
RADAR Echo Recognition of Squall Line Based on Deep Learning
by
 , ,
, ,
Peilong Xie
1,2,
Zhiqun Hu
2,3,*,
Shujie Yuan
1,
Jiafeng Zheng
1,
Hanyuan Tian
2,4 and
Fen Xu
5,6 1
College of Atmospheric Sciences, Chengdu University of Information Technology, Chengdu 610225, China
2
State Key Lab of Severe Weather, Chinese Academy of Meteorological Sciences, Beijing 100081, China
3
Key Laboratory of Atmosphere Sounding, CMA, Chengdu 610225, China
4
College of Electronic Engineering, Chengdu University of Information Technology, Chengdu 610225, China
5
Nanjing Joint Institute for Atmospheric Sciences, Nanjing 210041, China
6
Key Laboratory of Transportation Meteorology, CMA, Nanjing 210041, China
*
Author to whom correspondence should be addressed.
Remote Sens. 2023, 15(19), 4726; https://doi.org/10.3390/rs15194726
Submission received: 16 August 2023
/
Revised: 16 September 2023
/
Accepted: 25 September 2023
/
Published: 27 September 2023
Abstract
:Highlights
- A deep learning dataset of squall lines with over 49,920 samples was constructed based on RADAR-base data by means of manual classification and data augment.
- Three squall lines automatic recognition modes are trained according to the distance of label data away from RADARs.
- The models have good generalization ability which can effectively capture the characteristics of squall lines from RADAR-base data to realize its automatic recognition well.
Abstract
Squall line (SL) is a convective weather process that often causes disasters. The automatic recognition and early warning of SL are important objectives in the field of meteorology. By collecting the new-generation weather RADARs (CINRAD/SA and CINRAD/SAD) base data during 12 SL weather events occurred in Jiangsu, Shanghai, Shandong, Hebei, and other regions of China from 2019 to 2021, the dataset has a total of 49,920 samples with a window size of 40 km. The 40 km area was labeled by employing manual classification and data augmentation to construct the deep learning dataset with a positive and negative sample ratio of 1:1, of which 80% and 20% are separated as the training and test set, respectively. Based on the echo height of each elevation beam at different distances, three deep learning-based models are trained for SL automatic recognition, which include a near-distance model (M1) trained by the data in nine RADAR elevation angles within 45 km from RADARs, a mid-distance model (M2) by the data in six elevations from 45 to 135 km, and a far-distance model (M3) by the data in three elevations from 135 to 230 km. A confusion matrix and its derived metrics including receiver operating characteristic (ROC) curves and the area under the ROC curve (AUC) are introduced as the indicators to evaluate the models by the test dataset. The results indicate that the accuracy of models are over 86% with the hit rates over 87%, the false alarm rates less than 21%, and the critical success indexes (CSI) surpass 78%. All the optimal critical points on the ROC curves are close to (0, 1), and the AUC values are above 0.95, so the three models have high hit rates and low false alarm rates for ensuring SL discrimination. Finally, the effectiveness of the models is further demonstrated through two SL events detected with Nanjing, Yancheng and Qingpu RADARs.
1. Introduction
Squall line (SL) is a severe convective weather phenomenon characterized by a line of organized and closely spaced thunderstorm cells known for its short duration and localized impact. When an SL passes through an area, it often brings hazardous weather events such as thunderstorms, strong winds, hail, and tornadoes. Therefore, improving the monitoring and warning capabilities for SL automatic recognition is of significant importance in safeguarding the safety of the public and their belongings.
Meso- and micro-scale systems such as SL are commonly monitored with weather RADAR, and their identification algorithms can be categorized into two types. The first type is mathematical models established by abstracting features of severe weather, which include algorithms such as Tracking RADAR Echoes by Correlation (TREC) [1,2] and its improvements [3], the Storm Cell Identification and Tracking (SCIT) [4], SL identification by an improved TITAN algorithm [5], and by the Hough transform [6], etc. The other type is machine learning methods which mine the rules from large amounts of data to train a recognition model.
As early as the last century, the original perceptron model is proposed for binary classification models [7]. Subsequently, combining the multilayer perceptron (MLP) with the backpropagation algorithm, the foundation of deep learning is formed [8]. By this century, with the advancement in computing power and the advent of the digital era with big data, the implementation of more complex neural networks becomes feasible, and a concept of deep learning is introduced [9]. Soon afterwards, an AlexNet model achieved impressive success in image classification [10]. Convolutional Neural Networks (CNNs) have been proven to be effective in extracting spatial features from images and have become a hot topic in image recognition research. Famous CNN models such as LeNet [11,12], ResNet [13], and VGG [14] have achieved remarkable results in image classification tasks.
CNN has reached or even surpassed the level of manual recognition in many image classification issues. Notably, deep learning methods are simpler and more versatile than the methods of finding features and then building mathematical models. Therefore, in recent years the meteorological community has introduced deep learning methods to achieve highly reliable and automated strong convective weather monitoring and warning such as combining deep learning with numerical weather prediction to forecast different types of convective weather [15]. For example, convective wind gust (CG) identification by CGsNet [16], and RADAR echo extrapolation by 3D-Unet-LSTM use RADAR images as training data [17]. However, all the above image-based recognition methods will lose many details after the RADAR-base data are converted into grayscale images as model input, and not enough label data are collected during the training processes.
In this study, 24,960 SL labels (positive sample) and 24,960 non-SL labels (negative sample) with a window size of 40 km × 40 km are tagged using RADAR-base data through manual classification and data augmentation, and the Unet network, one of the common deep learning algorithms, is utilized for SL recognition research.
The second part of the paper introduces the data sources for model training and testing, data preprocessing, and the Unet network architecture. The third part provides a brief overview of the model training process, the evaluation metrics, and showcases the recognition performance. The fourth part demonstrates the models effectiveness by using two SL events observed with CINARAD/SA and CINARAD/SAD RADARs. Finally, some conclusions and discussions are presented in the following six sections with an outlook on the application of deep learning methods in SL recognition using weather RADAR.
2. Data and Methods
2.1. Data Sources
SL can be defined as a strong band-like echo region with a continuous length of more than 50 km, intensity exceeding 35 dBZ, and a length-to-width ratio greater than 5:1 in the RADAR intensity plan position indicator (PPI) [18,19].
In order to conduct research on SL automatic recognition based on deep learning, it is necessary to first collect sufficient SL samples to build a deep learning dataset. A total of 8450 RADAR volume scan base data from 15 RADAR stations in Jiangsu, Shanghai, Shandong, and Hebei provinces are collected in 12 SL events from 2019 to 2021. The time (in UTC in this paper) and location information are listed in Table 1. The RADAR types in the order number 35, 36, and 37 in Table 1 are CINARAD/SAD which radial resolution is 250 m, and the remaining RADAR types are CINARAD/SA which intensity radial resolution is 1000 m. Both the RADAR types run a volume scan once every six min. These scans consist of a series of PPI sweeps at nine increasing elevations, i.e., 0.5°, 1.5°, 2.4°, 3.5°, 4.3°, 6.0°, 9.9°, 14.6°, and 19.5°. This study only uses RADAR data within 230 km, and the data are strictly controlled to eliminate the pollution of ground clutter and other non-meteorological echoes with the algorithm developed by the RADAR detection team of the State Key Laboratory of Serious Weather, Chinese Academy of Meteorological Sciences [20,21,22,23].
2.2. Dataset Construction
Due to the enormous advantages demonstrated by deep learning in the field of image recognition, many non-specialists have begun to conduct RADAR image recognition based on grayscale images converted solely from RADAR intensity products which has lost a lot of detailed information. Since these tags, especially for strong convective weather, are manually labeled, which requires someone with advanced knowledge in RADAR, meteorology, and computer to spend a lot of time and effort building it through manual classification. Therefore, there are still very few deep learning datasets for convective weather based on RADAR-base data.
Grayscale images are exclusively employed for RADAR-base data visualization purposes, rather than serving as input for the model. This choice arises from the fact that numerous researchers in RADAR meteorology employ deep learning methods by utilizing grayscale representations of pseudo-colored intensity products as inputs. This practice is due to their inability to access RADAR-base data or their limited RADAR expertise. Consequently, this input approach presents the following two conspicuous disadvantages: (1) the intensity pseudo color image only uses 16 color codes to represent a continuous range from −10 to more than 70 dBZ; (2) when converting to a grayscale image of 0–255, the details are further smoothed out. In contrast, this study employs actual observation values constrained within [0, 70] as input, effectively preserving the details of RADAR echoes. Data standardization is a standard procedure in deep learning, and it serves to maintain isotropy while utilizing gradient descent algorithms to expedite the convergence of weight parameters. In order to promote this research on SL automatic recognition, a specialized labeling software is developed by the RADAR team. The process of manual classification is as follows: opening RADAR-base data from the software, a black window with a set size is displayed in the PPI (This study used a window size of 60 × 60), and the data of all parameters in all elevations in the window will be automatically saved when the mouse is double clicked (Figure 1). The label is manually marked as one if an SL is contained within the window, otherwise it is marked as zero.
Here, 4992 SL and 9054 non-SL samples are tagged with manual classification by a significant amount of manpower and time. The size of labels is set to 60 km × 60 km with nine elevations, and only reflectivity factors are used for modeling, so the label matrix size is 9 × 60 × 60 for CINRAD/SA, but 9 × 240 × 240 for CINRAD/SAD which need downsampling to be consistent with CINRAD/SA. The intensity echoes of some SLs at the 0.5° elevation are demonstrated in grayscale images for visual understanding (Figure 2).
For deep learning, the model may encounter difficulties on effective digging data characteristics if a limited number of data samples. Therefore, data augmentation techniques, such as rotation and cropping, are usually employed to create a more diverse set of data samples to address this challenge. However, it may lead to data distortion if the rotation angle is too large. Especially for SL data which exhibits directionality and correlation with weather systems, the rotation is constrained to clockwise or counterclockwise by 1° and 2° can avoid the data distortion to ensures label accuracy. Thus, in this study, SL labels only rotate the data clockwise or counterclockwise by 1° and 2°, respectively. In order to maintain a balance between the positive (SL) and negative (non-SL) samples, the negative samples are augmented four times and rotated every 90° without considering directivity, so the dataset has a total of 49,920 samples after data augmentation, and 80% of the data are randomly extracted as training set and 20% as test set. The training datasets are shuffled after each iteration, and 20% of them are randomly extracted as validation dataset to enhance the generalization ability during model training.
Obviously, during one full rotation of a square, the data will be missing at its four corners. So, the 60 km × 60 km data are clipped into 40 km × 40 km, after rotation to eliminate blank data while the SL features are preserved (Figure 3). The size of the label matrix in this study is actually unified as 40 km × 40 km.
Considering that the width of RADAR beam width widens, and the height increases with distance, three deep learning-based SL automatic recognition models are trained according to the input elevation number and the distance from the RADARs. A near-distance model (M1) is trained with the data in nine RADAR elevation angles (0.5°, 1.5°, 2.4°, 3.5°, 4.3°, 6.0°, 9.9°, 14.6°, and 19.5°) within 45 km from RADARs, a mid-distance model (M2) with the data in six elevations (0.5°, 1.5°, 2.4°, 3.5°, 4.3°, and 6.0°) from 45 to 135 km, and a far-distance model (M3) with the data in three elevations (0.5°, 1.5°, and 2.4°) from 135 to 230 km. The number of labels used for training in each model is listed in Table 2.
The label matrixes are normalized by the maximum and minimum values methods using Equation (1), in which represents the value of the ith point after normalization, represents the original value that is set to 70 if its value is greater than 70 dBZ and set to 0 if less than 0 dBZ, and are 70 and 0 dBZ, respectively.
Different from converting the RADAR product into RADAR images for model training, the models are trained directly using the RADAR-base data, which is also one of the highlights of this study.
2.3. Algorithm Introduction
VGG16 [14], one of the popular deep learning neural Unet networks developed by Oxford University Geometry Group and is a CNN architecture characterized by its deep stack of 16 weight layers, comprising 13 convolutional layers and 3 fully connected layers. VGG16 is utilized as the backend to establish the SL automatic recognition models, mainly because its architecture is similar to the left half of Unet.
As shown in Figure 4, A Unet network consists of the left and right parts. The left part represents the main feature extraction network including convolutional layers and max-pooling layers, and the right part represents the enhanced feature extraction network. It is similar in structure to the VGG network, so the VGG16 containing 16 hidden layers is used as the backend for the main feature extraction network in this study.
The size of convolution kernels in the convolution layers (white squares in Figure 4) are all set as 3 × 3, padding and step are set to one, and ReLU as the activation function is used in all layers. Therefore, only the number of channels are changed after each convolution layer, while the size of the matrix consists of before convolution. The maximum pooling layers in the backbone extraction network (the black square on the left side of Figure 4) are all 2 × 2 in size with a step size of 2 and padding of 0, so the length and width of the matrix are changed to half of the original size after each pooling. The length and width of the matrix became twice that of the previous matrix after each upsampling to stack the two layers due to the same size of the upper and lower matrices.
3. Model Construction
3.1. Evaluation Indicators
The common evaluation metrics for classification tasks include confusion matrix and its derived metrics, Receiver Operating Characteristic (ROC) curve, etc. As shown in Table 3, the prediction and samples are classified into the following two categories: correct identification (positive case) and false identification (negative case). Thus, the two elements on the main diagonal are true cases (TP) and true counter cases (TN), and the two elements on the secondary diagonal are false counter cases (FN) and false positive cases (FP).
According to the above confusion matrix, other metrics including Accuracy, Probability of Detection (POD), False Alarm Rate (FAR) and Critical Success Index (CSI) can be calculated by Equations (2)–(5):
Additionally, the ROC curve can reflect the judgment ability of each model when the positive and negative samples are sufficient. In practice, it is likely that the distribution of positive and negative samples is uneven, compared with the Precision-Recall (PR) curve, the ROC curve can remain stable when the distribution of positive and negative samples changes, but the PR curve will have a large change. The vertical coordinate of the ROC curve is the POD (sensitivity), and the horizontal coordinate is 1-FAR (1-specificity), so a POD and FAR point pair calculated by the test dataset is a point on the ROC curve. Therefore, a ROC curve can be obtained by connecting these point pairs which are continuously calculated by adjusting the threshold to obtain multiple POD and FAR (1-specificity) pairs. For a test sample, the score value generated by the classifier represents the likelihood of the sample belonging to positive or negative class. The Score values for all samples are sorted in ascending order for determining the sample property, and a sample are considered positive if its score value is greater than or equal to the threshold, but negative on the contrary. Meanwhile, the pairs of FAR and POD points are calculated through the process. The area enclosed by the ROC curve, the horizontal axis, and the line with the horizontal coordinate of one is the AUC value (Area Under ROC Curve). The closer the upper leftmost point of the ROC curve (the best threshold) is to the point (0, 1), the higher the POD, and the lower the FAR of the classifier, which also indicates the better classification effect of the classifier, and vice versa.
3.2. Model Training
Differing from traditional image-based classification, pre-trained weights in the network are not necessary for RADAR-base data-based classification but are initialized with Gaussian distribution. Firstly, the parameters in the network are initialized, which include that all the biases are set to zero; the weights in the linear layer are set as an N (0, 0.01) normal distribution; the weights in convolutional layers are set to one; stochastic gradient descent (SGD) is used as the optimizer, and Cross Entropy Loss as loss function. In addition, the early stop mechanism is adopted to prevent overfitting. The iteration will be stopped if the loss function value of the validation set does not decrease after continuous 10 epochs, and the model is saved.
3.3. Model Evaluation
Using the test dataset to evaluate the three models, the confusion matrices are shown in Figure 5, the values of evaluation metrics are listed in Table 4, and the values of ROC and AUC are shown in Figure 6. From Table 4 and Figure 6, it can be seen that the accuracy of the models is more than 86%, and the optimal critical points of the ROC curves are very close to the (0, 1) with the values of AUC above 0.95, which indicate that the TPR is high while the FPR is as low as possible.
Although there are 6–21% FAR for the models, the POD and CSI are more than 87% and 78%, respectively, so the models have good performance for SL discrimination. Among the three models, M2 and M3 do not have much difference in the metrics, while M1 has a higher FAR and lower accuracy and CSI, which may be due to the relatively fewer SL samples in the test dataset of M1.
4. Model Demonstration
After data augmentation, the label size is 40 km × 40 km, so the matrix size of the models’ input is 9 × 40 × 40 for SA RADARs and 9 × 160 × 160 for SAD RADARs. In order to better demonstrate the models’ recognition effect, the models are employed from RADAR west to east from north to south with a step size of 8 km, and the recognition results are marked with 40 km × 40 km black windows in the 0.5° elevation reflectivity PPIs if an SL manually determines that it is correctly recognized, and represented in red if an SL is missed recognition.
4.1. Nanjing RADAR
Influenced by a shortwave trough in the westerlies and a persistent cyclone over the Jianghuai region on June 12, 2020, a heavy rainfall process accompanying with lightning and thunderstorm gust occurred in most regions of Jiangsu province, China, and in particular an EF1–EF2 level tornado is observed in three towns of Gaoyou City. The strong convective weather event is observed by Nanjing and Yancheng SA RADARs.
Figure 7 shows the successive automatic recognition results in eight PPIs from 0435 to 0514 UTC. It can be seen that there is an obvious SL with reflectivity more than 60 dBZ from southwest to north of the RADAR. The linear strong echo band moves eastward over time, and the models can accurately identify the SL, but have misidentification to few strong convective cells in front of the SL (marked with red box).
4.2. Yancheng RADAR
As the SL continues to advance southeastward, it enters the Yancheng RADAR detection range with a reflectivity of more than 65 dBZ. Figure 8 shows the successive automatic recognition results in eight PPIs from 0919 to 0959 UTC. The models can basically accurately identify the SL but have a small amount of missed recognition regions marked with red box in Figure 8a,c.
4.3. Qingpu RADAR
In order to further showcase the recognition performance of the models for SAD RADAR, another SL event occurred in Shanghai and Jiangsu regions is demonstrated as an example. This severe convective weather is triggered with a cold air guided by the upper-level trough in the unstable atmospheric condition where the dry and cold air in the upper levels stacked on the warm and moist air in the lower levels.
Figure 9 shows the successive automatic recognition results in eight PPIs from 1231 to 1308 UTC on April 30, 2021. It can be seen that there is an obvious SL with a maximum reflectivity of more than 65 dBZ in the north of the RADAR. The SL features are obvious with an arc-shaped gust front appearing in front of the SL. Even if the strong echoes continuously deform, the models can identify the SL accurately in all the event processes.
5. Conclusions and Discussion
Collecting 12 SL events from 2019 to 2021, an SL deep learning dataset with 49,920 samples which is labeled with the RADAR analysis software developed by the RADAR detection team of the State Key Laboratory of Serious Weather, Chinese Academy of Meteorological Sciences is conducted from 15 RADARs in Jiangsu, Shanghai, Shandong, and Hebei provinces. Three Unet-based SL automatic recognition models are trained for the consideration that the beam widens and the height increases with the distance from echo to RADAR.
The accuracy of the three models is more than 86% in the test dataset, and the optimal threshold points on the ROC curves are close to (0, 1) with all the AUC values over 0.95, which suggest that the models have a high probability of TN and TP while having a low probability of FN and FP. For all the models, the CSI exceeds 78% with the FAR less than 21% and POD more than 87%, which hints that the models have strong SL automatic recognition ability.
Additionally, the models are further demonstrated by the two SL events observed in Nanjing, Yancheng, and Qingpu RADARs. It is found that the SLs can be discriminated against by all the models whether it is SA or SAD RADARs. Even if it is a misreported linear echo that does not meet the SL definition, it is still necessary to be vigilant against the occurrence of strong convection once the models provide an SL prompt.
Although it has taken a significant amount of manpower and time to build the dataset for SL automatic recognition, the models still have certain limitations as the samples are still scarce for deep learning. In the future, as more SL labels with various shapes including before SL generation, development, rupture, and extinction are added to the dataset, the retrained models will have stronger generalization ability and recognition accuracy. In addition, with the polarization upgrade of weather RADAR, a dataset containing polarmetric parameters will improve the models’ performance, especially for the echoes of less obvious SL features.
Deep learning is developing rapidly, and new algorithms will be used to improve SL recognition performance. In the future, some image segmentation algorithms such as YOLO can be applied to discriminate the SL and non-SL regions first, and then the models could be implemented in the SL regions to enhance the recognition effect.
Author Contributions
Conceptualization, P.X. and Z.H.; methodology, Z.H.; software, Z.H. and J.Z.; validation, P.X., S.Y. and H.T.; formal analysis, J.Z.; investigation, P.X.; resources, Z.H.; data curation, P.X., H.T. and F.X.; writing—original draft preparation, P.X.; writing—review and editing, Z.H. and P.X.; visualization, P.X.; supervision, Z.H.; project administration, Z.H.; funding acquisition, Z.H. All authors have read and agreed to the published version of the manuscript.
Funding
This research was supported by the Key-Area Research and Development Program of Guangdong Province (2020B1111200001), Basic Research Fund of CAMS (2023Z019), National Key R&D Program of China (2022YFC3003903), the Joint Fund of Key Laboratory of Atmosphere Sounding, CMA and Research Centre on Meteorological Observation Engineering Technology, CMA (U2021Z05), the Key project of monitoring, early warning and prevention of major natural disasters of China (2019YFC1510304), the Basic Research Fund of CAMS (2021Z003), and the Open Grants of the State Key Laboratory of Severe Weather (2023LASW-B02).
Data Availability Statement
The data presented in this study are available on request from the corresponding author.
Acknowledgments
The authors would like to sincerely thank Fen Xu of Nanjing Joint Institute for Atmospheric Sciences, for providing technical guidance and collection of part of the dataset.
Conflicts of Interest
The authors declare no conflict of interest. The funders had no role in the design of the study; in the collection, analyses, or interpretation of data; in the writing of the manuscript; or in the decision to publish the results.
References
- Smythe, G.R.; Zrnic, D.S. Correlation Analysis of Doppler Radar Data and Retrieval of the Horizontal Wind. J. Appl. Meteorol. Climatol. 1983, 22, 297–311. [Google Scholar] [CrossRef]
- Rinehart, R.E.; Garvey, E.T. Three-Dimensional Storm Motion Detection by Conventional Weather Radar. Nature 1978, 273, 287–289. [Google Scholar] [CrossRef]
- Zou, H.; Wu, S.; Shan, J.; Yi, X. A Method of Radar Echo Extrapolation Based on TREC and Barnes Filter. J. Atmos. Ocean. Technol. 2019, 36, 1713–1727. [Google Scholar] [CrossRef]
- Johnson, J.T.; MacKeen, P.L.; Witt, A.; Mitchell, E.D.W.; Stumpf, G.J.; Eilts, M.D.; Thomas, K.W. The Storm Cell Identification and Tracking Algorithm: An Enhanced WSR-88D Algorithm. Weather Forecast. 1998, 13, 263–276. [Google Scholar] [CrossRef]
- Wang, L.; Wang, H.; Heng, Z. A Rapid Identification and Warning Method for Severe Weather via Doppler Radar Based on an Improved TITAN Algorithm. J. Atmos. Sol.-Terr. Phys. 2019, 193, 105080. [Google Scholar] [CrossRef]
- Wang, X.; Bian, H.; Qian, D.; Miao, C.; Zhan, S. An Automatic Identifying Method of the Squall Line Based on Hough Transform. Multimed. Tools Appl. 2021, 80, 18993–19009. [Google Scholar] [CrossRef]
- Rosenblatt, F. The Perceptron: A Probabilistic Model for Information Storage and Organization in the Brain. Psychol. Rev. 1958, 65, 386–408. [Google Scholar] [CrossRef] [PubMed]
- Rumelhart, D.E.; Hinton, G.E.; Williams, R.J. Learning Representations by Back-Propagating Errors. Nature 1986, 323, 533–536. [Google Scholar] [CrossRef]
- Hinton, G.E.; Osindero, S.; Teh, Y.-W. A Fast Learning Algorithm for Deep Belief Nets. Neural Comput. 2006, 18, 1527–1554. [Google Scholar] [CrossRef] [PubMed]
- Krizhevsky, A.; Sutskever, I.; Hinton, G.E. ImageNet Classification with Deep Convolutional Neural Networks. In Proceedings of the Advances in Neural Information Processing Systems, Lake Tahoe, NV, USA, 3–6 December 2012; Curran Associates, Inc.: Red Hook, NY, USA, 2012; Volume 25. [Google Scholar]
- LeCun, Y.; Boser, B.; Denker, J.; Henderson, D.; Howard, R.; Hubbard, W.; Jackel, L. Handwritten Digit Recognition with a Back-Propagation Network. In Proceedings of the Advances in Neural Information Processing Systems, Denver, CO, USA, 27–30 November 1989; Morgan-Kaufmann: Burlington, MA, USA, 1989; Volume 2. [Google Scholar]
- Lecun, Y.; Bottou, L.; Bengio, Y.; Haffner, P. Gradient-Based Learning Applied to Document Recognition. Proc. IEEE 1998, 86, 2278–2324. [Google Scholar] [CrossRef]
- He, K.; Zhang, X.; Ren, S.; Sun, J. Deep Residual Learning for Image Recognition. In Proceedings of the IEEE Conference on Computer Vision and Pattern Recognition (CVPR), Las Vegas, NV, USA, 27–30 June 2016; pp. 770–778. [Google Scholar]
- Simonyan, K.; Zisserman, A. Very Deep Convolutional Networks for Large-Scale Image Recognition. arXiv 2015. [Google Scholar] [CrossRef]
- Zhou, K.; Zheng, Y.; Li, B.; Dong, W.; Zhang, X. Forecasting Different Types of Convective Weather: A Deep Learning Approach. J. Meteorol. Res. 2019, 33, 797–809. [Google Scholar] [CrossRef]
- Xiao, H.; Wang, Y.; Zheng, Y.; Zheng, Y.; Zhuang, X.; Wang, H.; Gao, M. Convective-Gust Nowcasting Based on Radar Reflectivity and a Deep Learning Algorithm. Geosci. Model Dev. 2023, 16, 3611–3628. [Google Scholar] [CrossRef]
- Guo, S.; Sun, N.; Pei, Y.; Li, Q. 3D-UNet-LSTM: A Deep Learning-Based Radar Echo Extrapolation Model for Convective Nowcasting. Remote Sens. 2023, 15, 1529. [Google Scholar] [CrossRef]
- Chen, G.T.J.; Chou, H.C. General Characteristics of Squall Lines Observed in TAMEX. Mon. Weather Rev. 1993, 121, 726–733. [Google Scholar] [CrossRef]
- Geerts, B. Mesoscale Convective Systems in the Southeast United States during 1994–95: A Survey. Weather Forecast. 1998, 13, 860–869. [Google Scholar] [CrossRef]
- Liu, L.P.; Wu, L.L.; Yang, Y.M. Development of Fuzzy-Logical Two-Step Ground Clutter Detection Algorithm. Acta Meteorol. Sin. 2007, 65, 252–260. (In Chinese) [Google Scholar] [CrossRef]
- Hu, Z.; Liu, L.; Chu, R.; Jin, R. Comparison of different attenuation correction methods and their effects on estimated rainfall using x-band dual linear polarimetric radar. Acta Meteorol. Sin. 2008, 66, 251–261. (In Chinese) [Google Scholar] [CrossRef]
- Feng, L.; Liping, L.; Hongyan, W.; Yuan, J. Identification of Non-Precipitation Meteorological Echoes with Doppler Weather Radar. J. Appl. Meteorol. Sci. 2012, 23, 147–158. (In Chinese) [Google Scholar]
- Zheng, J.; Liu, L. Ka-Band Millimeter Wave Cloud Radar Data Quality Control. J. Infrared Millim. Waves 2016, 35, 748–757. (In Chinese) [Google Scholar] [CrossRef]
Figure 1.
Schematic for manual labeling an SL on the 0.5° elevation reflectivity PPI, in which a 60 km × 60 km sized black window will move with the mouse, and the data within the window will be saved once the mouse is double clicked.
Figure 1.
Schematic for manual labeling an SL on the 0.5° elevation reflectivity PPI, in which a 60 km × 60 km sized black window will move with the mouse, and the data within the window will be saved once the mouse is double clicked.
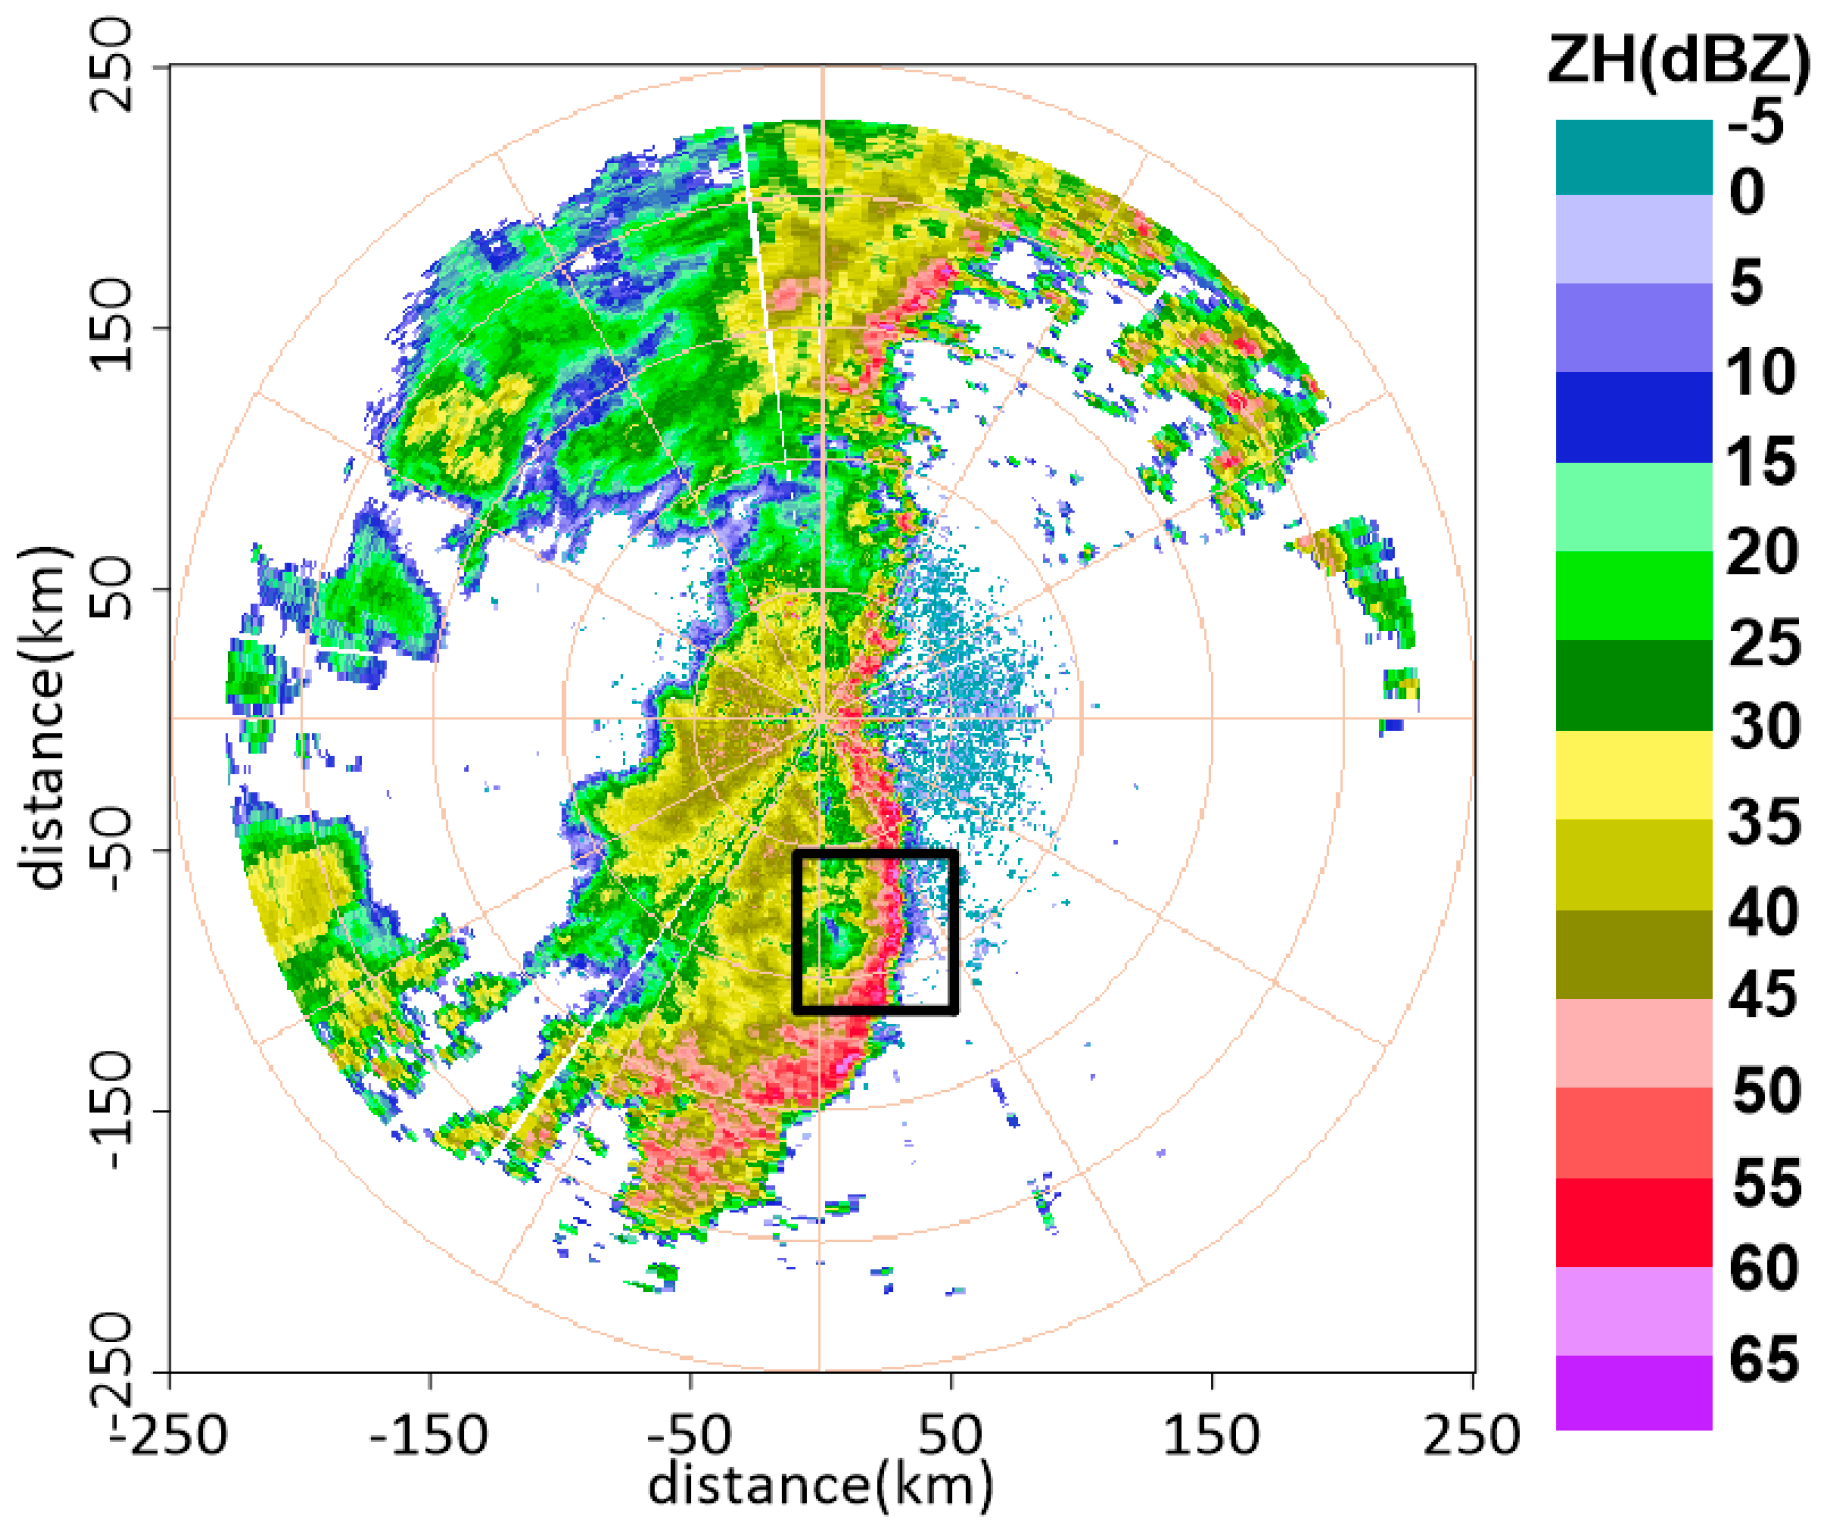
Figure 2.
Visualization effect of partial SL RADAR-base data at 0.5° elevation reflectivity PPI with grayscale image only for demonstrate the labels instead of model input.
Figure 2.
Visualization effect of partial SL RADAR-base data at 0.5° elevation reflectivity PPI with grayscale image only for demonstrate the labels instead of model input.

Figure 3.
Visualization of the data augmentation process in which nine SL samples are rotated 2°, and clipped form 60 km × 60 km to 40 km × 40 km.
Figure 3.
Visualization of the data augmentation process in which nine SL samples are rotated 2°, and clipped form 60 km × 60 km to 40 km × 40 km.

Figure 4.
Schematic diagram of Unet network.

Figure 5.
Confusion matrices for the test set models. The true and predicted labels are on the horizontal and vertical axes, respectively, and the correct classification is located on the antidiagonal line.
Figure 5.
Confusion matrices for the test set models. The true and predicted labels are on the horizontal and vertical axes, respectively, and the correct classification is located on the antidiagonal line.

Figure 6.
The curves of ROC and the values of AUC are calculated by the test set. The antidiagonal is the random guess classifier.
Figure 6.
The curves of ROC and the values of AUC are calculated by the test set. The antidiagonal is the random guess classifier.

Figure 7.
The SL recognition results in 0.5° elevation PPI in Nanjing RADAR at (a) 0435, (b) 0441, (c) 0446, (d) 0452, (e) 0457, (f) 0503, (g) 0509, and (h) 0514 UTC, respectively, in which the black windows with 40 km × 40 km size indicate that the SL are correctly recognized, and the red windows represents incorrect recognition. The distance circle is 100 km.

Figure 8.
The SL recognition results in 0.5° elevation PPI in Yancheng RADAR at (a) 0919, (b) 0924, (c) 0930, (d) 0936, (e) 0941, (f) 0947, (g) 0953, and (h) 0959 UTC, respectively, in which the black windows indicate that the SL are correctly recognized, and the red windows represents missed recognition.

Figure 9.
The SL recognition results in 0.5° elevation PPI in Qingpu RADAR at (a) 1231, (b) 1236, (c) 1242, (d) 1247, (e) 1252, (f) 1258, (g) 1303, and (h) 1308 UTC, respectively, in which the black windows indicate that the SL are correctly recognized.
Figure 9.
The SL recognition results in 0.5° elevation PPI in Qingpu RADAR at (a) 1231, (b) 1236, (c) 1242, (d) 1247, (e) 1252, (f) 1258, (g) 1303, and (h) 1308 UTC, respectively, in which the black windows indicate that the SL are correctly recognized.


Table 1.
RADAR station and data time.
| Serial Number | RADAR Station, Time | Serial Number | RADAR Station, Time |
|---|---|---|---|
| 1 | Nanjing 2019-04-09 00:00–05:00 | 20 | Linyi 2020-05-23 03:00–11:00 |
| 2 | Nanjing 2019-07-06 05:00–12:00 | 21 | Qingdao 2020-05-23 03:00–10:00 |
| 3 | Nantong 2019-07-06 10:00–13:00 | 22 | Jinan 2020-05-23 03:00–11:00 |
| 4 | Yancheng 2019-07-06 05:00–10:00 | 23 | Jinan 2020-06-01 07:00–12:00 |
| 5 | Xuzhou 2019-07-06 00:00–06:00 | 24 | Linyi 2020-06-01 07:00–12:00 |
| 6 | Huaian 2019-07-06 00:00–11:00 | 25 | Jinan 2020-06-25 12:00–23:00 |
| 7 | Lianyungang 2019-07-06 00:00–10:00 | 26 | Shijiazhuang 2020-06-25 12:00–15:00 |
| 8 | Changzhou 2019-07-06 05:00–15:00 | 27 | Nanjing 2020-06-12 00:00–12:00 |
| 9 | Taizhou 2019-07-06 06:00–16:00 | 28 | Nantong 2020-06-12 00:00–12:00 |
| 10 | Weifang 2019-08-16 06:00–10:00 | 29 | Yancheng 2020-06-12 00:00–12:00 |
| 11 | Linyi 2019-08-16 06:00–10:00 | 30 | Xuzhou 2020-06-12 00:00–12:00 |
| 12 | Qingdao 2019-08-16 06:00–10:00 | 31 | Huai’an 2020-06-12 00:00–12:00 |
| 13 | Jinan 2020-05-03 13:00–15:00 | 32 | Lianyungang 2020-06-12 00:00–12:00 |
| 14 | Linyi 2020-05-11 23:00–24:00 | 33 | Changzhou 2020-06-12 00:00–12:00 |
| 15 | Jinan 2020-05-16 08:00–16:00 | 34 | Taizhou 2020-06-12 00:00–12:00 |
| 16 | Jinan 2020-05-17 10:00–16:00 | 35 | Qingpu 2021-04-30 00:00–24:00 |
| 17 | Qingdao 2020-05-17 10:00–17:00 | 36 | Nantong 2021-04-30 00:00–24:00 |
| 18 | Yantai 2020-05-17 10:00–17:00 | 37 | Lianyungang 2021-04-30 00:00–24:00 |
| 19 | Linyi 2020-05-17 10:00–17:00 |
Table 2.
The number of labels used in each model.
| Model | Total Number | Training Set | Test Set |
|---|---|---|---|
| M1 | 4090 | 3272 | 818 |
| M2 | 28,020 | 22,416 | 5604 |
| M3 | 17,810 | 14,248 | 3562 |
Table 3.
The definition of Confusion Matrix.
| Category | The Real Situation | ||
|---|---|---|---|
| Positive Sample | Negative Sample | ||
| Predicted Results | Positive case | TP | FP |
| Negative case | FN | TN | |
Table 4.
The values of evaluation metrics in the test set for the models.
| Model | Accuracy | POD | FAR | CSI |
|---|---|---|---|---|
| M1 | 86.9% | 94.1% | 20.3% | 78.3% |
| M2 | 90.1% | 87.8% | 7.6% | 81.6% |
| M3 | 92.3% | 91.3% | 6.6% | 85.6% |
Disclaimer/Publisher’s Note: The statements, opinions and data contained in all publications are solely those of the individual author(s) and contributor(s) and not of MDPI and/or the editor(s). MDPI and/or the editor(s) disclaim responsibility for any injury to people or property resulting from any ideas, methods, instructions or products referred to in the content. |
© 2023 by the authors. Licensee MDPI, Basel, Switzerland. This article is an open access article distributed under the terms and conditions of the Creative Commons Attribution (CC BY) license (https://creativecommons.org/licenses/by/4.0/).
Share and Cite
MDPI and ACS Style
Xie, P.; Hu, Z.; Yuan, S.; Zheng, J.; Tian, H.; Xu, F. RADAR Echo Recognition of Squall Line Based on Deep Learning. Remote Sens. 2023, 15, 4726. https://doi.org/10.3390/rs15194726
AMA Style
Xie P, Hu Z, Yuan S, Zheng J, Tian H, Xu F. RADAR Echo Recognition of Squall Line Based on Deep Learning. Remote Sensing. 2023; 15(19):4726. https://doi.org/10.3390/rs15194726
Chicago/Turabian StyleXie, Peilong, Zhiqun Hu, Shujie Yuan, Jiafeng Zheng, Hanyuan Tian, and Fen Xu. 2023. "RADAR Echo Recognition of Squall Line Based on Deep Learning" Remote Sensing 15, no. 19: 4726. https://doi.org/10.3390/rs15194726
Note that from the first issue of 2016, this journal uses article numbers instead of page numbers. See further details here.