

Validating and Developing Hyperspectral Indices for Tracing Leaf Chlorophyll Fluorescence Parameters under Varying Light Conditions

1
Graduate School of Science and Technology, Shizuoka University, 836 Ohya, Suruga-ku, Shizuoka 422-8529, Japan
2
Faculty of Agriculture, Shizuoka University, 836 Ohya, Suruga-ku, Shizuoka 422-8529, Japan
3
Institute of Geography and Oceanography, Nanning Normal University, Nanning 530001, China
*
Author to whom correspondence should be addressed.
Remote Sens. 2023, 15(19), 4890; https://doi.org/10.3390/rs15194890
Submission received: 27 July 2023
/
Revised: 21 September 2023
/
Accepted: 7 October 2023
/
Published: 9 October 2023
(This article belongs to the Special Issue Hyperspectral Remote Sensing of Vegetation Functions: Assessing Vegetation Ecophysiology II)
Abstract
:Chlorophyll a fluorescence (ChlFa) parameters provide insight into the physiological and biochemical processes of plants and have been widely applied to monitor and evaluate the photochemical process and photosynthetic capacity of plants in a variety of environments. Recent advances in remote sensing provide new opportunities for the detection of ChlFa at large scales but demand further tremendous efforts. Among such efforts, application of the hyperspectral index is always possible, but the performance of hyperspectral indices in detecting ChlFa parameters under varying light conditions is much less investigated. The objective of this study is to investigate the performance of reported hyperspectral indices for tracking ChlFa parameters under different light conditions and to develop and evaluate novel spectral indices. Therefore, an experiment was conducted to simultaneously measure ChlFa parameters and spectral reflectance of sunlit and shaded leaves under varying light conditions, and 28 reported hyperspectral indices were examined for their performance in tracking the ChlFa parameters. Furthermore, we developed novel hyperspectral indices based on various spectral transformations. The results indicated that the maximum quantum efficiency of photosystem II (PSIImax), the cumulative quantum yield of photochemistry (ΦP), and the fraction of open reaction centers in photosystem II (qL) of sunlit leaves were significantly higher than those of shaded leaves, while the cumulative quantum yield of regulated thermal dissipation (ΦN) and fluorescence (ΦF) of shaded leaves was higher than that of sunlit leaves. Efficient tracing of ChlFa parameters could not be achieved from previously published spectral indices. In comparison, all ChlFa parameters were well quantified in shaded leaves when using novel hyperspectral indices, although the hyperspectral indices for tracing the non-photochemical quenching (NPQ) and ΦF were not stable, especially for sunlit leaves. Our findings justify the use of hyperspectral indices as a practical approach to estimating ChlFa parameters. However, caution should be used when using spectral indices to track ChlFa parameters based on the differences in sunlit and shaded leaves.
1. Introduction
Chlorophyll a fluorescence (ChlFa) is a non-destructive probe for studying plant photosynthesis [1]. Light is absorbed by antenna pigments, and excitation energy is transferred to the reaction centers of the two photosystems, with part of the absorbed light energy used for photochemistry, while the remaining part is emitted as fluorescence or released in the form of heat dissipation [2] (Figure 1). Therefore, ChlFa is closely related to the process of photosynthesis and thus can provide a unique perspective and information for photochemical reactions and photosynthetic energy conversion. Many studies have proposed the use of ChlFa to track the photosynthesis process and stress at different spatial scales [3,4,5] and have, more recently, also shown that the photosynthetic simulation model can be improved using ChlFa parameters [6,7,8].
Traditionally, at the leaf scale, pulse amplitude modulation (PAM) fluorometer techniques are used to measure the fluorescence kinetics curve, from which the maximum quantum efficiency of photosystem II (PSIImax), non-photochemical quenching (NPQ), fraction of open reaction centers in photosystem II (qL), cumulative quantum yield of photochemistry (ΦP), regulated thermal dissipation (ΦN), and fluorescence (ΦF) can be calculated. All of these values can provide information about the efficiency of photochemistry and thermal dissipation in PSII [9]. Unfortunately, because of series inherent limitations, PAM technology cannot be applied to large-area satellite remote sensing monitoring [10,11]. On the other hand, the recent boom in passive solar-induced chlorophyll fluorescence (SIF) exploits the Fraunhofer line to decouple fluorescence from the reflected signals, using the infilling of the O2A and O2B bands at the 600–800 nm window [12] and providing an alternative indicator of large-scale photosynthetic activity to study global patterns and dynamics of terrestrial vegetation productivity [5,13,14]. However, this radiance-based approach relies heavily on high-resolution spectral sensors, and low resolution can result in the loss of absorption features [15]. Furthermore, the complete process of energy capture, conversion, and dissipation in photosynthetic systems (i.e., NPQ and qL) could not be accurately estimated by this radiance-based approach [16].
In comparison, reflectance-based approaches can calculate spectral indices related to ChlFa parameters, providing a convenient way to estimate ChlFa parameters [15]. Previous studies have attempted to use hyperspectral vegetation indices to estimate ChlFa parameters. For example, Nichol et al. [17] suggested using the photochemical reflectance index (PRI) to track changes in the NPQ of mangroves. Similarly, the anthocyanin reflectance index (ARI) and normalized difference vegetation index (NDVI) were used to reflect the variations in chlorophyll content and fluorescence-based electron transfer rates in sugar maple during autumn [18]. In addition, Zhang et al. [19] found that the normalized difference spectral indices (NDSI) and ratio spectral index (RSI) were useful to detect PSIImax and ΦP of Suaeda salsa under salinity stress. Several studies have further attempted different spectral transformation methods for the quantification of ChlFa parameters, e.g., Zarco-Tejada et al. [20] proposed that derivative indices can track fluorescence more efficiently and minimize other confusing effects, while the first-derivative (first) method for spectral reflectance has been applied to estimate PSIImax and ΦP of Suaeda salsa under water and salt conditions [21]. Furthermore, the standard normal variate transformation (SNV) and multiplicative scatter correction (MSC) methods have been successfully applied to highlight the correlation between spectral data and PSIImax in rice [22]. The results of these studies demonstrate the potential of hyperspectral indices coupled with different spectral transformation methods for monitoring and detecting changes in ChlFa parameters.
However, the ability of the published indices and spectral transformation methods to track ChlFa parameters still needs further explicit validation, especially for different leaf groups (i.e., sunlit and shaded leaves) under varying light conditions. The relationship between spectral reflectance and ChlFa parameters is complex and can be influenced by environmental conditions and leaf biochemical and physiological traits [23,24]. It is clear that there are large discrepancies between the two leaf groups, e.g., Sarijeva et al. [25] demonstrated the differences in pigment levels and photosynthetic activity of sunlit and shaded leaves of ginkgo and beech. Furthermore, most variations in ChlFa parameters can be explained by the growth irradiance environment of leaves, as well as chlorophyll and nitrogen content [26]. To the best of our knowledge, the literature on the ability of the published indices to track the ChlFa parameters of different leaf groups remains limited. Sonobe and Wang [11] examined the performance of 30 published hyperspectral indices for detecting ChlFa parameters of sunlit and shaded leaves in deciduous forests. They found that there was a significant difference in the reflectance of sunlit and shaded leaves, affecting the ability of spectral indices to track ChlFa parameters. It is unfortunate that no specific indices for tracking ChlFa parameters could have been recommended in their study. Hence, it is essential to differentiate the variation in ChlFa parameters between sunlit and shaded leaves and to verify the effectiveness of published indices in tracking ChlFa parameters.
Similarly, more research is needed to evaluate the capability of the spectral index to quantify ChlFa parameters under various light conditions. The light components in the natural light environment can vary greatly on a diurnal basis [27] and within the canopy [28], which can have a significant impact on the photosynthetic apparatus of leaves at different canopy positions and, thus, the ChlFa parameters [29,30]. At present, existing studies focus on the use of the spectral index to evaluate the performance of estimating ChlFa parameters under various biotic and abiotic stress or nutrient conditions [31,32,33], while rarely studying using spectral indices to detect ChlFa parameters under varying light conditions. Among the few exceptions, Alonso et al. [34] combined the PRI and diurnal absorbed photosynthetically active radiation (APAR), which well represented the diurnal dynamics of NPQ in tobacco. As a result, changes in PRI (∆PRI) have been proposed to improve estimates of ΦP and NPQ under multiple irradiance-temperature conditions in beech and spruce. However, obtaining ∆PRI is challenging due to the need for more complex measurement procedures. Consequently, there is a need to develop alternative novel spectral indices for estimating ChlFa parameters under varying light conditions that can bypass the need for complex measurements and calculations.
In this study, we conducted a series of experiments under varying light conditions at the leaf level, in which PSIImax, NPQ, qL, ΦP, ΦN, and ΦF were investigated. The leaf reflectance spectra were collected simultaneously. The objectives of this study were (1) to differentiate the variation in ChlFa parameters between sunlit and shaded leaves, (2) to verify the performance of published indices for tracking ChlFa parameters, and (3) to develop new spectral indices for detecting ChlFa parameters while assessing their feasibility.
2. Materials and Methods
2.1. Data Acquisition
We experimented over 30 days on mango (Mangifera indica L.) leaves that had grown in the Tianyang ecological site of integrated remote sensing, at the National Agricultural Sci-tech Zone of Baise, Guangxi Autonomous Region of South China (23°42′09.5″N, 106°59′42.2″E). The average altitude of this site is 151 m, its frost-free period is about 300 days, and the annual sunshine duration is about 1821 h [35]. The experiments were conducted from 7 August to 1 September 2021, and 5 to 10 May 2022. Sunlit leaves were collected from branches of the top canopy and shaded leaves were collected from branches beneath the canopy. We marked the branches where the leaves to be tested belonged and used the detached branch method to collect the branches before sunrise, following the standard operating protocol of Foley et al. [36]. The specific operation procedures were (1) using forestry shears to cut the marked branches, (2) placing the branches immediately in a bucket of water and snipping the end of the branch under the water to re-establish the xylem water column [37], and (3) wrapping the branches with black plastic and transporting them immediately to the laboratory.
A portable gas-exchange system (LI-6800; LI-COR, Lincoln, NE, USA) equipped with a Multiphase Flash™ Fluorometer chamber (6800-01A; LI-COR Inc., USA) was used to measure chlorophyll fluorescence parameters (Fo, Fm, Fs, F′o, and F′m). Among these, Fo and Fm represent the minimum initial and maximum fluorescence under dark adaptation, respectively. Fs and F′m denote the minimum and maximum fluorescence under light adaptation, respectively, and Fs denotes the steady-state fluorescence. In light adaptation fluorescence measurements, we controlled the photosynthetic photon flux density (PPFD) at 200, 400, 600, 800, 1000, 1200, 1400, 1600, 1800, and 2000 μmol m−2 s−1. The initial light compositions of red and blue were 90% and 10%, respectively. We gradually increased the proportion of blue light and reduced the proportion of red light at intervals of 10%. Leaves had to adapt to specific light intensity and light quality (about 20–30 min), and the fluorescence parameters were recorded based on the stability of the fluorescence curve. The blue actinic light output of the LI-6800-01A is only rated to go up to 1000 μmol m−2 s−1; thus, we screened for PPFD equal to or less than 1200 μmol m−2 s−1 and considered blue actinic light equal to or less than 1000 μmol m−2 s−1. Based on the measured chlorophyll fluorescence parameters, PSIImax, qL, and NPQ can be derived by Equations (1)–(3):
Based on Butler [38] and van der Tol et al. [39], the absolute yield of allocation of absorbed light energy can be calculated according to the rate coefficients (K) using Equations (4)–(8):
KP, KF, KD, and KN were calculated using Equations (9)–(12):
where KP and KN are the rate of photochemistry and the rate of energy-dependent heat dissipation, respectively. KD denotes the rate of constitutive thermal dissipation, varying with temperature and attaining a maximum value of 0.87. KF is a constant and represents the rate of fluorescence.
Reflectance spectra were recorded using an ASD field spectrometer (Analytical Spectral Devices Inc., Boulder, CO, USA) equipped with a leaf clip after measurements of chlorophyll fluorescence. To verify the performance of published indices for tracking ChlFa parameters, we collected 28 spectral indices from previous studies. Detailed primer information is presented in the Supplementary Material (Table S1).
2.2. Data Preprocessing
Spectral transformation can attenuate or eliminate spectral noise to varying degrees, extract weak spectral changes, and highlight useful spectral features, which has a great impact on the predictive performance of the model [40]. Five forms of spectral transformations were used. Among these, SNV, MSC, and extended multiplicative scatter correction (EMSC) were considered to correct the scattering effect [41,42,43]. First and apparent absorption spectra (Log) can be used to reduce nonlinearities [44,45]. The different forms of spectral transformations are shown in Figure 2.
2.3. Data Analyses
Ten types of new spectral indices were developed for detecting ChlFa parameters by combining them with the aforementioned spectral transformations. The ten types of indices included the reflectance at a given wavelength (R), a simple ratio (SR), the wavelength difference (D), the normalized difference (ND), the inverse difference (ID), the double difference (DDn), the modified simple ratio 1 (mSR1), the modified simple ratio 2 (mSR2), the modified normalized difference (mND), and the modified inverse difference (mID) [45,46,47]. The calculation formula for the given indices is described in the Supplementary Material (Table S2). We evaluated the performance of all possible wavelength combinations for the given indices in the 400–2400 nm wavelength range at 10 nm intervals under various spectral transformations. Finally, the best combination of wavelengths for each ChlFa parameter was determined using linear regression analysis.
All statistical analyses and visualizations were performed using R 4.1.0. The one-way analysis of variance (ANOVA) was conducted to assess the influence of leaf grouping on ChlFa parameters. The leaf group was set as the independent variable, and the null hypothesis of no statistically significant difference between the compared group means was rejected when the p-value fell below 0.05. In addition, the independent t-test was used to pairwise compare statistical disparities in ChlFa parameters between all leaves and between sunlit and shaded leaves. At a significance level of p-value < 0.05, the null hypothesis positing no statistically significant difference between the means of the two compared groups was rejected. Linear regression analysis was used to assess associations of spectral indices with ChlFa parameters. The coefficient of determination (R2), root mean square error (RMSE), and the ratio of performance to deviation (RPD) were used to evaluate the performance of prediction. The predicted models can be classified as good (RPD > 2.0), fair (1.4 ≤ RPD ≤ 2.0), or unreliable (RPD < 1.4) [48].
3. Results
3.1. Variation of ChlFa Parameters in Sunlit and Shaded Leaves
Significant effects of leaf grouping on PSIImax, qL, ΦP, ΦN and ΦF were revealed by one-way ANOVA (Table 1, p < 0.01). The differences in mean ± SE of ChlFa parameters between sunlit and shaded leaves also were compared by t-test (Figure 3). The PSIImax, qL, and ΦP of sunlit leaves (0.810 ± 0.001, 0.470 ± 0.015, and 0.386 ± 0.011) were significantly higher (p ≤ 0.0001) than those of shaded leaves (0.804 ± 0.001, 0.330 ± 0.014, and 0.298 ± 0.009). Significantly lower (p ≤ 0.05) values of ΦN and ΦF were found in sunlit leaves (0.413 ± 0.011 and 0.011 ± 0.0001) compared with shaded leaves (0.462 ± 0.008 and 0.013 ± 0.002). However, there were no significant differences between groups for NPQ (p > 0.05).
3.2. Performance of Reported Spectral Indices
We compared the performance of the reported spectral indices (Figure 4), and the best published indices are shown in Table 2. The best indices were PRI (R2 = 0.05, RMSE = 0.01), mSR705 (R2 = 0.11, RMSE = 0.01), and EVI (R2 = 0.07, RMSE = 0.01) for tracing the PSIImax of all leaves, sunlit leaves, and shaded leaves, respectively. For estimating NPQ, PSRI had the best performance in all leaves (R2 = 0.03, RMSE = 0.76) and sunlit leaves (R2 = 0.12, RMSE = 0.81), and ARI2 had the highest RPD in shaded leaves (R2 = 0.13, RMSE = 0.59). The best indices for tracing qL were RSI (R2 = 0.21, RMSE = 0.20), RGI (R2 = 0.25, RMSE = 0.20), and CRI1 (R2 = 0.73, RMSE = 0.10) in all leaves, sunlit leaves, and shaded leaves, respectively. The RSI (R2 = 0.18, RMSE = 0.14), EVI (R2 = 0.23, RMSE = 0.14), and CRI2 (R2 = 0.70, RMSE = 0.07) best estimated ΦP in all leaves, sunlit leaves, and shaded leaves, respectively. The RSI (R2 = 0.11, RMSE = 0.14), ARI2 (R2 = 0.19, RMSE = 0.14), and CRI2 (R2 = 0.55, RMSE = 0.08) were the best indices to evaluate the ΦN of all leaves, sunlit leaves, and shaded leaves, respectively. In terms of the ΦF, the RGI (R2 = 0.19, RMSE = 0.002), PRI (R2 = 0.24, RMSE = 0.002), and CRI1 (R2 = 0.16, RMSE = 0.003) had the best performance in all leaves, sunlit leaves, and shaded leaves, respectively.
3.3. Developing New Indices to Evaluate ChlFa Parameters
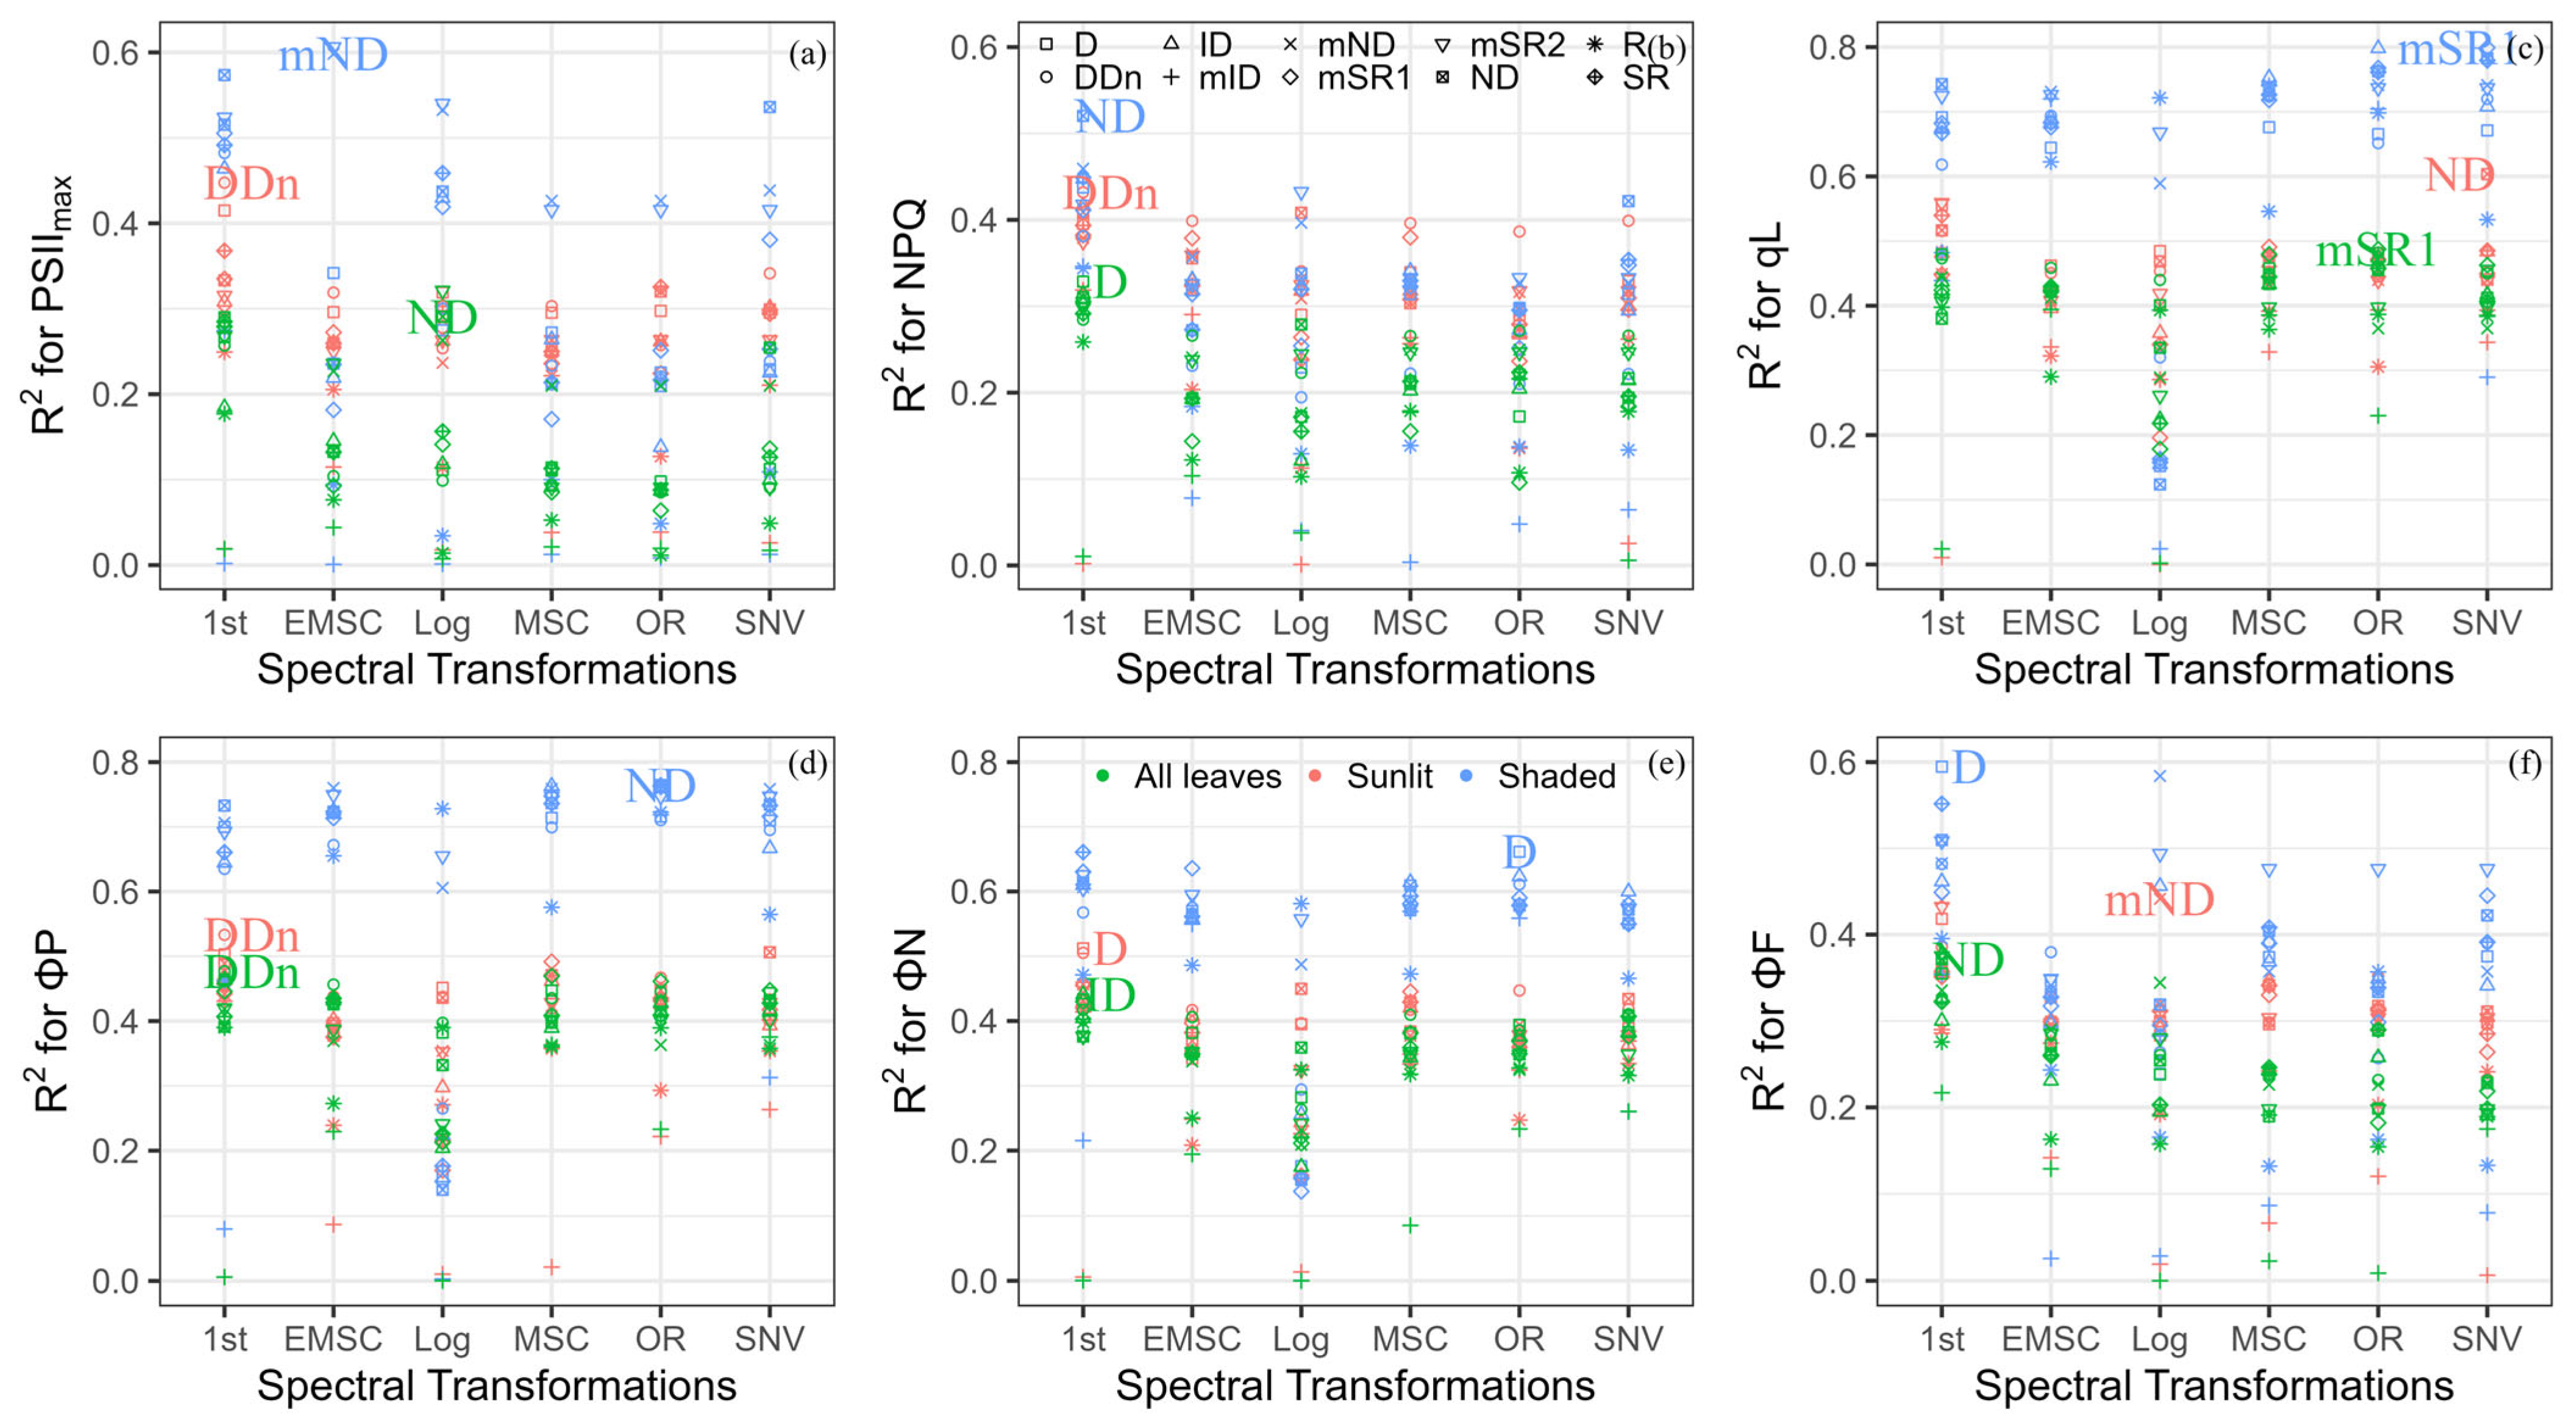
We calculated the different indices using various spectral transformations to track ChlFa parameters. The best index was defined based on the RPD performance (Figure 5). For estimating PSIImax, the ND (R2 = 0.29, RMSE = 0.01), DDn (R2 = 0.45, RMSE = 0.01), and mND (R2 = 0.60, RMSE = 0.01) were calculated as the log, first-order derivative, and EMSC reflectance, which were the best indices in all leaves, sunlit leaves, and shaded leaves, respectively. In terms of first-order derivative spectra, the D (R2 = 0.33, RMSE = 0.63), DDn (R2 = 0.43, RMSE = 0.65), and ND (R2 = 0.52, RMSE = 0.44) were the best compared to other transformed indices to quantify NPQ in all leaves, sunlit leaves, and shaded leaves, respectively. The ND (R2 = 0.60, RMSE = 0.14) and mSR1 (R2 = 0.80, RMSE = 0.08) had the highest accuracy to track qL after SNV transformation in sunlit and shaded leaves. The performance of mSR1 (R2 = 0.49, RMSE = 0.16) was the highest when applying original reflectance to estimate qL in all leaves. The DDn had the highest RPD to estimate the ΦP in all leaves (R2 = 0.48, RMSE = 0.11) and sunlit leaves (R2 = 0.53, RMSE = 0.11) under the first-order derivative transformation, and ND (R2 = 0.80, RMSE = 0.08) was the best index in shaded leaves under original reflectance. For estimating the ΦN, ID (R2 = 0.44, RMSE = 0.11) and D (R2 = 0.52, RMSE = 0.11) had the best performance in all leaves and sunlit leaves under the first-order derivative transformation. Moreover, D (R2 = 0.66, RMSE = 0.07) can be used in shaded leaves under original reflectance. The transformed ND (R2 = 0.37, RMSE = 0.002) and D (R2 = 0.59, RMSE = 0.002) of the first-order derivative can be used to track ΦN for all leaves and shaded leaves, while the best index for tracing sunlit leaves was mND (R2 = 0.44, RMSE = 0.001) under log transformation.
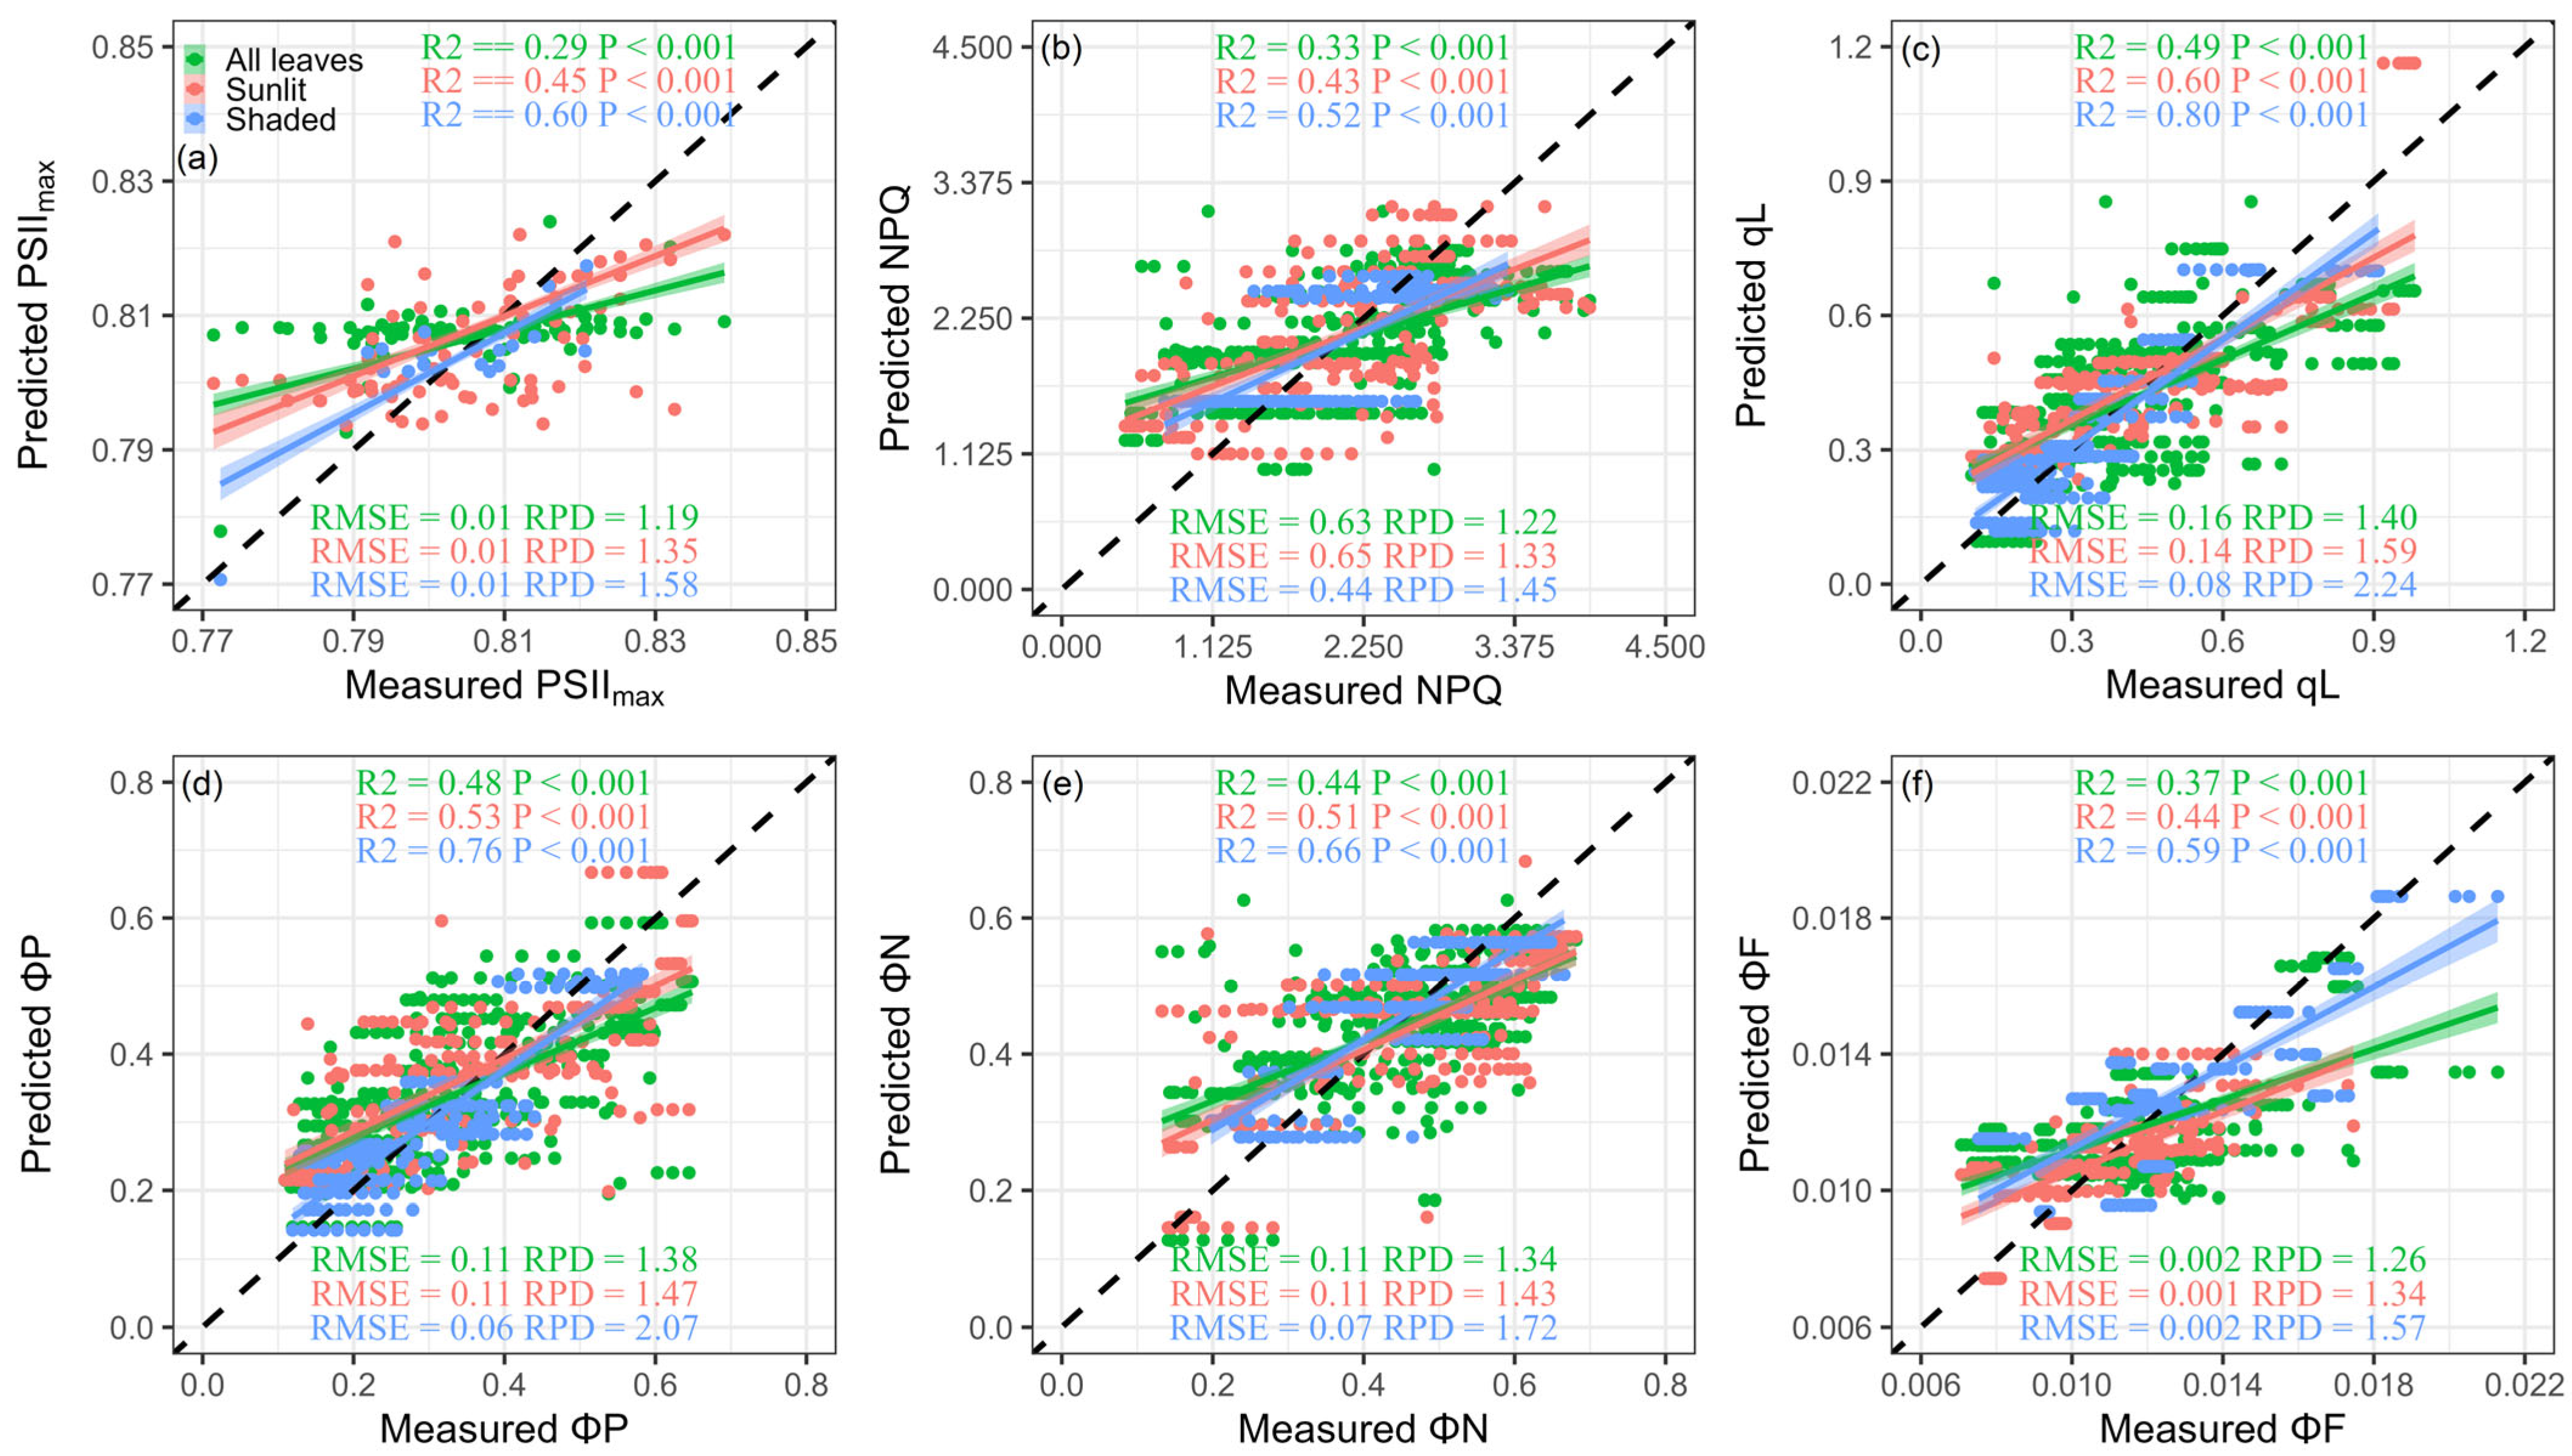
Figure 6 shows the R2, RMSE, and RPD between measured ChlFa and predicted ChlFa parameters from new indices across different light intensities and light qualities in all leaves, sunlit leaves, and shaded leaves. Overall, all ChlFa parameters retrieved from our newly developed indices captured more than 50% of the total variance in measured ChlFa parameters for shaded leaves. Moreover, satisfactory performance was observed in qL (R2 = 0.80, RMSE = 0.08) and ΦP (R2 = 0.76, RMSE = 0.06), in which the RPD was greater than 2. In addition, the new indices had fair performance for the prediction of qL (R2 = 0.60, RMSE = 0.14), ΦP (R2 = 0.53, RMSE = 0.11), and ΦN (R2 = 0.51, RMSE = 0.11) in sunlit leaves (RPD > 1.4). However, the new indices were unreliable for ChlFa parameters in all leaves (RPD < 1.4).
4. Discussion
4.1. Difference of Acclimation in ChlFa Parameters between Sunlit and Shaded Leaves
The results of this investigation show that sunlit and shaded leaves possessed different values for ChlFa parameters (Figure 3). We observed that the PSIImax, ΦP, and qL of sunlit leaves were significantly higher than those in shaded leaves, while the ΦN was higher in shaded leaves compared to sunlit leaves. Previous studies have demonstrated the difference in ChlFa parameters between sunlit leaves and shaded leaves for varying species [49,50,51]. Generally, plants have evolved adaptive mechanisms to cope with various light conditions and achieve optimum photosynthetic efficiency [52,53,54]. Differences in ChlFa parameters between sunlit and shaded leaves result from taxon-specific adaptation mechanisms and photosynthetic apparatus. The value of initial fluorescence is related to the oxidized QA (primary quinone) centers. Dietz et al. [55] pointed out that the QA was higher in sunlit leaves than in shade leaves of beech, causing a higher efficiency in chemical energy conversion for the sunlit leaves. In shaded leaves, photons are channeled into the dissipation pathways available for driving photochemistry, increasing heat dissipation [56]. In our study, the up-regulation of ΦN and down-regulation of ΦP in shaded leaves demonstrated adaptive photoprotection of the photosynthetic apparatus and lower PSII connectivity.
In addition, the production of ChlFa is affected by leaf biochemical and physiological traits, especially chlorophyll content [1]. The ambient light intensity can modulate chlorophyll content, resulting in a variation in ChlFa parameters due to the change in light absorption and transport solar energy efficiency of light harvesting [57,58,59]. Zivcak, Brestic, Kalaji, and Govindjee [56] showed lower area-based chlorophyll content and quantum yield of photochemical quenching, along with higher quantum yield of non-photochemical quenching, in shaded leaves of barley. In contrast, Dai et al. [60] showed that full-sunlight leaves have lower chlorophyll content and photochemical quenching quantum yield, while having higher non-photochemical quenching quantum yield, compared with 67% shade leaves in T. hemsleyanum. This result illustrates that plants may maximize the efficiency of light capture by increasing chlorophyll content. Thus, we conclude that the trade-off between photochemical and non-photochemical quenching is a universal phenomenon, but the relationship between ChlFa parameters and chlorophyll content depends on plant species.
4.2. New Spectral Indices Reinforce the Potential for Tracing the ChlFa Parameters Compared with Reported Spectral Indices
In this study, the results suggested that all reported spectral indices had low reliability for tracing the ChlFa parameters (Figure 4). Although CRI1 and CRI2 performed relatively better (Table 2), they can merely simulate qL, ΦP, and ΦN in shaded leaves (RPD > 1.4). Gitelson et al. [61] proposed that the total pigment content can be estimated accurately by reciprocal reflectance in the 510 to 550 nm range in Norway maple, horse chestnut, and beech. Depending on this, a previous study found significant correlations between CRI with ΦP and electron transport rate in reed [62]. These correlations can be explained by the light absorption in the blue region of the spectrum and the physicochemical and photophysical functions of pigment content [61,63]. Additionally, the PRI is sensitive to carotenoid pigment composition and can be used as a proxy to track the short-term state of the xanthophyll cycle and the long-term changes in pigment [64,65,66]. Thus, some researchers have used the PRI to predict ΦP and NPQ [34,67]. However, in our study, we did not find evidence of a significant correlation between the PRI and ChlFa parameters. This is similar to the finding that the PRI is unreliable for tracing the large variations of NPQ [11,68].
We developed novel spectral indices for detecting ChlFa parameters using five spectral transformations and ten forms of given indices. The results showed that all ChlFa parameters were well quantified in shaded leaves, with R2 values ranging from 0.52 to 0.80 and RPD values ranging from 1.45 to 2.24 (Figure 6). Previous studies have substantiated the suitability of spectral indices derived from the visible light region (400 to 700 nm) and red edge region (680 to 780 nm) of the first-derivative spectrum for the monitoring of chlorophyll fluorescence parameters [69,70,71]. This is attributed to the fact that the visible light and red edge region are characterized by a significant absorption of red light by chlorophyll, coupled with multiple scattering events within mesophyll cells. Nevertheless, Dobrowski et al. [72] explored wavelengths beyond the absorption range of chlorophyll and carotenoid pigments to achieve more efficient tracking of changes in ChlFa parameters than what can be achieved with traditional chlorophyll-related wavelengths. In our case, the selected bands of indices for ΦP detection were at 1610 and 1660 nm, and for qL detection they were at 1670, 1620, and 1720 nm in shaded leaves. This aligns with the findings of El-Hendawy et al. [73], who suggested that alterations in moisture levels directly and indirectly impact the functional state of photosynthetic machinery. Consequently, the pronounced water absorption band situated in the shortwave infrared (SWIR) region is deemed valuable for the estimation of ChlFa parameters. In addition, previous studies have demonstrated the veracity of strong light absorbance by chlorophyll content at SWIR bands such as 1694, 1768, and 1773 nm [74,75,76]. It is well known that the chlorophyll content is closely related to the intensity of chlorophyll fluorescence and affects the light-harvesting complex and chloroplast structure [57,77]. Zhuang et al. [78] showed that chlorophyll content governed the intensity of fluorescence emission by affecting the photochemical process in cucumbers. Thus, the major influence of chlorophyll content on the photochemical process also confirms the accuracy of our novel spectral indices.
However, the new spectral indices did not show stable performances for NPQ and ΦF, in all leaves and sunlit leaves (RPD < 1.40) and showed only fair performance for qL (R2 = 0.60, RPD = 1.59), ΦP (R2 = 0.53, RPD = 1.47), and ΦN (R2 = 0.51, RPD = 1.43) in sunlit leaves (Figure 6). The probable reason for this is that we measured the NPQ and ΦF under varying light conditions with the fast-regulated processes of the photosynthetic apparatus. In comparison, the spectral reflectance was taken under the halogen lamp with the leaf clip. For sunlit leaves in our study, NPQ and ΦF depend not only on structure and pigment content, but also on light conditions. Hallik, Niinemets, and Kull [26] illustrated that sunlit leaves had a higher capacity to tolerate light fluctuations and fast-regulated flexible heat dissipation compared with shaded leaves. The observed poor prediction of NPQ and ΦF may be because sunlit leaves have a higher sensitivity to short-term changes in the state of the xanthophyll cycle under varying light conditions. Thus, new spectral indices may not accurately capture the dynamics of NPQ and ΦF in sunlit leaves.
4.3. Uncertainty and Perspective
The development of novel indices to track ChlFa parameters has great significance for monitoring plant biochemical processes, allowing for more accurate and consistent measurements of photosynthetic capacity. Our study thus provides useful guidance for tracing ChlFa parameters from spectral information. However, a few caveats are worth noting. We were unable to measure ChlFa parameters and spectral reflectance completely synchronously under various light conditions because we were limited by experimental conditions. This may have led to the inability to explain those ChlFa parameters that rapidly change within a short term, especially for sunlit leaves. In future studies, we will consider combining strictly simultaneous measurements of ChlFa and spectral reflectance. In addition, only mango leaves were investigated in our study and the experiment was performed in the laboratory. Furthermore, even though direct quantification of chlorophyll fluorescence emitted by leaves under natural sunlight remains a major challenge due to the exceptionally weak fluorescence signal, which is easily masked by reflected light [15], an interesting advance can be found in the work of Van der Tol et al. [79], who introduced the Fluspect model to quantitatively evaluate crucial processes such as absorption, emission, and scattering. The model used a specific multiplication algorithm to accurately simulate the scattering and absorption of chlorophyll a fluorescence within the mesophyll layer. In the future, we will include a wider range of factors and incorporate appropriate models capable of accounting for the complex scattering effects to effectively track and analyze the various parameters associated with chlorophyll fluorescence.
5. Conclusions
Our measurements show that there are significant variations in ChlFa parameters among different leaf groups. Validation results suggested that the reliability of previously published spectral indices was low, and PRI is also not applicable. The predictive capability of newly developed spectral indices for ChlFa parameters was better in shaded leaves relative to sun leaves. Certain spectral indices chosen from the SWIR band exhibit a notable ability to accurately monitor ChlFa parameters. Our study especially reveals the potential difficulty of using spectral indices to detect ChlFa parameters due to differences in short-term tolerance to changing light conditions in sunlit and shaded leaves, even though it is appropriate to utilize hyperspectral indices as a potential technique for estimating ChlFa parameters. Further extensive studies on varying species in diverse light conditions are required before universal and feasible approaches for monitoring ChlFa parameters are established.
Supplementary Materials
The following supporting information can be downloaded at: https://www.mdpi.com/article/10.3390/rs15194890/s1, Table S1: Published spectral indices for the estimation of ChlFa parameters in other studies; Table S2: The given indices for the estimation of ChlFa parameters.; Table S3: The independent t-test for ChlFa parameters in all, sunlit and shaded leaves; Table S4: The ratio of performance to deviation (RPD) of reported indices for ChlF parameters in all leaves; Table S5: The ratio of performance to deviation (RPD) of reported indices for ChlF parameters in sunlit leaves; Table S6: The ratio of performance to deviation (RPD) of reported indices for ChlF parameters in shaded leaves; Table S7: Developed indices for quantifying ChlF parameters in all, sunlit and shaded leaves.
Author Contributions
Conceptualization, Q.W.; methodology, Q.W.; investigation, J.Z.; formal analysis, J.Z. and G.S.; software, J.Z., G.S. and J.J.; visualization, J.Z.; writing—original draft preparation, J.Z. and Q.W. All authors have read and agreed to the published version of the manuscript.
Funding
This research received no external funding.
Data Availability Statement
The data that support the findings of this study are available upon reasonable request from the corresponding author.
Acknowledgments
We are grateful to the members of the International Joint Laboratory of Ecology and Remote Sensing of Nanning Normal University and the Baise National Agricultural Sci-tech Zone for their support of both fieldwork and laboratory analyses. We thank Yuqing Huang of Nanning Normal University for her support in conducting this study. We are also grateful to Shuting Song, JiaJia Mo, and Shuyue Liu for their support of fieldwork and data collection.
Conflicts of Interest
The authors declare no conflict of interest.
References
- Baker, N.R. Chlorophyll Fluorescence: A Probe of Photosynthesis in Vivo. Annu. Rev. Plant Biol. 2008, 59, 89–113. [Google Scholar] [CrossRef]
- Porcar-Castell, A.; Tyystjärvi, E.; Atherton, J.; van der Tol, C.; Flexas, J.; Pfündel, E.E.; Moreno, J.; Frankenberg, C.; Berry, J.A. Linking chlorophyll a fluorescence to photosynthesis for remote sensing applications: Mechanisms and challenges. J. Exp. Bot. 2014, 65, 4065–4095. [Google Scholar] [CrossRef]
- Yang, H.; Yang, X.; Zhang, Y.; Heskel, M.A.; Lu, X.; Munger, J.W.; Sun, S.; Tang, J. Chlorophyll fluorescence tracks seasonal variations of photosynthesis from leaf to canopy in a temperate forest. Glob. Chang. Biol. 2017, 23, 2874–2886. [Google Scholar] [CrossRef] [PubMed]
- Zha, T.-S.; Wu, Y.J.; Jia, X.; Zhang, M.Y.; Bai, Y.J.; Liu, P.; Ma, J.Y.; Bourque, C.P.-A.; Peltola, H. Diurnal response of effective quantum yield of PSII photochemistry to irradiance as an indicator of photosynthetic acclimation to stressed environments revealed in a xerophytic species. Ecol. Indic. 2017, 74, 191–197. [Google Scholar] [CrossRef]
- Wang, S.; Zhang, Y.; Ju, W.; Wu, M.; Liu, L.; He, W.; Peñuelas, J. Temporally corrected long-term satellite solar-induced fluorescence leads to improved estimation of global trends in vegetation photosynthesis during 1995–2018. ISPRS J. Photogramm. Remote Sens. 2022, 194, 222–234. [Google Scholar] [CrossRef]
- Gu, L.; Han, J.; Wood, J.D.; Chang, C.Y.Y.; Sun, Y. Sun-induced Chl fluorescence and its importance for biophysical modeling of photosynthesis based on light reactions. New Phytol. 2019, 223, 1179–1191. [Google Scholar] [CrossRef] [PubMed]
- Han, J.; Chang, C.Y.Y.; Gu, L.; Zhang, Y.; Meeker, E.W.; Magney, T.S.; Walker, A.P.; Wen, J.; Kira, O.; McNaull, S.; et al. The physiological basis for estimating photosynthesis from Chla fluorescence. New Phytol. 2022, 234, 1206–1219. [Google Scholar] [CrossRef]
- Liu, Z.; Zhao, F.; Liu, X.; Yu, Q.; Wang, Y.; Peng, X.; Cai, H.; Lu, X. Direct estimation of photosynthetic CO2 assimilation from solar-induced chlorophyll fluorescence (SIF). Remote Sens. Environ. 2022, 271, 112893. [Google Scholar] [CrossRef]
- Schreiber, U.; Bilger, W.; Neubauer, C. Chlorophyll fluorescence as a nonintrusive indicator for rapid assessment of in vivo photosynthesis. In Ecophysiology of Photosynthesis; Springer: Berlin/Heidelberg, Germany, 1995; pp. 49–70. [Google Scholar]
- Grace, J.; Nichol, C.; Disney, M.; Lewis, P.; Quaife, T.; Bowyer, P. Can we measure terrestrial photosynthesis from space directly, using spectral reflectance and fluorescence? Glob. Chang. Biol. 2007, 13, 1484–1497. [Google Scholar] [CrossRef]
- Sonobe, R.; Wang, Q. Assessing hyperspectral indices for tracing chlorophyll fluorescence parameters in deciduous forests. J. Environ. Manag. 2018, 227, 172–180. [Google Scholar] [CrossRef]
- Guanter, L.; Rossini, M.; Colombo, R.; Meroni, M.; Frankenberg, C.; Lee, J.-E.; Joiner, J. Using field spectroscopy to assess the potential of statistical approaches for the retrieval of sun-induced chlorophyll fluorescence from ground and space. Remote Sens. Environ. 2013, 133, 52–61. [Google Scholar] [CrossRef]
- Guan, K.; Berry, J.A.; Zhang, Y.; Joiner, J.; Guanter, L.; Badgley, G.; Lobell, D.B. Improving the monitoring of crop productivity using spaceborne solar-induced fluorescence. Glob. Chang. Biol. 2016, 22, 716–726. [Google Scholar] [CrossRef] [PubMed]
- Köhler, P.; Guanter, L.; Kobayashi, H.; Walther, S.; Yang, W. Assessing the potential of sun-induced fluorescence and the canopy scattering coefficient to track large-scale vegetation dynamics in Amazon forests. Remote Sens. Environ. 2018, 204, 769–785. [Google Scholar] [CrossRef]
- Meroni, M.; Rossini, M.; Guanter, L.; Alonso, L.; Rascher, U.; Colombo, R.; Moreno, J. Remote sensing of solar-induced chlorophyll fluorescence: Review of methods and applications. Remote Sens. Environ. 2009, 113, 2037–2051. [Google Scholar] [CrossRef]
- Mohammed, G.H.; Colombo, R.; Middleton, E.M.; Rascher, U.; van der Tol, C.; Nedbal, L.; Goulas, Y.; Pérez-Priego, O.; Damm, A.; Meroni, M.; et al. Remote sensing of solar-induced chlorophyll fluorescence (SIF) in vegetation: 50 years of progress. Remote Sens. Environ. 2019, 231, 111177. [Google Scholar] [CrossRef]
- Nichol, C.J.; Rascher, U.; Matsubara, S.; Osmond, B. Assessing photosynthetic efficiency in an experimental mangrove canopy using remote sensing and chlorophyll fluorescence. Trees 2006, 20, 9–15. [Google Scholar] [CrossRef]
- Junker, L.V.; Ensminger, I. Relationship between leaf optical properties, chlorophyll fluorescence and pigment changes in senescing Acer saccharum leaves. Tree Physiol. 2016, 36, 694–711. [Google Scholar] [CrossRef]
- Zhang, H.; Hu, H.; Zhang, X.; Wang, K.; Song, T.; Zeng, F. Detecting Suaeda salsa L. chlorophyll fluorescence response to salinity stress by using hyperspectral reflectance. Acta Physiol. Plant. 2012, 34, 581–588. [Google Scholar] [CrossRef]
- Zarco-Tejada, P.J.; Pushnik, J.C.; Dobrowski, S.; Ustin, S.L. Steady-state chlorophyll a fluorescence detection from canopy derivative reflectance and double-peak red-edge effects. Remote Sens. Environ. 2003, 84, 283–294. [Google Scholar] [CrossRef]
- Zheng, W.; Lu, X.; Li, Y.; Li, S.; Zhang, Y. Hyperspectral Identification of Chlorophyll Fluorescence Parameters of Suaeda salsa in Coastal Wetlands. Remote Sens. 2021, 13, 2066. [Google Scholar] [CrossRef]
- Wen, S.; Shi, N.; Lu, J.; Gao, Q.; Yang, H.; Gao, Z. Estimating Chlorophyll Fluorescence Parameters of Rice (Oryza sativa L.) Based on Spectrum Transformation and a Joint Feature Extraction Algorithm. Agronomy 2023, 13, 337. [Google Scholar] [CrossRef]
- Gitelson, A.A.; Gamon, J.A.; Solovchenko, A. Multiple drivers of seasonal change in PRI: Implications for photosynthesis 1. Leaf level. Remote Sens. Environ. 2017, 191, 110–116. [Google Scholar] [CrossRef]
- Pinto, F.; Celesti, M.; Acebron, K.; Alberti, G.; Cogliati, S.; Colombo, R.; Juszczak, R.; Matsubara, S.; Miglietta, F.; Palombo, A.; et al. Dynamics of sun-induced chlorophyll fluorescence and reflectance to detect stress-induced variations in canopy photosynthesis. Plant Cell Environ. 2020, 43, 1637–1654. [Google Scholar] [CrossRef]
- Sarijeva, G.; Knapp, M.; Lichtenthaler, H.K. Differences in photosynthetic activity, chlorophyll and carotenoid levels, and in chlorophyll fluorescence parameters in green sun and shade leaves of Ginkgo and Fagus. J. Plant Physiol. 2007, 164, 950–955. [Google Scholar] [CrossRef]
- Hallik, L.; Niinemets, Ü.; Kull, O. Photosynthetic acclimation to light in woody and herbaceous species: A comparison of leaf structure, pigment content and chlorophyll fluorescence characteristics measured in the field. Plant Biol. 2012, 14, 88–99. [Google Scholar] [CrossRef]
- Matthews, J.S.A.; Vialet-Chabrand, S.; Lawson, T. Role of blue and red light in stomatal dynamic behaviour. J. Exp. Bot. 2020, 71, 2253–2269. [Google Scholar] [CrossRef] [PubMed]
- Huber, M.; Nieuwendijk, N.M.; Pantazopoulou, C.K.; Pierik, R. Light signalling shapes plant–plant interactions in dense canopies. Plant Cell Environ. 2021, 44, 1014–1029. [Google Scholar] [CrossRef] [PubMed]
- Semer, J.; Štroch, M.; Špunda, V.; Navrátil, M. Partitioning of absorbed light energy within photosystem II in barley can be affected by chloroplast movement. J. Photochem. Photobiol. B Biol. 2018, 186, 98–106. [Google Scholar] [CrossRef] [PubMed]
- Zhang, Y.; Kaiser, E.; Zhang, Y.; Yang, Q.; Li, T. Red/blue light ratio strongly affects steady-state photosynthesis, but hardly affects photosynthetic induction in tomato (Solanum lycopersicum). Physiol. Plant. 2019, 167, 144–158. [Google Scholar] [CrossRef] [PubMed]
- Van Gaalen, K.E.; Flanagan, L.B.; Peddle, D.R. Photosynthesis, chlorophyll fluorescence and spectral reflectance in Sphagnum moss at varying water contents. Oecologia 2007, 153, 19–28. [Google Scholar] [CrossRef] [PubMed]
- Shrestha, S.; Brueck, H.; Asch, F. Chlorophyll index, photochemical reflectance index and chlorophyll fluorescence measurements of rice leaves supplied with different N levels. J. Photochem. Photobiol. B Biol. 2012, 113, 7–13. [Google Scholar] [CrossRef] [PubMed]
- Jia, M.; Li, D.; Colombo, R.; Wang, Y.; Wang, X.; Cheng, T.; Zhu, Y.; Yao, X.; Xu, C.; Ouer, G.; et al. Quantifying Chlorophyll Fluorescence Parameters from Hyperspectral Reflectance at the Leaf Scale under Various Nitrogen Treatment Regimes in Winter Wheat. Remote Sens. 2019, 11, 2838. [Google Scholar] [CrossRef]
- Alonso, L.; Van Wittenberghe, S.; Amorós-López, J.; Vila-Francés, J.; Gómez-Chova, L.; Moreno, J. Diurnal Cycle Relationships between Passive Fluorescence, PRI and NPQ of Vegetation in a Controlled Stress Experiment. Remote Sens. 2017, 9, 770. [Google Scholar] [CrossRef]
- Jin, J.; Huang, N.; Huang, Y.; Yan, Y.; Zhao, X.; Wu, M. Proximal Remote Sensing-Based Vegetation Indices for Monitoring Mango Tree Stem Sap Flux Density. Remote Sens. 2022, 14, 1483. [Google Scholar] [CrossRef]
- Foley, S.; Rivard, B.; Sanchez-Azofeifa, G.A.; Calvo, J. Foliar spectral properties following leaf clipping and implications for handling techniques. Remote Sens. Environ. 2006, 103, 265–275. [Google Scholar] [CrossRef]
- Domingues, T.F.; Meir, P.; Feldpausch, T.R.; Saiz, G.; Veenendaal, E.M.; Schrodt, F.; Bird, M.; Djagbletey, G.; Hien, F.; Compaore, H.; et al. Co-limitation of photosynthetic capacity by nitrogen and phosphorus in West Africa woodlands. Plant Cell Environ. 2010, 33, 959–980. [Google Scholar] [CrossRef]
- Butler, W.L. Energy Distribution in the Photochemical Apparatus of Photosynthesis. Annu. Rev. Plant Physiol. 1978, 29, 345–378. [Google Scholar] [CrossRef]
- van der Tol, C.; Berry, J.A.; Campbell, P.K.E.; Rascher, U. Models of fluorescence and photosynthesis for interpreting measurements of solar-induced chlorophyll fluorescence. J. Geophys. Res. Biogeosci. 2014, 119, 2312–2327. [Google Scholar] [CrossRef]
- Xiao, Q.; Tang, W.; Zhang, C.; Zhou, L.; Feng, L.; Shen, J.; Yan, T.; Gao, P.; He, Y.; Wu, N. Spectral preprocessing combined with deep transfer learning to evaluate chlorophyll content in cotton leaves. Plant Phenomics 2022, 2022, 9813841. [Google Scholar] [CrossRef]
- Geladi, P.; MacDougall, D.; Martens, H. Linearization and Scatter-Correction for Near-Infrared Reflectance Spectra of Meat. Appl. Spectrosc. 1985, 39, 491–500. [Google Scholar] [CrossRef]
- Barnes, R.J.; Dhanoa, M.S.; Lister, S.J. Standard Normal Variate Transformation and De-Trending of Near-Infrared Diffuse Reflectance Spectra. Appl. Spectrosc. 1989, 43, 772–777. [Google Scholar] [CrossRef]
- Martens, H.; Stark, E. Extended multiplicative signal correction and spectral interference subtraction: New preprocessing methods for near infrared spectroscopy. J. Pharm. Biomed. Anal. 1991, 9, 625–635. [Google Scholar] [CrossRef] [PubMed]
- Burger, J.; Geladi, P. Spectral Pre-Treatments of Hyperspectral near Infrared Images: Analysis of Diffuse Reflectance Scattering. J. Near Infrared Spectrosc. 2007, 15, 29–37. [Google Scholar] [CrossRef]
- Song, G.; Wang, Q. Developing Hyperspectral Indices for Assessing Seasonal Variations in the Ratio of Chlorophyll to Carotenoid in Deciduous Forests. Remote Sens. 2022, 14, 1324. [Google Scholar] [CrossRef]
- Wang, Q.; Jin, J.; Sonobe, R.; Chen, J.M. Derivative hyperspectral vegetation indices in characterizing forest biophysical and biochemical quantities. In Hyperspectral Indices and Image Classifications for Agriculture and Vegetation; CRC Press: Boca Raton, FL, USA, 2018; pp. 27–63. [Google Scholar]
- Jin, J.; Arief Pratama, B.; Wang, Q. Tracing Leaf Photosynthetic Parameters Using Hyperspectral Indices in an Alpine Deciduous Forest. Remote Sens. 2020, 12, 1124. [Google Scholar] [CrossRef]
- Song, G.; Wang, Q.; Jin, J. Exploring the instability of the relationship between maximum potential electron transport rate and maximum carboxylation rate in cool-temperate deciduous forests. Agric. For. Meteorol. 2021, 308, 108614. [Google Scholar]
- Wang, M.; Jiang, W.; Yu, H. Effects of Exogenous Epibrassinolide on Photosynthetic Characteristics in Tomato (Lycopersicon esculentum Mill) Seedlings under Weak Light Stress. J. Agric. Food Chem. 2010, 58, 3642–3645. [Google Scholar] [CrossRef] [PubMed]
- Yang, Z.Q.; Yuan, C.H.; Han, W.; Li, Y.X.; Xiao, F. Effects of low irradiation on photosynthesis and antioxidant enzyme activities in cucumber during ripening stage. Photosynthetica 2016, 54, 251–258. [Google Scholar] [CrossRef]
- Stratoulias, D.; Tóth, V.R. Photophysiology and Spectroscopy of Sun and Shade Leaves of Phragmites australis and the Effect on Patches of Different Densities. Remote Sens. 2020, 12, 200. [Google Scholar] [CrossRef]
- Dietzel, L.; Bräutigam, K.; Pfannschmidt, T. Photosynthetic acclimation: State transitions and adjustment of photosystem stoichiometry—Functional relationships between short-term and long-term light quality acclimation in plants. FEBS J. 2008, 275, 1080–1088. [Google Scholar] [CrossRef]
- Schöttler, M.A.; Tóth, S.Z. Photosynthetic complex stoichiometry dynamics in higher plants: Environmental acclimation and photosynthetic flux control. Front. Plant Sci. 2014, 5, 188. [Google Scholar] [CrossRef] [PubMed]
- Bettini, P.P.; Lazzara, L.; Massi, L.; Fani, F.; Mauro, M.L. Effect of far-red light exposure on photosynthesis and photoprotection in tomato plants transgenic for the Agrobacterium rhizogenes rolB gene. J. Plant Physiol. 2020, 245, 153095. [Google Scholar] [CrossRef]
- Dietz, K.J.; Schreiber, U.; Heber, U. The relationship between the redox state of QA and photosynthesis in leaves at various carbon-dioxide, oxygen and light regimes. Planta 1985, 166, 219–226. [Google Scholar] [CrossRef]
- Zivcak, M.; Brestic, M.; Kalaji, H.M.; Govindjee, N. Photosynthetic responses of sun- and shade-grown barley leaves to high light: Is the lower PSII connectivity in shade leaves associated with protection against excess of light? Photosynth. Res. 2014, 119, 339–354. [Google Scholar] [CrossRef] [PubMed]
- Horton, P.; Ruban, A.V.; Walters, R.G. Regulation of Light Harvesting in Green Plants (Indication by Nonphotochemical Quenching of Chlorophyll Fluorescence). Plant Physiol. 1994, 106, 415–420. [Google Scholar] [CrossRef] [PubMed]
- Mathur, S.; Jain, L.; Jajoo, A. Photosynthetic efficiency in sun and shade plants. Photosynthetica 2018, 56, 354–365. [Google Scholar] [CrossRef]
- Tan, S.-L.; Liu, T.; Zhang, S.-B.; Huang, W. Balancing light use efficiency and photoprotection in tobacco leaves grown at different light regimes. Environ. Exp. Bot. 2020, 175, 104046. [Google Scholar] [CrossRef]
- Dai, Y.; Shen, Z.; Liu, Y.; Wang, L.; Hannaway, D.; Lu, H. Effects of shade treatments on the photosynthetic capacity, chlorophyll fluorescence, and chlorophyll content of Tetrastigma hemsleyanum Diels et Gilg. Environ. Exp. Bot. 2009, 65, 177–182. [Google Scholar] [CrossRef]
- Gitelson, A.A.; Zur, Y.; Chivkunova, O.B.; Merzlyak, M.N. Assessing Carotenoid Content in Plant Leaves with Reflectance Spectroscopy¶. Photochem. Photobiol. 2002, 75, 272–281. [Google Scholar] [CrossRef] [PubMed]
- Stratoulias, D.; Balzter, H.; Zlinszky, A.; Tóth, V.R. Assessment of ecophysiology of lake shore reed vegetation based on chlorophyll fluorescence, field spectroscopy and hyperspectral airborne imagery. Remote Sens. Environ. 2015, 157, 72–84. [Google Scholar] [CrossRef]
- Demmig-Adams, B.; Gilmore, A.M.; Adams, W.W., III. In vivo functions of carotenoids in higher plants. FASEB J. 1996, 10, 403–412. [Google Scholar] [CrossRef]
- Filella, I.; Porcar-Castell, A.; Munné-Bosch, S.; Bäck, J.; Garbulsky, M.F.; Peñuelas, J. PRI assessment of long-term changes in carotenoids/chlorophyll ratio and short-term changes in de-epoxidation state of the xanthophyll cycle. Int. J. Remote Sens. 2009, 30, 4443–4455. [Google Scholar] [CrossRef]
- Garbulsky, M.F.; Peñuelas, J.; Gamon, J.; Inoue, Y.; Filella, I. The photochemical reflectance index (PRI) and the remote sensing of leaf, canopy and ecosystem radiation use efficiencies: A review and meta-analysis. Remote Sens. Environ. 2011, 115, 281–297. [Google Scholar] [CrossRef]
- Garrity, S.R.; Eitel, J.U.H.; Vierling, L.A. Disentangling the relationships between plant pigments and the photochemical reflectance index reveals a new approach for remote estimation of carotenoid content. Remote Sens. Environ. 2011, 115, 628–635. [Google Scholar] [CrossRef]
- Atherton, J.; Nichol, C.J.; Porcar-Castell, A. Using spectral chlorophyll fluorescence and the photochemical reflectance index to predict physiological dynamics. Remote Sens. Environ. 2016, 176, 17–30. [Google Scholar] [CrossRef]
- Rapaport, T.; Hochberg, U.; Cochavi, A.; Karnieli, A.; Rachmilevitch, S. The potential of the spectral ‘water balance index’ (WABI) for crop irrigation scheduling. New Phytol. 2017, 216, 741–757. [Google Scholar] [CrossRef] [PubMed]
- Jia, M.; Zhou, C.; Cheng, T.; Tian, Y.; Zhu, Y.; Cao, W.; Yao, X. Inversion of chlorophyll fluorescence parameters on vegetation indices at leaf scale. In Proceedings of the 2016 IEEE International Geoscience and Remote Sensing Symposium (IGARSS), Beijing, China, 10–15 July 2016; pp. 4359–4362. [Google Scholar]
- Peng, Y.; Zeng, A.; Zhu, T.; Fang, S.; Gong, Y.; Tao, Y.; Zhou, Y.; Liu, K. Using remotely sensed spectral reflectance to indicate leaf photosynthetic efficiency derived from active fluorescence measurements. J. Appl. Remote Sens. 2017, 11, 026034. [Google Scholar] [CrossRef]
- Lin, H.-H.; Lin, K.-H.; Jiang, J.-Y.; Wang, C.-W.; Chen, C.-I.; Huang, M.-Y.; Weng, J.-H. Comparisons between yellow and green leaves of sweet potato cultivars in chlorophyll fluorescence during various temperature regimes under high light intensities. Sci. Hortic. 2021, 288, 110335. [Google Scholar] [CrossRef]
- Dobrowski, S.Z.; Pushnik, J.C.; Zarco-Tejada, P.J.; Ustin, S.L. Simple reflectance indices track heat and water stress-induced changes in steady-state chlorophyll fluorescence at the canopy scale. Remote Sens. Environ. 2005, 97, 403–414. [Google Scholar] [CrossRef]
- El-Hendawy, S.; Al-Suhaibani, N.; Elsayed, S.; Alotaibi, M.; Hassan, W.; Schmidhalter, U. Performance of optimized hyperspectral reflectance indices and partial least squares regression for estimating the chlorophyll fluorescence and grain yield of wheat grown in simulated saline field conditions. Plant Physiol. Biochem. 2019, 144, 300–311. [Google Scholar] [CrossRef] [PubMed]
- Leon-Saval, S.G.; Birks, T.A.; Wadsworth, W.J.; Russell, P.S.J.; Mason, M.W. Supercontinuum generation in submicron fibre waveguides. Opt. Express 2004, 12, 2864–2869. [Google Scholar] [CrossRef] [PubMed]
- Min, M.; Lee, W.S.; Kim, Y.H.; Bucklin, R.A. Nondestructive Detection of Nitrogen in Chinese Cabbage Leaves Using VIS–NIR Spectroscopy. Hortic. Sci. 2006, 41, 162–166. [Google Scholar] [CrossRef]
- Liu, W.; Li, Y.; Tomasetto, F.; Yan, W.; Tan, Z.; Liu, J.; Jiang, J. Non-destructive Measurements of Toona sinensis Chlorophyll and Nitrogen Content Under Drought Stress Using Near Infrared Spectroscopy. Front. Plant Sci. 2022, 12, 809828. [Google Scholar] [CrossRef]
- Csintalan, Z.; Tuba, Z.; Lichtenthaler, H.K. Changes in laser-induced chlorophyll fluorescence ratio F690/F735 in the poikilochlorophyllous desiccation tolerant plant Xerophyta scabrida during desiccation. J. Plant Physiol. 1998, 152, 540–544. [Google Scholar] [CrossRef]
- Zhuang, J.; Wang, Y.; Chi, Y.; Zhou, L.; Chen, J.; Zhou, W.; Song, J.; Zhao, N.; Ding, J. Drought stress strengthens the link between chlorophyll fluorescence parameters and photosynthetic traits. PeerJ 2020, 8, e10046. [Google Scholar] [PubMed]
- Van der Tol, C.; Vilfan, N.; Dauwe, D.; Cendrero-Mateo, M.P.; Yang, P. The scattering and re-absorption of red and near-infrared chlorophyll fluorescence in the models Fluspect and SCOPE. Remote Sens. Environ. 2019, 232, 111292. [Google Scholar] [CrossRef]
Figure 1.
The possible fate of light energy absorbed by the leaf.

Figure 2.
Different spectral reflectance transformations from original (OR) (a), first-order (first) (b), logarithm (Log) (c), standard normal variate transformation (SNV) (d), multiplicative scatter correction (MSC) (e), and extended multiplicative scatter correction (EMSC) (f) for all leaves and sunlit and shaded leaves; color coding is used for different leaf groups.
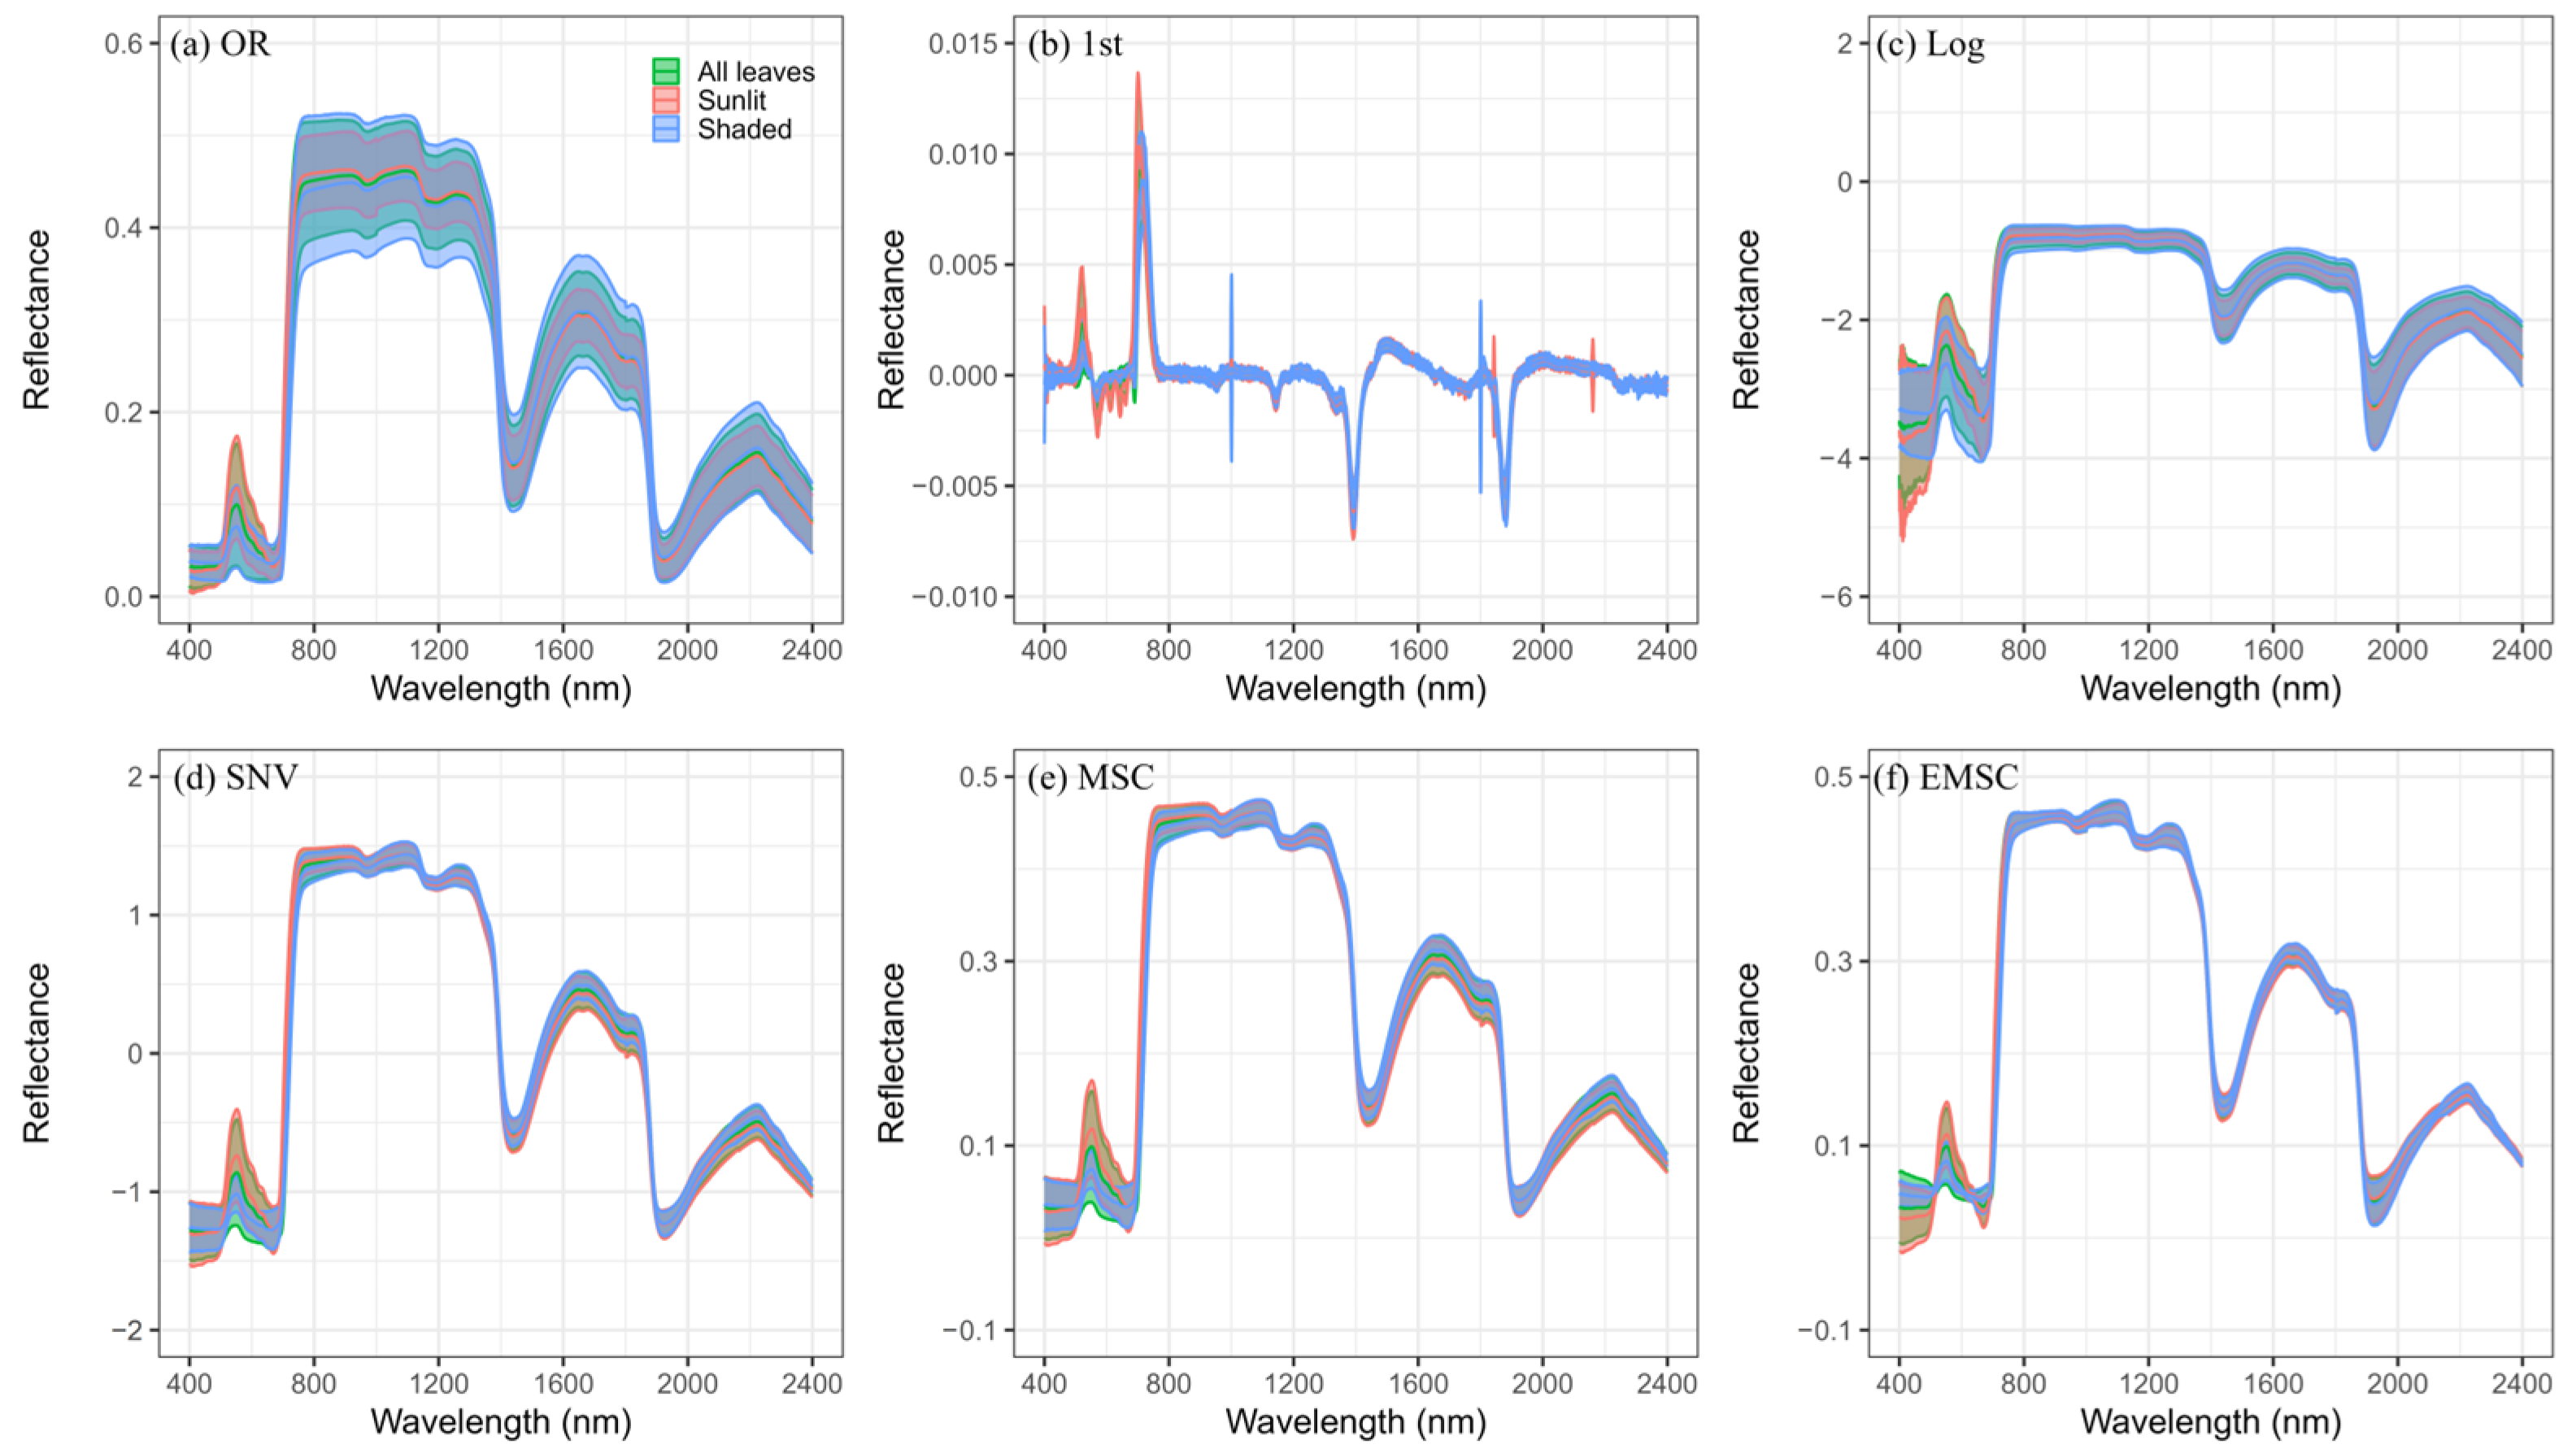
Figure 3.
Comparing the maximum quantum efficiency of photosystem II (PSIImax) (a), non-photochemical quenching (NPQ) (b), the fraction of open reaction centers in photosystem II (qL) (c), the cumulative quantum yield of photochemistry (ΦP) (d), regulated thermal dissipation (ΦN) (e), and fluorescence (ΦF) (f) for all leaves and sunlit and shaded leaves; in the boxplot, the black lines and white diamonds are the median lines and mean points, respectively; number and n represent the mean value and the sample size in each group; color coding is used for different leaf groups; asterisks represent significant differences of t-test (NS. p > 0.05, * p ≤ 0.05, ** p ≤ 0.01, *** p ≤ 0.001). Descriptive statistics of t-test can be viewed in Table S3.
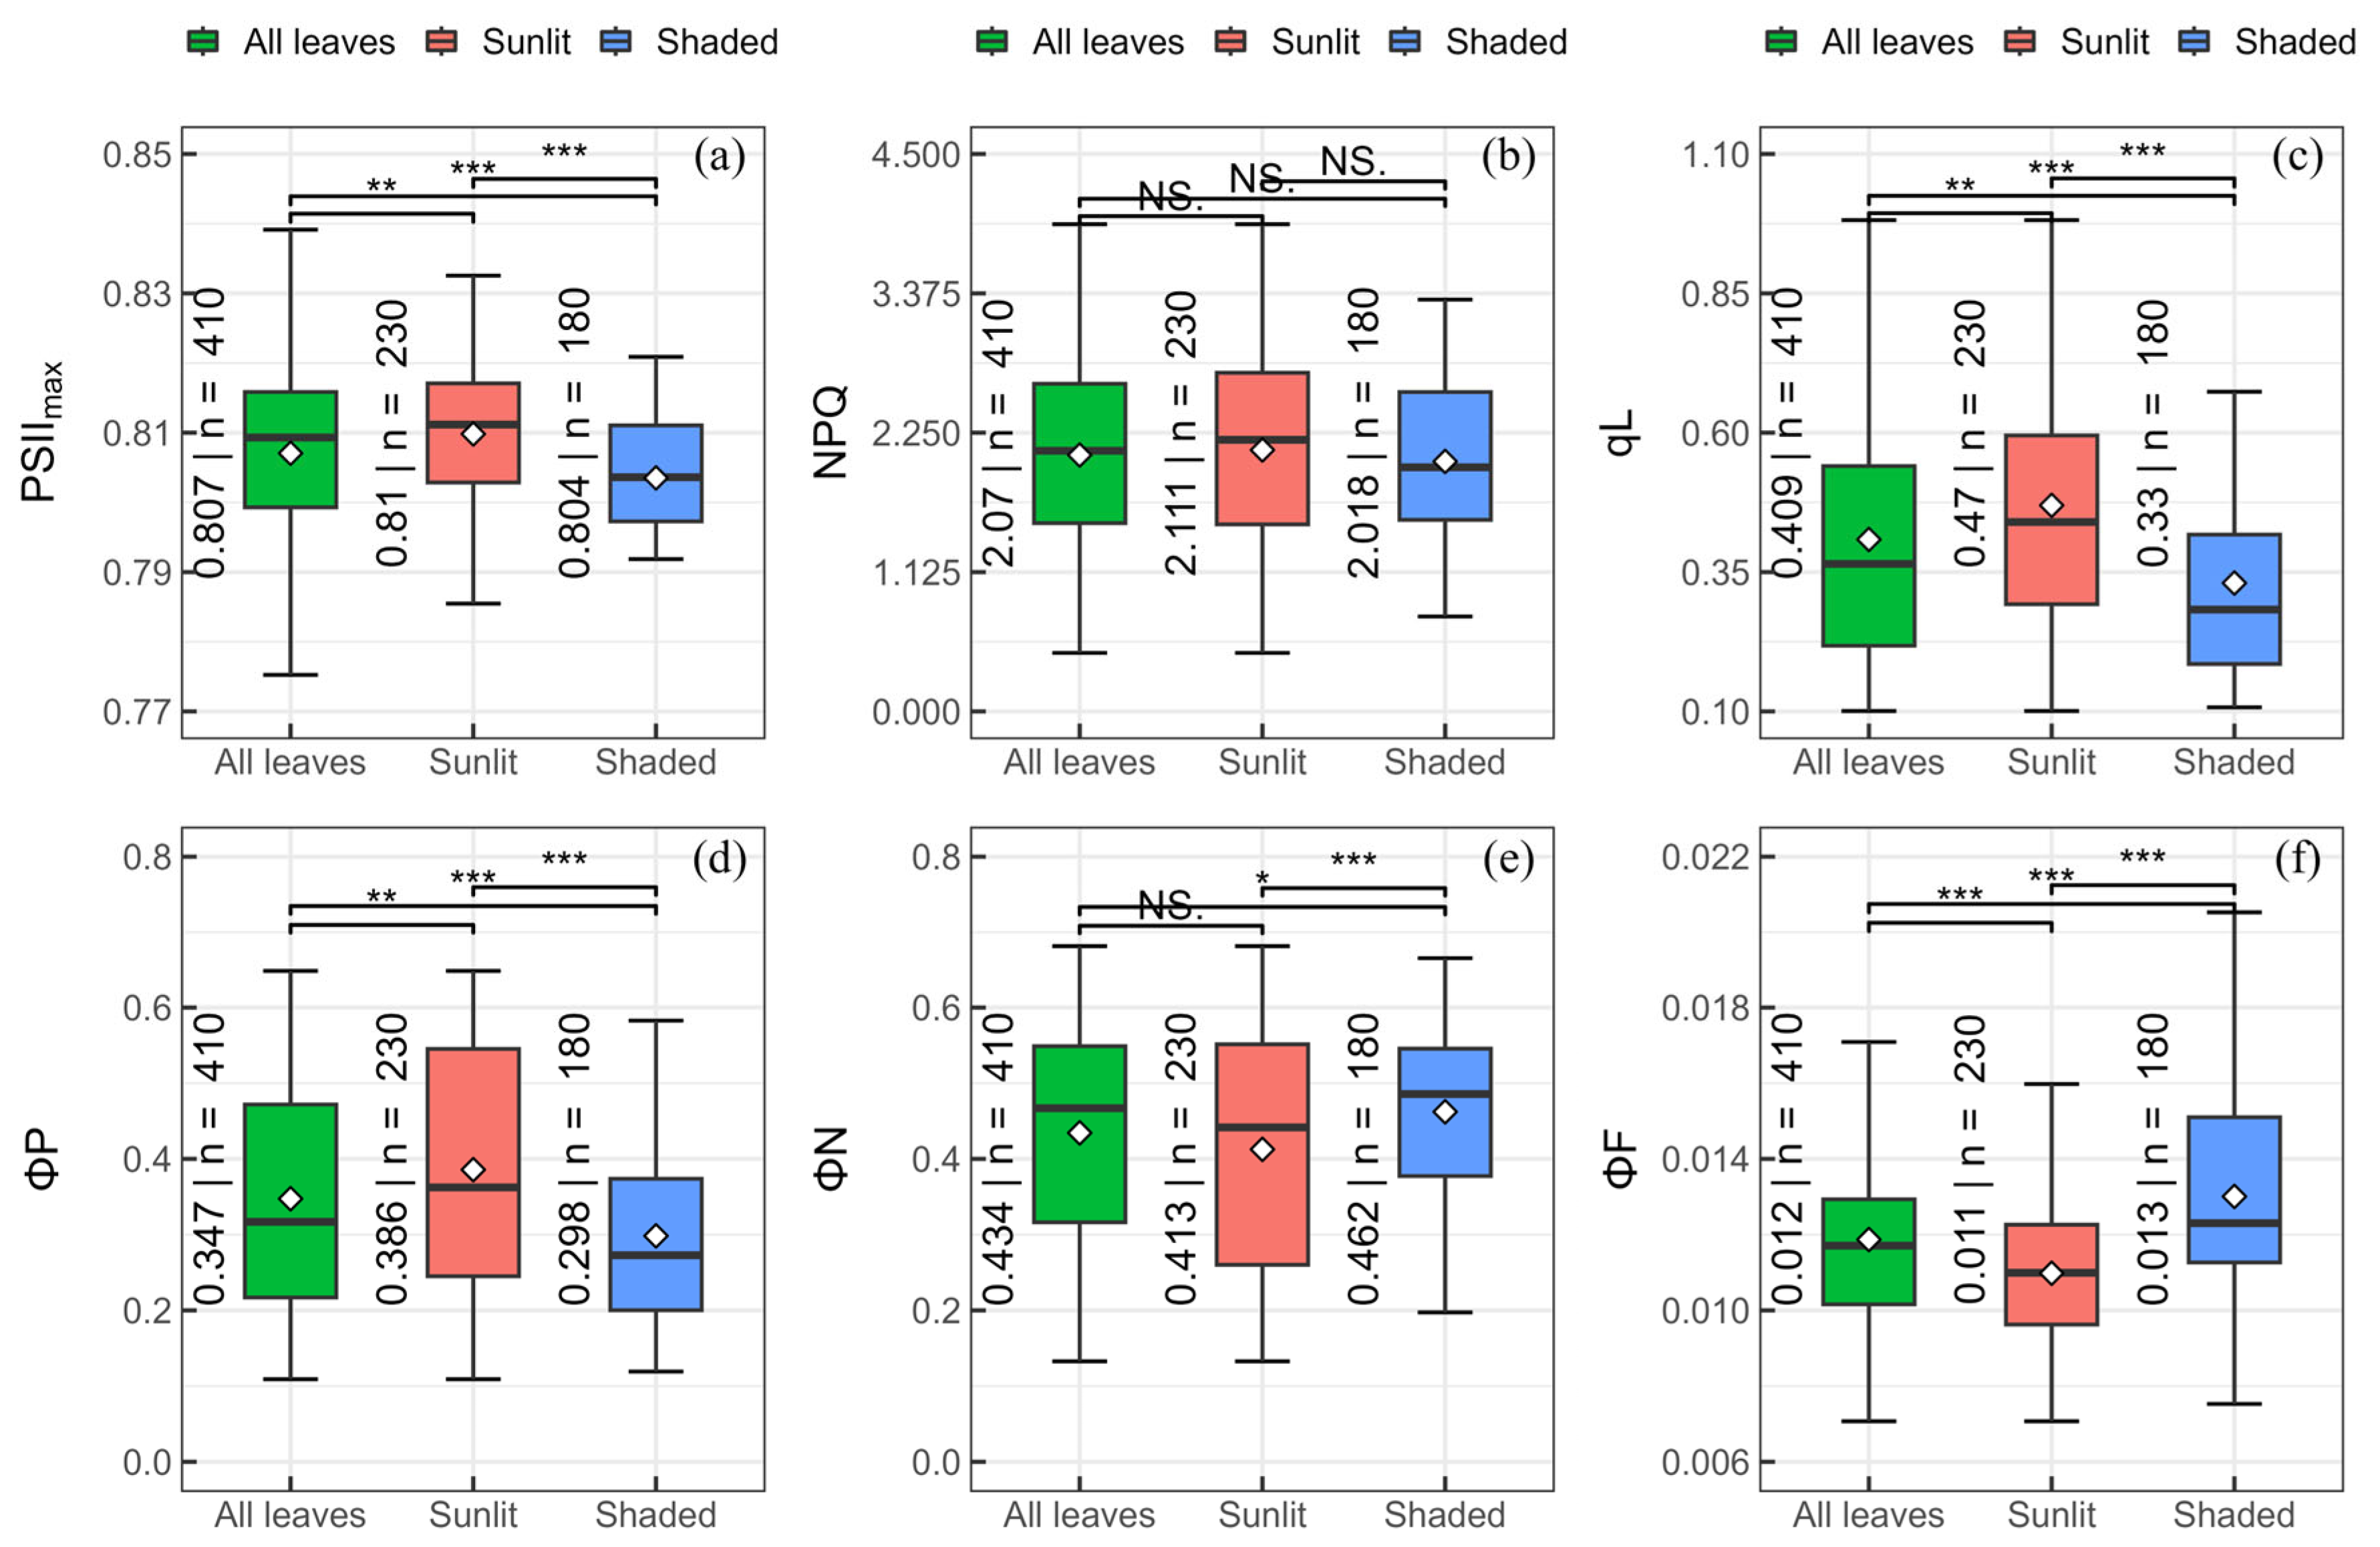
Figure 4.
Performance of published indices for estimating ChlFa parameters among all leaves (green) and sunlit (red) and shaded leaves (blue); RPD is the ratio of performance to deviation; the red box is the best index based on RPD evaluation; all RPD values are presented in Tables S4–S6.
Figure 4.
Performance of published indices for estimating ChlFa parameters among all leaves (green) and sunlit (red) and shaded leaves (blue); RPD is the ratio of performance to deviation; the red box is the best index based on RPD evaluation; all RPD values are presented in Tables S4–S6.
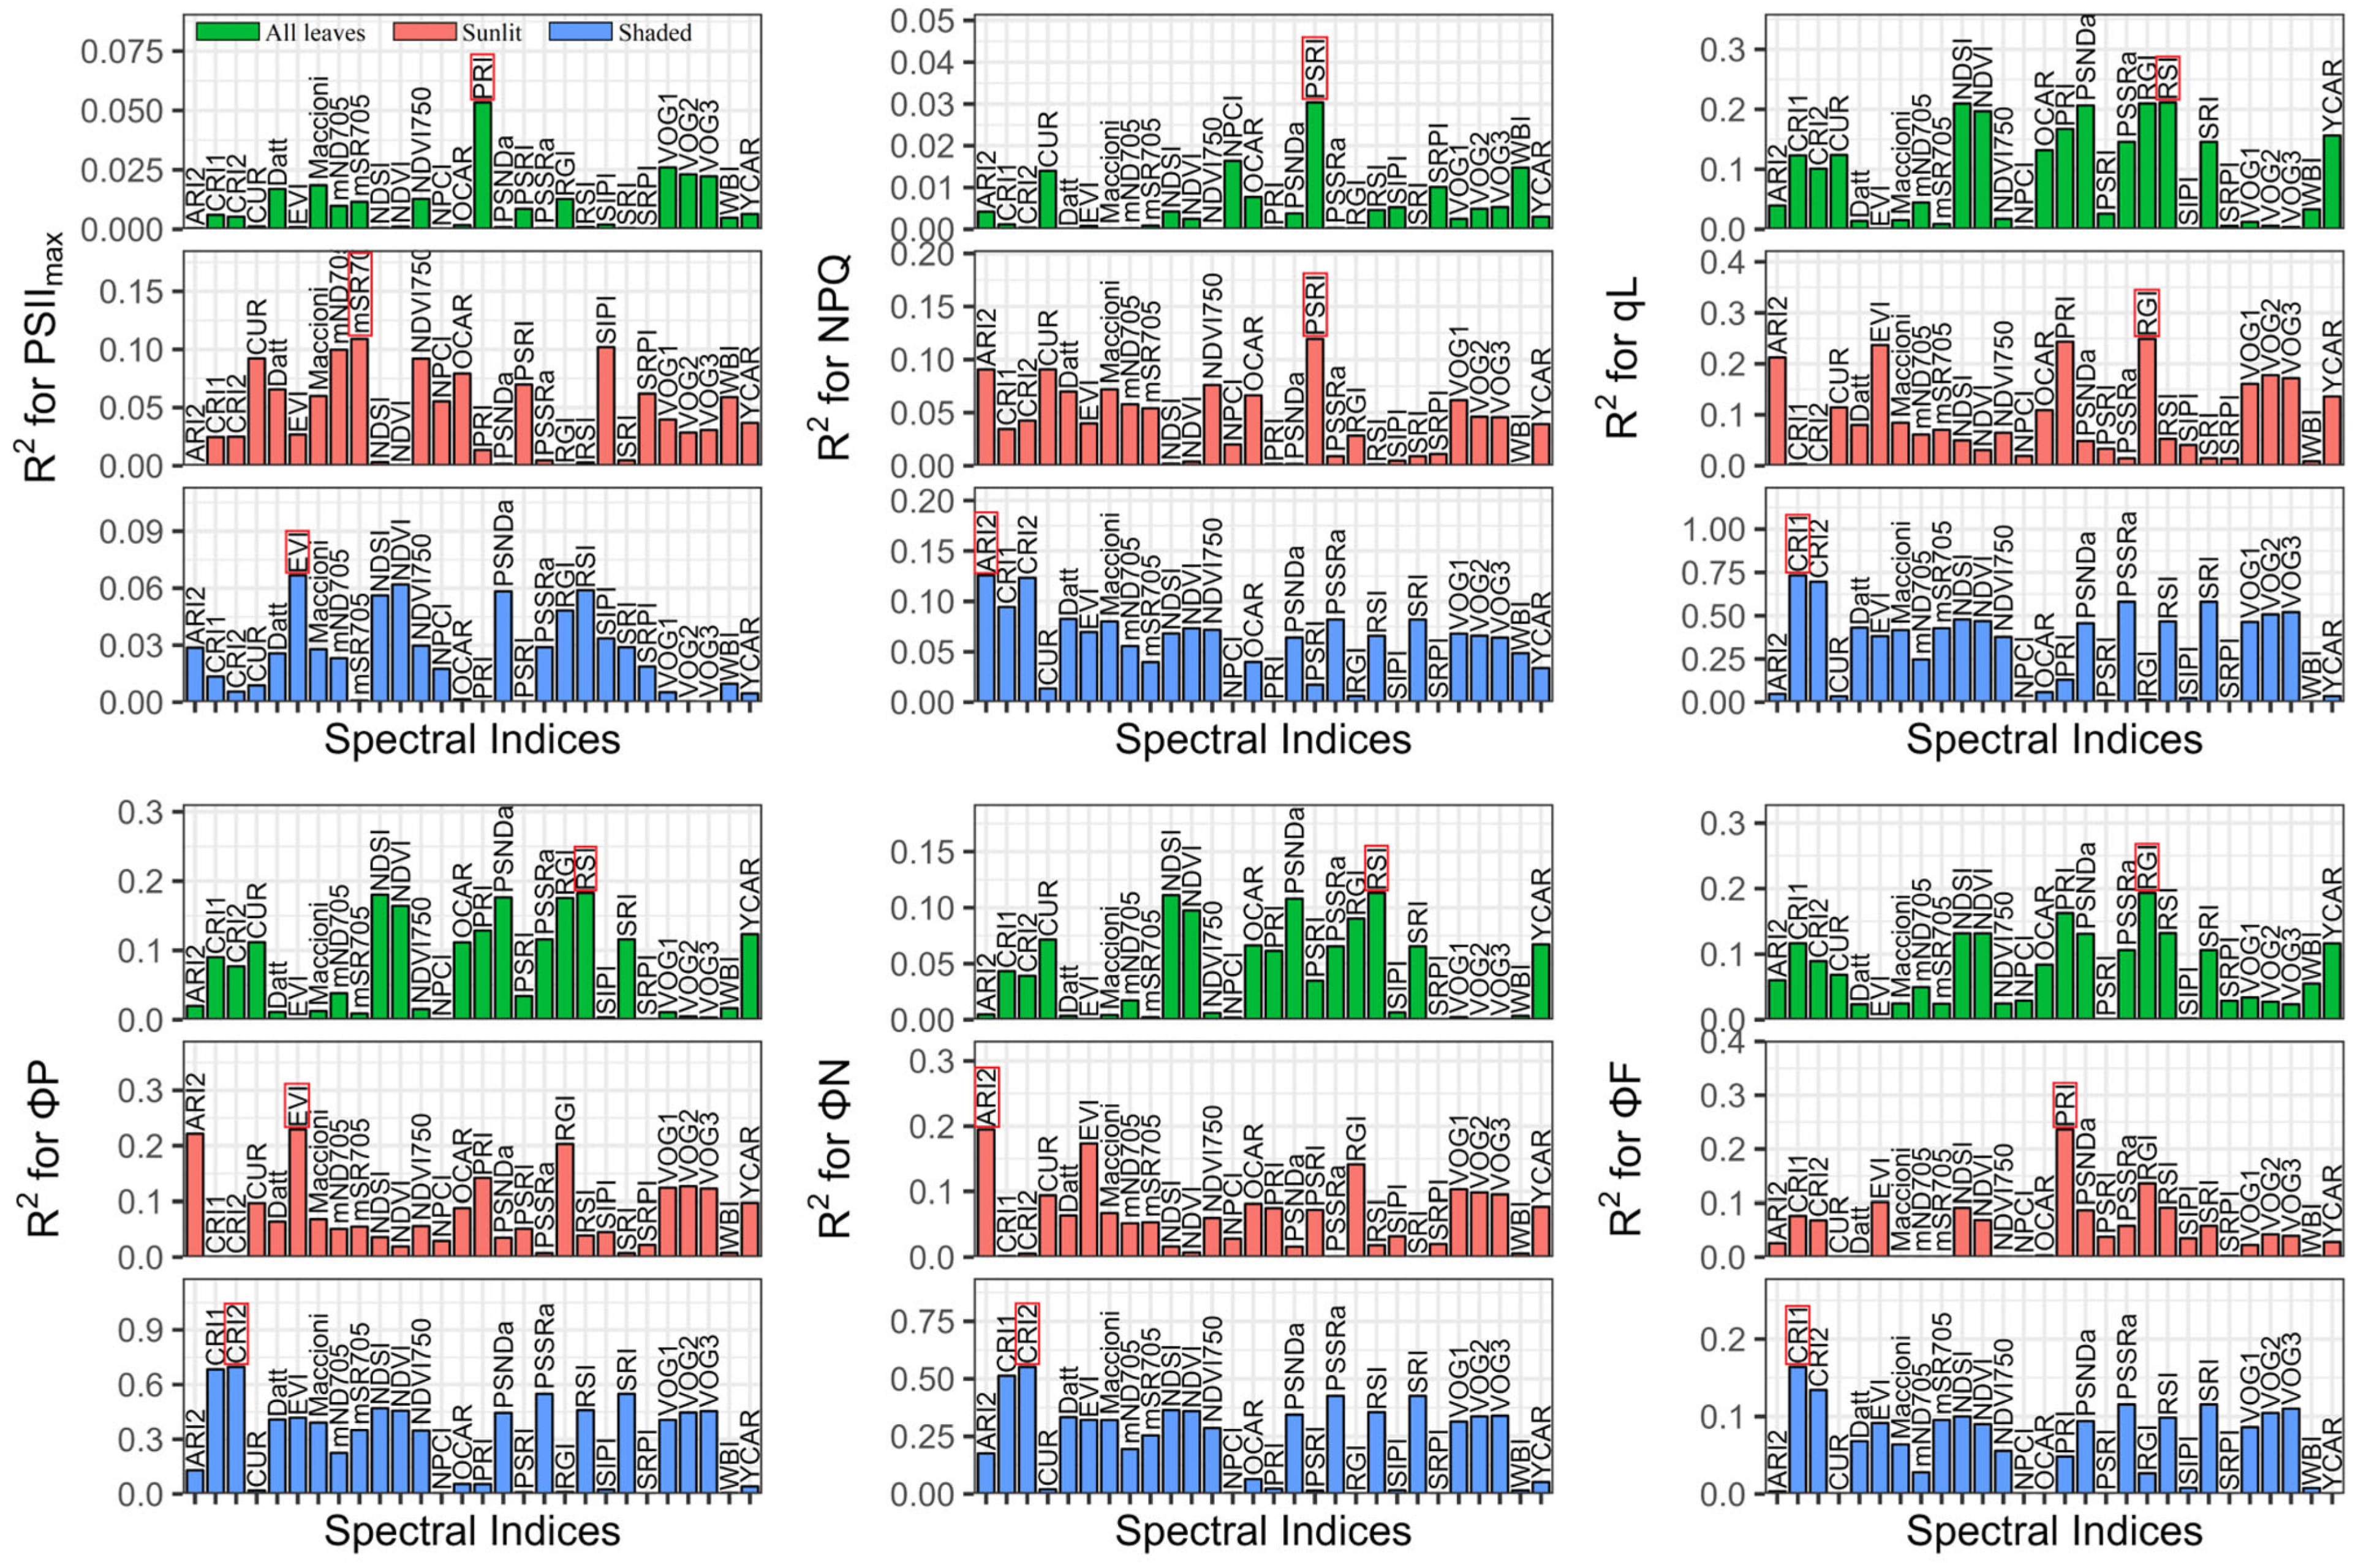
Figure 5.
Performance of different indices for the estimation of the maximum quantum efficiency of photosystem II (PSIImax) (a), non-photochemical quenching (NPQ) (b), the fraction of open reaction centers in photosystem II (qL) (c), the cumulative quantum yield of photochemistry (ΦP) (d), regulated thermal dissipation (ΦN) (e), and fluorescence (ΦF) (f) applying various spectral transformations among all leaves, sunlit leaves, and shaded leaves; color coding is used for different leaf groups, and shape coding is used for different index types; RPD is the ratio of performance to deviation; the label is the best index based on RPD evaluation for different leaf groups. The wavelength information of the determined new spectral indices can be viewed in Table S7.

Figure 6.
Measurements and predictions of the maximum quantum efficiency of photosystem II (PSIImax) (a), non-photochemical quenching (NPQ) (b), the fraction of open reaction centers in photosystem II (qL) (c), the cumulative quantum yield of photochemistry (ΦP) (d), regulated thermal dissipation (ΦN) (e), and fluorescence (ΦF) (f) using newly developed indices in all leaves, sunlit leaves, and shaded leaves; color coding is used for different leaf groups; the black dashed line represents the 1:1 line; R2 is the coefficient of determination, RMSE is the root mean square error, and RPD is the ratio of performance to deviation.

Table 1.
Effects of the leaf grouping on ChlFa parameters by one-way analysis of variance (ANOVA).
| Dependent Variable | Df | F Value | p Value |
|---|---|---|---|
| PSIImax | 2 | 14.46 | <0.001 |
| NPQ | 2 | 0.72 | 0.49 |
| qL | 2 | 20.73 | <0.001 |
| ΦP | 2 | 17.11 | <0.001 |
| ΦN | 2 | 6.07 | <0.01 |
| ΦF | 2 | 33.88 | <0.001 |
Table 2.
Performance of the best-performing published index for estimating the ChlFa parameters among all leaves and sunlit and shaded leaves. Asterisks indicate significance levels (***, p < 0.001).
Table 2.
Performance of the best-performing published index for estimating the ChlFa parameters among all leaves and sunlit and shaded leaves. Asterisks indicate significance levels (***, p < 0.001).
| Variable | Leaf Group | Index Name | R2 | RMSE | AIC | RPD |
|---|---|---|---|---|---|---|
| All leaves | PRI | 0.05 *** | 0.01 | 6.07 | 1.03 | |
| PSIImax | Sunlit | mSR705 | 0.11 *** | 0.01 | 6.21 | 1.06 |
| Shaded | EVI | 0.07 *** | 0.01 | 6.16 | 1.04 | |
| All leaves | PSRI | 0.03 *** | 0.76 | 2.30 | 1.02 | |
| NPQ | Sunlit | PSRI | 0.12 *** | 0.81 | 2.42 | 1.07 |
| Shaded | ARI2 | 0.13 *** | 0.59 | 1.81 | 1.07 | |
| All leaves | RSI | 0.21 *** | 0.20 | 0.41 | 1.13 | |
| qL | Sunlit | RGI | 0.25 *** | 0.20 | 0.41 | 1.16 |
| Shaded | CRI1 | 0.73 *** | 0.10 | 1.85 | 1.94 | |
| All leaves | RSI | 0.18 *** | 0.14 | 1.12 | 1.11 | |
| ΦP | Sunlit | EVI | 0.23 *** | 0.14 | 1.06 | 1.14 |
| Shaded | CRI2 | 0.70 *** | 0.07 | 2.55 | 1.82 | |
| All leaves | RSI | 0.11 *** | 0.14 | 1.16 | 1.06 | |
| ΦN | Sunlit | ARI2 | 0.19 *** | 0.14 | 1.04 | 1.12 |
| Shaded | CRI2 | 0.55 *** | 0.08 | 2.34 | 1.50 | |
| All leaves | RGI | 0.19 *** | 0.002 | 9.31 | 1.11 | |
| ΦF | Sunlit | PRI | 0.24 *** | 0.002 | 9.93 | 1.15 |
| Shaded | CRI1 | 0.16 *** | 0.003 | 9.09 | 1.10 |
Disclaimer/Publisher’s Note: The statements, opinions and data contained in all publications are solely those of the individual author(s) and contributor(s) and not of MDPI and/or the editor(s). MDPI and/or the editor(s) disclaim responsibility for any injury to people or property resulting from any ideas, methods, instructions or products referred to in the content. |
© 2023 by the authors. Licensee MDPI, Basel, Switzerland. This article is an open access article distributed under the terms and conditions of the Creative Commons Attribution (CC BY) license (https://creativecommons.org/licenses/by/4.0/).
Share and Cite
MDPI and ACS Style
Zhuang, J.; Wang, Q.; Song, G.; Jin, J. Validating and Developing Hyperspectral Indices for Tracing Leaf Chlorophyll Fluorescence Parameters under Varying Light Conditions. Remote Sens. 2023, 15, 4890. https://doi.org/10.3390/rs15194890
AMA Style
Zhuang J, Wang Q, Song G, Jin J. Validating and Developing Hyperspectral Indices for Tracing Leaf Chlorophyll Fluorescence Parameters under Varying Light Conditions. Remote Sensing. 2023; 15(19):4890. https://doi.org/10.3390/rs15194890
Chicago/Turabian StyleZhuang, Jie, Quan Wang, Guangman Song, and Jia Jin. 2023. "Validating and Developing Hyperspectral Indices for Tracing Leaf Chlorophyll Fluorescence Parameters under Varying Light Conditions" Remote Sensing 15, no. 19: 4890. https://doi.org/10.3390/rs15194890
Note that from the first issue of 2016, this journal uses article numbers instead of page numbers. See further details here.