Article

Quantitative Analysis of Tidal Creek Evolution and Vegetation Variation in Silting Muddy Flats on the Yellow Sea

1
School of Geographic Sciences, Nanjing University of Information Science and Technology, Nanjing 210044, China
2
Chang Wang School of Honors, Nanjing University of Information Science and Technology, Nanjing 210044, China
*
Author to whom correspondence should be addressed.
Remote Sens. 2023, 15(21), 5107; https://doi.org/10.3390/rs15215107
Submission received: 19 September 2023 / Revised: 15 October 2023 / Accepted: 23 October 2023 / Published: 25 October 2023

Abstract

:
Coastal wetland ecosystems around the world are facing serious challenges due to rapid economic development, climate change, and sea level rise. These factors have a great influence on the tidal creek network and vegetation ecosystem. Accordingly, based on long-term time-series remote sensing images, the evolution characteristics of tidal creeks and vegetation in silting muddy flats on the Yellow Sea were analyzed, and different quantitative methods were used to describe the relationship between tidal creeks and vegetation. The results showed that the total number of tidal creeks exhibited a downward trend, while the number of small creeks increased over time. The total length of the tidal creeks decreased at a rate of 16.1 km per year during the study period. The length of three-grade tidal creeks, the patch area ratio of Suaeda salsa, and a low vegetation coverage had a great influence on the average return flow length (LOP). LOP was negatively correlated with the patch area ratio of S. salsa, but positively correlated with the reclamation area, both significantly. With the increase in the patch area ratio of S. salsa, the total length of the tidal creeks increased by 12.95 km, and LOP decreased by 35.35 m.

1. Introduction

The coastal wetland ecosystems are facing serious challenges due anthropogenic and climatic changes worldwide. In the transition zone between terrestrial and marine ecosystems, the coastal wetland ecosystems are highly dynamic, complex, and fragile systems [1,2], providing some of the most important ecosystem services including wildlife habitats, water purification, and carbon sequestration [3,4]. Tidal creeks play a significant role in promoting coastal wetland ecosystem functioning and services, as they act as the main channel for material and energy exchange and information transfer between coastal wetlands and external terrestrial ecosystems [5,6]. For instance, an increased hydrological connectivity of the tidal ditch network promotes nutrient connectivity, maintains habitat biotope stability, and improves communities’ resistance to external disturbances [7]. Hence, tidal flats and silting landforms offer a significant platform for studying the morphological characteristics of tidal creeks. The Southeast China’s Yellow Sea muddy coast, one of the largest tidal flats in Asia, for example, is characterized by significant wetland vegetation and can be studied to understand the relationship between tidal creeks and vegetation cover, contributing to coastal wetland conservation and ecological restoration under the rapidly changing environment in the region [8].
Remote sensing data are mostly employed in land use studies, urban planning, natural resource management, disaster monitoring, agriculture, forestry, and ecological monitoring. With their continuous development and improvement, remote sensing data provide more and more information in the fields of earth science, environmental protection, agriculture and urban planning and promote the progress and development of the human society [9,10]. Remote sensing satellite image data have been increasingly useful for studying the relationship between vegetation and tidal creeks, as well as for establishing morphological characteristic indices in the presence of hydrological connectivity [11]. Recent studies suggested that the tidal gullies and wetland vegetation are interrelated [12,13]. The relationship between tidal creeks and vegetation distribution pattern in the Yangtze River delta, Yancheng nature reserve, and Yellow River delta has been established by examining the drainage efficiency of vegetation-free and vegetation-covered tidal creek networks, the evolution of tidal creeks, and the expansion of Spartina alterniflora [14,15,16]. Further, a significant positive correlation between the density of tidal creeks and the area ratio of S. salsa patches, as well as between the curvature of tidal creeks and the area ratio of patches, has also been observed [17]. However, the studies on the relationship between the evolution of tidal creeks and wetland vegetation on China’s coasts are not comprehensive. Especially, the relationship between tidal evolution and vegetation distribution in the Yellow Sea muddy coast reserve still receives little attention, and the latest remote sensing technologies are not applied in this area. A quantitative relationship between tidal creeks and vegetation in the muddy coast of the Yellow Sea has not yet been established, and related research on the distribution of tidal creek networks and the relationship between drainage efficiency and vegetation has not been carried out in depth.
In recent years, the emergence of deep learning algorithms has provided technical support for the interpretation of remote sensing images [18]. Compared to the accuracy achieved with some traditional classification methods, the extraction accuracy of remotely sensed data can be improved with the use of recently developed advanced approaches. For instance, U-Net has been extensively used to classify remote sensing images of coastal and marine environments [19,20,21]. The U-Net model was successfully used to identify the habitat of the red-crowned crane on the Yellow Sea muddy coast and characterize the competition among species for habitat and food resources [18]. At the same time, the update of some integrated software such as ARCGIS Pro has also become useful for the interpretation of remote sensing images. In previous landscape studies of the tidal creeks of Yancheng wetlands [17,22], the extraction of typical wetland landscapes was mostly accomplished by traditional methods, such as random forest and support vector machine. Deep learning algorithms such as U-Net can be used to improve the classification accuracy and to establish accurate relationships between tidal creeks and typical landscapes, as well as their evolution.
Therefore, in this study we used long-term Landsat, SPOT, and Sentinel-2 data to extract the tidal creeks networks and vegetation pattern of the Yellow Sea muddy coast from 1989 to 2021 and to determine the relationship between tidal creeks’ characteristic indices and wetland vegetation pattern. We then analyzed the spatial distribution of tidal creeks, vegetation cover changes, vegetation patch area ratio. The established relationship can provide the theoretical basis for the ecological restoration of this coastal wetland ecosystem.

2. Materials and Methods

2.1. Study Area

The study was the natural coastal mudflat between Sheyang Port and the Liangduo estuary. This area is largely controlled by intermittent tidal waves of the South Yellow Sea under a subtropical and tropical climate (Figure 1) [23]. The tidal action is frequent and strong, with an average tidal range of 2.42 m [24,25]. S. alterniflora was introduced in the 1980s and has expanded rapidly, together with other coastal plants including Phragmites australis and S. salsa.
S. alterniflora, a perennial herb suitable for growth in intertidal zones and marshes, originates from the eastern coast of North America and the Gulf of Mexico. In December 1979, S. alterniflora was introduced in the high tidal flats from the United States. S. alterniflora has a deep root system and forms a dense vegetation. Due to its strong adaptability and diffusion ability, it has rapidly invaded the growth area of local species [26]. While S. alterniflora has a positive effect on coastal protection, its invasion has led to a continuous decline in the habitat of native species (Phragmites australis and S. salsa). Due to the physiological characteristics of S. alterniflora and tidal flat reclamation, the area occupied by S. alterniflora has gradually shifted from high tidal flats to low tidal flats. The reclamation area has gradually expanded and invaded a large area previously occupied by S. salsa.

2.2. Data Sources

The satellite data used in this study were mainly Landsat series multispectral data set-s, SPOT, and Sentinel-2 satellite images (Geospatial Data Cloud, https://www.gscloud.cn/, https://scihub.copernicus.eu, https://regards.cnes.fr/user/swh/modules/60, accessed on 21 October 2022). Considering the hydrologically dependent vegetation conditions and the rapidly changing tidal levels (tidal depths) on the Yellow Sea muddy coast, the corresponding remote sensing images were selected (Table 1). The 11-scene remote sensed satellite data from 1989 to 2021 were mainly selected, and the multispectral data of three unmanned air vehicles (Xinya-ng Port, Red-crowned Crane Reserve, and Chuan Dong Port) were used as supplements for the calculation of the vegetation coverage.

2.3. Methods and Analysis

2.3.1. Tidal Creeks and Vegetation Classification

The normalized water index was calculated, and the planar vectors of the tidal creeks were extracted by the combination of supervised classification and visual interpretation. The center line of the planar vector of a tidal creek was extracted by the ArcScan module, considering a linear tidal creek [27,28].
I N D W I = B g r e e n B n i r B g r e e n + B n i r
where Bgreen is the green band, and Bnir is the near-infrared band.
An accurate classification of landscape vegetation in the silting muddy flats of the Yellow Sea can allow for the analysis of the correlation between the tidal creek system and vegetation and for the identification of the interaction mechanism between tidal creeks and vegetation. The four classification methods of random forest (RF), maximum likelihood (ML), support vector machine (SVM), and U-Net convolutional neural network were compared and analyzed, and their classification accuracy in extracting the landscape of the Yellow Sea muddy coast was compared. To quantitatively evaluate the accuracy, the overall classification accuracy (OA), the kappa coefficient, and the F1-score were used as evaluation indicators. OA represents the probability that the classification of all pixels is correct for the examined area. The kappa coefficient represents the error reduction ratio between the classification and a completely random classification. The F1-score is an index for the comprehensive evaluation of accuracy and recall rate and is expressed as the harmonic average of accuracy and recall rate [29,30]. The corresponding Equations are
O A = i = 1 N x i i N
k a p p a = N i = 1 N x i i i = 1 N ( x i + x + i ) / N 2 i = 1 N ( x i + x + i )  
where   x i i   is the number of correctly classified pixels in the image,   x i + and   x + i   are the sum of rows and columns of the confusion matrix, respectively, and N is the total number of pixels in the image;
F 1 = 2 · P · R P + R
where P represents the accuracy, also known as producer accuracy, which refers to the ratio of the number of pixels correctly classified into a class to the total number of real references of the class. R represents the recall rate, also known as user accuracy, which refers to the ratio of the total number of pixels correctly classified into a certain class to the total number of pixels classified by the classifier into the entire image.
The GEE pixel dichotomy model was used to calculate the vegetation coverage in the study area [31]. According to the classification principle of vegetation cover and the actual situation of the Yellow Sea muddy coast, the pixel types were classified as corresponding to no vegetation (0), low vegetation (0, 0.38), medium and low vegetation (0.38, 0.63), medium vegetation (0.63, 0.85), high vegetation (0.85, 1) (Ren et al., 2019) [32]. Fragstats 4.1 (oregon state university., Corvallis, The United States of America) was used to calculate the patch area ratio at the type level, reflecting the proportion of landscape patch types such as S. alterniflora in the entire landscape area. When its value tended to 0, it indicated that the examined patch type in the landscape tended to become very rare. When the value was equal to 100, it indicated that the whole landscape was composed of only one type of patch.

2.3.2. Tidal Creek Morphological Index

The total length (L), curvature (C) [33,34], fractal dimension (D) [35], and branching rate (Y) [27,36] were calculated to evaluate the morphological characteristics of the tidal creeks, which were then classified according to the principle of natural break point. The tidal creeks with similar morphological characteristics could be grouped together by using the natural break method, so that the differences in length for different tidal creek grades could be observed intuitively, and the differences in the morphological characteristics of tidal creeks of the same grade could be further reduced [37].
Return flow length (LUF) and average return flow length (LOP) can represent the water and sediment distribution efficiency of tidal creek networks at high tide and the drainage efficiency at ebb tide. LUF is a measure of the distance of the water flow from the tidal creek network, representing the distance of the water flow from the nearest waterway; LOP is the negative reciprocal of the slope of the linear part of the curve calculated based on the semi-logarithmic transcendental probability distribution curve, reflecting the average distance of the water flow from the tidal creek network [38,39].

2.3.3. Variable Importance Projection Analysis

In view of the influence of different factors on the drainage efficiency of tidal creek networks, variable importance projection (VIP) analysis was used. The VIP score was calculated as [40]:
I j = f = 1 F S f × W i f 2 × J S × F
where F is the number of principal components calculated based on a partial least squares regression model, S f   is the square sum of variance explained by the fth component (f = 1, 2, …, F). W i f   is the weight value of the jth variable and the fth component, j is the number of independent variables, and s is the sum of squares explained by the dependent variable. The VIP score is a measure of the importance of each explanatory variable [40]. The greater the VIP value, the greater the impact of a factor on the drainage efficiency of the tidal network.

2.3.4. Pearson Correlation Analysis

Pearson correlation analysis was used to describe the degree of linear correlation between two variables [39].

3. Results

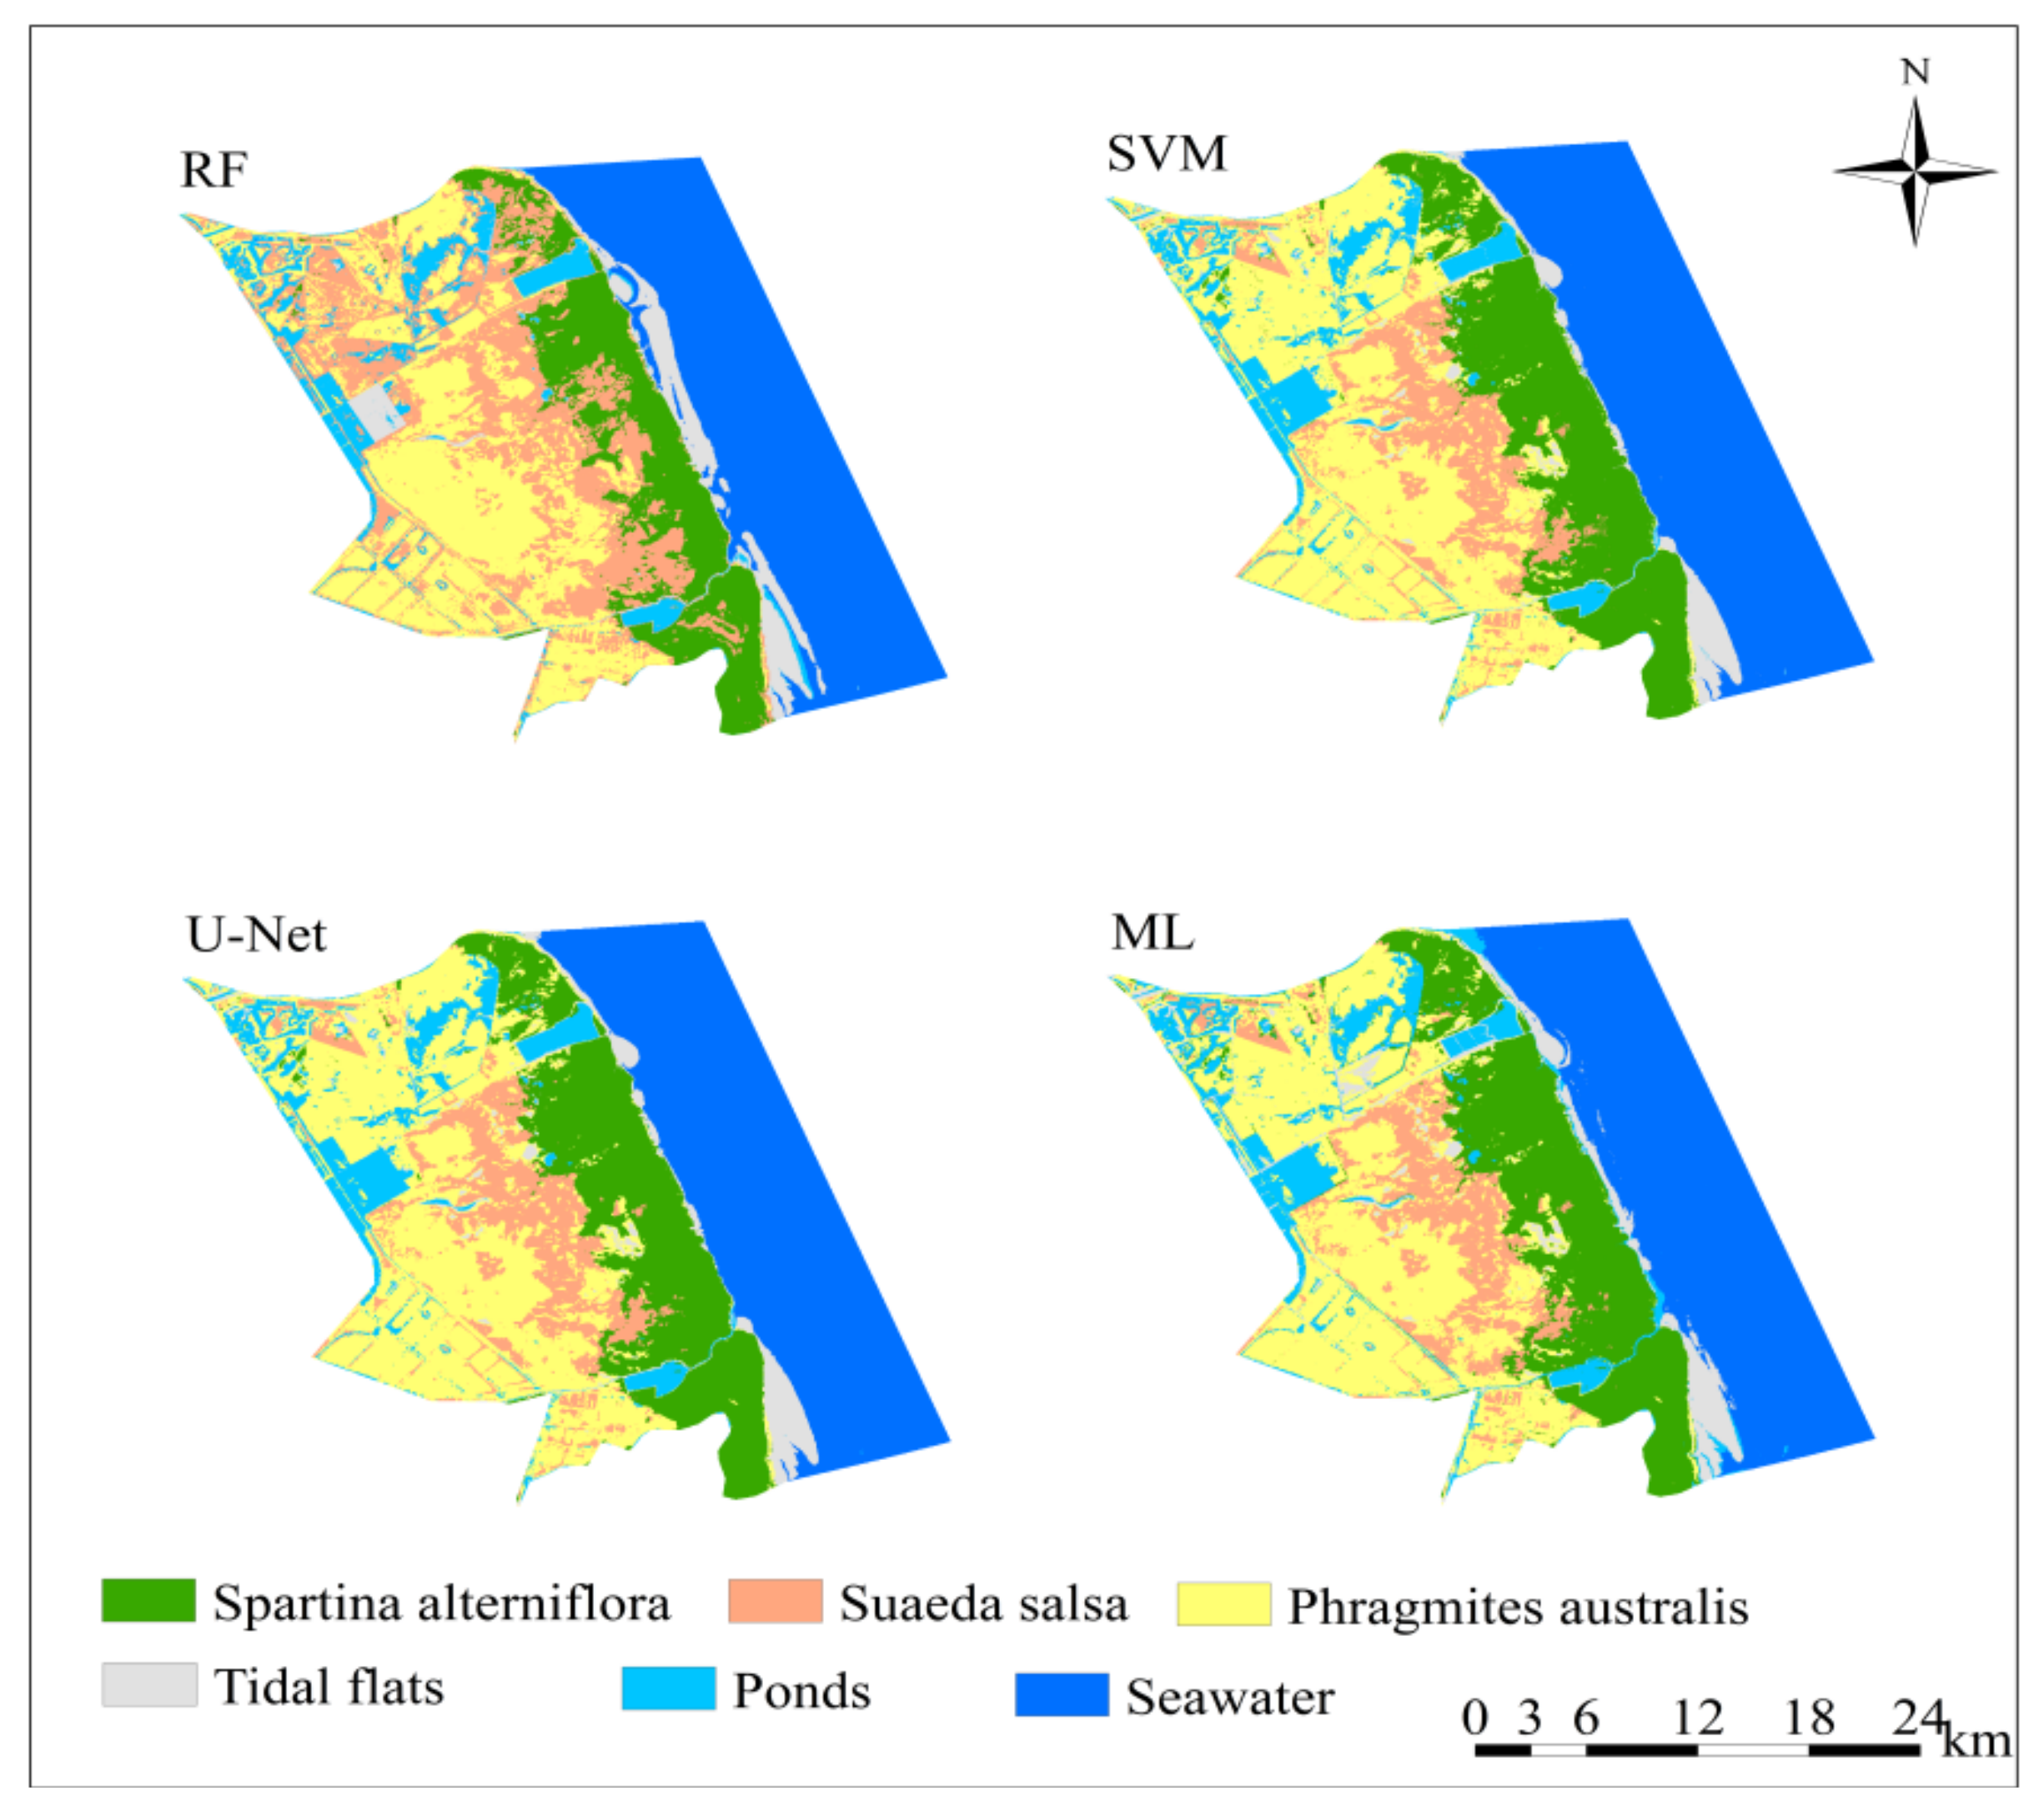
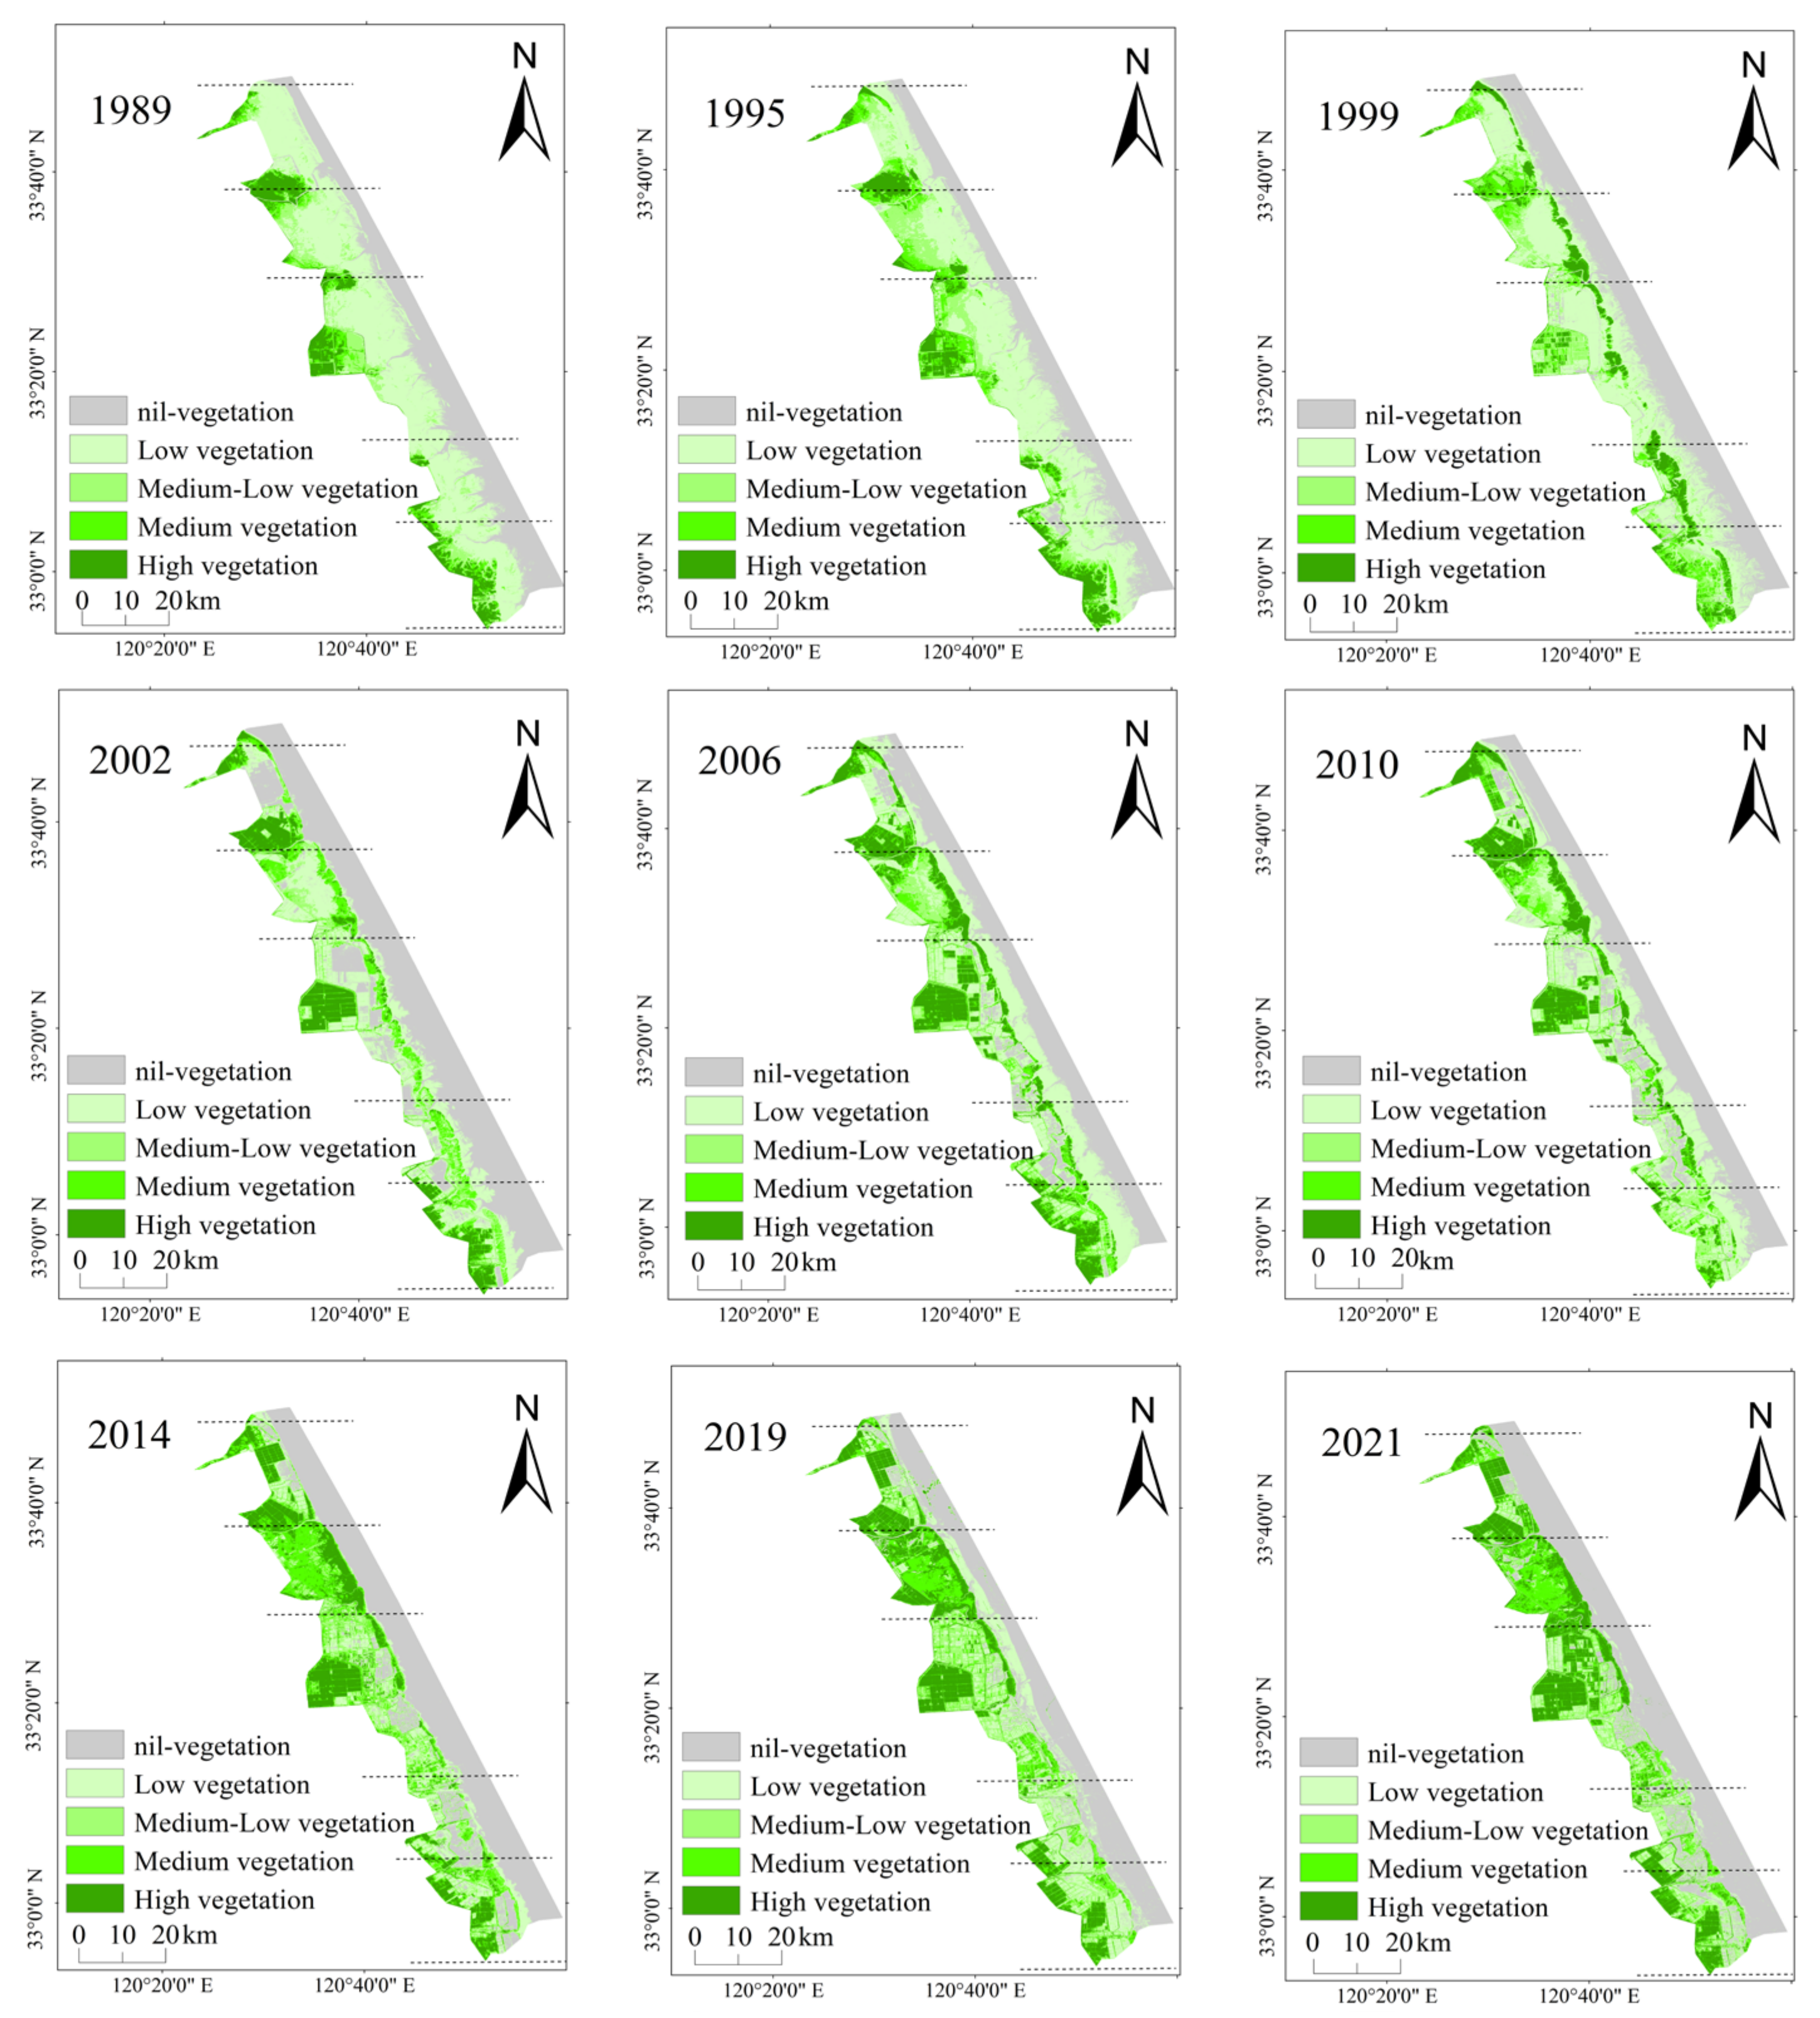
3.1. Classification of Landscape Vegetation Types

The results from the random forest (RF), maximum likelihood (ML), support vector machine (SVM), and U-Net convolutional neural network algorithms were compared. Taking the results for 2019 as an example (Figure 2), the random forest extraction effect was found to be relatively poor, and some P. australis areas were wrongly classified as S. salsa areas. The other three methods were able to better extract the wetland landscape information.
The overall accuracy and the kappa coefficient of the four classification methods were calculated. As shown in Figure 3, the overall accuracy of U-Net was the highest at 94.35%, followed by those of SVM, ML, and RF, which were 93.37%, 91.53%, and 87.34%, respectively. The kappa coefficient of U-Net was 0.95, followed by those of SVM, ML, and RF at 0.93, 0.91, and 0.86, respectively (Figure 3).
As shown in Table 2, U-Net had the highest F1 values, i.e., 94.53, 91.57, and 90.87, for the three typical landscapes of S. alterniflora, P. australis, and S. salsa, respectively. The F1 values of RF (85.36, 89.05, and 70.36) for S. alterniflora, P. australis, and S. salsa were the lowest. For S. alterniflora, there was no significant difference in the F1 values between U-Net and SVM and between SVM and ML. For Phragmites australis, there was no significant difference in the F1 values between U-Net and SVM (p < 0.01). For S. salsa, there was no significant difference in the F1 values between U-Net and SVM (p < 0.05).

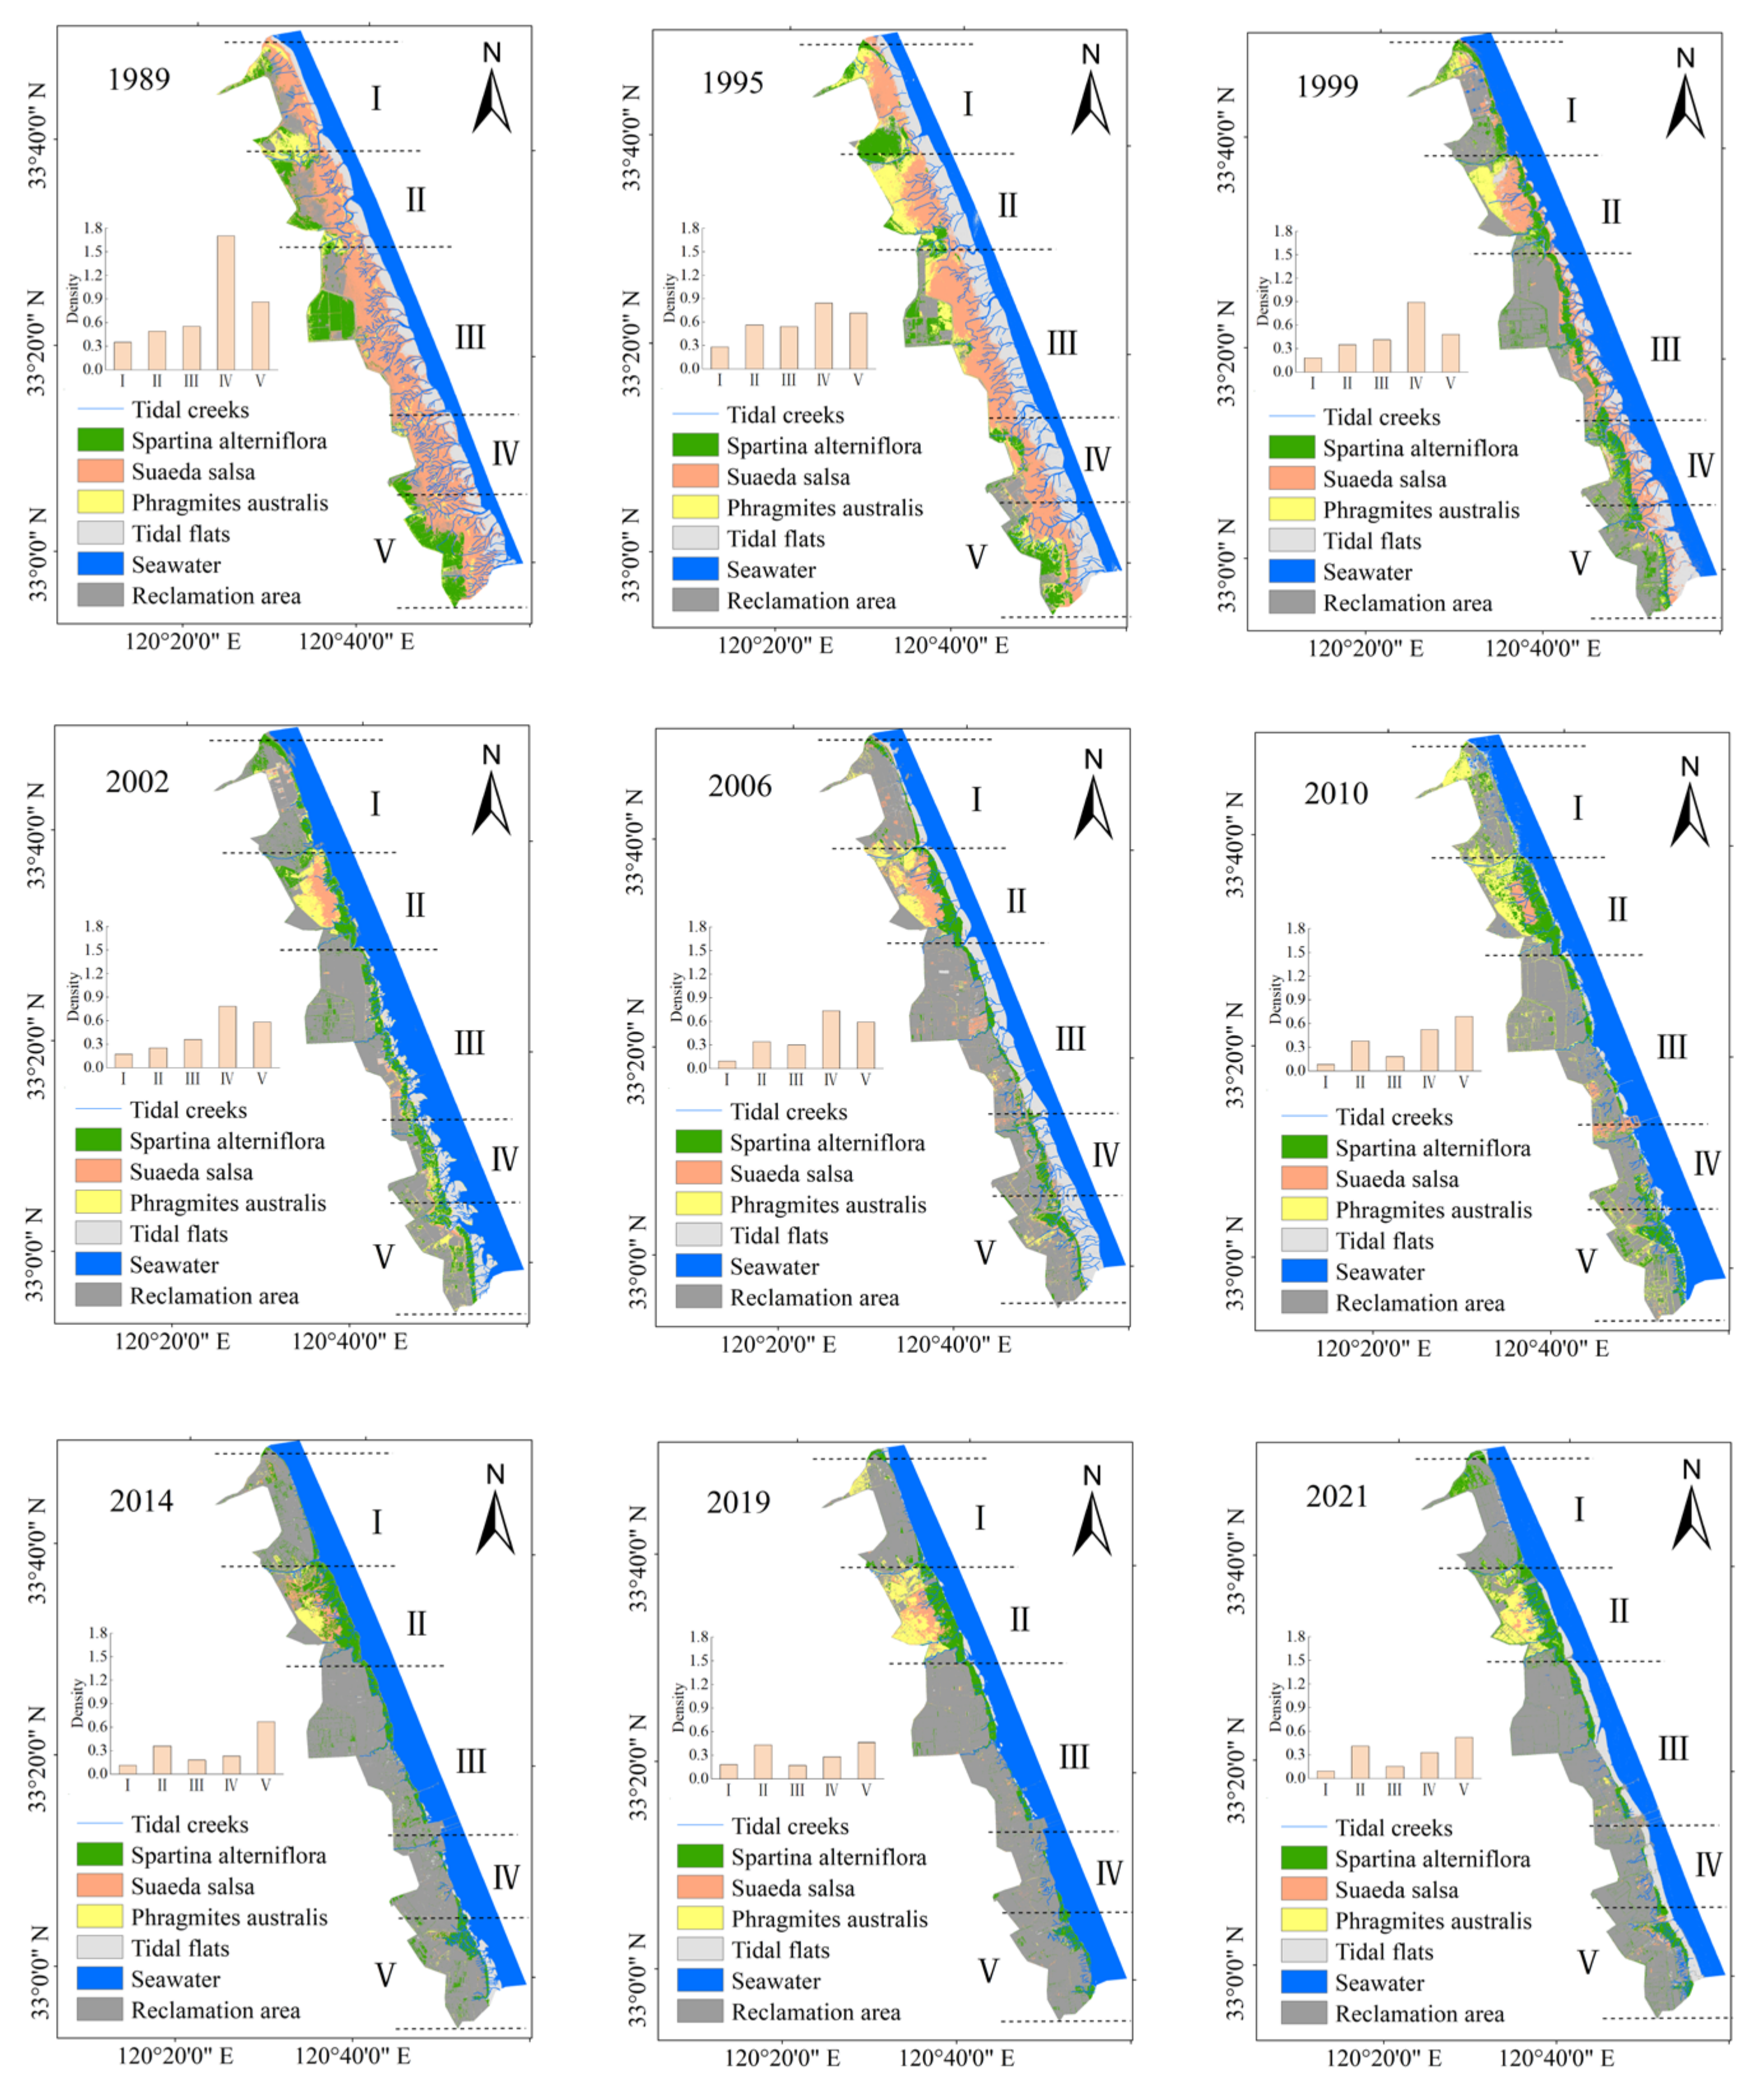
3.2. Spatiotemporal Heterogeneity of Tidal Creeks and Vegetation

The area of S. salsa decreased every year since 1989 and was occupied by S. alterniflora and wetland reclamation activities. By 2021, the area of S. salsa became the smallest (Figure 4). The rate of change of the P. australis vegetation area was not high compared to those the other two types of vegetation. P. australis was mainly distributed in the red-crowned crane protection area between Xinyang Port and Doulong Port (Figure 4).
According to Google Earth visual interpretation of the 2021 Sentinel-2 remote sensing images and tidal creek data, the accuracy of tidal creek extraction could be as high as 95%, indicating that we used the most appropriate approach to extract the remote sensing data. The evolution of the tidal flats with the network of creeks could be divided into various stages. The extracted distribution map (Figure 4) shows a decline in the length of the tidal creek network on the Yellow Sea muddy coast since 1989, along with an increased reclamation area.
Our results showed that the number and the length of the tidal creeks decreased, and the density of the tidal creeks was the lowest (Figure 4) between Sheyang Port and Xinyang Port. In 2021, the area had the least number of tidal creeks, with a tidal creek density of 0.09. Between Xinyang Port and Doulong Port, the number and length of tidal creeks decreased, but this area was less affected by human activities, the change in tidal creeks was not obvious, and the change in tidal creek density was also relatively small (Figure 4). Since the area was affected by human reclamation activities between Doulong Port and Dafeng Port, the length, number, and density of tidal creeks decreased significantly (Figure 4). Between Dafeng Port and Chuandong Port, the density of tidal creeks was the highest in 1989, and then the length, number, and density of tidal creeks decreased due to increased tidal flat reclamation (Figure 4). Between Chuandong Port and the Liang duo River, the length of the tidal creeks decreased due to the distribution of Spartina alterniflora in a relatively low tidal flat. Here, the area of short tidal creeks with dominant Spartina alterniflora increased, but due to the reclamation of the tidal flat, the density of tidal creeks in this area did not change significantly (Figure 4). In general, our extracted remote sensing data showed that the tidal creeks of the Yellow Sea muddy coast were disappearing.

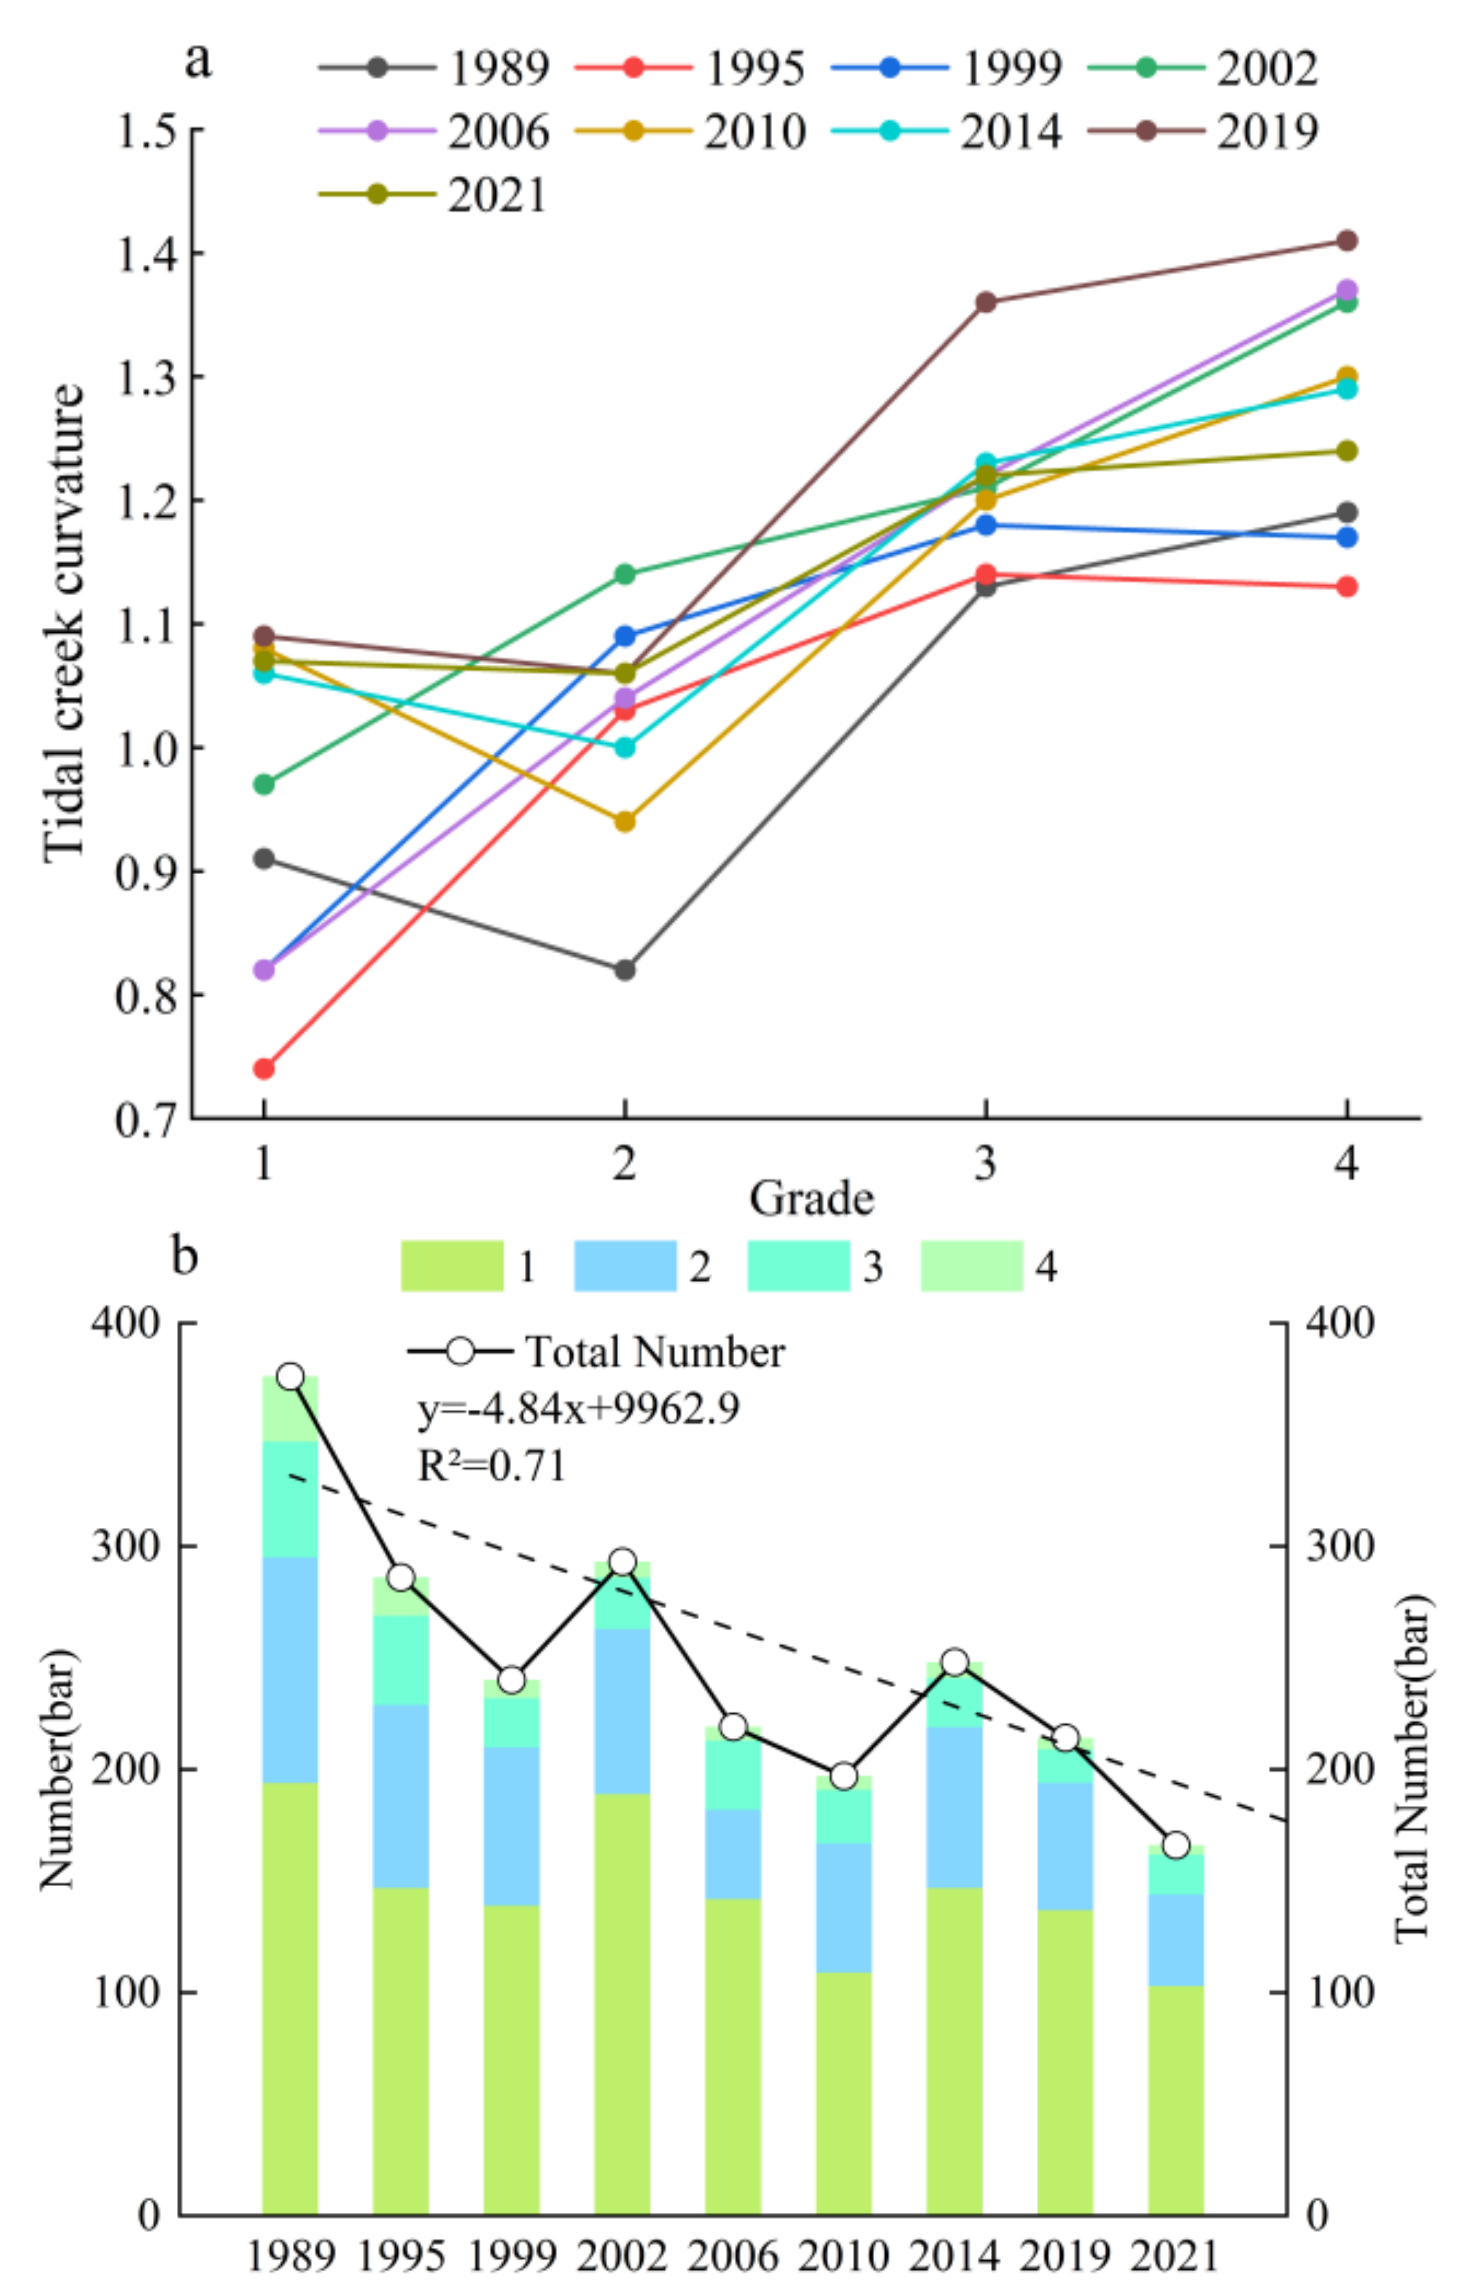
3.3. Grade and Number of Tidal Creeks

A numerical analysis of the length, curvature, and quantity of the tidal creeks at all levels showed that the total number of tidal creeks on the Yellow Sea muddy coast decreased from 1989 to 2021 (Figure 5 and Figure 6). The total number of tidal creeks decreased from 376 to 166, a reduction of more than 55% (Figure 6b). The number of tidal creeks generally showed a decreasing trend, while the number of tidal creeks and the number of grade 1 tidal creeks in individual years increased. With the increase in tidal creek grade, the average length increased significantly, and the curvature of the tidal creeks increased (Figure 5 and Figure 6a). In addition, by fitting the level of tidal creeks and the corresponding number of tidal creeks, we found that there was an exponential relationship, and the correlation coefficient was greater than 0.95, satisfying Horton’s law of the number of rivers (Marani et al., 2002). Horton’s law shows that there is a geometric relationship between the level of rivers and the number of rivers, the average river length, the average basin area, and the average river slope.

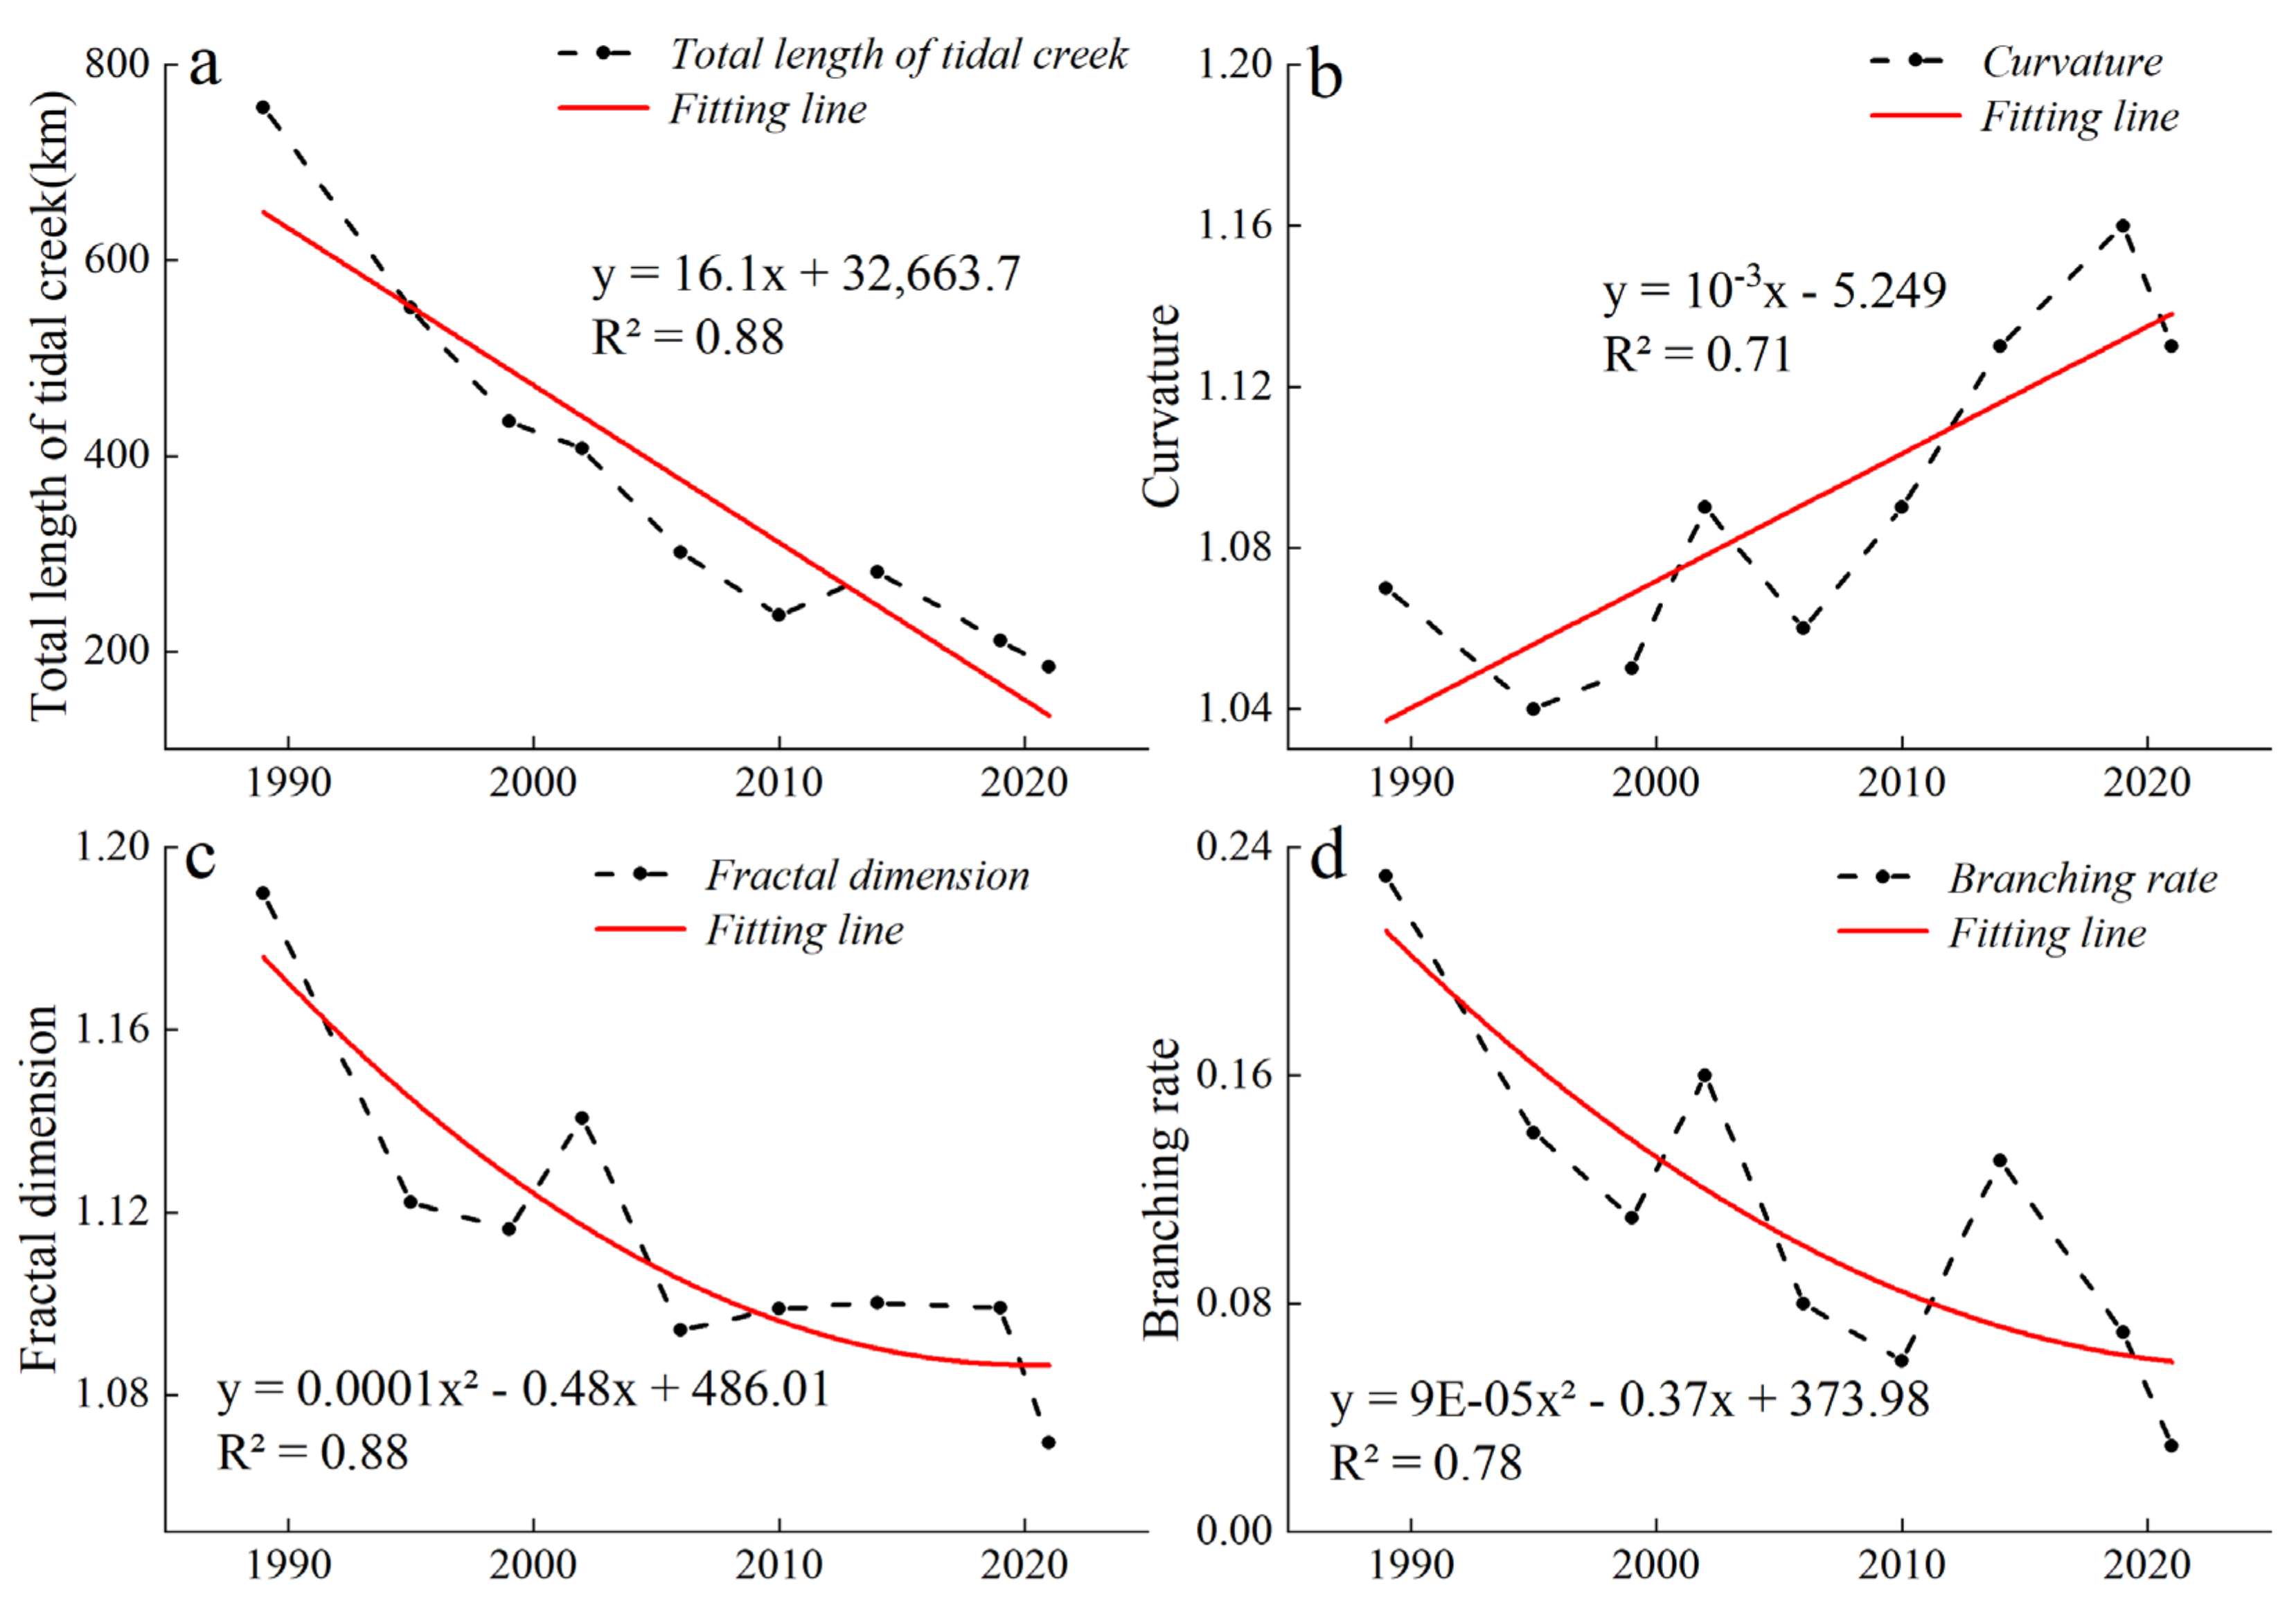
3.4. Morphological Characteristic Index of the Studied Tidal Creeks

The total length, curvature, fractal dimension, and branching rate of the tidal creek network on the Yellow Sea muddy coast were selected for assessing the morphological characteristics of the tidal creeks. Figure 7 shows that the total length and curvature of the tidal creeks changed linearly, while their branching rate and fractal dimension changed nonlinearly. The total length of the tidal creeks decreased at a rate of 16.1 km per year (Figure 7a). The tidal creek curvature showed an upward trend and increased at a rate of 3 × 10⁻³ per year (Figure 7b). The fractal dimension value decreased over time, while the nonlinear fitting coefficient (R2) was found to be 0.88, indicating that the tributaries of the tidal creeks decreased over time, and in the meantime, the complexity of the tidal creek network also decreased (Figure 7c). The nonlinear fitting coefficient (R2) of the branching rate was 0.78 and also decreased with time (Figure 7d). In summary, the tidal channel network system of the Yellow Sea muddy coast gradually subsided in the past 25 years.

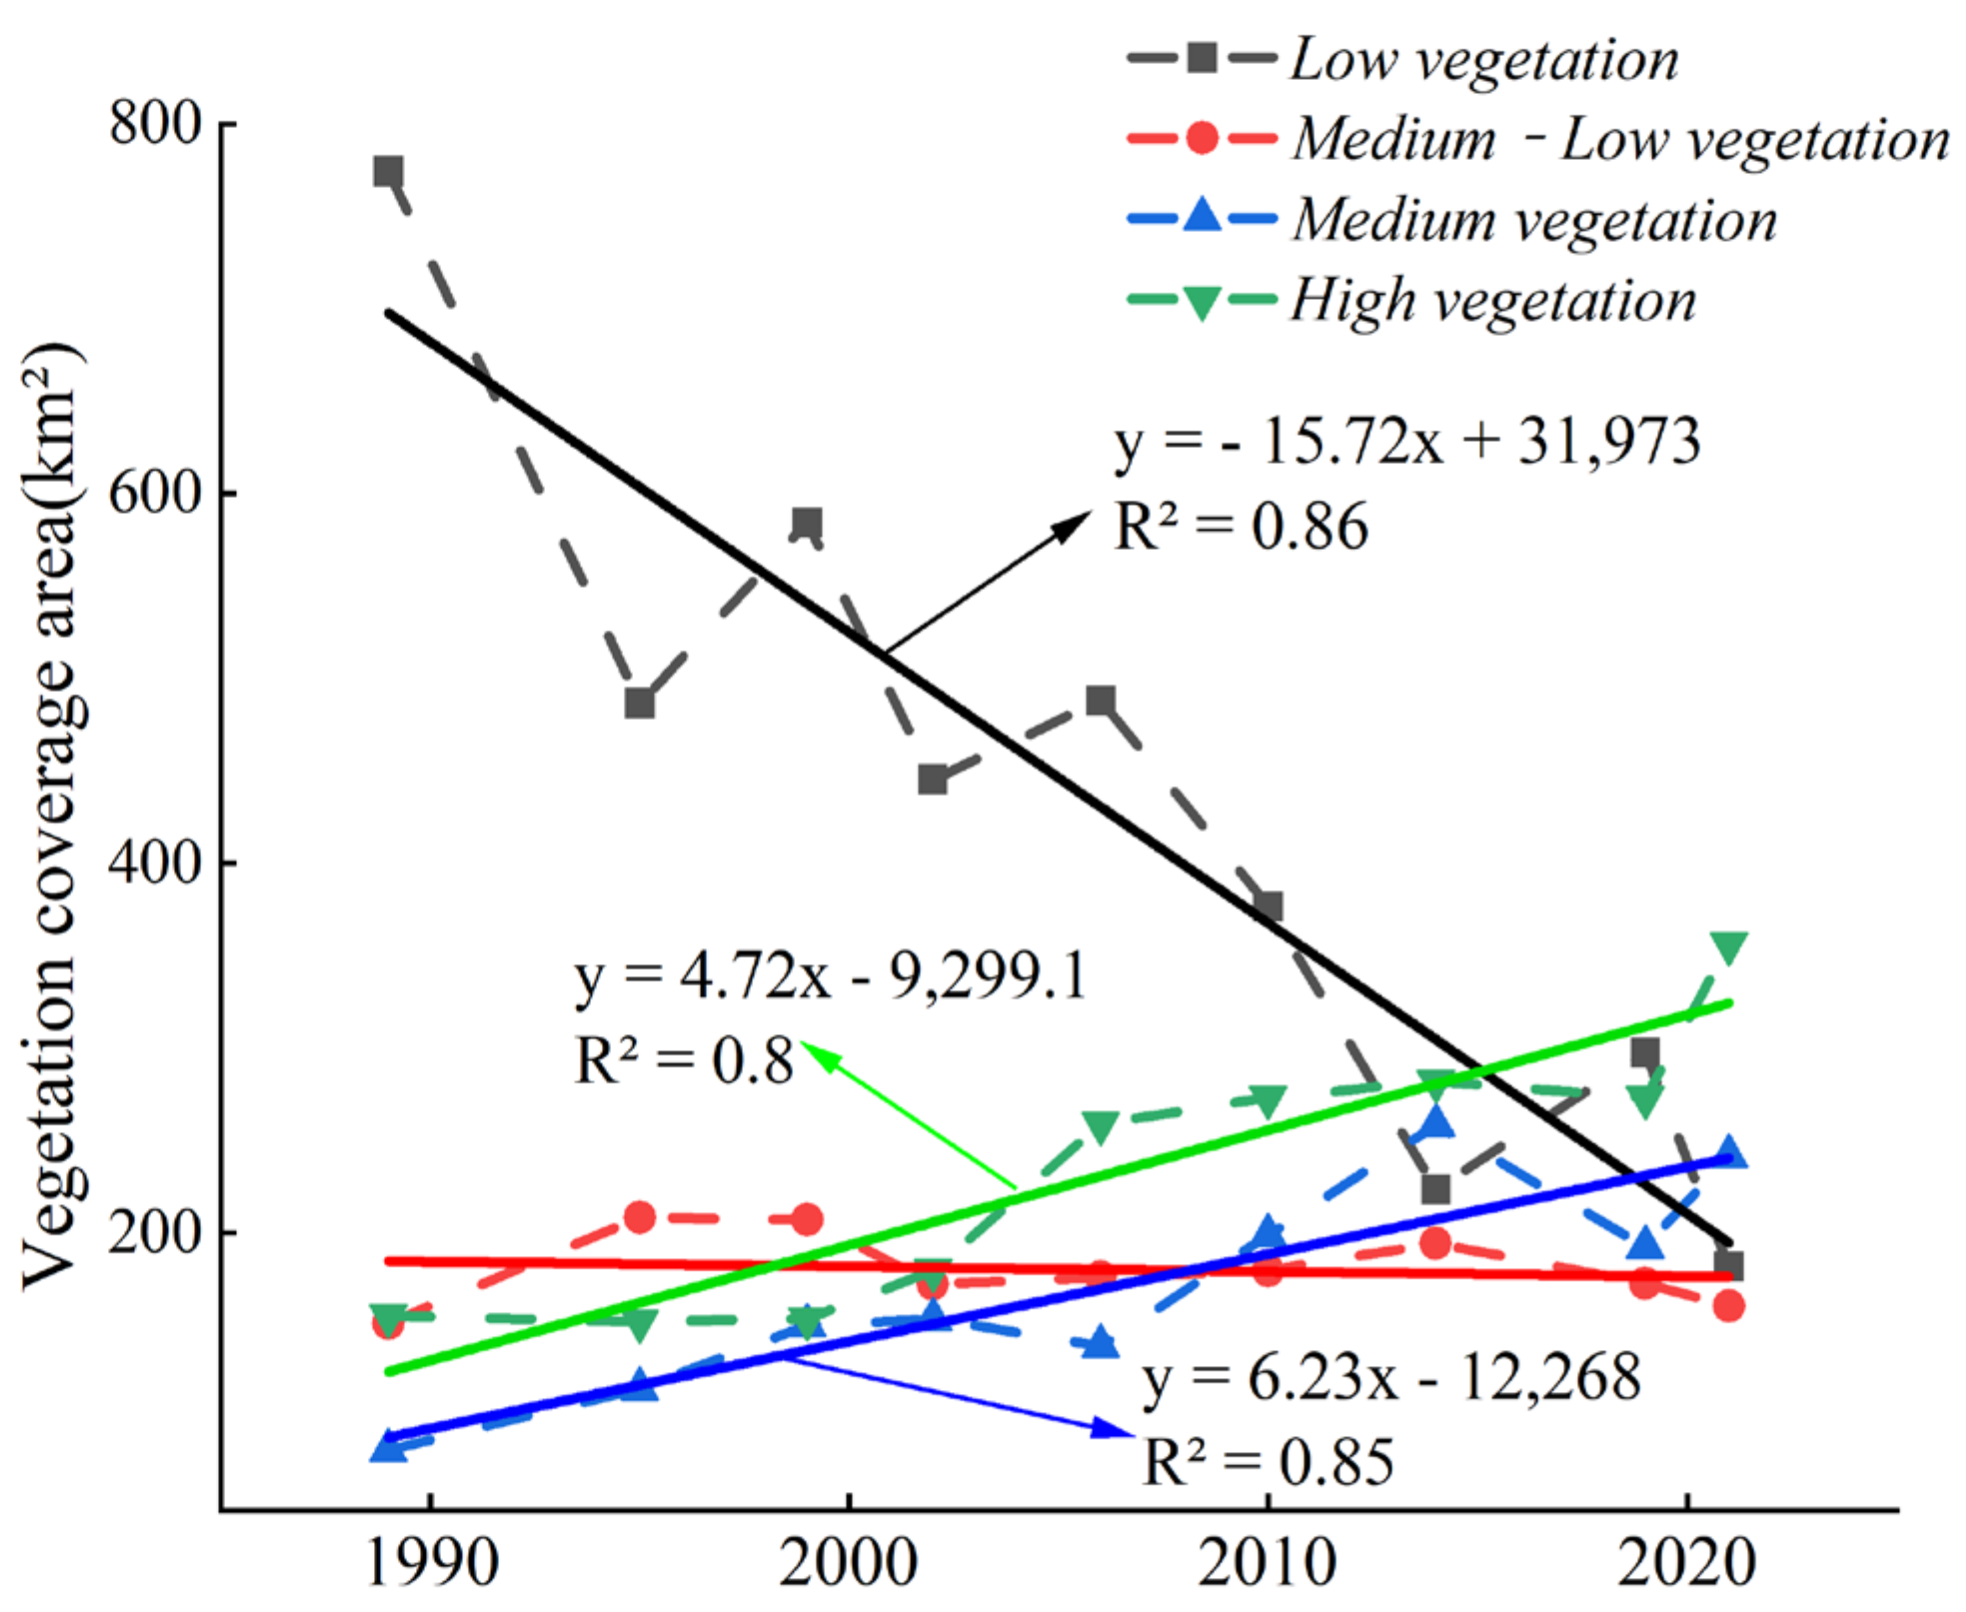
3.5. Vegetation Coverage Characteristics

The vegetation coverage on the Yellow Sea muddy coast calculated by the Sentinel-2 data from 2019 was used as a comparison to evaluate the accuracy of the extracted vegetation coverage. The R2 was 0.85, indicating that the extracted vegetation coverage was accurate. The area of medium and high vegetation coverage appeared to be expanding from high tidal flat areas to the low tidal flat areas, while the area with low vegetation coverage appeared to be gradually decreasing (Figure 8).
Figure 9 shows that since 1989, the low-vegetation-coverage area decreased at a rate of 15.72 km2 per year, and the area ratio decreased from 66.57% in 1989 to 19.35% in 2021. The areas of medium-vegetation and high-vegetation coverage increased by 4.72 km2 and 6.23 km2 every year, respectively. The area of medium-vegetation coverage increased from 7.11% in 1989 to 25.73% in 2021, and the area of high-vegetation coverage increased from 13.33% in 1989 to 37.88% in 2021 (Figure 9). The transfer matrix (Table 3) of the wetland vegetation coverage areas at all levels showed that the transfer rates of the low-vegetation- and medium–low-vegetation-coverage areas were relatively high, being 83.65% and 83.6%, respectively. The transfer rate of the no-vegetation-coverage area was, however, the lowest (8.08%). A large part of the low-vegetation-coverage area was converted into no-vegetation-coverage area (388.68 km2), resulting in only 31.48% of low-vegetation-coverage area by 2021 (Table 3). The high-vegetation-coverage area remained almost unaltered (167.97 km2), reaching 67.83% by 2021 (Table 3). From the perspective of the transfer contribution rate, the low-vegetation-coverage area had the largest transfer contribution rate of 69.85%, while the no-vegetation-coverage area had the smallest transfer contribution rate of 4.3%. From the perspective of the transfer of vegetation coverage areas at all levels of wetland, the transfer rate of the medium-vegetation-coverage area was the highest, i.e., 91.93%, and the transfer rate of the low-vegetation-coverage area was the lowest, i.e., 30.62% (Table 3). The transfer-in contribution rate of the no-vegetation-coverage area was the highest, i.e., 28.14%, and the transfer-in contribution rate of the low-vegetation-coverage area was the lowest, i.e., 6.02%. Areas with a high vegetation coverage turnover rate did not necessarily have a high turnover contribution rate. However, in vegetation coverage areas with a high transfer-in rate, the turnover rate was not necessarily high (Table 3). The increase in medium- and high-vegetation-coverage areas was mainly due to the increase in S. alterniflora areas and the transformation of the tidal flats into farmland. According to the vegetation classification results of the Yellow Sea muddy coast (Figure 4) and the acquired UAV multispectral images, the average vegetation coverage corresponding to S. alterniflora, P. australis, and S. salsa was calculated. The average vegetation coverage of S. alterniflora was 0.86, that of P. australis was 0.64, and that of S. salsa was 0.36. It can be seen that most of the Spartina alterniflora areas were characterized by high-vegetation coverage, the P. australis areas by medium–low and medium vegetation coverage, and the S. salsa areas by low- and medium–low vegetation coverage (Figure 4 and Figure 8).

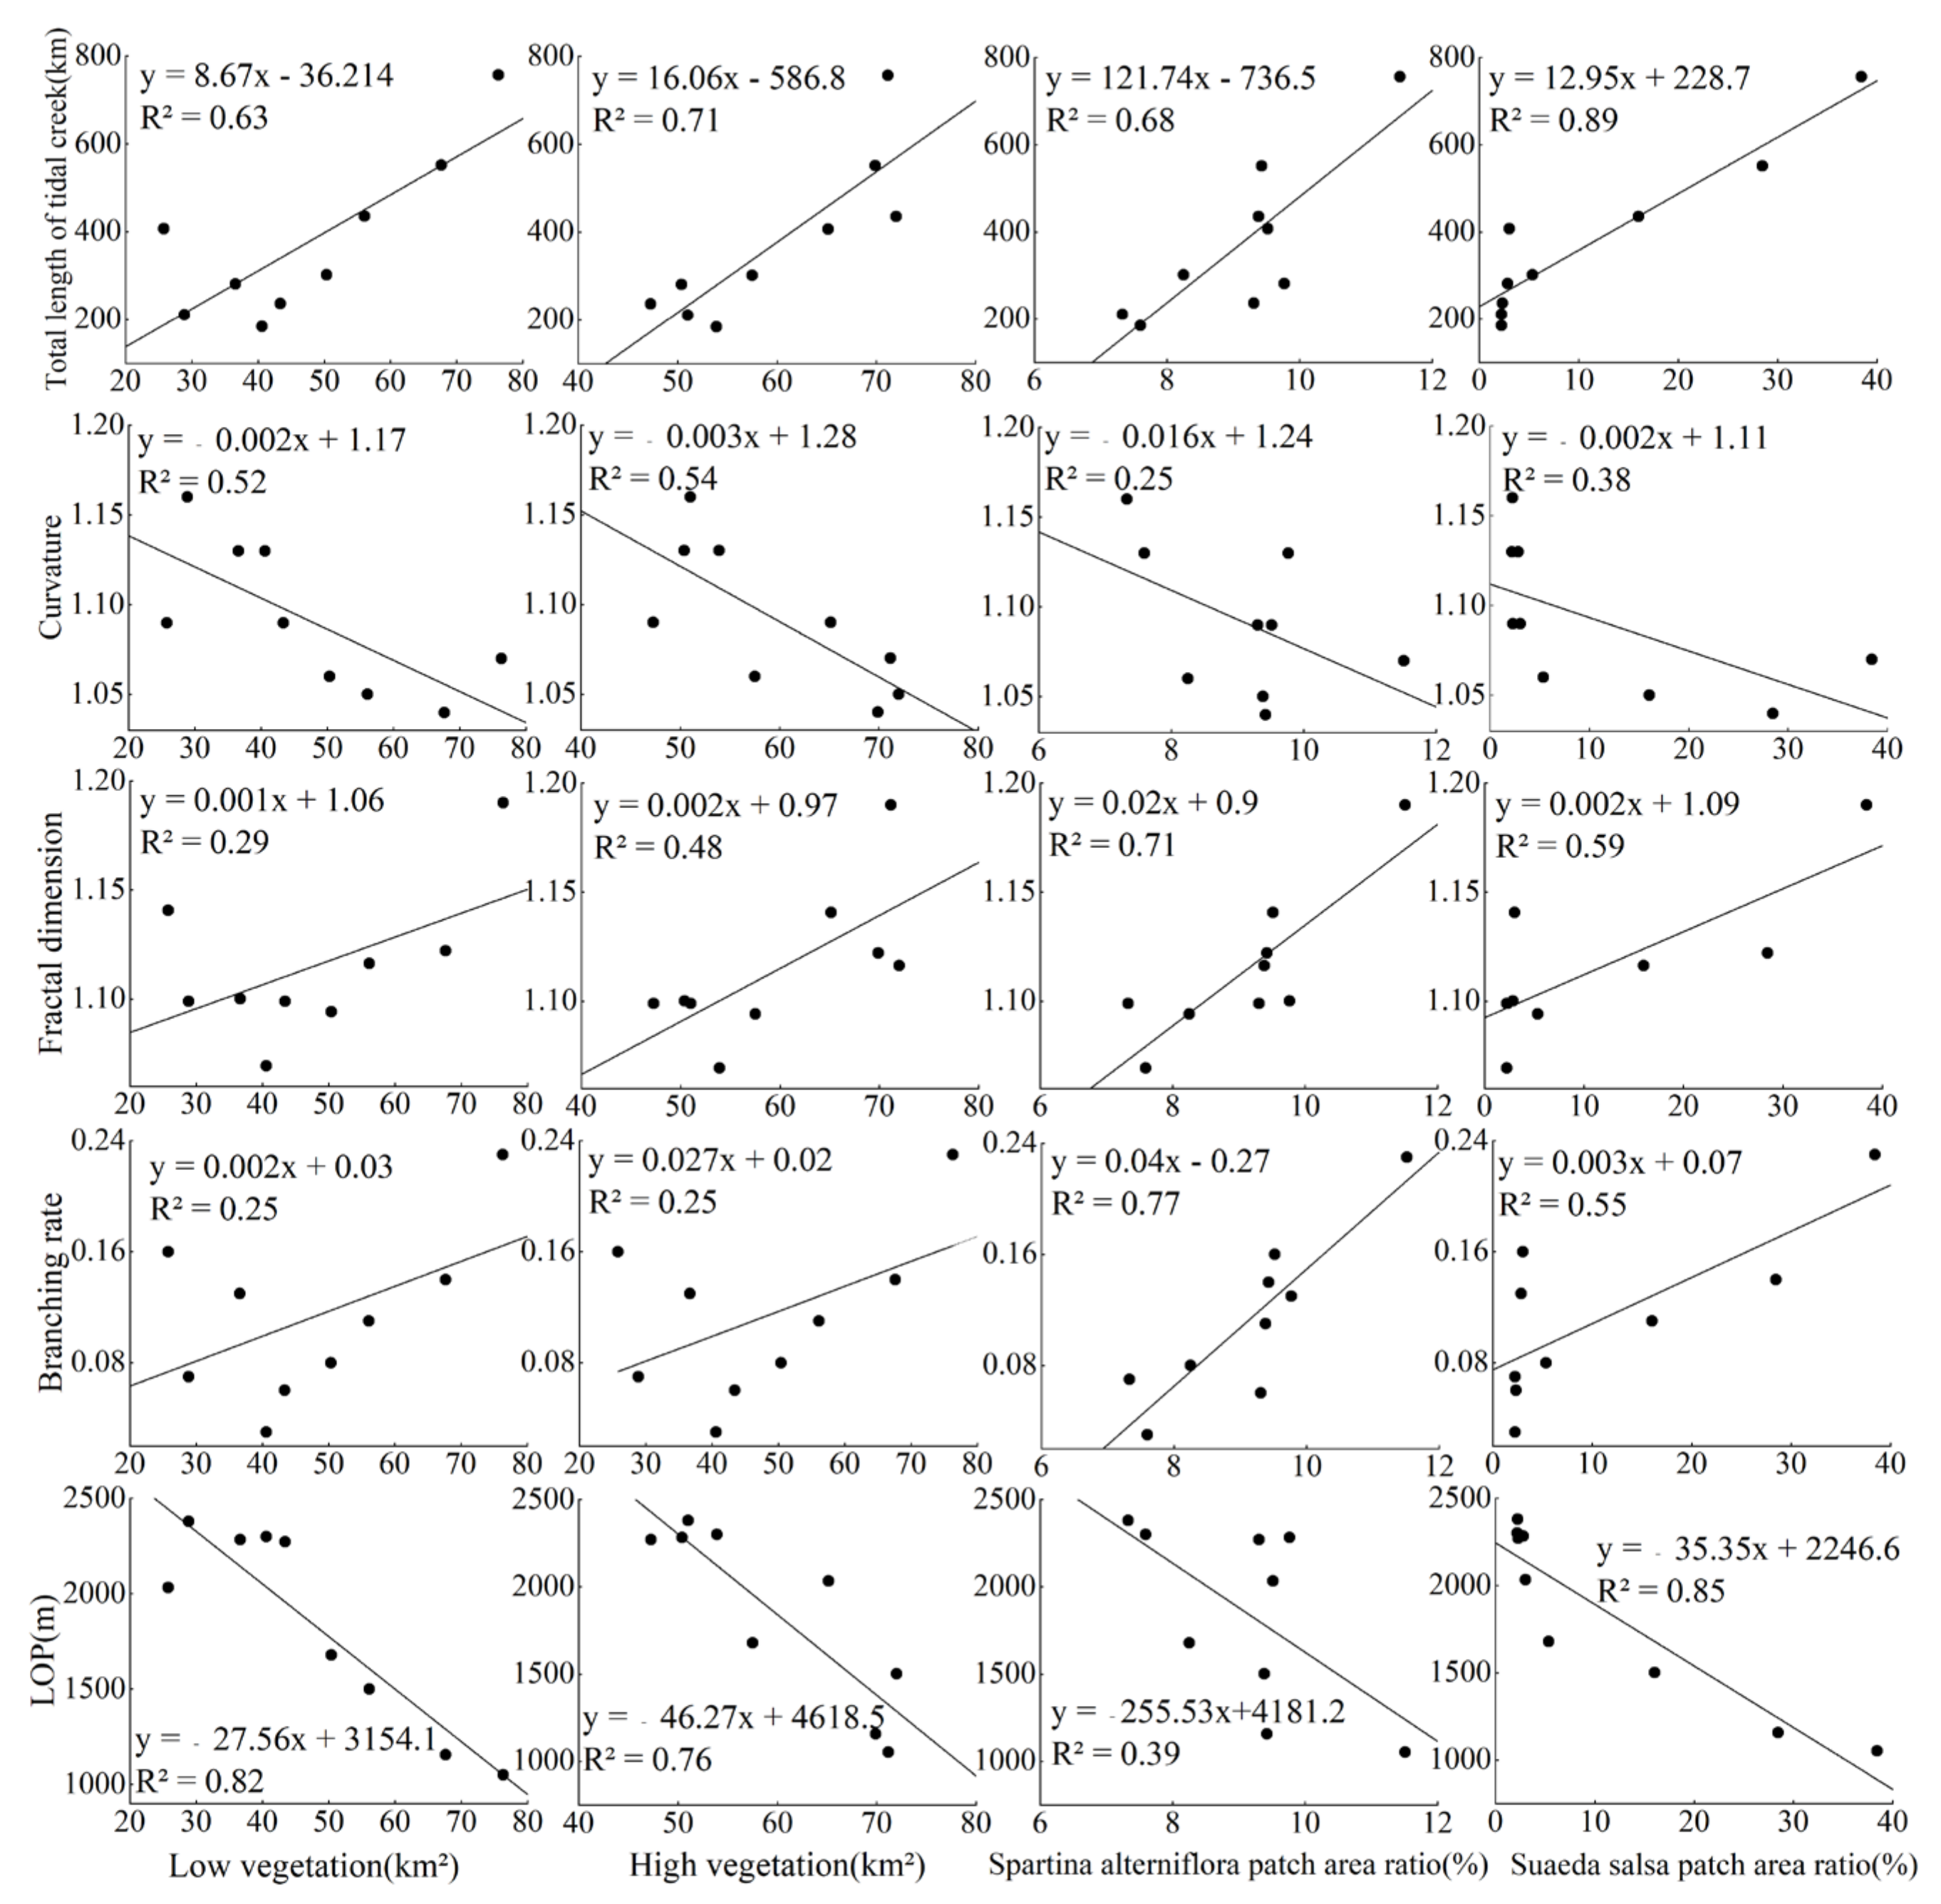
3.6. The Interaction between Tidal Creek Network and Vegetation Pattern

High vegetation coverage areas such as farmland in a reclamation area usually have a little influence on tidal creeks. To reduce the influence of high vegetation coverage areas such as farmland in the reclamation area in our analysis, we calculated the vegetation coverage after the reclamation area was removed. Figure 10 shows the Pearson correlation coefficient between the morphological characteristics of the tidal creeks and indices such as the vegetation coverage after removing the reclamation area. We found a strong relationship between the morphological index of tidal creek network and LOP. The absolute value of the correlation coefficient was mostly above 0.6. The absolute value of the correlation coefficient between the total length of the tidal creeks and LOP, the branching rate of the tidal creeks, the total length of the tidal creek, and the fractal dimension of the tidal creek was over 0.9. The relationship between different levels of vegetation coverage and the tidal creek morphological characteristic index was different. There was a strong relationship between low- and high-vegetation-coverage areas and the tidal creek morphological characteristic index, as the absolute value of the correlation coefficient was mostly above 0.6 (Figure 10). The relationship between the medium–low- and medium-vegetation-coverage areas and the morphological index of the tidal creeks was weak, as the absolute value of the correlation coefficient was low. There was a significant negative correlation between LOP and the patch area ratio of S. salsa, and the absolute value of the correlation coefficient was higher than 0.9, when the patch area ratio of S. salsa was large. The smaller the LOP value, the higher the drainage efficiency of the tidal creek. LOP was found to be significantly positively correlated with the reclamation area, with an absolute value of the correlation coefficient above 0.9. When the reclamation area increased, the drainage efficiency of the tidal creek network decreased (Figure 10). The patch area ratio of Phragmites australis showed a weak correlation with the tidal creek morphological characteristic index (Figure 10).
The factors influencing the drainage efficiency of the tidal creek network were analyzed by VIP analysis. The length of the three-grade tidal creek had a greater influence on the average flow length, and the VIP values were 1.26. The bifurcation ratio had the least influence on the average flow length, and the VIP value was 0.92. The low-vegetation-coverage area and patch area ratio of S. salsa had the greatest influence on the average flow length, and the VIP value was 1.19. The medium–low-vegetation-coverage area had the least influence on the average flow length of the channel, and the VIP value was 0.33. The VIP values of the areas, from the low-vegetation-coverage areas (IV) to the high-vegetation-coverage ones (I) were 1.19, 0.33, 0.59, and 1.13 respectively. It was found that a reasonable distribution ratio for low vegetation, medium–low vegetation, medium vegetation, and high vegetation in this area corresponded to 36.73%, 10.19%, 18.21%, and 34.87%, respectively, when the length of the flow was constant. These results can provide a scientific basis for wetland ecological restoration.
Figure 11 suggests that the low-vegetation-coverage area and the high-vegetation-coverage area were negatively correlated with LOP, with R2 values of 0.78 and 0.65, respectively. With the increase in the low-vegetation-coverage area and the high-vegetation-coverage area, LOP decreased by 27.56 m and 46.27 m, respectively, while in the meantime, the drainage efficiency of the tidal creeks increased (Figure 11). There was no correlation between the curvature of the tidal creeks and the vegetation index; so the fitting effect was relatively poor, with R2 below 0.6 (Figure 11). The patch area ratio of S. alterniflora was weakly correlated with LOP and positively correlated with the fractal dimension and branching rate of the tidal creeks (Figure 11). The patch area ratio of S. salsa was most significantly correlated with the total length of the tidal creeks and LOP, with an R2 value of above 0.8. With the increase in the patch area ratio of S. salsa, the total length of the tidal creeks increased by 12.95 km, and LOP decreased by 35.35 m, and consequently, the drainage efficiency of the tidal creeks increased (Figure 11).

4. Discussion

4.1. Factors Influencing Tidal Creeks and Vegetation

Our results indicated that the decreased total length and number of tidal creeks and the increased total number of tidal creeks and of one-grade tidal creeks in individual years since 1989 (Figure 6 and Figure 7) corresponded to those reported in one recent study. Since the socio-economic development of the 1980s, a large number of natural wetlands on the Yellow Sea muddy coast have been reclaimed. Yet, wetland reclamation from 1989 to 1995 was relatively limited and had little influence on the tidal creeks. From 1995 to 2020, however, the area was reclaimed significantly to meet human needs, for example, for the construction of dams and intertidal zones. The establishment of mariculture and agriculture in the newly reclaimed tidal flats disrupted the flow of seawater in the tidal creeks, consequently weakening the flow force in the tidal creeks [8].
Rising sea levels and increased extreme weather have been observed due to climate change. Over the past 40 years, the eroded section of the Jiangsu coastal area gradually moved southward from the abandoned coastal area of the Yellow River delta, causing the coastline to retreat further inland and some tidal creeks to disappear [41]. The continuous tidal hydrodynamic activities enhanced erosion, leading to the formation of new tidal creeks [42]. However, due to the disruption in the flow and the hydrological connectivity at intertidal zones, the exchange of water and sediment between the tidal flats and the sea decreased, the development of tidal creeks in the inland became hindered, and the number of new tidal creeks became smaller, followed by a further decrease in the length of the tidal creeks [43]. These conditions led to the formation of biological dams due to the expansion of S. alterniflora in low tidal flats, limited the extension of tidal creeks in the land, and reduced the area for the development of tidal creeks (Figure 12).
We found that since 1989, the curvature of the tidal creeks has increased over the years, suggesting that the tidal curvature may be related to the hydrodynamic environment of the Yancheng coast and the size of the tidal range may have affected the degree of bending of the tidal creeks [44]. It was argued that when the tidal range becomes larger, the force on the tidal creeks during the development process becomes stronger, the development of the tidal creeks becomes flat, and the curvature becomes smaller [37]. At the same time, when the tide level is relatively high, the smaller tidal creeks at the edge of a mudflat become submerged, influencing the number and length of the tidal creeks in the mudflat.
The decreasing and increasing trends of low-vegetation-coverage and medium and high-vegetation-coverage areas from 1989 to 2021 suggested that the transfer rate of low- and medium–low-vegetation-coverage areas was the largest, while that of no-vegetation coverage areas was the smallest. Similarly, the results suggested that the medium-vegetation-coverage areas had the highest transfer rate, while the low-vegetation-coverage areas had the lowest transfer rate. Mostly, the thick S. alterniflora was found in high-vegetation-coverage areas, P. australis was found in medium–low and medium-vegetation-coverage areas, and S. salsa was found in low and medium–low vegetation coverage areas (Figure 8).
Due to its invasive characteristics, S. alterniflora replaced S. salsa in low-vegetation-coverage areas (Figure 12). Following the invasion of S. alterniflora, not only S. salsa disappeared, but a significant increase in the contents of SOC and TN also occurred, consequently reducing the abundance of sulfur oxidation functional genes in the sediment due to the increase in soil sulfide. The of elevated soil hydrogen sulfide level became lethal for the plants, usually killing S. salsa more than S. alterniflora [45]. At the same time, our study showed that the growth of S. salsa was significantly affected by the soil salinity, and the most suitable soil salinity was 0.3–0.5%. S. salsa was green when the soil salt content was 0.4–1% and red when the soil salt content was 1–2% and died when the soil salt content was higher than 2% [46].
Sea level rise and coastal erosion lead to vegetation loss in low tidal flat areas [47]. The construction of mariculture and agricultural land on the newly reclaimed tidal mud flats would further reduce the low-vegetation-coverage area. The agricultural land would have a high vegetation coverage, and the medium- and high-vegetation-coverage areas would decrease on the Yellow Sea muddy coast [8]. With the return of farmland to wet ecological restoration and other projects, as well as with the improvement of social environmental protection awareness, tidal flat reclamation, beach aquaculture, salt production and other industries will be reduced, low-vegetation-coverage areas will be gradually restored, and the vegetation coverage will increase in the Yellow Sea muddy coast [48].

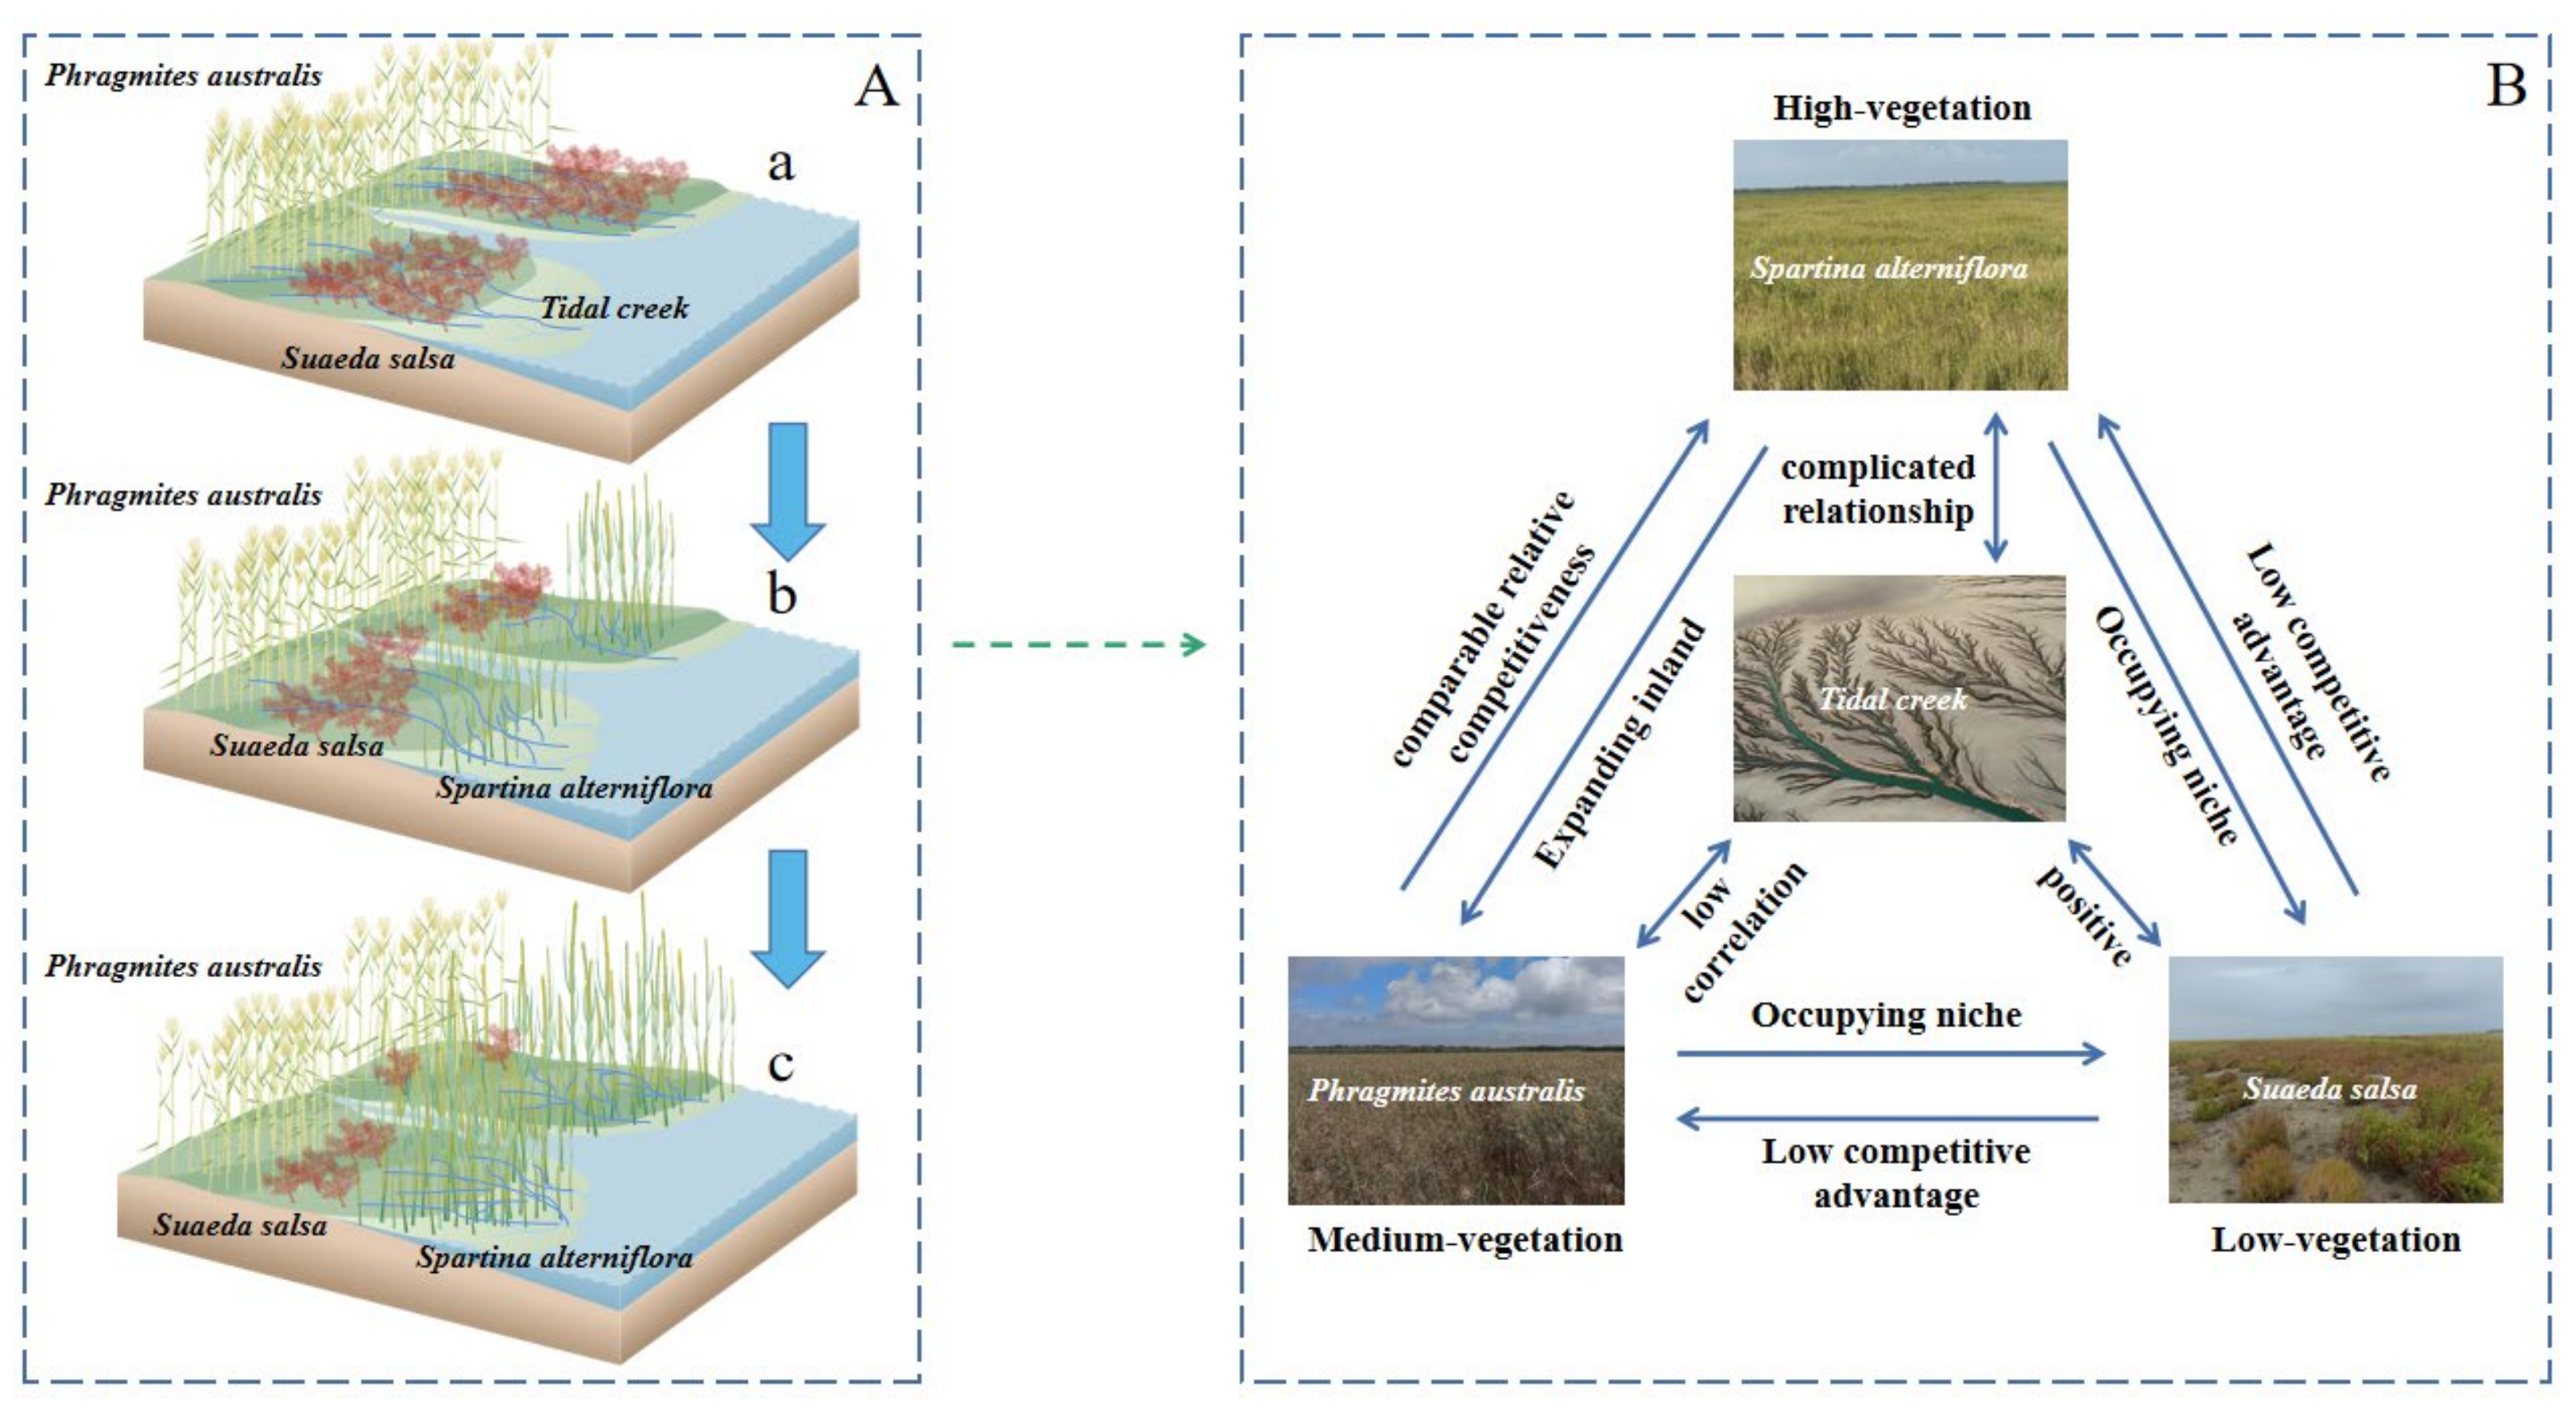
4.2. Relationship between Tidal Creek Evolution and Vegetation Variation

In the Abstract section, it was stated that coastal wetland ecosystems worldwide face serious challenges due to rapid economic development, climate change, and sea level rise. Therefore, it is essential to analyze which parts of the examined area are vulnerable and which are resistant to these ecosystem disturbances. This broader context is crucial for understanding the significance of our findings. The total length of the tidal creeks in the low-vegetation-coverage area was negatively correlated with LOP. The area ratio of S. salsa patches was significantly positively correlated with the total length of the tidal creeks and negatively correlated with LOP (Figure 10). With the increase in the area ratio of S. salsa patches, the total length of the tidal creeks increased by 12.95 km, LOP decreased by 35.35 km, and the drainage efficiency of the tidal creeks increased (Figure 11). The positive and negative correlations of the total length of the tidal creeks in the low-vegetation-coverage area with LOP suggests that S. salsa preferred both high-salt and intermittently flooded areas and distributed on both sides of the tidal creeks. Due to its unique physiological characteristics that allow S. salsa to tolerate salty and nutrient-rich environments, S. salsa in Yancheng wetland was found to be distributed in low-vegetation-coverage areas. The length of the tidal creeks in the S. salsa area increased, while the average length of the channel flow decreased, the drainage efficiency of the tidal creeks increased, and the vegetation coverage decreased, suggesting no impact by S. salsa on the coastal ecosystem (Figure 12).
In the early stage of its introduction on the Yellow Sea muddy coast, S. alterniflora had little effect on the tidal creeks (Figure 12). With its expansion over time, its growth area gradually shifted from high tidal flats to low tidal flats, preventing the growth of the endemic plant community (Figure 12) [49]. The positive correlation of the patch area with the total length of the tidal creeks (Figure 11) indicated that the length of the tidal creeks increased with the increase in the proportion of S. alterniflora area in the overall landscape. Sophisticatedly developed roots and dense S. alterniflora plants limited the development of tidal creeks in S. salsa areas (Figure 12). The developmental direction of the tidal creeks in Spartina alterniflora areas was found to be from east–west to north–south, where the small tidal creeks increased rapidly and the number of tidal creeks also increased, positively affecting the drainage efficiency of the tidal creeks. Similar conditions were reported in the abandoned Yellow River delta where the effect of S. alterniflora invasion not only promoted the development of tidal creeks, but also fragmented the plant community in the tidal creek system (Figure 12) [50].
In our study area, we found that the coastline continuously advanced to the sea, and the frequency and time of tidal inundations in the intertidal zones changed, resulting in a sedimentary environment and in the formation of some relatively new short tidal creeks in the S. alterniflora area [15]. We noticed that the development of tidal creeks and the expansion of S. alterniflora greatly interacted with each other, as coastal wetlands communicate with the outside sea world through tidal creeks, which are the main dispersal route for the spread of S. alterniflora seeds [51]. We found that the reclamation area on the Yellow Sea muddy coast was significantly negatively correlated with the length of the tidal creeks and significantly positively correlated with the curvature of the tidal creeks and the average flow length of the tidal creeks (Figure 10). This means that with the increase in reclamation activities, agricultural planting and mariculture will be extensively carried out in the new reclamation area. We noticed that a large number of tidal creeks in the study area are today disrupted by various forms of human activities; some tidal creeks have already disappeared, and their shapes have changed leading to the formation of short-curved tidal creeks. As a result of such modifications, the curvature of the tidal creek and the average length of the channel flow have both increased, and the drainage efficiency of the tidal creek has decreased. These changes in the long run are not beneficial for healthy coastal ecosystems.

5. Conclusions

Coastal wetland ecosystems around the world are facing serious challenges due to rapid economic development, climate change, and sea level rise. A quantitative analysis of the long-term (1989 to 2021) Landsat, SPOT-4, and Sentinel-2 images data to determine the relationship between tidal creeks’ morphological characteristics and vegetation coverage suggested that tidal creeks are disappearing in the silting muddy flats of the Yellow Sea. Our study showed that the application of U-Net can achieve an effective classification of land use. The tidal creeks on the examined silting muddy flats have been gradually declining due to factors such as tidal flat reclamation. The number of tidal creeks generally showed a decreasing trend, and the total length of the tidal creeks appeared to decrease at a rate of 16.1 km per year. The length of three-grade tidal creeks had a greater influence on the average flow length, and the VIP values were 1.26. The areas of low vegetation and high vegetation coverage had a great influence on the morphological characteristics of the tidal creeks. The patch area ratio of S. salsa was significantly negatively correlated with LOP, and the tidal flat reclamation area was significantly positively correlated with LOP. With the increase in the patch area ratio of S. salsa, the total length of the tidal creek increased by 12.95 km, LOP decreased by 35.35 m, and consequently, the drainage efficiency of the tidal creeks increased. This study provides a scientific basis for ecological restoration based on the relationship between tidal creeks and wetland vegetation. In the future, it is necessary to study the relationship between tidal creeks and vegetation in different seasons and to pay attention to the influence of more factors such as physical factors and climate change on the tidal creek network.

Author Contributions

All authors contributed to the study conception and design. Y.W.: theorization, investigation, methodology, software, original draft, writing, reviewing, and editing. G.Z. and W.D.: conceptualization, writing, reviewing, and editing. C.Z. and G.R.K.: Writing, reviewing, and editing. D.Z.: data curation. All authors have read and agreed to the published version of the manuscript.

Funding

The authors of this study would like to express their appreciation to the National Natural Science Foundation (42130405), the National Natural Science Foundation of China (42371060, 42301478), and the Innovative and Entrepreneurial Talent Program of Jiangsu Province (R2020SC04) for sponsorship.

Data Availability Statement

The data presented in this study are available on request from the corresponding author.

Acknowledgments

We would like to express our sincere gratitude to the editor and anonymous referees for their insightful and constructive comments.

Conflicts of Interest

The authors declare no conflict of interest.

References

  1. Vandenbruwaene, W.; Meire, P.; Temmerman, S. Formation and evolution of a tidal channel network within a constructed tidal marsh. Geomorphology 2012, 151–152, 114–125. [Google Scholar] [CrossRef]
  2. Reed, D.; van Wesenbeeck, B.; Herman, P.M.J.; Meselhe, E. Tidal flat-wetland systemsas flood defenses: Understanding biogeomorphic controls. Estuar. Coast. Shelf Sci. 2018, 213, 269–282. [Google Scholar] [CrossRef]
  3. Wang, F.M.; Lu, X.L.; Sanders, C.J.; Tang, J.W. Tidal wetland resilience to sea level rise increases their carbon sequestration capacity in United States. Nat. Commun. 2019, 10, 5733. [Google Scholar] [CrossRef] [PubMed]
  4. Zhou, Y. Study on changes and restoration of Yancheng coastal wetland based on hydro-logy and geomorphology differentiation. Nanjing Norm. Univ. 2021. [Google Scholar] [CrossRef]
  5. Williams, P.B.; Orr, M.K.; Garrity, N.J. Hydraulic geometry: A geomorphic design tool for tidal marsh channel evolution in wetland restoration projects. Restor. Ecol. 2010, 10, 577–590. [Google Scholar] [CrossRef]
  6. Zhang, H.; Wang, J.; Liu, Y.; Han, S.; Zhang, Y. Effects of human activities and the expansion of Spartina alternifora on the evolution of habitat quality of the coastal wet-land. Resour. Environ. Yangtze Basin 2021, 30, 1153–1163. [Google Scholar]
  7. Luo, M.; Wang, Q.; Qiu, D.D.; Shi, W.; Ning, Z.H.; Cai, Y.Z.; Song, Z.F.; Cui, B.S. Hydrolo-gical connectivity characteristics and ecological effects of a typical tidal channel syste-m in the Yellow River Delta. J. Beijing Norm. Univ. 2018, 54, 17–24. [Google Scholar] [CrossRef]
  8. Shi, H.; Shen, Y.; Kang, M. Rapid response of tidal creek network patterns to the reclama-tion on the central Jiangsu coast. Acta Oceanol. Sin. 2016, 38, 106–115. [Google Scholar] [CrossRef]
  9. Kuenzer, C.; Bluemel, A.; Gebhardt, S.; Quoc, T.V.; Dech, S. Remote Sensing of Mangrove Ecosystems: A Review. Remote Sens. 2011, 3, 878–928. [Google Scholar] [CrossRef]
  10. Gil, A.; Yu, Q.; Lobo, A.; Lourenço, P.C.; Silva, L.; Calado, H. Assessing the effectiveness of high resolution satellite imagery for vegetation mapping in small islands protected areas. J. Coast. Res. 2011, 64, 1663–1667. [Google Scholar]
  11. Park, C.; Yu, J.; Kim, J.; Yang, D.Y. Monitoring variation of tidal channels associated with Shihwa reclamation project using remote sensing approaches. Econ. Environ. Geol. 2019, 52, 299–312. [Google Scholar]
  12. Zhou, S.W.; Wang, C.; Li, Y.F.; Huang, W.C.; Jia, Y.; Wang, Y.Q.; Xu, W.; Qiu, C. Study on spatiotemporal variation and hydrological connectivity of tidal creek evolution inYan Cheng coastal wetlands. Environ. Sci. Pollut. Res. 2022, 30, 37143–37156. [Google Scholar] [CrossRef] [PubMed]
  13. Chen, X.; Qin, M.E.; Jia, L.Y.; Zhou, Y.H.; Guo, K.Y.; Jiang, B.; Zhang, M.L. Morphological characteristics and hydrological connectivity evaluation of tidal creeks in tidal flats of Liao River Estuary. J. Dalian Ocean. Univ. 2022, 312, 1707. [Google Scholar]
  14. Kearney, W.S.; Fagherazzi, S. Salt marsh vegetation promotes efficient tidal channel networks. Nat. Commun. 2016, 7, 12287. [Google Scholar] [CrossRef] [PubMed]
  15. Hou, M.H.; Liu, H.Y.; Zhang, H.B. Affection of tidal creek system on the expansion of the invasive Spartina in the coastal wetland of Yancheng. Acta Ecol. Sin. 2014, 34, 400–409. [Google Scholar] [CrossRef]
  16. Liu, L.Y.; Qu, F.Z.; Li, Y.Z.; Yu, J.B.; Yang, J.S.; An, C.B. Correlation between creek tidal distribution and vegetation coverage in the Yellow River Delta coastal wetland. Chin. J. Ecol. 2020, 39, 1830–1837. [Google Scholar] [CrossRef]
  17. Yu, X.J.; Xue, Z.S.; Zhang, Z.S.; Song, X.L.; Zhang, H.R. Impacts of tidal channels on typical landscapes of wetland in the Yellow River Delta. J. Nat. Resour. 2019, 34, 2504–2515. [Google Scholar] [CrossRef]
  18. Huang, Y.T.; Liu, Z.; Zheng, G.H.; Zhao, C.Y. Identification of Spartina alterniflora habitat expansion in a Suaeda salsa dominated coastal wetlands. Ecol. Indic. 2022, 145, 109704. [Google Scholar] [CrossRef]
  19. Li, R.; Liu, W.; Yang, L.; Sun, S.; Hu, W.; Zhang, F.; Li, W. Deep U-Net: A Deep Fully Convolutional Network for Pixel-Level Sea-Land Segmentation. IEEE J. Sel. Top. Appl. Earth Obs. Remote Sens. 2018, 11, 3954–3962. [Google Scholar] [CrossRef]
  20. Bac, K.D.; Ha, M.N.; Anh, D.N.; Hai, P.T.T.; Linh, G.T.; Hai, P.H.; Nhung, N.T. Coastal Wetland Classification with Deep U-Net Convolutional Networks and Sentinel-2 Imagery: A Case Study at the Tien Yen Estuary of Vietnam. Remote Sens. 2020, 12, 3270. [Google Scholar]
  21. Wang, H.; Wu, D.; Zuo, X.L.; Wang, H. Automatic classification of coral reef remote sensi-ng images based on U-Net. Hydrogr. Surv. Charting 2023, 43, 63–67. [Google Scholar] [CrossRef]
  22. Zhang, X.; Li, X.; Yu, J.B.; Su, Y.Z.; Guan, B.; Zhou, J.; Ling, Y.; Ma, Y.Q. Distribution of tidal channels in different landscape types in coastal wetlands of the Yellow River estuary. Chin. J. Ecol. 2023, 1–13. Available online: https://kns.cnki.net/kcms/detail/21.1148.Q.20230406.1516.008.html (accessed on 1 September 2023).
  23. Zhang, H.; Zhen, Y.; Wu, F.; Li, Y.; Zhang, Y. Relationship between habitat quality change and the expansion of Spartina alternifora in the coastal area. Resour. Sci. 2020, 42, 1004–1014. [Google Scholar]
  24. Zhou, Z.; Chen, L.; Lin, W.B.; Luo, F.; Chen, X.; Zhang, C.K. Advances in biogeomorpholo-gy of tidal flat-saltmarsh systems. Adv. Water Sci. 2021, 32, 470–484. [Google Scholar] [CrossRef]
  25. Guo, Z.R.; Wang, G.; Wu, Y.Q.; Chen, H.; Li, Y.F.; Liu, H.Y. Impact of Human Activities on Yancheng Coastline and Coastal Wetlands. J. Ecol. Rural. Environ. 2021, 37, 295–304. [Google Scholar]
  26. Wang, D.W.; Shen, W.X.; Wang, H. Effect of intrusion of Spartina alterniflora along the ecosystem of eastern coast area in China. J. Biol. 2020, 37, 104–107. [Google Scholar]
  27. Gong, Z.; Mou, K.; Wang, Q.; Qiu, H.; Zhang, C.; Zhou, D. Parameterizing the Yellow River Delta tidal creek morphology using automated extraction from remote sensing images. Sci. Total Environ. 2021, 769, 144572. [Google Scholar] [CrossRef] [PubMed]
  28. Chirol, C.; Haigh, I.D.; Pontee, N.; Thompson, C.E.; Gallop, S.L. Parametrizing tidal creek morphology in mature saltmarshes using semiautomated extraction from lidar. Remote Sens. Environ. Interdiscip. J. 2018, 209, 291–311. [Google Scholar] [CrossRef]
  29. Olli, N.; Eija, H.; Sakari, T.; Nikko, V.; Teemu, H.; Juha, H.; Heikki, S.; Imai, N.N.; Tommaselli, A.M.G. Individual Tree Detection and Classification with UAV-Based Photogrammetric Point Clouds and Hyperspectral Imaging. Remote Sens. 2017, 9, 185. [Google Scholar] [CrossRef]
  30. Li, W.; Liu, H.; Wang, Y.; Li, Z.; Jia, Y.; Gui, G. Deep Learning-Based Classification Methods for Remote Sensing Images in Urban Built-Up Areas. IEEE Access 2019, 7, 36274–36284. [Google Scholar] [CrossRef]
  31. Bai, X.; He, B.Y.; Gao, T.; Li, X.; Sun, Q. Research on the temporal and spatial changes of vegetation coverage in Yulin based on GEE cloud platform. Hubei Agric. Sci. 2022, 61, 70. [Google Scholar] [CrossRef]
  32. Ren, W.Y.; Wang, C.; Liu, H.Y.; Li, Y.F.; Zhou, Y.; Xu, J.Y.; Chen, H. Diversity of vegetati-on coverage based on birds’ habitat demands in the coastal wetland of Yancheng, Jiangsu Province. Chin. J. Ecol. 2019, 38, 3870–3877. [Google Scholar] [CrossRef]
  33. Charles, J.; Jean, C. A numerical approach to the analysis and classification of channel network patterns. Water Resour. Res. 1994, 30, 161–174. [Google Scholar] [CrossRef]
  34. Wu, D.; Shen, Y.; Fang, R. A morphological analysis of tidal creek network patterns on the central Jiangsu coast. Acta Geogr. Sin. 2013, 68, 955–965. Available online: http://www.geog.com.cn/en/y2013/v68/i7/955 (accessed on 17 June 2023).
  35. Sun, X.G.; Zhao, H.H.; Cui, C.Q. The fractal characteristics of tidal flat and tidal creek system in the Yellow River Delta. Oceanol. Limnol. Sin. 2001, 32, 80–86. [Google Scholar]
  36. Richard, C.; Horton, R.E. Erosional development of streams and their drainage basins: H-ydrophysical approach to quantitative morphology. Bulletin of the Geological Society of America. Prog. Phys. Geogr. 1945, 56, 275–370. [Google Scholar] [CrossRef]
  37. Hao, X. Study on morphological characteristics and evolution of tidal creeks on the coa-st of Jiangsu radial sandbar. Nanjing Norm. Univ. 2021. [Google Scholar] [CrossRef]
  38. Marani, M.; Belluco, E.; Alpaos, A.D. On the drainage density of tidal networks. Water Resour. Res. 2002, 39, 1040. [Google Scholar] [CrossRef]
  39. Lao, C.C.; Xin, P.; Zuo, Y.; Cheng, H. Effect of fractional vegetation cover on the evolution of tidal creeks of the Jiuduansha shoal in Yangtze River Estuary (China) during 1996–2020. Adv. Water Sci. 2022, 33, 15–26. [Google Scholar] [CrossRef]
  40. Chen, X.N.; Huang, J.; Yi, M.X. Cost estimation for general aviation aircrafts using regression models and variable importance in projection analysis. J. Clean. Prod. 2020, 256, 120648. [Google Scholar] [CrossRef]
  41. Zhang, R.S.; Lu, L.Y.; Wang, Y.H. The mechanism and trend of coastal erosion of Jiang su Province in China. Geogr. Res. 2002, 21, 469–478. [Google Scholar] [CrossRef]
  42. Hou, X.Y.; Wu, T.; Hou, W.; Chen, Q.; Wang, Y.D.; Yu, L.J. Characteristics of coastline changes in mainland China since the early 1940s. Sci. China Earth Sci. 2016, 59, 1791–1802. [Google Scholar] [CrossRef]
  43. Zong, Y.; Yang, J.L.; Liu, H.Y.; Li, Y.F.; Zhang, Y.L.; Wu, Y.H. Study on the impact of Spartina alterniflora invasion on tidal creek system in the coastal wetland of Yancheng. Adv. Mar. Sci. 2023, 41, 109–122. [Google Scholar] [CrossRef]
  44. Lv, T.Y.; Gong, Z.; Zhang, C.K.; Geng, L.; Zhang, Q. Reviews of morphological characteristics and evolution processes of silty mud tidal creeks. J. Hohai Univ. 2016, 44, 178–188. [Google Scholar] [CrossRef]
  45. He, C.Q.; Cheng, L.Y.; Wang, D.Y.; Zhao, Z.Z.; Wang, Z.Y.; Wang, F.F.; Wang, X.X.; Zhang, P.; Chen, X.P.; Liu, X.Y. Spartina alterniflora raised soil sulfide content by regulati-ng sulfur cycle-associated bacteria in the Jiuduansha Wetland of China. Plant Soil 2021, 469, 107–121. [Google Scholar] [CrossRef]
  46. Chu, Y. Study on distribution and mechanism of salinity on Suaeda heteropteran commun-ity in Liao River Estuary wetland. Diss. Gansu Agric. Univ. 2019. [Google Scholar] [CrossRef]
  47. Geng, L.D.; Alpaos, A.; Sgarabotto, A.; Gong, Z.; Lanzoni, S. Intertwined ecomorphodynamic evolution of salt marshes and emerging tidal channel networks. Water Resour. Res. 2021, 57, e2021W–e30840W. [Google Scholar] [CrossRef]
  48. He, L.; Li, G.S.; Cui, L.L.; Li, L.J.; Chen, Y.H.; Tu, X.S. Coupling relationship between reclamation and social economics development in north Jiangsu coastal area. Acta Ecol. Sin. 2021, 41, 9228–9238. [Google Scholar] [CrossRef]
  49. Zhang, X.; Lin, P.; Gong, Z.; Li, B.; Chen, X. Wave attenuation by Spartina alternifora und-er macrotidal and storm surge conditions. Wetlands 2020, 40, 2151–2162. [Google Scholar] [CrossRef]
  50. Li, Y.R.; Wu, H.T.; Zhang, S.; Lu, X.; Lu, K.L. Morphological characteristics and changes of tidal creeks in coastal wetlands of the yellow river delta under Spartina alterniflora invasion and continuous expansion. Wetl. Sci. 2021, 19, 88–97. [Google Scholar] [CrossRef]
  51. Yu, D.X.; Han, G.X.; Wang, X.J.; Zhang, B.H. Effects of Spartina alterniflora invasion on morphological characteristics of tidal creeks and plant community distribution in the Yellow River Estuary. Chin. J. Ecol. 2022, 41, 42–49. [Google Scholar] [CrossRef]
Figure 1. Geographic location of the Yellow Sea muddy coast in southeast Jiangsu Province, China.
Remotesensing 15 05107 g001
Figure 2. The classification results of RE, SVM, U-Net, and ML in some areas of the Yellow Sea muddy coast for 2019.
Remotesensing 15 05107 g002
Figure 3. RF, ML, SVM, U-Net classifications’ overall accuracy and kappa coefficient.
Remotesensing 15 05107 g003
Figure 4. Land cover types and tidal creeks distribution on the Yellow Sea muddy coast from 1989 to 2021.
Remotesensing 15 05107 g004
Figure 5. Length diagram for the tidal creeks on the Yellow Sea muddy coast during 1989–2021. Note: La, Average length of the tidal creeks (km).
Remotesensing 15 05107 g005
Figure 6. The curvature and quantity diagrams for the tidal creeks on the Yellow Sea muddy coast from 1989 to 2021. (a) Trend of the tidal creek curvature for each tidal creek grade. (b) Trend of the number and total number of tidal creeks for all tidal creek grades.
Remotesensing 15 05107 g006
Figure 7. Trends of the morphological indices of the tidal creeks. (a) Total length of the tidal creeks. (b) Curvature of the tidal creeks. (c) Fractal dimension of the tidal creeks. (d) Branching rate of the tidal creeks.
Remotesensing 15 05107 g007
Figure 8. Vegetation coverage distribution map of the Yellow Sea muddy coast from 1989 to 2021.
Remotesensing 15 05107 g008
Figure 9. The changes in low, medium-low, medium, and high vegetation coverage on the Yellow Sea muddy coast from 1989 to 2021.
Remotesensing 15 05107 g009
Figure 10. Pearson correlation analysis between the tidal gully characteristic index and vegetation coverage on the Yellow Sea muddy coast. (Note: L is the total length of the tidal creeks; C is the curvature of the tidal creeks; D is the fractal dimension value of the tidal creeks; Y is the tidal creek branching rate; LOW indicates low-vegetation-coverage areas; L-M medium–low-vegetation-coverage areas; M medium-vegetation-coverage areas; H high-vegetation-coverage areas; TA indicates the total vegetation coverage area; H-P is the patch area ratio of S. alterniflora; JP-P is the patch area ratio of Suaeda salsa; L-P is P. australis patch area ratio; LOP reflecting the average distance of the water flow from the tidal creek network; RA stands for reclamation area).
Remotesensing 15 05107 g010
Figure 11. Relationship between the characteristic index of tidal gully and the vegetation index on the Yellow Sea muddy coast. The solid line shows the variation trend.
Remotesensing 15 05107 g011
Figure 12. Mechanism influencing tidal creeks and vegetation pattern. (A) Evolution of tidal creeks and vegetation pattern on the Yellow Sea muddy coast. (a) Before the 1980s, S. salsa accounted for the main vegetation coverage. (b) After the introduction of S. alterniflora, S. alterniflora invaded some S. salsa niches. (c) S. alterniflora and P. australis invaded the ecological niche of S. salsa. The tidal creeks were blocked by S. alterniflora and could not enter the S. salsa area. The number of short tidal creeks in the S. alterniflora area increased. (B) Relationship between tidal creek and vegetation. The relationship between S. alterniflora and tidal creeks is complex. The relationship between P. australis and tidal creeks is weak, and there is a positive relationship between S. salsa and tidal creeks. S. alterniflora spread in the niche of S. salsa. Compared with S. alterniflora and P. australis, S. salsa has a low competitive advantage in the area.
Remotesensing 15 05107 g012
Table 1. Remote sensing data acquisition time and tide level.
SatelliteTimeTidal Level/mResolutionSatelliteTimeTidal Level/mResolution
Landsat5_TM2 August 1989 1:572.1930 mLandsat7_ETM9 August 2006 2:202.1330 m
Landsat5_TM21 October 1989 1:551.7130 mLandsat7_ETM13 March 2010 2:232.7730 m
SPOT-130 November 19891.3420 mLandsat7_ETM20 August 2010 2:231.8730 m
Landsat5_TM23 January 1995 1:432.3130 mSPOT-417 September 20102.1620 m
Landsat5_TM3 August 1995 1:342.1830 mLandsat8_OLI17 March 2014 2:312.3630 m
Landsat5_TM19 February 1999 2:101.4530 mLandsat8_OLI26 October 2014 2:313.0830 m
SPOT-427 May 19991.3420 mLandsat8_OLI21 August 2019 2:303.5030 m
Landsat5_TM2 November 1999 2:061.6230 mSentinel-228 September 20192.8710 m
SPOT-417 August 20022.7820 mLandsat8_OLI9 November 2019 2:311.4230 m
Landsat5_TM23 September 2002 2:043.4530 mLandsat8_OLI30 January 2021 2:302.6730 m
Landsat7_ETM1 October 2002 2:182.0530 mSentinel-230 August 20212.6710 m
Landsat7_ETM20 March 2006 2:201.6930 mLandsat8_OLI29 October 2021 2:301.3430 m
Table 2. The F1 scores of RF, U-Net, SVM, and ML for P. australis, S. alterniflora, and S. salsa.
MethodF1 (%)
S. alternifloraP. australisS. salsaMean Value
RF85.36 ± 0.3989.05 ± 0.1370.36 ± 0.1381.59 ± 0.07
U-Net94.53 ± 0.2191.57 ± 0.0890.87 ± 0.1692.32 ± 0.12
SVM93.87 ± 0.1490.13 ± 0.1589.18 ± 0.1591.06 ± 0.08
ML91.65 ± 0.3688.77 ± 0.1685.49 ± 0.2288.64 ± 0.07
Table 3. Vegetation cover transfer matrix of the Yellow Sea muddy coast from 1989 to 2021.The transfer-in contribution rate represents the percentage of a certain vegetation coverage area converted from other vegetation coverage types to the total transfer-in area. The transfer-out contribution rate represents the percentage of a certain vegetation coverage area converted into other types of vegetation coverage in the total transfer-out area.
1989 (km²)2021 (km²)Transfer Out (%)Transfer Out Contribution Rate (%)
NVLVMLVMVHV
No vegetation (NV)723.2825.8212.6916.029.098.084.3
Low vegetation (LV)388.68201.86167.71240.55235.8683.6569.85
Medium–low vegetation (MLV)18.4136.9139.5361.8484.483.613.63
Medium vegetation (MV)3.5710.8915.2731.2171.276.386.83
High vegetation (HV)5.4215.4721.4737.31167.9732.175.39
Transfer in (%)36.5230.6284.5991.9370.45
Transfer-in contribution rate (%)28.146.0214.6924.0627.09 100
Disclaimer/Publisher’s Note: The statements, opinions and data contained in all publications are solely those of the individual author(s) and contributor(s) and not of MDPI and/or the editor(s). MDPI and/or the editor(s) disclaim responsibility for any injury to people or property resulting from any ideas, methods, instructions or products referred to in the content.

