Article

Multi-Factors Synthetically Contribute to Ulva prolifera Outbreaks in the South Yellow Sea of China

1
College of Resources and Environmental Engineering, Ludong University, Yantai 264039, China
2
School of Atmospheric Sciences, Sun Yat-Sen University, Zhuhai 519082, China
3
Yantai Land Reserve and Use Centre, Yantai 264000, China
4
Shandong Marine Resource and Environment Research Institute, Yantai 264006, China
*
Author to whom correspondence should be addressed.
Remote Sens. 2023, 15(21), 5151; https://doi.org/10.3390/rs15215151
Submission received: 6 September 2023 / Revised: 20 October 2023 / Accepted: 25 October 2023 / Published: 27 October 2023
(This article belongs to the Section Ocean Remote Sensing)

Abstract

:
In recent years, the frequent outbreaks of Ulva prolifera in the South Yellow Sea have become the largest-scale green tide disasters in the world. The causes of its outbreaks have garnered widespread attention, particularly the coupled effects of multiple factors. Leveraging the Google Earth Engine (GEE) platform, this study conducted a long-term investigation of the Yellow Sea green tide disaster and the factors using multi-source satellite imagery. Finally, the combined effects of natural environmental changes and human activities on Ulva prolifera were analyzed by redundancy analysis (RDA) and variation partitioning analysis (VPA). The results indicate: (1) Since 2018, the scale of Ulva prolifera in the South Yellow Sea has shown a distinct “biennial” trend. (2) Regarding environmental factors, SST, PAR, precipitation, and windspeed have certain effects on the growth of Ulva prolifera. However, they cannot be considered as determining factors for the outbreak of Ulva prolifera (0.002 < R2 < 0.14). Regarding anthropogenic factors, the recycle time of Pyropia yezoensis culture rafts has a relatively minor influence on the extent of Ulva prolifera. There exists a certain positive correlation (R2 = 0.45) between the human footprint index (HFI) of Jiangsu Province and the annual variation in Ulva prolifera area in the South Yellow Sea. (3) The combined effects of multiple factors influence green tide outbreaks. The Ulvatotal explanatory power of SST, PAR, precipitation, windspeed, HFI, and the recycle time of Pyropia yezoensis culture rafts for the annual variation in the Ulva prolifera area is 31.8%, with these factors interweaving and mutually influencing each other. This study offers important insights into quantifying the driving forces behind Ulva prolifera in the South Yellow Sea, providing valuable information for a deeper comprehension of the complexity of marine ecosystems and sustainable management.

Graphical Abstract

1. Introduction

Ulva prolifera (U. prolifera), a member of the family Ulvaceae, belongs to the green algae group [1]. Since 2007, a succession of large-scale green tide events caused by U. prolifera has occurred for 16 consecutive years in China’s South Yellow Sea (SYS) [2,3]. Prior research has indicated that the germination of U. prolifera thalli typically initiates in the early spring, from late April to early May, within the Northern Jiangsu shoal, Jiangsu Province, China. By late May, this phenomenon becomes detectable through remote sensing imagery [4]. Driven by monsoonal winds and ocean currents, U. prolifera is subsequently carried northward along the coast of the SYS, experiencing rapid proliferation [5,6]. By June and July, it accumulates in the nearshore waters of the Shandong Peninsula, reaching its peak area. Subsequently, it gradually diminishes and disappears in July and August. The extensive outbreak of U. prolifera in the SYS represents the largest-scale green tide event documented [7]. This phenomenon has inflicted severe damage and substantial losses upon the ecological environment, aquaculture, and tourism industries along the western coast of the Yellow Sea [8,9]. The underlying causes of this phenomenon have attracted significant attention from a wide range of researchers.
Numerous scholars have researched the occurrence conditions, physiological characteristics, and adaptive mechanisms of U. prolifera. However, limited reports exist on the driving factors behind the outbreaks and interannual variations of U. prolifera in the SYS. Regarding the origin of U. prolifera, it is widely accepted that this green macroalga originates from propagules attached to Pyropia yezoensis (P. yezoensis) cultivation rafts in the Northern Jiangsu shoal of China. These propagules may be dislodged into the ocean due to seawater movement and changes in marine environments, thus serving as a potential source for U. prolifera [8,10,11]. Laboratory ecological studies concerning environmental factors that might influence U. prolifera proliferation have indicated its broad tolerance to irradiance, temperature, and salinity conditions [12]. Notably, U. prolifera demonstrates significant photosynthetic activity at sea surface temperatures between 15 °C and 25 °C, particularly under higher light saturation levels. The growth of U. prolifera relies predominantly on the uptake of nutrients such as nitrogen and phosphorus from seawater. Furthermore, factors like sea surface temperature (SST), photosynthetically active radiation (PAR), and nutrient concentrations interact with each other, influencing U. prolifera growth [13,14,15,16]. While individual studies have matured in understanding the factors influencing U. prolifera, quantifying the relative impact of each factor on changes in its area remains unaddressed. The intricate interplay among different factors complicates the elucidation of the driving mechanisms. Moreover, with the increasing human activities such as aquaculture, maritime traffic, and agricultural and industrial production, the role of anthropogenic factors in marine ecosystems cannot be ignored. The potential synergies between anthropogenic and natural driving forces could further exacerbate the complexities of U. prolifera outbreaks and interannual variations. As a result, there is a compelling need to comprehensively investigate and quantify the intricate relationships among these factors. That will help enhance our understanding of the dynamics of U. prolifera outbreaks in the SYS.
The advancement of remote sensing technology has greatly facilitated the study and monitoring of marine ecosystems [7,17,18]. Regarding U. prolifera research, methods for extracting information from remote sensing imagery primarily fall into supervised classification, single-band thresholding, and multi-band ratio-based approaches [19,20]. Among these, multi-band ratio-based methods utilize information from various spectral bands to enhance target features, thereby improving the discrimination of U. prolifera and minimizing interference from spurious information. Widely employed multi-band ratio-based methods include normalized difference vegetation index (NDVI), enhanced vegetation index (EVI), normalized difference algae index (NDAI), floating algae index (FAI), and virtual baseline height-based floating algae identification (VB-FAH) [21,22,23,24]. Compared to traditional remote sensing image processing methods, the Google Earth Engine (GEE) platform enables efficient cloud-based large-scale data processing and analysis, making intricate and long-term remote sensing data processing more efficacious [25]. Moreover, the GEE platform offers a plethora of data products that can be utilized to study driving factors that may contribute to U. prolifera outbreaks, such as sea surface temperature (SST), photosynthetically active radiation (PAR), precipitation, and windspeed [26,27]. This comprehensive toolset facilitates a more holistic understanding of the dynamics of U. prolifera outbreaks in the SYS.
Based on the comprehensive analysis outlined above, this study investigates potential influencing factors of U. prolifera outbreaks from the perspectives of environmental changes and human activities. The combined effects of various factors are examined through redundancy analysis (RDA) and variation partitioning analysis (VPA), shedding light on the primary influencing factors and their respective contributions. The impacts of these factors are quantified, offering novel insights into the driving mechanisms behind U. prolifera outbreaks and contributing to a deeper understanding of marine ecosystem dynamics. At the same time, it lays the groundwork for formulating effective green tide early warning systems, marine environmental protection strategies, and sustainable management measures. Moreover, this study presents a fresh empirical case for applying remote sensing techniques and statistical methodologies in marine environmental research, thereby contributing to the advancement of these tools in exploring the intricate dynamics of marine ecology. Through this endeavor, we aim to delve further into the exploration and understanding of the dynamic changes within marine ecosystems.

2. Materials and Methods
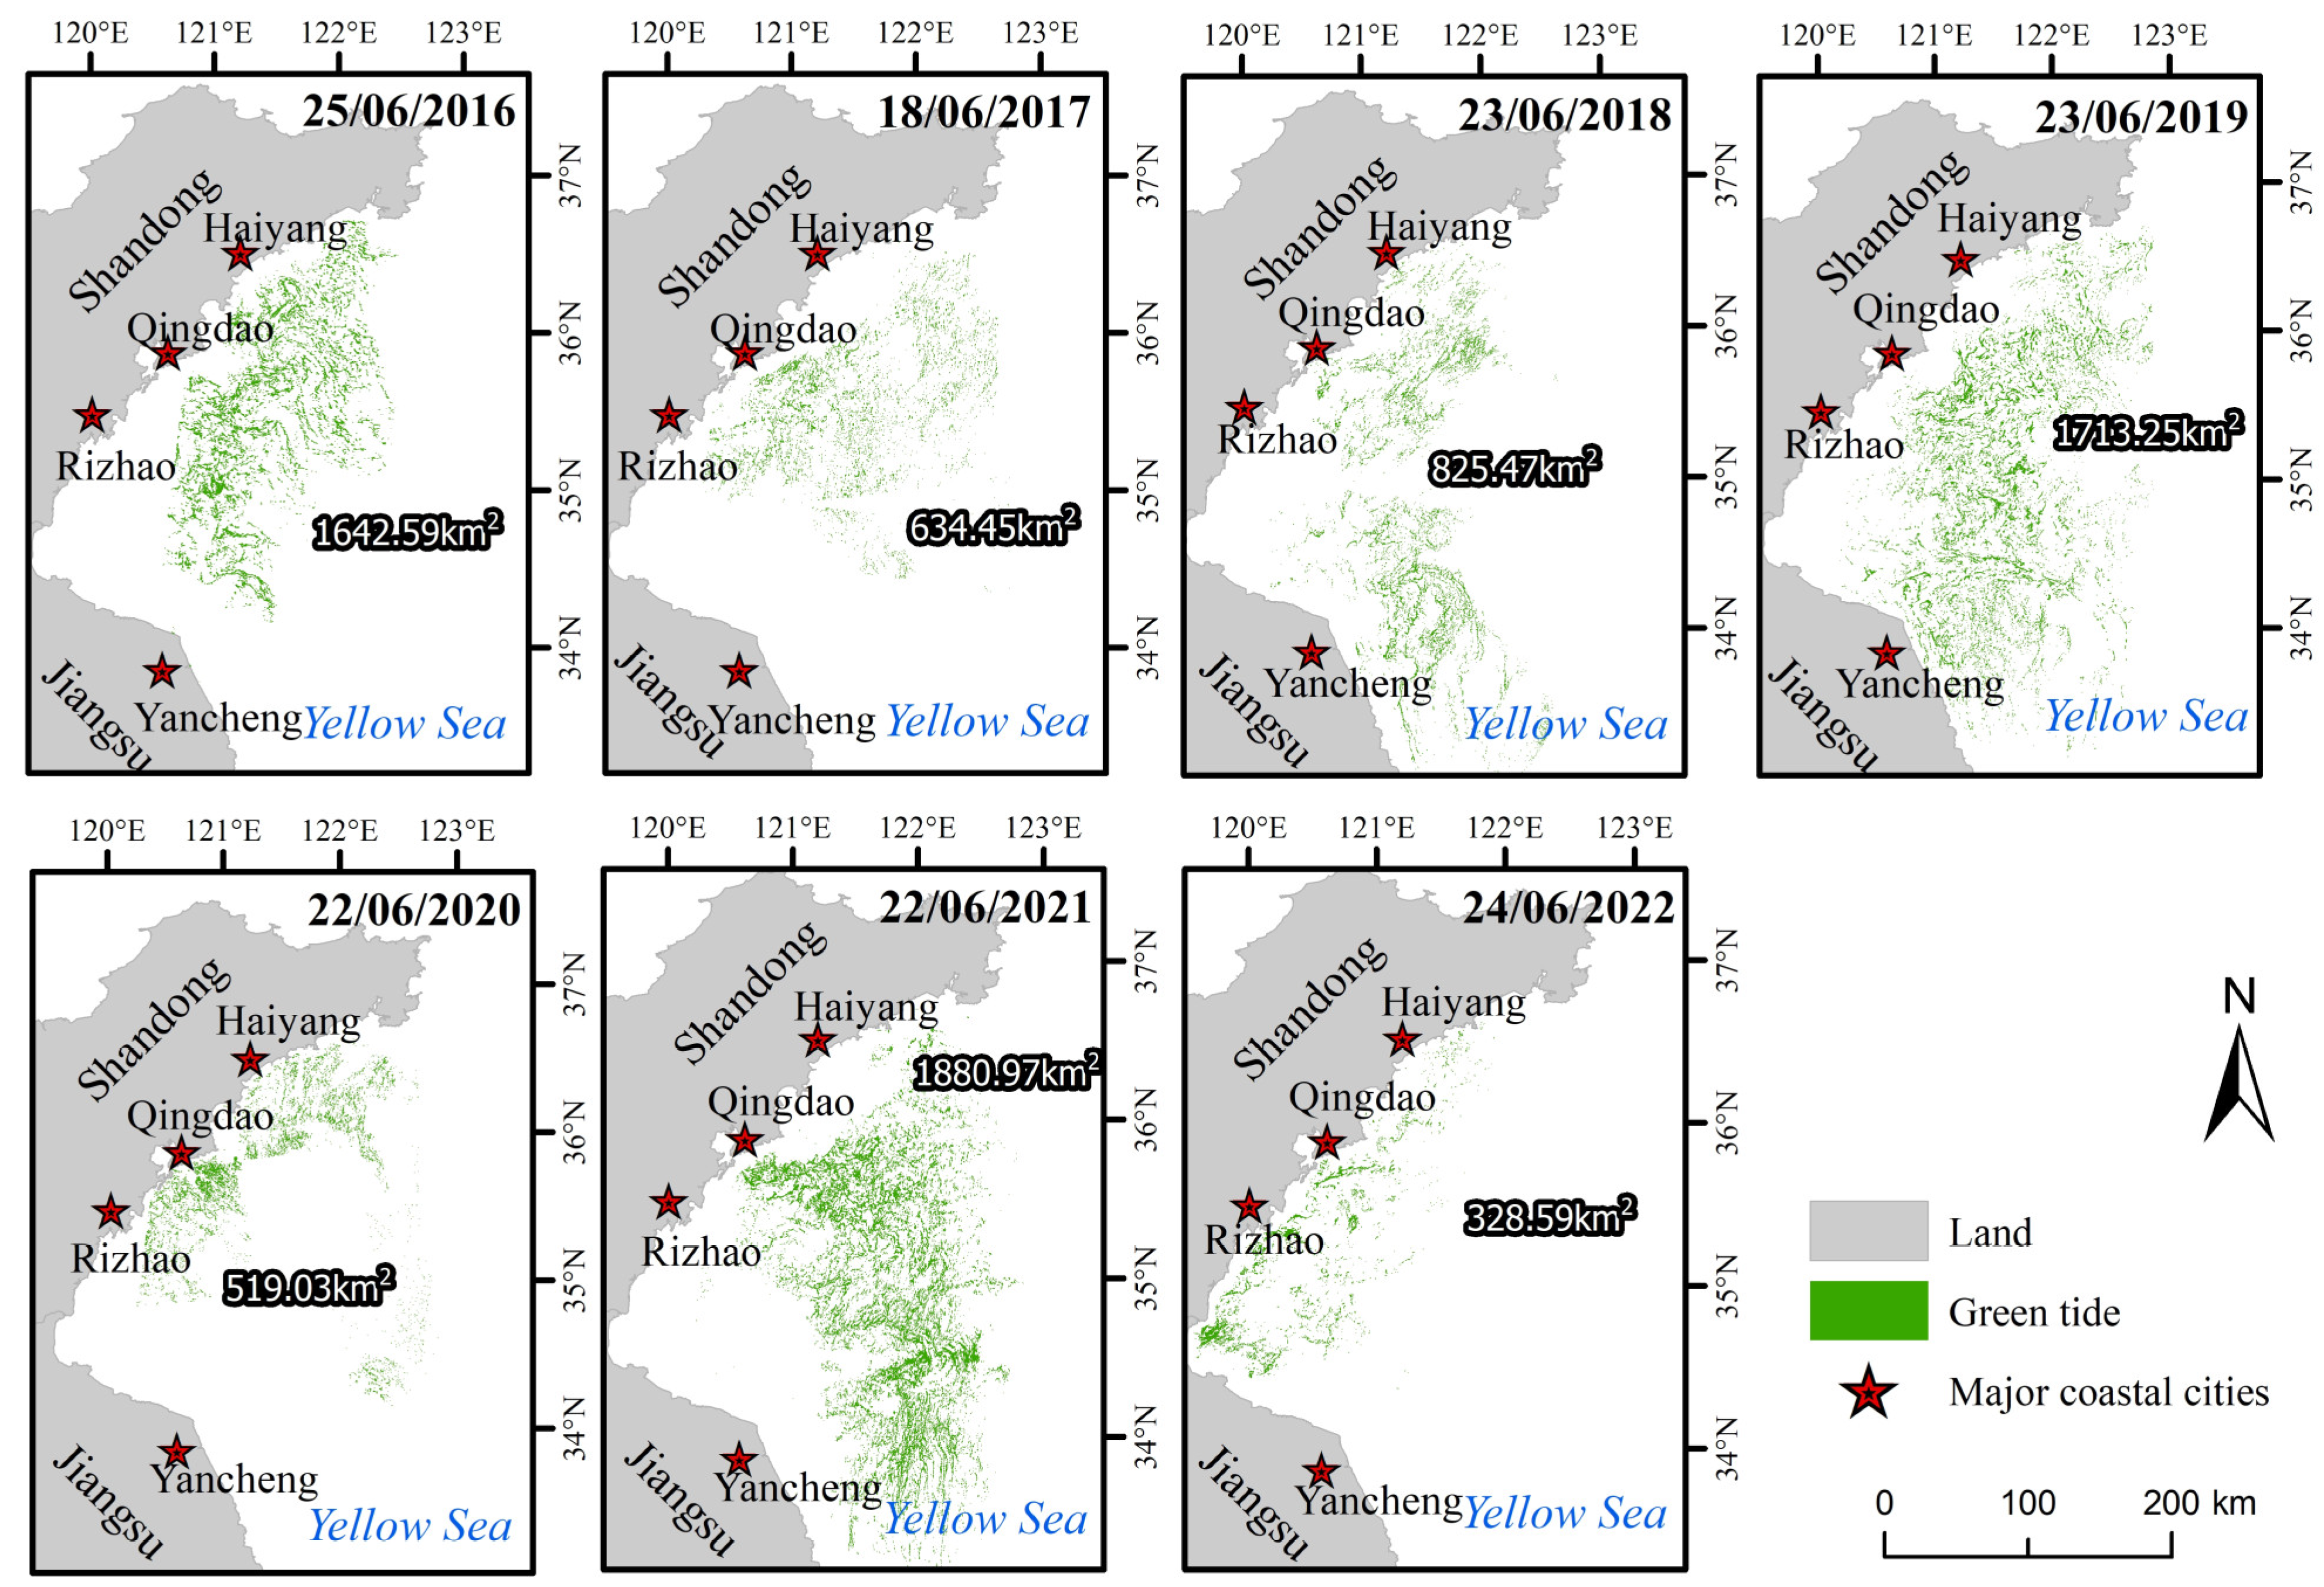
2.1. Study Area

The SYS is situated along the eastern coast of China, spanning from approximately 32°N to 37°N latitude and 119°E to 123°E longitude (Figure 1D). This region falls within the subtropical monsoon climate zone, with ample precipitation and a warm and humid climate. These ecological conditions create a suitable environment for the proliferation and growth of algae. The coastal areas of the SYS are dotted with several significant cities, such as Yancheng, Lianyungang, Qingdao, and Haiyang, which have long been affected by green tide outbreaks. Over the past few decades, human activities such as industrial emissions, coastal development, and maritime traffic in these coastal cities have led to the substantial inflow of terrestrial nutrients into the sea through urban rivers. Guided by tides and ocean currents, these nutrients contribute to the nutrient supply that fuels the proliferation of U. prolifera [28,29].

2.2. GEE Data Acquisition and Processing

A subset of the data employed in this study (Table 1) was sourced from the Google Earth Engine (GEE) platform. Leveraging the extensive remote sensing data within the GEE platform, we obtained high-resolution imagery to extract the distribution of U. prolifera and the boundaries of the P. yezoensis cultivation area. Furthermore, the GEE platform furnished additional crucial environmental data for our research, including sea surface temperature (SST), photosynthetically active radiation (PAR), windspeed, and precipitation. We calculated monthly average environmental indicators within the study area using these datasets. These indicators hold significant importance in unravelling the mechanisms underlying U. prolifera outbreaks.

2.2.1. U. prolifera Information Extraction

Utilizing remote sensing imagery to monitor and extract U. prolifera has gradually emerged as a pivotal approach to studying green tide disasters. Previous research efforts have produced a variety of methods encompassing diverse bands, indices, and features to cater to distinct research requirements and data characteristics [23,30,31,32]. During our field observations in 2021 (Figure 1A–C), we noted that healthy U. prolifera algae exhibit spectral features resembling those of green vegetation. Notably, the normalized difference vegetation index (NDVI) remained effective in extracting U. prolifera information even in thin clouds [33,34]. Building upon these observations, we opted for NDVI to extract the location and area information of U. prolifera from the imagery. NDVI values typically range from −1 to 1. Areas with green vegetation cover are generally have higher NDVI values, typically exceeding 0.2 or 0.3 [35]. The NDVI formula is as follows:
N D V I = ( N I R R ) / ( N I R + R ) ,
where N I R is the near-infrared band, and R is the red band in visible light.
We selected the Sentinel-2 image dataset within the GEE platform: “COPERNICUS/S2_HARMONIZED”. This dataset has undergone pre-processing steps, including calibration, radiometric correction, and atmospheric correction. These steps were taken to mitigate the impact of atmospheric interference and variations in lighting conditions on the NDVI calculations (Figure 1E). Subsequently, we employed visual interpretation and empirical methods to select water bodies containing U. prolifera information manually. Histogram analysis of NDVI images was then performed to determine the threshold for distinguishing U. prolifera from water bodies. This process established a threshold capable of distinguishing between the two [36]. Ultimately, we cross-referenced this threshold with field observation data to further refine and calibrate its values, ensuring enhanced precision and reliability of the extraction outcomes. Due to influences such as U. prolifera health and temporal variations, it is important to note that the threshold is not unique, often fluctuating between 0.15 and 0.25. We obtained 97 images containing U. prolifera information and averaged the extraction results. This procedure yielded the monthly average area of U. prolifera in the SYS.

2.2.2. Extraction of Information on P. yezoensis Cultivation

The dynamic changes of the P. yezoensis cultivation areas in the northern Jiangsu shoal significantly impact the outbreaks of U. prolifera in the SYS [10]. To extract P. yezoensis cultivation rafts, we employed the random forest (RF) classification algorithm to differentiate “cultivation areas” from “non-cultivation areas” in Sentinel-1 imagery. Notably, the distinct texture attributes of the "farming areas" rendered their edges clear and easily distinguishable in synthetic aperture radar (SAR) images (Figure 1F). The RF classification method is increasingly employed in remote sensing image processing due to its high flexibility and robust classification performance [37,38]. We utilized the “ee.Classifier.randomForest” function provided by the GEE platform. There were 300 “cultivation areas” and "non-cultivation areas" samples which were selected for model training. During training, optimal model configuration was achieved with the number of decision trees adjusted to 100. Simultaneously, we employed cross-validation, dividing the sample data into training and validation sets. The validation set was not involved in the training process and was used to assess the model’s performance. The cross-validation results revealed an average accuracy of 0.85, an average recall of 0.79, an average precision of 0.84, and an average F1 score of 0.82. Subsequently, we assessed the model using a confusion matrix, and the results are presented in Table 2. Based on these outcomes, we calculated an accuracy of approximately 0.86, a recall of 0.82, a precision of around 0.89, and an F1 score of approximately 0.86. These findings collectively support the high classification accuracy of the random forest model.

2.2.3. Processing of Environmental Factor Data

In the GEE platform, we imported datasets including sea surface temperature (SST), photosynthetically active radiation (PAR), windspeed, and precipitation. The periods during which the data for U. prolifera in the SYS could be monitored were identified. (The windspeed dataset, constrained by the temporal scope, was only used up to 2021). Taking SST data as an example, we initially defined a function to access images of the study area and calculate the average SST value for each image. Based on this foundation, the data were transformed to form a collection of features. Subsequently, we established a time series for computing monthly average SST data, and corresponding monthly charts were generated.

2.3. Human Footprint Index (HFI) Data Acquisition and Processing

The human footprint index (HFI) is crucial for interpreting human activities’ environmental impact [39]. It aims to measure human consumption of ecological resources, environmental modifications, and the equilibrium between these factors and the sustainability of the Earth’s ecosystems [40,41]. The computation of the HFI involves the comprehensive consideration of multiple influencing factors, primarily cropland area, deforestation area, fisheries catch, energy consumption, building land area, and population, among other indicators. This study references the HFI calculation methodology published by the Global Footprint Network (https://www.footprintnetwork.org, accessed on 11 March 2022), and data for the indicators were obtained from the National Bureau of Statistics (http://www.stats.gov.cn/, accessed on 17 March 2022). Linear normalization was chosen in this research to process the indicators. It is a dimensionless method that transforms original data linearly into the range of [0, 1]. Its calculation formula is as follows:
x = ( x m i n ) / ( m a x m i n ) ,
where x is the converted value, x is the original value, m i n is the minimum value in the original data, and m a x is the maximum value in the original data.
Considering the differing importance of each indicator, it is necessary to assign weights to them. In this study, we adopted the analytic hierarchy process (AHP) to calculate the weights of the individual indicators [41]. We compared the six standardized indicators to determine their relative importance. We used a scale from 1 to 9, where 1 signifies that two indicators are equally important, and 9 signifies that the difference between two indicators is huge [42]. After constructing the comparison matrices, we obtained the weights for each indicator, as presented in Table 3.
The formula for calculating the weighted sum based on the AHP-derived indicator weights is as follows:
W e i g h t e d   S c o r e = w 1 · x 1 + w 2 · x 2 + + w 6 · x 6 ,
where w n is the weight of the nth indicator, x 1 is the standardized value of the cropland area, x 2 is the standardized value of the deforestation area, x 3 is the standardized value of fisheries catch, x 4 is the standardized value of energy consumption, x 5 is the standardized value of the building land area, and x 6 is the standardized value of the population.
Based on the weighted sums, a final human footprint index can be derived:
H F I = W e i g h t e d   S c o r e T o t a l   P o s s i b l e   S c o r e ,
where the T o t a l   P o s s i b l e   S c o r e is the theoretical maximum within the standardized range of each indicator.

2.4. Influence Factor Processing Methods

In order to gain a deeper understanding of the factors influencing U. prolifera growth and their contributions, we employed redundancy analysis (RDA) [43]. RDA is a statistical analysis method that associates multiple explanatory variables, such as SST, PAR, HFI, windspeed, recycle time of P. yezoensis cultivation rafts, and precipitation, with the U. prolifera area as the response variable [44,45]. This approach allows us to elucidate the relationships between the response variable matrix and the explanatory variable matrix, providing clarity in exploring these associations. This relationship is visually presented in a lower-dimensional orthogonal ordination space. Based on the results of RDA, we employed variance partitioning analysis (VPA) to dissect the impact of multiple explanatory variables on the response variable and quantify their relative contributions [46]. The calculation of VPA typically involves using statistical software to perform multivariate analysis of variance (ANOVA) or linear regression [47]. In this study, VPA was executed using functions within the Package vegan (2.5-6) in the R programming language. Through this decomposition, we better understand the individual contributions of each explanatory variable, such as SST and PAR, to the interannual variation in the U. prolifera area and their combined effects on its fluctuations.

3. Results

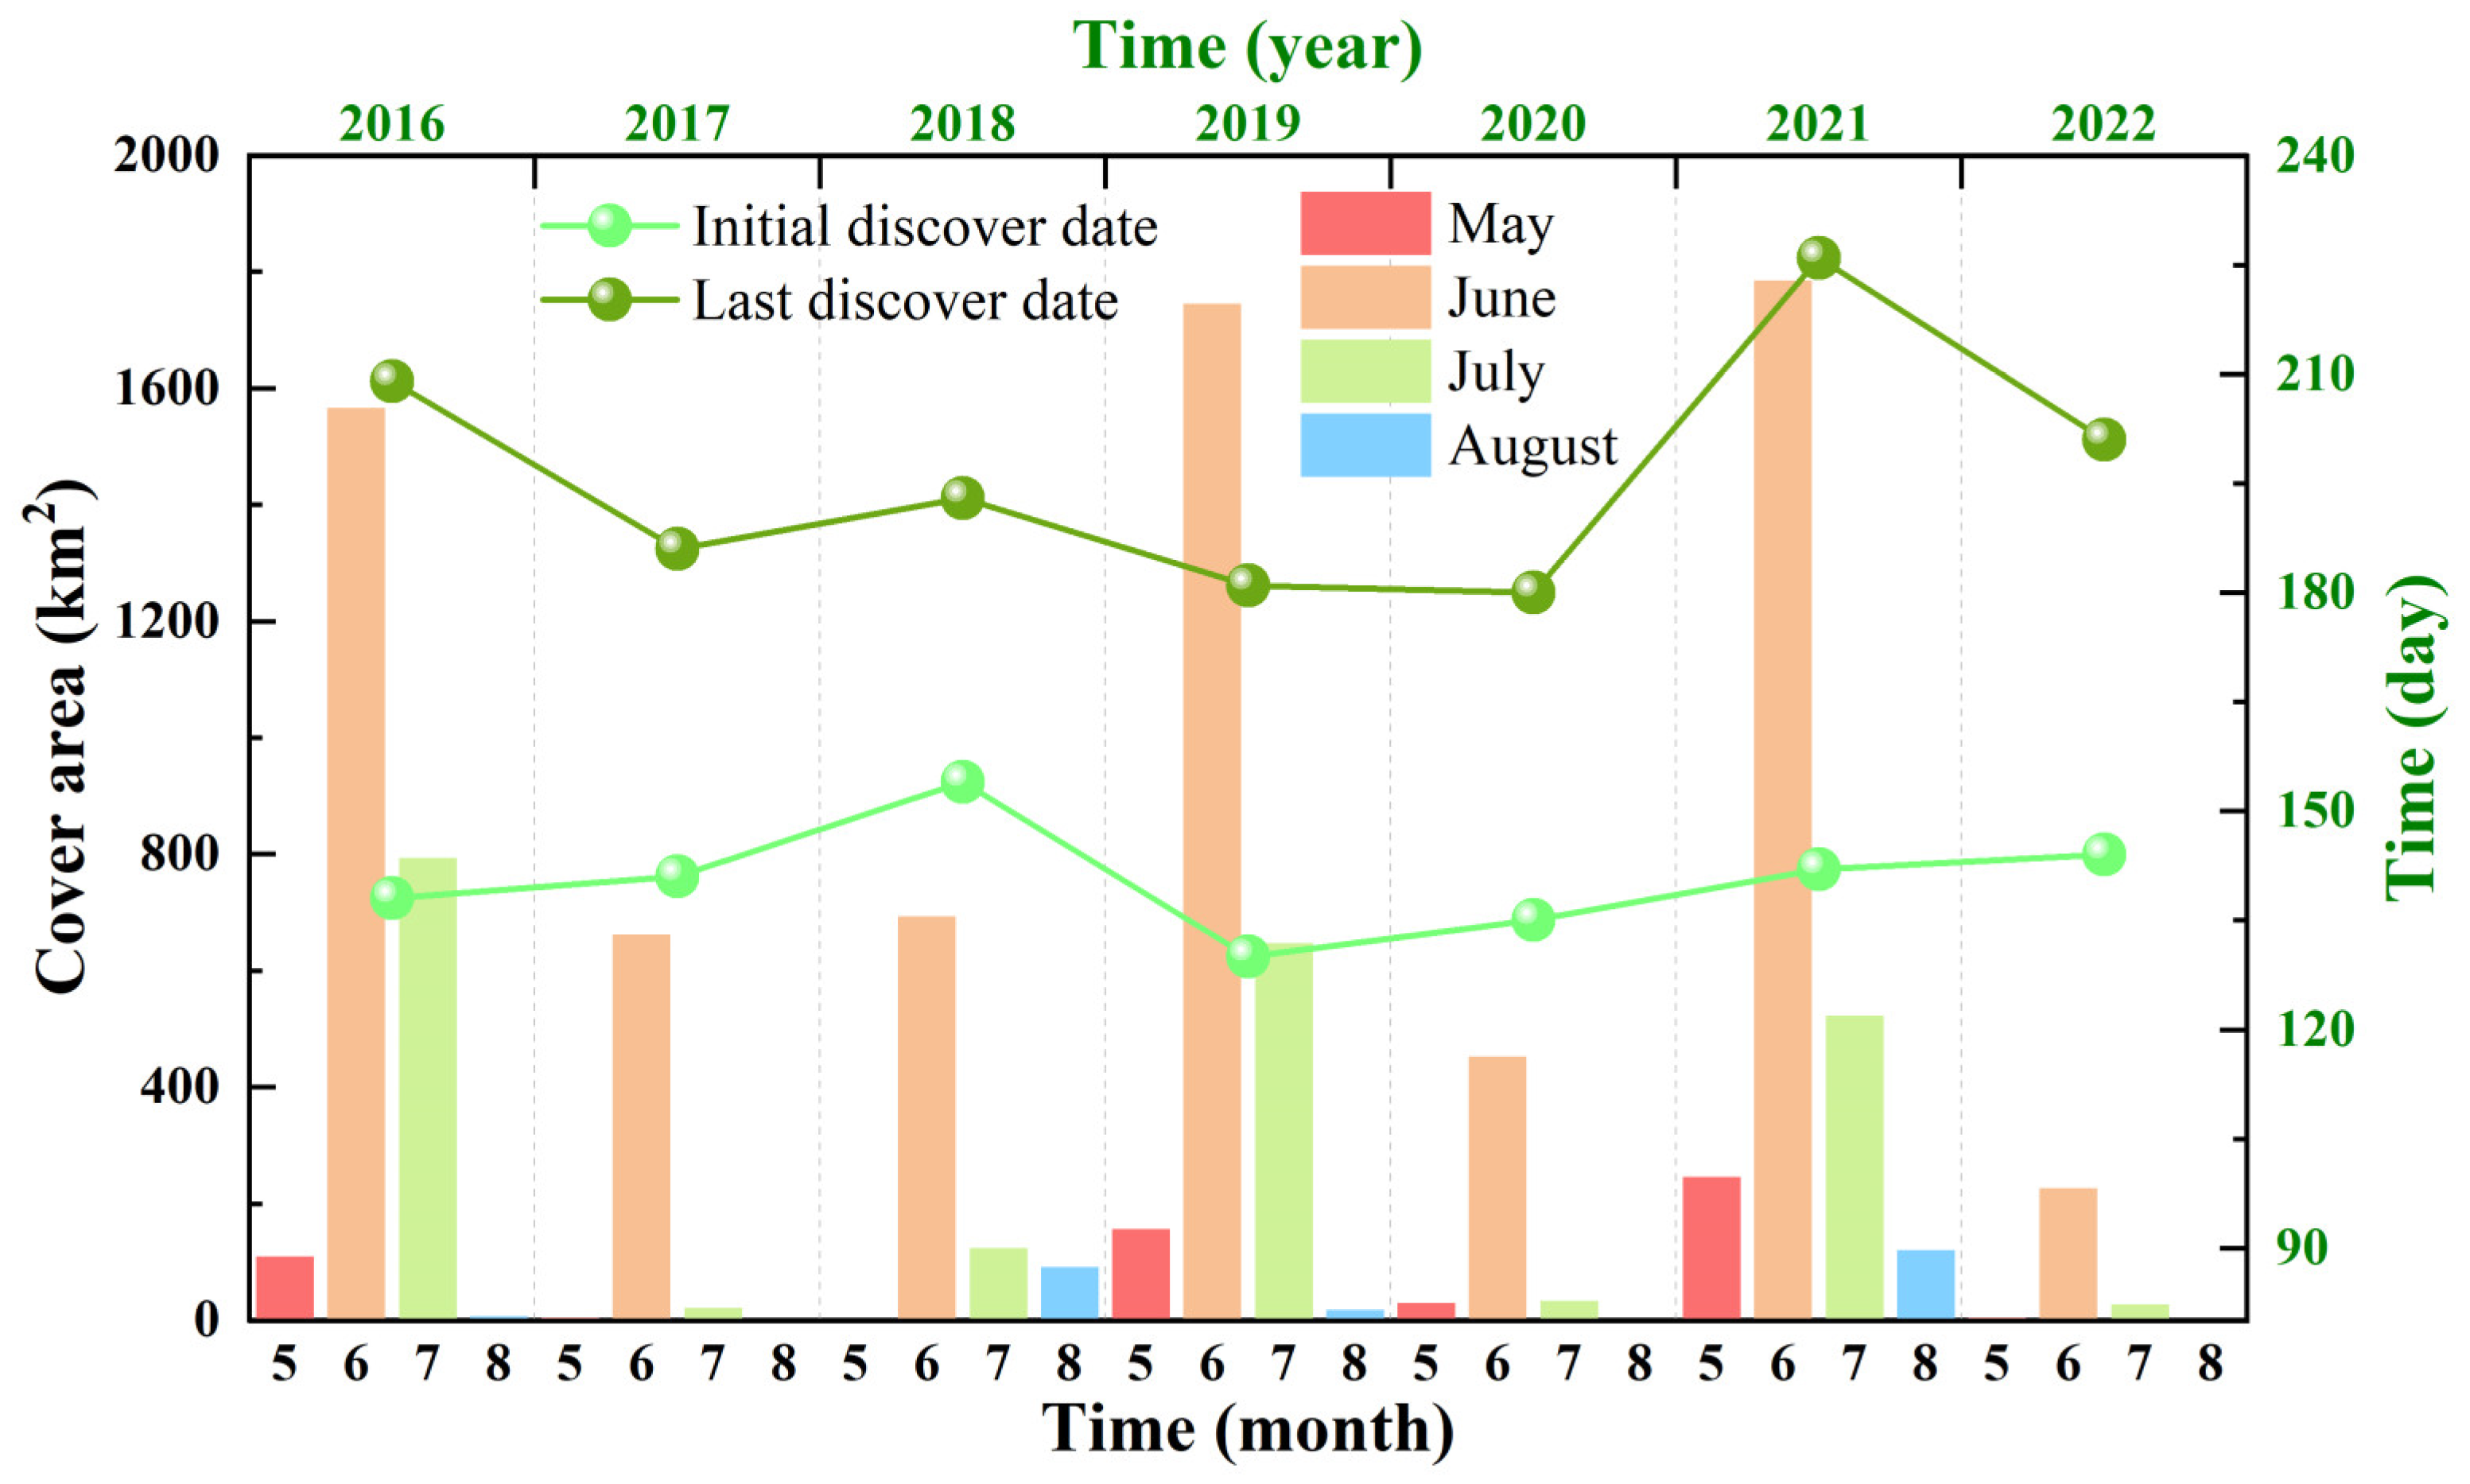
3.1. Variations in the Size and Duration of the Green Tide Phenomenon

Using the U. prolifera information identified based on NDVI values, we can analyze the U. prolifera scale changes from 2016 to 2022. As depicted in Figure 2, U. prolifera in the SYS is detectable in remote sensing images as early as May or June. Notably, in the months of May for the years 2016, 2019, and 2021, a certain level of coverage was observed, with substantial extents in these years. The peak coverage of U. prolifera in the SYS typically occurs in mid to late June, during which the prominent patches have reached the waters off Shandong Province (Figure 3). Subsequently, the coverage experiences a decline, leading to gradual disappearance in July or August, with durations ranging from 39 to 84 days (Figure 2). Analyzing the variation between the duration and coverage of U. prolifera in the SYS, it is apparent that the timing of outbreaks is not significantly correlated with the coverage extent for a given year. However, there exists a specific positive correlation between the duration and coverage. Years with longer durations tend to exhibit more extensive coverage, as seen in 2016 and 2021, whereas years with shorter durations, like 2017 and 2018, display the opposite pattern. From 2016 to 2022, the U. prolifera area has exhibited considerable fluctuations. Notably, recent years have shown significant variations in coverage; the average coverage in June of 2019 and 2021 exceeded 1500 km2. Conversely, in 2020 and 2022, the average coverage in June remained below 500 km2. Since 2018, the U. prolifera area in the SYS has demonstrated cyclical and regular changes, characterized by alternating “large” and “small” years, as depicted in Figure 2.

3.2. Changes in the Recycle Time of P. yezoensis Cultivation Rafts in the Northern Jiangsu Shoal

The recycling time of P. yezoensis cultivation rafts refers to the frequency and rate of raft collection. It significantly correlates with the outbreak of U. prolifera in the northern Jiangsu shoal [48]. As illustrated in Figure 4, there has been a gradual trend of earlier recycling time for the P. yezoensis cultivation rafts in the northern Jiangsu shoal from 2016 to 2022. Among these years, the recycle time was the latest in 2017 and earliest in 2021. In recent years, the commencement and completion times of raft recycle have occurred earlier, from 2020 to 2022. However, corresponding variations in the U. prolifera area for these years have been substantial. Taking 2021 and 2022 as examples, the differences in recycle times between these two years are less pronounced compared to other years. However, the U. prolifera coverage for two years represents the maximum and minimum values since 2016. Regarding recycle speed, 2017 saw the fastest recycle rate, with the remaining area of the cultivation zone decreasing from 50% to 10% within 12 days. On the other hand, 2018 exhibited the slowest recycle rate, requiring a total of 47 days for the remaining area to transition from 50% to 10%. However, 2017 and 2018 featured relatively small U. prolifera coverage in the SYS, with monthly average areas totaling less than 1000 km2. We conducted a correlation analysis between the recovery time, recovery rate of the P. yezoensis cultivation rafts, and the U. prolifera coverage. The results indicate R2 values of 0.009 and 0.005, respectively. These results show that the timing and speed of raft recycle are not the determining factors for U. prolifera outbreaks.

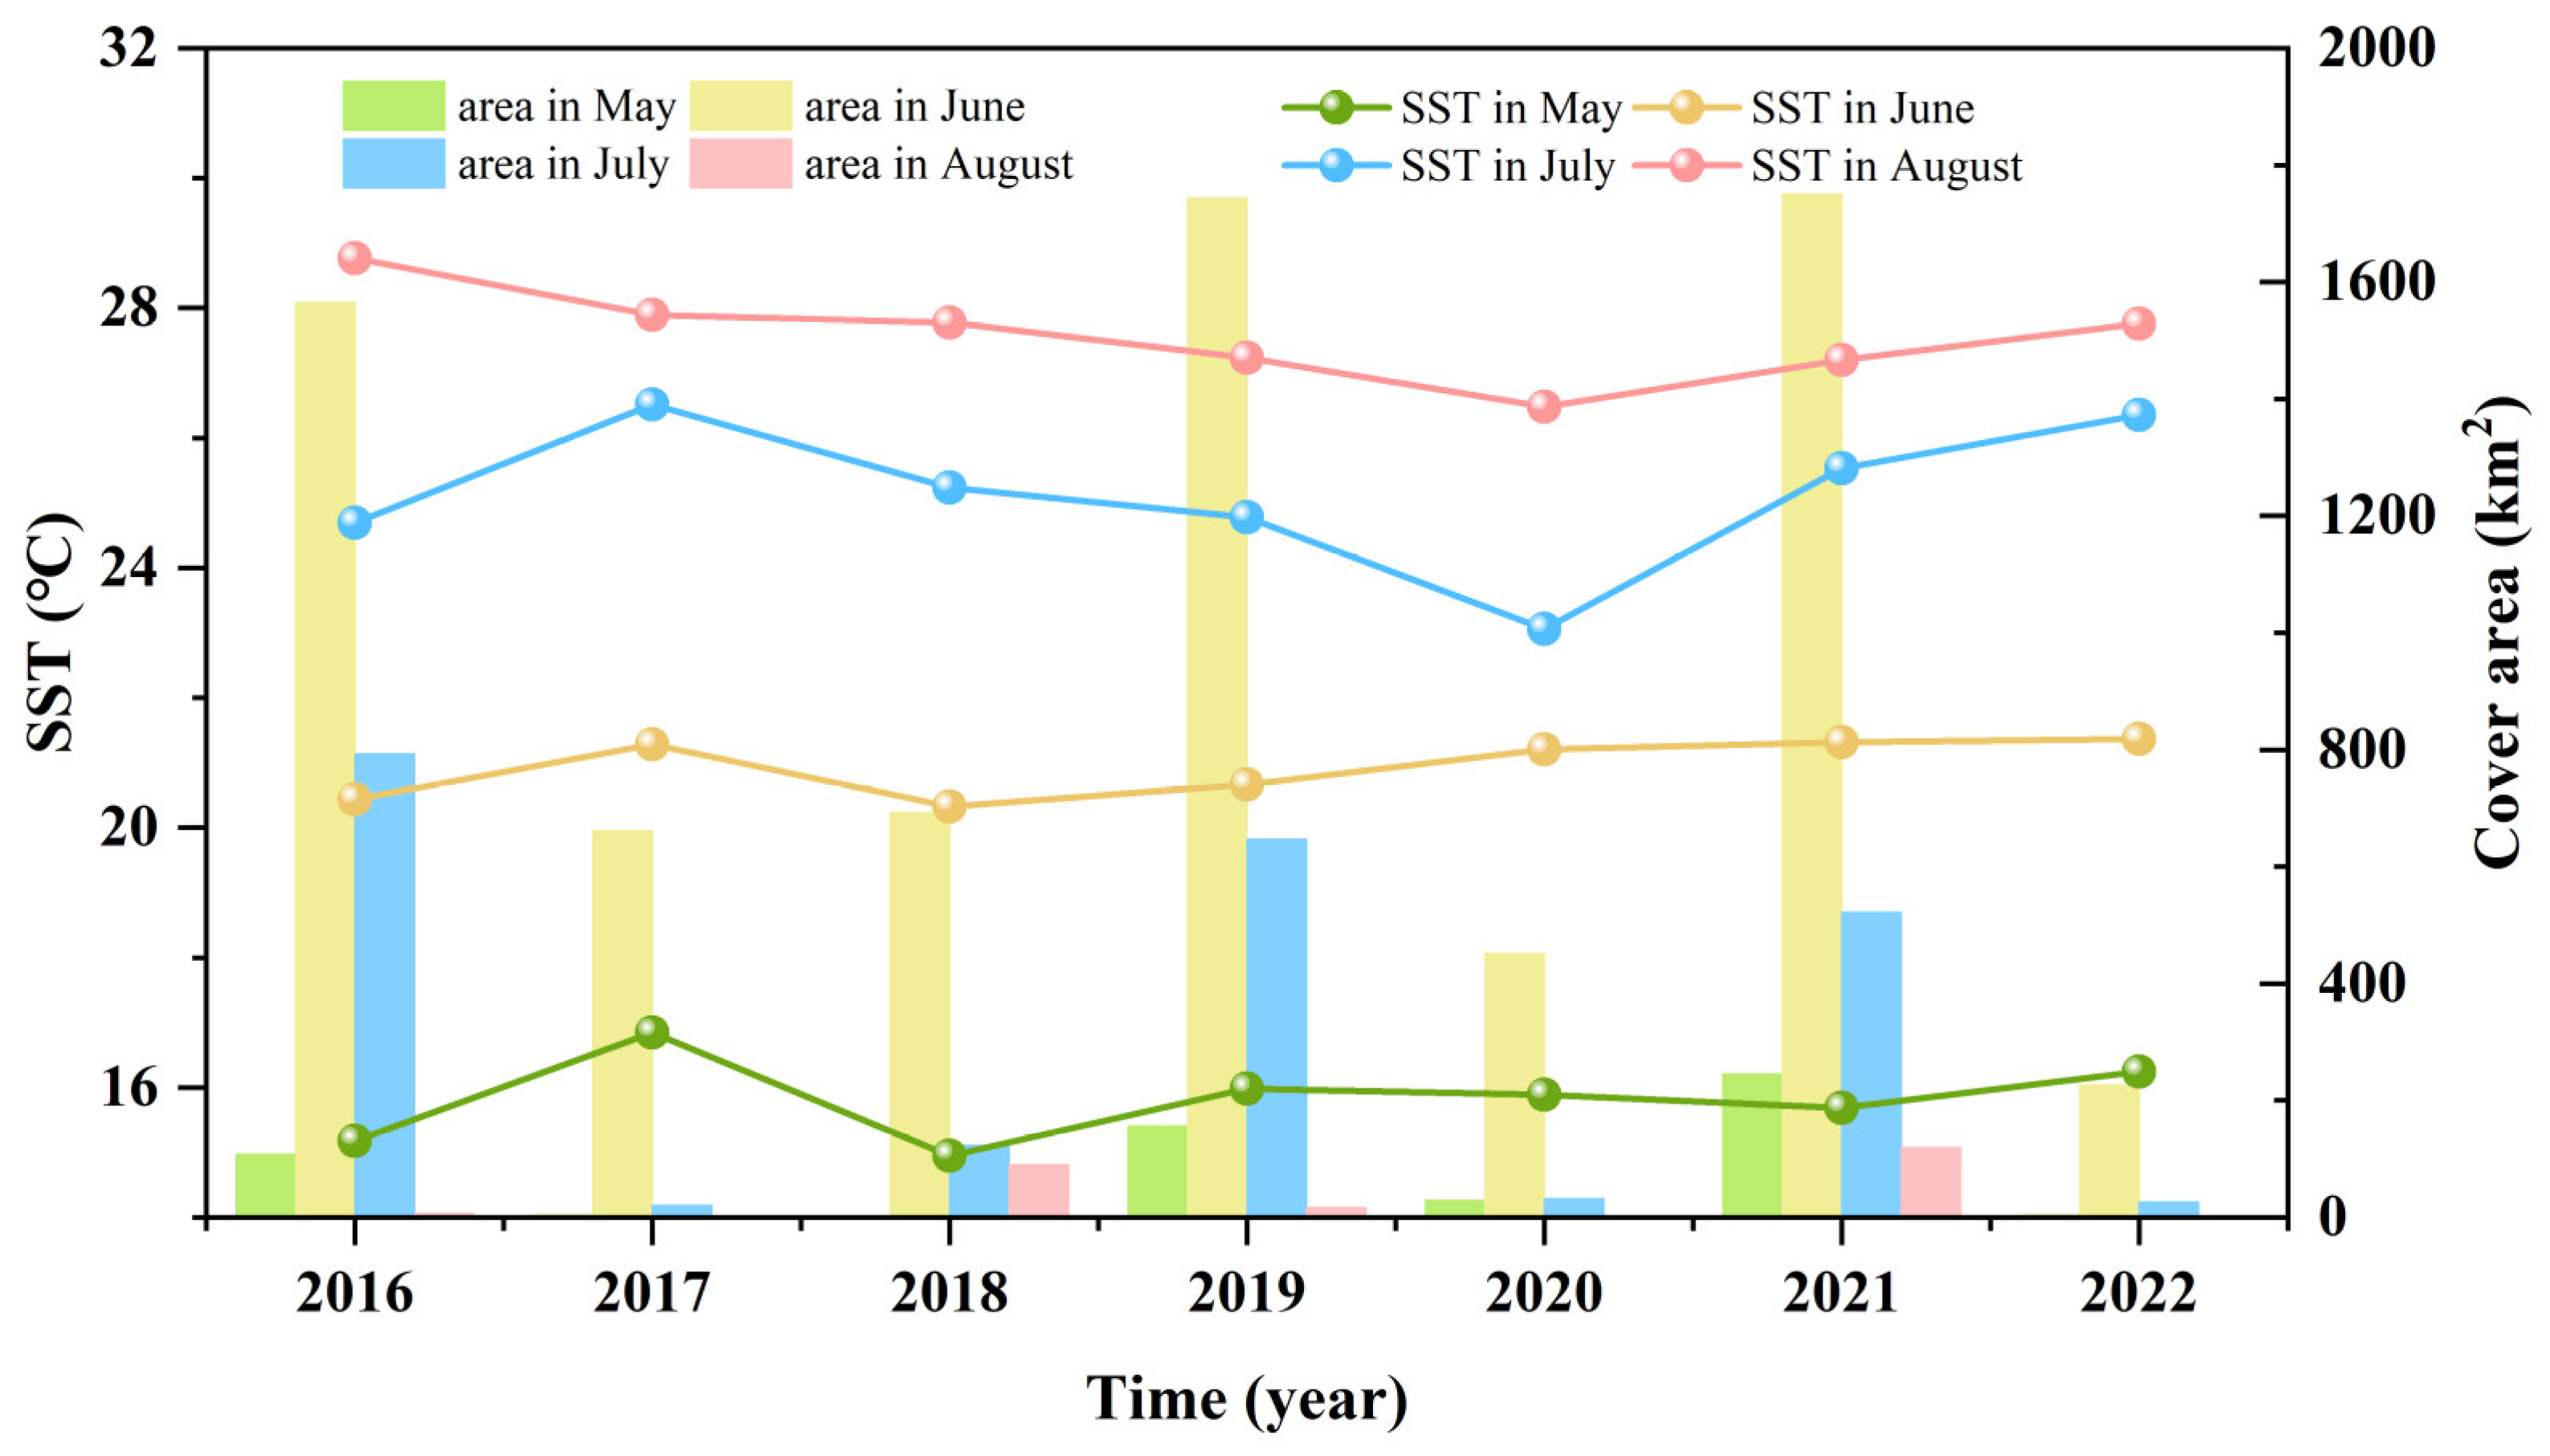
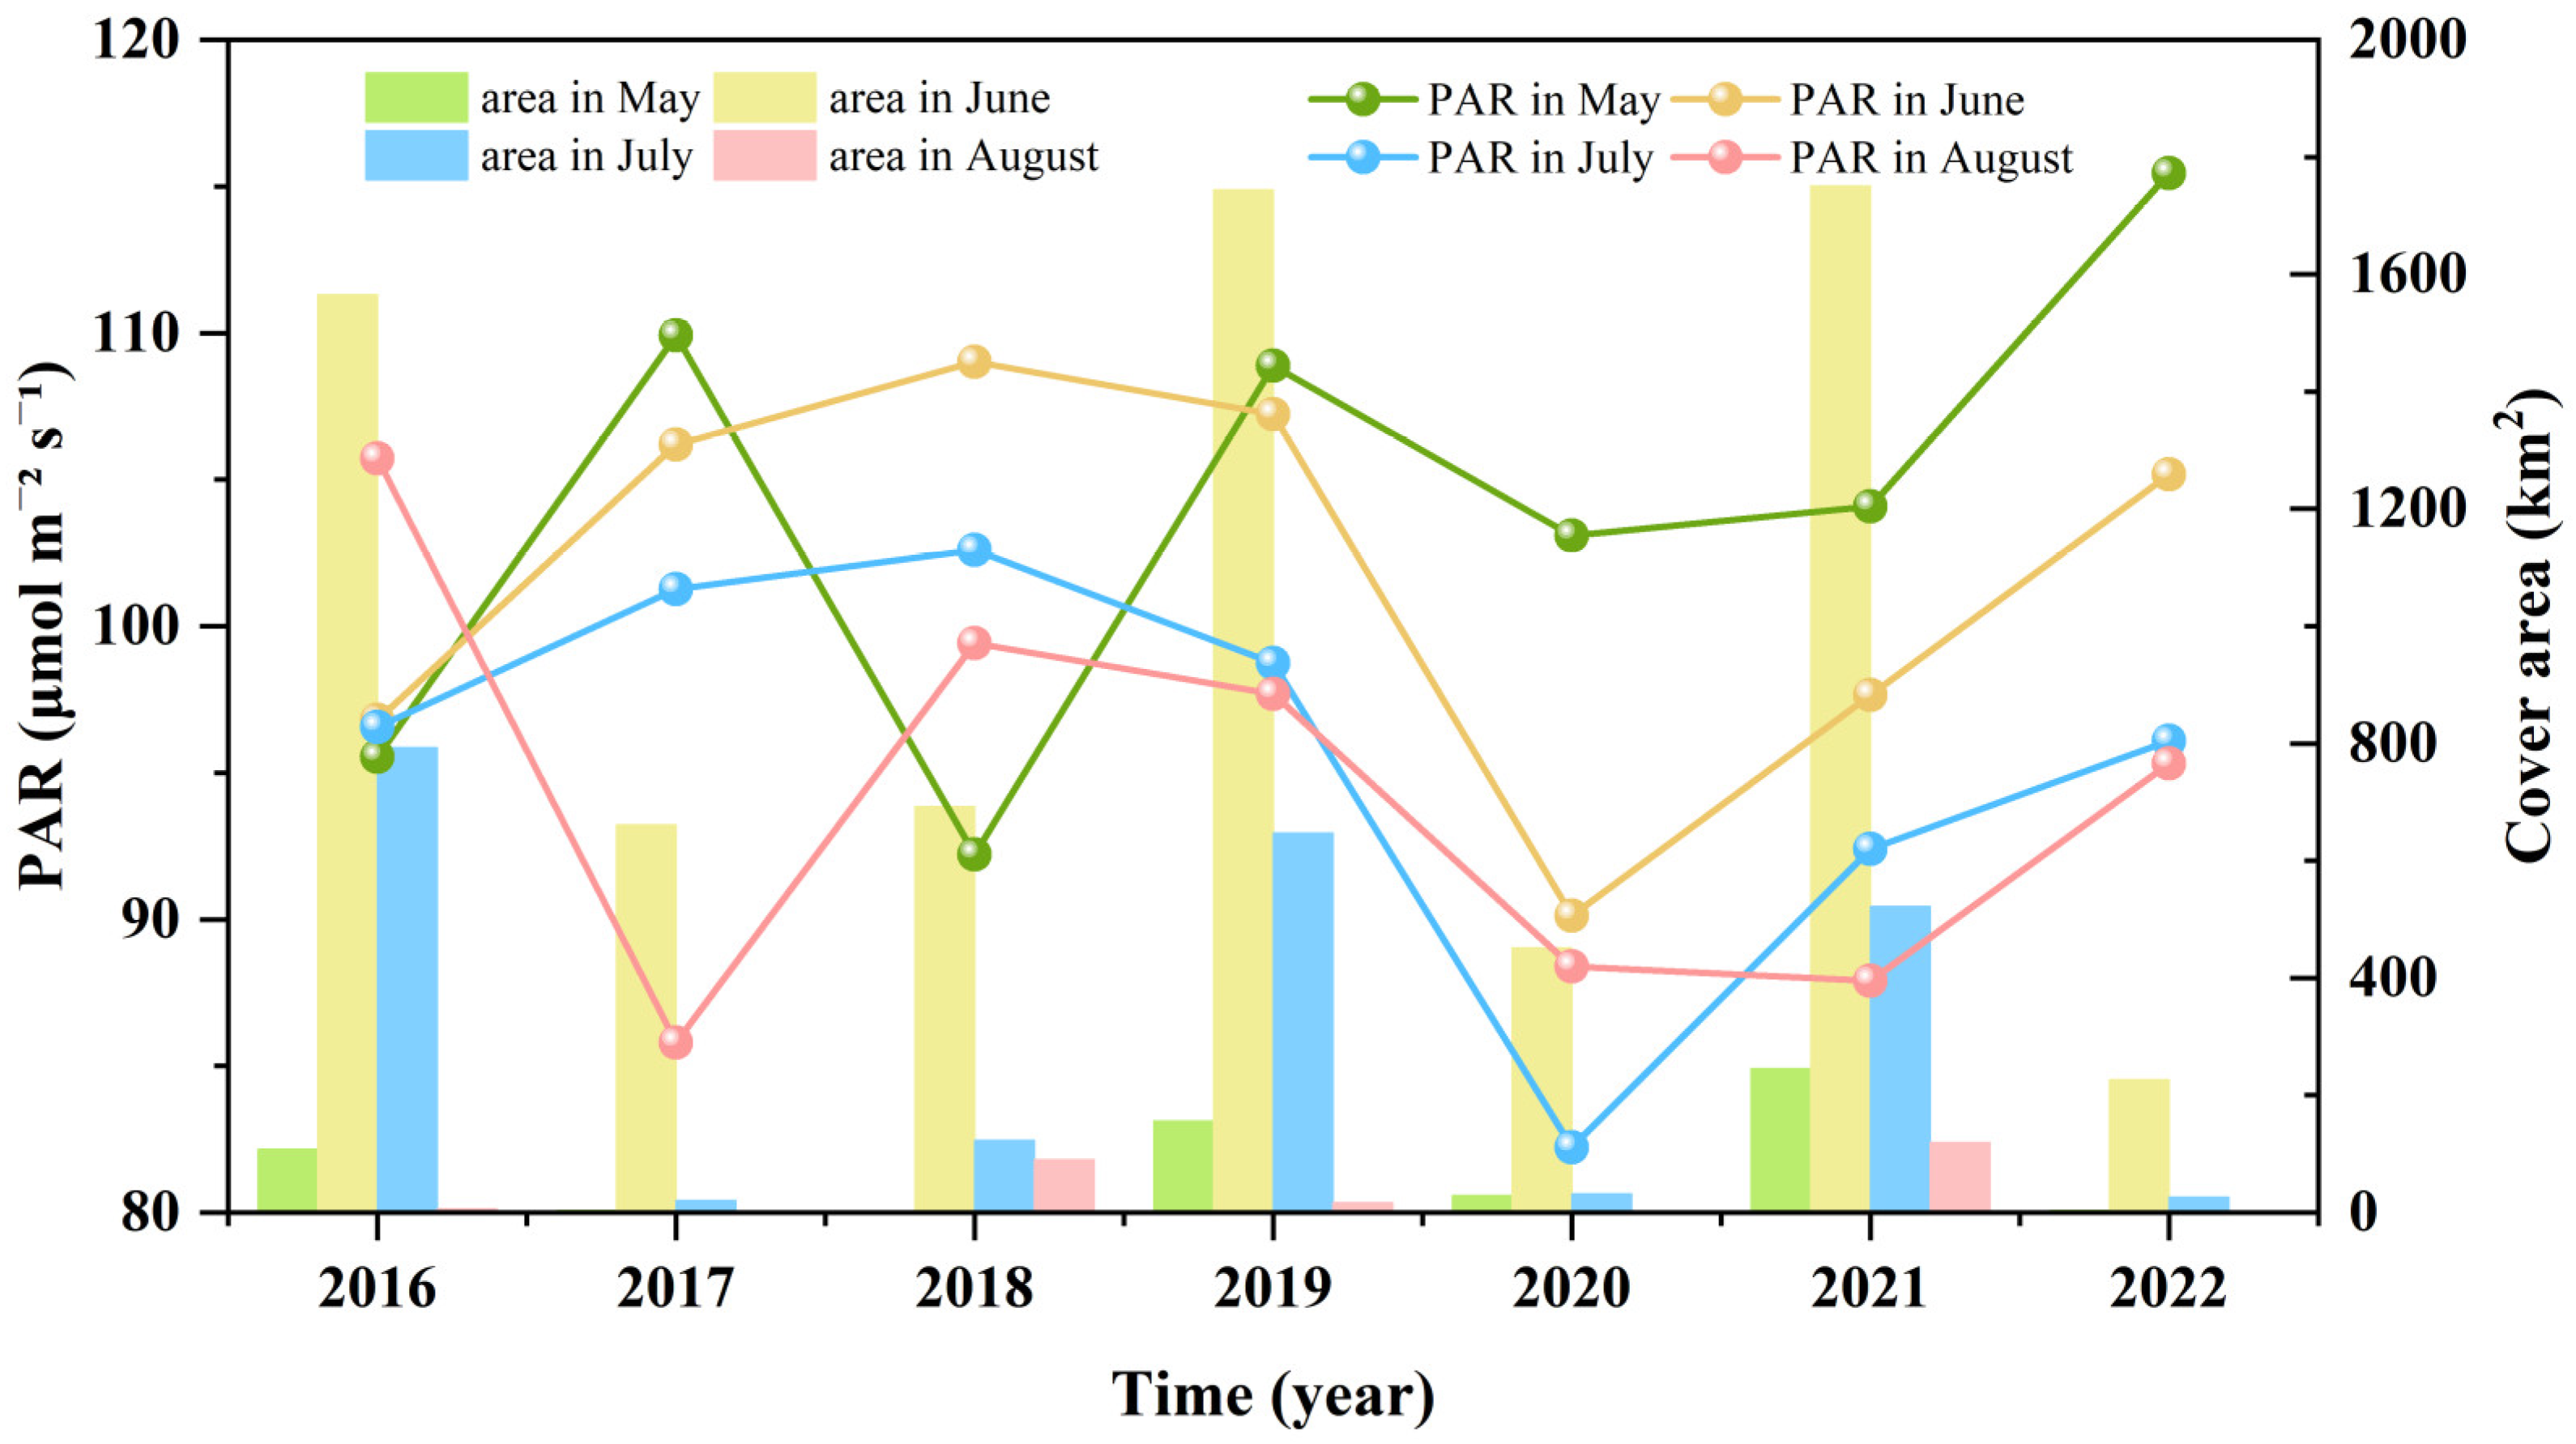
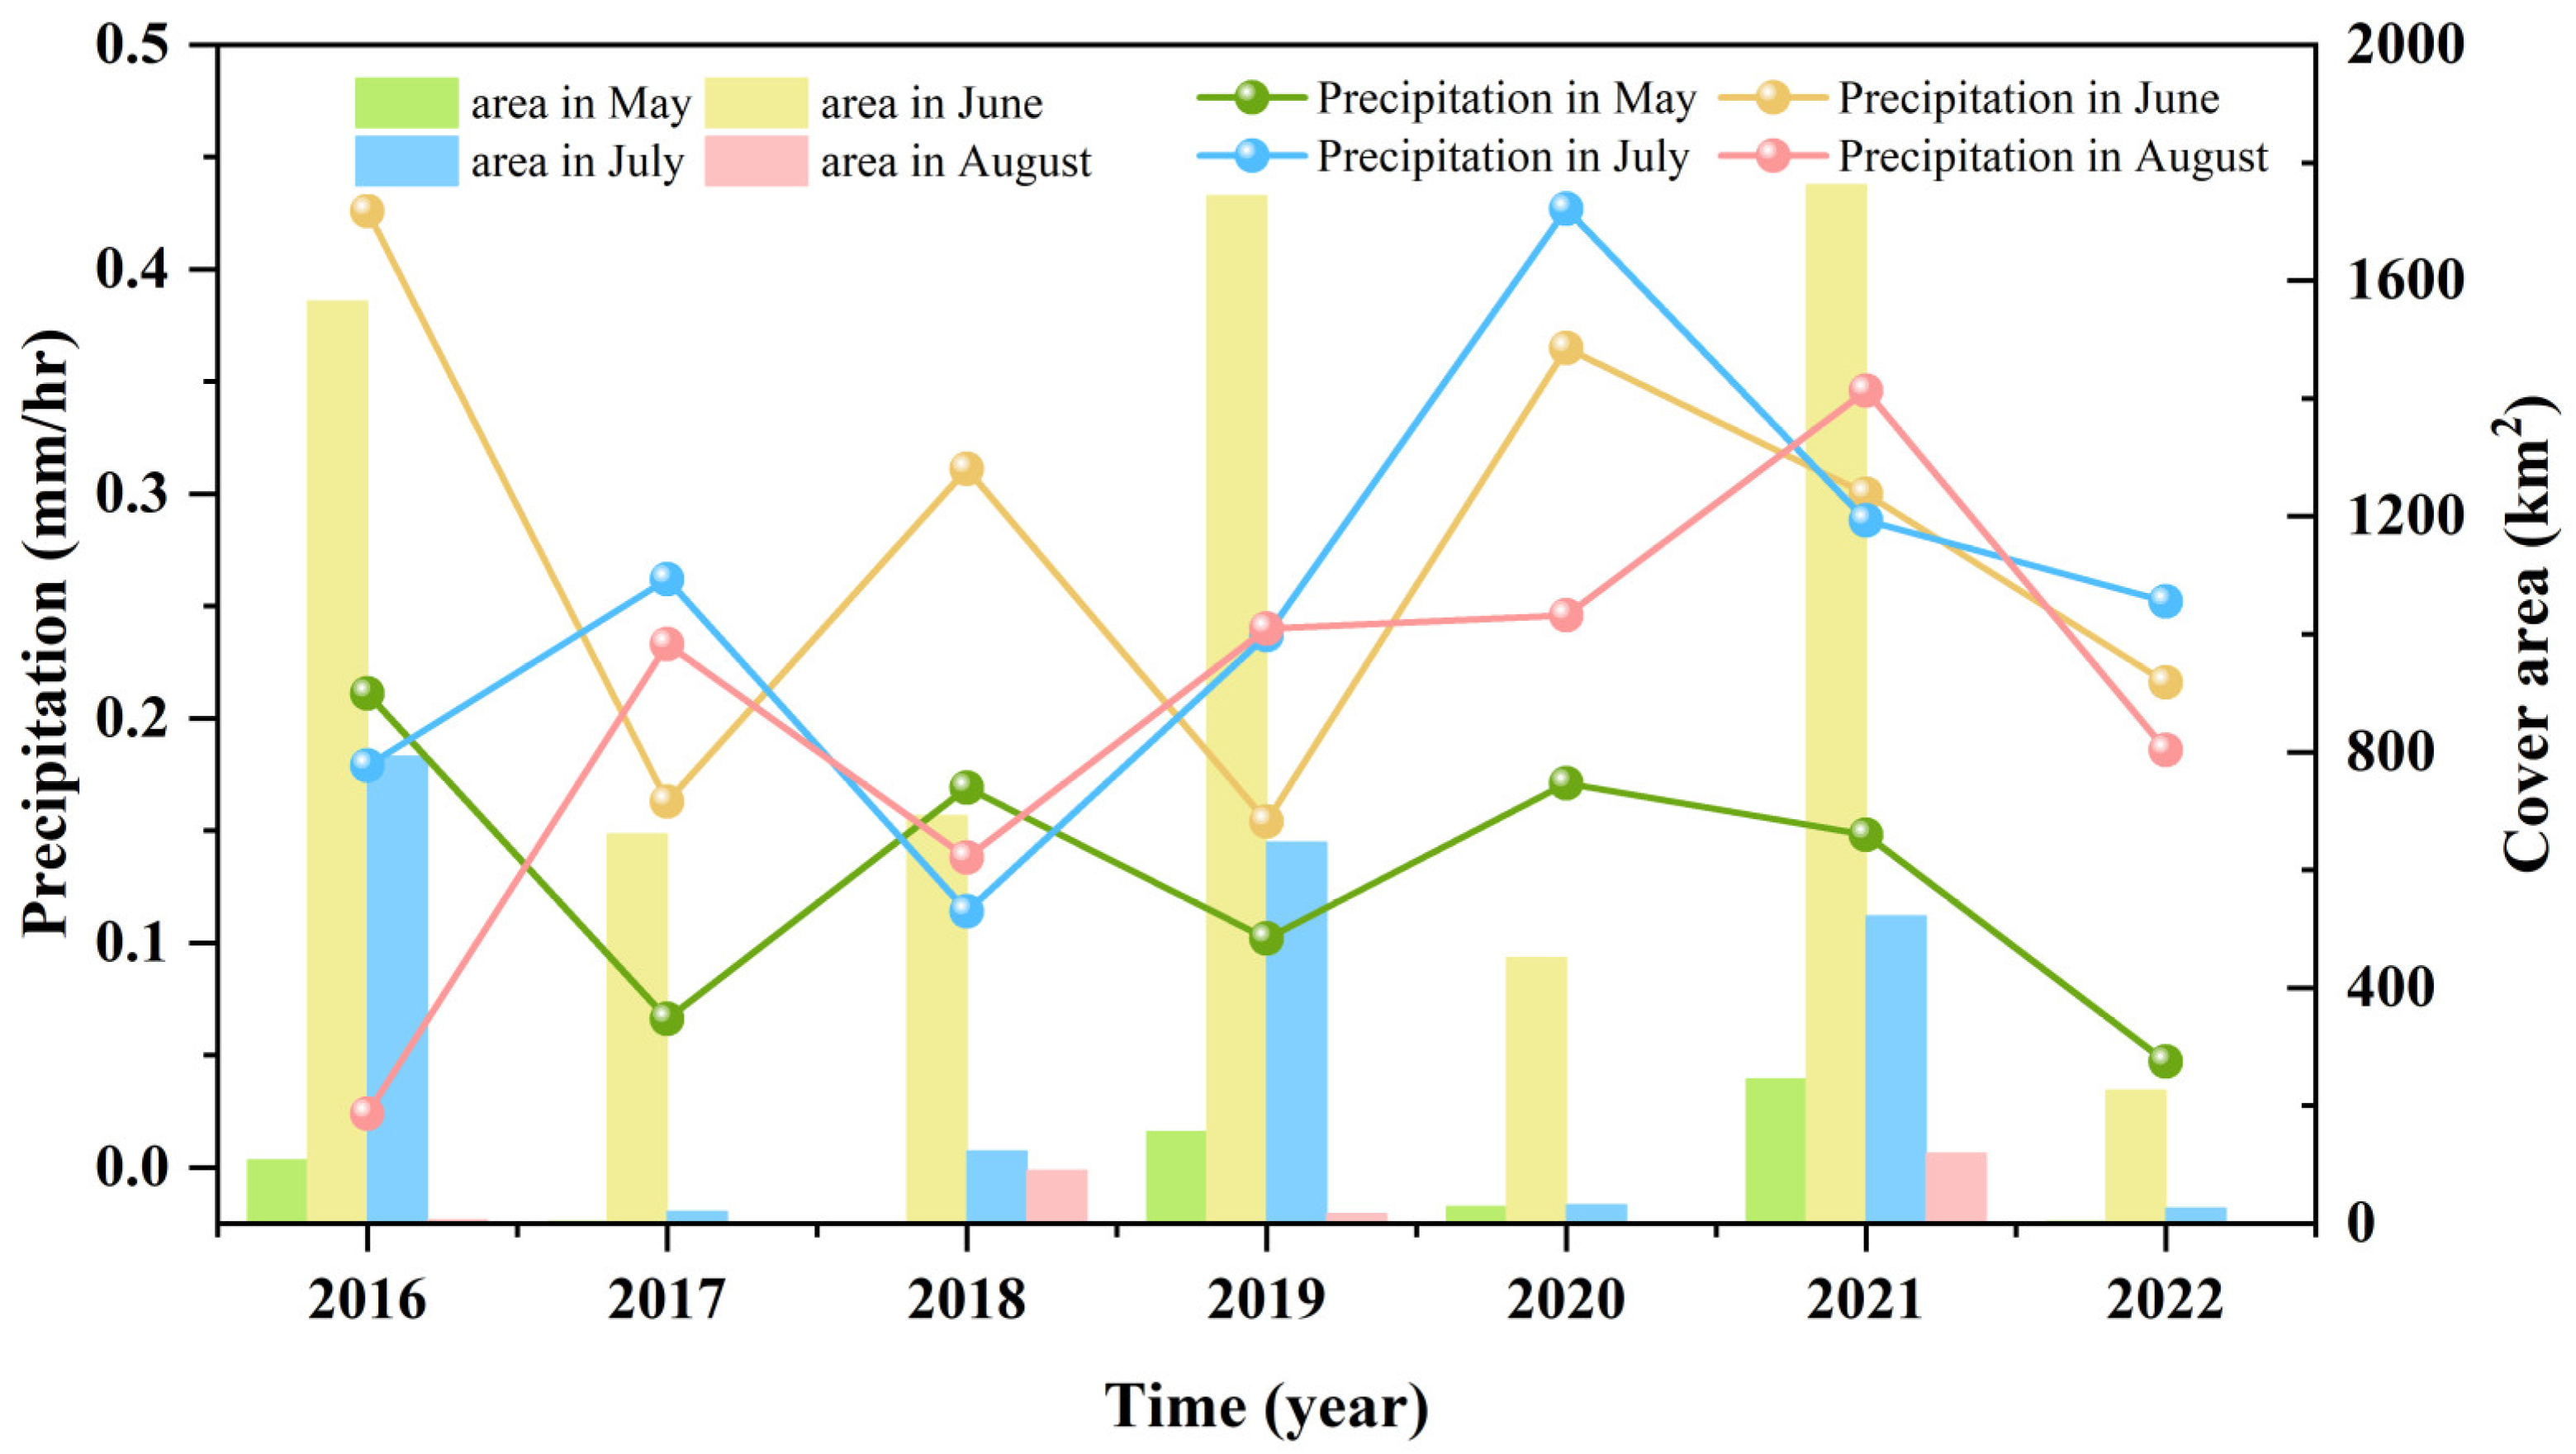
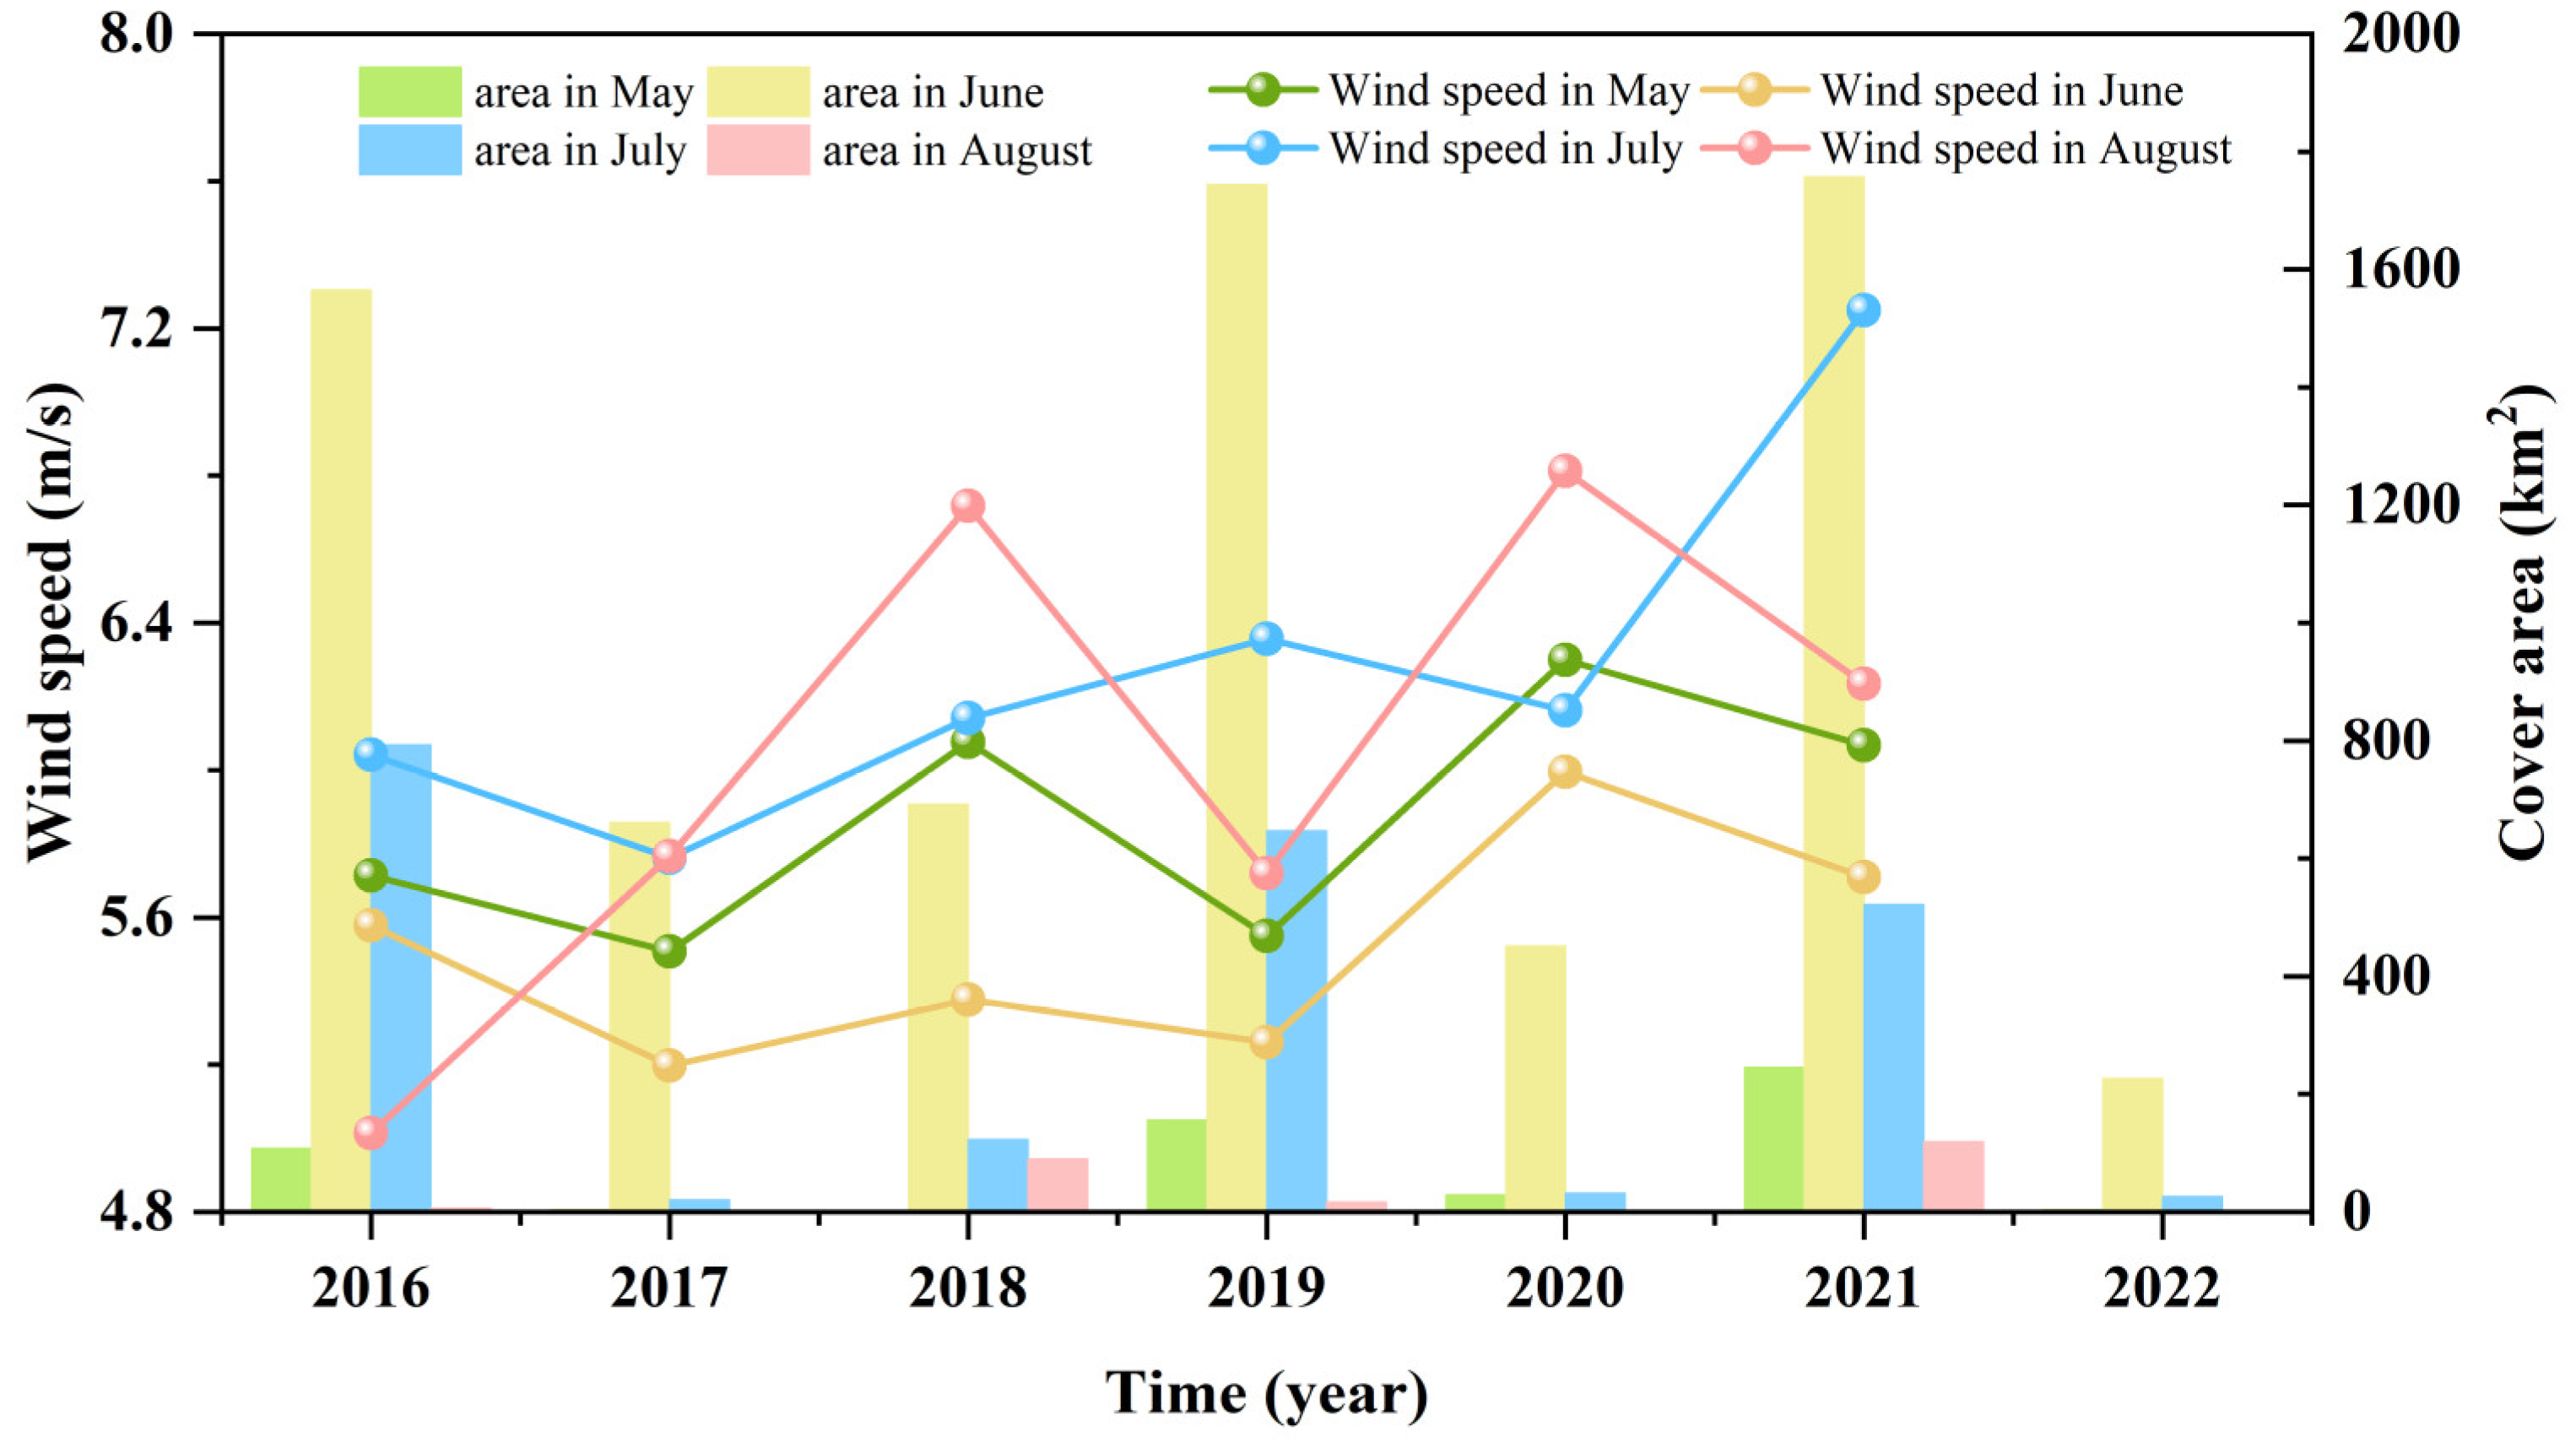
3.3. Fluctuations in Environmental Factors during Green Tide Events in the SYS

Appropriate SST provides an environment conducive to U. prolifera growth. Abnormally low or high temperatures might restrict physiological processes such as enzyme activity and photosynthetic rates, impacting nutrient absorption, utilization, and growth of U. prolifera. From 2016 to 2022, the overall variation in SST in the SYS was relatively minor, displaying a relatively stable trend (Figure 5). SST gradually increased from May to August, with the highest SST typically occurring in August and the lowest in May. During the growth months of U. prolifera (May and June), SST in the SYS ranged from approximately 15 to 21 °C, while during the decline months (July and August), SST ranged from around 24 to 28 °C. The interannual variability in monthly average SST appears relatively inconspicuous compared to the interannual variability in U. prolifera area, depending on annual seasonal patterns and thermodynamic processes. Analyzing the temporal trends of the U. prolifera area and SST, the area’s growth rate seems to be influenced by SST. For instance, the significant increase in the U. prolifera area in June 2016 correlates with relatively lower SST, possibly due to the sustained suitability of SST for U. prolifera growth in May and June of that year. Similarly, in years of large-scale U. prolifera outbreaks like 2019 and 2021, the slower area reduction rate in July and August is closely associated with the lower inhibitory SST during the corresponding months. However, analyzing the relationship between the two, we found that the correlation between SST and U. prolifera area is insignificant (Figure 6). Indicating the presence of other factors influencing U. prolifera growth dynamics. SST is not the sole determining factor for U. prolifera outbreaks.
Photosynthesis is the process by which U. prolifera acquires energy. Optimal light conditions can enhance chlorophyll absorption and conversion, driving photosynthetic reactions [27]. As shown in Figure 7, the absolute variation in PAR values remained relatively stable annually from 2016 to 2022. Across all months, PAR values ranged between 80 and 120 µmol m−2 s−1. However, there is no specific pattern in the highs and lows of PAR values among different years, exhibiting distinct trends. For instance, in 2016, the highest average monthly PAR from May to August occurred in August, while in 2022, the lowest monthly average PAR for August and the highest value for May were observed. This variability might be associated with monthly weather patterns. Generally, in most years, PAR gradually decreases from May to August. In years like 2017, 2019, and 2021, PAR in May and June significantly exceeded that in July and August, consistent with the growth rate of U. prolifera area. In 2020, PAR in the study area remained generally low, corresponding to a noticeably smaller U. prolifera area that year. However, in 2022, the PAR in the SYS for May to August was comparatively high. The May average PAR exceeded 115, reaching a nearly seven-year peak. Despite this, the U. prolifera area in the SYS was near a seven-year low this year. It could be attributed to photoinhibition due to prolonged exposure of the germination phase of U. prolifera to excessively high light conditions. Based on the results of the correlation analysis between the two, it is evident that PAR has a relatively weak influence on the U. prolifera area, showing no significant correlation (Figure 8). Therefore, it cannot be considered a determining factor. Other environmental factors likely exert a more substantial influence.
The exact environmental factors and mechanisms contributing to the explosive proliferation of U. prolifera, leading to the formation of green tides, have yet to be definitively established. However, the eutrophication of seawater is one of the factors that currently garners relatively consistent recognition. Atmospheric precipitation carries terrestrial nutrients (nitrogen, phosphorus, potassium) into the seawater via surface runoff, indirectly resulting in seawater eutrophication. Due to various factors, such as weather systems and monsoons, considerable variations in annual precipitation exist. During the germination phase of U. prolifera in May, surface runoff transports a substantial amount of nutrients from the land to the northern Jiangsu Shoal region, providing ample nourishment for early-stage U. prolifera growth. Higher levels of precipitation tend to promote U. prolifera outbreaks. As depicted in Figure 9, compared to other years, May and June in 2016 and 2021 experienced relatively high precipitation levels. Notably, in these years, there were extensive U. prolifera outbreaks in the SYS in June. In contrast, precipitation in the SYS remained consistently low from May to August of 2017 and 2022. These years, they have also exhibited smaller U. prolifera coverage and shorter durations. The correlation analysis between precipitation and the U. prolifera area reveals that in May and June, both show a weak positive correlation (Figure 10). In July, a weak negative correlation is observed, possibly due to a significant amount of precipitation during the U. prolifera decline period, which accelerates sedimentation (in August, most area values are 0, with limited significance for reference). There is a certain connection between precipitation and the U. prolifera area. However, the correlation is not strong enough to be considered a determining factor for the outbreak of U. prolifera.
Windspeed is a significant factor influencing marine hydrodynamics. As depicted in Figure 11, May of both 2018 and 2020 witnessed higher windspeeds. Intense winds can induce substantial wave agitation in the seawater, potentially affecting the initial adhesion and stability of U. prolifera. During the growth and decline periods of U. prolifera, a certain positive correlation exists between windspeed in July and the U. prolifera area (Figure 12). This suggests that higher windspeeds might impact the transport of elements like nitrogen and phosphorus in the seawater, consequently influencing the growth and distribution of U. prolifera. From Figure 11, we observe that the size of the U. prolifera area is not fixed in years and months with consistent windspeeds. Windspeed alone cannot exert a definitive influence on U. prolifera coverage. Instead, it needs to be combined with other influencing factors to elicit a positive or negative effect on the growth of U. prolifera.

3.4. Human Footprint Index Dynamics in the SYS

A higher human footprint index (HFI) is often associated with increased land development and utilization. Urbanization and industrialization in coastal regions can lead to input pollutants and nutrients (such as nitrogen and phosphorus) into water bodies, resulting in eutrophication and algal blooms [49]. Additionally, areas with higher HFI values might face overfishing and unsustainable fishing practices, potentially disrupting the food chain structure in water bodies and thereby impacting the growth conditions of U. prolifera as planktonic plants. Analysis of the U. prolifera area in the SYS and the HFI values of Shandong and Jiangsu provinces reveals potential relationships between these variables (Figure 13). From 2016 to 2021, Shandong and Jiangsu provinces exhibited an increasing trend in HFI values, with relatively consistent patterns. The HFI value for Shandong consistently exceeded that of Jiangsu, while Jiangsu generally maintained lower HFI values throughout the study period, suggesting less pronounced anthropogenic environmental changes. Both provinces experienced relatively lower HFI values in 2017 and 2018, reaching a peak in 2019. After 2020, HFI values might have been influenced by socio-health factors, leading to a decline. The correlation analysis between HFI and the U. prolifera area reveals a relatively strong positive correlation between the U. prolifera area and the HFI in Jiangsu Province and Shandong Province, with a significant relationship noted between the U. prolifera area and the HFI in Jiangsu Province (Figure 14). This could be attributed to the fact that the germination and outbreak phases of U. prolifera primarily occur in the southern waters of Jiangsu and Shandong, making the relationship more closely tied to Jiangsu Province.

4. Discussion

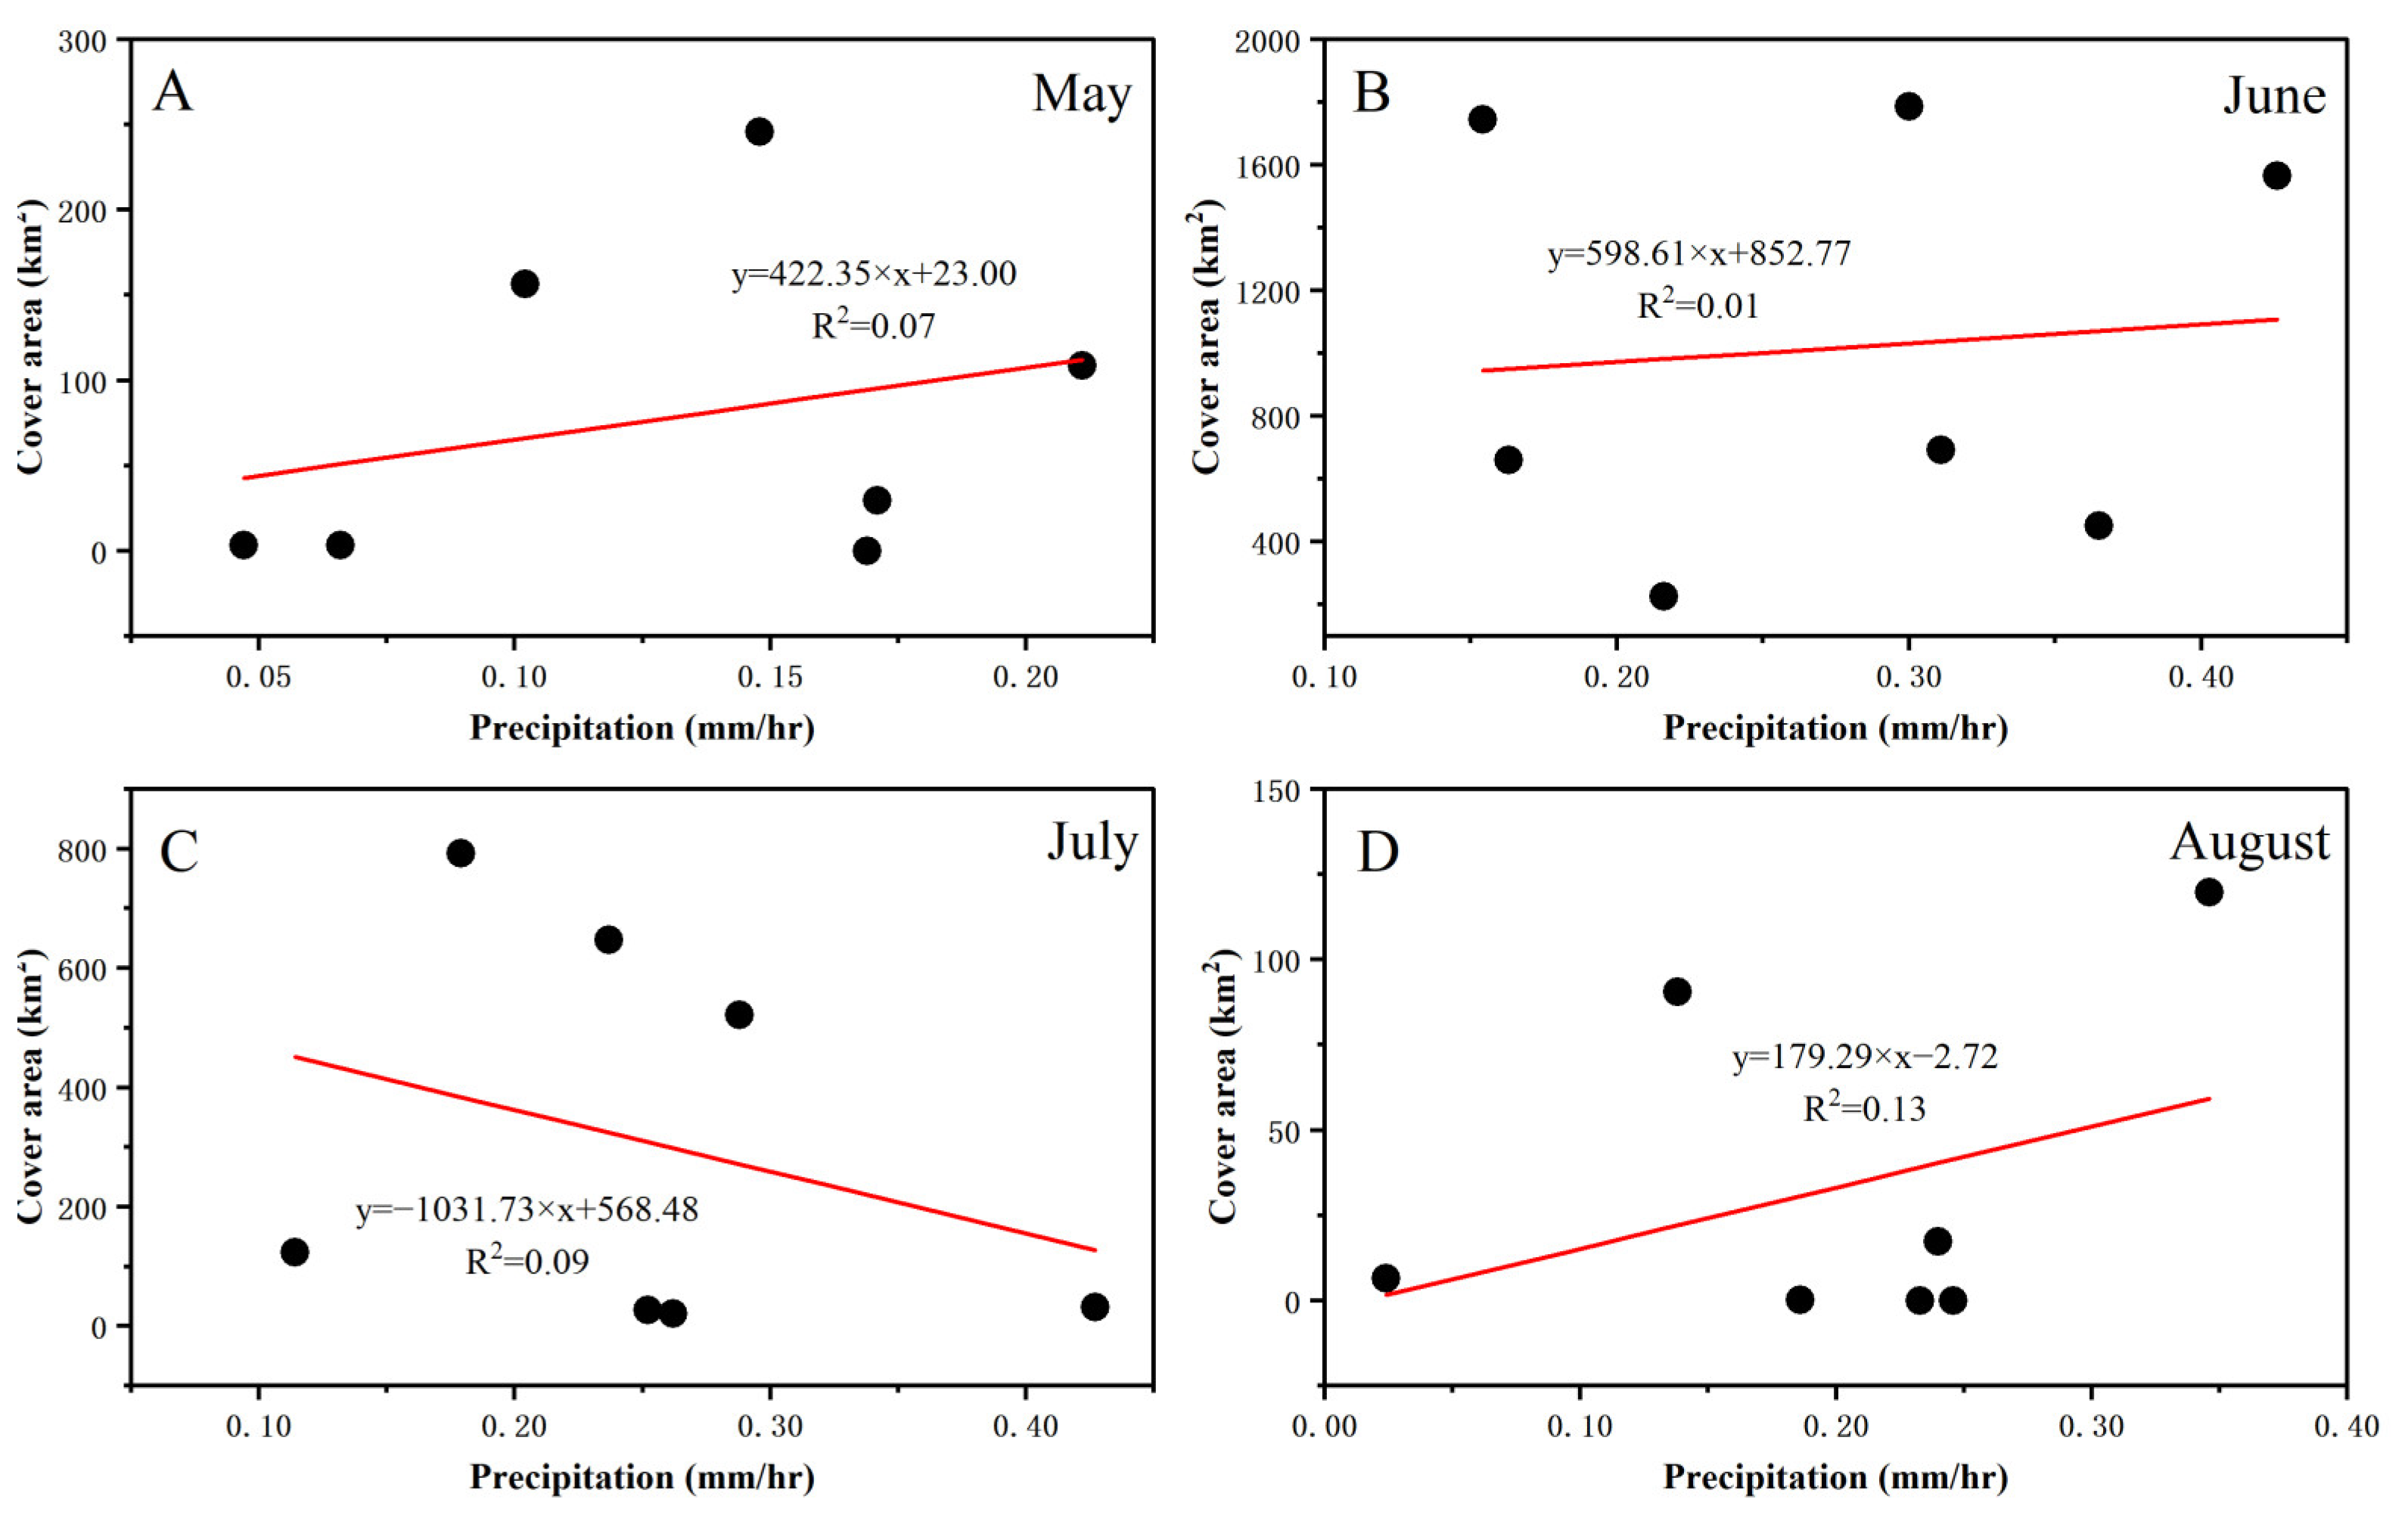
4.1. Analysis of the Contribution of Impact Factors to the Outbreak of U. prolifera in the SYS

In this study, factors such as SST, PAR, precipitation, windspeed, recycle time of cultivation rafts, and HFI appear to interweave and influence the scale and duration of U. prolifera outbreaks in different years. However, the roles of these factors may be modulated by other environmental variables, and the extent of their impact on the U. prolifera area remains to be determined. Further research is needed to unveil these intricate interrelationships. We visualized the RDA results as a Triplot graph based on six categories of influencing factors and the U. prolifera area (Figure 15). In the Triplot graph, each variable is often represented by an arrow or vector, where the vector’s direction and length indicate each variable’s contribution and importance. Longer arrows signify a more substantial explanatory power of the variable (influencing factor) on the sample (U. prolifera area) [43]. According to Figure 15, HFI and precipitation exhibit more substantial explanatory power over U. prolifera area, followed by SST and windspeed. PAR and recycle time of cultivation rafts demonstrate relatively weaker explanatory power. The distribution and clustering of data points reflect differences and similarities among samples in the redundancy space. Notably, the data points of the U. prolifera area in Figure 15 are noticeably clustered, indicating that most sample data share similarities regarding environmental factors or features or experiences similar influences. However, the U. prolifera area data for June 2016, 2019, and 2021 show scattered distribution in the Triplot graph. It suggests significant disparities among these samples in the redundancy space, with substantial differences in their explanatory and response variables scores. Factors beyond the established explanatory variables likely influence these variations.
Based on the results of RDA, we employed variance partitioning analysis (VPA) to quantify the contributions of various factors. The results indicated that the six factors, including SST, precipitation, windspeed, PAR, HFI, and retrieval time of cultivation rafts, collectively explained 31.8% of the total variability in the U. prolifera area changes in the SYS. The individual explanatory contributions were 7.2%, 9.8%, 4.2%, 1.9%, 10.5%, and 2.6%, respectively, with some degree of overlap among them (Figure 16). Hence, the selected factors in this study only influence the interannual variation of the U. prolifera area to varying extents and do not play a deterministic role. The complexity of the ecosystem also results in nonlinear responses of the U. prolifera area in the SYS. This nonlinearity could stem from interactions among multiple factors and threshold effects.

4.2. Analysis of Factors Affecting Inter-Annual Variability in U. prolifera Scale

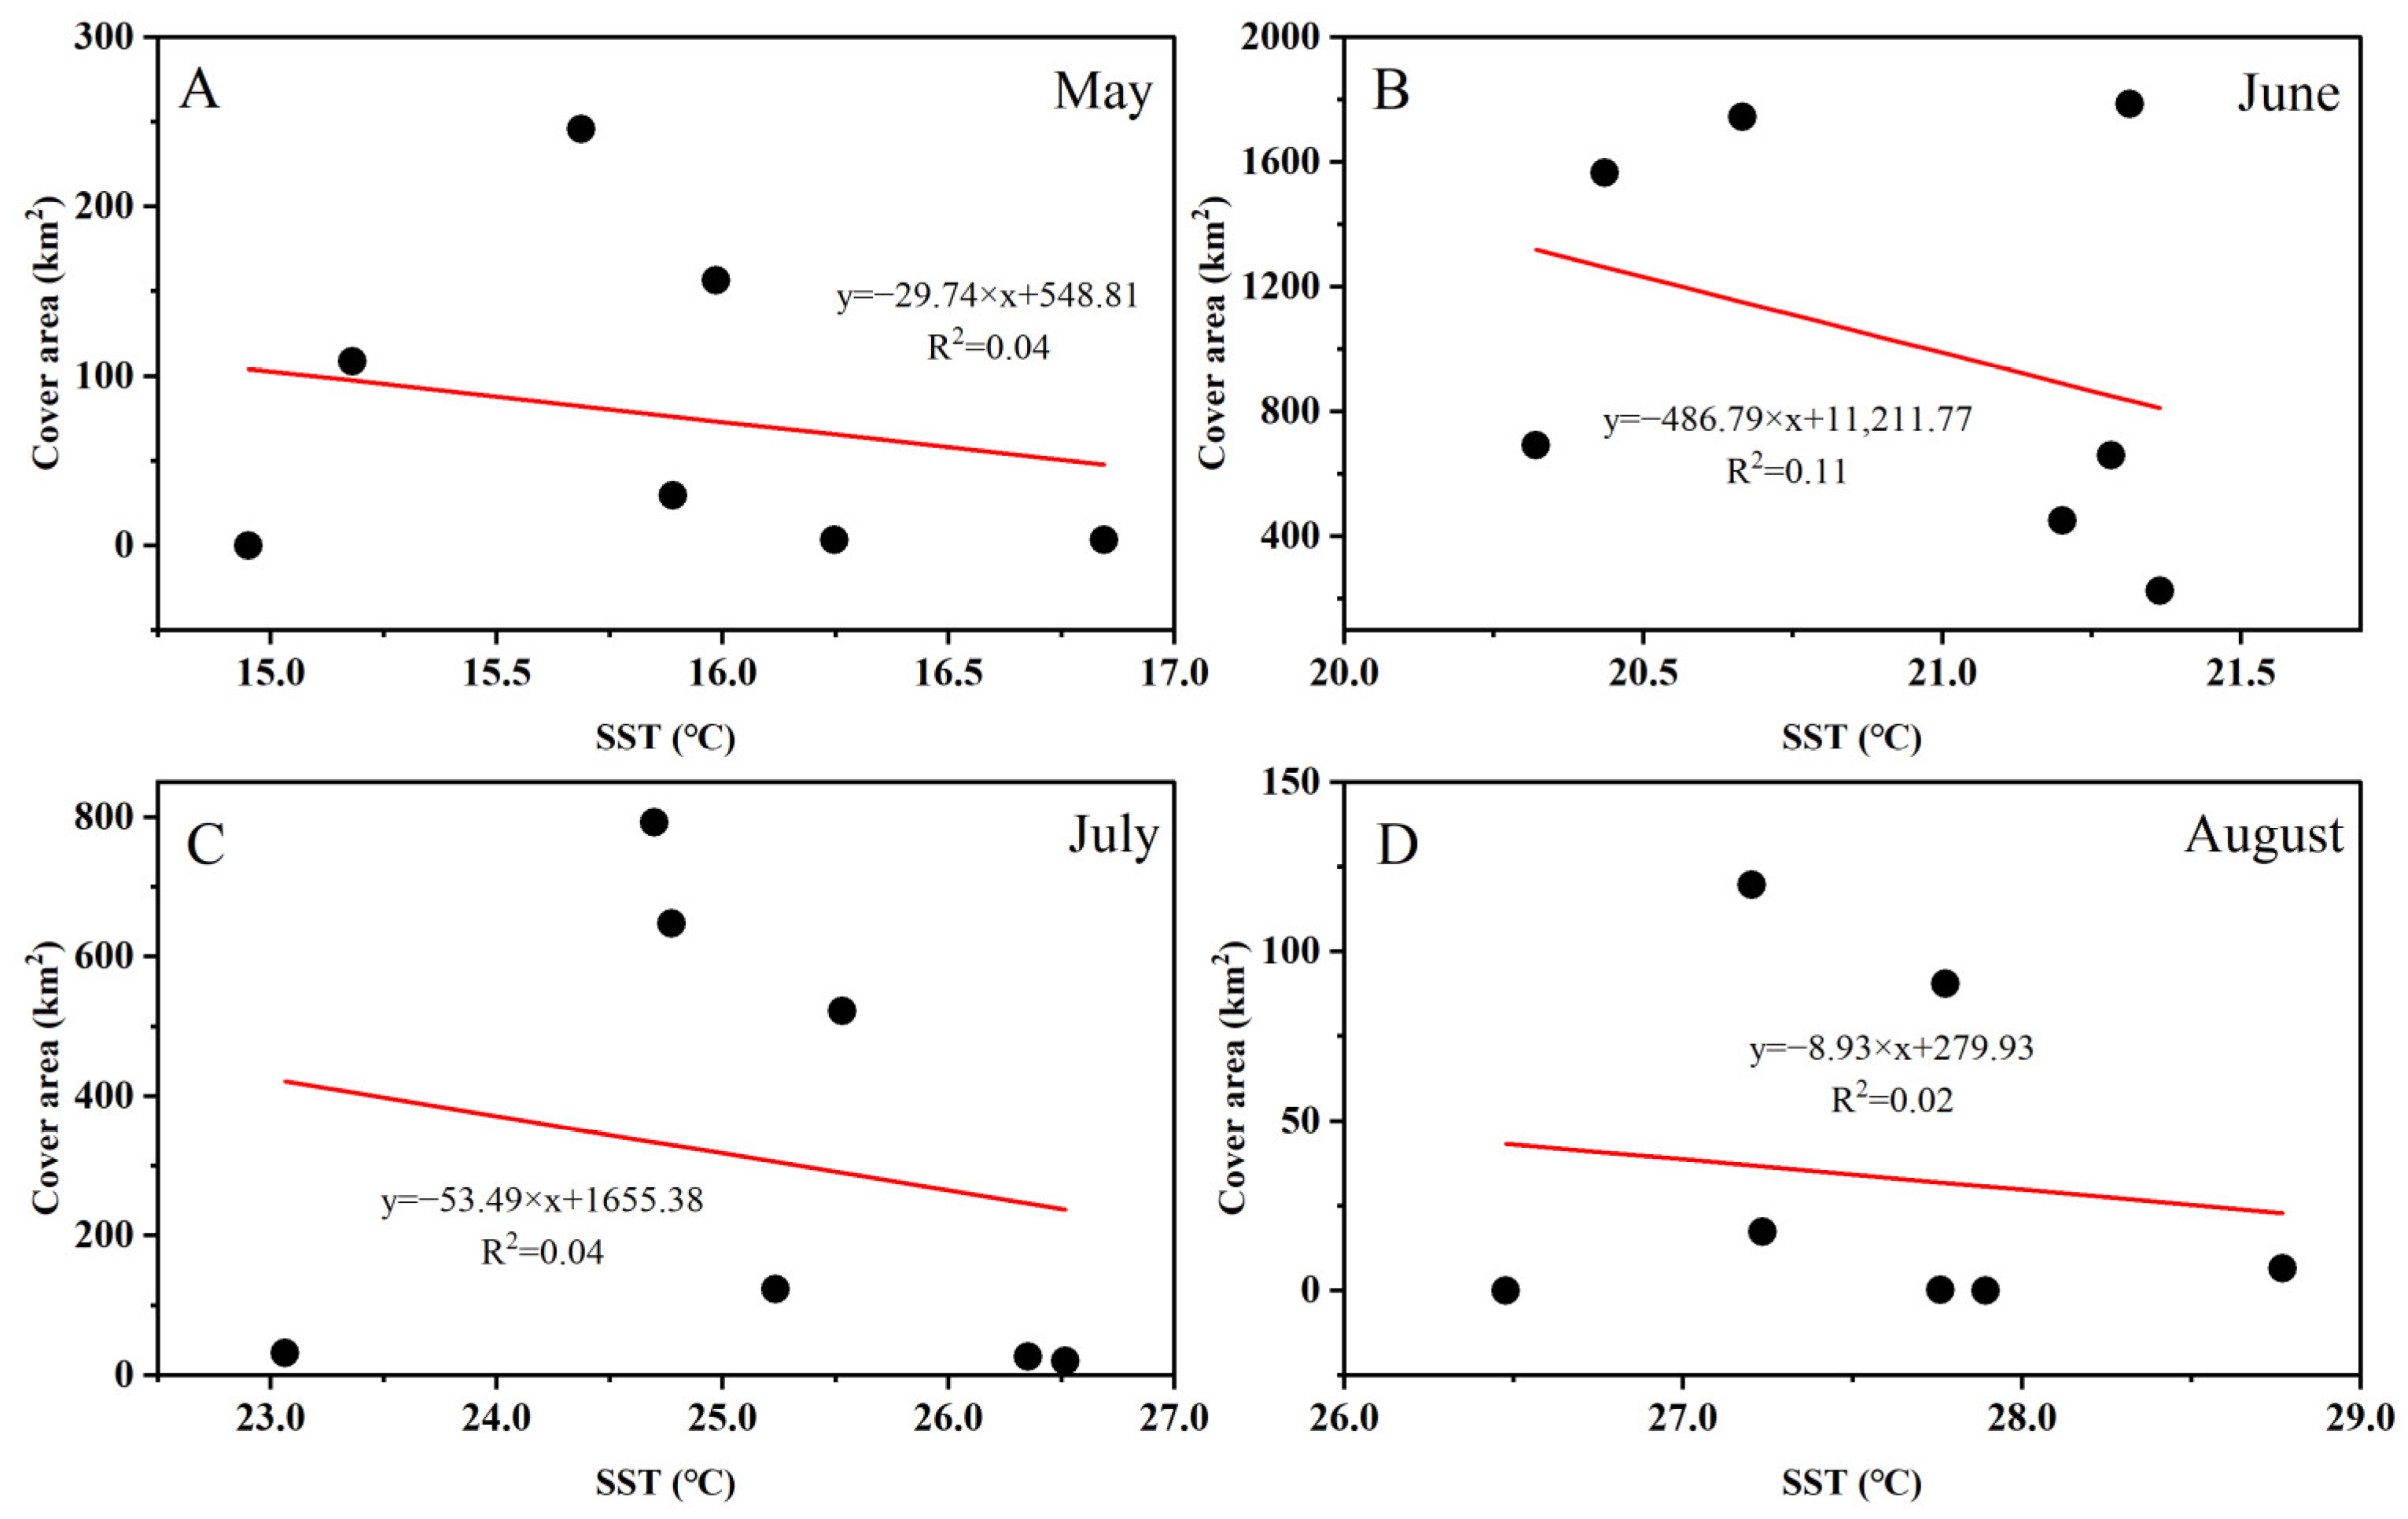
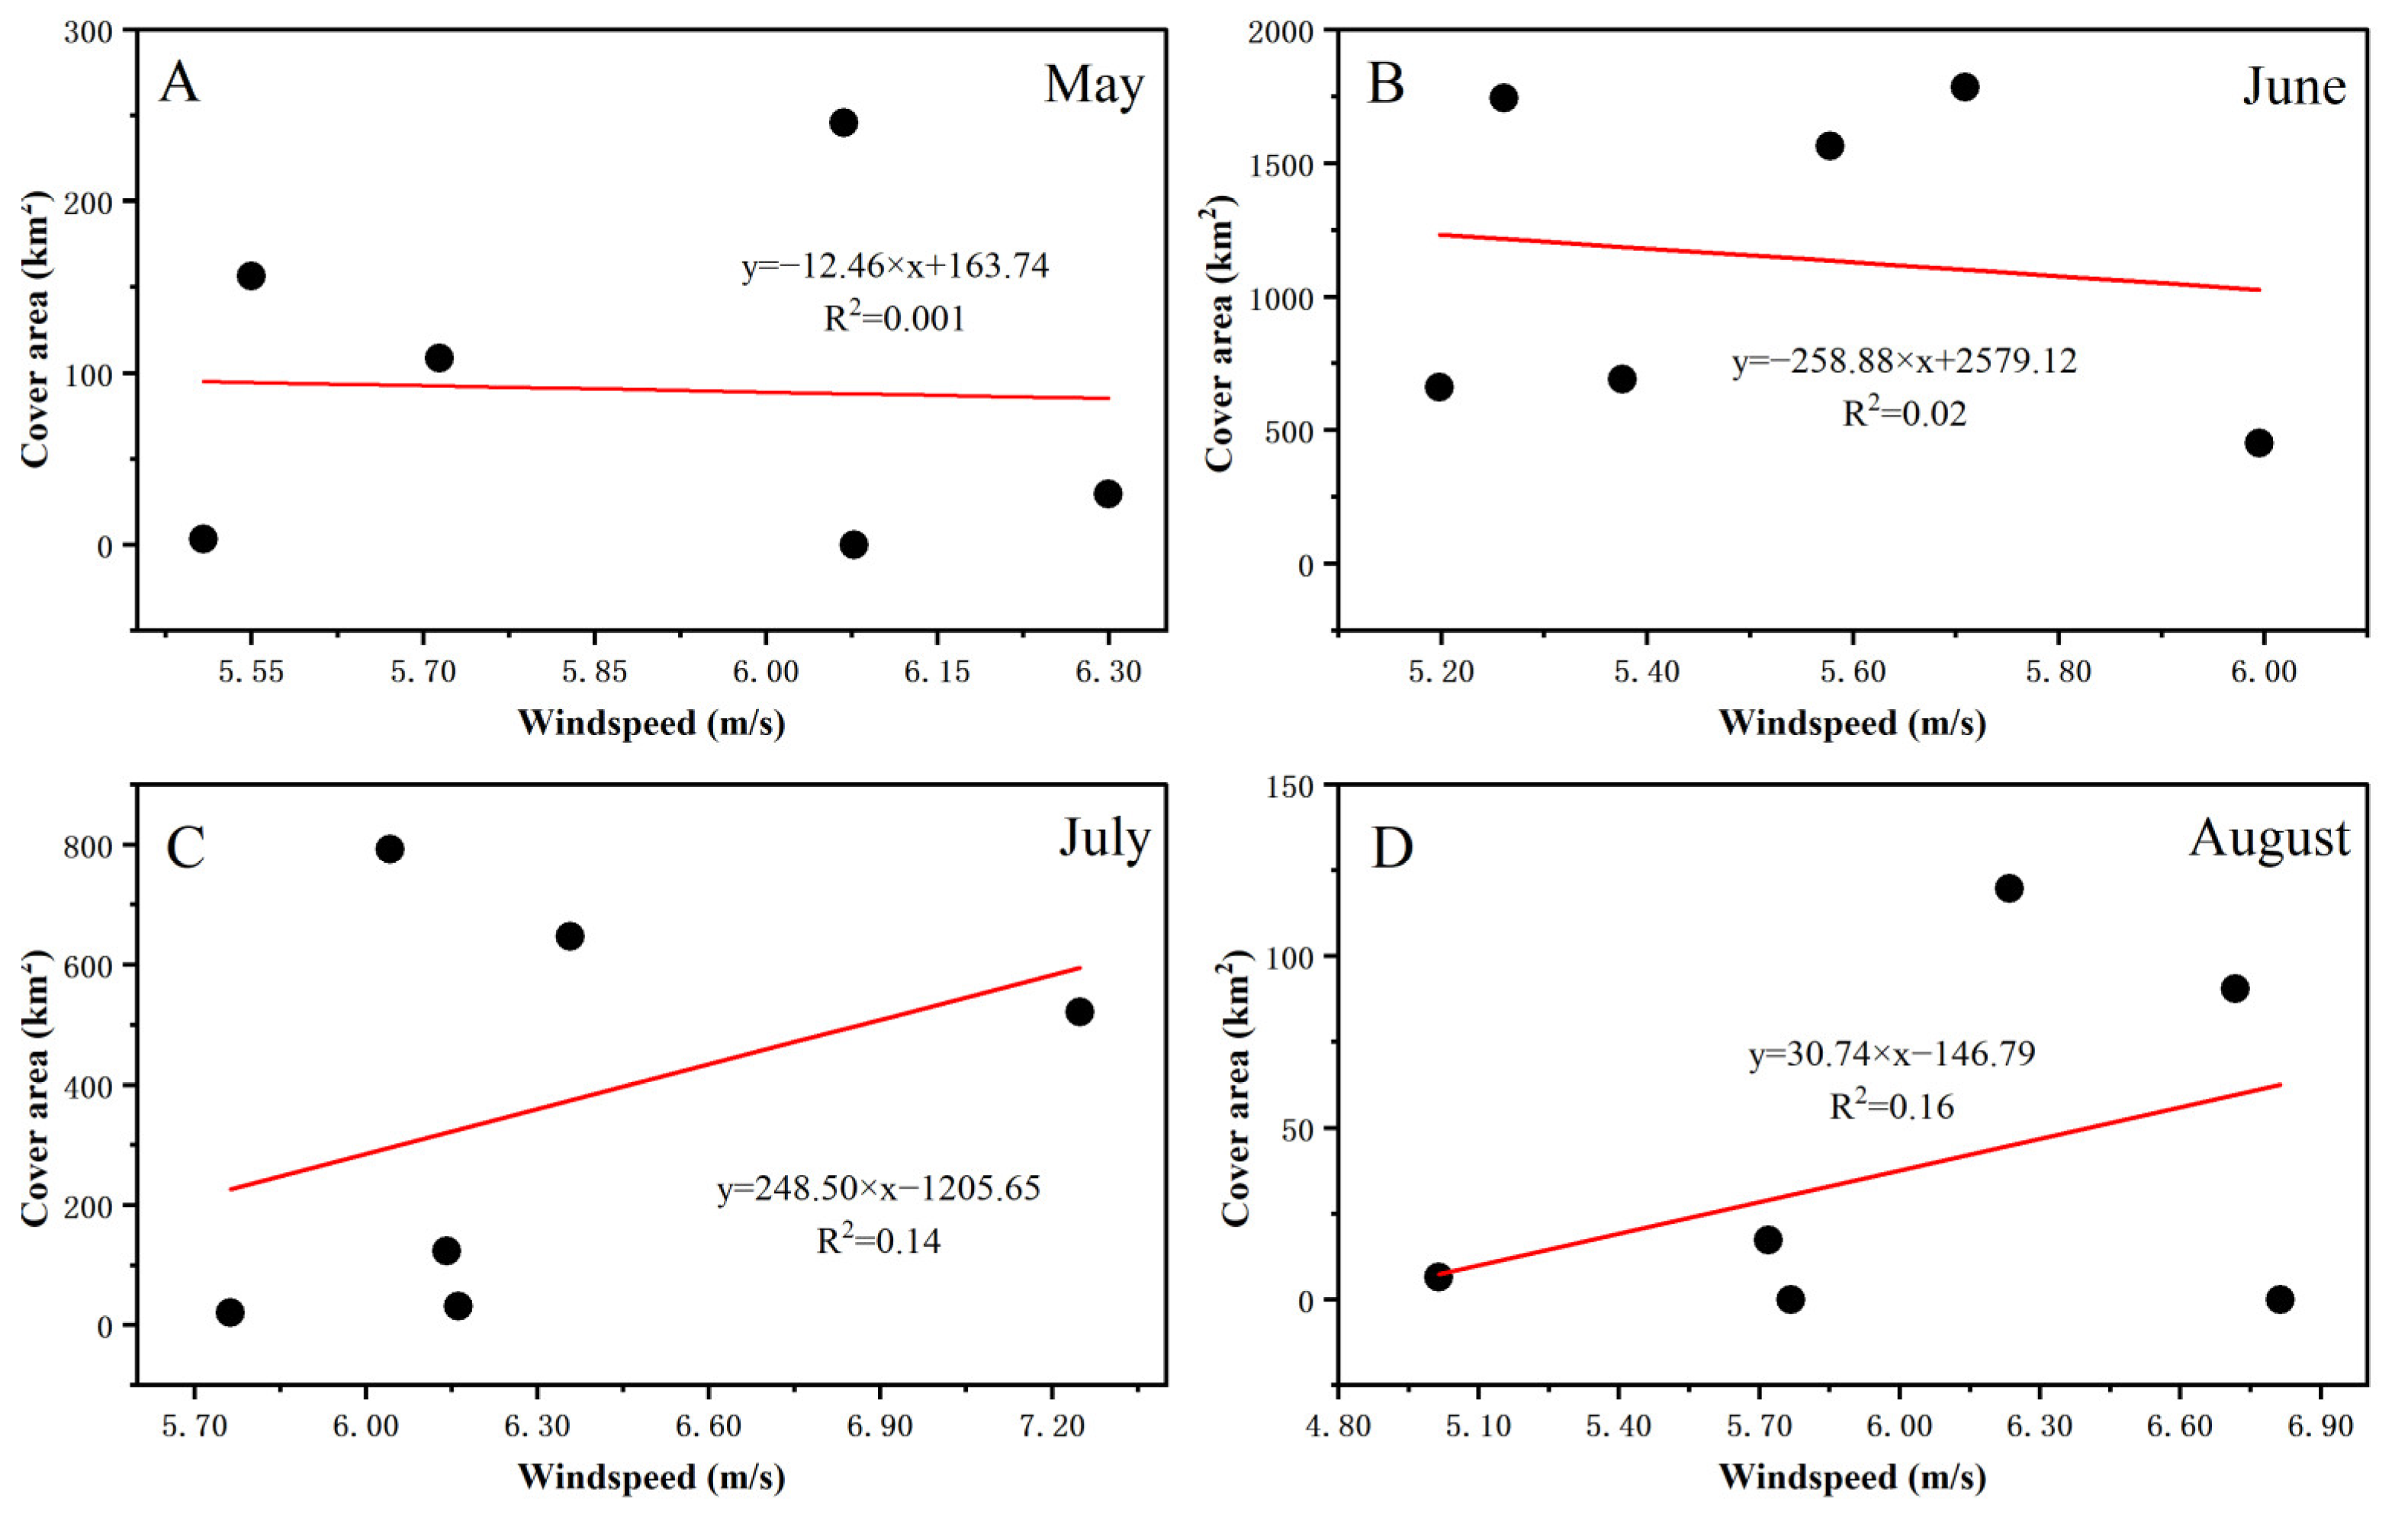
4.2.1. Analysis of Environmental Factors

Numerous studies have indicated that favorable SST conditions may facilitate the growth and proliferation of U. prolifera in the SYS [12,50,51]. The temperature range of 15 °C to 25 °C is optimal for U. prolifera growth, while excessively high or low temperatures can constrain its physiological processes [52]. U. prolifera in the SYS germinates in late May each year, during which the SST ranges from approximately 15 °C to 17 °C. This range promotes spore growth and initial biomass accumulation [27]. As the sun’s zenith shifts, the SST gradually increases in the SYS, enhancing the U. prolifera’s metabolism and growth rate within a certain range. It creates a more conducive environment for reproduction and growth, thus facilitating the significant increase in the U. prolifera area in June. SST also plays a crucial role in U. prolifera decline. Prior research has revealed a notable negative correlation between the reduction of the U. prolifera area in July and August and SST [53,54]. In our study, the maximum coverage area of U. prolifera in the SYS is typically reached in mid to late June, after which the area starts to decline. At this point, the SST is approximately 23–24 °C. It might be attributed to SST surpassing the suitable growth range for U. prolifera. Elevated temperatures could affect intracellular enzyme activity, reduce biochemical reaction rates, and even induce physiological stress, triggering a stress response in U. prolifera cells [55]. Stress responses could deplete cellular energy and resources, hindering average growth and ecological functions. SST plays a critical role in U. prolifera outbreaks in the SYS, exerting a significant influence during crucial junctures of germination and decline. Our study corroborates this assertion. However, recent fluctuations in the U. prolifera area reveal that the relationship between SST and area is not pronounced in some years. It implies that SST primarily affects the physiological processes and health of U. prolifera growth, rather than playing a dominant role in the interannual variability of the U. prolifera area in the SYS [56,57].
Photosynthesis is crucial for the growth of U. prolifera, and PAR is one of the critical factors in this process [58]. We have observed that the relationship between PAR levels and the U. prolifera area is rather intricate. While higher PAR levels are consistent with growth in certain years, the overall relationship between PAR and area is not evident. We posit that this complexity arises because the effect of PAR on U. prolifera growth and reproduction is contingent upon interactions with other environmental factors. The efficiency of U. prolifera photosynthesis is constrained by light intensity, temperature, water supply, and nutrient availability. Relying solely on monthly variations in PAR might not substantially alter growth and reproductive rates. Additionally, we have identified a unique scenario in 2022 where PAR levels in May reached an unusually high value, yet the U. prolifera area in the SYS was exceedingly small in the same year. It might be attributed to photoinhibition caused by excessive light, damaging cells, and negatively impacting growth [53]. However, this situation also raises an intriguing question: Does a light threshold exist beyond which photoinhibition occurs while significantly below which limits photosynthesis [59,60]?
Precipitation can interact with the U. prolifera ecosystem through multiple pathways, impacting its area and distribution [61,62]. We have observed a correlation between variations in precipitation and the periodic changes in U. prolifera outbreaks during the study period. Firstly, precipitation could influence the floating propagules of U. prolifera. Numerous studies concur that U. prolifera in the SYS originates from reproductive bodies attached to rafts in the northern Jiangsu shoal [63,64,65]. Abundant precipitation may lead to the flushing of U. prolifera propagules from these rafts into the ocean, thereby increasing the initial biomass. These floating propagules disperse in the ocean, facilitating the spread and proliferation of U. prolifera, thereby creating conditions for outbreaks. Secondly, during the growth phase of U. prolifera, precipitation directly affects nutrient input in the growth area. Atmospheric precipitation carries nutrients from the land, introducing nitrogen, phosphorus, and other substances into the ocean through surface runoff. Simultaneously, marine precipitation replenishes algal moisture, preventing U. prolifera from excessive sun exposure and excessive nutrient consumption. Using 2022 as an example, the coexistence of high PAR and meagre precipitation in May in the SYS resulted in a lower initial biomass of U. prolifera that year. Finally, excessive precipitation can sharply reduce U. prolifera area [26]. In the later growth stages, a large amount of precipitation may accelerate the sinking of U. prolifera, especially during meteorological events like storm surges. It may cause a rapid decrease in the U. prolifera area in some years, particularly in July. Our study, including data from 2020, supports this observation.
When discussing the influence of windspeed on U. prolifera outbreaks and area changes in the SYS, it is necessary to consider their complex interactions at different time scales and with other environmental factors. Windspeed is a crucial driving force in the marine hydrodynamic environment that affects processes such as U. prolifera distribution, attachment, and sedimentation [30]. During the germination period, strong winds may disturb the seawater, causing the detachment of U. prolifera reproductive bodies from the P. yezoensis cultivation rafts. In the growth stage, moderate winds generate waves supporting U. prolifera growth and attachment, ensuring better distribution and stability in the seawater. Ocean currents generated by wind can alter the drifting path and movement speed of U. prolifera, thereby influencing its distribution range. In summary, variations in windspeed may have different impacts on U. prolifera growth status and coverage at different time scales. However, a deeper investigation is required to understand the complex relationship between windspeed and other environmental factors concerning U. prolifera outbreaks and changes in area. It will better explain the annual dynamic variations in U. prolifera coverage in the SYS.
The marine ecosystem is an open and highly complex system. Some factors are difficult to capture and quantify, such as benthic organisms, water salinity, suspended particle concentration, chlorophyll-a concentration, etc. These factors may also play crucial roles in the interannual variations of U. prolifera outbreaks [6,12,66]. Therefore, research on the environmental factors influencing U. prolifera outbreaks needs to continue to understand their dynamics fully.

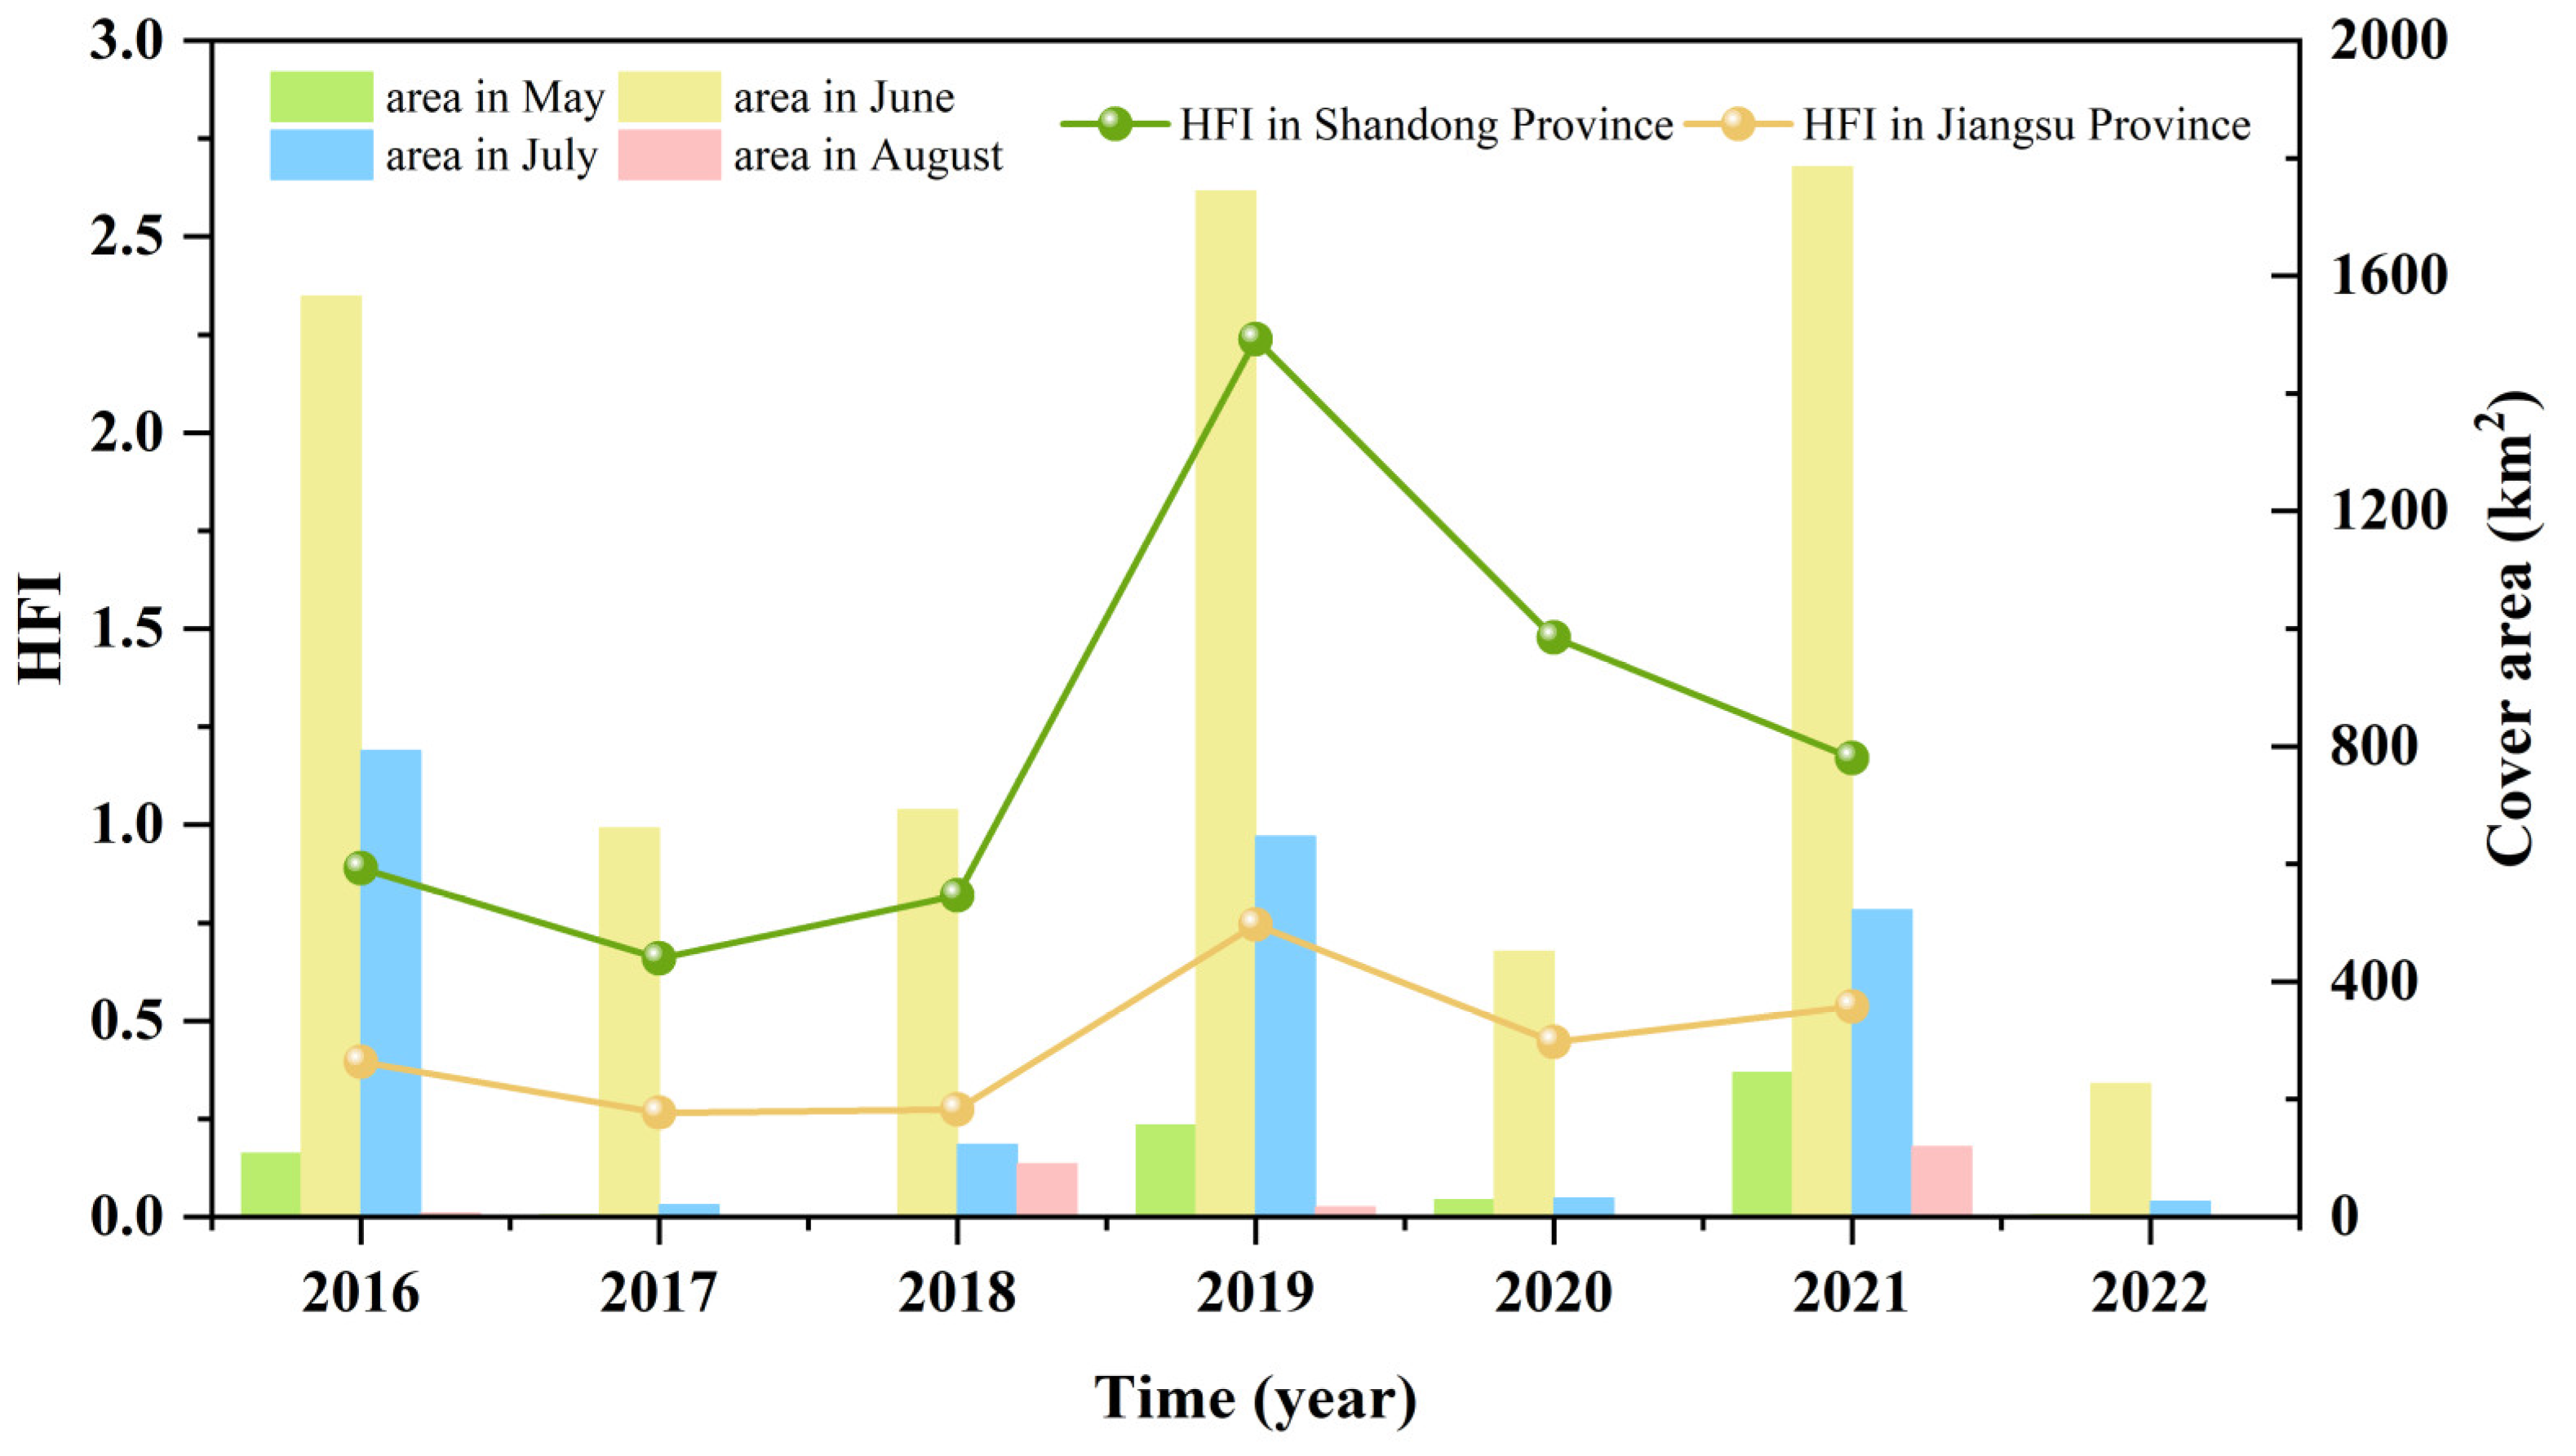
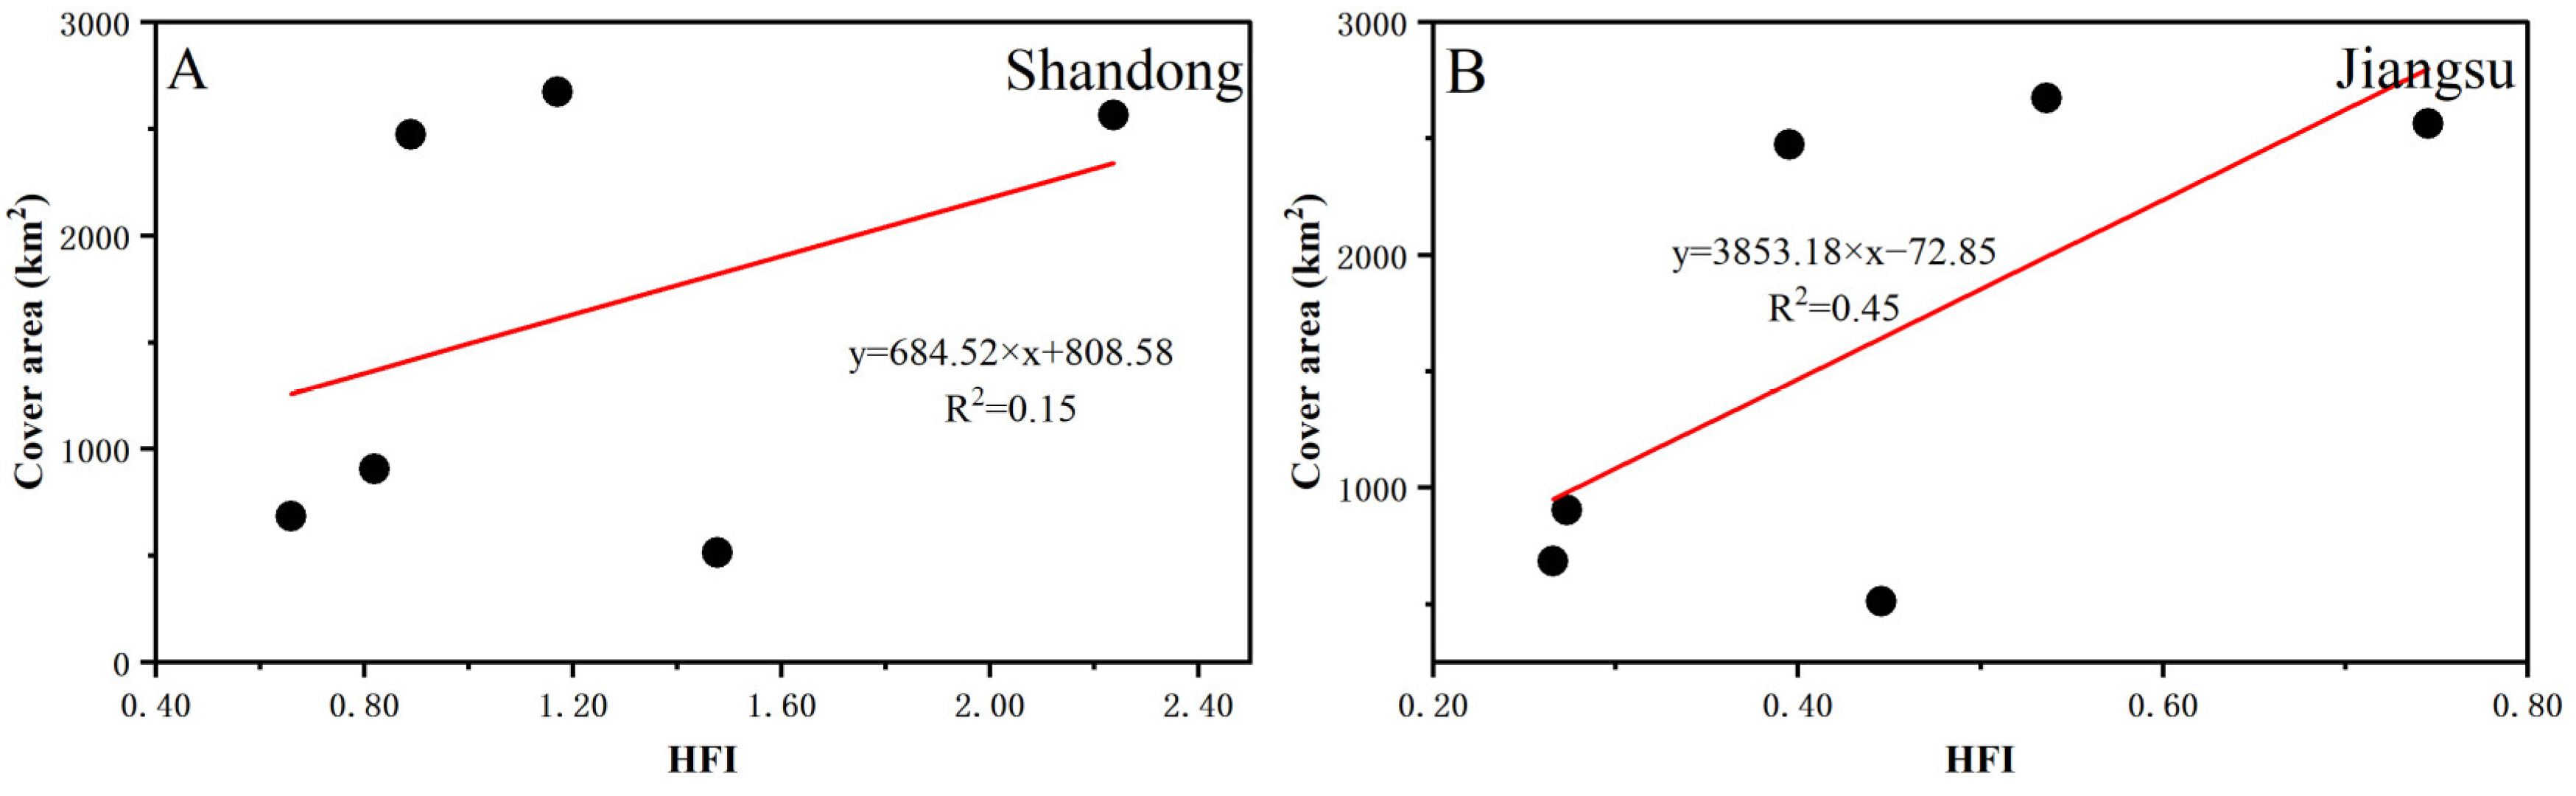
4.2.2. Human Factors Analysis

This study discusses anthropogenic factors from two perspectives: the timing and rate of P. yezoensis culture rafts recycle and the HFI values. Previous research has indicated that the influence of P. yezoensis culture rafts recycle timing on the area of U. prolifera outbreaks is intricate [21]. Early recycle times may reduce the introduction of attached reproductive bodies into the sea, thereby limiting primary production activities and partially restraining U. prolifera outbreaks. However, when interacting with other influencing factors, earlier raft recycle times may also result in the dispersion of reproductive bodies into the ocean during extreme weather conditions. Consequently, they act as a source of U. prolifera, facilitating dispersion and proliferation. Regarding retrieval speed, a slower rate implies extended attachment time for reproductive bodies, providing more opportunities for growth and proliferation. It potentially leads to more mature and abundant reproductive bodies on the culture rafts, contributing to an increased source of U. prolifera expansion and growth during outbreaks. Thus, the timing and speed of P. yezoensis culture raft recycle might influence the initial biomass of U. prolifera, provided that other environmental factors are controlled. The extensive proliferation of U. prolifera is more significantly constrained by other factors, and solely altering the timing of P. yezoensis culture raft recycle is unlikely to impact its area substantially.
Regions with high HFI values are often associated with marine eutrophication. This phenomenon could be attributed to aquaculture effluents, industrial emissions, and agricultural runoff. Nutrient enrichment in seawater can stimulate the proliferation of phytoplankton, mainly algae [67]. Nitrogen, such as nitrates, ammonium, and phosphorus, are vital nutrients for algae, playing a crucial role in their blade formation and cell division [12,68]. This increased nutrient availability in the water contributes to the primary production of U. prolifera. Elevated concentrations of nutrients, such as nitrogen and phosphorus, in the water can lead to the outbreak of large macroalgae, including U. prolifera. Additionally, the uneven distribution of nutrients in seawater can influence the drifting patterns and distribution of U. prolifera [69]. Analysis indicates a positive correlation between the U. prolifera area and HFI values in the SYS, particularly in the Shandong and Jiangsu regions (Figure 14). In the initial stages of U. prolifera germination and proliferation in the Jiangsu region, there is a relatively strong correlation between the interannual variation of the U. prolifera area and the levels of HFI (R2 = 0.45). Moreover, human activities can interact with climate change, potentially resulting in more intricate effects on U. prolifera outbreaks [70]. These findings underscore the importance of implementing sustainable coastal management measures to mitigate the adverse impacts of anthropogenic environmental changes. Such measures can help protect the ecological stability and integrity of marine ecosystems. For instance, scientifically managing fishing activities and effective wastewater treatment can help reduce the ecological impact of human activities on aquatic environments.
In addition to the aforementioned anthropogenic factors, it is also important to consider that U. prolifera absorbs a significant amount of nutrients such as nitrogen and phosphorus from seawater to support its growth and reproduction during the growing phase, and releases substantial amounts of carbon, nitrogen, and phosphorus back into the seawater during the decaying phase [71,72]. We posit that the timing and magnitude of U. prolifera harvesting may influence the degree of seawater eutrophication, thus affecting the scale of U. prolifera blooms in the subsequent year. Take the year 2021 as an example, when the massive outbreak of U. prolifera in the SYS led to the accumulation of substantial amounts of nitrogen and phosphorus in the algal biomass. As the end of the growth phase coincided with extensive harvesting and removal of U. prolifera to the shores, the accumulated nutrient-rich substances within the U. prolifera were not released into the seawater. Consequently, the level of seawater eutrophication remained relatively moderate compared to before the outbreak, which mitigated the growth conditions for U. prolifera in the subsequent years. The scale of the 2022 outbreak supports this observation. However, data on U. prolifera harvesting timing and quantities were not easily obtainable annually, necessitating further research to delve into and validate this hypothesis.

5. Conclusions

In this study, we utilized the GEE platform to extract the U. prolifera area data in the SYS. Monthly average data for various environmental factors were computed, and the HFI was introduced to quantify the impact of human activities on the U. prolifera area changes. Through a multifactor analysis of U. prolifera outbreaks and annual variations in area, we unveiled how environmental and anthropogenic factors influence U. prolifera outbreaks. Among environmental factors, SST was pivotal during the stages of U. prolifera germination, growth, and decline, primarily affecting physiological processes and health status. Photosynthesis is crucial for U. prolifera growth, but the relationship between PAR and photosynthesis is intricate, necessitating considering interactions with other environmental factors. Precipitation, windspeed, and other factors influenced U. prolifera source distribution, nutrient inputs, and ecological balance, tightly associated with its area and distribution. Concerning anthropogenic factors, earlier recycle of P. yezoensis farming rafts limited primary production but could also foster source dissemination in specific contexts. A slower recycle time contributed to the formation of mature sources. Areas with higher HFI values might promote U. prolifera proliferation due to enhanced eutrophication. Furthermore, this factor correlated more with U. prolifera’s annual area variations than other environmental factors. Nevertheless, human activities interacted with climate change, resulting in even more intricate effects.
Based on the analysis results of RDA and VPA, we conclude that the annual variation of the U. prolifera area in the SYS is influenced by a combination of multiple factors. Among these, the HFI exhibited the highest contribution rate. Moreover, these factors interacted in complex ways, demonstrating nonlinear responses. Future research should explore additional potential influencing factors to comprehensively comprehend the mechanisms underlying U. prolifera outbreaks and area changes. Factors such as U. prolifera harvesting timing and quantity, benthic organisms, chlorophyll-a concentration, and water salinity could be further investigated to enhance comprehensive understanding. Concurrently, strengthening the management and monitoring of human activities in marine ecosystems will aid in mitigating anthropogenic-induced environmental changes, thereby sustaining the health and stability of marine ecosystems. This study offers a novel perspective on understanding the mechanisms of U. prolifera outbreaks in the SYS and provides a scientific foundation for the sustainable management of marine ecosystems.

Author Contributions

Conceptualization, M.W., M.X. and L.Z.; methodology, M.W., M.X. and L.Z.; software, M.X., L.Z. and L.L. (Longxing Liu); investigation, M.W., M.X., L.Z., J.L. and L.L. (Longxing Liu); resources, M.W., S.L. and L.L. (Lijuan Liu); data curation, M.X. and J.L.; writing—original draft preparation, M.X.; writing—review and editing, M.X., M.W., L.Z. and S.Z.; visualization, M.X. and S.Z.; supervision, M.W., S.L. and L.L. (Lijuan Liu); project administration, M.W.; funding acquisition, M.W. All authors have read and agreed to the published version of the manuscript.

Funding

This research was funded by the National Natural Science Foundation of China (grant number 42071385), the National Science and Technology Major Project of High Resolution Earth Observation System (grant number 79-Y50-G18-9001-22/23), the Yantai science and technology innovation development plan project (grant number 2022MSGY062), the Open Project Program of Shandong Marine Aerospace Equipment Technological Innovation Center, Ludong University (grant number MAETIC2021-12), the Shandong Science and Technology SMEs Technology Innovation Capacity Enhancement Project (grant number 2022TSGC2371) and the Yantai science and technology innovation development plan project (grant number 2022MSGY057).

Data Availability Statement

The data presented in this study are available on request from the corresponding author.

Conflicts of Interest

The authors declare no conflict of interest.

References

  1. Lyons, D.A.; Arvanitidis, C.; Blight, A.J.; Chatzinikolaou, E.; Guy-Haim, T.; Kotta, J.; Orav-Kotta, H.; Queirós, A.M.; Rilov, G.; Somerfield, P.J. Macroalgal blooms alter community structure and primary productivity in marine ecosystems. Glob. Chang. Biol. 2014, 20, 2712–2724. [Google Scholar] [CrossRef] [PubMed]
  2. Jiang, P.; Wang, J.; Cui, Y.; Li, Y.; Lin, H.; Qin, S. Molecular phylogenetic analysis of attached Ulvaceae species and free-floating Enteromorpha from Qingdao coasts in 2007. Chin. J. Oceanol. Limnol. 2008, 26, 276–279. [Google Scholar] [CrossRef]
  3. Zhang, J.; Shi, J.; Gao, S.; Huo, Y.; Cui, J.; Shen, H.; Liu, G.; He, P. Annual patterns of macroalgal blooms in the Yellow Sea during 2007–2017. PLoS ONE 2019, 14, e0210460. [Google Scholar] [CrossRef] [PubMed]
  4. Zheng, L.; Wu, M.; Zhou, M.; Zhao, L. Spatiotemporal distribution and influencing factors of Ulva prolifera and Sargassum and their coexistence in the South Yellow Sea, China. J. Oceanol. Limnol. 2022, 40, 1070–1084. [Google Scholar] [CrossRef]
  5. Zhou, M.-J.; Liu, D.-Y.; Anderson, D.M.; Valiela, I. Introduction to the Special Issue on green tides in the Yellow Sea. Estuar. Coast. Shelf Sci. 2015, 163, 3–8. [Google Scholar] [CrossRef]
  6. Wei, Q.; Wang, B.; Yao, Q.; Fu, M.; Sun, J.; Xu, B.; Yu, Z. Hydro-biogeochemical processes and their implications for Ulva prolifera blooms and expansion in the world’s largest green tide occurrence region (Yellow Sea, China). Sci. Total Environ. 2018, 645, 257–266. [Google Scholar] [CrossRef] [PubMed]
  7. Xing, Q.; Wu, L.; Tian, L.; Cui, T.; Li, L.; Kong, F.; Gao, X.; Wu, M. Remote sensing of early-stage green tide in the Yellow Sea for floating-macroalgae collecting campaign. Mar. Pollut. Bull. 2018, 133, 150–156. [Google Scholar] [CrossRef] [PubMed]
  8. Liu, D.; Keesing, J.K.; He, P.; Wang, Z.; Shi, Y.; Wang, Y. The world’s largest macroalgal bloom in the Yellow Sea, China: Formation and implications. Estuar. Coast. Shelf Sci. 2013, 129, 2–10. [Google Scholar] [CrossRef]
  9. Wang, S.; Zhao, L.; Wang, Y.; Zhang, H.; Li, F.; Zhang, Y. Distribution characteristics of green tides and its impact on environment in the Yellow Sea. Mar. Environ. Res. 2022, 181, 105756. [Google Scholar] [CrossRef]
  10. Fan, S.; Fu, M.; Wang, Z.; Zhang, X.; Song, W.; Li, Y.; Liu, G.; Shi, X.; Wang, X.; Zhu, M. Temporal variation of green macroalgal assemblage on Porphyra aquaculture rafts in the Subei Shoal, China. Estuar. Coast. Shelf Sci. 2015, 163, 23–28. [Google Scholar] [CrossRef]
  11. Liu, J.; Xia, J.; Zhuang, M.; Zhang, J.; Yu, K.; Zhao, S.; Sun, Y.; Tong, Y.; Xia, L.; Qin, Y. Controlling the source of green tides in the Yellow Sea: NaClO treatment of Ulva attached on Pyropia aquaculture rafts. Aquaculture 2021, 535, 736378. [Google Scholar] [CrossRef]
  12. Taylor, R.; Fletcher, R.; Raven, J. Preliminary studies on the growth of selected ‘green tide’algae in laboratory culture: Effects of irradiance, temperature, salinity and nutrients on growth rate. Bot. Mar. 2001, 44, 327–336. [Google Scholar] [CrossRef]
  13. Xiao, J.; Zhang, X.; Gao, C.; Jiang, M.; Li, R.; Wang, Z.; Li, Y.; Fan, S.; Zhang, X. Effect of temperature, salinity and irradiance on growth and photosynthesis of Ulva prolifera. Acta Oceanol. Sin. 2016, 35, 114–121. [Google Scholar] [CrossRef]
  14. Li, H.; Zhang, Y.; Han, X.; Shi, X.; Rivkin, R.B.; Legendre, L. Growth responses of Ulva prolifera to inorganic and organic nutrients: Implications for macroalgal blooms in the southern Yellow Sea, China. Sci. Rep. 2016, 6, 26498. [Google Scholar] [CrossRef] [PubMed]
  15. Fan, X.; Xu, D.; Wang, Y.; Zhang, X.; Cao, S.; Mou, S.; Ye, N. The effect of nutrient concentrations, nutrient ratios and temperature on photosynthesis and nutrient uptake by Ulva prolifera: Implications for the explosion in green tides. J. Appl. Phycol. 2014, 26, 537–544. [Google Scholar] [CrossRef]
  16. Wu, H.; Gao, G.; Zhong, Z.; Li, X.; Xu, J. Physiological acclimation of the green tidal alga Ulva prolifera to a fast-changing environment. Mar. Environ. Res. 2018, 137, 1–7. [Google Scholar] [CrossRef] [PubMed]
  17. Xiao, Y.; Zhang, J.; Cui, T. High-precision extraction of nearshore green tides using satellite remote sensing data of the Yellow Sea, China. Int. J. Remote Sens. 2017, 38, 1626–1641. [Google Scholar] [CrossRef]
  18. Ma, Y.; Wong, K.; Tsou, J.Y.; Zhang, Y. Investigating spatial distribution of green-tide in the Yellow Sea in 2021 using combined optical and SAR images. J. Mar. Sci. Eng. 2022, 10, 127. [Google Scholar] [CrossRef]
  19. Hu, C.; Qi, L.; Hu, L.; Cui, T.; Xing, Q.; He, M.; Wang, N.; Xiao, Y.; Sun, D.; Lu, Y. Mapping Ulva prolifera green tides from space: A revisit on algorithm design and data products. Int. J. Appl. Earth Obs. Geoinf. 2023, 116, 103173. [Google Scholar] [CrossRef]
  20. Cuevas, E.; Uribe-Martínez, A.; Liceaga-Correa, M.d.l.Á. A satellite remote-sensing multi-index approach to discriminate pelagic Sargassum in the waters of the Yucatan Peninsula, Mexico. Int. J. Remote Sens. 2018, 39, 3608–3627. [Google Scholar] [CrossRef]
  21. Liu, D.; Keesing, J.K.; Dong, Z.; Zhen, Y.; Di, B.; Shi, Y.; Fearns, P.; Shi, P. Recurrence of the world’s largest green-tide in 2009 in Yellow Sea, China: Porphyra yezoensis aquaculture rafts confirmed as nursery for macroalgal blooms. Mar. Pollut. Bull. 2010, 60, 1423–1432. [Google Scholar] [CrossRef] [PubMed]
  22. Shi, W.; Wang, M. Green macroalgae blooms in the Yellow Sea during the spring and summer of 2008. J. Geophys. Res. Ocean. 2009, 114, C12010. [Google Scholar] [CrossRef]
  23. Hu, C. A novel ocean color index to detect floating algae in the global oceans. Remote Sens. Environ. 2009, 113, 2118–2129. [Google Scholar] [CrossRef]
  24. Xing, Q.; Hu, C. Mapping macroalgal blooms in the Yellow Sea and East China Sea using HJ-1 and Landsat data: Application of a virtual baseline reflectance height technique. Remote Sens. Environ. 2016, 178, 113–126. [Google Scholar] [CrossRef]
  25. Amani, M.; Ghorbanian, A.; Ahmadi, S.A.; Kakooei, M.; Moghimi, A.; Mirmazloumi, S.M.; Moghaddam, S.H.A.; Mahdavi, S.; Ghahremanloo, M.; Parsian, S. Google earth engine cloud computing platform for remote sensing big data applications: A comprehensive review. IEEE J. Sel. Top. Appl. Earth Obs. Remote Sens. 2020, 13, 5326–5350. [Google Scholar] [CrossRef]
  26. Li, D.; Gao, Z.; Xu, F. Research on the dissipation of green tide and its influencing factors in the Yellow Sea based on Google Earth Engine. Mar. Pollut. Bull. 2021, 172, 112801. [Google Scholar] [CrossRef] [PubMed]
  27. Zheng, L.; Wu, M.; Cui, Y.; Tian, L.; Yang, P.; Zhao, L.; Xue, M.; Liu, J. What causes the great green tide disaster in the South Yellow Sea of China in 2021? Ecol. Indic. 2022, 140, 108988. [Google Scholar] [CrossRef]
  28. Hallegraeff, G.M. Ocean climate change, phytoplankton community responses, and harmful algal blooms: A formidable predictive challenge 1. J. Phycol. 2010, 46, 220–235. [Google Scholar] [CrossRef]
  29. Tian, R.; Lin, Q.; Li, D.; Zhang, W.; Zhao, X. Atmospheric transport of nutrients during a harmful algal bloom event. Reg. Stud. Mar. Sci. 2020, 34, 101007. [Google Scholar] [CrossRef]
  30. Xing, Q.; Loisel, H.; Schmitt, F.; Shi, P.; Liu, D.; Keesing, J. Detection of the green tide at the Yellow Sea and tracking its wind-forced drifting by remote sensing. In Proceedings of the EGU General Assembly Conference, Vienna, Austria, 19–24 April 2009; p. 577. [Google Scholar]
  31. Gower, J.; Hu, C.; Borstad, G.; King, S. Ocean color satellites show extensive lines of floating Sargassum in the Gulf of Mexico. IEEE Trans. Geosci. Remote Sens. 2006, 44, 3619–3625. [Google Scholar] [CrossRef]
  32. Son, Y.B.; Min, J.-E.; Ryu, J.-H. Detecting massive green algae (Ulva prolifera) blooms in the Yellow Sea and East China Sea using geostationary ocean color imager (GOCI) data. Ocean Sci. J. 2012, 47, 359–375. [Google Scholar] [CrossRef]
  33. Zhang, G.; Wu, M.; Wei, J.; He, Y.; Niu, L.; Li, H.; Xu, G. Adaptive threshold model in google earth engine: A case study of Ulva prolifera extraction in the south yellow sea, China. Remote Sens. 2021, 13, 3240. [Google Scholar] [CrossRef]
  34. Xu, Q.; Zhang, H.; Cheng, Y. Multi-sensor monitoring of Ulva prolifera blooms in the Yellow Sea using different methods. Front. Earth Sci. 2016, 10, 378–388. [Google Scholar] [CrossRef]
  35. Li, D.; Gao, Z.; Song, D. Analysis of environmental factors affecting the large-scale long-term sequence of green tide outbreaks in the Yellow Sea. Estuar. Coast. Shelf Sci. 2021, 260, 107504. [Google Scholar] [CrossRef]
  36. Sun, X.; Wu, M.; Xing, Q.; Song, X.; Zhao, D.; Han, Q.; Zhang, G. Spatio-temporal patterns of Ulva prolifera blooms and the corresponding influence on chlorophyll-a concentration in the Southern Yellow Sea, China. Sci. Total Environ. 2018, 640, 807–820. [Google Scholar] [CrossRef] [PubMed]
  37. Breiman, L. Random forests. Mach. Learn. 2001, 45, 5–32. [Google Scholar] [CrossRef]
  38. Belgiu, M.; Drăguţ, L. Random forest in remote sensing: A review of applications and future directions. ISPRS J. Photogramm. Remote Sens. 2016, 114, 24–31. [Google Scholar] [CrossRef]
  39. Venter, O.; Sanderson, E.W.; Magrach, A.; Allan, J.R.; Beher, J.; Jones, K.R.; Possingham, H.P.; Laurance, W.F.; Wood, P.; Fekete, B.M. Sixteen years of change in the global terrestrial human footprint and implications for biodiversity conservation. Nat. Commun. 2016, 7, 12558. [Google Scholar] [CrossRef]
  40. Sanderson, E.W. Personalized Measures of Consumption and Development in the Context of Biodiversity Conservation: Connecting the Ecological Footprint Calculation with the Human Footprint Map. In Biodiversity Monitoring and Conservation: Bridging the Gap between Global Commitment and Local Action; John Wiley & Sons: Hoboken, NJ, USA, 2013; pp. 189–209. [Google Scholar]
  41. Fatemi, M.; Rezaei-Moghaddam, K.; Karami, E.; Hayati, D.; Wackernagel, M. An integrated approach of Ecological Footprint (EF) and Analytical Hierarchy Process (AHP) in human ecology: A base for planning toward sustainability. PLoS ONE 2021, 16, e0250167. [Google Scholar] [CrossRef]
  42. Vargas, L.G. An overview of the analytic hierarchy process and its applications. Eur. J. Oper. Res. 1990, 48, 2–8. [Google Scholar] [CrossRef]
  43. Zuur, A.F.; Ieno, E.N.; Smith, G.M. Principal component analysis and redundancy analysis. In Analysing Ecological Data; Springer: Berlin/Heidelberg, Germany, 2007; pp. 193–224. [Google Scholar]
  44. Chen, H.W.; Lin, H.C.; Chuang, Y.H.; Sun, C.T.; Chen, W.Y.; Kao, C.Y. Effects of environmental factors on benthic species in a coastal wetland by redundancy analysis. Ocean Coast. Manag. 2019, 169, 37–49. [Google Scholar] [CrossRef]
  45. Shi, P.; Zhang, Y.; Li, Z.; Li, P.; Xu, G. Influence of land use and land cover patterns on seasonal water quality at multi-spatial scales. Catena 2017, 151, 182–190. [Google Scholar] [CrossRef]
  46. Fang, C.; Song, K.; Paerl, H.W.; Jacinthe, P.A.; Wen, Z.; Liu, G.; Tao, H.; Xu, X.; Kutser, T.; Wang, Z. Global divergent trends of algal blooms detected by satellite during 1982–2018. Glob. Chang. Biol. 2022, 28, 2327–2340. [Google Scholar] [CrossRef] [PubMed]
  47. Legendre, P. Studying beta diversity: Ecological variation partitioning by multiple regression and canonical analysis. J. Plant Ecol. 2008, 1, 3–8. [Google Scholar] [CrossRef]
  48. Hao, Y.; Qu, T.; Guan, C.; Zhao, X.; Hou, C.; Tang, X.; Wang, Y. Competitive advantages of Ulva prolifera from Pyropia aquaculture rafts in Subei Shoal and its implication for the green tide in the Yellow Sea. Mar. Pollut. Bull. 2020, 157, 111353. [Google Scholar] [CrossRef] [PubMed]
  49. Wurtsbaugh, W.A.; Paerl, H.W.; Dodds, W.K. Nutrients, eutrophication and harmful algal blooms along the freshwater to marine continuum. Wiley Interdiscip. Rev. Water 2019, 6, e1373. [Google Scholar] [CrossRef]
  50. Yang, D.; Yuen, K.-V.; Gu, X.; Sun, C.; Gao, L. Influences of environmental factors on the dissipation of green tides in the Yellow Sea, China. Mar. Pollut. Bull. 2023, 189, 114737. [Google Scholar] [CrossRef]
  51. Hu, L.; He, M. Impacts of sea surface temperature anomaly to the coverage area and early appearance time of green tide in the Yellow Sea. In Proceedings of the 2014 IEEE Geoscience and Remote Sensing Symposium, Quebec City, QC, Canada, 13–18 July 2014; pp. 4465–4468. [Google Scholar]
  52. Hu, C.; Li, D.; Chen, C.; Ge, J.; Muller-Karger, F.E.; Liu, J.; Yu, F.; He, M.X. On the recurrent Ulva prolifera blooms in the Yellow Sea and East China Sea. J. Geophys. Res. Ocean. 2010, 115, C05017. [Google Scholar] [CrossRef]
  53. Wang, Y.; Wang, Y.; Zhu, L.; Zhou, B.; Tang, X. Comparative studies on the ecophysiological differences of two green tide macroalgae under controlled laboratory conditions. PLoS ONE 2012, 7, e38245. [Google Scholar] [CrossRef]
  54. Zhang, G.; Wu, M.; Zhang, A.; Xing, Q.; Zhou, M.; Zhao, D.; Song, X.; Yu, Z. Influence of sea surface temperature on outbreak of Ulva prolifera in the Southern Yellow Sea, China. Chin. Geogr. Sci. 2020, 30, 631–642. [Google Scholar] [CrossRef]
  55. Szymańska, R.; Ślesak, I.; Orzechowska, A.; Kruk, J. Physiological and biochemical responses to high light and temperature stress in plants. Environ. Exp. Bot. 2017, 139, 165–177. [Google Scholar] [CrossRef]
  56. Wells, M.L.; Trainer, V.L.; Smayda, T.J.; Karlson, B.S.; Trick, C.G.; Kudela, R.M.; Ishikawa, A.; Bernard, S.; Wulff, A.; Anderson, D.M. Harmful algal blooms and climate change: Learning from the past and present to forecast the future. Harmful Algae 2015, 49, 68–93. [Google Scholar] [CrossRef] [PubMed]
  57. Le Nohaïc, M.; Ross, C.L.; Cornwall, C.E.; Comeau, S.; Lowe, R.; McCulloch, M.T.; Schoepf, V. Marine heatwave causes unprecedented regional mass bleaching of thermally resistant corals in northwestern Australia. Sci. Rep. 2017, 7, 14999. [Google Scholar] [CrossRef] [PubMed]
  58. Li, D.; Gao, Z.; Wang, Z. Analysis of the reasons for the outbreak of Yellow Sea green tide in 2021 based on long-term multi-source data. Mar. Environ. Res. 2022, 178, 105649. [Google Scholar] [CrossRef] [PubMed]
  59. Droop, M.R. 25 years of algal growth kinetics a personal view. Bot. Mar. 1983, 26, 99–112. [Google Scholar] [CrossRef]
  60. Liu, X.; Chen, L.; Zhang, G.; Zhang, J.; Wu, Y.; Ju, H. Spatiotemporal dynamics of succession and growth limitation of phytoplankton for nutrients and light in a large shallow lake. Water Res. 2021, 194, 116910. [Google Scholar] [CrossRef] [PubMed]
  61. Martins, I.; Pardal, M.; Lillebø, A.; Flindt, M.; Marques, J. Hydrodynamics as a major factor controlling the occurrence of green macroalgal blooms in a eutrophic estuary: A case study on the influence of precipitation and river management. Estuar. Coast. Shelf Sci. 2001, 52, 165–177. [Google Scholar] [CrossRef]
  62. Zhang, H.; Wang, G.; Zhang, C.; Su, R.; Shi, X.; Wang, X. Characterization of the development stages and roles of nutrients and other environmental factors in green tides in the Southern Yellow Sea, China. Harmful Algae 2020, 98, 101893. [Google Scholar] [CrossRef]
  63. Keesing, J.K.; Liu, D.; Fearns, P.; Garcia, R. Inter-and intra-annual patterns of Ulva prolifera green tides in the Yellow Sea during 2007–2009, their origin and relationship to the expansion of coastal seaweed aquaculture in China. Mar. Pollut. Bull. 2011, 62, 1169–1182. [Google Scholar] [CrossRef]
  64. Liu, X.; Wang, Z.; Zhang, X. A review of the green tides in the Yellow Sea, China. Mar. Environ. Res. 2016, 119, 189–196. [Google Scholar] [CrossRef]
  65. Pang, S.J.; Liu, F.; Shan, T.F.; Xu, N.; Zhang, Z.H.; Gao, S.Q.; Chopin, T.; Sun, S. Tracking the algal origin of the Ulva bloom in the Yellow Sea by a combination of molecular, morphological and physiological analyses. Mar. Environ. Res. 2010, 69, 207–215. [Google Scholar] [CrossRef] [PubMed]
  66. Li, D.; Gao, Z.; Wang, Y. Research on the long-term relationship between green tide and chlorophyll-a concentration in the Yellow Sea based on Google Earth Engine. Mar. Pollut. Bull. 2022, 177, 113574. [Google Scholar] [CrossRef] [PubMed]
  67. Dubey, D.; Dutta, V. Nutrient enrichment in lake ecosystem and its effects on algae and macrophytes. In Environmental Concerns and Sustainable Development: Volume 2: Biodiversity, Soil and Waste Management; Springer: Berlin/Heidelberg, Germany, 2020; pp. 81–126. [Google Scholar]
  68. Li, S.; Yu, K.; Huo, Y.; Zhang, J.; Wu, H.; Cai, C.E.; Liu, Y.; Shi, D.; He, P. Effects of nitrogen and phosphorus enrichment on growth and photosynthetic assimilation of carbon in a green tide-forming species (Ulva prolifera) in the Yellow Sea. Hydrobiologia 2016, 776, 161–171. [Google Scholar] [CrossRef]
  69. Ye, N.-H.; Zhang, X.-W.; Mao, Y.-Z.; Liang, C.-W.; Xu, D.; Zou, J.; Zhuang, Z.-M.; Wang, Q.-Y. ‘Green tides’ are overwhelming the coastline of our blue planet: Taking the world’s largest example. Ecol. Res. 2011, 26, 477–485. [Google Scholar] [CrossRef]
  70. Gao, G.; Clare, A.S.; Rose, C.; Caldwell, G.S. Eutrophication and warming-driven green tides (Ulva rigida) are predicted to increase under future climate change scenarios. Mar. Pollut. Bull. 2017, 114, 439–447. [Google Scholar] [CrossRef] [PubMed]
  71. Cai, J.; Ni, J.; Chen, Z.; Wu, S.; Wu, R.; He, C.; Wang, J.; Liu, Y.; Zhou, W.; Xu, J. Effects of ocean acidification and eutrophication on the growth and photosynthetic performances of a green tide alga Ulva prolifera. Front. Mar. Sci. 2023, 10, 1145048. [Google Scholar] [CrossRef]
  72. Zheng, L.; Wu, M.; Zhao, J.; Luan, S.; Wang, D.; Jiang, W.; Xue, M.; Liu, J.; Cui, Y. Effects of Ulva prolifera dissipation on the offshore environment based on remote sensing images and field monitoring data. Acta Oceanol. Sin. 2023, 42, 112–120. [Google Scholar] [CrossRef]
Figure 1. Location of the study area. Here, (AC) show the field observation images in 2021; (D) shows the location of green tide disaster and important coastal cities; (E) shows the image of U. prolifera under Sentinel-2; and (F) shows the image of P. yezoensis cultivation area under Sentinel-1 image.
Remotesensing 15 05151 g001
Figure 2. Monthly average area and duration of remote sensing monitoring of U. prolifera in the SYS during 2016~2022.
Remotesensing 15 05151 g002
Figure 3. Maximum daily coverage of SYS U. prolifera between 2016 and 2022.
Remotesensing 15 05151 g003
Figure 4. Area covered by U. prolifera in the SYS and time of recycle in P. yezoensis cultivation rafts in the northern Jiangsu shoal.
Remotesensing 15 05151 g004
Figure 5. Monthly mean area and monthly mean SST of U. prolifera in the SYS during 2016~2022.
Remotesensing 15 05151 g005
Figure 6. Correlation analysis between SST and U. prolifera area. Here, (AD) shows the correlation between U. prolifera area and SST for the months of May, June, July, and August from 2016 to 2022.
Remotesensing 15 05151 g006
Figure 7. Mean monthly area and mean monthly PAR of U. prolifera in the SYS between 2016 and 2022.
Remotesensing 15 05151 g007
Figure 8. Correlation analysis between PAR and U. prolifera area. Here, (AD) shows the correlation between U. prolifera area and PAR for the months of May, June, July, and August from 2016 to 2022.
Remotesensing 15 05151 g008
Figure 9. Mean monthly area and mean monthly precipitation of U. prolifera in the SYS between 2016 and 2022.
Remotesensing 15 05151 g009
Figure 10. Correlation analysis between precipitation and U. prolifera area. Here, (AD) shows the correlation between U. prolifera area and precipitation for the months of May, June, July, and August from 2016 to 2022.
Remotesensing 15 05151 g010
Figure 11. Mean monthly area and mean monthly windspeed of U. prolifera in the SYS between 2016 and 2022.
Remotesensing 15 05151 g011
Figure 12. Correlation analysis between windspeed and U. prolifera area. Here, (AD) shows the correlation between U. prolifera area and windspeed for the months of May, June, July, and August from 2016 to 2021.
Remotesensing 15 05151 g012
Figure 13. Monthly mean area and monthly mean HFI of U. prolifera in the SYS between 2016 and 2022.
Remotesensing 15 05151 g013
Figure 14. Correlation between monthly mean area and monthly mean HFI of U. prolifera. Here, (A,B) shows the correlation between U. prolifera area and HFI for the Shandong Province and Jiangsu Province from 2016 to 2021.
Remotesensing 15 05151 g014
Figure 15. Triplot of the U. prolifera area with each influence factor.
Remotesensing 15 05151 g015
Figure 16. Venn diagram for each impact factor.
Remotesensing 15 05151 g016
Table 1. Remote sensing imagery and environmental factors data sources.
Data NameData ProviderDatasetData NameData Provider
Sentinel-1European Union/ESA/Copernicus3 October 201410 m/6 dCOPERNICUS/S1_GRD
Sentinel-2European Union/ESA/Copernicus23 June 201510 m/5 dCOPERNICUS/S2_HARMONIZED
SSTNOPP2 October 1992–8 May 20238905.6 m/1 dHYCOM/sea_temp_salinity
PARNASA LP DAAC at the USGS EROS Center24 February 2002–1 July 2023500 m/3 hMODIS/061/MCD18C2
PrecipitationNASA GES DISC at NASA Goddard Space Flight Center1 June 2000–1 September 202111,132 m/3 hNASA/GPM_L3/IMERG_MONTHLY_V06
WindspeedNOAA1 January 1988–31 August 202127,830 m/1 dNOAA/CDR/ATMOS_NEAR_SURFACE/V2
Table 2. Confusion matrix calculation results.
Actual/PredictedCultivation Zone (1)Non-Cultivation Zone (2)
Cultivation zone (1)TP = 246FN = 54
Non-cultivation zone (2)FP = 29TN = 271
Table 3. Indicators and weights for HFI calculation.
Impact IndicatorsWeights
Cropland area0.15
Deforestation area0.17
Fisheries catch0.22
Energy consumption0.27
Building land area0.11
population0.08
Disclaimer/Publisher’s Note: The statements, opinions and data contained in all publications are solely those of the individual author(s) and contributor(s) and not of MDPI and/or the editor(s). MDPI and/or the editor(s) disclaim responsibility for any injury to people or property resulting from any ideas, methods, instructions or products referred to in the content.

