


Precision Nitrogen Fertilization for Opium Poppy Using Combined Proximal and Remote Sensor Data Fusion


1
Department of Environment, Universiteit Gent, Coupure Links 653, 9000 Gent, Belgium
2
AgriSat Iberia SL, Paseo de la Innovación 1, 02006 Albacete, Spain
*
Author to whom correspondence should be addressed.
Remote Sens. 2023, 15(23), 5442; https://doi.org/10.3390/rs15235442
Submission received: 8 September 2023
/
Revised: 16 November 2023
/
Accepted: 18 November 2023
/
Published: 21 November 2023
(This article belongs to the Special Issue Proximal and Remote Sensing for Precision Crop Management II)
Abstract
:Proper management of within-field variability is crucial for maximizing crop yield, production outcomes and resource use efficiency and reducing environmental impacts. This study evaluated the agroeconomic and environmental feasibilities of site-specific nitrogen fertilization (SNF) in opium poppy (Papaver somniferum L.). On-line visible and near-infrared reflectance spectroscopy was used to estimate soil pH, organic carbon (OC), soil organic matter (SOM), P, K, Mg, Ca, Na, moisture content (MC), Ca:Mg and K:Mg for one field in Spain. Normalized difference vegetation indexes of the previous crop were retrieved from Sentine-2 images. Rasterization of soil and crop data layers created a spatially homogenous dataset followed by delineation of a management zone (MZ) map using a k-means cluster analysis. MZ clusters were ranked relying on the within-cluster soil fertility attributes. A strip experiment was conducted by creating parallel stripes distributed over the MZ map, over which two SNF treatments (i.e., SNF-Kings approach [KA] and SNF-Robin Hood approach [RHA]) were compared against the uniform rate N (URN) control treatment. In SNF-KA, the highest and lowest N dose was applied in the most and least fertile MZ, respectively, whereas the opposite approach was adopted in the SNF-RHA treatment. Yield and cost–benefit analyses provided both SNF treatments to produce more yield (KA = 2.72 and RHA = 2.74 t ha−1) than the URN (2.64 t ha−1) treatment, leading to increasing gross margins by EUR 91 ha−1 (SNF–KA) and EUR 88.5 ha−1 (SNF–RHA). While SNF-KA reduced N input by 66.54 kg N ha−1, SNF–RHA applied more N by 17.90 kg N ha−1 than URN. Additionally, SNF–RHA attempted to equalize yield responses to N across MZ classes, with a small increase in N input. This study, therefore, suggests adopting SNF–RHA for increasing yield and gross margin and accurate distribution of N according to per MZ N response. Future studies, however, should address the limitations of the current study by delineating MZ maps with the incorporation of additional soil information (e.g., mineral N and clay) for optimizing N doses as well as evaluating agroeconomic performance across multiple sites and years using a full-budget analysis.
1. Introduction
Nitrogen (N) is an indispensable element for crop biomass development [1] and yield formation [2], and it, as a major element, interacts at the intersection of the soil–water–air environment [3,4,5,6]. Supplying N to the crop is one of the critical soil functions [7]; however, soil organic matter (SOM) shortages and unfavorable microclimates are among the reasons why soils often fail to provide adequate amounts of N to crops [8,9]. When soils are unable or limited in providing N, critically required bye crops, applying external N is a common farming practice. Traditionally, farmers assume a field is homogenously fertile, hence, apply a uniform rate N (URN) throughout the field area. Nevertheless, most agricultural soils are highly variable at spatially and temporally, which has strong impacts on crop yields and environments [10,11]. Applying N uniformly may exceed the crop needs in some parts of a field where soils are fertile, whereas crops may suffer from N deficiency in parts where soils are not fertile enough [12]. Consequently, below-optimal N rates can reduce the final yield while above-optimal N rates may endanger soil and crop health. Particularly, excess use of N above crop needs can cause surface and groundwater contamination through leaching, run-off and eutrophication [13]. Excessive N inputs can also affect air quality through N volatilization and gasification [14] and, ultimately, cause economic loss to the farmer [15]. Usually, N fertilizer is the most expensive farming input; nevertheless, the recent hike in N prices has made farming more expensive than ever. Therefore, the optimal application of N doses essentially requires efficient technologies, which should minimize environmental risks while maximizing N use efficiency and crop productivity.
Site-specific N fertilization (SNF) has recently drawn mass attention and is a suggested technology to manage in-field variabilities by prescribing optimal but variable N doses across different parts of a field [16]. The first step in implementing SNF is to map within-field soil and crop variations and divide the field area into several homogenous zones (known as management zones, MZs). In particular, the MZ delineation relies on the soil fertility indicators in combination with crop attributes such as crop biomass, vegetation index, greenness index and so on [17,18]. Ideally, MZs should consider multiple soil and crop quality indicators to map the yield potential of a field because none of the single indicators can represent the yield potential of a field or a MZ [19,20,21]. Once a MZ map is available, a certain N rate is assigned to each MZ class by adjusting the usually practiced N dose by some percentages. The percentage of change depends on the degree of within-field variabilities and can be as high as 30% [22]. Therefore, N doses can be higher and lower than the usual N rate. However, there is no scientific method to date to quantitively determine the best N rates except for two methods, i.e., Kings (KA) and Robin Hood (RHA) [23]. The KA method recommends a high N dose for highly fertile MZs, and vice versa (feeding the rich), and RHA suggests a low N rate for highly fertile MZs, and vice versa (feeding the poor). A few SNF studies evaluated the performance of KA and RHA methods. For example, Maleki et al. [24] reported a real-time control study of variable P application rates in maize using the RHA method. Guerrero et al. [25] and Zhang et al. [23] compared the KA and RHA methods for variable rate N management in winter wheat and barley and manure-based P fertilization in winter wheat by altering doses up to ±40%, respectively. Schillaci et al. [22] tested the RHA-based SNF (SNF-RHA) for N topdressing in maize by varying N doses by up to ±30%. Most of these studies concluded that SNF-RHA is more productive and more economically efficient and environmentally sustainable than the SNF-KA and URN approaches. However, no work comparing the two SNF methods for poppy production can be found in the literature to date.
Conflicting results are often reported as well. For example, Basso et al. [26] observed that a high-yielding zone maximized economic return and minimized environmental impacts (low N leaching) when fertilized with 90 kg N ha−1 compared to a low-yielding zone fertilized with 30 kg N ha−1. Not only because of this contradiction but also due to inconsistent economic prospects reported for SNF management [27,28], more and more studies are required to evaluate different methods for recommending variable N rates in order to confirm the benefit of SNF in different crops under different agroecological zones [13,26]. With this, this study is motivated to investigate and compare the two SNF treatments (SNF-KA and SNF-RHA) against URN for poppy production in Spain, the second biggest poppy-producing country in the world [29]. Opium poppy (Papaver somniferum L.) is usually grown for three purposes, i.e., poppy seeds, opium and alkaloids production, while seed yield can vary widely, with an average of around 2.0 t ha−1 [30,31]. Commercially, poppy has multiple values in medicine (e.g., morphine), decoration (as an ornamental plant), and food, while poppy seeds are useful for making porridge, eating raw or being pressed for edible oil [32]. Despite its large economic importance, no previous study has evaluated the agroeconomic and environmental performance of SNF in poppy production. Therefore, this study evaluates the agroeconomic and environmental impact of SNF in opium poppy production and compares the performance of KA and RHA recommendations. It hypothesizes that SNF increases poppy yield and/or reduces N application compared to URN, and that RHA is a better approach than KA from economic and environmental perspectives. The novelty of this study lies in the implementation and validation of an existing methodology of SNF technology in a new crop, i.e., in poppy for the first time. Additionally, it introduces an innovative index, the ‘Field Fertility Index’, designed to optimize the selection of an effective method for recommending variable N rates. The SNF application is based on an MZ map delineated with a multi-sensor data fusion approach that included (i) a set of soil fertility attributes estimated using an on-line soil sensor, (ii) crop normalized difference vegetation index retrieved from Sentinel-2 images and (iii) previous yield records. Finally, it compares the agro-economic and environmental benefits of SNF with URN technologies.
2. Material and Methods
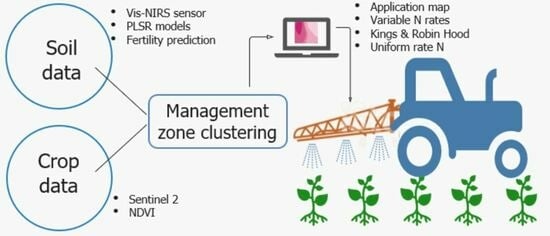
The overall methodology used in this study is illustrated in Figure 1. The simultaneous collection of soil samples and on-line soil sensing was carried out using a mobile visible and near infrared spectroscopy (vis-NIRS) sensing platform [33]. Soil samples were subsequently analyzed to assess soil fertility attributes, which were further used as response variables for modeling vis-NIRS data. Partial least squares regression (PLSR) models were established and validated for each soil property. These models were then used for predicting soil fertility attributes using on-line collected soil spectra. Crop normalized difference vegetation index (NDVI) data were retrieved from Sentinel-2 multispectral images, while yield data were derived from historical records from the 2018 cropping season provided by the farmer. These multi-layered datasets were passed through geostatistical analyses, including variogram modeling and kriging, to enable high-resolution spatial visualization of within-field variability. A cluster analysis was then performed using k-means clustering to establish MZ maps. Each cluster was assigned a fertility level based on yield data, soil fertility attributes and farmer knowledge of their field. The determination of variable N doses per MZ was made using two recommendation methods, namely, KA and RHA, and their performance was compared with the control uniform N dose. Cost–benefit and environmental analyses were conducted to evaluate the performance of the two proposed SNF treatments with the control UNR treatment.
2.1. Experimental Field
The experiment was conducted in an area of about 9 ha within a 50 ha field (39°04′03.8″N, 1°40′03.5″W) at a commercial farm in Albacete, Spain, in 2021 (Figure 2).
In Albacete, the climate is characterized by short, warm and predominantly sunny summers, while winters continue for an extended period, bringing cold temperatures, strong winds and intermittent cloud cover. Precipitation levels remain consistently low throughout the year, resulting in a dry climate. The annual temperature typically varies from 0.6 to 33 °C and is rarely below −4.5 °C or above 36.7 °C. The region experiences a semi-arid Mediterranean climate, known for its significant variations in rainfall during the crop growing season. This variability is accentuated by the limited soil water-holding capacity of the Calcaric Cambisols found in the area, which have shallow subsurface horizons at depths of around 40–80 cm. Irrigation helps in offsetting these challenges. The annual rainy season spans over 10 months, starting in late August and extending through the year until early July, with a 31-day rainfall of at least 1.25 cm per rainy day. October stands out as the wettest month, boasting an average precipitation of 3.3 cm. Particle analysis indicates that the field soil is a sandy loam. Before the year of the experiment in 2019, Garlic (Allium sativum) was grown under an irrigated system.
2.2. On-Line Soil Sensing
In the summer of 2019, spectral measurements were conducted using an on-line soil-sensing platform (Figure 3) originally designed, developed and patented by Mouazen [33]. This platform consists of a subsoiler affixed to a frame that is attached to the standard three-point linkage of a tractor. The subsoiler creates trenches in the soil, reaching depths of 15–20 cm, and smooths the bottom of these trenches through its downward vertical forces. An optical probe, hosted within a mild steel lens holder, is attached to the rear of the subsoiler chisel to capture soil spectra in diffuse reflectance mode from the smoothed trench bottom. To record the soil spectra, a visible and near-infrared spectrophotometer (vis-NIRS) with a detection range spanning from 305 to 1700 nm and a sampling resolution of 1 nm was used (CompactSpec from Tec5 Technology in Germany). A PTFE (polytetrafluoroethylene) disc with ≅99% reflectance and 50 mm in diameter was used as the standard reference, allowing for sensor recalibration every 30 min. A real-time kinematic global positioning system (RTK-GPS) from Trimble Navigation Ltd., based in Sunnyvale, Canada, was employed to record the precise location data of each soil spectrum. These georeferenced soil spectra were recorded at a rate of 1 Hz using a MultiSpec pro-II data logger and an acquisition system by Tec5 Technology in Germany. This equipment was integrated into a semi-rugged computer (Toughbook, Panasonic UK Ltd., Bracknell, UK). The measurement platform traversed parallel transects spaced 12 m apart (Figure 1), maintaining an average forward speed of approximately 3.5 km h−1. While conducting the on-line sensing, a set of 25 soil samples was randomly collected from the trench bottoms, about 20 cm deep. Concurrently, the data logger system recorded around 900 on-line spectra per hectare (ha−1).
2.3. Laboratory Soil Analysis
The fresh soil samples underwent a cleaning process to eliminate non-soil particles, including grass, stones, stubble, roots and any other foreign materials. Subsequently, each soil sample was thoroughly mixed and reduced to 300 g using the standard coning and quartering technique. Soil pH was measured with an electrode meter after making a soil solution with distilled water followed by shaking and settling the suspension for 30 min. The available potassium (K+), magnesium (Mg2+), calcium (Ca2+) and sodium (Na+) were measured in 1 N ammonium acetate (NH4CH3O2) extract with inductively coupled plasma atomic emission spectroscopy (ISO 11885 [34]; CMA2/I/B1). Soil moisture content (MC) was measured by subjecting samples to a 24 h drying at a temperature of 105 °C. Soil phosphorus (P) and SOM were measured using the Olsen [35] and Walkley and Black [36] methods, respectively. Soil organic carbon (OC) was derived from SOM by dividing it by a constant of 1.724 [37], and the ratios of K:Mg and K:Ca were calculated arithmetically.
2.4. Modeling of On-Line Measured Soil Vis-NIR Spectra
The 25 soil samples collected from the field were very limited in calibrating the vis-NIRS sensor; hence, they were merged with selected samples from an existing spectra library (Table 1). The selection of samples was based on the data distribution similarity by projecting histogram, soil origin, type and mineralogy. To improve the signal-to-noise ratio, spectra were then pre-processed using the following steps successively: moving averaging, standard normalization, gap–segment derivatives and Savtizky-Golay filtering (Table 1). On top of this, spectral edges were trimmed to exclude the noisy edges resulting in variable spectral ranges (350 to 1690 nm), which differed among soil properties. To correct the spectral bounce between the two detectors, namely, the visible and NIR detectors at the 1045 nm waveband, a correction method proposed by Mouazen et al. [38] was applied. The pre-processed spectra were then randomly split into calibration (70%) and prediction (30%) datasets. Calibration involved conducting partial least squares regression (PLSR) analyses with leave-one-out cross-validation (LOOCV) on the calibration dataset. Subsequently, the resulting models were validated using the prediction dataset. An individual model was developed for MC, OC, CEC, pH, Ca, Mg, Na, P, K, SOM, Ca:Mg and K:Mg. The selection of the number of latent variables (LV) in PLSR was based on the lowest root mean square error (RMSE) in cross-validation. The predictive performance of each model was assessed using the the coefficient of determination (R2), RMSE, the ratio of prediction to inter-quartile range (RPIQ) and the ratio of prediction to deviation (RPD). All spectral analyses, including data pre-processing and model development, were conducted using the ‘prospectr’ package by Stevens and Ramirez Lopez [39] and the ‘pls’ package by Mevik and Wehrens [40], both available in R CRAN.
2.5. Soil and Crop Data Collection and Mapping
After the PLSR models’ development and validation, models were used to predict each of the soil properties mentioned using the on-line soil spectra. The output of the on-line soil prediction corresponded to one dataset of each of the soil properties with DGPS coordinates. With these datasets, a high-resolution map for each predicted soil property was developed through interpolation by using the ordinary kriging method available in ArcMap (ESRI ArcGIS™ v10.7, Redlands, CA, USA). Before interpolation, semi-variogram models were fitted, whose parameters were used in the interpolation. The kriging maps were then classified into five classes, aiming at critical analyses and visualization purposes. In addition to the on-line soil data, crop NDVIs before the SNF in 2021 and yield records from 2018 were collected. The NDVI data were derived by employing a two-band combination function [41] on the multi-band images obtained from the Sentinel-2 open data hub [42]. These different layers of soil and crop data were used in the delineation of the MZ map, described in the following section.
2.6. Management Zone Delineation
Since clustering requires the same spatial resolution data, all soil and crop maps were transferred into 5 by 5 m resolution by a raster analysis. Cell values of each raster were extracted and joined spatially to create a spatially homogenous data matrix where each pair of coordinates contained information on all variables, i.e., soil properties, NDVI and yield. The k-means clustering was developed in MATLAB software—R2019b, version 9.7.0, (MathWorks, Natick, MA, USA). This algorithm grouped the observations of the data matrix into k clusters and returned the cluster indices of each observation. It used the squared Euclidean distance metric to maximize the between-clusters distances. A normalized means cluster chart was obtained by normalizing the means of clusters of each variable used in the k-means clustering. This explored insights into each variable’s contribution to the clustering process. The optimal number of clusters was made by means of the elbow method. The ranking of the fertility of each management zone was conducted through consultation with the farmer in addition to the analysis of the historical yield data from 2018 and soil fertility for each management zone. This fertility ranking analysis thus facilitated MZ ranking as high (H), medium-high (MH), medium-low (ML) or low (L).
2.7. Variable Rate Fertilization Scheme
Farmers used to calculate N rates based on laboratory soil analyses using 1 or 2 sample ha−1, whose output was used to calculate a N recommended rate that is homogeneous (URN) throughout the entire field area. This study adopted two SNF treatments, i.e., SNF-KA and SNF-RHA, and compared them against the URN treatment. The first SNF applied N according to the KA, e.g., feeding the rich. This was performed by recommending 40–50% more N rates to highly fertile zones (MZ-H), the usual N rate in medium fertile zones and 40–50% less in poorly fertile zones (MZ-L). If the number of MZ classes were five, then the MH fertility zone would receive 20–25% more fertilizer and the ML fertility zone would receive 20–25% less fertilizer than the URN. The second SNF adopted the RHA, which follows the opposite principle to that of the KA. N fertilizer rates of up to +50%, +25%, −25% and −50% were decided upon to ensure measurable differences allowing for comparison among treatments, i.e., URN, SNF-KA and SNF-RHA. The tested percentages were indeed subjective but agreed with farmers and local legislation. Nevertheless, previous studies have reported different N rates to evaluate crop responses to SNF [17].
2.8. On-Field Experimental Design and Application
The map for fertilizer application was created by dividing the field into multiple parallel strips, each being 21 m wide, which corresponded to the width of the available sprayer on the farm. The stripes were superimposed onto the MZ map, leading to a variable count of individual plots within each strip. The number of plots within a strip depended on the number of MZ classes this particular strip intersected. Each strip was assigned as URN, SNF-KA or SNF-RHA treatment, and each treatment was repeated twice (Figure 4). The N rate of each plot was determined according to URN, SNK-KA and SNF-RHA treatments as described before. A georeferenced application map (known as a task card) (Figure 4), as machine-compatible shapefiles containing plot N doses, was created using ArcMap (ESRI ArcGIS™ v10.7, Redlands, CA, USA).
Three applications of granular N fertilizers were made using a twin-disc centrifugal spreader (Kuhn AXIS 40.2 W M EMC, KUHN, Saverne, France). In the first N application 2 days before sowing on 11th February 2021, a commercial product with 18% N concentration was applied to the URN plots at a rate of 195 kg ha−1, while in the SNF plots, doses varied according to the fertility level of a plot, between 97.5 and 292.5 kg ha−1 (±20–40%). In the second application on 9 April, 150 kg N ha−1 was applied in the URN plots and 75–225 kg N ha−1 (±25–50%) in the SNF treatments. In the third application on 5 May, a homogeneous N rate of 215 kg N ha−1 was applied across the entire field area to ensure that the required amount of N was provided to each MZ class. Other management operations, i.e., tillage, irrigation and pesticide applications, were identical across the three treatments.
2.9. Harvest and Gross Margin Analysis
On 13th of July 2021, a total of 119 yield samples were collected by harvesting poppy heads manually, and these were separated and stored in plastic bags for weighing and recording yield. At least 3 samples per plot were confirmed in order to ensure meaningful data analysis. Each sample was collected by harvesting a 1.5 m length of two central rows (0.14 m apart) covering an area of 0.21 m2 each. Gross margins and N use were analyzed considering the yield, costs of machinery hiring and N fertilizer, and market price for yield. Poppy price (930 € t−1) was directly obtained from farmers. The gross margin was calculated by subtracting the price of fertilizer and machinery hiring cost (EUR 15 ha−1) from the selling price of the yield. This type of analysis is well known as a partial budget analysis, which does not determine profitability but the ‘change in profit’ if an alternative is adopted, i.e., SNF instead of URN. Finally, a gross margin per field was simulated as if one treatment was applied throughout the entire field area. Additionally, the total amount of fertilizer applied was compared between treatments, and simulations of fertilizer use and savings per treatment were also calculated.
3. Results
3.1. Prediction Accuracy of On-Line Vis-NIRS Sensor
The developed vis-NIRS spectral models exhibited moderate to highly accurate performance in both calibration and on-line prediction (validation) of the studied soil properties (Table 2). Generally, the calibration phase tended to produce slightly better models compared to the models in the validation phase, a trend often observed in such analyses. Notably, the accuracies of the models varied significantly across soil properties. For example, the soil pH and P models were calibrated with the highest and lowest R2 values of 0.95 and 0.44, respectively. These same properties maintained their order in the test prediction, with slightly reduced R2 values of 0.87 and 0.14, respectively. Furthermore, the cross-validation process resulted in an optimized and finely tuned model, with a very limited number of LV, ranging from 3 to 8. This outcome indicates an overall high stability and reliability of the spectral model, which can be confidently utilized for practical applications.
The vis-NIRS sensor demonstrated remarkable accuracy in predicting nearly all the studied soil properties, with particularly outstanding performance in estimating soil pH (R2 = 0.87, RMSE = 0.25). It was closely followed by the predictions for K (R2 = 0.76, RMSE = 0.43 meq 100 g−1), SOM and SOC (R2 = 0.74, RMSE = 1.76%). The sensor also performed well in predicting MC (R2 = 0.74, RMSE = 4.19%), Ca:Mg (R2 = 0.72, RMSE = 1.02), Mg (R2 = 0.71, RMSE = 0.94 meq 100 g−1) and Ca (R2 = 0.53, RMSE = 4.5 meq 100 g−1). However, there were certain cases where the vis-NIRS sensor did not perform as well as expected. For instance, it underperformed in predicting soil Na (R2 = 0.41, RMSE = 0.21 meq 100 g−1), K:Mg (R2 = 0.38, RMSE = 0.07) and P (R2 = 0.14, RMSE = 4.69 ppm). Overall, the on-line spectral models in the validation tests could be classified as excellent (RPD > 2.5) for pH; very good (RPD = 2.5–2.0) for K; fair (RPD = 1.8–1.4) for Ca; poor (RPD = 1.4–1.0) for P, Na and K:Mg; and good (2.0–1.8) for the remaining properties.
3.2. Within-Field Fertility Variations
Predicted soils maps illustrated substantial within-field variations, concurrently highlighting the robustness of on-line soil prediction and geostatistical interpolation (Figure 5). Notably, spatial patterns exhibited divergence across distinct soil and crop attributes. The majority of the soil properties displayed discernible structural variations, whereas MC exhibited a more stochastic distribution. The upper-right quadrant of the field demonstrated elevated levels of fertility constituents, including pH, P, Mg, Ca and K:Mg, with a moderate enrichment of Na as well. Remarkably expansive ranges were observed in SOM (OC) and MC, explaining the necessity for advanced field management technology like SNF. The observed SOM and OC both remained within a range often recommended for optimal crop development. The field’s soil pH fell within a range indicative of a mildly alkaline nature.
Four MZ classes, as determined by the k-means cluster analyses (Figure 6), were categorized into different fertility levels, namely, H, MH, ML and L (Figure 6b). This classification was based on the within-cluster soil fertility status and farmer experience and knowledge in his field. The ranking of MZ classes was also based on per cluster historical yield maps. Despite the MH fertile MZ having the highest NDVI, it did not have the highest yield, which was recorded in the MZ class H with the highest SOM (and OC), K:Mg, Ca:Mg and K contents but the second highest NDVI. The two least fertile MZ classes (ML and L) strongly agreed with their previous cropping season yield being low, which can be explained by their low fertility levels, e.g., low SOM (and OC), P, NDVI, K:Mg and K. Analyzing the spatial extent of MZ classes indicated that a small part of the experimental field of the current study was highly productive (high fertility), while the largest part was of low productivity (low fertility). Here, the authors introduce a new index called the field fertility index (FFI), which can be calculated as follows:
FFI = area under highly fertile MZ (H + MH) ÷ area under highly and poorly fertile MZ (H + MH + L + ML)
This FFI = 0.26 in this study, meaning that only 26% of the total study area was in a highly fertile class.
3.3. Yield Response to Variable Rates N
Yield response to variable N rates applied in different MZ classes differed across SNF treatments (Figure 7). The N–yield response curve for the SNF-RHA treatment revealed an almost similar yield across all MZ classes fertilized with variable N doses. This indicates that the RHA equalized yield across different fertility level MZs by recommending a complementary N rate redistributed among MZ classes. The SNF-KA method illustrated a typical N–yield response curve, i.e., increasing yield with increased N doses, reaching a peak value, after which it preserved a plateau stage or declined slowly. In the least fertile MZ (L), yield dropped significantly due to the lowest N dose prescribed by the SNF-KA (b in Figure 7), but SNF-RHA yielded much more in the L fertile MZ than the comparative zone under SNF-KA. Indeed, the yield in the MZs under SNF-RHA increased slightly with the increase in N dose to the highest level at the L fertility zone (Figure 7). The application of high N doses increased yield of the highly fertile MZ class H under SNF-KA. However, the increased N dose in the MH zone did not lead to yield improvement in this zone compared to the ML zone. It is most important to highlight that the yield for all MZ classes for SNF-RHA was larger than that for the URN treatment, while the yields of ML, MH and H MZs for SNF-KA were higher than that for the URN treatment. Yields of both the MH and H fertile MZs for SNF-KA were slightly and clearly higher, respectively, than the corresponding MZs’ yields for SNF-RHA.
3.4. Cost–Benefit and N Use Analyses
The implementation of SNF treatments yielded an average yield enhancement compared to the URN approach, consequently resulting in a corresponding elevation in overall gross production (Table 3). Among these treatments, SNF-RHA produced the highest average yield (2.74 t ha−1), closely followed by SNF-KA (2.72 t ha−1) and URN (2.64 t ha−1). In tandem with this yield enhancement, SNF-RHA distinctly provided a more substantial revenue stream, reaching EUR 2546.3 ha−1, surpassing both SNF-KA (EUR 2531.7 ha−1) and URN (EUR 2454.3 ha−1) treatments. However, SNF-KA and SNF-RHA increased gross margins almost equally by EUR 91 and 88.4 ha−1, respectively, in comparison to URN.
Examining the amount of N used by the three different treatments revealed that SNF-KA reduced the N input applied (493.5 kg N ha−1) compared to URN (560 kg N ha−1). Conversely, SNF-RHA showcased elevated N use (577.9 kg N ha−1). The field-scale simulation showed that SFN-KA had the potential to reduce N input by 594.2 kg, while SNF-RHA was likely to increase N input by 159.9 kg within the experimental area (approximately 9 ha). Despite this fact, both SNF treatments were effective in increasing yield, while only SNF-KA reduced N input. Intriguingly, while using slightly extra N, SNF-RHA led to yield increases surpassing those in both SNF-KA and URN treatments.
4. Discussion
4.1. Spectral Models and Within-Field Fertility
The current performance accuracies (Table 2) of vis-NIRS sensors in predicting multiple soil fertility indicators are comparable with those reported in previous studies [20,43,44,45]. The low number of LV observed in this study is in line with results reported in the literature [46,47,48], which is an indication of the model’s robustness and reliability. It is worth noting that the current spectral models were developed based on the leave-one-out cross-validation criterion, and these models were validated using an independent prediction dataset. However, a recent study has raised concerns regarding the use of leave-one-out cross-validation, suggesting the use of a random subset instead [49]. This new suggested methodology of cross-validation can be tested in the future, as the current work was conducted in 2019, much earlier than the recent suggestion became available in 2023. The closely similar accuracy observed for SOC and SOM can attributed to their direct associations. Usually, vis-NIRS is less accurate in predicting the secondary attributes (e.g., K, Na, Ca) than the primary soil attributes (e.g., OC, MC) [43,45], which is in line with the results obtained in the current study. Since the soil was very dry during the on-line measurement in 2018 (4–12%), high levels of noise due to vibrations may have negatively affected the spectral quality, and the quality of predictions. Despite these harsh measurement conditions, the accuracy for all properties was in the excellent to good range, except for the low prediction accuracy for P and Na. The low accuracy observed for the P and Na models can be attributed to the low MC, as it was documented that the prediction of P [50] and Na [45] is possible due to their covariation with soil MC- and MC-sensitive spectral bands, which are indeed not strongly featured in this study. Generally, such covariations of secondary soil properties, i.e., P, K, Mg, Na and Ca with MC in the 350–1700 nm spectral range, are attributed to the O-H absorption overtone region around 1400–1450 nm [45]. Munnaf et al. [45] reported that some bands can make Mg (1056 nm) and K (1158 nm) predictions possible due to the covariation with aromatic C-H absorption around 1100 nm, and that Na (1550 nm) and Mg (1510 nm) were possible to predict mainly because of the indirect association with amine N-H absorption around 1500 nm. Additionally, several bands within the visible spectral range were found to be key to predict secondary properties. For example, 456 nm and 460 nm together with 571 nm are associated with successful prediction of pH and Mg, through the possible associations with soil albedo due to soil MC and SOM. The key bands for predicting Ca were the same as those for pH prediction, and 560 nm along with 770 nm were observed to support Na prediction. Another possible reason for low accurate predictions could be the availability of a limited dataset during model development, with a critical shortfall in the sample size, as only 25 samples were collected from the specific field of study. After all, most of the current models met the criteria established by Maleki et al. [24], requiring a model to achieve R2 ≥ 0.70 and RPD ≥ 1.75 to be considered a reliable model for the development of site-specific applications.
Despite observing structural variability in soil fertility maps (Figure 5), abrupt alterations observed in on-line predicted MC maps can be attributed to the highly dynamic nature of MC compared to other soil properties. Areas with high pH contents resembled Mg-, P- and Ca-rich areas, confirming the influence of those nutrients on pH. Soil P availability to crops is constrained to both alkaline and acid soils, affecting crop root development severely, primarily because P plays a pivotal role in cell division. A pH between 6 and 7.5 is often considered as an ideal soil acidity for P availability, but this was not the case in the study field, where pH was more than 8. High pH (7–8.5) also influences soil’s Mg availability. Noticeably, high variations in Ca:Mg and K:Mg maps should be given special attention in crop management decisions because of their antagonistic interactions, i.e., the presence of one can limit the availability of another [1,51]. Accordingly, studies recommended retaining a proper ratio of Ca2+ to Mg2+ prior to making a nutrient management decision and managing soil acidity through liming [51,52]. On the contrary, research suggested confirming an optimal level of soil Ca and Mg for best crop growth instead of altering the Ca2+:Mg2+ ratio [53]. The antagonistic effect of K on Mg was reported to be stronger than the effect of Mg on K availability [54]; however, such influences as well as balanced ratios depend on crop and soil types [55]. Therefore, the fusion of multiple fertility indicators in the MZ delineation is the ideal option as it allows for the determination of key yield-limiting factors and thus optimizes management decisions [56,57].
The lack of alignment between yield and NDVI variability among MZ classes (Figure 6) raises concerns about the reliability of using NDVI for ranking soil fertility classes, a practice often employed for making management decisions. Many studies found NDVI to have a strong correlation with crop yield [58], hence, this was adopted in this study as a MZ proxy. The opposite suggestion was also reported, i.e., NDVI cannot be an MZ proxy directly, and the use of NDVI should be carefully interpreted [59]. The weak correlation between NDVI and yield when encountered can be attributed to biotic and abiotic stresses at the late stages of the cropping season [60]. Nevertheless, NDVI in the current work correlated with crop yield quite well, particularly for the H and MH fertile MZs. This suggests that relying solely on NDVI for decision making on N fertilization should be given special care, particularly regarding the selection of the best crop growth stage for NDVI data collection [61,62]. The use of time-series NDVI data instead of a single NDVI measurement is highly recommended [18], although this was not the case in this study.
4.2. Influences of Site-Specific N Applications
Looking at the N–yield response curve (Figure 7) observed for SNF-KA reveals that KA recommended a lower than necessary N dose for the poorly fertile MZ (L), which deteriorated its fertility further because of its low N mineralization potential, limiting crop growth and final yield. A yield improvement was not possible to observe even after applying an elevated N dose in the MH fertile MZ, indicating the optimal N consumption to grow marginally, but carried risks of increasing residual N accumulation in the soil and N leaching [63]. It is worth noting that a yield–N response curve like the current one for the SNF-KA approach was possible to derive from the data reported by Guerrero et al. [25], where SNF-KA diminished barley yields by increasing the N doses over the usual dose, and SNF-RHA led to a nearly equal yield over variable N doses. The yield response to increased N can be mediated by the increased capturing of solar radiation, which is in turn mediated by improved tillering and leaf enlargement and enhanced photosynthesis [64]. N application amplifies crop yield, but an overdose of N can reduce yield due to lodging [23] and foliar infections [64].
Almost homogenous poppy yields among MZ classes under SNF-RHA treatment explain that the low fertility (L and ML) MZ classes required supplementary high N doses, whereas the highly fertile MZ classes (MH and H) did not require this, but were able to provide adequate amounts of N, allowing crops to grow optimally. This was possible for the highly fertile MZs (H and MH) due to their high potential of mineral N release by the naturally occurring soil N mineralization process [65,66] since both H and MH fertile MZ classes possess higher SOM than ML and L fertile MZ classes (Figure 6). Apart from soil microclimate conditions, soil N mineralization largely depends on SOM, which can influence microbial activity and microbial biomass [67]. This means that the H and MH fertility MZs had higher N mineralization potential under favorable soil micro-climatic conditions (e.g., temperature, pH, redox, MC, texture) than the ML and L MZ classes; however, the current study does not have sufficient data to support the quantification of N mineralization potential. It is worth noting that poppy yields can vary widely (1.5–3.0 t ha−1) depending on the local weather conditions, cultivar used, seeding rates and inter-cultural management including N rate, irrigation and agrochemicals application, limiting a fair comparison between the yield obtained in the current work with those reported in the literature [30,31].
The estimated cost–benefits (Table 3) in these studies to some extent agreed with those in the literature that site-specific fertilization increases the gross margin compared to URN for cereal crops. Guerrero et al. [25] reported enhanced gross margins of EUR 129.27–148.78 ha−1 and EUR 4.85–16.40 ha−1 by SNF technology in barley and wheat, respectively. Zhang et al. [23] observed an increase in gross margins ranging between EUR 36.32 and 40.06 ha−1 by applying variable rate manure using the same data fusion approach as that of the current study. Another work reported a net return of EUR 15.2–24.64 ha−1 from SNF in maize compared to URN [12]. Recently, Munnaf et al. [68] reported SNF to increase gross margins by EUR 43.93 ha−1 in winter wheat production by implementing a novel map–sensor-based technology for variable rate N management.
The potential of SNF in reducing N use (Table 3) observed in this study both partially agreed as well as contradicted to observations reported in the literature. Guerrero et al. [25] found SNF-KA (15.22 kg N ha−1) to increase and SNF-RHA (7.79 kg N ha−1) to decrease N inputs in barley production; however, both SNF treatments reduced N (2.10–26.83 kg N ha−1) compared to URN in wheat. For site-specific manure application, Zhang et al. [23] showed that SNF-KA consumed additional N (5.21 kg N ha−1) and P (1.63 kg N ha−1), while SNF-RHA reduced both N (11.01 kg N ha−1) and P (7.1 kg N ha−1) compared to uniform rate manure application in wheat. Such conflicting findings could be due to the FFI, reflecting the proportion of highly (H and MH) fertile areas to the total area under both highly and poorly fertile zones, which is in line with what was pointed out by Pedersen and Lind [69]. As such, most of the field area of the study field was classified as poorly fertile (ML and L fertile MZs), covering three-fourths of the total field area (FFI = 0.26). This is the reason why the RHA treatment applied high N doses for about three-quarters of the total area, leading to an increase in the average N dose, which, in turn, reduced the corresponding gross margin [15]. Contrarily, SNF-KA applied high N doses only over a small area (in H and MH fertile MZs), leading to a reduction in N use. Generally, SNF has the potential not only to decrease N costs but also to prevent agroecosystems from N-based contamination, e.g., leaching, emission and residue [70,71]. Increasing gross margins and reducing environmental footprints are expected benefits of SNF, as observed in this study, at least for SNF-KA, and as reported earlier [15,16,28,72].
4.3. Possible Limitations
Despite observing a positive gross margin and poppy yield as well as a reduction in N use through the proposed SNF technology, this study acknowledges a couple of possible limitations around spectral modeling, MZ mapping, N dose calculation, the duration of the trial and economic analysis. The quality of the spectral models seemed not the best mainly because of the dry soil conditions during soil scanning in 2018. The limited number of samples collected from the study field and used in the model training allowed to use PLSR only in spectra modelling instead of intelligent learning algorithms, e.g., artificial neural networks. It is highly possible to improve vis-NIRS spectral prediction accuracy by increasing the number of observations, thus taking the benefit of using advanced machine and/or deep learning techniques. The quality of spectral predictions also determines the quality of MZ maps, which is the backbone of SNF. To develop the MZ map, several key soil fertility attributes were used in the current work, while excluding soil mineral N and clay, which are two critical soil fertility indicators for deciding upon N doses. Therefore, a future study should take clay and N information into account for MZ delineation and determining variable N doses. Variable N dose per each MZ class was based on the arbitrary percentage increase or decrease of the uniform rate N dose, which is not the optimal N dose. Ideally, N dose should be calculated as a function of soil fertility per MZ based on long-term experimental data, which were not available in this study.
The current findings relied on a single-site-year experiment, limiting the generalization of the results achieved, despite being promising, as this agronomic study was highly sensitive to weather conditions. Particularly, the amount of rainfall and temperature can largely affect the crop yield and N use efficiency. Therefore, we suggest a careful interpretation of the current agronomic, economic and environmental benefits while comparing them with existing studies as well as any future studies to come. Future work should consider several field experiments that are run for several cropping seasons to arrive at robust conclusions regarding the benefits.
The cost–benefit analysis of the current work relied on a partial budgeting method, which is indeed an acceptable economic tool due to the lack of appropriate data required to use a full-budget economic analysis, which is a more realistic analysis compared to partial budgeting. Given that the partial budget analysis showed inconsistent economic performances, this study foresees the need to use a full-budget analysis of the proposed SNF in the future.
5. Conclusions
The current findings confirm that site-specific N fertilization (SNF) enhances poppy productivity, similar to earlier reports of different crops [25,72,73]. Despite contradictory results on the reduction in N use observed for the current Kings (KA)- and Robin Hood (RHA)-based SNF treatments, both approaches increased yield. While using slightly extra N, SNF-RHA led to yield increases compared to both SNF-KA and URN. Although SNF-RHA has proven its efficacy in reducing N inputs in previous studies, it equalized yields across all MZ classes in the current work, and this was indeed one of the expected outcomes of site-specific N management. The slightly high N consumption by SNF-RHA is attributed to the small field fertility index (FFI), i.e., three-quarters of the field area was of the low and medium-low fertility classes. Therefore, RHA seems to be an economic and environmentally friendly N recommendation approach. However, the influence of FFI on the N prescription decision should be evaluated in future works. This study at this stage confirms that SNF in poppy production is economically feasible but its sustainability aspects largely depend on how accurate N prescriptions are and, thus, N doses must be decided upon carefully. It is worth noting that the current study has several limitations, i.e., a small dataset used in spectral modeling, key information missing in MZ mapping, arbitrarily decided N doses, single-year experiment and partial-budget economic analysis. Future studies, therefore, should address these limitations by increasing the sample size for vis-NIRS sensor calibration and delineating MZ maps with the incorporation of additional soil information (e.g., mineral N and clay) for optimizing N doses as well as evaluating agroeconomic performance across multiple sites and years using a full-budget analysis.
Author Contributions
Conceptualization: M.A.M., A.M.M. and A.G.; Methodology: A.M.M. and A.G.; Software: A.G.; Validation: A.G. and M.C.; Formal analysis: A.G. and M.A.M.; Investigation: A.M.M., A.G. and M.C.; Resources: M.C.; Data curation: A.G. and M.A.M.; Writing—original draft preparation: M.A.M.; Writing—review and editing: A.M.M., A.G. and M.C.; Visualization: A.G. and M.A.M.; Supervision: A.M.M.; Project administration: A.M.M.; Funding acquisition: A.M.M. All authors have read and agreed to the published version of the manuscript.
Funding
The authors acknowledge the financial support received from the European Commission for ‘Sino-EU Soil Observatory for Intelligent Land Use Management’—‘SIEUSOIL’ project (no. 818346) and ‘Stepping up and bringing out the scientific excellence and innovation capacity in soil research of the University of Lisbon’—‘SOILdarity’ (no. 952051).
Data Availability Statement
The data presented in this study are available on request from the corresponding author. The data are not publicly available due to privacy reasons.
Conflicts of Interest
The authors declare no conflict of interest.
References
- Koch, M.; Naumann, M.; Pawelzik, E.; Gransee, A.; Thiel, H. The Importance of Nutrient Management for Potato Production Part I: Plant Nutrition and Yield. Potato Res. 2020, 63, 97–119. [Google Scholar] [CrossRef]
- Silva, J.G.; França, M.G.C.; Gomide, F.T.F.; Magalhaes, J.R. Different Nitrogen Sources Affect Biomass Partitioning and Quality of Potato Production in a Hydroponic System. Am. J. Potato Res. 2013, 90, 179–185. [Google Scholar] [CrossRef]
- Bünemann, E.K.; Schwenke, G.D.; Van Zwieten, L. Impact of Agricultural Inputs on Soil Organisms—A Review. Aust. J. Soil Res. 2006, 44, 379–406. [Google Scholar] [CrossRef]
- Carpenter, S.R.; Caraco, N.F.; Correll, D.L.; Howarth, R.W.; Sharpley, A.N.; Smith, V.H. Nonpoint Pollution of Surface Waters with Phosphorus and Nitrogen. Ecol. Appl. 1998, 8, 559–568. [Google Scholar] [CrossRef]
- Grizzetti, B.; Bouraoui, F.; Aloe, A. Changes of Nitrogen and Phosphorus Loads to European Seas. Glob. Chang. Biol. 2012, 18, 769–782. [Google Scholar] [CrossRef]
- Windolf, J.; Blicher-Mathiesen, G.; Carstensen, J.; Kronvang, B. Changes in Nitrogen Loads to Estuaries Following Implementation of Governmental Action Plans in Denmark: A Paired Catchment and Estuary Approach for Analysing Regional Responses. Environ. Sci. Policy 2012, 24, 24–33. [Google Scholar] [CrossRef]
- Bünemann, E.K.; Bongiorno, G.; Bai, Z.; Creamer, R.E.; De Deyn, G.; de Goede, R.; Fleskens, L.; Geissen, V.; Kuyper, T.W.; Mäder, P.; et al. Soil Quality—A Critical Review. Soil Biol. Biochem. 2018, 120, 105–125. [Google Scholar] [CrossRef]
- Khan, S.A.; Mulvaney, R.L.; Hoeft, R.G. A Simple Soil Test for Detecting Sites That Are Nonresponsive to Nitrogen Fertilization. Soil Sci. Soc. Am. J. 2001, 65, 1751–1760. [Google Scholar] [CrossRef]
- Mulvaney, R.L.; Khan, S.A.; Hoeft, R.G.; Brown, H.M. A Soil Organic Nitrogen Fraction That Reduces the Need for Nitrogen Fertilization. Soil Sci. Soc. Am. J. 2001, 65, 1164–1172. [Google Scholar] [CrossRef]
- Sanches, G.M.; Graziano Magalhães, P.S.; Junqueira Franco, H.C. Site-Specific Assessment of Spatial and Temporal Variability of Sugarcane Yield Related to Soil Attributes. Geoderma 2019, 334, 90–98. [Google Scholar] [CrossRef]
- Spomer, R.G.; Piest, R.F. Soil Productivity and Erosion of Iowa Loess Soils. Trans. ASAE 1982, 25, 1295–1299. [Google Scholar] [CrossRef]
- Koch, B.; Khosla, R.; Frasier, W.M.; Westfall, D.G.; Inman, D. Economic Feasibility of Variable-Rate Nitrogen Application Utilizing Site-Specific Management Zones. Agron. J. 2004, 96, 1572–1580. [Google Scholar] [CrossRef]
- Basso, B.; Fiorentino, C.; Cammarano, D.; Schulthess, U. Variable Rate Nitrogen Fertilizer Response in Wheat Using Remote Sensing. Precis. Agric. 2016, 17, 168–182. [Google Scholar] [CrossRef]
- Grace, P.R.; Philip Robertson, G.; Millar, N.; Colunga-Garcia, M.; Basso, B.; Gage, S.H.; Hoben, J. The Contribution of Maize Cropping in the Midwest USA to Global Warming: A Regional Estimate. Agric. Syst. 2011, 104, 292–296. [Google Scholar] [CrossRef]
- Link, J.; Graeff, S.; Batchelor, W.D.; Claupein, W. Evaluating the Economic and Environmental Impact of Environmental Compensation Payment Policy under Uniform and Variable-Rate Nitrogen Management. Agric. Syst. 2006, 91, 135–153. [Google Scholar] [CrossRef]
- Diacono, M.; Rubino, P.; Montemurro, F. Precision Nitrogen Management of Wheat. A Review. Agron. Sustain. Dev. 2013, 33, 219–241. [Google Scholar] [CrossRef]
- Nawar, S.; Corstanje, R.; Halcro, G.; Mulla, D.; Mouazen, A.M. Delineation of Soil Management Zones for Variable-Rate Fertilization. In Advances in Agronomy; Spark, D.L., Ed.; Academic Press: Amsterdam, The Netherlands, 2017; Volume 143, pp. 175–245. ISBN 9780128124215. [Google Scholar]
- Rokhafrouz, M.; Latifi, H.; Abkar, A.A.; Wojciechowski, T.; Czechlowski, M.; Naieni, A.S.; Maghsoudi, Y.; Niedbała, G. Simplified and Hybrid Remote Sensing-Based Delineation of Management Zones for Nitrogen Variable Rate Application in Wheat. Agriculture 2021, 11, 1104. [Google Scholar] [CrossRef]
- Munnaf, M.A.; Haesaert, G.; Van Meirvenne, M.; Mouazen, A.M. Multi-Sensors Data Fusion Approach for Site-Specific Seeding of Consumption and Seed Potato Production. Precis. Agric. 2021, 22, 1890–1917. [Google Scholar] [CrossRef]
- Munnaf, M.A.; Haesaert, G.; Van Meirvenne, M.; Mouazen, A.M. Site-Specific Seeding Using Multi-Sensor and Data Fusion Techniques: A Review. In Advances in Agronomy; Spark, D.L., Ed.; Academic Press: Amsterdam, The Netherlands, 2020; Volume 161, pp. 241–323. [Google Scholar]
- Guerrero, A.; De Neve, S.; Mouazen, A.M. Current Sensor Technologies for In Situ and On-Line Measurement of Soil Nitrogen for Variable Rate Fertilization: A Review. In Advances in Agronomy; Academic Press: Amsterdam, The Netherlands, 2021; Volume 168, pp. 1–38. ISBN 9780128245897. [Google Scholar]
- Schillaci, C.; Tadiello, T.; Acutis, M.; Perego, A. Reducing Topdressing N Fertilization with Variable Rates Does Not Reduce Maize Yield. Sustainability 2021, 13, 8059. [Google Scholar] [CrossRef]
- Zhang, J.; Guerrero, A.; Mouazen, A.M. Map-Based Variable-Rate Manure Application in Wheat Using a Data Fusion Approach. Soil Tillage Res. 2021, 207, 104846. [Google Scholar] [CrossRef]
- Maleki, M.R.; Mouazen, A.M.; De Ketelaere, B.; Ramon, H.; De Baerdemaeker, J. On-the-Go Variable-Rate Phosphorus Fertilisation Based on a Visible and near-Infrared Soil Sensor. Biosyst. Eng. 2008, 99, 35–46. [Google Scholar] [CrossRef]
- Guerrero, A.; De Neve, S.; Mouazen, A.M. Data Fusion Approach for Map-Based Variable-Rate Nitrogen Fertilization in Barley and Wheat. Soil Tillage Res. 2021, 205, 104789. [Google Scholar] [CrossRef]
- Basso, B.; Ritchie, J.T.; Cammarano, D.; Sartori, L. A Strategic and Tactical Management Approach to Select Optimal N Fertilizer Rates for Wheat in a Spatially Variable Field. Eur. J. Agron. 2011, 35, 215–222. [Google Scholar] [CrossRef]
- Khakbazan, M.; Moulin, A.; Huang, J. Economic Evaluation of Variable Rate Nitrogen Management of Canola for Zones Based on Historical Yield Maps and Soil Test Recommendations. Sci. Rep. 2021, 11, 4439. [Google Scholar] [CrossRef] [PubMed]
- Wang, D.; Prato, T.; Qiu, Z.; Kitchen, N.R.; Sudduth, K.A. Economic and Environmental Evaluation of Variable Rate Nitrogen and Lime Application for Claypan Soil Fields. Precis. Agric. 2003, 4, 35–52. [Google Scholar] [CrossRef]
- Sevillano, E.G. Death among Spain’s Poppy Fields. Available online: https://english.elpais.com/elpais/2016/08/16/inenglish/1471351892_433825.html (accessed on 15 December 2022).
- Ograjšek, S.; Kastelec, D.; Kocjan, D.A. The Impact of the Period of Sowing and Fertilization on Morphological Characteristics and Seed Yield of Garden Poppy (Papaver somniferum L.). Acta Agric. Slov. 2016, 107, 219–228. [Google Scholar] [CrossRef]
- Neugschwandtner, R.W.; Dobos, G.; Wagentristl, H.; Lošák, T.; Klimek-Kopyra, A.; Kaul, H.P. Yield and Yield Components of Winter Poppy (Papaver somniferum L.) Are Affected by Sowing Date and Sowing Rate under Pannonian Climate Conditions. Agriculture 2023, 13, 997. [Google Scholar] [CrossRef]
- Jesus, A.; Bonhomme, V.; Evin, A.; Ivorra, S.; Soteras, R.; Salavert, A.; Antolín, F.; Bouby, L. A Morphometric Approach to Track Opium Poppy Domestication. Sci. Rep. 2021, 11, 9778. [Google Scholar] [CrossRef]
- Mouazen, A.M. Soil Survey Device. International Publication Published under the Patent Cooperation Treaty (PCT). World Intellectual Property Organization, International Bureau. International Publication Number: WO2006/015463; PCT/BE2005/000129; IPC: G01N21/00; G01N21/0 2006; International Publication Published under the Pate. Available online: https://patentscope2.wipo.int/search/en/detail.jsf?docId=WO2006015463 (accessed on 17 November 2023).
- ISO 11885:2007; Determination of Selected Elements by Inductively Coupled Plasma Optical Emission Spectrometry (ICP-OES). International Organization for Standardization: Geneva, Switzerland, 2007.
- Olsen, S.R. Estimation of Available Phosphorus in Soils by Extraction with Sodium Bicarbonate; US Department of Agriculture: Washington, DC, USA, 1954.
- Walkley, A.; Black, I.A. An Examination of the Degtjareff Method for Determining Soil Organic Matter, and a Proposed Modification of the Chromic Acid Titration Method. Soil Sci. 1934, 37, 29–38. [Google Scholar] [CrossRef]
- Pribyl, D.W. A Critical Review of the Conventional SOC to SOM Conversion Factor. Geoderma 2010, 156, 75–83. [Google Scholar] [CrossRef]
- Mouazen, A.M.; Maleki, M.R.; Cockx, L.; Van Meirvenne, M.; Van Holm, L.H.J.; Merckx, R.; De Baerdemaeker, J.; Ramon, H. Optimum Three-Point Linkage Set up for Improving the Quality of Soil Spectra and the Accuracy of Soil Phosphorus Measured Using an on-Line Visible and near Infrared Sensor. Soil Tillage Res. 2009, 103, 144–152. [Google Scholar] [CrossRef]
- Stevens, A.; Ramirez Lopez, L. An Introduction to the Prospectr Package. Available online: https://cran.r-project.org/web/packages/prospectr/vignettes/prospectr.html (accessed on 1 January 2019).
- Mevik, B.H.; Wehrens, R. The Pls Package: Principal Component and Partial Least Squares Regression in R. J. Stat. Softw. 2007, 18, 1–24. [Google Scholar] [CrossRef]
- Sellers, P.J. Canopy Reflectance, Photosynthesis and Transpiration. Int. J. Remote Sens. 1985, 6, 1335–1372. [Google Scholar] [CrossRef]
- ESA Radiometric—Resolutions—Sentinel-2 MSI—User Guides—Sentinel Online. Available online: https://sentinel.esa.int/web/sentinel/user-guides/sentinel-2-msi/resolutions/radiometric (accessed on 19 May 2020).
- Kuang, B.; Mahmood, H.S.; Quraishi, M.Z.; Hoogmoed, W.B.; Mouazen, A.M.; van Henten, E.J. Sensing Soil Properties in the Laboratory, In Situ, and On-Line. Adv. Agron. 2012, 114, 155–223. [Google Scholar] [CrossRef]
- Marín-González, O.; Kuang, B.; Quraishi, M.Z.; Munóz-García, M.Á.; Mouazen, A.M. On-Line Measurement of Soil Properties without Direct Spectral Response in near Infrared Spectral Range. Soil Tillage Res. 2013, 132, 21–29. [Google Scholar] [CrossRef]
- Munnaf, M.A.; Nawar, S.; Mouazen, A.M. Estimation of Secondary Soil Properties by Fusion of Laboratory and On-Line Measured Vis–NIR Spectra. Remote Sens. 2019, 11, 2819. [Google Scholar] [CrossRef]
- Kuang, B.; Mouazen, A.M. Calibration of Visible and near Infrared Spectroscopy for Soil Analysis at the Field Scale on Three European Farms. Eur. J. Soil Sci. 2011, 62, 629–636. [Google Scholar] [CrossRef]
- Mouazen, A.M.; Maleki, M.R.; De Baerdemaeker, J.; Ramon, H. On-Line Measurement of Some Selected Soil Properties Using a VIS-NIR Sensor. Soil Tillage Res. 2007, 93, 13–27. [Google Scholar] [CrossRef]
- Nawar, S.; Mouazen, A.M. Predictive Performance of Mobile Vis-near Infrared Spectroscopy for Key Soil Properties at Different Geographical Scales by Using Spiking and Data Mining Techniques. Catena 2017, 151, 118–129. [Google Scholar] [CrossRef]
- Lopez, E.; Etxebarria-Elezgarai, J.; Amigo, J.M.; Seifert, A. The Importance of Choosing a Proper Validation Strategy in Predictive Models. A Tutorial with Real Examples. Anal. Chim. Acta 2023, 1275, 341532. [Google Scholar] [CrossRef]
- Munnaf, M.A.; Guerrero, A.; Nawar, S.; Haesaert, G.; Van Meirvenne, M.; Mouazen, A.M. A Combined Data Mining Approach for On-Line Prediction of Key Soil Quality Indicators by Vis-NIR Spectroscopy. Soil Tillage Res. 2021, 205, 104808. [Google Scholar] [CrossRef]
- Osemwota, I.O.; Omueti, J.A.I.; Ogboghodo, A.I. Effect of Calcium/Magnesium Ratio in Soil on Magnesium Availability, Yield, and Yield Components of Maize. Commun. Soil Sci. Plant Anal. 2007, 38, 2849–2860. [Google Scholar] [CrossRef]
- Tisdale, S.L.; Nelson, W.L.; Beaton, J.B. Soil Fertility and Fertilizers, 4th ed.; Collier–Macmillan Coy: New York, NY, USA, 1985; Volume 4. [Google Scholar]
- Fox, R.H.; Piekielek, W.P. Soil Magnesium Level, Corn (Zea mays L.) Yield, and Magnesium Uptake. Commun. Soil Sci. Plant Anal. 1984, 15, 109–123. [Google Scholar] [CrossRef]
- Laekemariam, F.; Kibret, K.; Shiferaw, H. Potassium (K)-to-Magnesium (Mg) Ratio, Its Spatial Variability and Implications to Potential Mg-Induced K Deficiency in Nitisols of Southern Ethiopia. Agric. Food Secur. 2018, 7, 13. [Google Scholar] [CrossRef]
- Xie, K.; Cakmak, I.; Wang, S.; Zhang, F.; Guo, S. Synergistic and Antagonistic Interactions between Potassium and Magnesium in Higher Plants. Crop J. 2021, 9, 249–256. [Google Scholar] [CrossRef]
- Adamchuk, V.I.; Viscarra Rossel, R.A.; Sudduth, K.A.; Lammers, P.S. Sensor Fusion for Precision Agriculture Viacheslav. In Sensor Fusion—Foundation and Applications; InTech: Singapore, 2011; Volume 3, pp. 27–40. ISBN 978-953-307-446-7. [Google Scholar]
- Shaddad, S.M.; Madrau, S.; Castrignanò, A.; Mouazen, A.M. Data Fusion Techniques for Delineation of Site-Specific Management Zones in a Field in UK. Precis. Agric. 2016, 17, 200–217. [Google Scholar] [CrossRef]
- Padilla, F.M.; Gallardo, M.; Peña-Fleitas, M.T.; De Souza, R.; Thompson, R.B. Proximal Optical Sensors for Nitrogen Management of Vegetable Crops: A Review. Sensors 2018, 18, 2083. [Google Scholar] [CrossRef] [PubMed]
- Gianquinto, G.; Orsini, F.; Fecondini, M.; Mezzetti, M.; Sambo, P.; Bona, S. A Methodological Approach for Defining Spectral Indices for Assessing Tomato Nitrogen Status and Yield. Eur. J. Agron. 2011, 35, 135–143. [Google Scholar] [CrossRef]
- Whetton, R.; Zhao, Y.; Mouazen, A.M. Quantifying Individual and Collective Influences of Soil Properties on Crop Yield. Soil Res. 2017, 56, 19–27. [Google Scholar] [CrossRef]
- Bannari, A.; Morin, D.; Bonn, F.; Huete, A.R. A Review of Vegetation Indices. Remote Sens. Rev. 1995, 13, 95–120. [Google Scholar] [CrossRef]
- Munnaf, M.A.; Haesaert, G.; Van Meirvenne, M.; Mouazen, A.M. Map-Based Site-Specific Seeding of Consumption Potato Production Using High-Resolution Soil and Crop Data Fusion. Comput. Electron. Agric. 2020, 178, 105752. [Google Scholar] [CrossRef]
- Godard, C.; Roger-Estrade, J.; Jayet, P.A.; Brisson, N.; Le Bas, C. Use of Available Information at a European Level to Construct Crop Nitrogen Response Curves for the Regions of the EU. Agric. Syst. 2008, 97, 68–82. [Google Scholar] [CrossRef]
- Gastal, F.; Lemaire, G.; Durand, J.-L.; Louarn, G. Quantifying Crop Responses to Nitrogen and Avenues to Improve Nitrogen-Use Efficiency. In Crop Physiology, 2nd ed.; Academic Press; Elsevier: San Diego, CA, USA, 2015. [Google Scholar] [CrossRef]
- Recous, S.; Robin, D.; Darwis, D.; Mary, B. Soil Inorganic N Availability: Effect on Maize Residue Decomposition. Soil Biol. Biochem. 1995, 27, 1529–1538. [Google Scholar] [CrossRef]
- Ruma, F.Y.; Munnaf, M.A.; Neve, S.D.; Mouazen, A.M. Management Zone-Specific N Mineralization Rate Estimation in Unamended Soil. In Proceedings of the 15th International Conference on Precision Agriculture, Minneapolis, MN, USA, 26–29 June 2022; International Society of Precision Agriculture, IL: Minneapolis, MN, USA, 2022; pp. 1–13. [Google Scholar]
- Côté, L.; Brown, S.; Paré, D.; Fyles, J.; Bauhus, J. Dynamics of Carbon and Nitrogen Mineralization in Relation to Stand Type, Stand Age and Soil Texture in the Boreal Mixedwood. Soil Biol. Biochem. 2000, 32, 1079–1090. [Google Scholar] [CrossRef]
- Munnaf, M.A.; Castillo, A.G.; Mouazen, A.M. A Novel Approach to Map-Sensor-Based Site-Specific Nitrogen Fertilisation in Winter Wheat. In Proceedings of the Precision Agriculture ’23; Wageningen Academic Publishers: Wageningen, The Netherlands, 2023; pp. 299–306. [Google Scholar]
- Pedersen, S.M.; Lind, K.M. Precision Agriculture—From Mapping to Site-Specific Application. In Precision Agriculture: Technology and Economic Perspectives, Progress in Precision Agriculture; Springer: Berlin/Heidelberg, Germany, 2017; pp. 1–20. [Google Scholar]
- Van Evert, F.K.; Booij, R.; Nammen, J.; Hein, F.M.; Uenk, D.; Meurs, E.J.J.B.; Van Geel, W.C.A.; Wijnholds, K.H.; Slabbekoorn, J.J.H. Using Crop Reflectance to Determine Sidedress N Rate in Potato Saves N and Maintains Yield. Eur. J. Agron. 2012, 43, 58–67. [Google Scholar] [CrossRef]
- Yao, Y.; Miao, Y.; Huang, S.; Gao, L.; Ma, X.; Zhao, G.; Jiang, R.; Chen, X.; Zhang, F.; Yu, K.; et al. Active Canopy Sensor-Based Precision N Management Strategy for Rice. Agron. Sustain. Dev. 2012, 32, 925–933. [Google Scholar] [CrossRef]
- Basso, B.; Dumont, B.; Cammarano, D.; Pezzuolo, A.; Marinello, F.; Sartori, L. Environmental and Economic Benefits of Variable Rate Nitrogen Fertilization in a Nitrate Vulnerable Zone. Sci. Total Environ. 2016, 545–546, 227–235. [Google Scholar] [CrossRef]
- Van Evert, F.K.; Gaitán-Cremaschi, D.; Fountas, S.; Kempenaar, C. Can Precision Agriculture Increase the Profitability and Sustainability of the Production of Potatoes and Olives? Sustainability 2017, 9, 1863. [Google Scholar] [CrossRef]
Figure 1.
Overall methodological steps followed in this study. OC, organic carbon; available—P, phosphorus; K, potassium; Mg, magnesium; Ca, calcium; Na, sodium; MC, moisture content; CEC, cation exchange capacity; N, nitrogen; PLSR, partial least squares regression; NDVI, normalized difference vegetation index; vis-NIR, visible and near-infrared reflectance spectroscopy.

Figure 2.
Geographic location of the experimental field in Spain (a) and soil sampling positions (dots) along on-line spectral measurements transects (b).
Figure 2.
Geographic location of the experimental field in Spain (a) and soil sampling positions (dots) along on-line spectral measurements transects (b).

Figure 3.
Illustration of on-line soil sensing platform [33] equipped with visible and near-infrared spectroscopy (Vis-NIRS), real-time kinematic global positioning system (RTK-GPS) and data logging and system control unit shown both in static (a) and on-line (b) measurement conditions.
Figure 3.
Illustration of on-line soil sensing platform [33] equipped with visible and near-infrared spectroscopy (Vis-NIRS), real-time kinematic global positioning system (RTK-GPS) and data logging and system control unit shown both in static (a) and on-line (b) measurement conditions.

Figure 4.
Strips application map, comparing two site-specific nitrogen fertilization (SNF) treatments against uniform rate N (URN) application. SNF-RHA, SNF based on ‘Robin Hood’ approach; SNF-KA, SNF based on ‘Kings’ approach. H, MH, ML, L—high, medium-high, medium-low, low soil fertility management zones, respectively.

Figure 5.
Maps of on-line predicted soil properties, i.e., calcium (Ca), moisture content (MC), potassium (K), sodium (Na), organic carbon (OC), phosphorus (P), soil organic matter (SOM), magnesium (Mg), Ca/Mg, K/Mg and pH.
Figure 5.
Maps of on-line predicted soil properties, i.e., calcium (Ca), moisture content (MC), potassium (K), sodium (Na), organic carbon (OC), phosphorus (P), soil organic matter (SOM), magnesium (Mg), Ca/Mg, K/Mg and pH.

Figure 6.
Management zone (MZ) map (a) and plot of normalized mean of each fertility attribute involved in k-means clustering (b).
Figure 6.
Management zone (MZ) map (a) and plot of normalized mean of each fertility attribute involved in k-means clustering (b).

Figure 7.
Production function of poppy yield response to variable nitrogen (N) rates recommended by ‘Kings’ (KA) and ‘Rohin Hood’ (RHA) approaches. * Hypothetical yield in uniform rate N (URN) treatment assumed the entire field was equally productive. The highest yield gaps are shown between URN (hypothetical average) and SNF-KA (b), whereas a smaller yield gap is shown between URN and SNF-RHA (a).


Table 1.
Information of dataset, spectra pre-processing and dataset partitioning prior to partial least squares regression (PLSR) analyses.
Table 1.
Information of dataset, spectra pre-processing and dataset partitioning prior to partial least squares regression (PLSR) analyses.
| Dataset [N + L *] | Pre-Processing | Effective Range, nm | Soil Properties | Partitioning | |
|---|---|---|---|---|---|
| Calibration | Prediction | ||||
| 112 [25 + 87] | MA > SN > GS1 > SGF | 350–1660 | P | 78 | 34 |
| 350–1690 | K | ||||
| 450–1660 | Mg | ||||
| 350–1660 | Ca | ||||
| 370–1680 | Na | ||||
| 350–1680 | Ca:Mg | ||||
| 380–1680 | K:Mg | ||||
| 143 [25 + 118] | 350–1690 | SOM | 100 | 43 | |
| 350–1690 | OC | ||||
| 360–1680 | MC | ||||
| 137 [25 + 112] | 380–1680 | pH | 96 | 41 | |
N, number of samples collected; L, number of samples from the library; SOM, soil organic matter; OC, organic carbon; P, phosphorus; K, potassium; Mg, magnesium; Ca, calcium; Na, sodium; MC, moisture content; MA, moving average; SN, standard normalization; GS1, gap segment 1st derivative; SGF, Savtizky and Golay filter. * The spectral library consisted of 975 soil samples that were gathered from agricultural fields located across Belgium, Germany, Spain, Portugal and France. The selection of samples for modeling was based on several criteria, including similarity in data distribution, the origin of the soil, its type and its mineral composition.
Table 2.
Accuracy of the visible and near infrared spectroscopy (vis-NIRS) sensor assessed in both cross-validation and prediction.
Table 2.
Accuracy of the visible and near infrared spectroscopy (vis-NIRS) sensor assessed in both cross-validation and prediction.
| Soil Properties | Cross-Validation | On-Line Prediction | |||||||
|---|---|---|---|---|---|---|---|---|---|
| R2 | RMSE | RPD | RPIQ | LV | R2 | RMSE | RPD | RPIQ | |
| pH | 0.95 | 0.26 | 4.36 | 1.27 | 5 | 0.87 | 0.25 | 2.83 | 1.09 |
| SOM, % | 0.77 | 1.92 | 2.12 | 0.44 | 3 | 0.74 | 1.76 | 1.99 | 0.47 |
| OC, % | 0.77 | 1.92 | 2.12 | 0.44 | 3 | 0.74 | 1.76 | 1.99 | 0.47 |
| P, ppm | 0.44 | 3.78 | 1.35 | 1.79 | 3 | 0.14 | 4.69 | 1.10 | 1.27 |
| K, meq 100 g−1 | 0.77 | 0.34 | 2.12 | 3.22 | 4 | 0.76 | 0.43 | 2.05 | 3.38 |
| Mg, meq 100 g−1 | 0.87 | 0.68 | 2.80 | 4.20 | 6 | 0.71 | 0.94 | 1.86 | 2.55 |
| Ca, meq 100 g−1 | 0.75 | 2.79 | 1.99 | 2.77 | 8 | 0.53 | 4.50 | 1.48 | 2.12 |
| Na, meq 100 g−1 | 0.67 | 0.13 | 1.76 | 2.54 | 5 | 0.41 | 0.21 | 1.31 | 1.72 |
| K:Mg | 0.62 | 0.05 | 1.64 | 2.21 | 4 | 0.38 | 0.07 | 1.28 | 1.60 |
| Ca:Mg | 0.93 | 0.73 | 4.06 | 5.00 | 6 | 0.72 | 1.02 | 1.92 | 1.53 |
| MC, % | 0.91 | 2.67 | 3.39 | 2.97 | 8 | 0.74 | 4.19 | 1.98 | 1.64 |
OC, organic carbon; SOM, soil organic matter; P, phosphorus; K, potassium; Mg, magnesium; Ca, calcium; Na, sodium; MC, moisture content; K:Mg; the ratio of K to Mg; Ca:Mg, the ratio of Ca to Mg; R2, coefficient of determination; RPD, ratio of prediction to deviation; RMSE, root mean square error; RPIQ, ratio of prediction to interquartile distance; LV, latent variable.
Table 3.
Results of cost–benefit and nitrogen (N) use analyses for site-specific N fertilization based on Kings (SNF-KA) and Robin Hood (SNF-RHA) treatments in comparison with uniform rate N (URN) treatment.
Table 3.
Results of cost–benefit and nitrogen (N) use analyses for site-specific N fertilization based on Kings (SNF-KA) and Robin Hood (SNF-RHA) treatments in comparison with uniform rate N (URN) treatment.
| Treatment | Area, ha | Application Rate, kg N ha−1 | N Usage, kg ha−1 | Relative N Usage, kg ha−1 | Simulated Relative N Usage, kg | Cost of N + Spraying, EUR ha−1 | Yield, t ha−1 | Revenue, EUR ha−1 | Gross Margin, EUR ha−1 | Relative Gross Margin, EUR ha−1 | Simulated Field Relative Gross Margin, EUR | ||
|---|---|---|---|---|---|---|---|---|---|---|---|---|---|
| 1st | 2nd | 3rd | |||||||||||
| URN | 3.10 | 195 | 150 | 215 | 560 | 151.70 | 2.64 | 2454.3 | 2302.6 | - | - | ||
| SNF-KA | |||||||||||||
| H | 0.20 | 293 | 225 | 215 | 732.5 | 186.4 | 3.10 | ||||||
| MH | 0.60 | 244 | 188 | 215 | 646.3 | 169.0 | 2.80 | ||||||
| ML | 1.15 | 146 | 113 | 215 | 473.8 | 134.3 | 2.77 | ||||||
| L | 1.10 | 98 | 75 | 215 | 387.5 | 117.0 | 2.22 | ||||||
| Total | 3.05 | 493.5 | −66.5 | −594.2 | 138.3 | 2.72 | 2531.7 | 2393.4 | 91.0 | 808.1 | |||
| SNF-RHA | |||||||||||||
| H | 0.24 | 98 | 75 | 215 | 387.5 | 117.0 | 2.70 | ||||||
| MH | 1.10 | 146 | 113 | 215 | 473.8 | 134.3 | 3.0 | ||||||
| ML | 0.88 | 244 | 188 | 215 | 646.3 | 169.0 | 3.0 | ||||||
| L | 0.64 | 293 | 225 | 215 | 732.5 | 186.4 | 2.78 | ||||||
| Total | 2.86 | 577.9 | 17.9 | 159.9 | 155.3 | 2.74 | 2546.3 | 2391.0 | 88.4 | 786.8 | |||
Management zone clusters are ranked as high (H), medium-high (MH), medium-low (ML) and low (L).
Disclaimer/Publisher’s Note: The statements, opinions and data contained in all publications are solely those of the individual author(s) and contributor(s) and not of MDPI and/or the editor(s). MDPI and/or the editor(s) disclaim responsibility for any injury to people or property resulting from any ideas, methods, instructions or products referred to in the content. |
© 2023 by the authors. Licensee MDPI, Basel, Switzerland. This article is an open access article distributed under the terms and conditions of the Creative Commons Attribution (CC BY) license (https://creativecommons.org/licenses/by/4.0/).
Share and Cite
MDPI and ACS Style
Munnaf, M.A.; Guerrero, A.; Calera, M.; Mouazen, A.M. Precision Nitrogen Fertilization for Opium Poppy Using Combined Proximal and Remote Sensor Data Fusion. Remote Sens. 2023, 15, 5442. https://doi.org/10.3390/rs15235442
AMA Style
Munnaf MA, Guerrero A, Calera M, Mouazen AM. Precision Nitrogen Fertilization for Opium Poppy Using Combined Proximal and Remote Sensor Data Fusion. Remote Sensing. 2023; 15(23):5442. https://doi.org/10.3390/rs15235442
Chicago/Turabian StyleMunnaf, Muhammad Abdul, Angela Guerrero, Maria Calera, and Abdul Mounem Mouazen. 2023. "Precision Nitrogen Fertilization for Opium Poppy Using Combined Proximal and Remote Sensor Data Fusion" Remote Sensing 15, no. 23: 5442. https://doi.org/10.3390/rs15235442
Note that from the first issue of 2016, this journal uses article numbers instead of page numbers. See further details here.