1. Introduction
Sustainability, its different components, and the tools used to achieve it are difficult concepts to convey to students. But it is recognised that the United National Sustainable Development Goals (SDGs) are a suitable instructional framework [
1] to help students understand sustainability and to ensure that they become “informed, active citizens who take action for a more sustainable future” [
2]. The UN SDGs, 17 inter-linked global goals, designed to be a blueprint to achieve a better and more sustainable future for all, are already largely incorporated in many third-level programmes in Ireland [
3]. However, the inclusion of SDGs in the curriculum at a secondary level is at an early stage.
As remote sensing specialists, and as practitioners and/or educators who work with spatial data, we know how important this data can be to achieve each of the SDGs. We can also identify the added benefit to teaching and learning that accrues from knowing a little about how the data are collected and what they can be used for. In addition, we are firm advocates for mandating that a ‘location’ is attached to data (i.e., making it ‘spatial’), because we understand that seeing something in its real-world position can further help students digest complex topics and relate what they learn to their real-world experiences. We also know that doing this well can enthuse students about the types of technology that we are lucky to work with, such as satellite imagery, and how we maintain that initial fascination [
4]. Moreover, research suggests that integrating spatial data in lessons can have a ‘significantly positive impact compared to conventional teaching methods in enhancing participants’ intrinsic motivation’ [
5].
Integrating even fundamental remote sensing concepts in a lesson involves greater complexity than the more typical references to spatial data (e.g., point, polygons, and basemaps). The challenge would then be to ensure that the lesson does not become fixated on what spatial data are rather than what they are used for, but to demonstrate that this is productive knowledge, rather than an inert, and highly specialised knowledge with limited applications [
6]. A move to emphasize real-world applications still runs the risk that the technical aspects will dominate, such as the original sensor, the operational characteristics (e.g., satellite, airborne, or terrestrial), and the form the data might take (differing outputs, whether captured through active or passive techniques). The danger of over-complication is equally present when preparing teachers to teach this content. Many of the challenges and technical issues regarding teaching remote sensing have already been clearly identified and articulated in this Special Issue [
4], including challenges involved when designing RS content to foster interdisciplinary thinking [
6] and coping with limited instructor time [
7]. But, in Ireland, as in other countries such as Germany, Switzerland, and the U.K. [
8], students have already been exposed to aerial imagery or other digital geo-media at a young age in different core curricula, for example during image interpretation or looking at satellite images in classes on climate change. The question then, is how can students’ prior knowledge be developed to encompass techniques for imaging the Earth using energy measured across the broader EM spectrum, or expanded into the third dimension for understanding height, without over-complicating a lesson?
There are many excellent online satellite education resources available, including the Sentinel Playground [
9], which provides students with access to the full Sentinel and much of the NASA archive. This platform offers dedicated education-focussed resources. The discipline of ‘geo’ has also benefited from many early [
10,
11] and more recent [
12,
13,
14] education and capacity-building initiatives, including those led by established societies such as the International Society of Photogrammetry and Remote Sensing. However, the spatial data literature (and our own experience) highlights that teachers consistently mention the following challenges when teaching: time constraints when learning new software and developing new materials; technical aspects of the software; lack of infrastructure and technical support within schools; and lack of teaching materials and resources [
15,
16,
17,
18]. New teacher- and student-friendly tools are therefore critical for introducing remote sensing to school students, to support teachers in incorporating this new content into lessons and, most importantly, to align it with the existing leaning outcomes within the curriculum, without unnecessarily over-crowding it [
15,
16,
17,
18,
19]. The potential to achieve this lies in the more student-led elements of the curriculum. For example, in Ireland, in the 2015 reforms of lower secondary-level curriculum (Department of Education and Skills) [
2] sought to reduce the dominance of summative assessment, introducing various formative assessment practices throughout the three years of lower secondary-level education [
20]. These classroom-based assessments (CBAs) are introduced in different subjects at pre-defined times in a school year and provide students a lot of leeway, in conjunction with support from the teacher [
21], to choose topics that interest them. The reformed curriculum is also underpinned by a set of key skills [
22] that we, as remote sensing specialists, can readily identify in our standard workflows. For example, organising and analysing data, problem solving, and spatial thinking are common skills taught in geography, science, and mathematics classes [
23]. We see an opportunity to build on this by encouraging an inquiry-based approach, which is a common instructional strategy in science teaching using spatial data such as satellite images. Such an approach offers ways to utilise remotely sensed data to promote student-led learning; support them in developing their own scientific arguments using spatial data, and support them as they learn to identify meaningful patterns in the images. In this paper we propose and introduce an augmented reality app titled
SatelliteSkill5, designed to achieve the following key objectives:
Introduce students to fundamental remote sensing concepts in an easily understandable manner.
Develop a new, user-friendly and engaging medium.
Frame the remote sensing data against real world issues using the UN SDGs to reinforce learning.
Develop a tool that is easy for a teacher to use and meaningfully embed in lessons to achieve the pre-determined learning outcomes of the curriculum at a lower second level across a number of school subjects.
This paper will first introduce the educational concepts applied during the design stages, including active and game-based learning, along with other pedagogical principles. This will then be followed by the core remote sensing technical information and datasets that are incorporated in
SatelliteSkill5, introducing each of the fundamental geospatial themes incorporated in the challenges that make up the activities users engage in. The software development/design of the tool will then be described using the processed data in
Section 3 (including the environment and work in progress). Finally, an informal evaluation of the app, performed in a series of real-world class environments, is provided and discussed in
Section 4 and
Section 5.
2. Materials and Methods
The Departments of Geography/Education in Maynooth University, Ireland, are leading a collaboration initiated in 2019 with the Ordnance Survey Ireland (OSi is the Irish National Mapping Agency, now rebranded as Tailte Éireann-Surveying), the Society of Chartered Surveyors Ireland (SCSI), Esri Ireland, and the School of Surveying and Construction Innovation at Technological University Dublin to showcase satellites and survey data to students. ‘5*S: Space, Surveyors, and Students—STEM and the Sustainable Development Goals’ is a science, technology, engineering, and mathematics (STEM) outreach project that builds on two existing national school-based programmes that target a national audience. It is funded by Science Foundation Ireland (SFI), the statutory body in Ireland with responsibility for funding basic, oriented, and applied research in the areas of STEM with a strategic focus and co-funded by the Irish branch of the European Space Education Resource Office, ESERO Ireland. The two existing national programmes are Esri Ireland’s award winning, ‘ArcGIS for Schools’ programme and the SCSI ‘Day in the Life’ recruitment programme. A collaboration between these two programmes presented the opportunity to combine a national network of volunteers with an existing data and training infrastructure. 5*S has two main work packages (WP): The first of these is a ‘top-down’ approach, in which very specific remote-sensing-focused content has been developed for and delivered to classes in the Junior Cycle (lower secondary level) of science, geography, and history. All content is made available to students through ArcGIS StoryMaps with interactive components scattered throughout to pique students’ interest and keep them engaged. Including the Department of Education in Maynooth University in the 5*S partnership has also opened the initiative to student teachers on both the concurrent (Bachelor of Science Education) and consecutive (Professional Master of Education) initial teacher education programmes at Maynooth. Moreover, it has resulted in the co-creation of lesson plans that can be adapted by teachers for different subjects and age groups. The focussed, StoryMap-centric WP has been extensively reported on [
24] and its benefits for teacher agency have been demonstrated. This paper, however, is focussed on the second WP, in which a ‘bottom-up’ approach resulted in the creation of an augmented reality app that aims to empower students and encourage their autonomy in learning.
2.1. Project Structure and Workflow
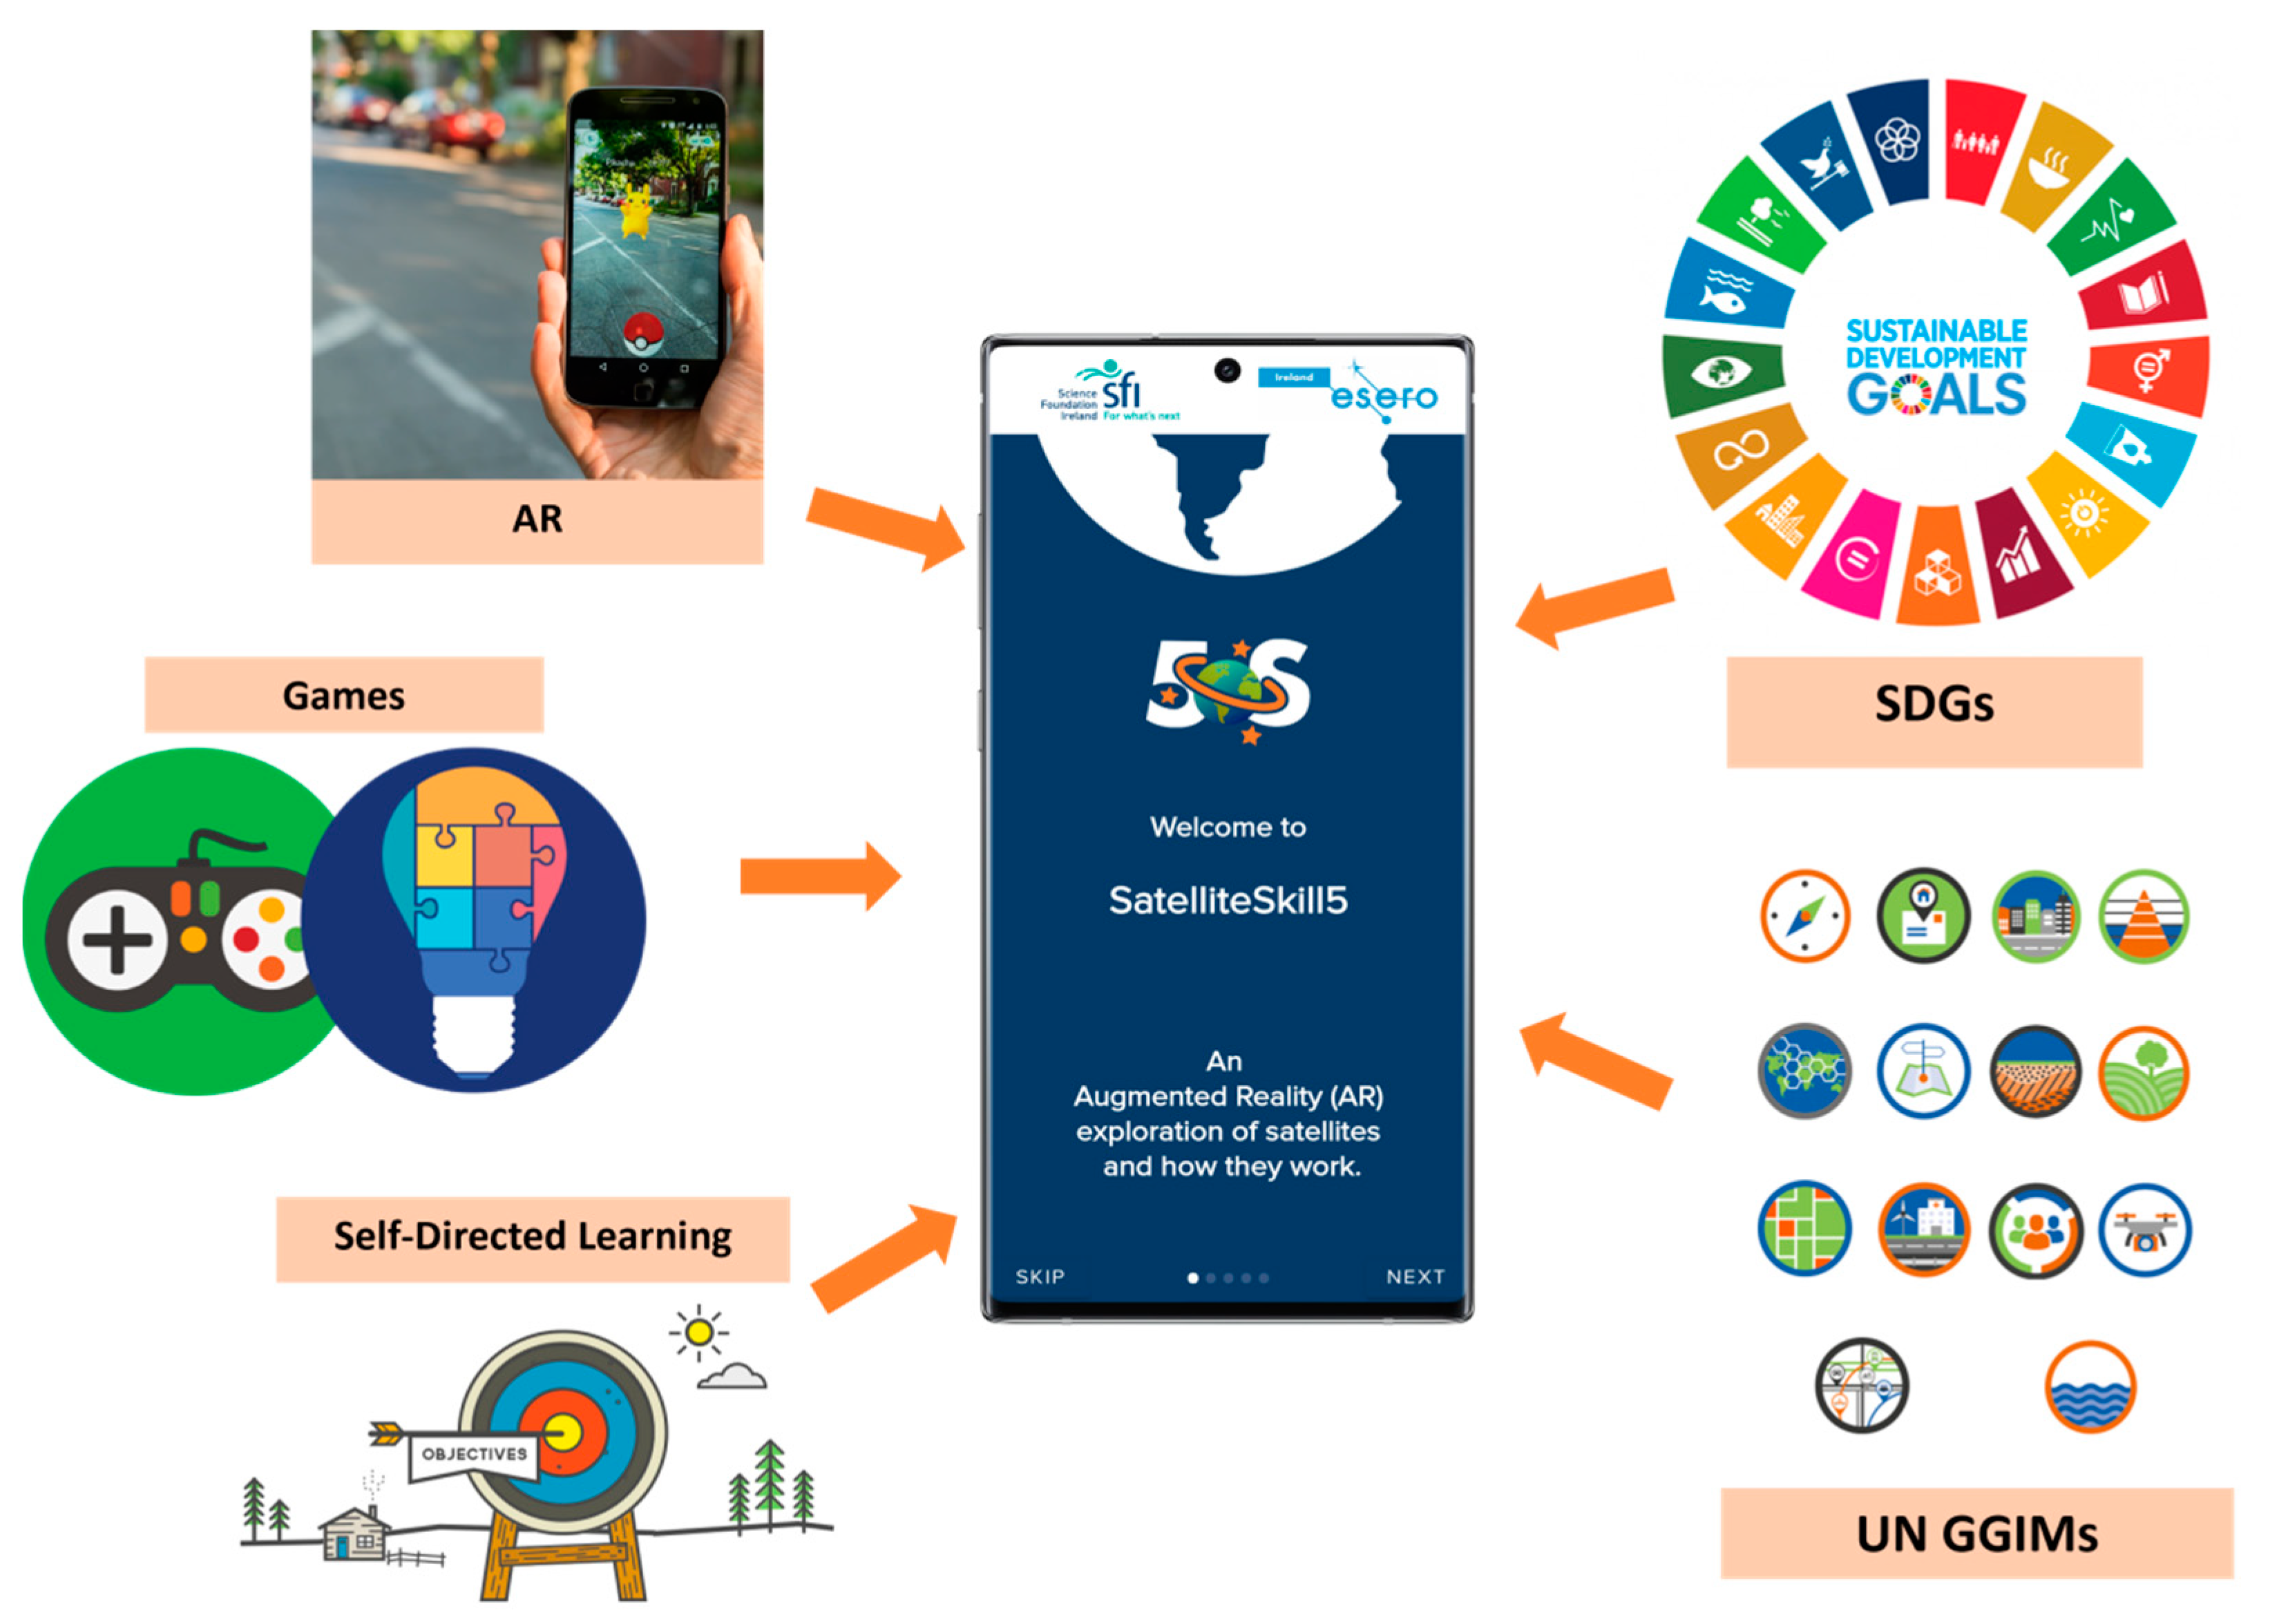
This ‘bottom-up’ WP was designed to promote active, student-led learning. Encouraged by the success of augmented reality (AR) apps such as
Pokémon Go, the 5*S team developed a free AR app titled
SatelliteSkill5 (pronounced “Satellite Skills” where a 5 replaces the final S to echo the 5*S project title). Using a phone or tablet device, the app not only introduces students to satellite data, but it highlights their use in charting the impacts of climate change. It simulates real-world applications of remote sensing and other survey and satellite datasets, and by linking the app’s activities or challenges to specific SDGs, it helps them grasp the concept of sustainability with reference to local and national contexts (
Figure 1).
2.2. Pedagogic Principles
As previously discussed, the 5*S team identified an opportunity to highlight how spatial and remotely sensed data can become integral in sustainability education. We considered several pedagogic principles during the initial design and development stage. The following three requirements were specified as mandatory:
Gamified Education: Initial development began early in the COVID-19 period, and we were determined to offer an app that would promote a self-directed, active learning approach. This would not only lead to higher levels of engagement and motivation, but would encourage self-paced, self-directed learning that was ideal during COVID-19 because it could provide immediate feedback and spatial skills’ development in the absence of the usual classroom context (
Figure 2).
High level of immersion and interactivity: The app should offer a detailed learning experience, but also make it easier to visualise and understand complex topics to increase motivation. An easy-to-use interface would be essential to ensure intuitive use (again, possibly when no teacher was present) and help walk students through each part with some minimal guidance and text.
Empower the students: Makes use of real-world data for real-world challenges: flooding, oil spills, forest fires, etc. Engages students and demonstrates the real-world application of remotely sensed data with a focus on SDGs, namely one of the key objectives of our study introduced in
Section 1.
The SatelliteSkill5 method is underpinned by both constructivist and connectivist learning theory. A constructivist approach favours students being more active in their learning [
25]. By puzzling out a resolution to different challenges in the app, students are not passively receiving information, but must engage responsively, drawing on their experience of, and in, the real world. They must also create meaningful links between these scenarios as they learn about SDGs in the process.
SatelliteSkill5 shows how remote sensing data can help students develop their thinking and data literacy skills [
26], and it highlights the complexities of the ‘real world’. The students are given a series of challenges to complete, requiring them to interpret each of the different datasets, thereby enhancing multiple skills in the process. The competitive, gamified approach is achieved by a digital trophy being awarded for every successfully completed challenge, allowing students to ‘collect’ different awards during the engagement with the
SatelliteSkill5 app. The technology-focused nature of remote sensing also encourages a connectivist approach. Particular examples are where students can act as a ‘citizen scientist’ [
27]. Citizen science, which has seen a surge in popularity in recent times, provides students with the opportunity to support decision making and/or participate in environmental reporting and monitoring [
28], and, for example, the
SatelliteSkill5 app has already been incorporated in a use-case for the European Space Agency ‘Climate Detectives’ Programme.
2.3. Satellite Imagery and Other Remote Sensing Data Incorporated
SatelliteSkill5 prioritises multispectral and SAR satellite data from Copernicus, but also introduces several other remotely sensed datasets, including sonar and aerial orthophotography. The challenges are designed to focus on SAR data covering backscatter or other derivative datasets such as flood polygons from the Copernicus Emergency Mapping Service or the Ocean Wind Field Component derived from Sentinel 1. The multispectral data are introduced both in terms of the visible proportion of the spectrum, but also further into the infrared, briefly introducing the user to SWIR for hotspot detection and the concept of band ratios.
Table 1 introduces many of the datasets incorporated into the different challenges, each of which is designed to introduce the user to a small selection of the wide range of datasets that can be derived from Sentinel satellites and similar programmes, without overwhelming them.
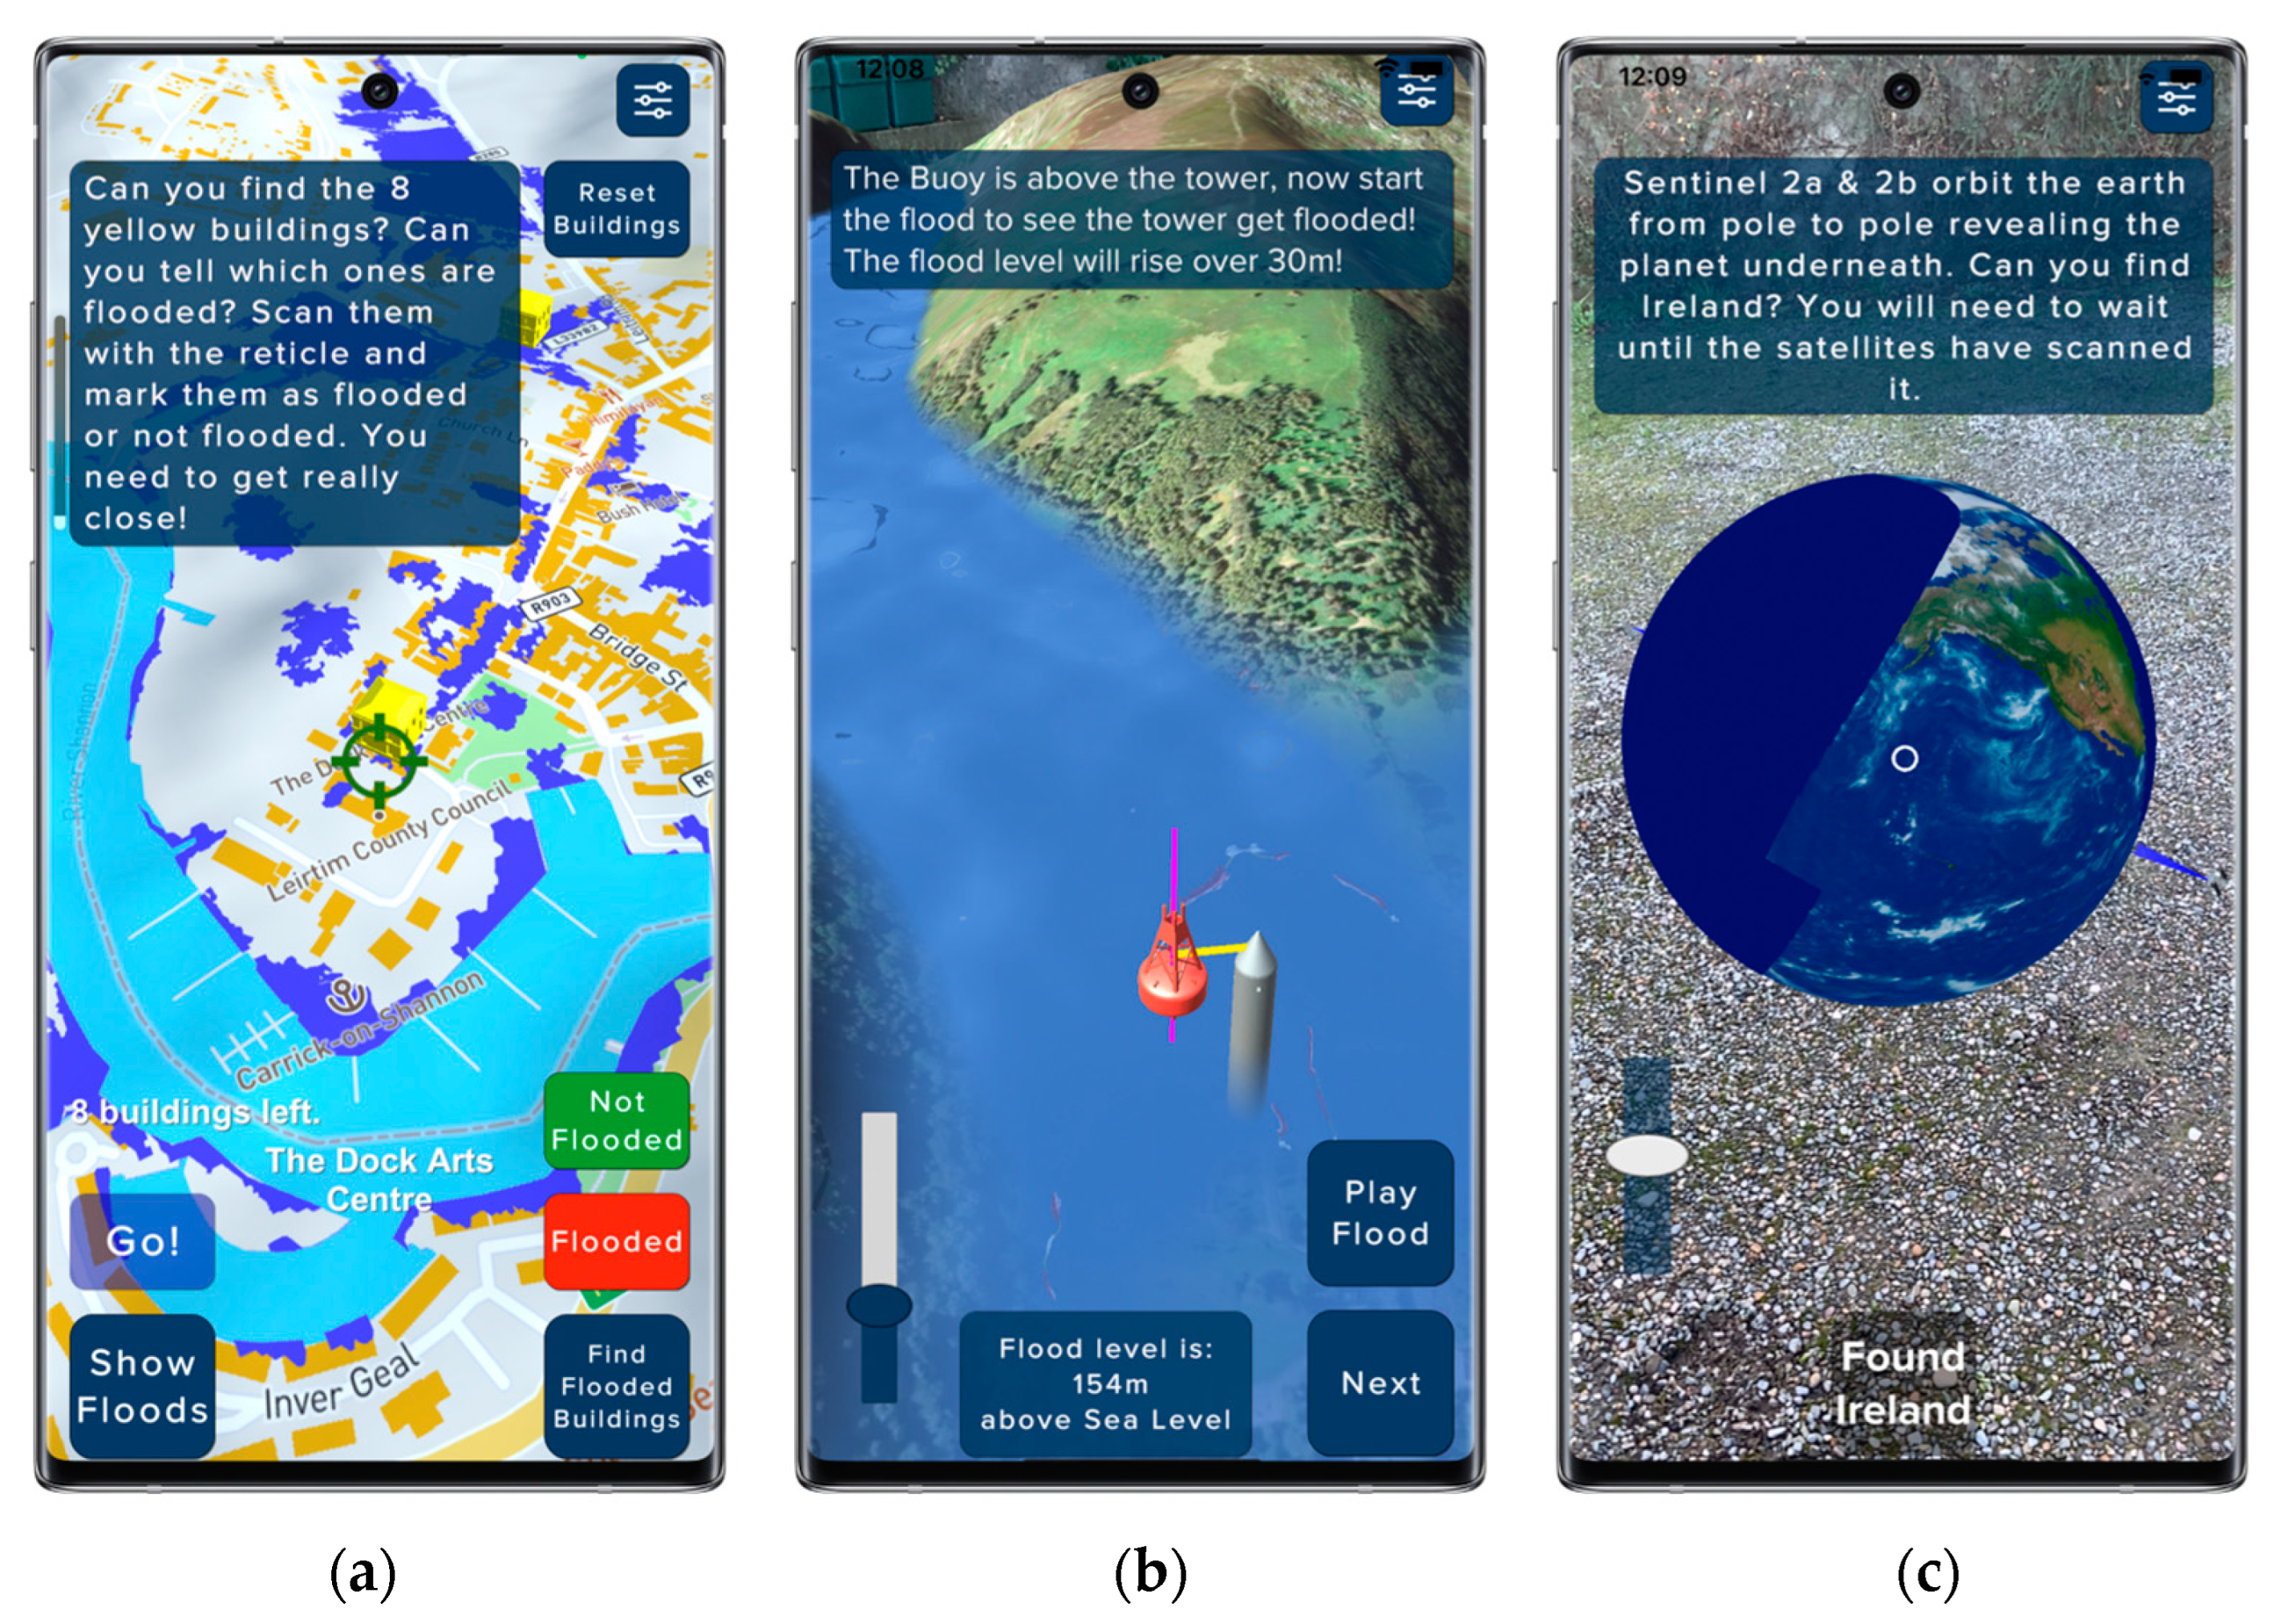
Satellite orbits and hardware principles are also introduced (
Figure 3), showing how SAR can ‘see’ through clouds. In this challenge, students learn about the principle of satellite orbits, push-broom scanning methods, orbital swaths, and revisit time. Here, the student must ‘become’ the satellite and complete the mapping of the Earth to unlock the next challenge. Students are also introduced to elevation datasets derived from space platforms such as the shuttle RADAR topography mission (SRTM) and night-time imagery of urban areas from NASA’s SUOMI satellite.
2.4. The United Nations Sustainable Development Goals
Governments, businesses, and individuals in Ireland are mobilising efforts to achieve the United Nations’ Sustainable Development Goals (SDGs) by 2030. Universal, inclusive, and indivisible, this far-reaching plan calls for action by all countries to improve the lives of people everywhere. Students place the environment, climate change, and a sustainable future as among their most pressing concerns, if not their ultimate top concerns. Ordnance Survey Ireland, another 5*S partner, has played an active role in the United Nations Global Geospatial Information Management (UN-GGIM) Committee of Experts since 2012, and its work, in collaboration with the Central Statistics Office, has resulted in the development of Ireland’s SDG data platform. The SDG platform (irelandsdg.geohive.ie) was developed on ‘GeoHive’, the State’s geospatial data hub, and provides authoritative information and focussed content on Ireland’s progress against SDGs for citizens, business, and policy makers. 5*S highlights the role of satellite data for Ireland’s reporting on SDGs and raises awareness among the general public. As explained in
Section 1—we used many of the SDGs as the ‘hook’ in
SatelliteSkill5 to introduce students to remote sensing (
Table 2).
2.5. Data—Key Skills, Spatial Data, and the UN GGIM fundamental Geospatial Data Themes
The final component is the focus on key skills in the Junior Cycle Framework referred to in
Section 1. Eight key skills are linked to learning outcomes for each subject and are intended to guide teaching and student learning [
29]. Being numerate, literate, communicating, and creative, and managing information and thinking are the most relevant of these key skills identified by the 5*S project. These key skills clearly bridge the geography and science curricula, both of which are core subjects for 5*S and where there is a clear focus on different data types. This concept is further expanded for spatial data, which includes the different datatypes represented by raster images (binary and threshold maps, greyscale, pseudo colour, and false colour composite images). Standard cartographic or geodetic principles and best practice (including latitude and longitude, datums, map legends, and colour ramps) are all included as relevant content throughout the activities. In
SatelliteSkilll5, these are indicated to the student by a clickable lightbulb that opens a numbered note titled ‘Data Did You Know’. These notes, illustrated in
Figure 4 and detailed in
Table 3, were introduced to draw clear links between traditional data and its spatial representation. Feedback in our other WP indicated this link was not always clear to non-geographers, where ‘spatial data’ were often regarded as being ‘just maps’.
To further reinforce the link between remote sensing and real-world issues that are encountered on a daily basis (whether satellite, airborne, or terrestrial), students were also introduced to the concept of the UN Fundamental Geospatial Data themes during their sessions on the app. This effort further enhanced work at an international level, where OSi collaborated with the Irish Central Statistics Office and many international peers on the development of 14 fundamental geospatial data themes. The role of satellite data in sustainability is often overlooked by the general public as well as students (
Figure 5a). The 5*S project aims to communicate the role of satellites and Earth observation in helping achieve SDGs. One 5*S partner—OSi—has played an active role in the United Nations’ Global Geospatial Information Management (UN-GGIM) Committee of Experts since 2012 and many of the UN GGIM fundamental geospatial data themes have also been introduced in this app (
Figure 5b). This element of
SatelliteSkill5 feeds back into the scientific method and inquiry approach, where students should carry out their own study. This is the game or ‘unlocking’ element of the development of
SatelliteSkill5; in each case, each challenge also unlocks an open dataset. These form a curated list of spatial data aligning with each of the 14 GGIM themes, chosen by the 5*S team and specifically selected to be of use for a student beginning a research project. The 5*S partners OSi and Esri Ireland developed an automated unlocking element, where the student ‘collected’ (once again following a gamified learning approach—
Figure 5c) data of relevance to their topic of interest, and this appeared in their ArcGIS Online account after the challenge was completed. The
SatelliteSkill5 app can be used as a learning tool, or proceed further via this route and, for example, be used to carry out GIS analysis on some data for their locale. The 5*S team also provided STEM outreach sessions and training for schools on these datasets.
3. Technical Development of the SatelliteSkill5 App
This section introduces the technical development of the SatelliteSkill5 app, the design, and the platforms and environments.
3.1. Development Engine
Unity is a powerful, versatile, and popular game development engine that provides a sandbox environment for the creation of immersive and interactive 2D and 3D experiences. Unity (versions 2019–2022.3 used during development) offers exceptional cross-platform capabilities, including mobile devices, consoles, and desktops, and it supports emerging technologies such as AR (e.g., [
30,
31,
32,
33]) and VR, which were used by the
SatelliteSkill5 app; many of these AR examples were carried out with public engagement [
34,
35] or education and capacity building [
36,
37] in mind. The user interface that Unity provides significantly simplifies the game development process without the developer needing extensive coding knowledge. Unity’s scripting system, primarily based on C#, also provides a powerful and flexible framework for game development. Users can create complex interactions between the spatial datasets and other game assets by making use of Unity’s excellent physics and simulation tools.
Each of the SatelliteSkill5 challenges is highly curated to provide the users a bespoke experience, but do not yet offer the possibility to view satellite data at their immediate location. These were designed for both indoor or outdoor use and were created using individual Unity scenes; the central element in each scene consisted of a map containing 3D data of somewhere in Ireland, including multispectral, radar, and topological satellite data; spatial data; and other datasets. A unique set of sub-challenges were then built around this map, where the users were asked to move around the map, explore it, and perform some directed action. Significant effort went into the prompts to guide users through each section with accompanying text, and with different visual and audio stimuli, considering many of the key skills referred to above. A gamified approach, with digital trophies to mark the completion of different challenges, intended to provide encouragement to students and the impetus to consider opportunities for further learning offered within the app. As the user progresses through each sub-challenge, the difficulty increases as they grow more comfortable with the 3D environment.
3.2. Accessibility—Smartphone and Tablet Compatible
The near ubiquitous availability of smartphones among young people provided the scope for students to oversee their own learning using this technology. We prioritised it for its familiarity; convenience to users; and multiple modalities for video, AR, and download capability. Integrated development environments (IDE) serve a crucial role in mobile app development by providing a comprehensive set of tools and features that streamline the development process. In this project, they allowed for the development of a parent app to house the Unity challenges. These were built using Android Studio 2022.3 for Android and X-Code 15 for iOS. Android Studio is the official IDE for Android app development. It offers a rich set of features tailored specifically for building Android applications, including code editing, debugging, performance profiling, layout design, and emulator support. Xcode is the official IDE for iOS, iPadOS, and macOS app development. It provides a complete set of tools for developing, testing, and debugging apps for Apple platforms. With Interface Builder, debugging tools, simulator support, and App Store distribution capabilities, Xcode is an essential tool for iOS developers. These programs also allow for straight forward publishing to the Google Play and Apple App Stores. By having a parent app, it was possible to provide a nice introduction to the app that would inform users about what each satellite challenge was about, what they would learn, and it would allow them to keep track of their progress through each challenge. It also provided them with external learning opportunities. The programs also allowed for the collection of crash analytics, which helped ensure a high quality of user experience through fixing any bugs that arose.
3.3. Hosting and Distribution
Google Play and Apple App Store are the two primary distribution platforms for mobile applications on the Android and iOS platforms, respectively. These online stores allow developers to publish and distribute their applications to a wide audience and allow them to be easily available for school outreach sessions. Developers can create a developer account, submit their apps for review, and once approved, make them available for download on Android and iOS devices. They also provide features for beta testing and staged rollouts. Developers can release their apps to a limited number of users or specific regions before making them available to the broader audience, allowing for testing and gathering feedback. They also include content policies that are in place to ensure the quality, security, and appropriateness of apps. Developers are required to adhere to these policies, which include guidelines for app content, user data handling, and app behaviour. Both Google Play and Apple App Store were used as central locations to distribute the app to the students in the schools we worked with, while also being available for others to find and use it.
3.4. Interacting with the Environment
Each challenge level in the SatelliteSkill5 application was a manually created game level built in the Unity game engine. Every level design started off with a 3D map, which acted as a central starting point for the challenge. External assets such as 3D models, animations, and sounds were then manually added and programmed to create the user experience that users needed to complete in order to successfully complete the challenge. All 3D models in the scene were stored according to the cartesian reference frame present within Unity. The user camera on their mobile device served as the ‘eye’ through which the user interacted with the game level. The app used the device camera and AR software development kits of ARCore 5.1.0 and ARKit 5.1.0 (developed by Google and Apple) to detect flat surfaces in the user’s vicinity. Once detected, users could anchor the challenge level 3D models onto the flat surface. This exact ‘real-world’ point acted as the origin for the digital model to attach to. All other 3D models existed in relation to that position. Users then interacted with the 3D model using Raycasts. Raycasts are narrow invisible beams that shine out in a straight line from the device’s camera. If the beam interacted with a specific object, it triggered an event that prompted the user to perform some action.
5. Discussions and Future Work
5.1. Summary of Findings
The role of satellites and other RS datasets are relevant to many topics across the curriculum at a secondary level. However, making this relevant to every subject requires linking to many different learning outcomes, and partially (i) undersells what satellites and other remote sensing data and hardware can do, (ii) as well as relegating these to a secondary role, where the range of datasets (encompassing both their richness but also their complexity) may be largely diluted or even lost when the focus is on the curriculum or a specific learning outcome.. This also emerged in the work of the other 5*S programme offering school content [
24]. The
SatelliteSkill5 app was therefore developed to offer a less rigid, more creative, and game-based learning approach to help introduce students to the role of satellites and other remote sensing data outside of any one curricular subject. The popularity of this offering was evident, and enjoyed a particularly timely launch during COVID-19, when teachers were looking for free online and digital offerings for students. Teacher feedback was almost unanimously positive and the results across the different schools, as well as verbal feedback from students, as reported to us by the teachers, reinforced our confidence in their positive opinion of the
SatelliteSkill5 app. The use of AR and remote sensing data as a teaching tool is therefore promising, and we used the feedback to add new content into later iterations of the app, which are now available to download.
5.2. Limits of the Evaluation
Student feedback was one of the key pieces of information that needed to be incorporated, and we were since awarded Tier 3 ethical approval, which will be brought to Phase 2 of the project, which began in March 2023, and will be reported on in a subsequent paper. Tier 3 approval will allow us to incorporate student questionnaires during outreach events and recordings of metrics and performance measurements in the SatelliteSkill5 App during challenges. Another important aspect is that the project can be easily modified in several ways in order to make it even more attractive to students, for example through a use case we provided that aligns with the ESA Climate Detective programme. It is also important to note this is not only a tool suited for secondary level, as it has been trialled over a number of years on the remote sensing modules on the BSc in Geospatial Surveying at Technological University Dublin, on the remote sensing undergraduate module at Maynooth University, and for the MSc in GIS and Remote Sensing at Maynooth; it was deemed as a useful exercise and informative tool for each cohort. Our hope is that the work we began with the SatelliteSkill5 app will inspire the next generation of students to consider RS or GIS courses at both secondary and tertiary levels.
5.3. Technical Limitations of the App
All IT projects are prone to their own specific series of software and hardware issues. Although overwhelmingly successful and offering a solid, robust software release that has stood the test of over five thousand users at end of 2023—technical issues are occasionally present. These can be summarised as follows:
Data loading: Because of data size, it was not possible to store the spatial data used in the app directly in the app itself. Data were stored externally and needed to be downloaded to the device before they could be used. Therefore, a good internet connection was essential for its use. Poor data speed could result in some or none of the map being downloaded, which impacted the user experience. This was also exacerbated by the fact that school students did not always have access to school Wi-Fi and/or had basic phone plans that limited internet access.
Device Storage: Storage could be a factor for users, as the app needed plenty of device space to operate. The scale of the maps that users had access to had to be reduced to help alleviate this, which reduced the amount of 3D map users could explore. Every effort was made to compress and reduce the size of the assets used in this app. Students had a wide variety of mobile devices and many of them were older models, so it was important to make sure the app could run effectively on as many devices as possible.
AR Limitations: While the ARCore and ARKit software developmental platforms were very powerful and flexible, they did not work on every mobile device for a variety of reasons (insufficient RAM, old CPU, or other features). Google and Apple retain control over the list of devices they support so there is no remedy if a device is not supported to use AR.
AR Tracking: The AR tracking capabilities of ARCore and ARKit are very powerful, but are prone to their own bugs; sometimes items placed in the AR scene will drift away if errors occur in the tracking software. These bugs have been reduced over the years as these platforms have matured, but they do still appear.
5.4. Future Work
Future work includes improving learning related to SDGs, by moving from a simple ‘question and answer’ at the end of each challenge to a scroll wheel in the AR environment, where the student must take more time to reflect and consider what SDG this challenge can help address. We will also explore the potential of dynamic data updates for the user location. In early versions of SatelliteSkill5, we explored this and implemented a mix of in-classroom-based challenges and location-based challenges. These location-based challenges made use of user GPS locations to provide a more personalised challenge depending on the immediate surroundings. These were phased out during testing, as we did not want to send users to geographical hazardous areas when carrying out an AR challenge where they look at their device screens while being near dangerous environments (e.g., river banks linked to flood events). There were also child protection issues around personal GPS locations that were important to address and communicate with users. Location-based challenges were, however, a common request from users and teachers, and should be considered for later iterations of SatelliteSkill5.


 ,
, 


