


Artisanal Mining River Dredge Detection Using SAR: A Method Comparison

1
U.S. Geological Survey, Florence Bascom Geoscience Center, 12201 Sunrise Valley Drive, Reston, VA 20192, USA
2
Department of Geography, University of Mary Washington, 1301 College Avenue, Fredericksburg, VA 22401, USA
*
Author to whom correspondence should be addressed.
Remote Sens. 2023, 15(24), 5701; https://doi.org/10.3390/rs15245701
Submission received: 29 November 2023
/
Accepted: 9 December 2023
/
Published: 12 December 2023
(This article belongs to the Special Issue Analysis of SAR/InSAR Data in Geoscience)
Abstract
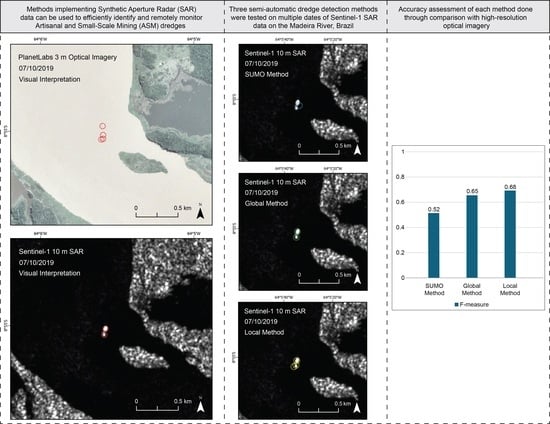
:Challenges exist in monitoring artisanal and small-scale mining (ASM) activities, given their dynamic and often informal nature. ASM takes form through various techniques and scales, including riverine dredging, which often targets the abundant alluvial gold deposits in South America. Remote sensing offers a solution to improve data collection, regulation, and monitoring of the more mobile and elusive ASM activities and their impacts. Mapping ASM riverine dredges using Synthetic Aperture Radar (SAR) is one of the application areas least explored. Three semi-automated detection approaches using Sentinel-1 SAR are compared on their ability to identify dredges with minimal false positives. The methods are: (i) Search for Unidentified Maritime Objects (SUMO), an established method for large ocean ship detection; and two techniques specifically developed for riverine environments that are introduced in this paper: (ii) a local detection method; and (iii) a global threshold method. A visual interpretation of SAR data with the inclusion of optical high-resolution data are used to generate a validation dataset. Results show it is possible to semi-automatically detect riverine dredge using SAR and that a local detection method provides the best balance between sensitivity and precision and has the lowest risk of error. Future improvements may consider further automation, more discriminatory variables, and analyzing the methods in different environments and at higher spatial resolutions.
1. Introduction
Artisanal and small-scale mining (ASM) is a broad term that refers to mining performed by individuals, groups, families, or cooperatives using minimal or no mechanization, frequently in the informal sector of the economy [1,2]. Artisanal miners extract high-value gemstones and materials such as diamonds and gold, as well as other critical and industrial minerals, across the globe [1,2]. ASM frequently targets alluvial placer deposits because of their accessibility and high-grade resources. A prime example is seen in the Brazilian Amazonia regions, where high concentrations of gold are found in river bottom sediments and alluvial deposits [3,4]. Brazil experienced its first gold rush of artisanal miners in 1693 and has seen expansive ASM activity since [4]. In the 20th and 21st centuries, the number of ASM miners increased, and modernized techniques including the use of tractors, excavators, suction and jet pumps, river dredges, divers, mercury, and cyanidation were adopted [4]. These activities cover expansive areas in Brazil and the rest of the Amazon Basin region and are less regulated than industrial mining [4]. Additionally, these practices impact environmental and human health through the extensive degradation of the land and rivers and the extensive use of mercury in the gold amalgamation process [1,4].
The modernization of ASM includes riverine dredging, a process used to remove material from one part of the river and relocate it to another, with the main objective of recovering material that has value or use [3,5,6]. The process takes place on a floating platform that can range from small dredges made from recycled wood and metal to large, manufactured industrial-scale dredges [3,7,8]. The two most common dredges used in ASM are suction dredges and bucket-line dredges [3,5,6] (Figure 1). The bucket-line dredge uses a chain of large, fortified buckets that travel in a loop along a conveyor belt, digging into the river bottom and carrying the sediment onboard [7]. Suction dredges use a cutting drum to excavate the river bottom by breaking up rocks and consolidated materials that can then be pumped onboard [3,6]. Once onboard, the material is sorted by grain size using sieves, classifying screens, and sluice boxes to retain gemstones, fine gold particles, and gold nuggets. The rejected material, known as tailings, is returned back into the environment [3]. These practices can cause harmful effects on human, plant, and animal life, such as altering the flow of the river and contaminating waters with mercury [1,3,8,9]. ASM, and dredging in particular, can be difficult to reliably monitor due to their remote and dispersed nature, sparse government oversight and regulation, constant movement, and operation in unpermitted areas [8,9]. It is therefore valuable to identify and monitor the location and intensity of ASM activity; one promising way is through remote sensing [9].
Satellite imagery products of various natures (e.g., optical, multispectral, active) are used for mapping and monitoring ASM in various contexts and are especially useful in conflict zones and remote terrain [9,11,12]. Remote sensing is used to determine the distribution of ASM activity on both small and large scales [13,14,15,16], to monitor the development of ASM over time [12,17], and to assess the impact of ASM on the environment and land use [18,19]. Many variations of image classification techniques are used to distinguish ASM from other land cover types [12,20]. While the identification of distinct land cover signatures per pixel (or object) can be difficult, observing the impacts of mining through land cover change using two or more scenes over time often improves the analysis [21]. Optical imagery has been used to monitor vessel activity on rivers and lakes but has limited capabilities due to cloud interference, insufficient resolution, and reliance on atmosphere and light conditions [9,22,23].
Synthetic Aperture Radar (SAR) is an active remote sensing technique used to monitor ASM, although less widely applied [9,10]. While optical imagery can be obscured by cloud cover and lacks the spectral and spatial resolution necessary to distinguish ASM from other types of land cover, SAR provides a useful alternative thanks to its weather independence and wavelength capabilities [9,24]. A common SAR practice is backscatter analysis, which is used to differentiate areas of interest based on their backscatter strengths and patterns [25]. This technique is often used in change detection studies to identify land cover change produced by ASM [9,26,27]. Another common SAR technique, interferometry, measures very fine differences in ground movement between repeat passes of SAR collects, highlighting subsidence or surface motion associated with tunnel and open pit digging or ground disturbance where there was an attempt to extract resources [9,28,29]. SAR has been typically used for monitoring land cover and landform changes that signal ASM activities [25,30]. However, ASM impact and presence that are not measurable through changes in land cover exist on and surrounding rivers in the form of dredging, and SAR methods for vessel detection can be applied to monitor ASM activities [10].
Many algorithms and techniques have been developed to detect ocean ships using SAR [31,32,33,34]. Several approaches use neural networks or deep learning to recognize the backscatter patterns of large ships and then extract these features from the SAR scene [35,36,37,38,39]. Additionally, automated classification techniques are used by applying adaptive moving window thresholds to separate target pixels from their background to identify ships, the most common being the constant false alarm rate (CFAR) [40,41,42,43]. CFAR algorithms compare individual pixels with the statistical properties of their local neighborhood to identify pixels with unusual values [41]. However, the identification of ASM dredges using ship detection methods has not been thoroughly explored. It is important to consider that rivers differ greatly from oceans and from river to river in terms of their environmental factors. Rivers present factors such as shoals, sand or gravel bars, and even rock outcrops that may impede usage or result in misleading SAR backscatter. Dredges differ from ships in their size; ASM riverine dredges tend to have smaller surface areas and are vertically shorter than ocean ships; and in their physical structure; ocean ships may have varying shapes across their surface and be made of metal, while ASM dredges are often flat and made of various materials. Therefore, a method is needed specifically for use in riverine environments where ASM dredging is present.
One of the few examples of using SAR in a riverine dredging application is [44]. They examine SAR intensity histograms to identify thresholds, apply cluster processing, and use boundary detection to extract distinct backscatter features [44]. This analysis is limited to a small portion of the river and only examines one date. Another study [10] uses visual analysis to identify distinct backscatter signatures from ASM dredges on a river in the Central African Republic to monitor ASM over time and found the signals appear most visually distinctive in the VV polarized data. However, [10] notes the time-consuming nature and specialized experience needed for visual identification methods and finds misidentification of the visual cues caused by the dredges’ close operation to riverbanks. The results from [44] along with [10] demonstrate that the strong backscatter created by man-made vessels against the weak backscatter of the river surface is sufficient for distinguishing riverine dredges using SAR.
Taking the methods a step further, [45] uses a backscatter thresholding technique combined with time-series analysis to identify riverine vessel locations using C-band SAR data from the VV polarization of the Sentinel-1 satellite, thus proving that riverine vessels can be observed in Sentinel-1 data and the backscatter produced by smaller vessels are distinguishable from the river surface. However, they acknowledge the challenge of distinguishing vessel types and tailor their study to the habits of sand dredges to reduce false identification. By using a time series and an adaptive river boundary, they account for the daily habits of their subject and the possible geomorphologic areas of their operation. This differs from gold and diamond dredge mining, where ASM dredges hug the riverbanks and operate at unpredictable/varying times and places. There is a need for these methods to be continually developed and tested in new environments and conditions, specifically for investigating ASM dredging in riverine environments.
This paper focuses on ASM riverine dredges used to extract gold from alluvial placer deposits located along riverbeds and riverbanks in the Brazilian Amazon. Using previous ocean ship detection strategies as a starting point for the proposed methods, three methodologies that use SAR to detect ASM dredges are compared. The first technique is an established ocean ship detection method known as Search for Unidentified Maritime Objects (SUMO) [41]. While designed to be used for identifying large ships in ocean environments, it is also used as a comparison point to understand the need for specifically tailored methods and to inspire the development of the following two methods: The second and third are semi-automated methods developed for the riverine environment and ASM dredges. The two proposed methodologies are inspired by ocean ship detection but are adapted and tailored to the riverine environment and the characteristics of ASM dredges. The results are validated using a reference dataset created from visual analysis of a combination of SAR and high-resolution optical imagery.
2. Materials and Methods
2.1. Study Area
Extensive use of mechanized river dredges is currently seen on large sections of the Madeira River, including in the vicinity of Porto Velho, the capital of Rondônia [4] (Figure 2). In 1952, an influx of ASM was seen in the Brazilian state of Rondônia, where gold had been discovered in sediment coverings of the Madeira River [4]. Since mining was regulated in 1979, dredging on the Madeira River went from informal, manual gold extraction to an expansive mechanized activity with the implementation of suction dredges [3]. Although mining between Porto Velho and Abuna has been regulated and legalized for dredges carrying a permit, many dredges reportedly operate outside of these rules and leave behind “ravaged and mercury-contaminated” landscapes [3,8,46]. The Madeira River has been one of the most productive gold-producing regions in Brazil and is being mined by dredges described as floating sluice boxes that measure from 8 m × 14 m to 10 m × 30 m at the largest [3]. This study area section of the Madeira River presents an example of a wide (from 530 to 3500 m), open river with distinct riverbanks and large dredges made from recycled wood and metal [3,46]. Seven acquisitions spanning 4 June 2019 to 10 July 2019 were used to test the three detection methods on the Madeira River.
2.2. Data
L1 Detected High-Res Dual-Pol (GRD-HD) products from the Sentinel-1 satellite, downloaded from the Alaska Satellite Facility (ASF) Data Search Vertex: https://search.asf.alaska.edu/#/ (accessed on 12 January 2021) [47], are used in all methods (Table 1). The scenes are acquired using a C-band SAR with the Interferometric Wide Swath (IW) mode and a temporal resolution of 6 days. The Sentinel-1 satellite collects data using both cross-polarization (VH) and co-polarization (VV). Each SAR acquisition covers a 250 km swath with 20 m × 22 m (ground range x azimuth) resolution, a 10 m × 10 m pixel spacing, and an Equivalent Number of Looks (ENL) of 4.4. The data are collected in ascending and descending passes, although only descending passes were available in this study area. Seven dates are tested to determine the average accuracy and consistency of the methods (scene names can be found in the Supplementary Materials in Table S1). High-resolution 3 m optical imagery from Planet Labs’ PlanetScope Satellite is used to create the validation datasets and to confirm the presence of dredges in this study area [48]. The SAR data are pre-processed using the Sentinel Applications Platform (SNAP) software (version 8.0.0) [49], and subsequent analysis is performed using ESRIs ArcGIS Pro (version 10.6.1).
2.3. SAR Interaction with Dredges
Although ASM dredges can be seen in more detail using high-resolution optical satellite imagery (e.g., Planet), they rely heavily on clear weather and daylight. SAR are an active data collection system that emits its own microwave energy, ranging from 2 to 100 cm wavelengths, and then records the returning energy, allowing it to be weather and daylight independent, providing more “usable” days of data than an optical sensor [32]. Using a sequence of acquisitions from a small antenna to simulate a much larger one, SAR produces a high spatial resolution across large footprints [50] (Figure 3). Variables of acquisition such as slant range, polarization, wavelength, and flight direction, along with the features on the Earth’s surface, impact the strength of the backscatter returned to the sensor [24,50]. The angle and orientation of the wavelength’s emission are represented through polarization, slant range, and flight path and can impact the SAR scene’s composition and backscatter characteristics [24].
SAR wavelengths have unique interactions with terrain and ground features, resulting in measurable differences in backscatter strength that can be useful for identifying areas or objects of interest (Figure 4). Flat surfaces, such as calm water, typically produce low backscatter (specular reflection), and man-made objects with prominent corners, such as buildings or boats, produce a high backscatter signal (corner or double-bounce reflections) [50]. The material that SAR wavelengths interact with also affects the signal return. SAR signals are strongly reflected by materials that conduct electricity well or have a high dielectric constant, like metal [29]. Other materials, such as wood or plastic, are less conductive and create a weaker backscatter return. The interaction between SAR and corner reflectors, particularly against a flat or texturally smooth surface, is valuable for identifying man-made objects such as large metal ships in a calm ocean. ASM dredges are often made of wood but have structured corners, metal sluices, roofs, or other equipment onboard to contribute to the creation of a strong backscatter against a calm river surface.
This paper applies and takes inspiration from ocean ship detection techniques to identify dredges using SAR in a riverine setting. A workflow for a common ship detection process is detailed in [51] and is seen in Figure 5. It is often recommended in ocean ship detection to begin with a land mask to remove the area closest to shore from the analysis, as large ocean ships do not travel in shallow water [51]. However, riverine dredges often operate in shallow water and close to riverbanks, where shoals, sand or gravel bars, rapids, and rock outcrops may present ambiguous or misleading signals. Therefore, the new methods under test use a river boundary that hugs the riverbank as close as possible and considers detections that cross the boundary as still potential dredges. Next, in an ocean ship workflow, an adaptive threshold will be applied to identify statistically anomalous pixels to be clustered into detection features. The two new methods will utilize two different types of evaluation criteria in the threshold step. The detection features are assigned characteristics that may include length, direction, size, roundness, or brightness to be used in the discrimination process. Based on their attributes, the features are classified as possible detections or false alarms using decision rules. Multiple attributes and combinations of attributes are tested in the two new methods to best fit the way dredges appear in the SAR data. The challenge is defining a unique set of parameters to lower false identification rates while retaining correct identifications in a time-efficient and consistent semi-automatic method as compared to a visual analysis. The methods designed for this paper tailor ocean ship detection strategies to better suit a riverine environment for ASM dredge detection.
2.4. Methods
This paper compares the performance of three approaches for the semi-automatic detection of ASM river dredges. Once the SAR data are acquired from the ASF Data Search Vertex, each scene is pre-processed in SNAP using the workflow detailed in [52] with steps as seen in Figure 6. These steps apply a standard set of corrections and reduce the propagation of errors in future processing steps [52]. Speckle filtering is often recommended for SAR processing and is intended to increase the quality of the SAR; however, it reduces small spatial structures in the data, impacting the potential detection of the potentially small features produced by backscatter from ASM riverine dredges, and is not applied here.
After pre-processing, a river boundary is created by dividing land and water pixels with a threshold derived from histogram analysis of the SAR backscatter values. Discarding the area outside of the river boundary saves processing time and ensures land values do not interfere with future steps. A validation data set are created using a visual interpretation of each SAR scene along with high-resolution optical imagery. Each of the three methods is then performed on all dates, producing results using the VV and VH data individually, and then the results from both polarizations are combined for a joint result (Figure 7). After reviewing the results of an initial accuracy assessment, adjustments to the settings, polarizations used, and decision rules were made to address consistent misidentifications in each method. The second iteration of methods was then tested on all scenes and chosen polarizations and then validated for a final time. The iterations with the highest accuracies are presented here.
2.4.1. SUMO
SUMO is a software (version 1.3.5) package published by [41] that implements a set of algorithms to semi- or fully-automatically detect ocean ships in SAR scenes. Using a CFAR approach, the algorithm identifies pixels that are anomalously bright in comparison to their 200 by 200 local pixel neighborhood. Options for user input include a coastline, ice, algorithm, an option to set a “detection threshold adjustment” for each polarization (referred to as thresholdVV and thresholdVH), buffer, and ENL.
To start, the SUMO platform applies a land mask (either user-provided or from OpenStreetMap coastline), computes background pixel statistics, and derives a local detection threshold for each pixel. Any pixel with a value above this local detection threshold is considered “detected”. The “detected” pixels are clustered into features, and attributes such as geographic location, length, width, heading, peak pixel value, integrated value, and significance are calculated and recorded for each detection feature. The whole process is carried out for each polarization (VH and VV in the case of Sentinel-1). This creates three sets of detected features: one for each polarization and one with the detections from both polarizations. The user can opt to accept the results as final or manually review each one and accept or decline the detection within the software interface. The results can be exported into multiple formats to suit the user’s needs.
It is suggested by [41] that there are more detections, both real and false, when the thresholdVV and thresholdVH parameters are lowered. After the initial iterations of the method using the default settings and comparing the results from each polarization option, the chosen approach for applying SUMO to a riverine environment in search of ASM dredges increases the default threshold by 0.5 to be thresholdVV = 2.0 and thresholdVH = 1.7. The buffer is set to 0 pixels because the use of a buffer is not appropriate for the detection of dredges, and the algorithm setting was set to k-distribution (the default and only option). The tool is executed for each of the 7 dates, and the combined polarization detections are chosen as the final results.
2.4.2. Global Method
The second method implements a global threshold, where a single threshold value is determined for each radar scene and applied to all pixels within the river boundary. This method does not use an adaptive threshold as the ocean ship methods do; however, it substitutes a constant threshold and follows the threshold, cluster, and discrimination steps seen in common ship detection methods (Figure 6). In the Global Method, any backscatter value above the threshold is identified as part of the detection, and any backscatter value below the threshold is given a null value. To determine the threshold value for each scene, a dredge is manually identified and confirmed as a true dredge using high-resolution imagery (see Section 2.4.4 for manual identification strategy). A 3 × 3 pixel neighborhood is created around the center pixel with the highest backscatter value of the identified dredge, and the statistics of the entire neighborhood are calculated. One standard deviation below the mean of that neighborhood is used as the global threshold value and is compared with each pixel value within the river boundary, as seen in the formula:
where d is a positive detection pixel, px,y is the pixel value at each x and y location within the river boundary, and and represent the mean and the standard deviation of the 3 × 3 neighborhood around px,y respectively. Only the VV polarization is used in the Global Method. Using the threshold, a binary dataset of the river surface is created when applied to each scene within the water mask. One class indicates a pixel that could be a part of a potential dredge detection if the pixel value is greater than the threshold value, and the other class represents no dredge detected if the pixel value is less than the threshold value. The binary datasets are converted into detection features where adjacent pixels of the same class are combined into one feature.
After thresholding, decision rules, or additional conditions about the characteristics of the features, are applied to narrow down the results to only the most likely to be dredges. Taking inspiration from the attributes recorded in the ocean ship method, relative size, pixel value, and location relative to land are used to indicate the likelihood of the detection feature being a true dredge. The final iteration rejects any feature that intersects the boundary of the river mask, except for features with an above-average area. Only features that are completely within the boundaries of the river mask and have a larger than average size are kept to ensure that any man-made objects such as houses or docks that overhang vegetation on the edge of the river are not falsely identified, while keeping large signals from strong backscatter, which have a higher potential of being a dredge. The remaining features are included in the final results, which are then used in the accuracy assessment.
2.4.3. Local Method
The Local Method examines each pixel individually based on its neighborhood to emphasize deviant pixels. This method uses a moving window similar to the CFAR ship detection methods to identify pixels that are outliers from their surroundings; however, this method creates a distinct boundary around the dredge pixels that will be used to group the pixels with the highest values into a detection feature. First, a high-pass sharpening 5 × 5 filter, also known as an edge enhancement filter, is applied to the pre-processed SAR scene. The filter calculates the focal sum for each pixel based on the 5 × 5 neighborhood using the weights shown in Figure 8. This heightens the comparative difference in the values of a pixel compared to its neighbors. The filter emphasizes the boundaries between potential dredge detection pixels, the highest values, and the water pixels, the lowest values. Then, neighboring pixels of similar values are grouped together to create singular features. The detected features are evaluated to eliminate false alarms using decision rules. Each polarization is used in the Local Method but has individual sets of decision rules.
The Local Method records certain attributes of the detection features to aid in the discrimination of false alarms, as is carried out in the previously described methods; however, it applies a different set of decision rules to each polarization. This method considers the relative size of each feature, location relative to land, and vertices of the polygons derived from the region grouping step. The decision rules for the VV polarization eliminate features that intersect the boundary of the river mask or are less than or equal to the average area of all detection features in that set of results. Then, any features within 50 feet of the river mask boundary or having 5 or fewer vertices are eliminated, except for features with an area greater than one standard deviation above the mean area of all detection features in that set of results. No decision rules are applied to the VH polarization results. The remaining features from the VV and the VH are combined, only keeping features that appear in both polarizations.
2.4.4. Visual Method
A method of visual interpretation is used to create a validation dataset for the semi-automatic methods. This method is preformed to ensure consistency throughout the interpretation of all the SAR scenes. Each scene is manually reviewed within the river mask boundaries for clusters of high-reflectance pixels that contrast with the background of the dark water pixels. These clusters are examined and designated as dredge based on the appearance of the brightness, shape, size, and context of the cluster, following the strategy used in [10]. When a possible dredge is identified, both VV and VH polarizations are examined, and high-resolution optical imagery is referenced at the location to see if there is a dredge in the area within one to two days. If the high reflectance cluster appears in both polarizations, is not eliminated as a manmade object or land in the high-resolution imagery, and there is a dredge in the high-resolution imagery, then the dredge could be identified with high confidence for the validation dataset.
2.4.5. Accuracy Assessment
The results of the SUMO, Global, and Local Methods’ accuracy are evaluated using the Visual Method as the validation dataset. Any detections made by one of the methods that were in the same location as the Visual Methods results are True Positives (TP) (Table 2). Any detection made by the methods under test that did not have an identical result in the Visual Method is a False Positive (FP). Any detection from the Visual Method without a corresponding detection from the other methods is a False Negative (FN).
True Negatives (TN) are not included in the final assessment because there would be an overwhelming number of instances where the methods under test accurately detected the absence of a riverine vessel and would interfere with the results of the accuracy assessment. Precision, sensitivity (also referred to as recall and true positive rate), and F-measure (also referred to as F-score) are used to assess the ability of each method to successfully identify a riverine dredge (Table 3). Precision represents the proportion of detections that are TP, and sensitivity represents the proportion of the validation dataset that is correctly identified by the methods under test. The F-measure, used to evaluate classification systems, weighs precision and sensitivity evenly in one measurement to gauge how well the results balance TP coverage and identification [53]. Omission and commission are calculated to evaluate the errors made by the methods under test. Omission occurs when one of the detection methods does not detect a riverine dredge where one of the Visual Method detections occur (FN), and commission occurs when a detection from one of the methods is false (FP).
3. Results
The results are produced from three methods of identifying ASM riverine dredges in 10 m resolution Sentinel-1 C band SAR on the Madeira River in Brazil (Figure 9). Each method is tested on the same seven dates, and the accuracy of each is calculated using a validation dataset produced through visual analysis of the SAR data. The final data consists of seven sets of detection results for each of the methods. Across all dates, there are 205 instances of potential dredges identified by the visual analysis (Table 4). The Local Method identified 254 potential dredges, the Global Method identified 138, and the SUMO Method identified 159 potential dredges.
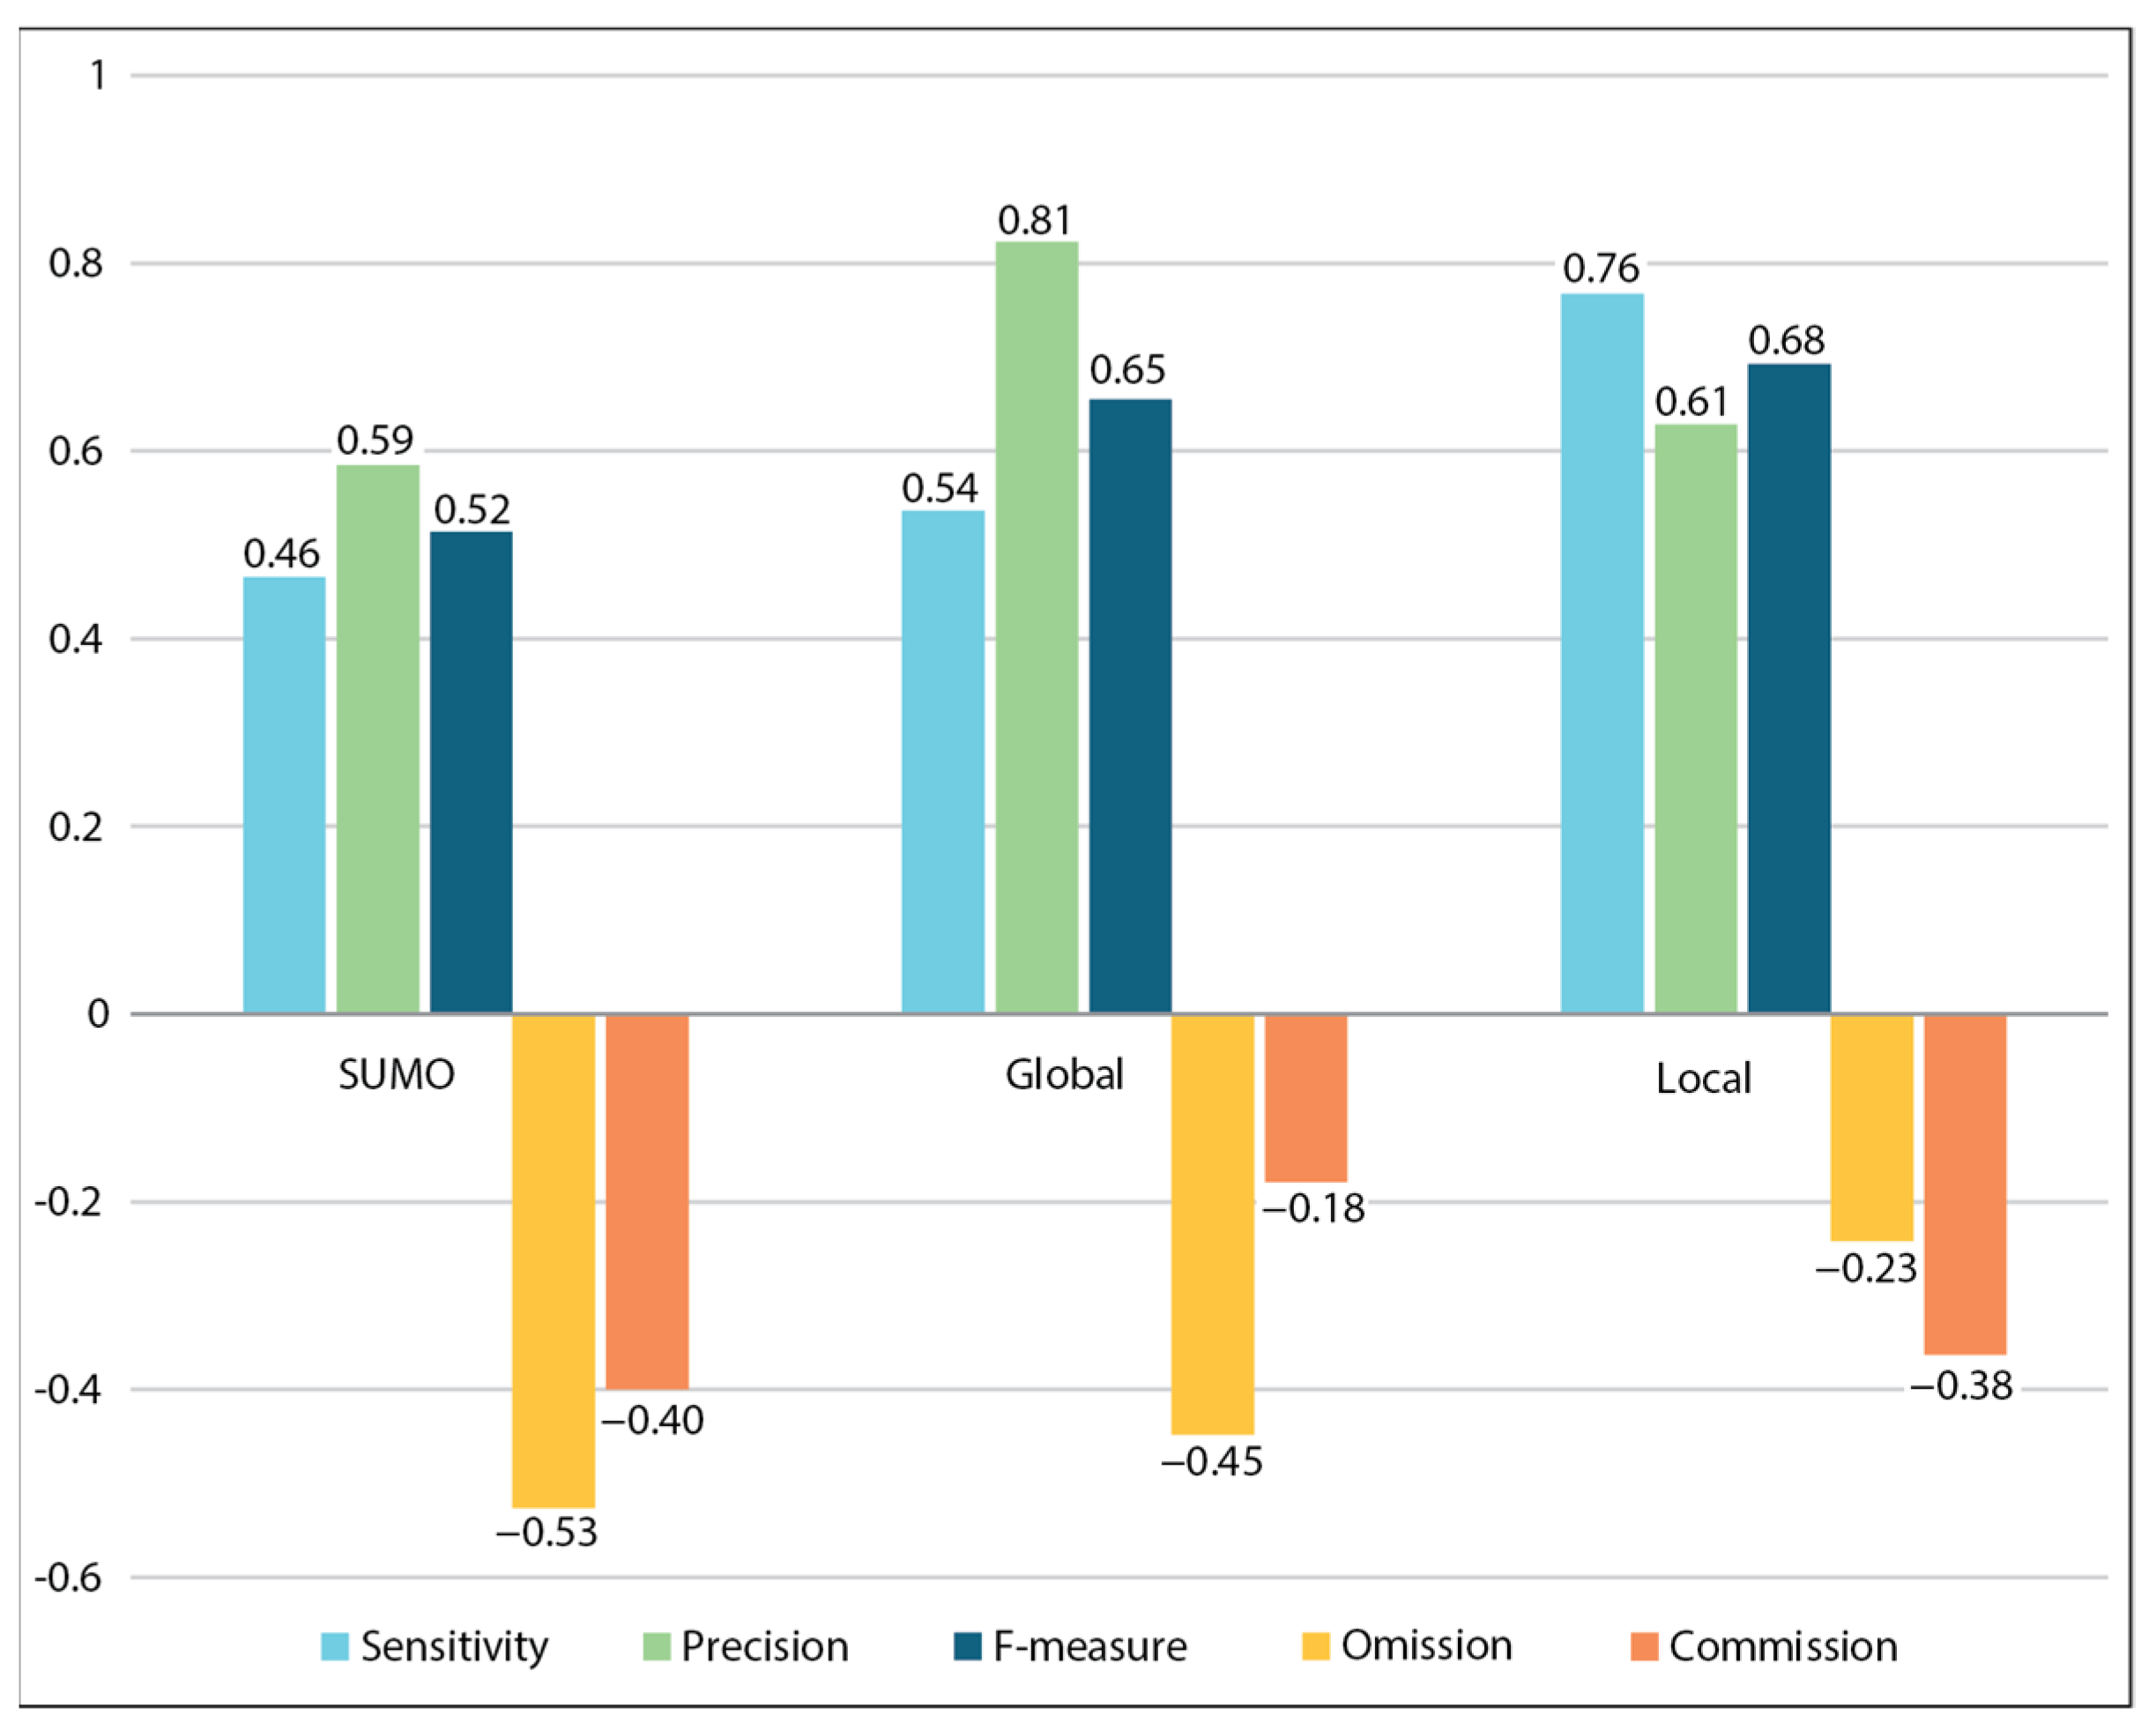
By classifying each detection as either TP, FP, or FN in all datasets produced by the three methods under test, accuracy metrics were calculated. The SUMO Method has the lowest precision and the lowest sensitivity out of all the methods under test (Figure 10). The Global Method has the highest precision but the second highest sensitivity. The Local Method has the highest sensitivity and the second highest precision; it is also the only method that has a higher sensitivity than precision and has the highest count of TPs and the lowest FN. However, the Local Method also has the highest count of FPs. The Global Method has the lowest count of FPs but has a higher count of FN than the Local Method. The Local Method has the lowest omission error, and the Global Method has the lowest commission error. The SUMO Method has the highest rate of both error types. The Local Method is the only one with a higher rate of commission error than omission. The Local Method has the highest F-measure of all methods.
4. Discussion
4.1. Method Accuracy
From the results summarized in Figure 10 and Table 3, a tradeoff is seen between sensitivity and precision and between omission and commission. The methods with higher sensitivity have greater occurrences of FP, and the methods with higher precision have a greater occurrence of FN. This tradeoff is also reflected in the error measures. When a method has a low commission error, the omission error is higher, increasing the likelihood of missed identifications. The Local Method has the highest F-measure and the lowest combined error, providing the most balanced results. The Global Method acts as an inverse, where it has a much higher precision and omission rate than sensitivity and commission. The Local Method has a greater chance of identifying the most potential dredges in a scene but also has a greater likelihood of creating FP, while the Global Method has a greater chance of the identifications it makes being accurate but also has a greater chance of missing a true detection. Therefore, a tradeoff between two different approaches to detection methods is found: a lenient approach with high sensitivity and low omission error, and a restrictive method with high precision and low commission error. Finding a balance between these two approaches is desirable to create an accurate and comprehensive method. The method with the highest overall accuracy is the Local Method, with an F-measure of 0.68. While this is a moderate level of accuracy, adjusting thresholds, exploring new filter types, and incorporating more decision rules to tailor the method to the environment, dredge appearance, and habits may create a more robust and trustworthy method.
A method where sensitivity and precision are nearly equal may best be applied to a situation where a general analysis of the activity of dredges on a river needs to be assessed and there is time for manual FP detection. Circumstances where the priority is absolute coverage and identification of as many potential dredges on the river as possible could be achieved with a more lenient, higher-sensitivity approach. This would produce the highest chance that every potential dredge is included in the results; however, this opens up a higher risk of FP. A more restrictive approach may be applied when overpredicting should be avoided and acquiring results that are as reliable as possible is the priority.
There are common causes of FP across the methods. FP are found to occur most frequently around the edges of the riverbanks, near manmade features such as dams, and in areas of high noise in the SAR scene, such as areas with rough or shallow water or from other forms of surface scattering. Higher commission errors could be caused by the small variations in the water surface created by shallow or rough water that cause the individual pixels to be classified as anomalous from their surroundings in the same way dredge pixels present themselves. There are small islands in the river whose shores change too often to be accounted for in a single water mask, as well as piles of sand or gravel from the river bottom piled up by dredges along the riverbank that can cause FP. The use of a singular high-pass edge enhancement filter in the Local Method may also enhance these areas, giving the illusion that the pixels are brighter than they are. However, it is often recommended to use a high-pass and a low-pass filter in conjunction; a method that combines a high-pass filter to enhance the differences between pixels with a low-pass filter that reduces local variation and noise could reduce FP. Additionally, there is the possibility of a filter where the weights of the neighborhood pixels could be defined by the user, and different weight arrangements could be tested and adjusted for different environments. Recurrent omission errors, or FNs, happen when multiple dredges operate side by side, leading to the methods grouping them into one detection feature and undercounting the number of dredges at that location. There are also cases where FN is caused by a weak signal in the VH band that is not strong enough to be identified without incurring increasingly abundant FP. It is possible to compare the performance of these methods to other approaches to automatic detection, including Machine Learning and Deep Learning. This methodology was manually looped through two or three variations for each method; with Machine Learning and automation, this process could be looped many times and much faster to test as many variations as possible to realize the optimal threshold or decision rules.
4.2. SAR for Dredge Detection
This paper’s goal is to implement SAR in a semi-automatic method to detect ASM riverine dredges. The purpose is to further the methods of manual inspection and increase the speed and consistency of results for monitoring ASM activity while also assessing the challenges that come along with automating this process with SAR. This process takes inspiration from ocean ship detection methods, compares them side by side with methods tailored for the riverine environment, and examines different threshold types, boundary methods, and discrimination attributes to explore how SAR can be applied to successfully monitor ASM river dredges. The first iteration of each method found that using results from the VV polarization produced higher sensitivity and lower precision. This may be caused by the transmitting and receiving planes having the same orientation. Co-polarization usually presents a stronger signal return and is used for detecting specular or volume scattering. This may cause stronger signals in not only the dredges but also in the water and on the riverbanks and cause the occurrence of FP. The VV polarization creates much larger signals from higher-intensity scattering than the VH and is therefore helpful when visually scanning images and identifying dredges by hand. However, the weaker background noise in the VH makes it easier to separate FP from TP in the semi-automatic methods, but it also leads to a higher omission error and FN count. Combining the results from each polarization may provide a balance between the tradeoffs in dredge identification using SAR.
Along with the ability of an active sensor to see through cloud coverage, the combination of corner reflectors and metal structures against a flat or smooth surface contributes to the advantages of SAR as a suitable option for detecting dredges. However, many of the dredges in this study area are made from a combination of wood and metal. Wood is a poor reflector of SAR pulses and could limit the capability of them being distinguished in the SAR data if they do not happen to have additional metal parts. These methods implemented a C-band SAR with a medium 10 m spatial resolution. Higher spatial resolution would potentially reveal overlooked smaller dredges, along with adding more detail to the dredge shape and structure, aiding in further identification of vessel type and potential production power. Additionally, access to longer wavelengths would generate greater double bounce and corner reflections off dredges to create an even more distinct signal and would help in seeing through any overhanging canopy on the banks of the river.
4.3. Monitoring ASM Activity
These methods provided locations of ASM riverine dredges from SAR data across the course of a month on the Madeira River in Brazil. Along with manual supervision, these semi-automatic methods can increase the speed and consistency of identifying and monitoring these riverine vessels. Counts of the potential identifications can be useful in understanding the extent of ASM on a river and further locating hot spots of the activity by examining recurring locations of these identifications across the month. The consistent monitoring provided by SAR data are useful for the continually changing conditions of the river and the constant movement of the dredges.
Testing the flexibility and consistency of these methods in different study areas will help examine how different riverine environments, dredge shape, material, or size affect accuracy. Environmental factors are important when considering the transferability of the methods to other rivers. The Madeira River is an example of a wide river and has distinct riverbanks that make it relatively easy to identify vessels on its surface in SAR. However, ASM dredges can be found on much smaller, narrower, and remote rivers with vegetation overhangs and rough, shallow water that may change the accuracy of these methods. Longer wavelengths may help the methods adapt to smaller and different material dredges. Additionally, higher-resolution SAR data may provide more detail to identify dredges and reduce false alarms. Ideally, an automatic dredge detection tool would possess multiple parameters for user input based on river site, resolution, average dredge size, and how lenient or restrictive the final detection results should be.
Another consideration is the availability and accuracy of the validation dataset for ASM dredges. ASM dredges do not report their location the way ocean ships do, so there is no natural data to consult for accuracy. It would not be practical to manually create a validation dataset for every analysis that uses an automatic detection method. Creating a validation dataset for a few dates and then using the results as a baseline accuracy rate for future tests in that location could be a solution where there are no true validation data set but there is an understood level of confidence for the location. Manually reviewing the results to discard any abundant or obvious FP would additionally help increase the level of confidence in the detection.
5. Conclusions
This paper compares three different detection approaches for identifying dredges on the Madeira River in Brazil using SAR. The SUMO Method, the Local Method, and the Global Method were tested on seven SAR collection dates. A dataset created from the visual interpretation of SAR and optical high-resolution imagery is used as the validation dataset in the accuracy assessment. These methods are an exploration of SAR for the use of semi-automatically detecting ASM riverine dredges. The results show that ocean ship detection methods using SAR can be a starting point for developing dredge detection in riverine environments. However, it is important to take into consideration the differences in size and behavior between ocean ships and riverine dredges and how their environment may impact the process. It is also important to understand the tradeoffs of the approaches each method may take. The Global Method produced the most successful restrictive results with the highest precision and is the least likely to create FP; however, it has a higher omission error. The Local Method is the most successful and lenient method. This method produced the highest proportion of TP; however, this method has an increased risk of FP. Consistent and reliable monitoring of ASM can provide beneficial information for governments and international bodies, as well as for local communities and miners, and may help in the mitigation of possible negative effects on the surrounding area caused by dredging. The use of SAR provides useful information to identify and monitor locations and the intensity of ASM activity. The methods outlined here can be used as a starting point for a more flexible and automated approach to identifying ASM dredges that can help further the knowledge of ASM in riverine environments.
Supplementary Materials
The following supporting information can be downloaded at: https://www.mdpi.com/article/10.3390/rs15245701/s1.
Author Contributions
Conceptualization, P.G.C. and M.A.A.; methodology, M.A.A., P.G.C. and M.M.; formal analysis, M.A.A.; data curation and production, M.A.A.; writing—original draft preparation, M.A.A.; writing—review and editing, P.G.C. and M.M.; visualization, M.A.A. All authors have read and agreed to the published version of the manuscript.
Funding
This research did not receive any specific grants from funding agencies in the public, commercial, or not-for-profit sectors.
Data Availability Statement
Feature locations of the detected dredges from each method and pre-processed SAR scenes for each date observed are freely available on sciencebase.gov: https://doi.org/10.5066/P9OML7YH (accessed on 29 November 2023).
Acknowledgments
The authors would like to recognize Kendall C. Wnuk (USGS) for valuable comments on an early version of the manuscript; Rob Stamm (USGS) and Kathleen M. Boston (Akima Systems Engineering) for reviews of data products and metadata; and four anonymous peer reviewers for their reviews and comments that helped to improve this manuscript.
Conflicts of Interest
The authors declare no conflict of interest.
References
- Teixeira, R.A.; Pereira, W.V.d.S.; de Souza, E.S.; Ramos, S.J.; Dias, Y.N.; de Lima, M.W.; de Souza Neto, H.F.; de Oliveira, E.S.; Fernandes, A.R. Artisanal Gold Mining in the Eastern Amazon: Environmental and Human Health Risks of Mercury from Different Mining Methods. Chemosphere 2021, 284, 131220. [Google Scholar] [CrossRef] [PubMed]
- Fritz, W.M.; McQuilken, J.; Collins, N.; Weldegiorgis, F. Global Trends in Artisanal and Small-Scale Mining (ASM): A Review of Key Numbers and Issues; International Institute for Sustainable Development: Winnipeg, MB, Canada, 2014; Volume 91. [Google Scholar]
- Balzino, M.; Seccatore, J.; Marin, T.; De Tomi, G.; Veiga, M.M. Gold Losses and Mercury Recovery in Artisanal Gold Mining on the Madeira River, Brazil. J. Clean. Prod. 2015, 102, 370–377. [Google Scholar] [CrossRef]
- da Costa, M.A.; Rios, F.J. The Gold Mining Industry in Brazil: A Historical Overview. Ore Geol. Rev. 2022, 148, 105005. [Google Scholar] [CrossRef]
- Kohler, J. 7.4.1: Dredging or Dredge Mining. Available online: https://www.e-education.psu.edu/geog000/node/883 (accessed on 4 April 2023).
- Harvey, B.C.; Lisle, T.E. Effects of Suction Dredging on Streams: A Review and an Evaluation Strategy. Fisheries 1998, 23, 8–17. [Google Scholar] [CrossRef]
- Webster, D. The Devastating Costs of the Amazon Gold Rush. Available online: https://www.smithsonianmag.com/travel/the-devastating-costs-of-the-amazon-gold-rush-19365506/ (accessed on 4 April 2023).
- Pestana, I.A.; de Rezende, C.E.; Almeida, R.; de Lacerda, L.D.; Bastos, W.R. Let’s Talk about Mercury Contamination in the Amazon (Again): The Case of the Floating Gold Miners’ Village on the Madeira River. Extr. Ind. Soc. 2022, 11, 101122. [Google Scholar] [CrossRef]
- Moomen, A.-W.; Lacroix, P.; Benvenuti, A.; Planque, M.; Piller, T.; Davis, K.; Miranda, M.; Ibrahim, E.; Giuliani, G. Assessing the Applications of Earth Observation Data for Monitoring Artisanal and Small-Scale Gold Mining (ASGM) in Developing Countries. Remote Sens. 2022, 14, 2971. [Google Scholar] [CrossRef]
- Alessi, M.A.; Chirico, P.G.; Sunder, S.; O’Pry, K.L. Detection and Monitoring of Small-Scale Diamond and Gold Mining Dredges Using Synthetic Aperture Radar on the Kadéï (Sangha) River, Central African Republic. Remote Sens. 2023, 15, 913. [Google Scholar] [CrossRef]
- Werner, T.T.; Bebbington, A.; Gregory, G. Assessing Impacts of Mining: Recent Contributions from GIS and Remote Sensing. Extr. Ind. Soc. 2019, 6, 993–1012. [Google Scholar] [CrossRef]
- DeWitt, J.D.; Chirico, P.G. Assessing Change in Small-Scale Diamond Mining Activity across the Carnot Region of the Central African Republic. In Proceedings of the ASPRS Annual Conference, Baltimore, MD, USA, 11–17 March 2017; Volume 13. [Google Scholar]
- Barenblitt, A.; Payton, A.; Lagomasino, D.; Fatoyinbo, L.; Asare, K.; Aidoo, K.; Pigott, H.; Som, C.K.; Smeets, L.; Seidu, O.; et al. The Large Footprint of Small-Scale Artisanal Gold Mining in Ghana. Sci. Total Environ. 2021, 781, 146644. [Google Scholar] [CrossRef]
- Nyamekye, C.; Ghansah, B.; Agyapong, E.; Obuobie, E.; Awuah, A.; Kwofie, S. Examining the Performances of True Color RGB Bands from Landsat-8, Sentinel-2 and UAV as Stand-Alone Data for Mapping Artisanal and Small-Scale Mining (ASM). Remote Sens. Appl. Soc. Environ. 2021, 24, 100655. [Google Scholar] [CrossRef]
- Werner, T.T.; Mudd, G.M.; Schipper, A.M.; Huijbregts, M.A.J.; Taneja, L.; Northey, S.A. Global-Scale Remote Sensing of Mine Areas and Analysis of Factors Explaining Their Extent. Glob. Environ. Chang. 2020, 60, 102007. [Google Scholar] [CrossRef]
- DeWitt, J.D.; Chirico, P.G.; Bergstresser, S.E.; Clark, I.E. The Central African Republic Diamond Database—A Geodatabase of Archival Diamond Occurrences and Areas of Recent Artisanal and Small-Scale Diamond Mining; Open-File Report 2018–1088; Open-File Report; U.S. Geological Survey: Reston, VA, USA, 2018.
- Nyamekye, C.; Ghansah, B.; Agyapong, E.; Kwofie, S. Mapping Changes in Artisanal and Small-Scale Mining (ASM) Landscape Using Machine and Deep Learning Algorithms—A Proxy Evaluation of the 2017 Ban on ASM in Ghana. Environ. Chall. 2021, 3, 100053. [Google Scholar] [CrossRef]
- Owolabi, A.O.; Amujo, K.; Olorunfemi, I.E. Spatiotemporal Changes on Land Surface Temperature, Land and Water Resources of Host Communities Due to Artisanal Mining. Environ. Sci. Pollut. Res. 2021, 28, 36375–36398. [Google Scholar] [CrossRef] [PubMed]
- Snapir, B.; Simms, D.M.; Waine, T.W. Mapping the Expansion of Galamsey Gold Mines in the Cocoa Growing Area of Ghana Using Optical Remote Sensing. Int. J. Appl. Earth Obs. Geoinf. 2017, 58, 225–233. [Google Scholar] [CrossRef]
- Kamga, M.A.; Nguemhe Fils, S.C.; Ayodele, M.O.; Olatubara, C.O.; Nzali, S.; Adenikinju, A.; Khalifa, M. Evaluation of Land Use/Land Cover Changes Due to Gold Mining Activities from 1987 to 2017 Using Landsat Imagery, East Cameroon. GeoJournal 2020, 85, 1097–1114. [Google Scholar] [CrossRef]
- Mhangara, P.; Tsoeleng, L.T.; Mapurisa, W. Monitoring the Development of Artisanal Mines in South Africa. J. S. Afr. Inst. Min. Metall. 2020, 120, 299–307. [Google Scholar] [CrossRef] [PubMed]
- Duan, H.; Cao, Z.; Shen, M.; Liu, D.; Xiao, Q. Detection of Illicit Sand Mining and the Associated Environmental Effects in China’s Fourth Largest Freshwater Lake Using Daytime and Nighttime Satellite Images. Sci. Total Environ. 2019, 647, 606–618. [Google Scholar] [CrossRef] [PubMed]
- Li, J.; Tian, L.; Chen, X.; Li, X.; Huang, J.; Lu, J.; Feng, L. Remote-Sensing Monitoring for Spatio-Temporal Dynamics of Sand Dredging Activities at Poyang Lake in China. Int. J. Remote Sens. 2014, 35, 6004–6022. [Google Scholar] [CrossRef]
- Moreira, A.; Prats-Iraola, P.; Younis, M.; Krieger, G.; Hajnsek, I.; Papathanassiou, K.P. A Tutorial on Synthetic Aperture Radar. IEEE Geosci. Remote Sens. Mag. 2013, 1, 6–43. [Google Scholar] [CrossRef]
- Forkuor, G.; Ullmann, T.; Griesbeck, M. Mapping and Monitoring Small-Scale Mining Activities in Ghana Using Sentinel-1 Time Series (2015–2019). Remote Sens. 2020, 12, 911. [Google Scholar] [CrossRef]
- Kimijima, S.; Sakakibara, M.; Nagai, M. Characterizing Time-Series Roving Artisanal and Small-Scale Gold Mining Activities in Indonesia Using Sentinel-1 Data. Int. J. Environ. Res. Public. Health 2022, 19, 6266. [Google Scholar] [CrossRef]
- Vargas, C.; Itoh, T.; Koide, T.; Regal, F.; Yoshino, M.; Okonogi, H.; Padilla, K.S.; Vento, N.V.; Navarrete, C.; Rivero, E.G. Sentinel-1 Data to Support Monitoring Deforestation in Tropical Humid Forests. Open Sci. J. 2021, 6, 23. [Google Scholar]
- Ammirati, L.; Mondillo, N.; Rodas, R.A.; Sellers, C.; Di Martire, D. Monitoring Land Surface Deformation Associated with Gold Artisanal Mining in the Zaruma City (Ecuador). Remote Sens. 2020, 12, 2135. [Google Scholar] [CrossRef]
- Brown, C.; Daniels, A.; Boyd, D.S.; Sowter, A.; Foody, G.; Kara, S. Investigating the Potential of Radar Interferometry for Monitoring Rural Artisanal Cobalt Mines in the Democratic Republic of the Congo. Sustainability 2020, 12, 9834. [Google Scholar] [CrossRef]
- Janse van Rensburg, G.; Kemp, J. The Use of C-Band and X-Band SAR with Machine Learning for Detecting Small-Scale Mining. Remote Sens. 2022, 14, 977. [Google Scholar] [CrossRef]
- Zhang, X.; Huo, C.; Xu, N.; Jiang, H.; Cao, Y.; Ni, L.; Pan, C. Multitask Learning for Ship Detection From Synthetic Aperture Radar Images. IEEE J. Sel. Top. Appl. Earth Obs. Remote Sens. 2021, 14, 8048–8062. [Google Scholar] [CrossRef]
- Chaturvedi, S.K. Study of Synthetic Aperture Radar and Automatic Identification System for Ship Target Detection. J. Ocean Eng. Sci. 2019, 4, 173–182. [Google Scholar] [CrossRef]
- Zhang, X.; Wang, H.; Xu, C.; Lv, Y.; Fu, C.; Xiao, H.; He, Y. A Lightweight Feature Optimizing Network for Ship Detection in SAR Image. IEEE Access 2019, 7, 141662–141678. [Google Scholar] [CrossRef]
- Grover, A.; Kumar, S.; Kumar, A. Ship detection using Sentinel-1 SAR data. ISPRS Ann. Photogramm. Remote Sens. Spat. Inf. Sci. 2018, IV-5, 317–324. [Google Scholar] [CrossRef]
- Chen, Y.; Duan, T.; Wang, C.; Zhang, Y.; Huang, M. End-to-End Ship Detection in SAR Images for Complex Scenes Based on Deep CNNs. J. Sens. 2021, 2021, 8893182. [Google Scholar] [CrossRef]
- Chen, C.; He, C.; Hu, C.; Pei, H.; Jiao, L. A Deep Neural Network Based on an Attention Mechanism for SAR Ship Detection in Multiscale and Complex Scenarios. IEEE Access 2019, 7, 104848–104863. [Google Scholar] [CrossRef]
- Jiao, J.; Zhang, Y.; Sun, H.; Yang, X.; Gao, X.; Hong, W.; Fu, K.; Sun, X. A Densely Connected End-to-End Neural Network for Multiscale and Multiscene SAR Ship Detection. IEEE Access 2018, 6, 20881–20892. [Google Scholar] [CrossRef]
- Cui, J.; Jia, H.; Wang, H.; Xu, F. A Fast Threshold Neural Network for Ship Detection in Large-Scene SAR Images. IEEE J. Sel. Top. Appl. Earth Obs. Remote Sens. 2022, 15, 6016–6032. [Google Scholar] [CrossRef]
- Li, D.; Liang, Q.; Liu, H.; Liu, Q.; Liu, H.; Liao, G. A Novel Multidimensional Domain Deep Learning Network for SAR Ship Detection. IEEE Trans. Geosci. Remote Sens. 2022, 60, 5203213. [Google Scholar] [CrossRef]
- Xie, T.; Liu, M.; Zhang, M.; Qi, S.; Yang, J. Ship Detection Based on a Superpixel-Level CFAR Detector for SAR Imagery. Int. J. Remote Sens. 2022, 43, 3412–3428. [Google Scholar] [CrossRef]
- Greidanus, H.; Alvarez, M.; Santamaria, C.; Thoorens, F.-X.; Kourti, N.; Argentieri, P. The SUMO Ship Detector Algorithm for Satellite Radar Images. Remote Sens. 2017, 9, 246. [Google Scholar] [CrossRef]
- Deng, H.; Pi, D.; Zhao, Y. Ship Target Detection Based on CFAR and Deep Learning SAR Image. J. Coast. Res. 2019, 94, 161. [Google Scholar] [CrossRef]
- Wang, R.; Li, J.; Duan, Y.; Cao, H.; Zhao, Y. Study on the Combined Application of CFAR and Deep Learning in Ship Detection. J. Indian Soc. Remote Sens. 2018, 46, 1413–1421. [Google Scholar] [CrossRef]
- Cheng, X.; Wan, Y.; Cao, B. Identification of Sand Dredges in Yangtze River Based on ASAR Remote Sensing Data. In Proceedings of the 2009 17th International Conference on Geoinformatics, Fairfax, VA, USA, 12–14 August 2009; IEEE: Fairfax, VA, USA, 2009; pp. 1–5. [Google Scholar]
- Gruel, C.R.; Latrubesse, E.M. A Monitoring System of Sand Mining in Large Rivers and Its Application to the Ayeyarwady (Irrawaddy) River, Myanmar. Water 2021, 13, 2331. [Google Scholar] [CrossRef]
- Faleiros, G. Gold Priced at $1700 per Ounce Brings New Gold Rush to Brazilian Amazon. Available online: https://news.mongabay.com/2020/07/gold-priced-at-1700-per-ounce-brings-new-gold-rush-to-brazilian-amazon/ (accessed on 4 April 2023).
- Laurencelle, J. Sentinel-1. Available online: https://asf.alaska.edu/data-sets/sar-data-sets/sentinel-1/ (accessed on 4 April 2023).
- PlanetScope. Available online: https://developers.planet.com/docs/data/planetscope/ (accessed on 4 April 2023).
- SNAP—ESA Sentinel Application Platform v{8.0.0}. Available online: http://step.esa.int (accessed on 8 December 2023).
- Flores, A.K.; Herndon, K.E.; Rajesh, T.; Cherrington, E. Synthetic Aperture Radar (SAR) Handbook: Comprehensive Methodologies for Forest Monitoring and Biomass Estimation; NASA: Fort Worth, TX, USA, 2019. [CrossRef]
- El-Darymli, K.; McGuire, P.; Power, D.; Moloney, C. Target Detection in Synthetic Aperture Radar Imagery: A State-of-the-Art Survey. J. Appl. Remote Sens. 2013, 7, 071598. [Google Scholar] [CrossRef]
- Filipponi, F. Sentinel-1 GRD Preprocessing Workflow. Proceedings 2019, 18, 11. [Google Scholar]
- Hripcsak, G. Agreement, the F-Measure, and Reliability in Information Retrieval. J. Am. Med. Inform. Assoc. 2005, 12, 296–298. [Google Scholar] [CrossRef]
Figure 1.
Structure of a bucket-line dredge (A) and a suction dredge (B). Graphic from [10].
Figure 1.
Structure of a bucket-line dredge (A) and a suction dredge (B). Graphic from [10].
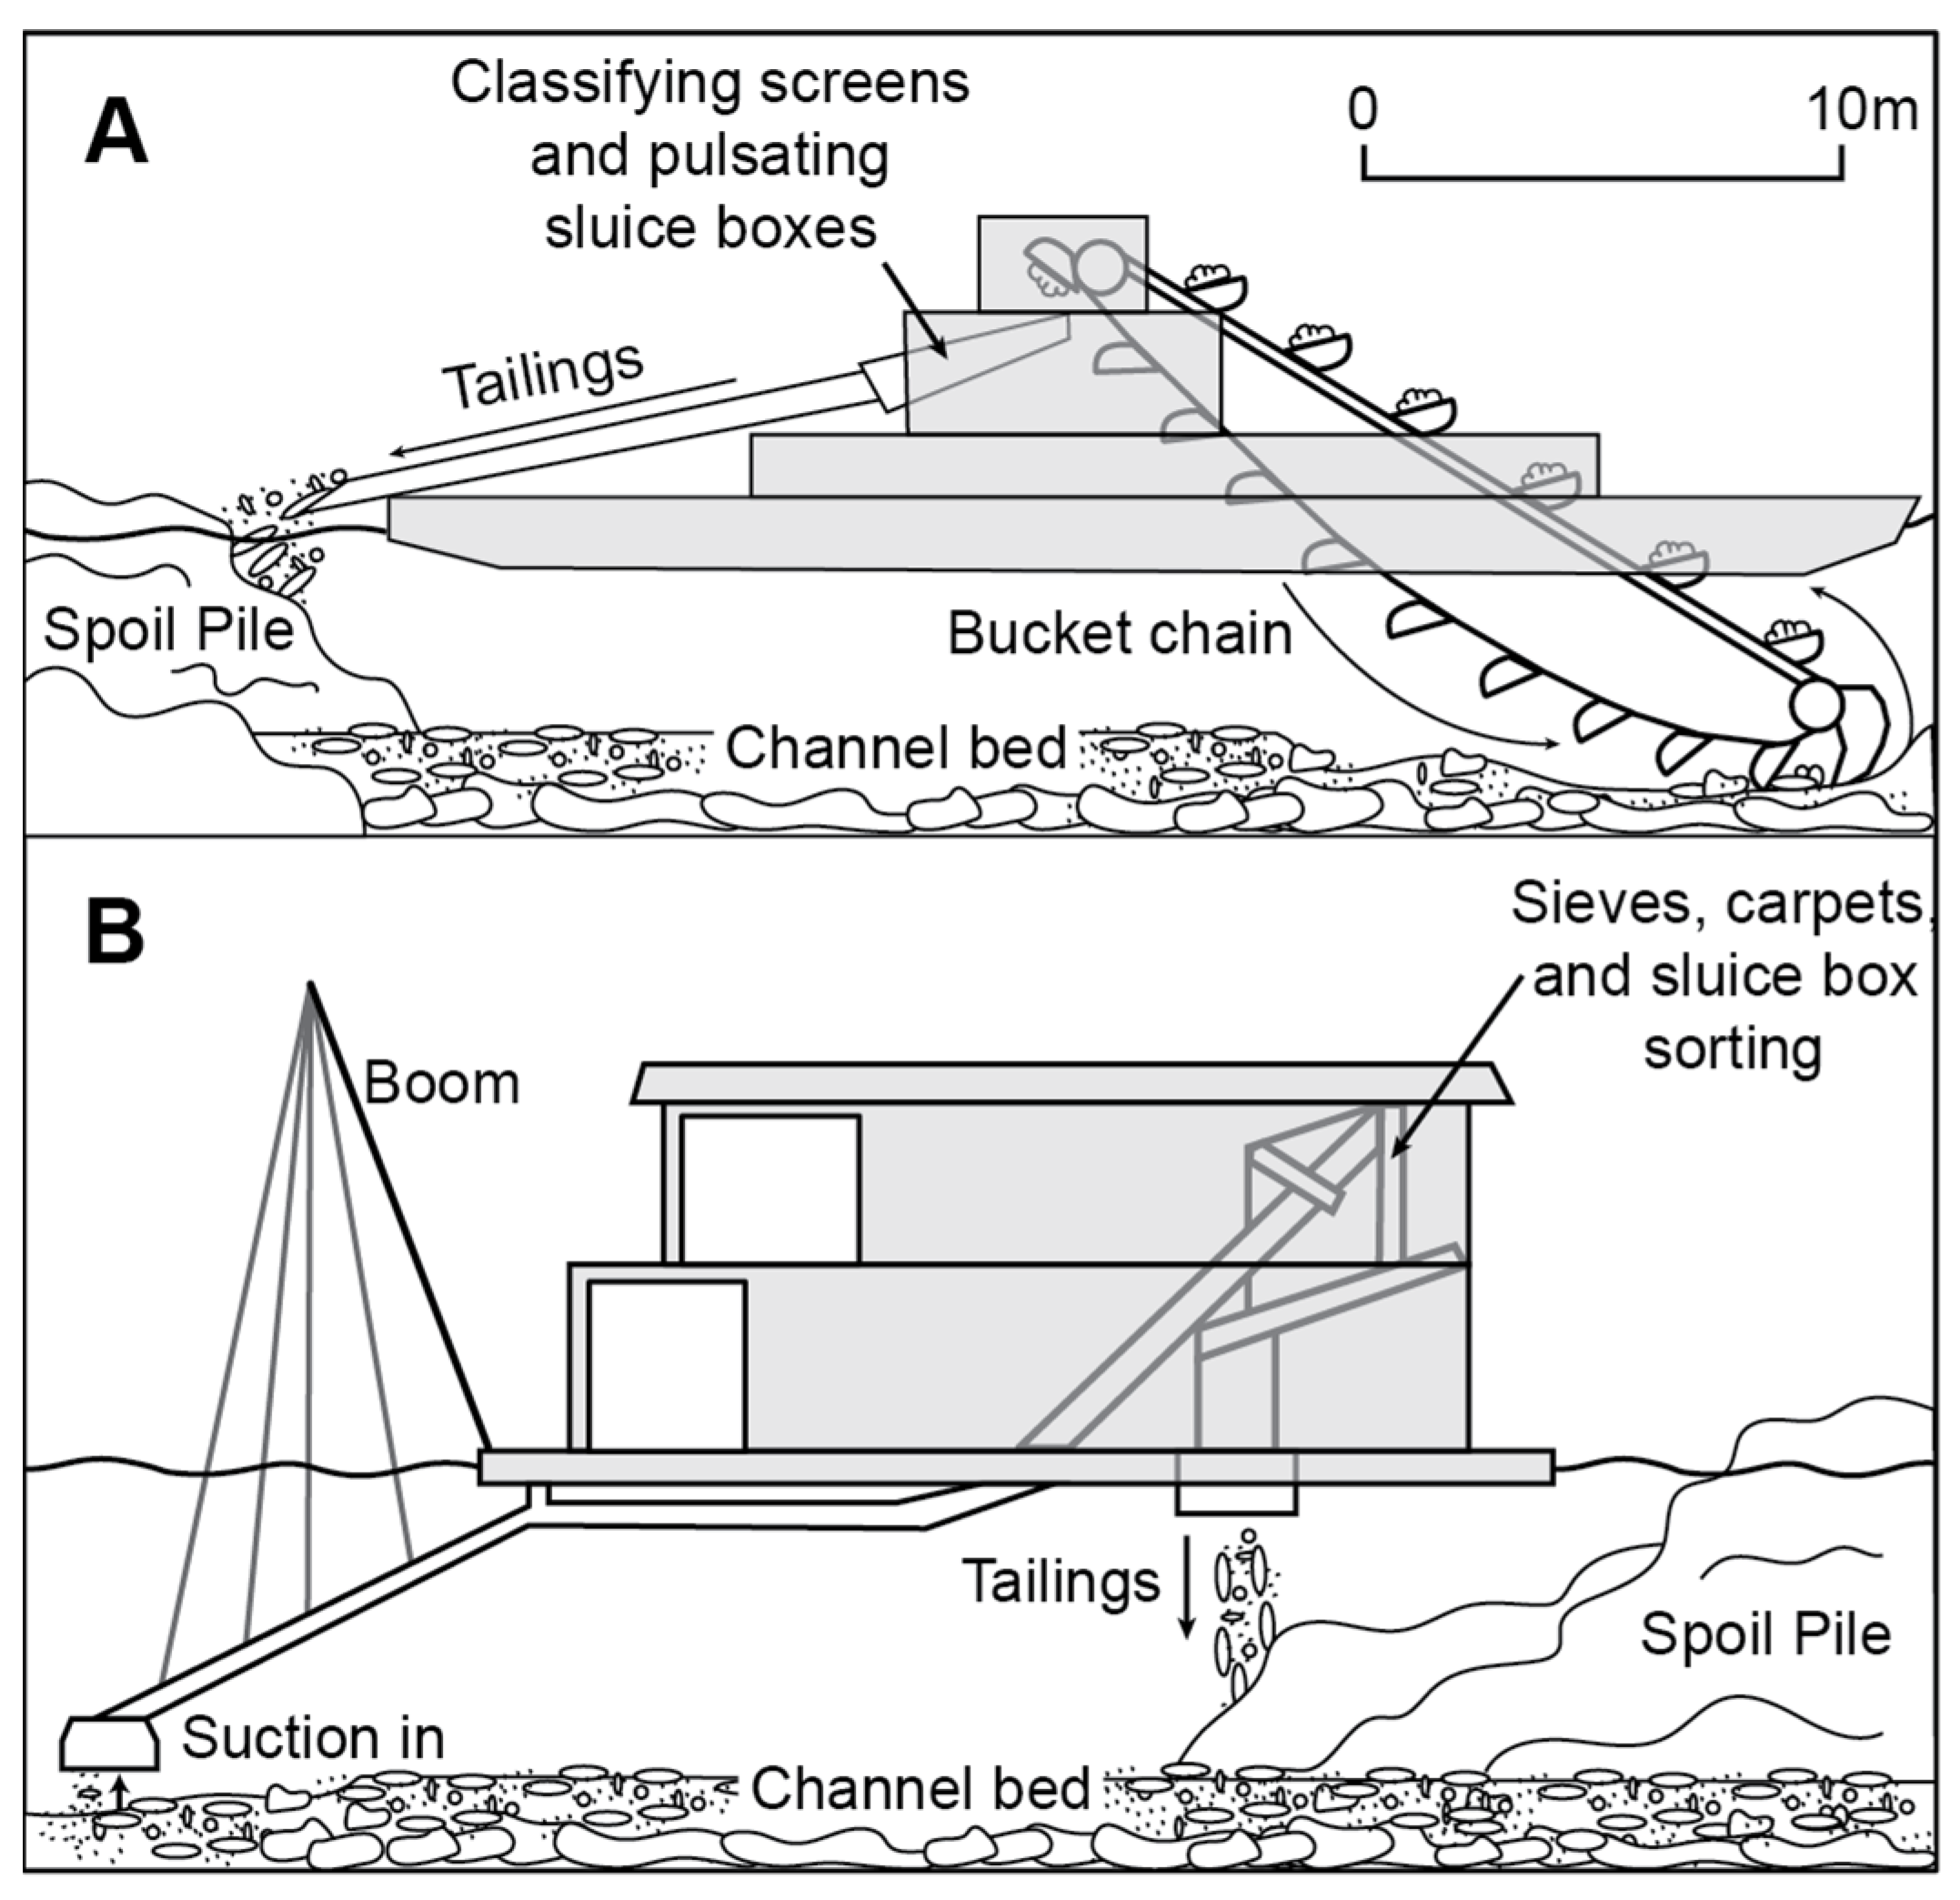
Figure 2.
Location map of this study area between Porto Velho and Abuna and the Madeira River boundary used in the analysis. Landsat-8 image courtesy of the U.S. Geological Survey.
Figure 2.
Location map of this study area between Porto Velho and Abuna and the Madeira River boundary used in the analysis. Landsat-8 image courtesy of the U.S. Geological Survey.

Figure 3.
Typical SAR imaging geometry. Graphic from [10].
Figure 3.
Typical SAR imaging geometry. Graphic from [10].
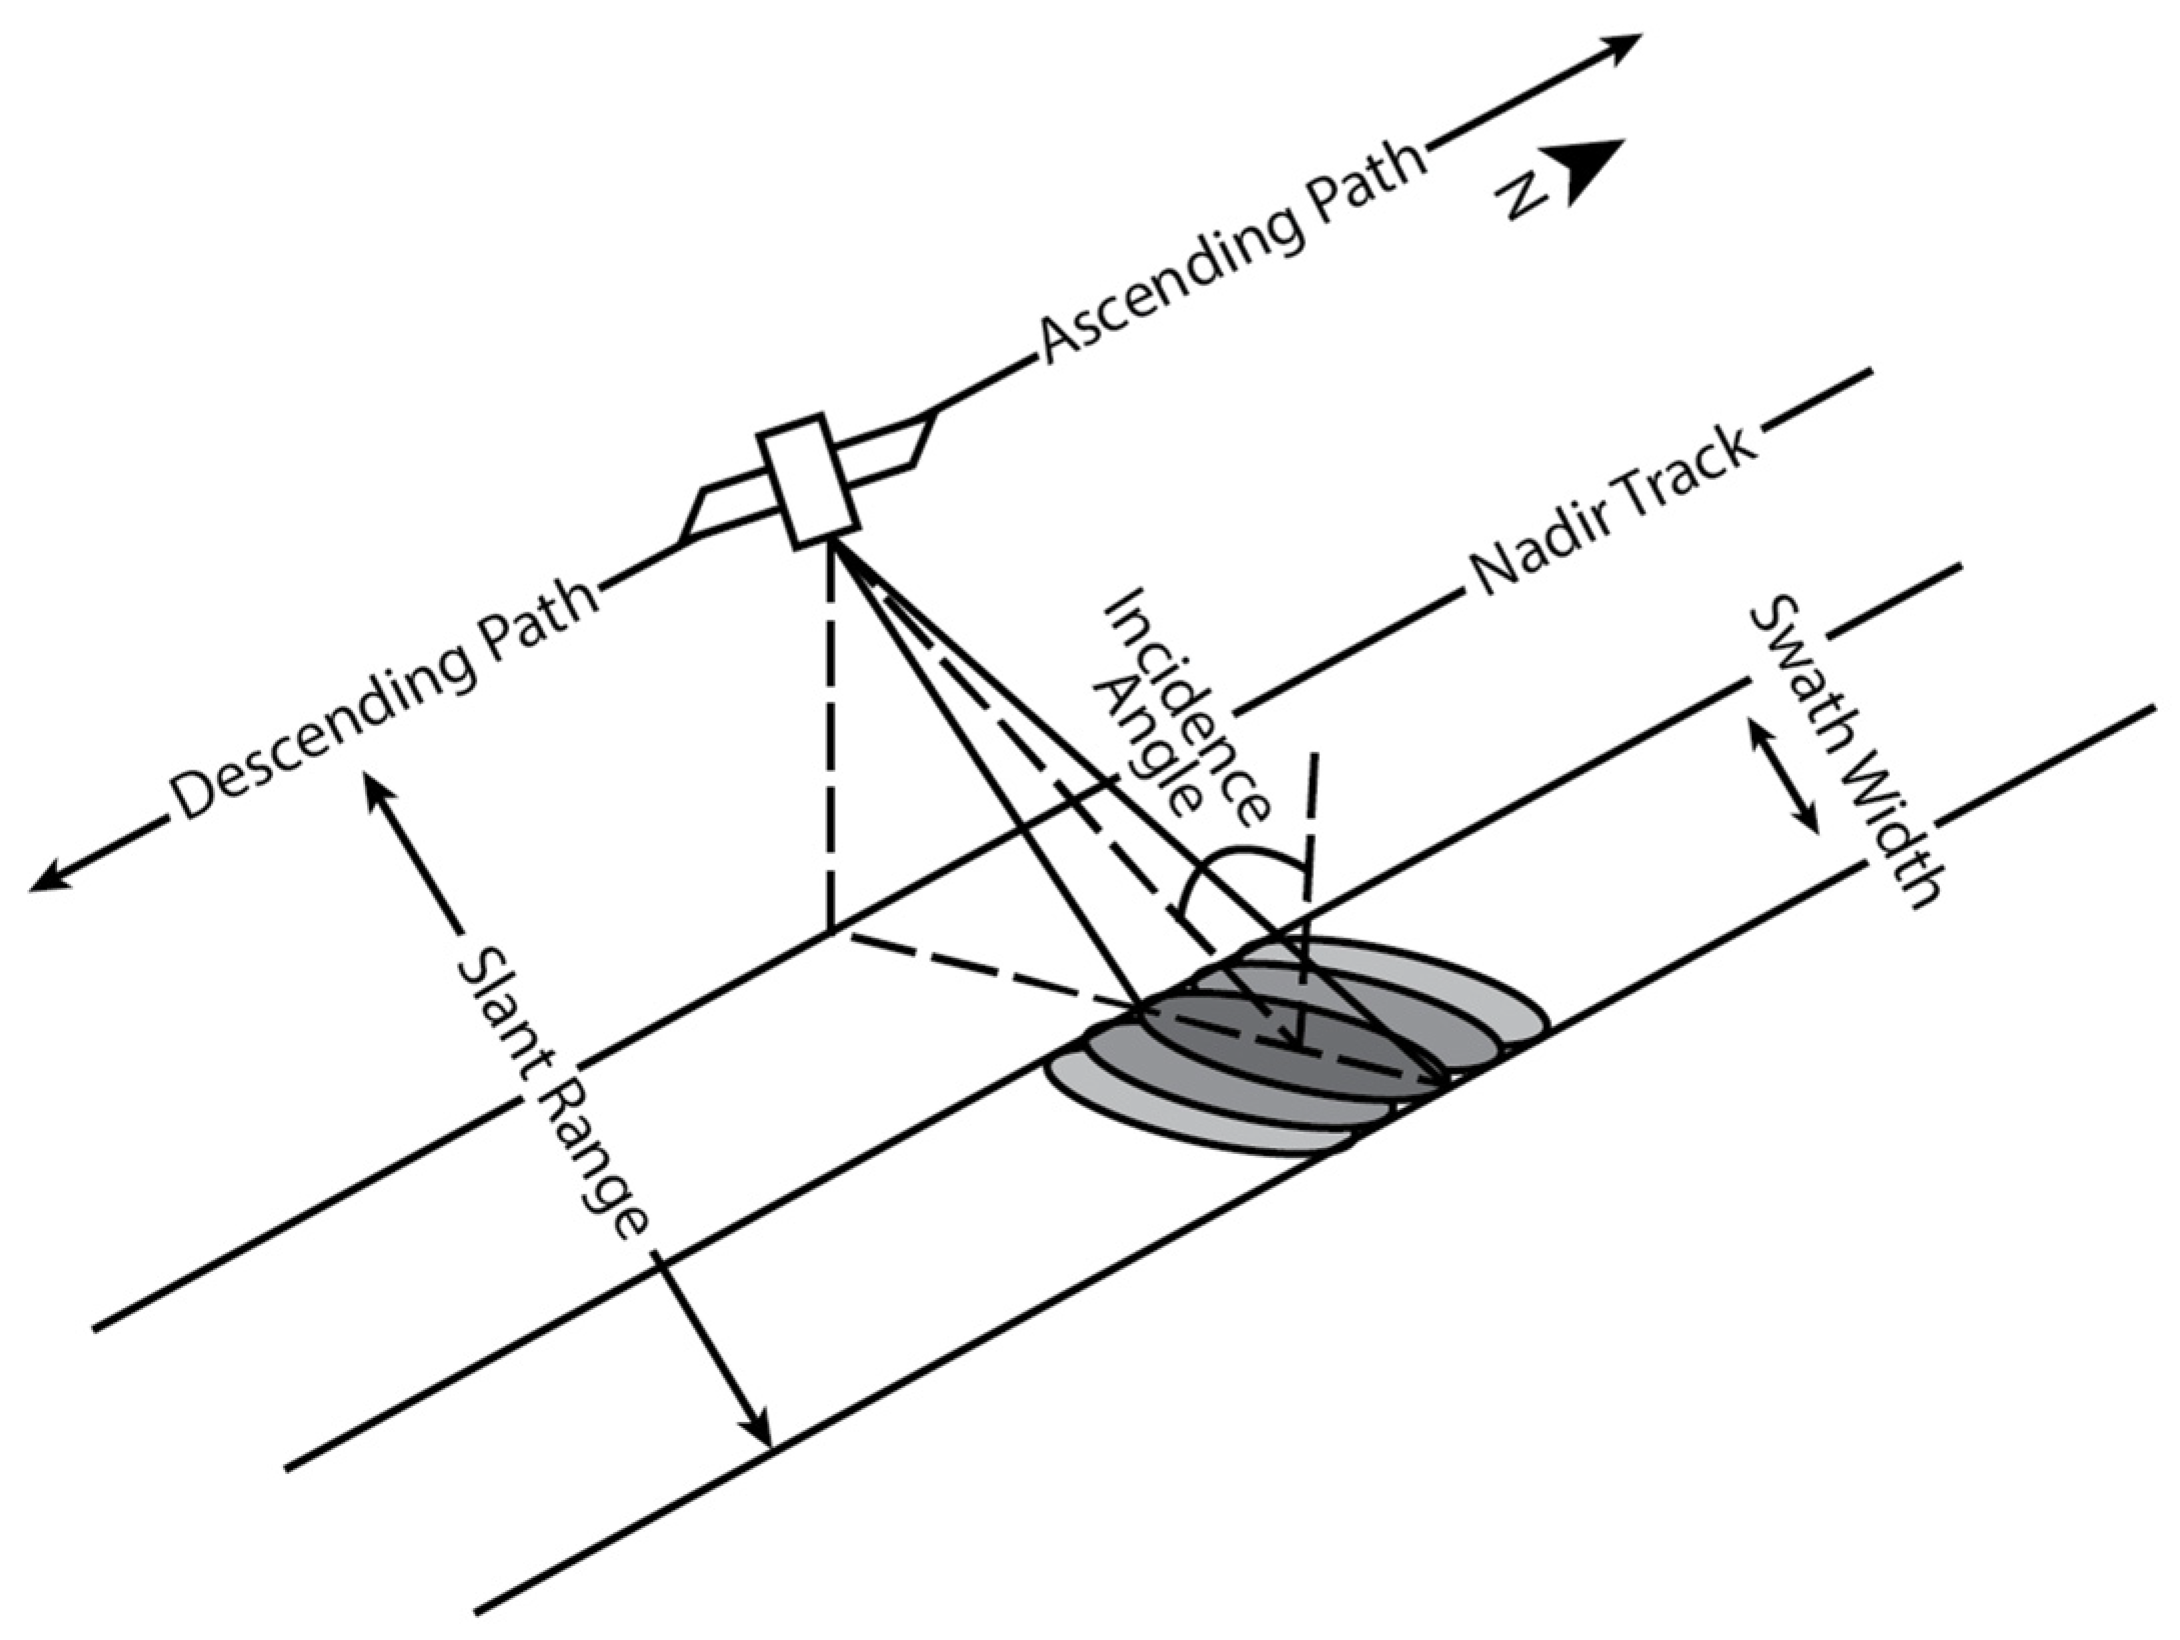
Figure 4.
SAR interaction with different surface features and their appearance in the data. Graphic from [10].
Figure 4.
SAR interaction with different surface features and their appearance in the data. Graphic from [10].
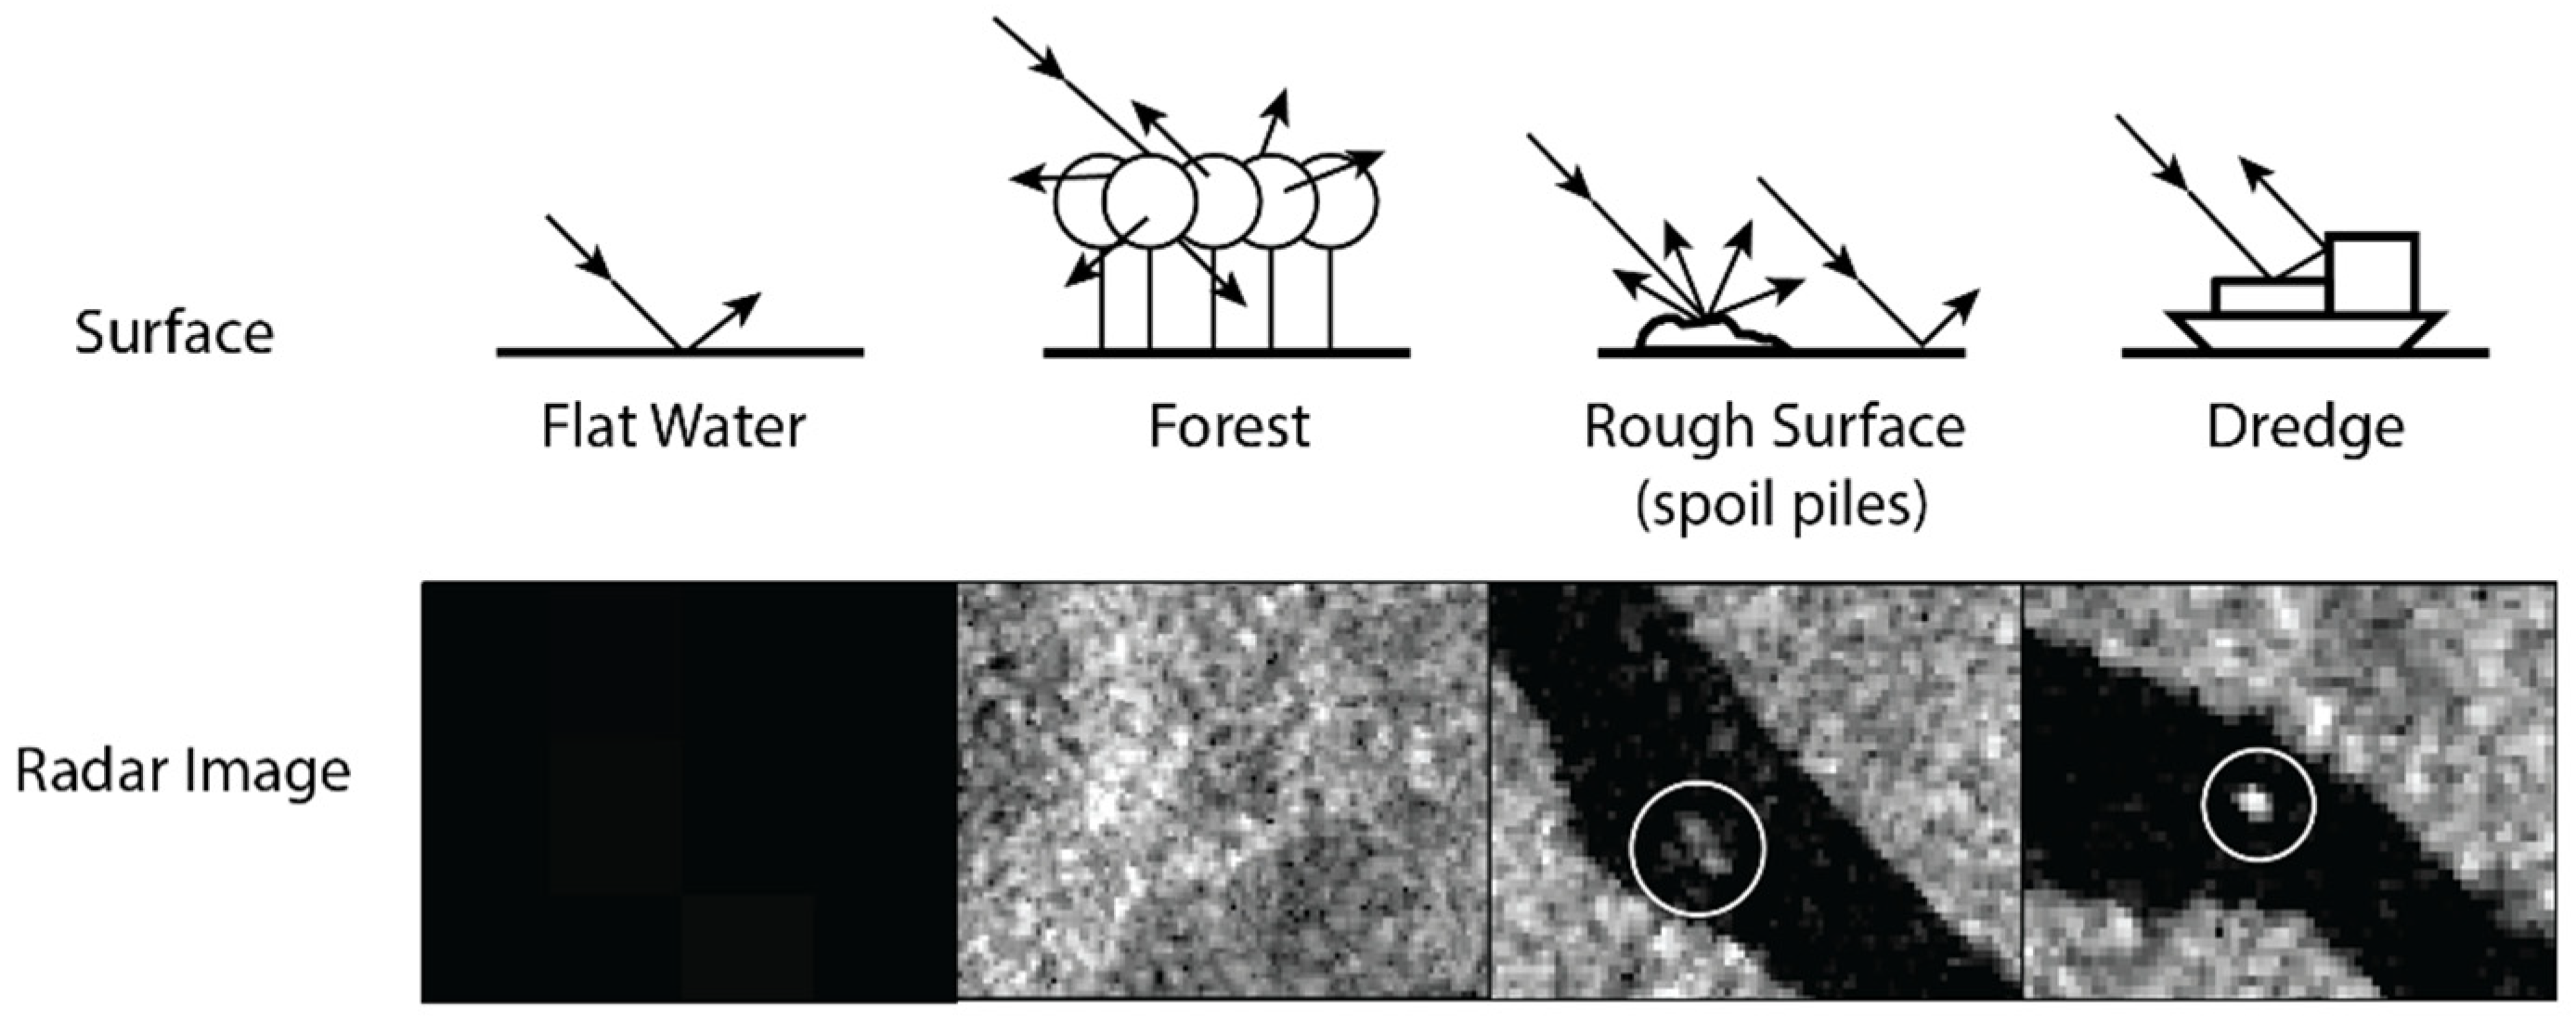
Figure 5.
The common steps found in a SAR ship detection workflow.
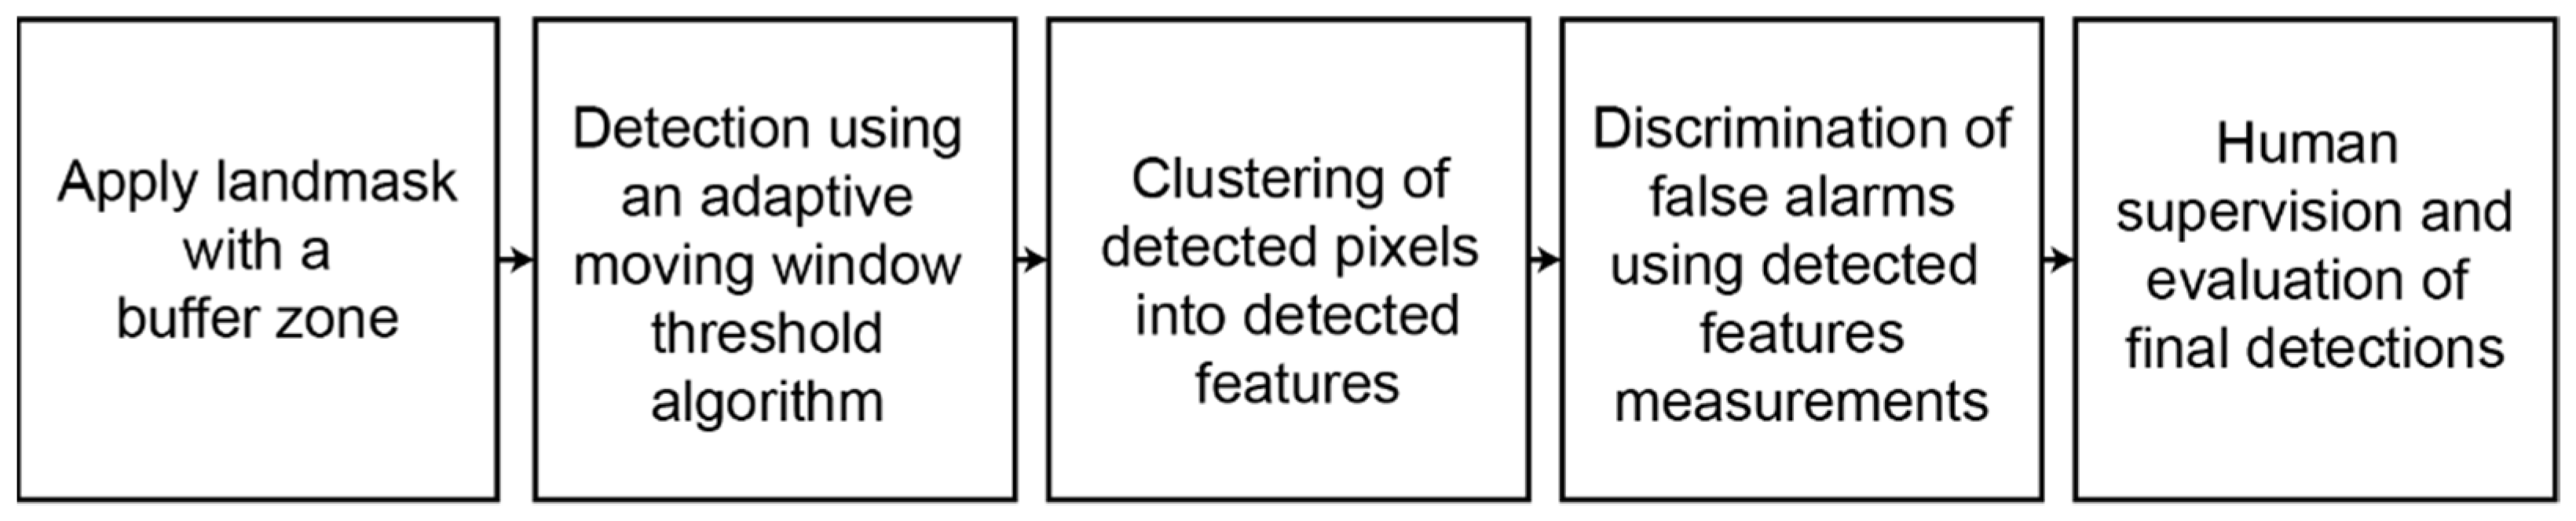
Figure 6.
The common SAR pre-processing workflow is carried out for each Sentinel-1 scene.
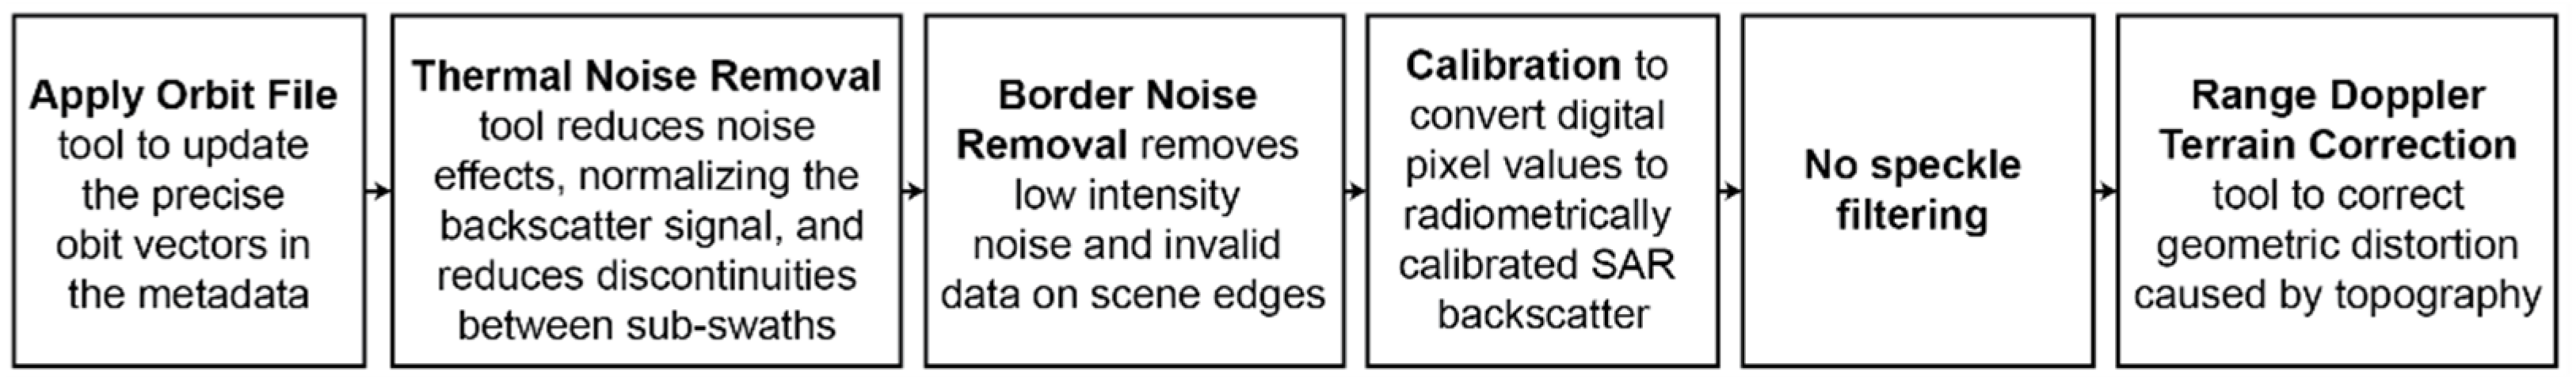
Figure 7.
Overall workflow to develop and evaluate the three methods. The seven Sentinel-1 scenes are collected and pre-processed, then all three methods are conducted with initial parameters (yellow box), the initial results are assessed with the results from the visual analysis, and the parameters are changed to address the shortcomings of the original iteration. Then, the adjusted methods are conducted once more (blue box) for the final results.
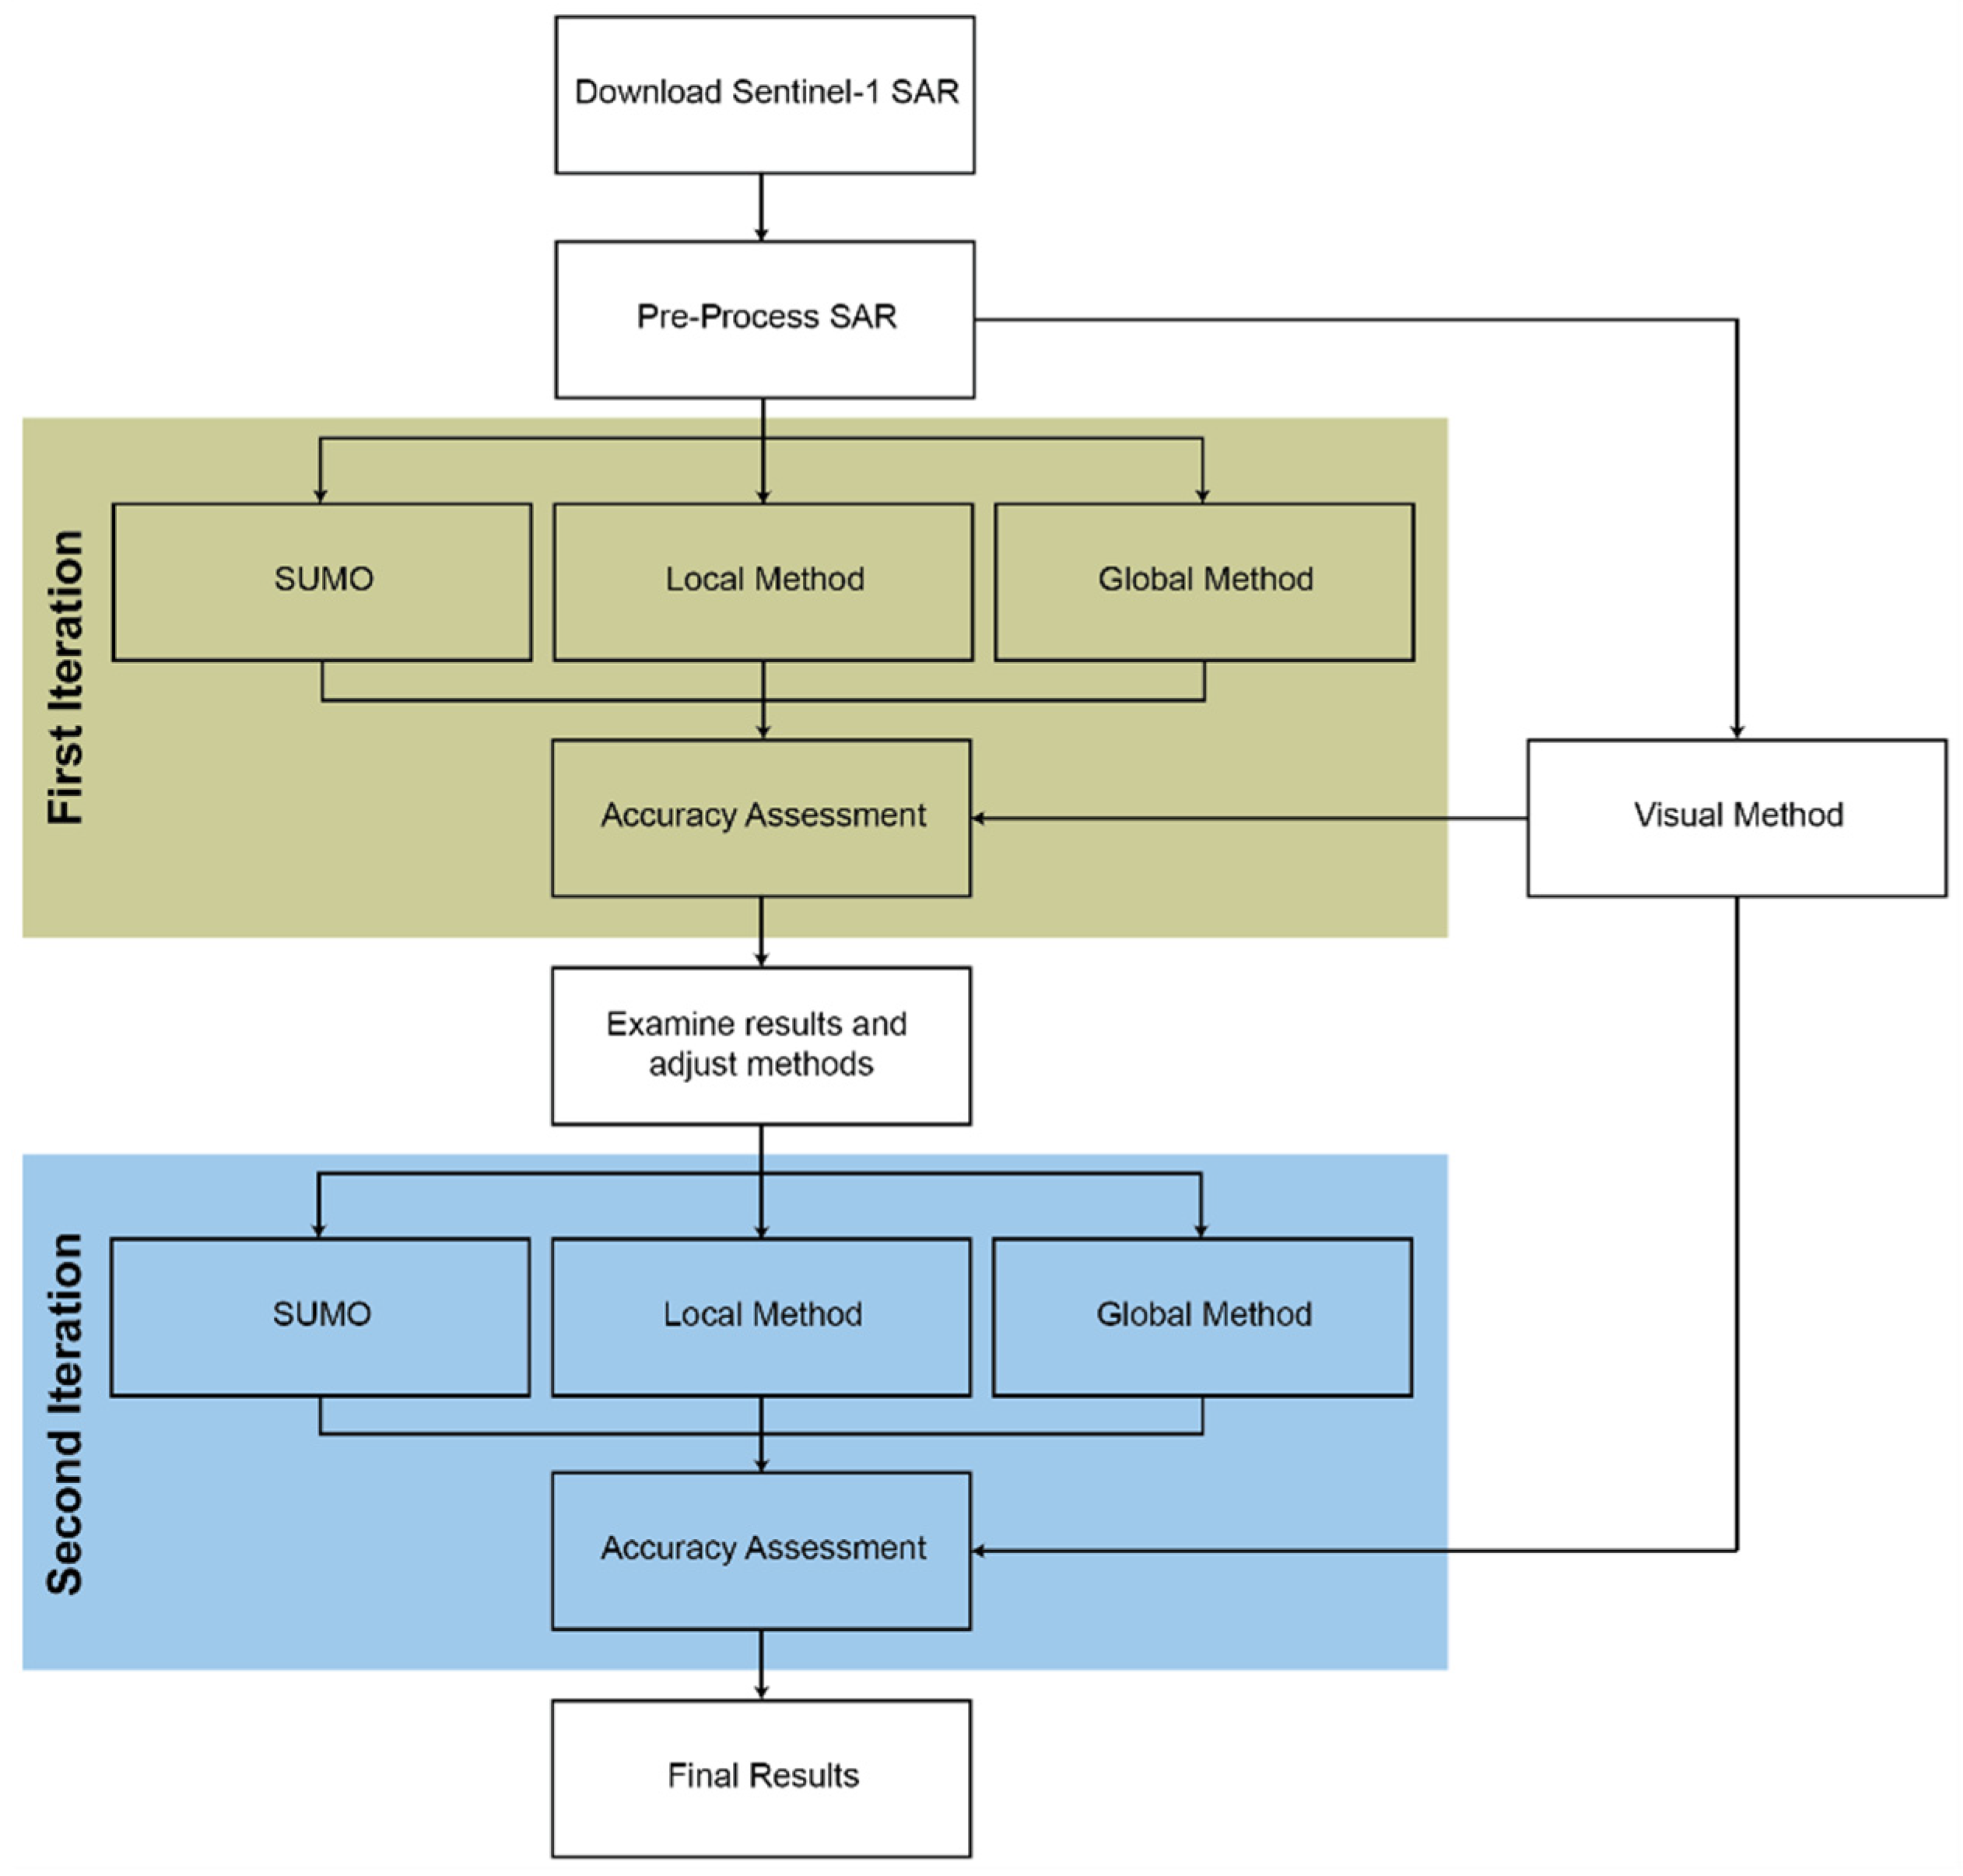
Figure 8.
Diagram of the filter weights used in the high-pass sharpening 5 × 5 filter used to emphasize the boundaries between dredge detection pixels and water pixels. The cell under test is represented in red and is the pixel assigned the focal sum calculated by multiplying the weights by each corresponding pixel value and then summing the total for the 5 × 5 window.
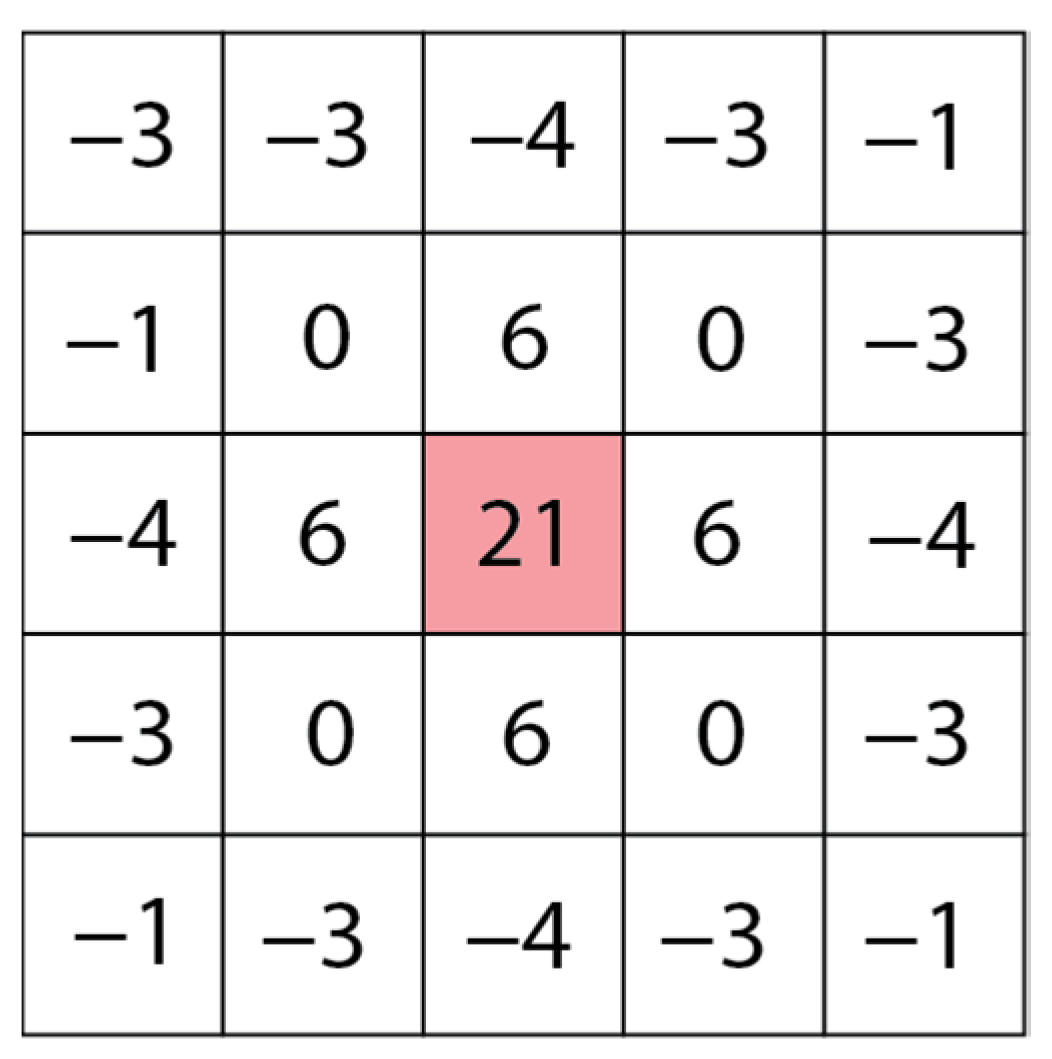
Figure 9.
Example of the 3 m Planet Imagery (A) (Image © 2019 Planet Labs PBC), Sentinel-1 SAR (B), results from the Visual Method used as the validation dataset (C), results from the SUMO Method (D), results from the Global Method (E), and results from the Local Method (F) shown in the same area where multiple dredges can be seen operating on the Madeira River near Abuna. SAR data from Copernicus Sentinel data [2019]. Retrieved from ASF DAAC [12 January 2021], processed by ESA.
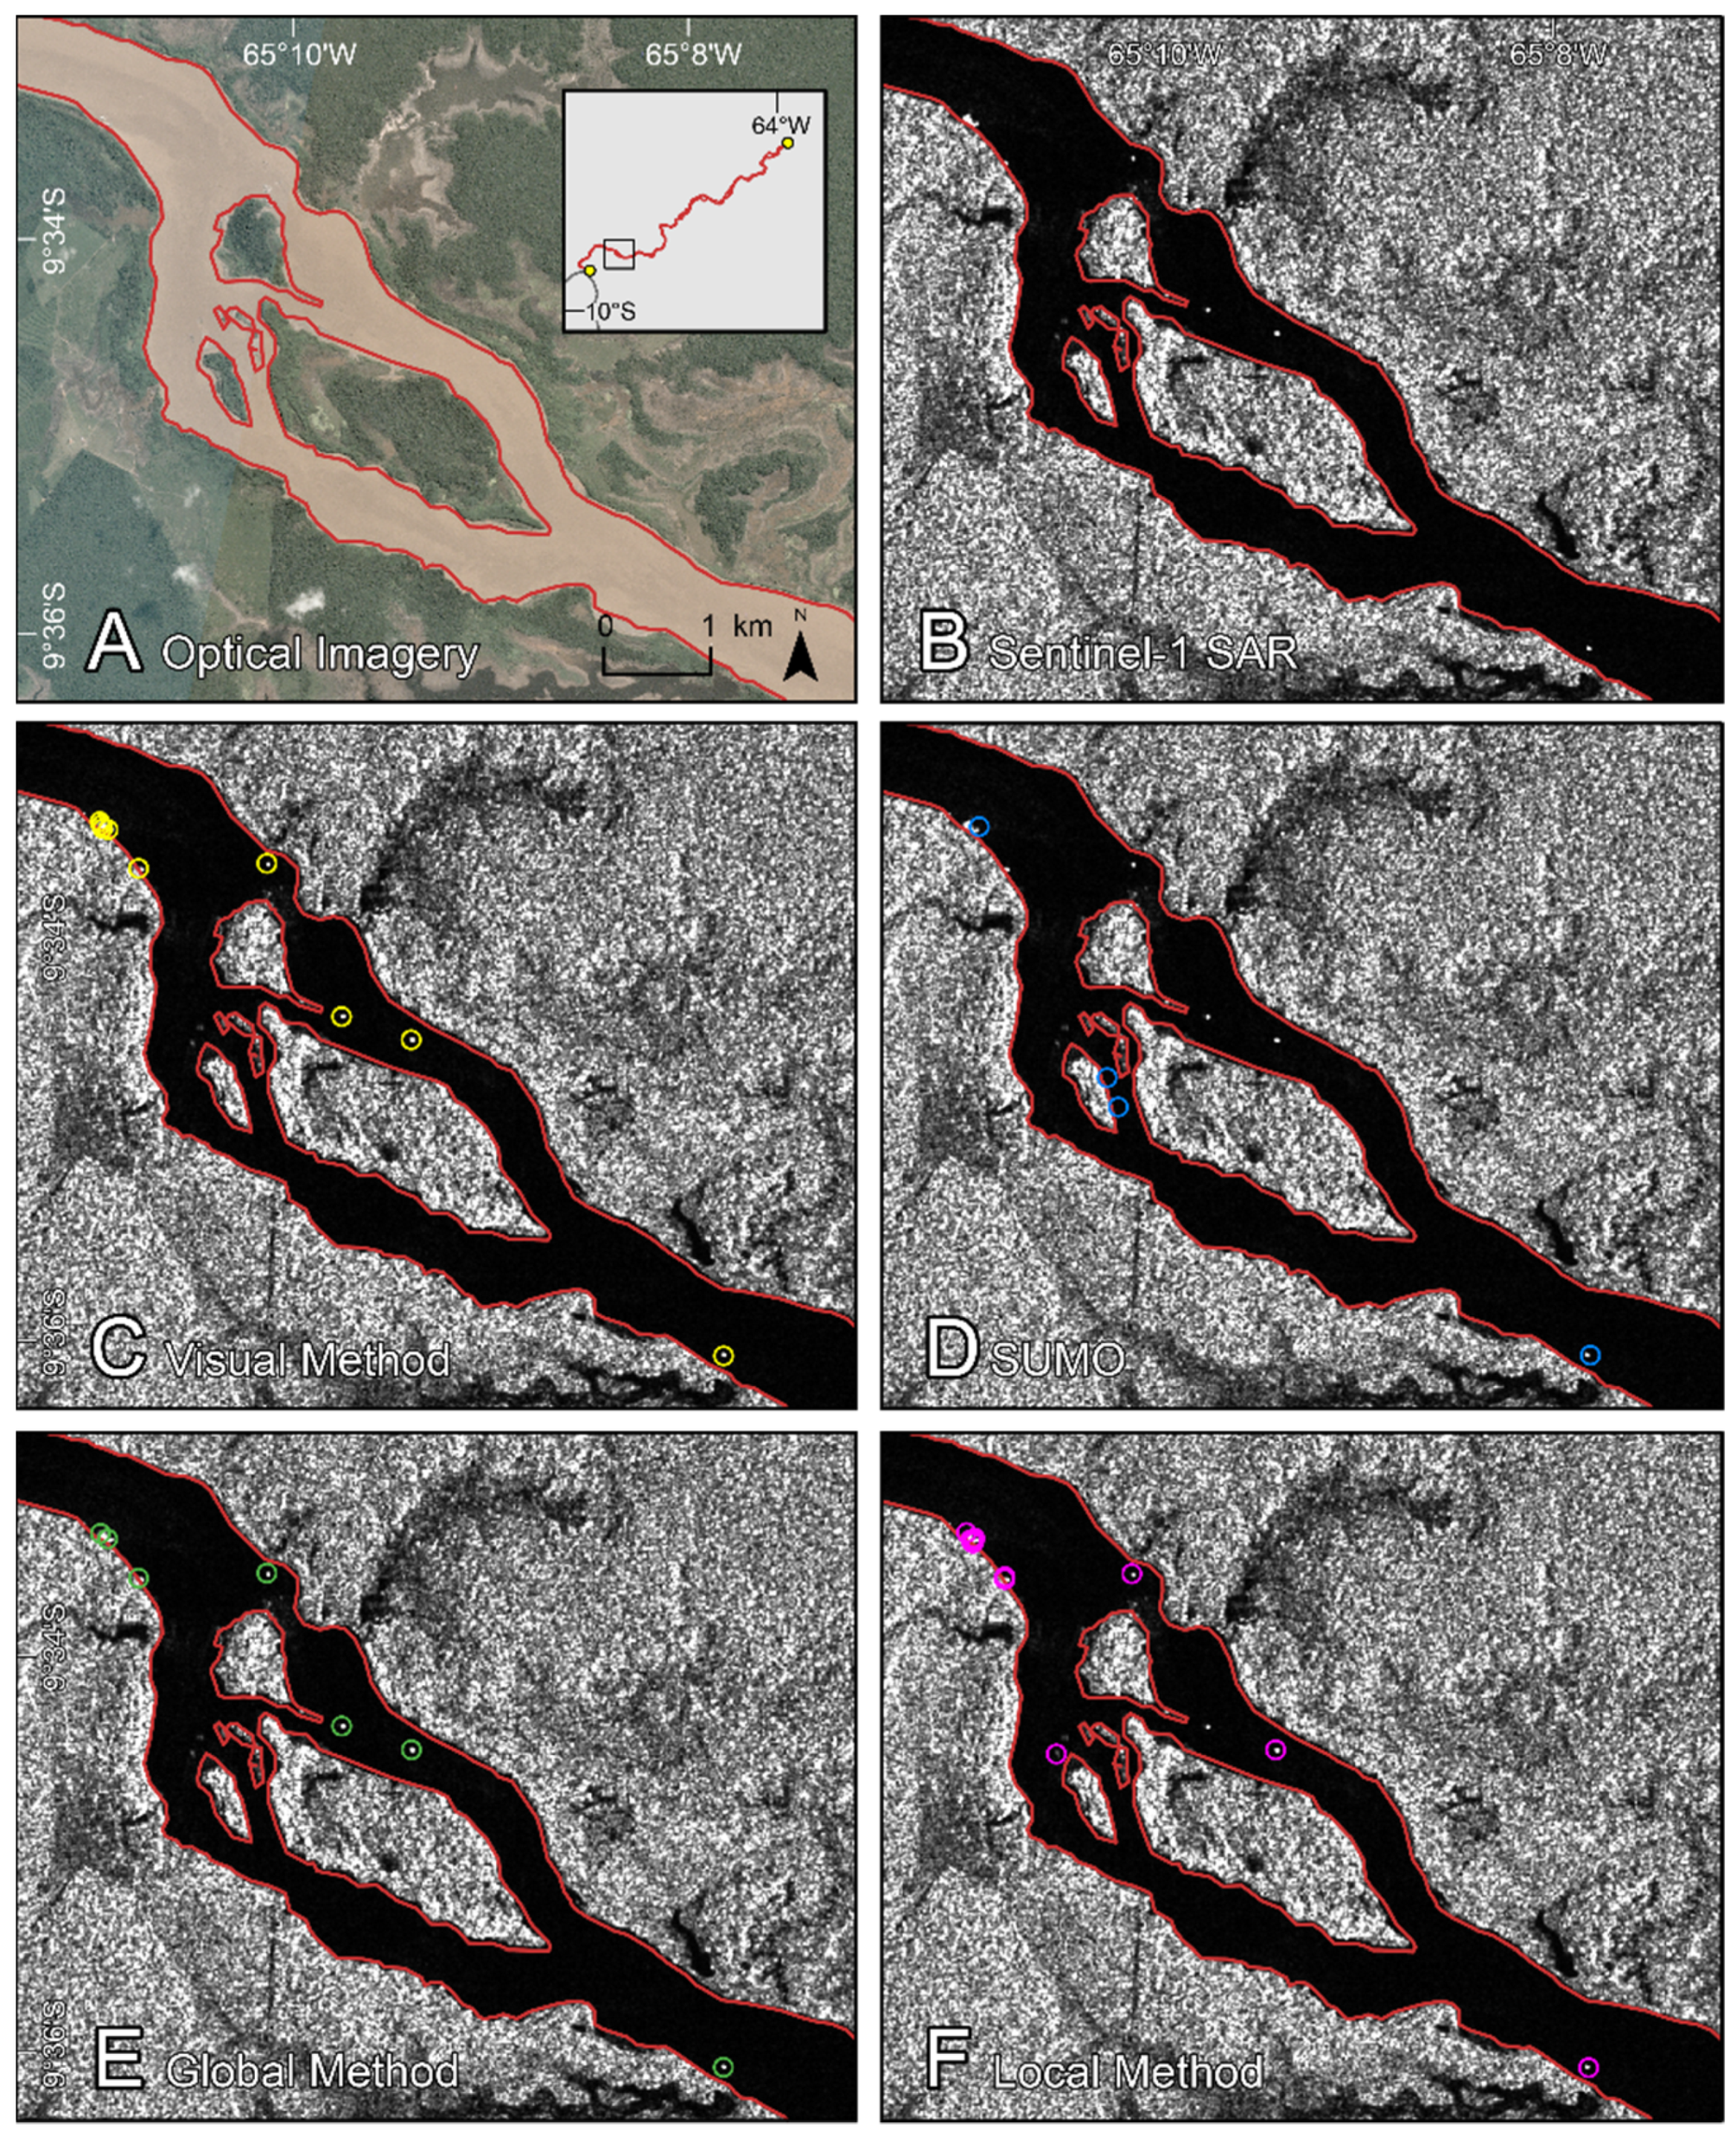
Figure 10.
Graph of accuracy and error measures for each of the methods under test.

Table 1.
Table of Sentinel-1 scenes used to develop and test all three detection methods and the visual analysis.
Table 1.
Table of Sentinel-1 scenes used to develop and test all three detection methods and the visual analysis.
| Acquisition Date | Direction | Path/Frame |
|---|---|---|
| 04 June 2019 | Descending | 156/619 and 156/624 |
| 10 June 2019 | Descending | 156/622 |
| 16 June 2019 | Descending | 156/619 and 156/624 |
| 22 June 2019 | Descending | 156/622 |
| 28 June 2019 | Descending | 156/619 and 156/624 |
| 04 July 2019 | Descending | 156/622 |
| 10 July 2019 | Descending | 156/619 and 156/624 |
Table 2.
Table of accuracy result classifications.
| Method Datasets | Validation Dataset | ||
| No Detection Present | Detection Present | ||
| No Detection Present | TN | FN | |
| Detection Present | FP | TP | |
Table 3.
Table of accuracy metrics formulas.
| Measure | Formula |
|---|---|
| Sensitivity | TP/(TP + FN) |
| Precision | TP/(TP + FP) |
| F-measure | (2 × Precision × Sensitivity)/(Precision + Sensitivity) |
| Omission | FN/(FN + TP) |
| Commission | FP/(FP + TP) |
Table 4.
Count of total detections for each method in all seven SAR scenes, along with the count of true positives, false positives, and false negatives.
Table 4.
Count of total detections for each method in all seven SAR scenes, along with the count of true positives, false positives, and false negatives.
| Method | Count | TP | FP | FN |
|---|---|---|---|---|
| SUMO | 159 | 95 | 64 | 110 |
| Local Method | 254 | 156 | 98 | 49 |
| Global Method | 138 | 112 | 26 | 93 |
| Visual | 205 |
Disclaimer/Publisher’s Note: The statements, opinions and data contained in all publications are solely those of the individual author(s) and contributor(s) and not of MDPI and/or the editor(s). MDPI and/or the editor(s) disclaim responsibility for any injury to people or property resulting from any ideas, methods, instructions or products referred to in the content. |
© 2023 by the authors. Licensee MDPI, Basel, Switzerland. This article is an open access article distributed under the terms and conditions of the Creative Commons Attribution (CC BY) license (https://creativecommons.org/licenses/by/4.0/).
Share and Cite
MDPI and ACS Style
Alessi, M.A.; Chirico, P.G.; Millones, M. Artisanal Mining River Dredge Detection Using SAR: A Method Comparison. Remote Sens. 2023, 15, 5701. https://doi.org/10.3390/rs15245701
AMA Style
Alessi MA, Chirico PG, Millones M. Artisanal Mining River Dredge Detection Using SAR: A Method Comparison. Remote Sensing. 2023; 15(24):5701. https://doi.org/10.3390/rs15245701
Chicago/Turabian StyleAlessi, Marissa A., Peter G. Chirico, and Marco Millones. 2023. "Artisanal Mining River Dredge Detection Using SAR: A Method Comparison" Remote Sensing 15, no. 24: 5701. https://doi.org/10.3390/rs15245701
Note that from the first issue of 2016, this journal uses article numbers instead of page numbers. See further details here.