


A Robust Index Based on Phenological Features to Extract Sugarcane from Multisource Remote Sensing Data
by
 ,
,
Yuanyuan Liu
1,
Chao Ren
1,2,* ,
,
Jieyu Liang
1,
Ying Zhou
1,
Xiaoqin Xue
1,
Cong Ding
1 and
Jiakai Lu
1 1
College of Geomatics and Geoinformation, Guilin University of Technology, Guilin 541006, China
2
Guangxi Key Laboratory of Spatial Information and Geomatics, Guilin 541106, China
*
Author to whom correspondence should be addressed.
Remote Sens. 2023, 15(24), 5783; https://doi.org/10.3390/rs15245783
Submission received: 5 November 2023
/
Revised: 15 December 2023
/
Accepted: 15 December 2023
/
Published: 18 December 2023
(This article belongs to the Special Issue Cropland Phenology Monitoring Based on Cloud-Computing Platforms)
Abstract
:Sugarcane is a major crop for sugar and biofuel production. Historically, mapping large sugarcane fields meticulously depended heavily on gathering comprehensive and representative training samples. This process was time-consuming and inefficient. Addressing this drawback, this study proposed a novel index, the Normalized Difference Vegetation Index (NDVI)-Based Sugarcane Index (NBSI). NBSI analyzed the temporal variation of sugarcane’s NDVI over a year. Leveraging the distinct growth phases of sugarcane (transplantation, tillering, rapid growth and maturity) four measurement methodologies, f(W1), f(W2), f(V) and f(D), were developed to characterize the features of the sugarcane growth period. Utilizing imagery from Landsat-8, Sentinel-2, and MODIS, this study employed the enhanced gap-filling (EGF) method to reconstruct NDVI time-series data for seven counties in Chongzuo, Guangxi Zhuang Autonomous Region, during 2021, subsequently testing NBSI’s ability to extract sugarcane. The results demonstrate the efficiency of NBSI with simple threshold settings: it was able to map sugarcane cultivation areas, exhibiting higher accuracy when compared to traditional classifiers like support vector machines (SVM) and random forests (RF), with an overall accuracy (OA) of 95.24% and a Kappa coefficient of 0.93, significantly surpassing RF (OA = 85.31%, Kappa = 0.84) and SVM (OA = 85.87%, Kappa = 0.86). This confirms the outstanding generalizability and robustness of the proposed method in Chongzuo. Therefore, the NBSI methodology, recognized for its flexibility and practicality, shows potential in enabling the extensive mapping of sugarcane cultivation. This heralds a new paradigm of thought in this field.
1. Introduction
Sugarcane is a perennial grass species that predominantly grows in tropical and subtropical regions, requiring abundant sunlight and precipitation [1,2,3]. It is a major global economic crop, constituting approximately 70% of the world’s sugar production [4]. Besides sugar, it is utilized for producing syrup and various other sugar-based products [5], thereby ensuring sugar industry sustainability [6]. The cultivation of sugarcane in countries such as Brazil, India, China, Thailand, Pakistan, the United States, and Australia has established it as a crucial economic crop [7]. In recent decades, the expansion of sugarcane cultivation areas has increased the demand for land [8], freshwater, and energy resources, subsequently raising concerns about water scarcity and environmental alterations. Therefore, timely and accurate information on sugarcane cultivation areas is crucial for industry planning and promoting sustainable production practices [9].
Conventional approaches to acquiring vital data on sugarcane cultivation involve cumbersome and arduous sampling procedures [10,11]. In comparison to traditional survey methods, remote sensing techniques prove to be both time- and resource-efficient for the large-scale and long-term mapping and monitoring of sugarcane [12,13]. Since the 1980s, satellite remote sensing has become a crucial data source for detecting, mapping, and monitoring crop growth, as well as supporting health management and crop productivity [14]. Remote sensing, with its advantages of extensive coverage, prolonged temporal sequences, and frequent monitoring, has found widespread application in crop monitoring and mapping efforts by providing high-quality, near-real-time, fine-resolution data [15]. It has emerged as a pivotal tool for elevating sugarcane mapping and enhancing water management practices [16]. In recent years, the growing availability of satellite data with higher revisit frequencies, enhanced spatial and spectral resolutions has enabled the acquisition of more accurate spectral and spatial information, providing essential data for crop management [8]. Over the past decade, numerous studies have been conducted to delineate sugarcane fields globally [17,18,19,20] and other crops [21,22,23,24,25,26], particularly in Brazil [27,28], China [29,30], and India [31]. These studies commonly utilized two types of remote sensing data: optical and synthetic aperture radar (SAR) data, with spatial resolutions ranging from sub-meter to kilometer scales. The optical images utilized include those from Landsat5 [14], Landsat 7/8 [28,32,33], Indian Remote Sensing Satellite (IRS-P6) [31], ASTER data [34], Sentinel-2 [19,29,35,36], UAV [37,38], Systeme Probatoire d’Observation de la Terre (SPOT) [39] and Moderate Resolution Imaging Spectroradiometer (MODIS) [40,41], while SAR data includes imagery from PALSAR [42], TerraSAR-X [29,43], ENVISAT ASAR [44], and Sentinel-1 [7,17,28]. Jaturong Som-ard et al. [13] compiled data on the frequency of sensors utilized in sugarcane research from 1980 to 2020. The free European S1 SAR and S2 MSI constellations, together with the rich archive of Landsat images, are the most popular for monitoring sugarcane areas [13].
Aside from data sources, the choice of classification algorithms significantly influences the classification outcomes [45]. Since the late 1990s, various remote sensing image classification methods have been applied increasingly for crop mapping and monitoring [46]. These can be categorized broadly into two classes: classifier-based and threshold-based methods. For the classifier-based methods, adequate samples are usually required to train a classifier and fit the classification model [47,48]. Along with the rapid development of computer science [49,50], machine learning (ML) algorithms such as logistic regression [51], maximum likelihood [5], decision trees [52], object-based image analysis (OBIA) [53], prior-knowledge-based [54], random forests [55], deep learning algorithms [56,57], and support vector machines [58] have become the most commonly used techniques for crop classification based on remotely sensed data [50,59,60]. The majority of investigations rely on spatial statistical methodologies, utilizing single- or multi-date imagery. For instance, Jiang Hao et al. [29] employed machine learning methods alongside Sentinel-1/2 time-series satellite data to identify sugarcane areas in Zhanjiang, China. Ana Cláudia dos Santos Luciano et al. [33] developed a classical frame of object-based classifications for a time series of Landsat images with the random forest machine learning algorithm. Mulianga [7] estimated potential soil erosion for environmental services in a sugarcane growing area using multisource remote sensing data. Wang et al. [15] mapped sugarcane in complex landscapes by integrating multi-temporal Sentinel-2 images and machine learning algorithms. These data-driven algorithms can increase classification accuracy and efficiency by operating on multi-dimensional data independent of data distribution [16,61,62]. However, these algorithms belong to the class of shallow-structured models and, they cannot extract and utilize deep features of remotely sensed imagery [62]. Recently, deep learning (DL), a relatively new form of ML, has been shown to be superior to conventional ML algorithms in identifying crops by automatically mining deep information from remotely sensed data [63,64]. Zhou et al. [56] proposed an ECA-MobileNetV3(Large)+SegNet mode for the binary sugarcane classification of remotely sensed images. However, DL models usually require a large number of training samples [36] and have difficulty in generalizing large areas [65,66]. Recently, the data mining dynamic time warping (DTW) method has performed well in time-series analysis by comparing an unknown time series to a known event signature, and has received increasing attention in the field of land cover classification [3,67]. Zheng Yi et al. [30,68] utilized the TWDTW method to extract sugarcane maps of Brazil and China. However, the DTW usually requires a long remote sensing image time series as model input, which can be a challenge in real applications [67].
Threshold-based approaches identify crops based on the magnitude of vegetation indices (VIs) or the phenological metrics derived from VIs during the crop growth period, relative to the variation in them [69]. These methods are usually implemented on time-series images [70]. For example, crops including rice [71,72,73], sugarcane [33], winter crops [25] and canola [74] are the prevalent crops classified by threshold-based approaches due to the differences in spectral or phenological features observed in the time-series profile. Using this method to distinguish crops at similar phenology stages may pose challenges [75]. Hence, traditional threshold-based methods require a substantial number of subjective threshold determinations, severely limiting both efficiency and accuracy [76]. Approaches based on several phenology thresholds corresponding to different growth stages of crops (such as the green-up, senescence, and length of growing season) necessitate calibration when extended to other regions or years. Consequently, traditional phenology-based methods remain insufficient for ideal mapping endeavors and may encounter multiple threshold limitations when applied on a larger scale [68,71].
Belonging to an advanced threshold-based method, an index-based method with just one threshold being determined objectively, has received increasing attention in recent years [36,77]. The index-based methodology, wherein a single threshold is objectively determined, has been extensively utilized for delineating target crop maps from remote sensing data [78]. This approach facilitates the classification of target crop types from extant remote sensing data by amplifying the disparities between the target crop types and other varieties [21,79,80]. Index-based methods have two significant advantages when compared to classification and threshold-based methodologies: (1) they harness the universal characteristics of target features, exhibiting commendable applicability under diverse conditions [24]; and (2) the indices, which are continuous variables correlated with the probability or coverage rate of target pixels, provide more objective and flexible mapping of target features compared to hard classification [23]. Various indices have been successfully developed for mapping different crops, such as the SAR-based Paddy Rice Index (SPRI) [26], the Canola Index (CI) [36] derived from Sentinel-2 satellite time-series data, the Potato Index (PF) [21] utilizing Sentinel-2 image time series, and the Winter Wheat Index (WWI) [79] developed using NDVI data acquired at four key growth stages of crops. In these cases, index-based methods are not only more precise than classifier-based methodologies but also more cost-effective [80].
In previous studies, NDVI time-series data have been employed for sugarcane identification [5,10,81,82,83], but high classification accuracies were not attained because of the serious spectral confusion between sugarcane and some crop types [75]. Many of these studies have harnessed NDVI time-series data derived from various sensors. However, the computation of NDVI time series can exhibit spatial and temporal discontinuities due to cloud interference and limitations inherent to individual sensors. To address this issue, several researchers have leveraged multi-source remote sensing imagery to reconstruct high-quality NDVI time series, although at the expense of substantial computational resources and storage space. In response to this challenge, Google Earth Engine (GEE) has emerged since 2010 as an innovative alternative to traditional local processing of remote sensing imagery [84]. As a cloud platform, GEE enables the rapid and efficient processing of extensive remote sensing imagery [85]. For instance, Yang et al. [86] utilized the gap-filling and Savitzky–Golay filter (GF-SG) method to fuse MODIS and Landsat images, reconstructing a Landsat-MODIS-NDVI time series with a spatial resolution of 30 m and a temporal resolution of 8 days on the GEE platform. However, for agricultural research, a spatial resolution of 30 m is coarse and fails to meet agricultural requisites. The Sentinel-2 satellite, which can offer rich spectral information along with a high spatial resolution of 10 m, serves to address this imbalance. Consequently, we employed enhanced gap-filling and Whittaker smoothing (EGF-WS) [87] on the GEE platform to fuse NDVI time-series data derived from MODIS, Landsat-8, and Sentinel-2 images, thereby reconstructing an EGF-NDVI time series with a spatial resolution of 10 m and a temporal resolution of 8 days.
NDVI encapsulates a wealth of information pertinent to vegetation dynamics, with the variations in NDVI serving as a significant biophysical characteristic of sugarcane and other vegetation types, typically exhibiting a close association with the crop growth process [17]. In previous investigations, NDVI time-series data have been deployed for sugarcane identification [20]. Given the cyclical nature of vegetation growth, NDVI curves for identical land cover type pixels should exhibit similarities across different years. Furthermore, it has been discerned that sugarcane manifests unique NDVI attributes during its growth phase, which can be leveraged to differentiate it from certain other crops with similar phenological stages. Thus, the optimal exploitation of the spatial similarity and temporal continuity of NDVI has been considered for the construction of a sugarcane index for the more rapid and efficient identification of sugarcane. By amalgamating and concurrently mining the available NDVI information throughout the entire growth cycle of sugarcane, the complex issue of sugarcane mapping based on single and appropriate imagery can be addressed. However, to the best of our knowledge, a sugarcane index for delineating accurate and efficient sugarcane maps from remote sensing imagery has not yet been reported.
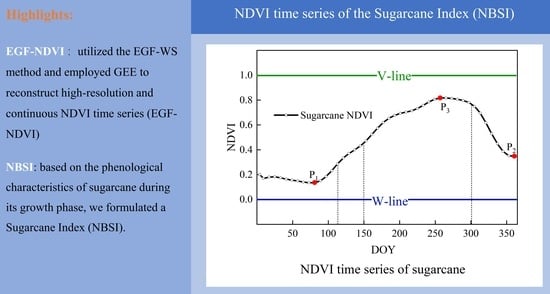
In this study, we utilized the EGF-WS method and employed GEE to reconstruct high-resolution and continuous NDVI time series (EGF-NDVI) for sugarcane extraction. Based on the phenological characteristics of sugarcane during its growth phase, we formulated a Sugarcane Index (NBSI). By empirically selecting the optimal threshold values, we conducted comprehensive tests on the efficacy and robustness of NBSI through experiments carried out in seven counties within Chongzuo in the Guangxi Zhuang Autonomous Region.
The subsequent structure of this article is delineated as follows: Section 2 provides an elaborate exposition of the experimental region, imagery data sources, and the origins of ground data. Section 3 meticulously elucidates the NBSI index methodology, sugarcane phenology and NDVI analysis, comparative methodologies, and accuracy assessment. Section 4 presents the classification outcomes derived from the NBSI index, alongside a qualitative and quantitative analysis of the classification results obtained from various methods. The selection of optimal threshold values for the NBSI index, along with a discussion on the advantages and disadvantages of the NBSI method, is explored in Section 5. Section 6 encapsulates the conclusions drawn from this study.
2. Study Area and Data
2.1. Study Area
This study is focused on Chongzuo, located in the southern part of the Guangxi Zhuang Autonomous Region, positioned between longitudes 106°33′ to 108°6′E and latitudes 22°36′ to 23°22′N. Encompassing an area of 17,300 km2, Chongzuo is characterized by a subtropical monsoon climate with an annual average temperature of 21.7 °C and a precipitation frequency ranging between 130 to 200 days per annum. The topography is varied, encompassing mountainous terrains, hills, and plains, with elevations ranging from −6 to 1359 m as depicted in Figure 1. The warm temperatures during summer, copious rainfall, and ample sunlight provide conducive conditions for sugarcane cultivation. Chongzuo is the largest base for sugarcane cultivation and sugar production in Guangxi, contributing 33% of the region’s sugarcane output and 20% of the national production, thereby earning the moniker “Sugar Capital of China”. According to the 2021 Statistical Bulletin on National Economic and Social Development of Chongzuo City, the primary crops cultivated are rice, sugarcane, and corn, with sugarcane accounting for 53% of the total cultivated area.
2.2. Data
Clouds and cloud shadows can impact the quality and quantity of optical remote sensing data, potentially hindering accurate extraction of ground crop information. To facilitate a more convenient and expeditious extraction of sugarcane, this study employed the EGF-WS algorithm to integrate a high spatiotemporal resolution and continuous NDVI time series from MODIS, Landsat-8, and Sentinel-2 satellites, as the research dataset. The NDVI is calculated utilizing the reflectance data from the near-infrared band (ρNIR) and red band (ρRED), as illustrated in the following equation:
where ρNIR is the near-infrared band, while ρRED is the red band.
2.2.1. MODIS Image Collection
We procured the full annual suite of surface reflectance imagery for the year 2021 from MODIS (designated “MODIS/09/MOD1A2021”), provided by NASA. Each MOD09A1 product encompasses seven spectral bands, all of which have undergone atmospheric correction. The temporal resolution for all these imagery sets is 8 days, with a spatial resolution of 500 m. A singular value is selected for synthesis from all images within an 8-day interval, based on image coverage, cloud cover, and aerosol presence. To generate a cloud-free MODIS-NDVI time-series dataset, the “StateQA” band from each image is utilized to identify clouds, cloud shadows, and cirrus clouds.
2.2.2. Landsat-8 Image Collection
For medium-resolution imagery, we harvested the full annular compilation of surface reflectance images from Landsat-8 for the year 2021 via GEE, delineated as “LANDSAT/LC02/C1/T2_L2021”. Post atmospheric correction, these images encompass four visible bands, one near-infrared band, and two shortwave infrared bands. The revisiting cycle of the Landsat-8 terrestrial satellite is 30 days with a spatial resolution of 30 m, affording reliable and consistent data. For the computation of Landsat-NDVI, we employed the B4 and B5 bands of Landsat-8. Additionally, the “QA_PIXEL” band was utilized to identify and mitigate the effects of clouds, cloud shadows, and cirrus clouds.
2.2.3. Sentinel-2 Image Collection
The European Space Agency (ESA) provides a collection of surface reflectance imagery designated as “COPERNICUS/S2021_SR”, categorized as high-spatial-resolution imagery. The Sentinel-2 imagery, having undergone atmospheric correction, boasts a revisiting cycle of 5 days and a spatial resolution of 10m. However, in low-latitude regions, the revisiting period for the Sentinel-2 satellite extends to 10 days. The Sentinel-NDVI is computed utilizing the B4 and B8 bands of Sentinel-2, while the “QA60” band is employed to mitigate the effects of clouds, cloud shadows, and cirrus clouds.
The available imagery from MODIS, Landsat-8, and Sentinel-2 for Chongzuo City is depicted in Figure 2. Throughout the year 2021, the counts of images from MODIS, Landsat-8, and Sentinel-2 stand at 46, 53, and 568, respectively. The range of cloud-free observations for each remote sensing image is as follows: 1 to 39 for MODIS, 1 to 30 for Landsat-8, and 1 to 209 for Sentinel-2. This variance elucidates the inferior quality of optical images, with the quantity of cloud-free images significantly dwindling amid adverse weather conditions.
2.3. Ground Reference Data
Utilizing field collection and visual interpretation methodologies, the gathered reference data serve as both training and validation samples, with the specific method encompassing field surveys and visual interpretation via GEE. Throughout the survey process, we amassed samples of both sugarcane and non-sugarcane sites, augmenting this with multiple multispectral images acquired via unmanned aerial vehicles (UAVs). Subsequently, field survey samples were located within Google Earth images, whereby manual visual interpretation was employed to discern the surface characteristics and textures of various entities. This was further enriched by amalgamating historical imagery from GEE across the entire growth cycle, resulting in the identification of sugarcane and non-sugarcane sample points. Ultimately, a total of 6589 sugarcane and 6531 non-sugarcane sample points were collected. Additionally, this study procured the “Statistical Bulletin on National Economic and Social Development” for various counties within Chongzuo for the year 2021, which was utilized to validate the congruence between the sugarcane cultivation area extracted in this study and the agricultural statistical data.
3. Methodology
In this study, we introduced a novel Sugarcane Index (NBSI) based on EGF. As delineated in Figure 3, the methodology primarily encompasses three steps: Initially, to ameliorate the spatial and temporal discontinuities in optical imagery often induced by the prevalent cloudy and rainy weather conditions in Chongzuo City, the EGF-WS fusion algorithm is employed. Leveraging the GEE platform, this algorithm orchestrates a temporal–spatial fusion of NDVI data computed from MODIS, Landsat-8, and Sentinel-2, engendering a high spatial–temporal resolution and continuous time-series dataset (EGF-NDVI). Subsequently, exploiting four unique phenology attributes discernible throughout the entire growth cycle of sugarcane, NBSI is constructed based on the NDVI time series, with an optimal threshold ascertained for sugarcane identification. NBSI furnishes the requisite information for distinguishing sugarcane from other land cover types. Ultimately, the accuracy of the NBSI extractions is assessed utilizing field-collected samples, sample points interpreted via GEE, and statistical data.
3.1. Reconstruction of Sugarcane NDVI
The EGF-WS approach was employed to reconstruct a high spatiotemporal resolution and continuous NDVI time series data for Chongzuo City. Broadly, the EGF-WS method unfolds in three pivotal steps.
In the initial stages, MODIS images were processed to create cloud-free MODIS-NDVI, forming a reference NDVI time series with high temporal resolution. Utilizing the maximum synthesis method, the Sentinel-Landsat Satellite NDVI (SL-NDVI) time series was generated at 16-day intervals. In the second step, EGF was applied to generate a new NDVI time series—Sentinel-Landsat-MODIS NDVI (SLM-NDVI). This process focuses on filling in the missing values in the SL-NDVI time series, providing high spatial resolution for NDVI data. Finally, the Whittaker smoothing (WS) technique was employed on the SLM-NDVI time series data to achieve smoothing, resulting in a Sentinel-Landsat-MODIS Whittaker-smoothed NDVI time series (referred to as EGF-NDVI) characterized by high temporal and spatial resolutions.
3.2. Phenological Analysis
NBSI was derived based on the annual 2021 EGF imagery and corresponding ground reference data for Chongzuo. As per field investigations and the pertinent literature, the land cover in Chongzuo encompasses three primary crops: sugarcane, maize, and rice. The phenology of these principal crops is illustrated in Figure 4.
Sugarcane, as a major economic crop, constitutes 53% of the total agricultural area in Chongzuo. Unlike annual crops, such as rice and maize, sugarcane progresses through four primary growth stages: (1) ratoon germination or planting, occurring from late January to late March, with new plantings typically established from late March to early May; (2) tillering, commencing in May and enduring for about a month; (3) rapid growth, wherein sugarcane initiates stalk elongation between June and October; and (4) maturation and harvest, with maturation in November, followed by a harvest phase extending from November to the ensuing April.
Rice and maize are the other major crops in Chongzuo. Rice cultivation is divided into single-season and double-season varieties. Single-season rice is planted in late May and harvested in early October. Double-season rice includes both early and late crops. The early crop’s growth cycle extends from late March to late July, while the late crop occupies the same fields from late July to late October. A notable interval, termed “double rush” in late July, delineates a transitional window where early rice is swiftly harvested to accommodate the sowing of late rice. Maize, a dryland crop, exhibits diverse cultivation practices within Guangxi; spring maize is cultivated from early February to late June, while summer maize extends from early July to late November. The distinct cultivation cycles among these primary crops lay a robust foundation for developing phenology-based algorithms to accurately identify and map sugarcane fields in this study. The inherent phenology variations underscore the potential of leveraging temporal signatures to discern sugarcane fields, contributing to a nuanced understanding and assessment of the agrarian landscape of Chongzuo [88].
3.3. Analysis of NDVI Time Series for Distinguishing Sugarcane from Other Land Features
To facilitate the delineation among sugarcane, rice, and maize, 100 sample points for each of these crops were randomly selected in Google Earth images based on ground reference data. In this paper, only double-cropping rice and double-cropping maize were studied. Subsequently, with the support of the GEE platform, time-series curves of NDVI for sugarcane, rice, and maize were constructed, spanning from 1 January 2021 to 31 December 2021, as shown in Figure 5.
The growth curves of sugarcane and maize in the DOY ≈ 10–140 phase (indicated by dashed lines a and c) exhibit similar fluctuation patterns, yet a distinct divergence occurs in late July, as denoted by the yellow arrows, leveraging this characteristic feature to differentiate maize from sugarcane. Throughout their respective growth cycles, the seasonal transition significantly impacts the NDVI variations between sugarcane and rice, with a notable discrepancy occurring in late July, marked by the blue arrow. The escalation of NDVI for both sugarcane and rice commences around DOY ≈ 100 (dashed line b), peaking at DOY ≈ 155 (dashed line d) for rice, followed by a decline to the nadir at the rice “double-cropping” stage around DOY ≈ 210 (dashed line e). Conversely, the NDVI for sugarcane continues to ascend, gradually reaching a zenith around DOY ≈ 220 (dashed line f). The maximal NDVI divergence occurs around DOY ≈ 200, optimizing the separability between rice and sugarcane as indicated by the blue arrow, thereby serving as a discriminative feature to delineate rice from sugarcane.
During the maturation phase, maize closely resembles sugarcane, especially during its harvest phase in October. This resemblance often results in classification errors when distinguishing harvested sugarcane. In our study, we address this challenge by utilizing the difference between the peak NDVI value during the growing season and the minimum NDVI value during the non-growing season, which helps to alleviate misclassifications to a certain extent.
3.4. Index Construction
Sugarcane is grown from cuttings rather than seeds. The initial growth phase, from planting to the first harvest, is known as plant cane. This phase typically lasts between 12 to 18 months, depending on seasonal variations, cultivar types, and geographical location. Post the inaugural harvest, the ratoon cane, a regrowth from the stubble, is harvested annually under a conventional 12-month cycle, spanning an approximate period of 5 to 7 years or longer. The growth duration of sugarcane in Guangxi exhibits a range from 8 months to over a year, distinguishing its life cycle from annual crops such as rice and maize. Sugarcane progresses through four primary growth stages, as delineated in Table 1.
The growth of sugarcane encompasses four distinct phases: (1) ratoon germination or planting (inclusive of ratoon cane), with germination transpiring from late January to late March, and the typical planting span for new sugarcane extending from late March to early May. During this germination or planting phase, NDVI is relatively low; (2) tillering, usually initiating in May and lasting for about a month, during which a rapid increase in NDVI is observed; (3) rapid growth, the phase between June and October where sugarcane stalks commence elongation and swiftly grow, reaching the apex of NDVI values; and (4) maturation and harvest, starting in November when sugarcane matures and prepares for harvest. The harvesting period unfolds from November and continues until April of the ensuing year, witnessing a sharp decline in NDVI.
Sugarcane diverges from the other two primary crops in Chongzuo, maize and rice, in that it is not an annual crop and exhibits only a single peak over its yearly growth cycle. To quantify these characteristics, boundaries representing the maximum (v) and minimum (w) vegetation intensities, abbreviated as “V-line” and “W-line”, respectively, were established to define the range of maximum to minimum vegetation. Within the study area of this research, both newly planted and ratoon sugarcane exhibited similar growth periods and NDVI variations. Xu et al. [26] proposed a SAR-based Paddy Rice Index (SPRI) that uses the unique features of paddy rice during the transplanting-vegetative period. We referred to SPRI in the construction of the sugarcane index (NBSI), aiming to extract sugarcane through crucial phenological points. The standard NDVI curve for sugarcane was generated by randomly selecting 50 sugarcane samples from various locations in Chongzuo from field data for the year 2021, as shown in Figure 6.
In this study, the value of the V-line is set to 1 and the W-line to 0. The unique growth attributes of sugarcane can be summarized as follows: (1) between January and May, there is both sprouting and newly planted sugarcane as well as maturing cane awaiting harvest, exhibiting the period’s minimum NDVI. This characteristic is denoted as f(W1) (Feature 1), represented by Equation (2); (2) during November to December, the harvest of sugarcane results in a period of minimal NDVI, denoted as f(W2) (Feature 2), and is represented by Equation (3); (3) the rapid growth phase from May to August showcases the maximum NDVI value throughout the growth period, symbolized as f(V) (Feature 3), and expressed by Equation (4); and (4) the difference between the minimum f(W) and maximum f(V) over the entire growth cycle, denoted as NDVI fluctuation range D(P3 − P1), is represented as f(D) (Feature 4). To amplify the difference, f(D) employs a sigmoid function to scale the value of f(D) between 0 and 1, as delineated in Equation (5).
Herein, x denotes the NDVI value, while P1 and P3 represent critical points during the growth phase of sugarcane.
The measures f(W1), f(W2), f(V) and f(D) quantitatively delineate various characteristics throughout the sugarcane growth period. The measure f(D) evaluates the NDVI fluctuation range D, the ratio between (P3 − P1) and V-W, given that V-W = 1, thus f(D) reflects the proximity of D(P3 − P1) to 1; f(W1) quantifies the closeness of the local minimum NDVI value to 0 during the ratoon germination or planting phase, f(W2) quantifies the closeness of the local minimum NDVI value to 0 during the maturation phase, and f(V) quantifies the closeness of the local maximum NDVI value to 1 during the growth phase. Sugarcane pixels should concurrently exhibit these four characteristics. Therefore, NBSI was devised to amalgamate these four measurements into an equation, represented by Equation (6):
The measures f(D), f(W) and f(V) span a range of 0 to 1 and exhibit a unified directionality where larger values signify a higher likelihood of sugarcane cultivation. Contrasted with the utilization of a singular measure, the amalgamation of these four measures affords a more reliable estimation of the probability of sugarcane cultivation. These constituent elements are multiplicatively combined as each serves as an essential criterion for identifying a farmland pixel as sugarcane. The employment of multiplication rather than addition ensures that only pixels exhibiting all four characteristics are classified as sugarcane. Under an additive combination, a single characteristic could be overlooked when any two or three other characteristics predominantly manifest. For instance, certain intensive crops with relatively larger values of f(W) and f(V) could be erroneously classified as sugarcane under Equation (6).
3.5. Machine Learning Methods and Accuracy Assessment
To evaluate the proposed NBSI, a comparative analysis was conducted against two prevalent classifiers, RF and SVM. SVM, a non-parametric classifier, makes no assumptions about the underlying data distribution and classifies images by constructing a hyperplane using kernel functions [89,90,91]. RF is fundamentally an ensemble classifier, whose robustness and convenience have rendered it a popular choice for sugarcane identification [92]. Given that both RF and SVM necessitate training samples, the training and testing data were bifurcated into “sugarcane” and “non-sugarcane” categories. The sample data utilized for calibration and validation in this study were chiefly derived from high-resolution images on Google Earth. Initially, sugarcane or non-sugarcane samples were selected based on color and texture visual interpretation from Google Earth images. We used the EGF-WS method to reconstruct the NDVI time series of Chongzuo, with a temporal resolution of 8 days and a spatial resolution of 10 m. For the classification of RF, SVM, and NBSI, we utilized the NDVI time series reconstructed by EGF-WS. Utilizing the ground-collected sugarcane field plots along with the visually interpreted sample points from Google Earth high-resolution images in conjunction with the extracted results of NBSI, a confusion matrix was constructed to interpret the accuracy of the spatial distribution results of sugarcane cultivation. Four common accuracy assessment indicators were employed for a quantitative evaluation of the sugarcane identification results, specifically: overall accuracy (OA), F1 score, and Kappa coefficient. Producer’s accuracy (PA) represents the percentage of surveyed reference samples correctly identified as the target category; user’s Accuracy (UA) denotes the percentage of samples confirmed as the target class on the classified map through field surveys among the surveyed reference samples; and overall accuracy (OA) reflects the ratio of correctly classified samples to all samples. These accuracies were computed using Equations (7)–(10), as delineated below:
Within this framework, XR denotes the quantity of samples correctly classified as sugarcane, which indeed possess authentic sugarcane coverage. Xi* signifies the number of samples classified as sugarcane, while X*j represents the total count of samples with genuine sugarcane coverage. Sd corresponds to the number of samples accurately classified, and n stands for the total count of validation samples.
We compared the extracted sugarcane cultivation area in 2021 with the sugarcane cultivation area reported in the 2021 statistical yearbook to validate the correlation between the estimated sugarcane cultivation area and the agricultural statistical planting data.
4. Results
4.1. NBSI Classification Results
This study computed the EGF-NDVI time series by fusing imagery from Landsat-8, Sentinel-2 and MODIS, then constructing the NBSI. Utilizing the NBSI, the following sugarcane cultivation areas within various counties of Chongzuo City in the Guangxi Zhuang Autonomous Region for the year 2021 were delineated: Daxin County (DX), Fusui County (FS), Jiangzhou District (JZ), Longzhou County (LZ), Ningming County (NM), Pingxiang County (PX), and Tiandeng County (TD), as illustrated in Figure 7.
The delineation of sugarcane cultivation areas in the seven counties was achieved by classifying EGF imagery using the optimal threshold values for each county. As depicted in Figure 7, the sugarcane cultivation within Chongzuo City is predominantly concentrated in the central flat regions, exhibiting characteristics of large-scale contiguous cultivation with relatively high planting density. This finding aligns with the spatial distribution of sugarcane cultivation areas in the Guangxi region as extracted by Zheng Yi and Wang Jie. FS County hosts the largest sugarcane cultivation area, which is mainly located in the southwestern part of the city and follows a compact planting pattern. Following FS, JZ and NM also have major sugarcane cultivation areas. In JZ, the cultivation is mainly centered in the western and eastern regions of the county, In NM, it is primarily concentrated in the northern plain blocks, exhibiting a contiguous planting characteristic in the north. The remaining cities have smaller sugarcane cultivation areas, manifesting a fragmented planting pattern, dispersed across various regions within each county.
4.2. Qualitative Assessment
To validate the outcomes derived from NBSI, existing sugarcane mapping methods, such as RF and SVM, were employed to identify sugarcane within the study area. For a visual comparative analysis, the sugarcane identification results from NBSI, the 30 m resolution sugarcane map extracted by TWDTW method, and the classification outcomes obtained via RF and SVM machine learning approaches were compared. Utilizing ArcGIS 10.8 software, all sugarcane locations within the study area were visualized to generate the corresponding sugarcane maps, as shown in Figure 8.
Figure 8 illustrates the results of sugarcane identification utilizing different methodologies. Sub-figure (a) depicts the outcomes of the present study using NBSI, represented in green; sub-figure (b) showcases the results extracted through TWDTW method, represented in blue; sub-figure (c) presents the results derived via the RF method, represented in yellow; and sub-figure (d) exhibits the outcomes obtained by the SVM method, represented in purple. Visually, a certain level of similarity is discernible among the sugarcane maps generated by these distinct methods. To elucidate the details of the sugarcane maps and facilitate visual comparison, seven typical regions within different counties were selected, as delineated by the red boxes in Figure 7a (Regions A–G), and were zoomed in on. The respective sugarcane maps were then compared against high-resolution images from Google Earth, as demonstrated in Figure 9.
Figure 9 delineates the detailed zoom-in results of the NBSI and TWDTW methods, and the classifiers RF and SVM. The first row of Figure 9 presents high-resolution satellite images provided by GEE, followed by the NBSI identification results in the second row, TWDTW identification results in the third row, RF classification results in the fourth row, and SVM classification results in the fifth row. Upon visual comparison, it can be seen that the NBSI results furnish more precise field boundary information and yield more accurate classification outcomes compared to the results of the TWDTW method. This enhancement may be attributed to the spatial resolution of 10 m of the sugarcane map generated in this study, in contrast to the 30 m resolution of the map produced by the TWDTW method. The NBSI identification results exhibit a consistency with the high-resolution satellite imagery, as depicted in the second row of Figure 8. Conversely, apparent classification errors are observed in the machine learning methods (SVM and RF) and TWDTW results, as illustrated by the circles in Figure 8. Notable omission errors occur in the TWDTW classification results in regions B, F and G; RF classification results in regions A, C, E, F and G; and SVM classification results in regions B and E, denoted by red circles. Commission errors are evident in the RF classification results in regions D and G; and in SVM classification results in regions A, D and G, denoted by yellow circles. Hence, it can be seen that NBSI yields more accurate classification outcomes compared to the other three methods, with sugarcane fields being more accurately separated from other land cover types, exhibiting not only fewer errors but also precise boundary information.
4.3. Quantitative Assessment
To assess the capability of the NBSI in identifying sugarcane, the accuracy of the 2021 Chongzuo sugarcane map was evaluated using the validation samples described in Section 2.3. We compared the extraction results of NBSI with two prevalent classifiers, namely, RF and SVM. The training and testing data were partitioned into sugarcane and other categories. The outcomes are depicted in Table 2:
In the seven counties of Chongzuo, NBSI achieved the highest overall accuracy (OA) of 95.51%, 96.49%, 96.37%, 95.48%, 95.24%, 97.53%, and 95.5%, surpassing RF’s 93.21%, 87.24%, 85.31%, 93.75%, 92.96%, 88.44% and 93.26%, and SVM’s 85.87%, 94.47%, 94.2%, 94.78%, 90.19%, 92.22% and 91.12%. Likewise, the NBSI attained the maximum Kappa coefficient of 0.98 across all seven counties, with an average Kappa value of 0.95, which is 2.43%–12.01% higher than RF and 1.11%–10.14% higher than SVM. This suggests a successful identification of the majority of sugarcane pixels in all study areas using our method. Specifically, the utilization of NBSI in FS accurately delineated sugarcane fields (OA = 96.49%), primarily due to the predominance of sugarcane cultivation and low landscape complexity in FS. Moderate mapping accuracy was obtained in the more complex areas of LZ and TD by NBSI. NM, presenting a high level of landscape complexity, posed the most challenging area for sugarcane mapping, where NBSI reported the lowest OA of 95.24%, albeit significantly higher than SVM (90.19%) and RF (92.96%).
A comparison of UA and PA amongst the three methods across the seven study sites revealed a superior balance of commission and omission errors by our method. This was reflected in the higher F1 scores demonstrated by our method, notably, an F1 of 95.37 in FS by NBSI, substantially surpassing the machine learning methods, thereby affirming NBSI’s recognition capability in regions where sugarcane is the predominant crop. In contrast, the RF method yielded only a 93.27% F1 score, indicating that many sugarcane pixels were missed in major sugarcane cultivation sites. For regions JZ and LZ, NBSI achieved higher F1 values of 94.83% and 95.58%, whereas RF and SVM methods resulted in F1 values between 92.51–93.63%, implying the incorrect classification of many non-sugarcane pixels, as sugarcane in these two regions where sugarcane is not the dominant crop. In the NM and PX regions of Chongzuo, the NBSI method was able to mitigate classification confusion by amplifying the distinction between sugarcane and other land covers, a significant challenge in mixed cultivation areas. The superior performance of NBSI over the two machine learning methods, especially in the most challenging regions for sugarcane mapping, was evident. Specifically, F1 scores by NBSI were 1.74–4.64% and 1.1–7.41% higher than RF and SVM methods respectively, indicating NBSI’s superior ability in identifying sugarcane fields.
From the 2021 sugarcane map identified by NBSI, sugarcane cultivation areas in each county were quantified and compared with the statistics from the 2021 Statistical Yearbook and the Statistical Bulletin of National Economic and Social Development, as illustrated in Figure 10:
The estimated areas closely align with the statistical areas, differing by a mere 1.98 km², potentially attributed to a lower proportion of fragmented sugarcane cultivation in DX. Following closely, FS, PX, JZ, and NM exhibit differences of 10.07, 9.8, 10.04, and 9.99 km², respectively. LZ county registers the largest disparity of 20.05 km² between estimated and statistical areas, likely stemming from a higher proportion of fragmented cultivation plots in LZ.
5. Discussion
To address the challenges arising from the suboptimal quality of optical remote sensing imagery during cloudy and rainy conditions, this study utilized the EGF-WS method to integrate imagery from Landsat-8, Sentinel-2, and MODIS. This integration resulted in EGF imagery with a spatial resolution of 10 m and a temporal resolution of 8 days. Utilizing the EGF imagery, the EGF-NDVI was computed. Leveraging the EGF-NDVI in conjunction with the various phenological characteristics observed during the sugarcane growth cycle, the NBSI was constructed. Through empirical selection of optimal threshold values, a 10 m resolution sugarcane map of Chongzuo City in the Guangxi Zhuang Autonomous Region was delineated.
5.1. Threshold Selection
In numerous remote sensing studies, threshold-based approaches have been effectively employed for delineating various crop types. Accordingly, this study utilized both empirical methods and the OTSU method to ascertain the optimal threshold values for each county and district. The outcomes of these two threshold determination methods across different regions are depicted in Figure 11.
The empirical methodology entailed a random selection of 203 sugarcane pixels from 1000 pixels in the DX region, with the remaining 797 pixels representing other categories. Subsequently, the overall accuracy was calculated under various threshold values, with a search stride of 0.0001 from 0 to 2. At a threshold of 0.7461, the accuracy notably ascended to 95.51%, followed by a sharp decline in accuracy beyond this threshold, plummeting to 15% at a threshold of 2. Hence, within the purview of this study, a threshold of 0.7461 is deemed optimal for segregating sugarcane from other land cover types in the DX region. Analogously, the optimal thresholds for other regions were ascertained as FS = 0.5674, JZ = 0.6085, LZ = 0.7139, NM = 0.7687, PX = 1.0858, and TD = 1.8682.
The OTSU algorithm, employed in computer vision applications to distinguish the foreground from the background, endeavors to maximize inter-class variance and minimize intra-class variance based on the histogram of a variable [93]. As depicted in the figure, the threshold selected via the OTSU method, when compared to the optimal threshold, is closest in FS county, with a deviation range of 0.0206 to 1.1502 across all counties. The outcomes indicate that the optimal thresholds obtained through the empirical approach yield the highest overall accuracy, substantially surpassing the overall accuracy achieved through the OTSU method.
5.2. Advantages of the NBSI Method
This investigation has fashioned the NBSI from the EGF-NDVI time series, testing its efficacy across research areas of varied topography and cultivation proportions, and has achieved remarkable accuracy. This can be chiefly ascribed to three advantages over other methods. Initially, as opposed to employing a single metric, the NBSI amalgamates four measures, facilitating a more reliable estimation of sugarcane cultivation probability, while existing methodologies merely employ a subset of features or utilize them independently. These four components are multiplicatively combined, being requisite conditions to discern a cropland pixel as sugarcane is cultivated. The employment of multiplication, rather than addition, is aimed to ensure that only pixels embodying all four characteristics are categorized as sugarcane. If amalgamated additively, a feature could be overlooked when any other two or three features predominate. The product of the four measures in the NBSI amplifies the distinction between sugarcane and non-sugarcane pixels, thereby achieving the highest F1 scores across all regions. Second, within this study, the NBSI accentuates the index value disparity between sugarcane and non-sugarcane, with an upper boundary “V-line” value of 1 and a lower boundary “W-line” value of 0, implying sugarcane near 1 and non-sugarcane near 0, simplifying the determination of optimal threshold values to segregate sugarcane from non-sugarcane regions through the index. Third, the NBSI method has the potential to be implemented with great reliability in a region without using training data. When applied to a new region, the decision rule is still valid, but the threshold needs to adjust for higher classification accuracy slightly. The temporal variations of multiple spectral indices may promote the development of index-based methods. This index method harbors significant potential for delineation in other crop types and could be considered for application across different crop types in other years or regions.
5.3. Limitations of the NBSI Method
Despite certain advantages over conventional sugarcane mapping methodologies, the NBSI still harbors some limitations. Initially, akin to other index-based methods, the NBSI appears to exhibit sensitivity to cloud cover, which could influence the NDVI base values, potentially diminishing the sugarcane recognition accuracy of the NBSI. The NBSI method is suitable for regions with high-quality observations during the growth stage. When the quality of the observations is lower due to cloud cover, the change could cause sugarcane to be misclassified as another crop. Second, understanding a region’s sugarcane phenological cycle is a prerequisite for NBSI application. While this study has procured the sugarcane phenological cycle of Guangxi Chongzuo and facilitating its direct application in future investigations, the adoption of NBSI for sugarcane mapping in other nations or regions necessitates the determination of f(W), f(V), and f(D) based on the NDVI time series and local sugarcane phenology. Third, the proposed NBSI, being pixel-based, might be susceptible to salt-and-pepper noise. Current research trends indicate a rise in classification methods based on remote sensing image segmentation, as they yield smoother classification outcomes. Future research could contemplate the extension of the pixel-based NBSI to object-based methodology applications. Fourth, the NBSI method performed better than the RF and SVM of Chongzuo, which proved the ability of the NBSI method when applied to sugarcane mapping areas in Chongzuo area. At present, this method is only applicable in this study area, but has not been extended to other regions; its universality will be further improved in the next work. SAR time series can capture signals corresponding to critical growth stages of rice, facilitating rice mapping in cloudy regions. Given the structural similarities between sugarcane fields and rice paddies, a plethora of rice identification methods can serve as valuable reference materials for sugarcane identification. In our forthcoming research endeavors, we intend to incorporate SAR imagery to augment the precision and robustness of sugarcane mapping. Finally, we are endeavoring to employ deep learning for sugarcane identification in related research [56]. The present study confines its definition of sugarcane solely to NDVI. Wang et al. [88] have employed LSWI, EVI, and NDVI collectively to ascertain sugarcane acreage in Guangxi. In our forthcoming work, we aspire to investigate the integration of additional features to assess NBSI’s capacity for sugarcane extraction and aim to explore the integration of more advanced methodologies with NBSI.
6. Conclusions
Sugarcane, as a pivotal source of sugar and biofuel production, plays an indispensable role in bolstering the sugar industry. This article introduces a novel Sugarcane Index, termed NBSI, devised by integrating imagery from MODIS, Sentinel-2, and Landsat-8. The temporal sequence data from the amalgamated imagery serves to delineate sugarcane cultivation from other land cover types and crops. The efficacy of NBSI in identifying sugarcane was examined across seven counties within Chongzuo City, Guangxi Zhuang Autonomous Region, and was compared against prevalent classifiers such as SVM and RF. The outcomes indicate that NBSI is capable of crafting sugarcane maps with an overall accuracy exceeding 90.45% and a Kappa coefficient surpassing 0.93, outperforming SVM and RF in Chongzuo region. Unlike traditional methods requiring extensive field sampling, NBSI necessitates merely the selection of a threshold value to extract sugarcane cultivation maps, demonstrating superior flexibility and applicability in sugarcane identification. This augurs well for the potential adaptation of NBSI in drafting sugarcane cultivation maps across different regions, thereby rendering assistance in sugarcane mapping endeavors.
Author Contributions
Y.L. and C.R. conceived and designed the experiments; J.L. (Jieyu Liang), Y.Z. and X.X. carried out the data acquisition; Y.L. and C.R. performed data processing and analyses, J.L. (Jieyu Liang) and C.D. contributed to the manuscript of the paper; C.D., J.L. (Jiakai Lu) and X.X. discussed and analyzed the experimental results. All authors have read and agreed to the published version of the manuscript.
Funding
This research was funded by the programs of the National Natural Science Foundation of China under grant no. 42064003.
Data Availability Statement
All data is obtained from Google Earth Engine (GEE) https://code.earthengine.google.com/ (accessed on 18 October 2023).
Conflicts of Interest
The authors declare no conflict of interest.
References
- Vignesh, U.; Chokkalingam, B.S. EnC-SVMWEL: Ensemble Approach using CNN and SVM Weighted Average Ensemble Learning for Sugarcane Leaf Disease Detection. In Proceedings of the 2023 International Conference on Sustainable Computing and Data Communication Systems (ICSCDS), Erode, India, 23–25 March 2023; pp. 1663–1668. [Google Scholar]
- Hu, S.; Shi, L.; Huang, K.; Zha, Y.; Hu, X.; Ye, H.; Yang, Q. Improvement of sugarcane crop simulation by SWAP-WOFOST model via data assimilation. Field Crops Res. 2019, 232, 49–61. [Google Scholar] [CrossRef]
- Belgiu, M.; Csillik, O. Sentinel-2 cropland mapping using pixel-based and object-based time-weighted dynamic time warping analysis. Remote Sens. Environ. 2018, 204, 509–523. [Google Scholar] [CrossRef]
- JukgolJun, W.; Moonumca, P.; Depaiwa, N. Development and Design Structure and Mechanism of Sugarcane Harvester with Leaf Pruning Machine. In Proceedings of the 2023 9th International Conference on Engineering, Applied Sciences, and Technology (ICEAST), Vientiane, Laos, 1–4 June 2023; pp. 111–114. [Google Scholar]
- Mulianga, B.; Bégué, A.; Clouvel, P.; Todoroff, P. Mapping cropping practices of a sugarcane-based cropping system in Kenya using remote sensing. Remote Sens. 2015, 7, 14428–14444. [Google Scholar] [CrossRef]
- Triadi, R.; Herdiyeni, Y.; Tarigan, S.D. Estimating crop water stress of sugarcane in indonesia using landsat 8. In Proceedings of the 2020 International Conference on Computer Science and Its Application in Agriculture (ICOSICA), Bogor, Indonesia, 17 September 2020; pp. 1–4. [Google Scholar]
- Den Besten, N.; Dunne, S.S.; Mahmud, A.; Jackson, D.; Aouizerats, B.; de Jeu, R.; Burger, R.; Houborg, R.; McGlinchey, M.; van der Zaag, P. Understanding Sentinel-1 backscatter response to sugarcane yield variability and waterlogging. Remote Sens. Environ. 2023, 290, 113555. [Google Scholar] [CrossRef]
- Defante, L.R.; Vilpoux, O.F.; Sauer, L. Rapid expansion of sugarcane crop for biofuels and influence on food production in the first producing region of Brazil. Food Policy 2018, 79, 121–131. [Google Scholar] [CrossRef]
- Hernandez-Figueroa, H.E.; Oliveira, L.P.; Oré, G.; Alcĉntara, M.S.; Góes, J.A.; ria Castro, V.; Castro, F.; Gabrielli, L.H.; Teruel, B.; Yepes, J. Sugarcane Precision Monitoring by Drone-Borne p/l/c-band dinsar. In Proceedings of the 2021 IEEE International Geoscience and Remote Sensing Symposium IGARSS, Brussels, Belgium, 11–16 July 2021; pp. 632–635. [Google Scholar]
- Xin, F.; Xiao, X.; Cabral, O.M.; White, P.M., Jr.; Guo, H.; Ma, J.; Li, B.; Zhao, B. Understanding the land surface phenology and gross primary production of sugarcane plantations by eddy flux measurements, MODIS images, and data-driven models. Remote Sens. 2020, 12, 2186. [Google Scholar] [CrossRef]
- Zhang, C.; Zhang, H.; Tian, S. Phenology-assisted supervised paddy rice mapping with the Landsat imagery on Google Earth Engine: Experiments in Heilongjiang Province of China from 1990 to 2020. Comput. Electron. Agric. 2023, 212, 108105. [Google Scholar] [CrossRef]
- Bordonal, R.d.O.; Carvalho, J.L.N.; Lal, R.; de Figueiredo, E.B.; de Oliveira, B.G.; La Scala, N. Sustainability of sugarcane production in Brazil. A review. Agron. Sustain. Dev. 2018, 38, 13. [Google Scholar] [CrossRef]
- Som-Ard, J.; Atzberger, C.; Izquierdo-Verdiguier, E.; Vuolo, F.; Immitzer, M. Remote sensing applications in sugarcane cultivation: A review. Remote Sens. 2021, 13, 4040. [Google Scholar] [CrossRef]
- Vieira, M.A.; Formaggio, A.R.; Rennó, C.D.; Atzberger, C.; Aguiar, D.A.; Mello, M.P. Object based image analysis and data mining applied to a remotely sensed Landsat time-series to map sugarcane over large areas. Remote Sens. Environ. 2012, 123, 553–562. [Google Scholar] [CrossRef]
- Wang, M.; Liu, Z.; Baig, M.H.A.; Wang, Y.; Li, Y.; Chen, Y. Mapping sugarcane in complex landscapes by integrating multi-temporal Sentinel-2 images and machine learning algorithms. Land Use Policy 2019, 88, 104190. [Google Scholar] [CrossRef]
- Li, X.; Yu, L.; Peng, D.; Gong, P. A large-scale, long time-series (1984–2020) of soybean mapping with phenological features: Heilongjiang Province as a test case. Int. J. Remote Sens. 2021, 42, 7332–7356. [Google Scholar] [CrossRef]
- Yuan, X.; Li, H.; Han, Y.; Chen, J.; Chen, X. Monitoring of Sugarcane Crop based on Time Series of Sentinel-1 data: A case study of Fusui, Guangxi. In Proceedings of the 2019 8th International Conference on Agro-Geoinformatics (Agro-Geoinformatics), Istanbul, Turkey, 16–19 July 2019; pp. 1–5. [Google Scholar]
- Zhou, D.; Fan, Y.; Deng, G.; He, F.; Wang, M. Research on algorithm of sugarcane nodes identification based on machine vision. In Proceedings of the 2019 Nicograph International (NicoInt), Yangling, China, 5–7 July 2019; pp. 111–116. [Google Scholar]
- Cruz-Sanabria, H.; Sánchez, M.G.; Rivera-Caicedo, J.P.; Avila-George, H. Identification of phenological stages of sugarcane cultivation using Sentinel-2 images. In Proceedings of the 2020 9th International Conference on Software Process Improvement (CIMPS), Mazatlan, Mexico, 21–23 October 2020; pp. 110–116. [Google Scholar]
- Muller, S.J.; Sithole, P.; Singels, A.; Van Niekerk, A. Assessing the fidelity of Landsat-based fAPAR models in two diverse sugarcane growing regions. Comput. Electron. Agric. 2020, 170, 105248. [Google Scholar] [CrossRef]
- Ashourloo, D.; Shahrabi, H.S.; Azadbakht, M.; Rad, A.M.; Aghighi, H.; Radiom, S. A novel method for automatic potato mapping using time series of Sentinel-2 images. Comput. Electron. Agric. 2020, 175, 105583. [Google Scholar] [CrossRef]
- Fan, Y.; Feng, H.; Yue, J.; Jin, X.; Liu, Y.; Chen, R.; Bian, M.; Ma, Y.; Song, X.; Yang, G. Using an optimized texture index to monitor the nitrogen content of potato plants over multiple growth stages. Comput. Electron. Agric. 2023, 212, 108147. [Google Scholar] [CrossRef]
- Liu, S.; Hu, Z.; Han, J.; Li, Y.; Zhou, T. Predicting grain yield and protein content of winter wheat at different growth stages by hyperspectral data integrated with growth monitor index. Comput. Electron. Agric. 2022, 200, 107235. [Google Scholar] [CrossRef]
- Sun, Q.; Chen, L.; Xu, X.; Gu, X.; Hu, X.; Yang, F.; Pan, Y. A new comprehensive index for monitoring maize lodging severity using UAV-based multi-spectral imagery. Comput. Electron. Agric. 2022, 202, 107362. [Google Scholar] [CrossRef]
- Zhang, H.; Du, H.; Zhang, C.; Zhang, L. An automated early-season method to map winter wheat using time-series Sentinel-2 data: A case study of Shandong, China. Comput. Electron. Agric. 2021, 182, 105962. [Google Scholar] [CrossRef]
- Xu, S.; Zhu, X.; Chen, J.; Zhu, X.; Duan, M.; Qiu, B.; Wan, L.; Tan, X.; Xu, Y.N.; Cao, R. A robust index to extract paddy fields in cloudy regions from SAR time series. Remote Sens. Environ. 2023, 285, 113374. [Google Scholar] [CrossRef]
- Aguiar, D.A.; Rudorff, B.F.T.; Silva, W.F.; Adami, M.; Mello, M.P. Remote sensing images in support of environmental protocol: Monitoring the sugarcane harvest in São Paulo State, Brazil. Remote Sens. 2011, 3, 2682–2703. [Google Scholar] [CrossRef]
- Dos Santos Luciano, A.C.; Picoli, M.C.A.; Rocha, J.V.; Duft, D.G.; Lamparelli, R.A.C.; Leal, M.R.L.V.; Le Maire, G. A generalized space-time OBIA classification scheme to map sugarcane areas at regional scale, using Landsat images time-series and the random forest algorithm. Int. J. Appl. Earth Obs. Geoinf. 2019, 80, 127–136. [Google Scholar]
- Jiang, H.; Li, D.; Jing, W.; Xu, J.; Huang, J.; Yang, J.; Chen, S. Early Season Mapping of Sugarcane by Applying Machine Learning Algorithms to Sentinel-1A/2 Time Series Data: A Case Study in Zhanjiang City, China. Remote Sens. 2019, 11, 861. [Google Scholar] [CrossRef]
- Zheng, Y.; Li, Z.; Pan, B.; Lin, S.; Dong, J.; Li, X.; Yuan, W. Development of a phenology-based method for identifying sugarcane plantation areas in China using high-resolution satellite datasets. Remote Sens. 2022, 14, 1274. [Google Scholar] [CrossRef]
- Zhang, G.; Xiao, X.; Biradar, C.M.; Dong, J.; Qin, Y.; Menarguez, M.A.; Zhou, Y.; Zhang, Y.; Jin, C.; Wang, J. Spatiotemporal patterns of paddy rice croplands in China and India from 2000 to 2015. Sci. Total Environ. 2017, 579, 82–92. [Google Scholar] [CrossRef]
- He, T.; Wang, K.; Xiao, W.; Xu, S.; Li, M.; Yang, R.; Yue, W. Global 30 meters spatiotemporal 3D urban expansion dataset from 1990 to 2010. Sci. Data 2023, 10, 321. [Google Scholar] [CrossRef] [PubMed]
- Luciano, A.d.S.; Picoli, M.C.A.; Rocha, J.V.; Franco, H.C.J.; Sanches, G.M.; Leal, M.R.L.V.; Maire, G.l. Generalized space-time classifiers for monitoring sugarcane areas in Brazil. Remote Sens. Environ. 2018, 215, 438–451. [Google Scholar] [CrossRef]
- Vinod, K.V.K.; Kamal, J. Development of spectral signatures and classification of sugarcane using aster data. Int. J. Comput. Sci. Commun 2010, 1, 245–251. [Google Scholar]
- Soltanikazemi, M.; Minaei, S.; Shafizadeh-Moghadam, H.; Mahdavian, A. Field-scale estimation of sugarcane leaf nitrogen content using vegetation indices and spectral bands of Sentinel-2: Application of random forest and support vector regression. Comput. Electron. Agric. 2022, 200, 107130. [Google Scholar] [CrossRef]
- Ashourloo, D.; Shahrabi, H.S.; Azadbakht, M.; Aghighi, H.; Nematollahi, H.; Alimohammadi, A.; Matkan, A.A. Automatic canola mapping using time series of sentinel 2 images. ISPRS J. Photogramm. Remote Sens. 2019, 156, 63–76. [Google Scholar] [CrossRef]
- Som-ard, J.; Hossain, M.D.; Ninsawat, S.; Veerachitt, V. Pre-harvest sugarcane yield estimation using UAV-based RGB images and ground observation. Sugar Tech 2018, 20, 645–657. [Google Scholar] [CrossRef]
- Luna, I.; Lobo, A. Mapping crop planting quality in sugarcane from UAV imagery: A pilot study in Nicaragua. Remote Sens. 2016, 8, 500. [Google Scholar] [CrossRef]
- El Hajj, M.; Bégué, A.; Guillaume, S.; Martiné, J.-F. Integrating SPOT-5 time series, crop growth modeling and expert knowledge for monitoring agricultural practices—The case of sugarcane harvest on Reunion Island. Remote Sens. Environ. 2009, 113, 2052–2061. [Google Scholar] [CrossRef]
- Song, X.-P.; Huang, W.; Hansen, M.C.; Potapov, P. An evaluation of Landsat, Sentinel-2, Sentinel-1 and MODIS data for crop type mapping. Sci. Remote Sens. 2021, 3, 100018. [Google Scholar] [CrossRef]
- Chen, Y.; Lu, D.; Moran, E.; Batistella, M.; Dutra, L.V.; Sanches, I.D.A.; da Silva, R.F.B.; Huang, J.; Luiz, A.J.B.; de Oliveira, M.A.F. Mapping croplands, cropping patterns, and crop types using MODIS time-series data. Int. J. Appl. Earth Obs. Geoinf. 2018, 69, 133–147. [Google Scholar] [CrossRef]
- Antropov, O.; Rauste, Y.; Tegel, K.; Baral, Y.; Junttila, V.; Kauranne, T.; Häme, T.; Praks, J. Tropical forest tree height and above ground biomass mapping in Nepal using Tandem-X and ALOS PALSAR data. In Proceedings of the IGARSS 2018–2018 IEEE International Geoscience and Remote Sensing Symposium, Valencia, Spain, 22–27 July 2018; pp. 5334–5336. [Google Scholar]
- Baghdadi, N.; Cresson, R.; Todoroff, P.; Moinet, S. Multitemporal observations of sugarcane by TerraSAR-X images. Sensors 2010, 10, 8899–8919. [Google Scholar] [CrossRef] [PubMed]
- Lin, H.; Chen, J.; Pei, Z.; Zhang, S.; Hu, X. Monitoring sugarcane growth using ENVISAT ASAR data. IEEE Trans. Geosci. Remote Sens. 2009, 47, 2572–2580. [Google Scholar] [CrossRef]
- Narmilan, A.; Gonzalez, F.; Salgadoe, A.S.A.; Kumarasiri, U.W.L.M.; Weerasinghe, H.A.S.; Kulasekara, B.R. Predicting canopy chlorophyll content in sugarcane crops using machine learning algorithms and spectral vegetation indices derived from UAV multispectral imagery. Remote Sens. 2022, 14, 1140. [Google Scholar] [CrossRef]
- Zhang, P.; Du, P.; Guo, S.; Zhang, W.; Tang, P.; Chen, J.; Zheng, H. A novel index for robust and large-scale mapping of plastic greenhouse from Sentinel-2 images. Remote Sens. Environ. 2022, 276, 113042. [Google Scholar] [CrossRef]
- Picoli, M.C.A.; Camara, G.; Sanches, I.; Simões, R.; Carvalho, A.; Maciel, A.; Coutinho, A.; Esquerdo, J.; Antunes, J.; Begotti, R.A. Big earth observation time series analysis for monitoring Brazilian agriculture. ISPRS J. Photogramm. Remote Sens. 2018, 145, 328–339. [Google Scholar] [CrossRef]
- Rußwurm, M.; Körner, M. Self-attention for raw optical satellite time series classification. ISPRS J. Photogramm. Remote Sens. 2020, 169, 421–435. [Google Scholar] [CrossRef]
- Wang, S.; Azzari, G.; Lobell, D.B. Crop type mapping without field-level labels: Random forest transfer and unsupervised clustering techniques. Remote Sens. Environ. 2019, 222, 303–317. [Google Scholar] [CrossRef]
- Turkoglu, M.O.; D’Aronco, S.; Perich, G.; Liebisch, F.; Streit, C.; Schindler, K.; Wegner, J.D. Crop mapping from image time series: Deep learning with multi-scale label hierarchies. Remote Sens. Environ. 2021, 264, 112603. [Google Scholar] [CrossRef]
- Henry, F.; Herwindiati, D.E.; Mulyono, S.; Hendryli, J. Sugarcane land classification with satellite imagery using logistic regression model. In Proceedings of the IOP Conference Series: Materials Science and Engineering, Xiamen, China, 20–22 October 2017; p. 012024. [Google Scholar]
- Asgarian, A.; Soffianian, A.; Pourmanafi, S. Crop type mapping in a highly fragmented and heterogeneous agricultural landscape: A case of central Iran using multi-temporal Landsat 8 imagery. Comput. Electron. Agric. 2016, 127, 531–540. [Google Scholar] [CrossRef]
- Wu, M.; Huang, W.; Niu, Z.; Wang, Y.; Wang, C.; Li, W.; Hao, P.; Yu, B. Fine crop mapping by combining high spectral and high spatial resolution remote sensing data in complex heterogeneous areas. Comput. Electron. Agric. 2017, 139, 1–9. [Google Scholar] [CrossRef]
- Wang, C.; Fan, Q.; Li, Q.; SooHoo, W.M.; Lu, L. Energy crop mapping with enhanced TM/MODIS time series in the BCAP agricultural lands. ISPRS J. Photogramm. Remote Sens. 2017, 124, 133–143. [Google Scholar] [CrossRef]
- Wu, Y.; Duguay, C.R.; Xu, L. Assessment of machine learning classifiers for global lake ice cover mapping from MODIS TOA reflectance data. Remote Sens. Environ. 2021, 253, 112206. [Google Scholar] [CrossRef]
- Zhou, G.; Liu, W.; Zhu, Q.; Lu, Y.; Liu, Y. ECA-mobilenetv3 (large)+ SegNet model for binary sugarcane classification of remotely sensed images. IEEE Trans. Geosci. Remote Sens. 2022, 60, 4414915. [Google Scholar] [CrossRef]
- Tanwar, V.; Lamba, S.; Sharma, B.; Sharma, A. Red Rot Disease Prediction in Sugarcane Using the Deep Learning Approach. In Proceedings of the 2023 2nd International Conference for Innovation in Technology (INOCON), Bangalore, India, 3–5 March 2023; pp. 1–5. [Google Scholar]
- Azadbakht, M.; Ashourloo, D.; Aghighi, H.; Radiom, S.; Alimohammadi, A. Wheat leaf rust detection at canopy scale under different LAI levels using machine learning techniques. Comput. Electron. Agric. 2019, 156, 119–128. [Google Scholar] [CrossRef]
- Liu, X.; Yu, L.; Zhong, L.; Hao, P.; Wu, B.; Wang, H.; Yu, C.; Gong, P. Spatial-temporal patterns of features selected using random forests: A case study of corn and soybeans mapping in the US. Int. J. Remote Sens. 2019, 40, 269–283. [Google Scholar] [CrossRef]
- Li, H.; Zhang, C.; Zhang, S.; Ding, X.; Atkinson, P.M. Iterative Deep Learning (IDL) for agricultural landscape classification using fine spatial resolution remotely sensed imagery. Int. J. Appl. Earth Obs. Geoinf. 2021, 102, 102437. [Google Scholar] [CrossRef]
- De Souza, C.H.W.; Mercante, E.; Johann, J.A.; Lamparelli, R.A.C.; Uribe-Opazo, M.A. Mapping and discrimination of soya bean and corn crops using spectro-temporal profiles of vegetation indices. Int. J. Remote Sens. 2015, 36, 1809–1824. [Google Scholar] [CrossRef]
- Xu, J.; Yang, J.; Xiong, X.; Li, H.; Huang, J.; Ting, K.; Ying, Y.; Lin, T. Towards interpreting multi-temporal deep learning models in crop mapping. Remote Sens. Environ. 2021, 264, 112599. [Google Scholar] [CrossRef]
- Zhong, L.; Hu, L.; Zhou, H.; Tao, X. Deep learning based winter wheat mapping using statistical data as ground references in Kansas and northern Texas, US. Remote Sens. Environ. 2019, 233, 111411. [Google Scholar] [CrossRef]
- Garnot, V.S.F.; Landrieu, L.; Giordano, S.; Chehata, N. Satellite image time series classification with pixel-set encoders and temporal self-attention. In Proceedings of the IEEE/CVF Conference on Computer Vision and Pattern Recognition, Seattle, WA, USA, 14–19 June 2020; pp. 12325–12334. [Google Scholar]
- Xu, J.; Zhu, Y.; Zhong, R.; Lin, Z.; Xu, J.; Jiang, H.; Huang, J.; Li, H.; Lin, T. DeepCropMapping: A multi-temporal deep learning approach with improved spatial generalizability for dynamic corn and soybean mapping. Remote Sens. Environ. 2020, 247, 111946. [Google Scholar] [CrossRef]
- Ajadi, O.A.; Barr, J.; Liang, S.-Z.; Ferreira, R.; Kumpatla, S.P.; Patel, R.; Swatantran, A. Large-scale crop type and crop area mapping across Brazil using synthetic aperture radar and optical imagery. Int. J. Appl. Earth Obs. Geoinf. 2021, 97, 102294. [Google Scholar] [CrossRef]
- Gella, G.W.; Bijker, W.; Belgiu, M. Mapping crop types in complex farming areas using SAR imagery with dynamic time warping. ISPRS J. Photogramm. Remote Sens. 2021, 175, 171–183. [Google Scholar] [CrossRef]
- Zheng, Y.; dos Santos Luciano, A.C.; Dong, J.; Yuan, W. High-resolution map of sugarcane cultivation in Brazil using a phenology-based method. Earth Syst. Sci. Data 2022, 14, 2065–2080. [Google Scholar] [CrossRef]
- Li, A.; Song, K.; Chen, S.; Mu, Y.; Xu, Z.; Zeng, Q. Mapping African wetlands for 2020 using multiple spectral, geo-ecological features and Google Earth Engine. ISPRS J. Photogramm. Remote Sens. 2022, 193, 252–268. [Google Scholar] [CrossRef]
- Boschetti, M.; Busetto, L.; Manfron, G.; Laborte, A.; Asilo, S.; Pazhanivelan, S.; Nelson, A. PhenoRice: A method for automatic extraction of spatio-temporal information on rice crops using satellite data time series. Remote Sens. Environ. 2017, 194, 347–365. [Google Scholar] [CrossRef]
- Kontgis, C.; Schneider, A.; Ozdogan, M. Mapping rice paddy extent and intensification in the Vietnamese Mekong River Delta with dense time stacks of Landsat data. Remote Sens. Environ. 2015, 169, 255–269. [Google Scholar] [CrossRef]
- Qiu, B.; Li, W.; Tang, Z.; Chen, C.; Qi, W. Mapping paddy rice areas based on vegetation phenology and surface moisture conditions. Ecol. Indic. 2015, 56, 79–86. [Google Scholar] [CrossRef]
- Lu, Z.-J.; Qian, S.; Liu, K.-B.; Wu, W.-B.; Liu, Y.-X.; Rui, X.; Zhang, D.-M. Rice cultivation changes and its relationships with geographical factors in Heilongjiang Province, China. J. Integr. Agric. 2017, 16, 2274–2282. [Google Scholar] [CrossRef]
- Sulik, J.J.; Long, D.S. Spectral considerations for modeling yield of canola. Remote Sens. Environ. 2016, 184, 161–174. [Google Scholar] [CrossRef]
- Chen, H.; Li, H.; Liu, Z.; Zhang, C.; Zhang, S.; Atkinson, P.M. A novel Greenness and Water Content Composite Index (GWCCI) for soybean mapping from single remotely sensed multispectral images. Remote Sens. Environ. 2023, 295, 113679. [Google Scholar] [CrossRef]
- Shao, Y.; Taff, G.N.; Ren, J.; Campbell, J.B. Characterizing major agricultural land change trends in the Western Corn Belt. ISPRS J. Photogramm. Remote Sens. 2016, 122, 116–125. [Google Scholar] [CrossRef]
- Jia, M.; Wang, Z.; Wang, C.; Mao, D.; Zhang, Y. A new vegetation index to detect periodically submerged mangrove forest using single-tide Sentinel-2 imagery. Remote Sens. 2019, 11, 2043. [Google Scholar] [CrossRef]
- Zhang, H.; Zhang, Y.; Liu, K.; Lan, S.; Gao, T.; Li, M. Winter wheat yield prediction using integrated Landsat 8 and Sentinel-2 vegetation index time-series data and machine learning algorithms. Comput. Electron. Agric. 2023, 213, 108250. [Google Scholar] [CrossRef]
- Qu, C.; Li, P.; Zhang, C. A spectral index for winter wheat mapping using multi-temporal Landsat NDVI data of key growth stages. ISPRS J. Photogramm. Remote Sens. 2021, 175, 431–447. [Google Scholar] [CrossRef]
- Yuan, W.; Meng, Y.; Li, Y.; Ji, Z.; Kong, Q.; Gao, R.; Su, Z. Research on rice leaf area index estimation based on fusion of texture and spectral information. Comput. Electron. Agric. 2023, 211, 108016. [Google Scholar] [CrossRef]
- Mulianga, B.; Bégué, A.; Simoes, M.; Todoroff, P. Forecasting regional sugarcane yield based on time integral and spatial aggregation of MODIS NDVI. Remote Sens. 2013, 5, 2184–2199. [Google Scholar] [CrossRef]
- Natarajan, S.; Basnayake, J.; Wei, X.; Lakshmanan, P. High-throughput phenotyping of indirect traits for early-stage selection in sugarcane breeding. Remote Sens. 2019, 11, 2952. [Google Scholar] [CrossRef]
- Kavats, O.; Khramov, D.; Sergieieva, K.; Vasyliev, V. Monitoring of sugarcane harvest in Brazil based on optical and SAR data. Remote Sens. 2020, 12, 4080. [Google Scholar] [CrossRef]
- Gorelick, N.; Hancher, M.; Dixon, M.; Ilyushchenko, S.; Thau, D.; Moore, R. Google Earth Engine: Planetary-scale geospatial analysis for everyone. Remote Sens. Environ. 2017, 202, 18–27. [Google Scholar] [CrossRef]
- Xiong, J.; Thenkabail, P.S.; Gumma, M.K.; Teluguntla, P.; Poehnelt, J.; Congalton, R.G.; Yadav, K.; Thau, D. Automated cropland mapping of continental Africa using Google Earth Engine cloud computing. ISPRS J. Photogramm. Remote Sens. 2017, 126, 225–244. [Google Scholar] [CrossRef]
- Chen, Y.; Cao, R.; Chen, J.; Liu, L.; Matsushita, B. A practical approach to reconstruct high-quality Landsat NDVI time-series data by gap filling and the Savitzky–Golay filter. ISPRS J. Photogramm. Remote Sens. 2021, 180, 174–190. [Google Scholar] [CrossRef]
- Liang, J.; Ren, C.; Li, Y.; Yue, W.; Wei, Z.; Song, X.; Zhang, X.; Yin, A.; Lin, X. Using Enhanced Gap-Filling and Whittaker Smoothing to Reconstruct High Spatiotemporal Resolution NDVI Time Series Based on Landsat 8, Sentinel-2, and MODIS Imagery. ISPRS Int. J. Geo-Inf. 2023, 12, 214. [Google Scholar] [CrossRef]
- Wang, J.; Xiao, X.; Liu, L.; Wu, X.; Qin, Y.; Steiner, J.L.; Dong, J. Mapping sugarcane plantation dynamics in Guangxi, China, by time series Sentinel-1, Sentinel-2 and Landsat images. Remote Sens. Environ. 2020, 247, 111951. [Google Scholar] [CrossRef]
- Maulik, U.; Chakraborty, D. Learning with transductive SVM for semisupervised pixel classification of remote sensing imagery. ISPRS J. Photogramm. Remote Sens. 2013, 77, 66–78. [Google Scholar] [CrossRef]
- Hittawe, M.M.; Sidibé, D.; Mériaudeau, F. Bag of words representation and SVM classifier for timber knots detection on color images. In Proceedings of the 2015 14th IAPR International Conference on Machine Vision Applications (MVA), Tokyo, Japan, 18–22 May 2015; pp. 287–290. [Google Scholar]
- Hittawe, M.M.; Afzal, S.; Jamil, T.; Snoussi, H.; Hoteit, I.; Knio, O. Abnormal events detection using deep neural networks: Application to extreme sea surface temperature detection in the Red Sea. J. Electron. Imaging 2019, 28, 021012. [Google Scholar] [CrossRef]
- Kuter, S. Completing the machine learning saga in fractional snow cover estimation from MODIS Terra reflectance data: Random forests versus support vector regression. Remote Sens. Environ. 2021, 255, 112294. [Google Scholar] [CrossRef]
- Cordeiro, M.C.; Martinez, J.-M.; Peña-Luque, S. Automatic water detection from multidimensional hierarchical clustering for Sentinel-2 images and a comparison with Level 2A processors. Remote Sens. Environ. 2021, 253, 112209. [Google Scholar] [CrossRef]
Figure 1.
The geographical Location of the study area. (a) Study area; (b) DEM of study area.

Figure 2.
Number of available images for each sensor. The number of scenes from MODIS, Landsat-8, and Sentinel-2 over the study area in 2021. Spatial distribution of the original images for MODIS (a); Landsat-8 (b); and Sentinel-2 (c). Spatial distribution of the cloud-free image for MODIS (d); Landsat-8 (e); and Sentinel-2 (f).

Figure 3.
The workflow for identifying and mapping sugarcane fields by sugarcane index (NBSI).

Figure 4.
Crop calendars for the major crops in Congzuo including sugarcane (SC), rice (RC), and maize (MZ). In this figure, ‘H’ and ‘S’ denote harvest and sowing separately.
Figure 4.
Crop calendars for the major crops in Congzuo including sugarcane (SC), rice (RC), and maize (MZ). In this figure, ‘H’ and ‘S’ denote harvest and sowing separately.

Figure 5.
NDVI time series of three major crops including sugarcane, rice, and maize.

Figure 6.
Diagram of four features in the NDVI time series for designing the sugarcane index in Equation (6).
Figure 6.
Diagram of four features in the NDVI time series for designing the sugarcane index in Equation (6).

Figure 7.
Sugarcane maps achieved by NBSI: (a) results of sugarcane in the study area; seven regions, denoted as A, B, C, D, E, F and G in (a), were selected randomly. The zoom-in views in (a) for the seven regions are shown in (b–h).
Figure 7.
Sugarcane maps achieved by NBSI: (a) results of sugarcane in the study area; seven regions, denoted as A, B, C, D, E, F and G in (a), were selected randomly. The zoom-in views in (a) for the seven regions are shown in (b–h).

Figure 8.
Sugarcane maps obtained using different classification methods: (a) extraction results of NBSI; (b) extraction results of TWDTW; (c) extraction results of RF; and (d) extraction results of SVM.
Figure 8.
Sugarcane maps obtained using different classification methods: (a) extraction results of NBSI; (b) extraction results of TWDTW; (c) extraction results of RF; and (d) extraction results of SVM.

Figure 9.
Zoom-ins showing seven selected sample blocks from classification results obtained by the four methods (from top to bottom: Google Earth satellite images, NBSI, TWDTW, RF and SVM).
Figure 9.
Zoom-ins showing seven selected sample blocks from classification results obtained by the four methods (from top to bottom: Google Earth satellite images, NBSI, TWDTW, RF and SVM).

Figure 10.
A comparison of sugarcane area estimates by prefecture and city between the sugarcane map in 2021 and the agricultural statistical data reported for 2021.
Figure 10.
A comparison of sugarcane area estimates by prefecture and city between the sugarcane map in 2021 and the agricultural statistical data reported for 2021.

Figure 11.
Threshold maps for each county. ★ represents the automatic threshold obtained by OTSU, and ● represents the optimal threshold selected by empirical methods; (a–g) show the threshold maps for DX, FS, JZ, LZ, NM, PX, and TD, respectively; and (h) represents the threshold table for Chongzuo.


Table 1.
Phenological periods and characteristics of sugarcane.
| Phenological Period | Phenological Characteristics (NDVI) | Sugarcane Field Photos | |
|---|---|---|---|
| Late January to Early May (ratoon germination or planting) | The sprouting of perennial sugarcane occurs between late January and late March, with new sugarcane planting typically taking place from late March to early May. Sprouting usually begins 15–30 days after sugarcane planting. During this period, NDVI starts to increase |  |  |
| May (tillering) | The tillering period begins approximately two months after sprouting and lasts for one month. Tillers emerge from the base of the mother shoot, forming 5–10 stems. During this period, NDVI rapidly increases. |  |  |
| June to October (rapid growth) | Sugarcane starts elongating its stalks between June and October, extending rapidly. This stage occurs approximately 4–10 months after planting. NDVI reaches its peak during this period. |  |  |
| November to April (mature and harvest) | Sugarcane harvesting begins in November and continues until April of the following year. During this stage, NDVI starts to decrease, and the moisture content in sugarcane drops sharply. |  |  |
Table 2.
Quantitative assessment of the classification accuracy of the NBSI method and the two comparative methods.
Table 2.
Quantitative assessment of the classification accuracy of the NBSI method and the two comparative methods.
| Regions | Methods | OA | Kappa | F1 |
|---|---|---|---|---|
| DX | NBSI | 95.51 | 0.98 | 96.69 |
| RF | 93.21 | 0.93 | 95.59 | |
| SVM | 85.87 | 0.97 | 94.95 | |
| FS | NBSI | 96.47 | 0.94 | 95.37 |
| RF | 87.24 | 0.91 | 93.27 | |
| SVM | 94.47 | 0.89 | 91.51 | |
| JZ | NBSI | 96.37 | 0.93 | 94.83 |
| RF | 85.31 | 0.9 | 91.94 | |
| SVM | 94.2 | 0.91 | 92.51 | |
| LZ | NBSI | 95.48 | 0.96 | 95.58 |
| RF | 93.75 | 0.93 | 93.21 | |
| SVM | 94.78 | 0.86 | 93.63 | |
| NM | NBSI | 95.24 | 0.96 | 95.67 |
| RF | 92.96 | 0.84 | 91.41 | |
| SVM | 90.19 | 0.92 | 91.3 | |
| PX | NBSI | 97.53 | 0.94 | 95.58 |
| RF | 88.44 | 0.92 | 92.49 | |
| SVM | 92.22 | 0.96 | 90.47 | |
| TD | NBSI | 95.55 | 0.97 | 97.88 |
| RF | 93.26 | 0.93 | 93.47 | |
| SVM | 91.12 | 0.96 | 90.41 |
Disclaimer/Publisher’s Note: The statements, opinions and data contained in all publications are solely those of the individual author(s) and contributor(s) and not of MDPI and/or the editor(s). MDPI and/or the editor(s) disclaim responsibility for any injury to people or property resulting from any ideas, methods, instructions or products referred to in the content. |
© 2023 by the authors. Licensee MDPI, Basel, Switzerland. This article is an open access article distributed under the terms and conditions of the Creative Commons Attribution (CC BY) license (https://creativecommons.org/licenses/by/4.0/).
Share and Cite
MDPI and ACS Style
Liu, Y.; Ren, C.; Liang, J.; Zhou, Y.; Xue, X.; Ding, C.; Lu, J. A Robust Index Based on Phenological Features to Extract Sugarcane from Multisource Remote Sensing Data. Remote Sens. 2023, 15, 5783. https://doi.org/10.3390/rs15245783
AMA Style
Liu Y, Ren C, Liang J, Zhou Y, Xue X, Ding C, Lu J. A Robust Index Based on Phenological Features to Extract Sugarcane from Multisource Remote Sensing Data. Remote Sensing. 2023; 15(24):5783. https://doi.org/10.3390/rs15245783
Chicago/Turabian StyleLiu, Yuanyuan, Chao Ren, Jieyu Liang, Ying Zhou, Xiaoqin Xue, Cong Ding, and Jiakai Lu. 2023. "A Robust Index Based on Phenological Features to Extract Sugarcane from Multisource Remote Sensing Data" Remote Sensing 15, no. 24: 5783. https://doi.org/10.3390/rs15245783
Note that from the first issue of 2016, this journal uses article numbers instead of page numbers. See further details here.