Article

Comparison of Different Dimensional Spectral Indices for Estimating Nitrogen Content of Potato Plants over Multiple Growth Periods

1
Key Laboratory of Quantitative Remote Sensing in Agriculture of Ministry of Agriculture and Rural Affairs, Information Technology Research Center, Beijing Academy of Agriculture and Forestry Sciences, Beijing 100097, China
2
College of Agriculture, Nanjing Agricultural University, Nanjing 210095, China
3
College of Information and Management Science, Henan Agricultural University, Zhengzhou 450002, China
4
Key Lab of Smart Agriculture System, Ministry of Education, China Agricultural University, Beijing 100083, China
5
Key Laboratory of Agricultural Information Acquisition Technology, Ministry of Agriculture and Rural Affairs, China Agricultural University, Beijing 100083, China
6
Institute of Crop Sciences, Chinese Academy of Agricultural Sciences/Key Laboratory of Crop Physiology and Ecology, Ministry of Agriculture, Beijing 100081, China
*
Author to whom correspondence should be addressed.
These authors contributed equally to this work.
Remote Sens. 2023, 15(3), 602; https://doi.org/10.3390/rs15030602
Submission received: 22 November 2022 / Revised: 6 January 2023 / Accepted: 17 January 2023 / Published: 19 January 2023
(This article belongs to the Special Issue Recent Progress in UAV-AI Remote Sensing)

Abstract

:
The estimation of physicochemical crop parameters based on spectral indices depend strongly on planting year, cultivar, and growing period. Therefore, the efficient monitoring of crop growth and nitrogen (N) fertilizer treatment requires that we develop a generic spectral index that allows the rapid assessment of the plant nitrogen content (PNC) of crops and that is independent of year, cultivar, and growing period. Thus, to obtain the best indicator for estimating potato PNC, herein, we provide an in-depth comparative analysis of the use of hyperspectral single-band reflectance and two- and three-band spectral indices of arbitrary bands for estimating potato PNC over several years and for different cultivars and growth periods. Potato field trials under different N treatments were conducted over the years 2018 and 2019. An unmanned aerial vehicle hyperspectral remote sensing platform was used to acquire canopy reflectance data at several key potato growth periods, and six spectral transformation techniques and 12 arbitrary band combinations were constructed. From these, optimal single-, two-, and three-dimensional spectral indices were selected. Finally, each optimal spectral index was used to estimate potato PNC under different scenarios and the results were systematically evaluated based on a correlation analysis and univariate linear modeling. The results show that, although the spectral transformation technique strengthens the correlation between spectral information and potato PNC, the PNC estimation model constructed based on single-band reflectance is of limited accuracy and stability. In contrast, the optimal three-band spectral index TBI 5 (530,734,514) performs optimally, with coefficients of determination of 0.67 and 0.65, root mean square errors of 0.39 and 0.39, and normalized root mean square errors of 12.64% and 12.17% for the calibration and validation datasets, respectively. The results thus provide a reference for the rapid and efficient monitoring of PNC in large potato fields.

Graphical Abstract

1. Introduction

Studies have shown that yields in agricultural systems must increase 3% annually to meet the global demand for food due to the increasing population and decreasing amount of arable land [1,2]. However, the most widely grown crops globally (rice, wheat, and maize) are constrained by technology and rising costs and have limited room to continue increasing yields. In contrast, potato is a high yield and nutritional food crop rich and is gradually gaining popularity in more than 160 countries and regions due to its cold tolerance, drought resistance, and environmental adaptability. As a result, it has become the fourth largest food crop globally, and its yield and quality have become vital for ensuring world food security [3].
Nitrogen (N) is a critical component of structural molecules, such as chlorophyll, nucleic acids, and proteins, and is essential for potato quality and yield [4]. Plant nitrogen content (PNC) is an important indicator for assessing the N nutritional status of crops, and obtaining PNC information quickly and non-destructively is important for assessing crop N surplus or deficit and growth status, which aids fertilization management and decision-making in precision agriculture [5,6]. Traditional PNC measurement methods tend to combine manual sampling and laboratory chemical analysis, which is accurate and reliable but time-consuming and thus cannot meet the needs of contemporary precision agriculture for high-throughput, real-time monitoring of crop growth conditions [7]. Therefore, it is urgent to develop new platforms and technologies that allow for the low cost, efficient, and robust acquisition of crop phenotype status.
Remote sensing technology can rapidly capture the radiation from crop canopies over large distance scales and without contact. These data can then be analyzed and processed to obtain high-throughput phenotypic information on the crop canopy, which in turn provides technical support for the rapid and non-destructive monitoring of crop physical and chemical parameters [8,9]. Unmanned aerial vehicle (UAV) remote sensing technology provides high spatial and temporal resolution remote sensing images of crops over all growth periods at a lower cost and more conveniently and efficiently than is possible with satellite or ground remote sensing. This technique is thus more conducive to the real-time monitoring of crop growth conditions and provides a reference for field management and scientific decision-making in the field [10,11].
Vegetation indices (VIs) are indicators obtained by the mathematical transformation of two or more specific crop canopy reflectance bands that are simple in form and efficient in the calculation. VIs have thus become an essential tool for monitoring the N nutrient status of crops [12,13,14,15,16,17]. The results of existing studies have indicated that, although it is feasible to monitor the N nutrient status of crops based on VIs, some limitations remain, mainly in the inconsistency of N monitoring models constructed based on VIs from different periods due to the influence of seasons, growth periods, cultivars, and growth environment, preventing the generalization of the models [18,19,20]. These factors make it difficult to use optical remote sensing technology to monitor the PNC status of crops in multiple growth periods.
Improved computer performance and image processing technology have provided opportunities to solve these problems. For example, some researchers have introduced new variables, such as morphological parameters (e.g., plant height and cover) [21,22] and texture [23], to monitor the PNC status of crops over multiple growth periods. Simultaneously, sophisticated machine learning methods (e.g., neural networks, random forests, partial least squares support vector machines, etc.) [10,24,25] have also been used to construct PNC estimation models. These measures have achieved some results, but they also introduce problems. On the one hand, the increased technical threshold makes the use of this technology difficult for agricultural workers who are not specialized in remote sensing. On the other hand, the increased model complexity and production operation cost are not conducive to the development and integration of real-time crop PNC-detection devices, which limits the widespread use of these models.
The development of hyperspectral technology has made it possible to obtain high-throughput spectral information on crop canopies [26,27]. Some studies now focus on finding suitable spectral indices rather than using complex methods to improve the accuracy of VIs for estimating PNC in crops with multiple growth periods. For example, the double peak canopy nitrogen (N) index developed by Chen et al. [5] minimizes the interference of the leaf area index to accurately estimate the PNC of winter wheat and maize. Schlemmer et al. [28] showed that the MERIS terrestrial chlorophyll index provides more accurate estimates of canopy N and chlorophyll content in maize than the conventional VIs. Feng et al. [13] improved leaf N content by developing a water-resistance N index and widened the applicability of the model used to estimate leaf N content under different climatic conditions. Wang et al. [29] showed that combining wavelengths at 924, 703, and 423 nm attenuates the saturation of conventional VIs and enhances the stability and accuracy of the model used to estimate leaf N content. These studies suggest that high dimensional spectral indices, such as three-band spectral indices (TBIs), have a significant potential for estimating PNC over multiple crop growth periods [30]. However, to date, few studies have compared different dimensional spectral indices for estimating N-nutrient status over multiple growth periods. Moreover, unlike crops, such as wheat and maize, potato continuously transfers N to the tuber in all growth periods. Thus, it remains unknown whether existing remote sensing monitoring methods can be applied to potato. Therefore, it is essential to systematically investigate the use of spectral indices of differing dimensions for estimating PNC over multiple potato growth periods.
Thus, this study uses a UAV as a remote sensing platform to acquire hyperspectral images of potato at the bud emergence (S1), tuber formation (S2), tuber growth (S3), and starch accumulation (S4) periods over the years 2018 and 2019. We focus on single-, two-, and three-dimensional spectral indices: hyperspectral single-band reflectance, two- and three-band spectral indices with arbitrary band combinations, respectively, and systematically assess the accuracy of PNC estimates over multiple potato growth periods to determine the optimal indicators for monitoring the N-nutritional status of potato. The first goal of this study is to systematically evaluate the performance of single-, two-, and three-dimensional spectral indices for estimating potato PNC based on spectral transformation techniques and various combinations of optical bands. A second goal is to investigate the optimal spectral indices and models for estimating PNC of potato over different planting years, cultivars, and growth periods. The results of the study should improve the accuracy of PNC estimates of potato over multiple growth periods and provide a reference for developing and integrating PNC-detection devices for the accurate management of N in agricultural fields.

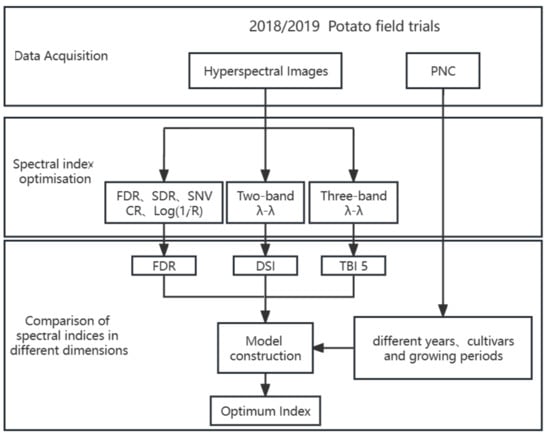
2. Materials and Methods

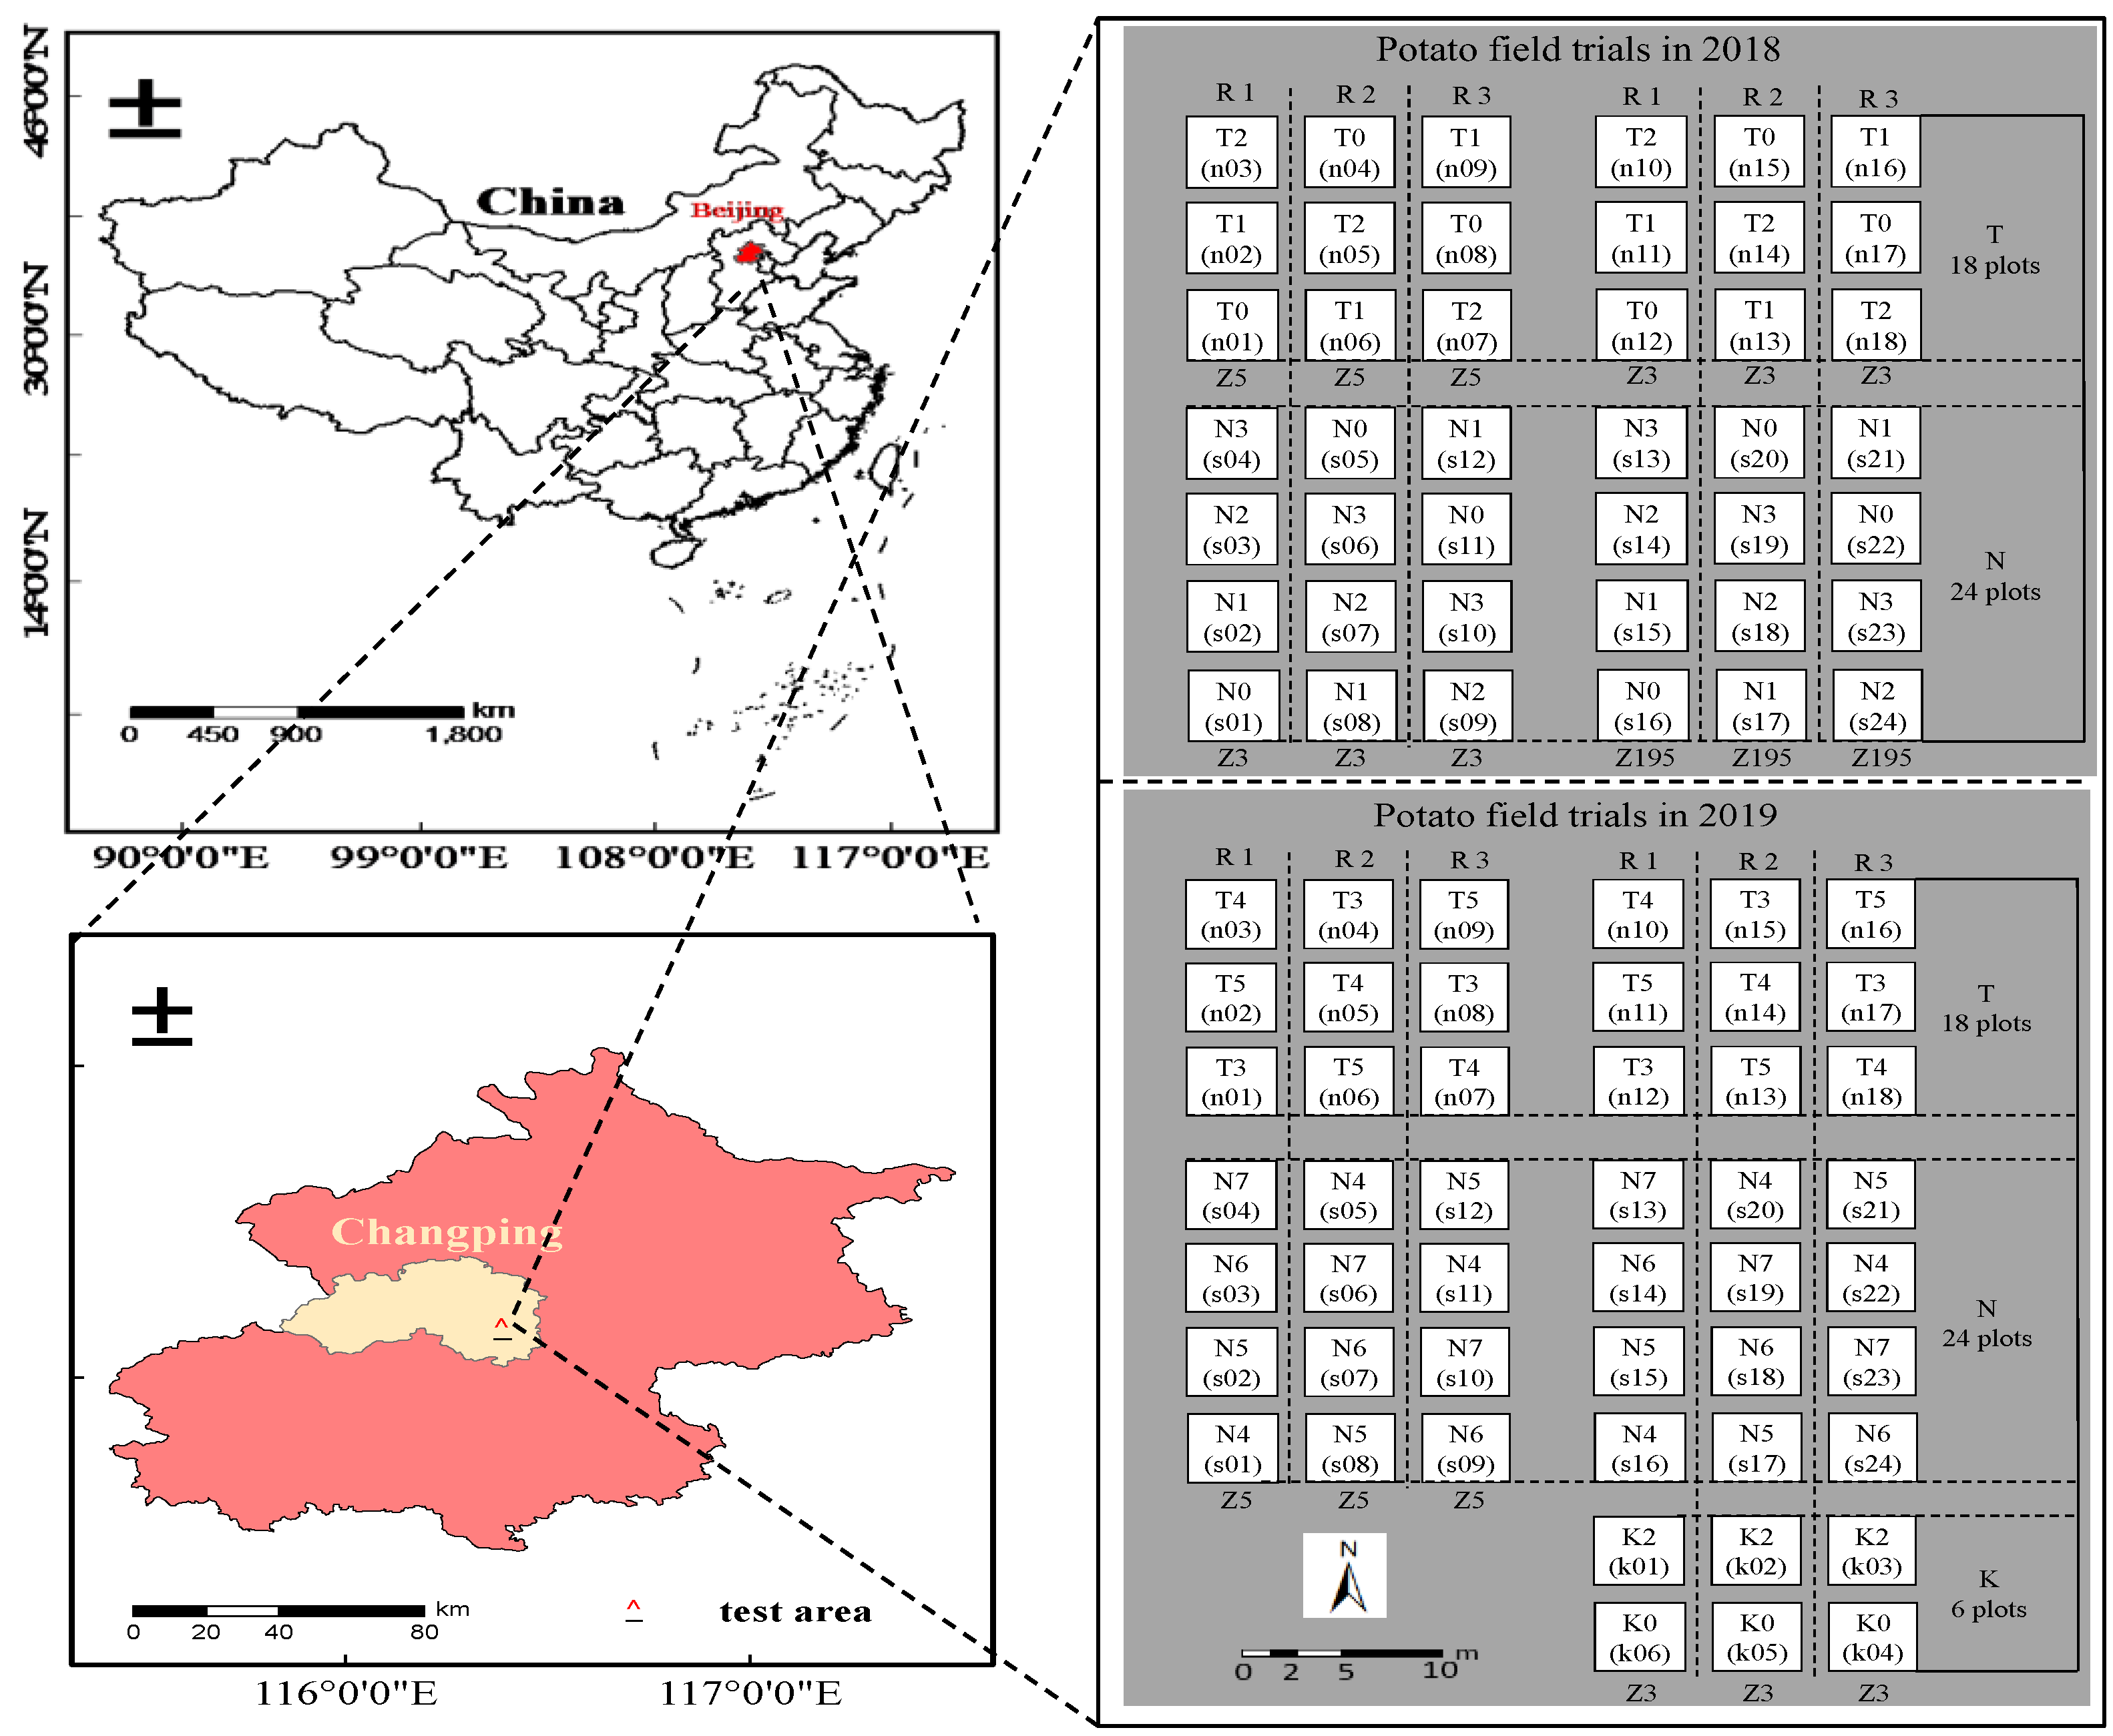
2.1. Experiment Design

Potato trials were conducted from April to July 2018 and 2019 at the National Precise Agriculture Research and Demonstration Base in Xiaotangshan Town, Changping District, Beijing, China (40°10′34″N, 116°26′39″E). The site has an average altitude of 36 m, an average annual rainfall of 644 mm, and a yearly average temperature of 11.8 °C. The climate is typically warm–temperate, semi-humid, continental monsoon. In the 2018 potato field trial, Zhongshu 5 (Z5) and Zhongshu 3 (Z3) were grown at different densities (T plots), and Zhongshu 195 (Z195) and Z3 were grown at different nitrogen fertilizers (N plots). The T Plots were treated with three densities: 63,000 plants/hm2 (T0), 72,000 plants/hm2 (T1), and 81,000 plants/hm2 (T2), with three replications of each treatment for a total of 18 plots. The N plots were treated with four nitrogen levels: 0 kg/hm2 urea (N0), 163.05 kg/hm2 urea (N1), 326.10 kg/hm2 urea (N2, normal treatment, 152.29 kg pure N), and 489.15 kg/hm2 urea (N3), with three replications of each treatment for a total of 24 plots. In the 2019 potato field trial, Z5 and Z3 were planted at different densities and with different nitrogen and potassium fertilizers (K plots). The T plots were treated with three density levels: 60,000 plants/hm2 (T3), 72,000 plants/hm2 (T4), and 84,000 plants/hm2 (T5), with three replications of each treatment for a total of 18 plots. The N plots were treated with four nitrogen levels: 0 kg/hm2 urea (N4), 244.65 kg/hm2 urea (N5), 489.15 kg/hm2 urea (N6, normal treatment, 228.43 kg pure N), and 733.50 kg/hm2 urea (N7), with three replications of each treatment for a total of 24 plots. K plots were treated with three potassium fertilizer treatments: 0 kg/hm2 potassium fertilizer (K0), 970.50 kg/hm2 potassium fertilizer (K1, the T plots and N plots received the K1 treatment), and 1941 kg/hm2 potassium fertilizer (K2), with three replications of each treatment for a total of six plots. In 2018 and 2019, we used 42 and 48 plots, respectively, and the area of each plot was 32.5 m2. Potato was grown by mulching, and field management included weeding, watering, and spraying. The location of the trial field and the trial profile are shown in Figure 1.

2.2. UAV Hyperspectral Data Acquisition and Processing

This study used the DJI M600 UAV with a UHD 185 imaging spectrometer from Cubert, Germany as the remote sensing platform to collect hyperspectral data during the periods of the potato bud emergence (15 May 2018, 13 May 2019), tuber formation (29 May 2018, 28 May 2019), tuber growth (5 June 2018, 10 June 2019), and starch accumulation (19 June 2018, 20 June 2019). The UHD 185 is a full-frame, real-time imaging airborne high speed imaging spectrometer with a spectral range of 450–950 nm, a sampling spectral interval of 4 nm, and a spectral resolution of 8 nm. It measures 195 mm × 67 mm × 60 mm and weighs 470 g. All UAV operations were conducted under windless, cloudless, and light stable conditions from 11:30 am to 1:30 pm local time. The UAV flight altitude was 20 m and its flight speed was about 1.5 m/s. To ensure the quality of the UAV hyperspectral images, the sampling interval of the hyperspectral sensor was set to 1 s, and the overlap of heading and side direction during the flight were set to 85% and 93%, respectively, which translates into a ground resolution of the acquired images of approximately 1.3 cm. Dark-current collection and whiteboard calibration were performed prior to collecting UAV hyperspectral data to ensure accurate reflectance data from the potato canopy at each growth period.
The UAV hyperspectral data were processed by geometric correction, image stitching, image fusion, and spectral data extraction. First, the surface reflectance was calibrated by making radiometric measurements of the digital values of the hyperspectral images based on black-and-white panel data. Second, the grayscale images were stitched together using the motion structure algorithm as implemented in the Agisoft Photoscan software (Agisoft, LLC, St. Petersburg, Russia). The hyperspectral cubes and grayscale images were then fused together by using the Cubert-Pilot software to obtain the complete hyperspectral images. Finally, the average hyperspectral reflectance of the region of interest was extracted from the vector data of each potato test plot using the ENVI 5.3 software.

2.3. Acquisition of Potato PNC Data

After completing the UAV flights, three potato plants representative of the overall plot growth were destructively sampled from each plot and rapidly transported to the laboratory in plastic bags to obtain ground truth PNC data. The samples were washed with running water, and the stems and leaves were separated and killed at 105 °C for 0.5 h and then dried at 80 °C to a constant weight. The dry matter mass of the stems and leaves was measured separately by using a high precision balance (0.0001 g). Finally, the nitrogen content of the stems and leaves was measured independently by using a Kjeldahl nitrogen tester, and the PNC data for each potato plot were calculated as follows:
PNC = LNC   ×   LDM + SNC   ×   SDM LDM + SDM
where LNC and SNC are the leaf N content and stem N content, respectively, and LDM and SDM are the leaf dry matter and stem dry matter, respectively.

2.4. Calculation of Spectral Index

Currently, most VIs used to monitor crop N status fall into three categories: normalized difference vegetation index, difference vegetation index, and ratio vegetation index. In addition, by adding a constant, soil-adjusted vegetation index is often used to estimate crop N nutrient status. VIs in the form of optimal vegetation indices and chlorophyll indices are also closely related to crop N status. We therefore selected six two-band spectral indices, namely normalized difference spectral index (NDSI), difference spectral index (DSI), ratio spectral index (RSI), soil-adjusted spectral index (SASI, L = 0.5), chlorophyll spectral index (CSI), and optimal spectral index (OSI), and used the “lambda-by-lambda” band-optimization algorithm to determine the optimal band combinations for estimating PNC over multiple potato growth periods. Considering the superior performance of TBIs for monitoring the physicochemical parameters of crops, six TBIs were constructed in this study. The optimal band combinations were also screened using the lambda-by-lambda band-optimization algorithm to investigate the use of TBIs for monitoring PNC in potato over multiple growth periods. This method produced the “optimal spectral indices.” Table 1 lists the two- and three-band spectral indices constructed in this study.

2.5. Model Construction and Validation

For this study, we collected a total of 360 sets of hyperspectral and PNC data over four potato growth periods in 2018 and 2019. Data from replicates 2 and 3 (240 sets) were used to construct a model to estimate potato PNC. Data from replicate 1 (120 sets) were used to verify the accuracy and stability of the model. Finally, the coefficient of determination (R2), the root mean square error (RMSE), and the normalized root mean square error (NRMSE) were calculated to quantitatively evaluate the accuracy and stability of the constructed estimation model.

3. Analysis of Results

3.1. PNC of Potato for Different Growth Periods and Years

Table 2 lists the mean, standard deviation (SD), and coefficient of variation (CV) of the PNC used for modeling and validation for different years and different potato growth periods. The PNC data obtained for each potato growth period have a significant coefficient of variation. In most growth periods, the standard deviation and coefficient of variation of the modeling and validation datasets follow similar trends, indicating that the data may be used for further analysis.

3.2. Correlation Analysis between PNC and Single-, Two-, and Three-Dimensional Spectral Indices

3.2.1. Correlation between Hyperspectral Single-Band Reflectance and PNC

Five spectral transformation techniques, namely the standard normal variate transform (SNVR) [40], the first derivative (FDR), the second derivative (SDR) [41], the logarithm of the reciprocal of the spectra, (Log(1/R)) [42], and continuous removal (CR) [43], were applied to the hyperspectral original reflectance (OR) to explore in depth the connection between hyperspectral single-band reflectance and PNC. The results of the analysis of the correlation between the six forms of single-band reflectance and potato PNC over multiple growth periods (Figure 2) show that FDR, SDR, and CR correlate more with PNC than with OR. In contrast, Log(1/R) and SNVR have the opposite or the same correlation as OR.
Table 3 shows the sensitive band intervals of different types of single-band reflectance with PNC and the locations of the most closely linked wavelengths. The spectral transformation technique can further exploit spectral information to enhance the linkage with PNC, and the wavelengths most closely correlated with PNC for different single-band reflectance are in the red- or green-edge regions.

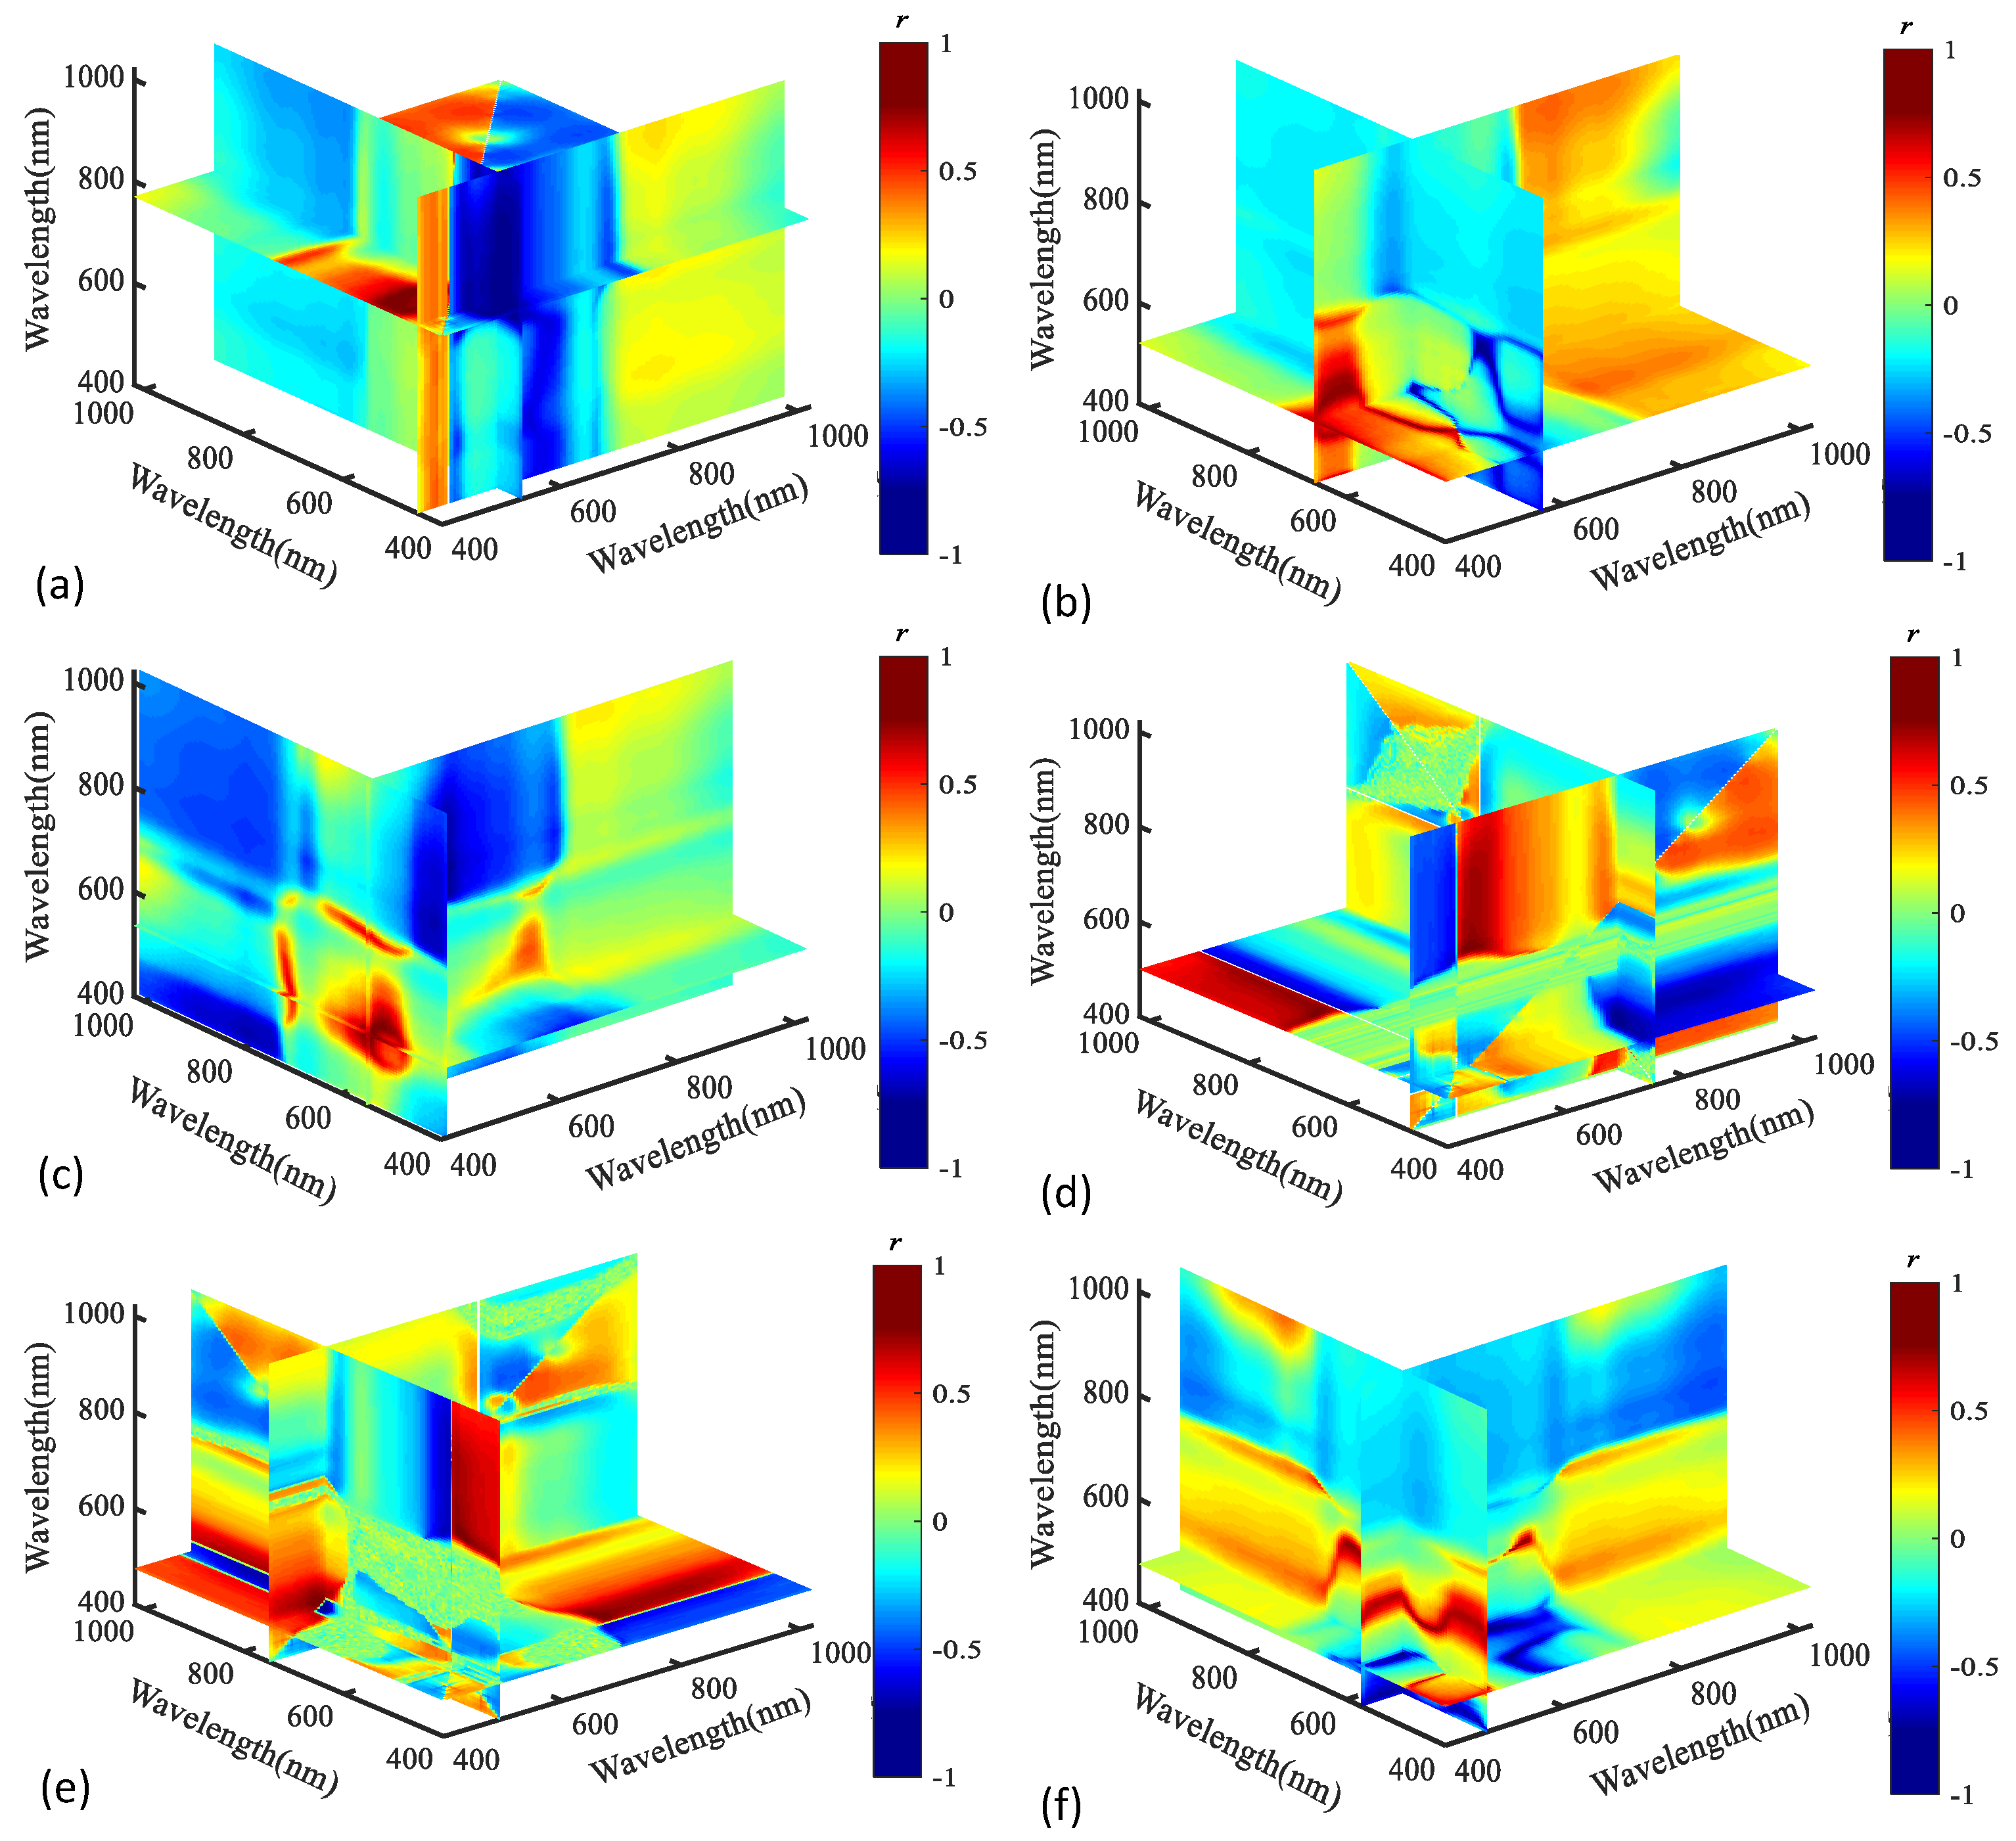
3.2.2. Association between Two-Band Spectral Indices and PNC

Based on the hyperspectral OR data, the lambda-by-lambda band-optimization algorithm was used to construct the six forms of the two-band spectral indices listed in Table 1. The contour maps of their coefficients of correlation with potato PNC are plotted in Figure 3. The results show that the correlation of OSI with PNC differs from that of other spectral indices. The spectral combinations of the various spectral indices that correlate optimally with PNC are NDSI (618,490), RSI (618,490), DSI (578,494), SASI (586,494), CSI (618,494), and OSI (586,490), corresponding to correlation coefficients of 0.62, 0.61, 0.74, 0.73, 0.62, and −0.72, respectively. The correlation of the six different forms of two-band spectral indices screened by PNC over multiple potato-growth periods is significantly greater than that of the hyperspectral single-band reflectance.

3.2.3. Correlation between Three-Band Spectral Indices and PNC

Based on the hyperspectral OR data, the six TBIs listed in Table 1 were constructed using the lambda-by-lambda band-optimization algorithm, and the contour maps of their correlation coefficients with potato PNC are plotted in Figure 4. These results show that the six different TBIs most closely correlated with potato PNC over the multiple growth periods are TBI1 (562,494,750), TBI2 (586,666,550), TBI3 (462,574,562), TBI4 (734,514,534), TBI5 (530,734,514), and TBI6 (510,590,514), corresponding to correlation coefficients of −0.76, −0.74, 0.70, −0.81, −0.82, and −0.62, respectively. The TBIs correlate more closely with the PNC of multiple potato-growth periods than the hyperspectral single-band reflectance and two-band spectral indices.

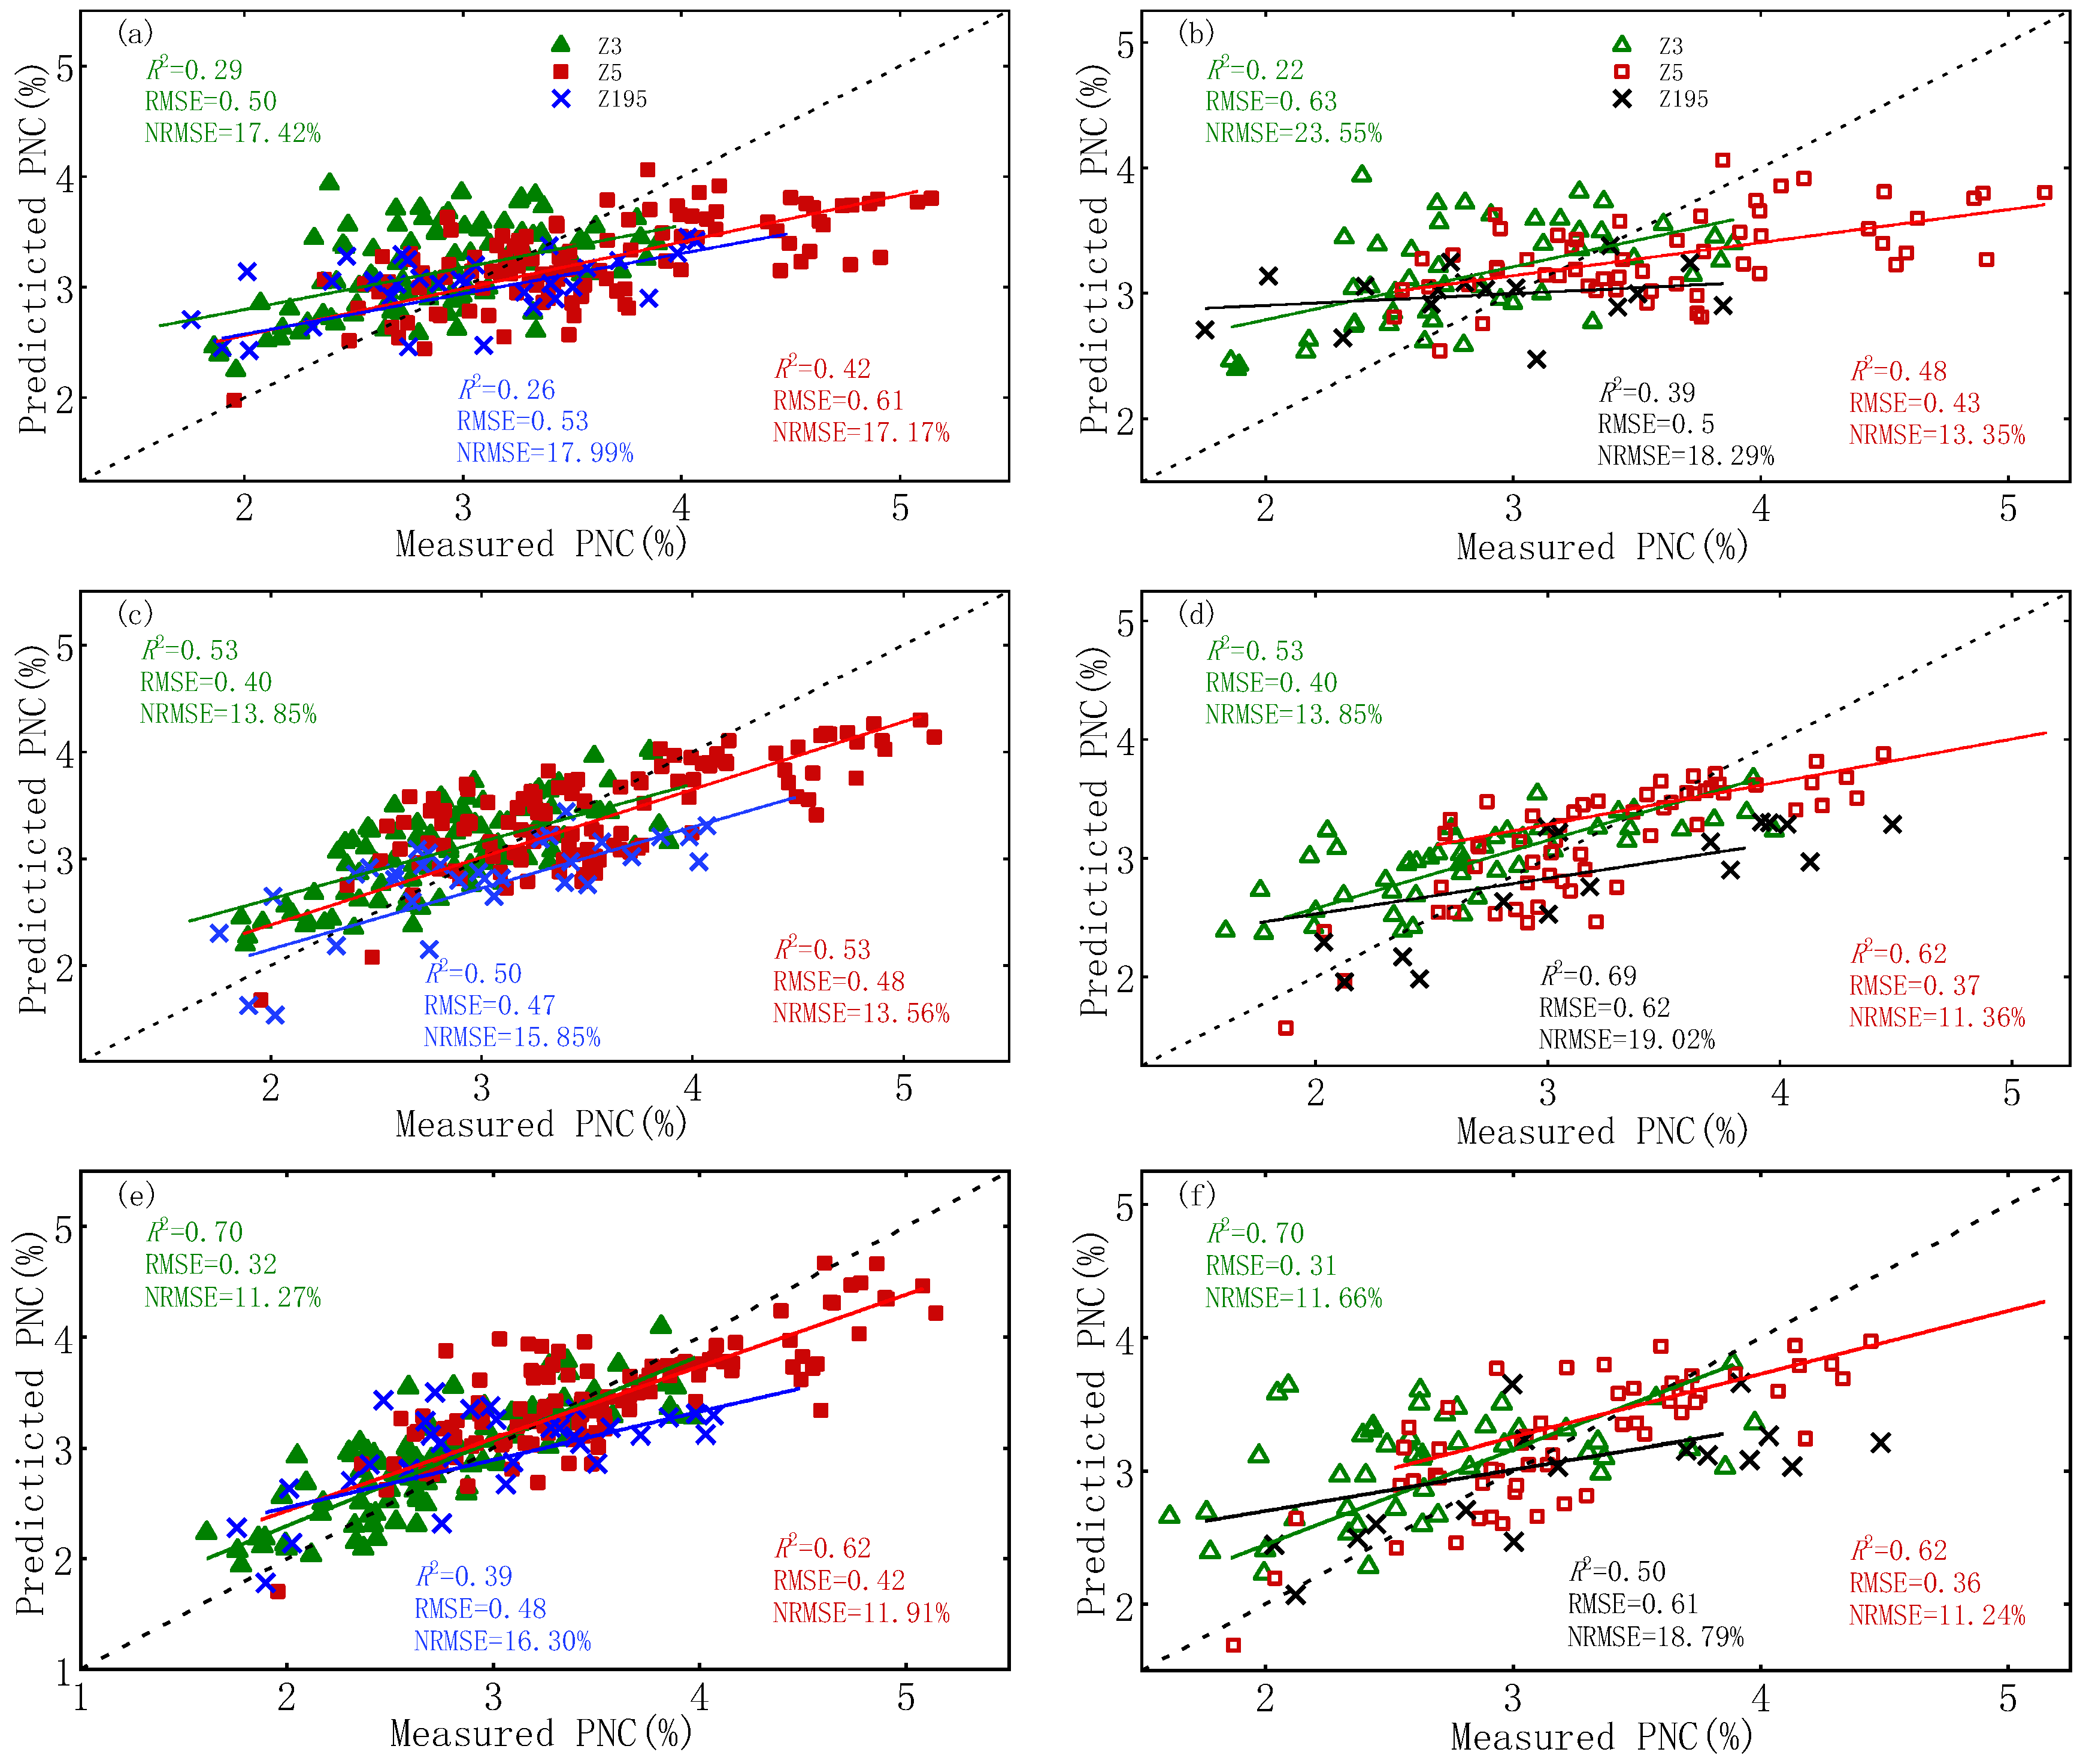
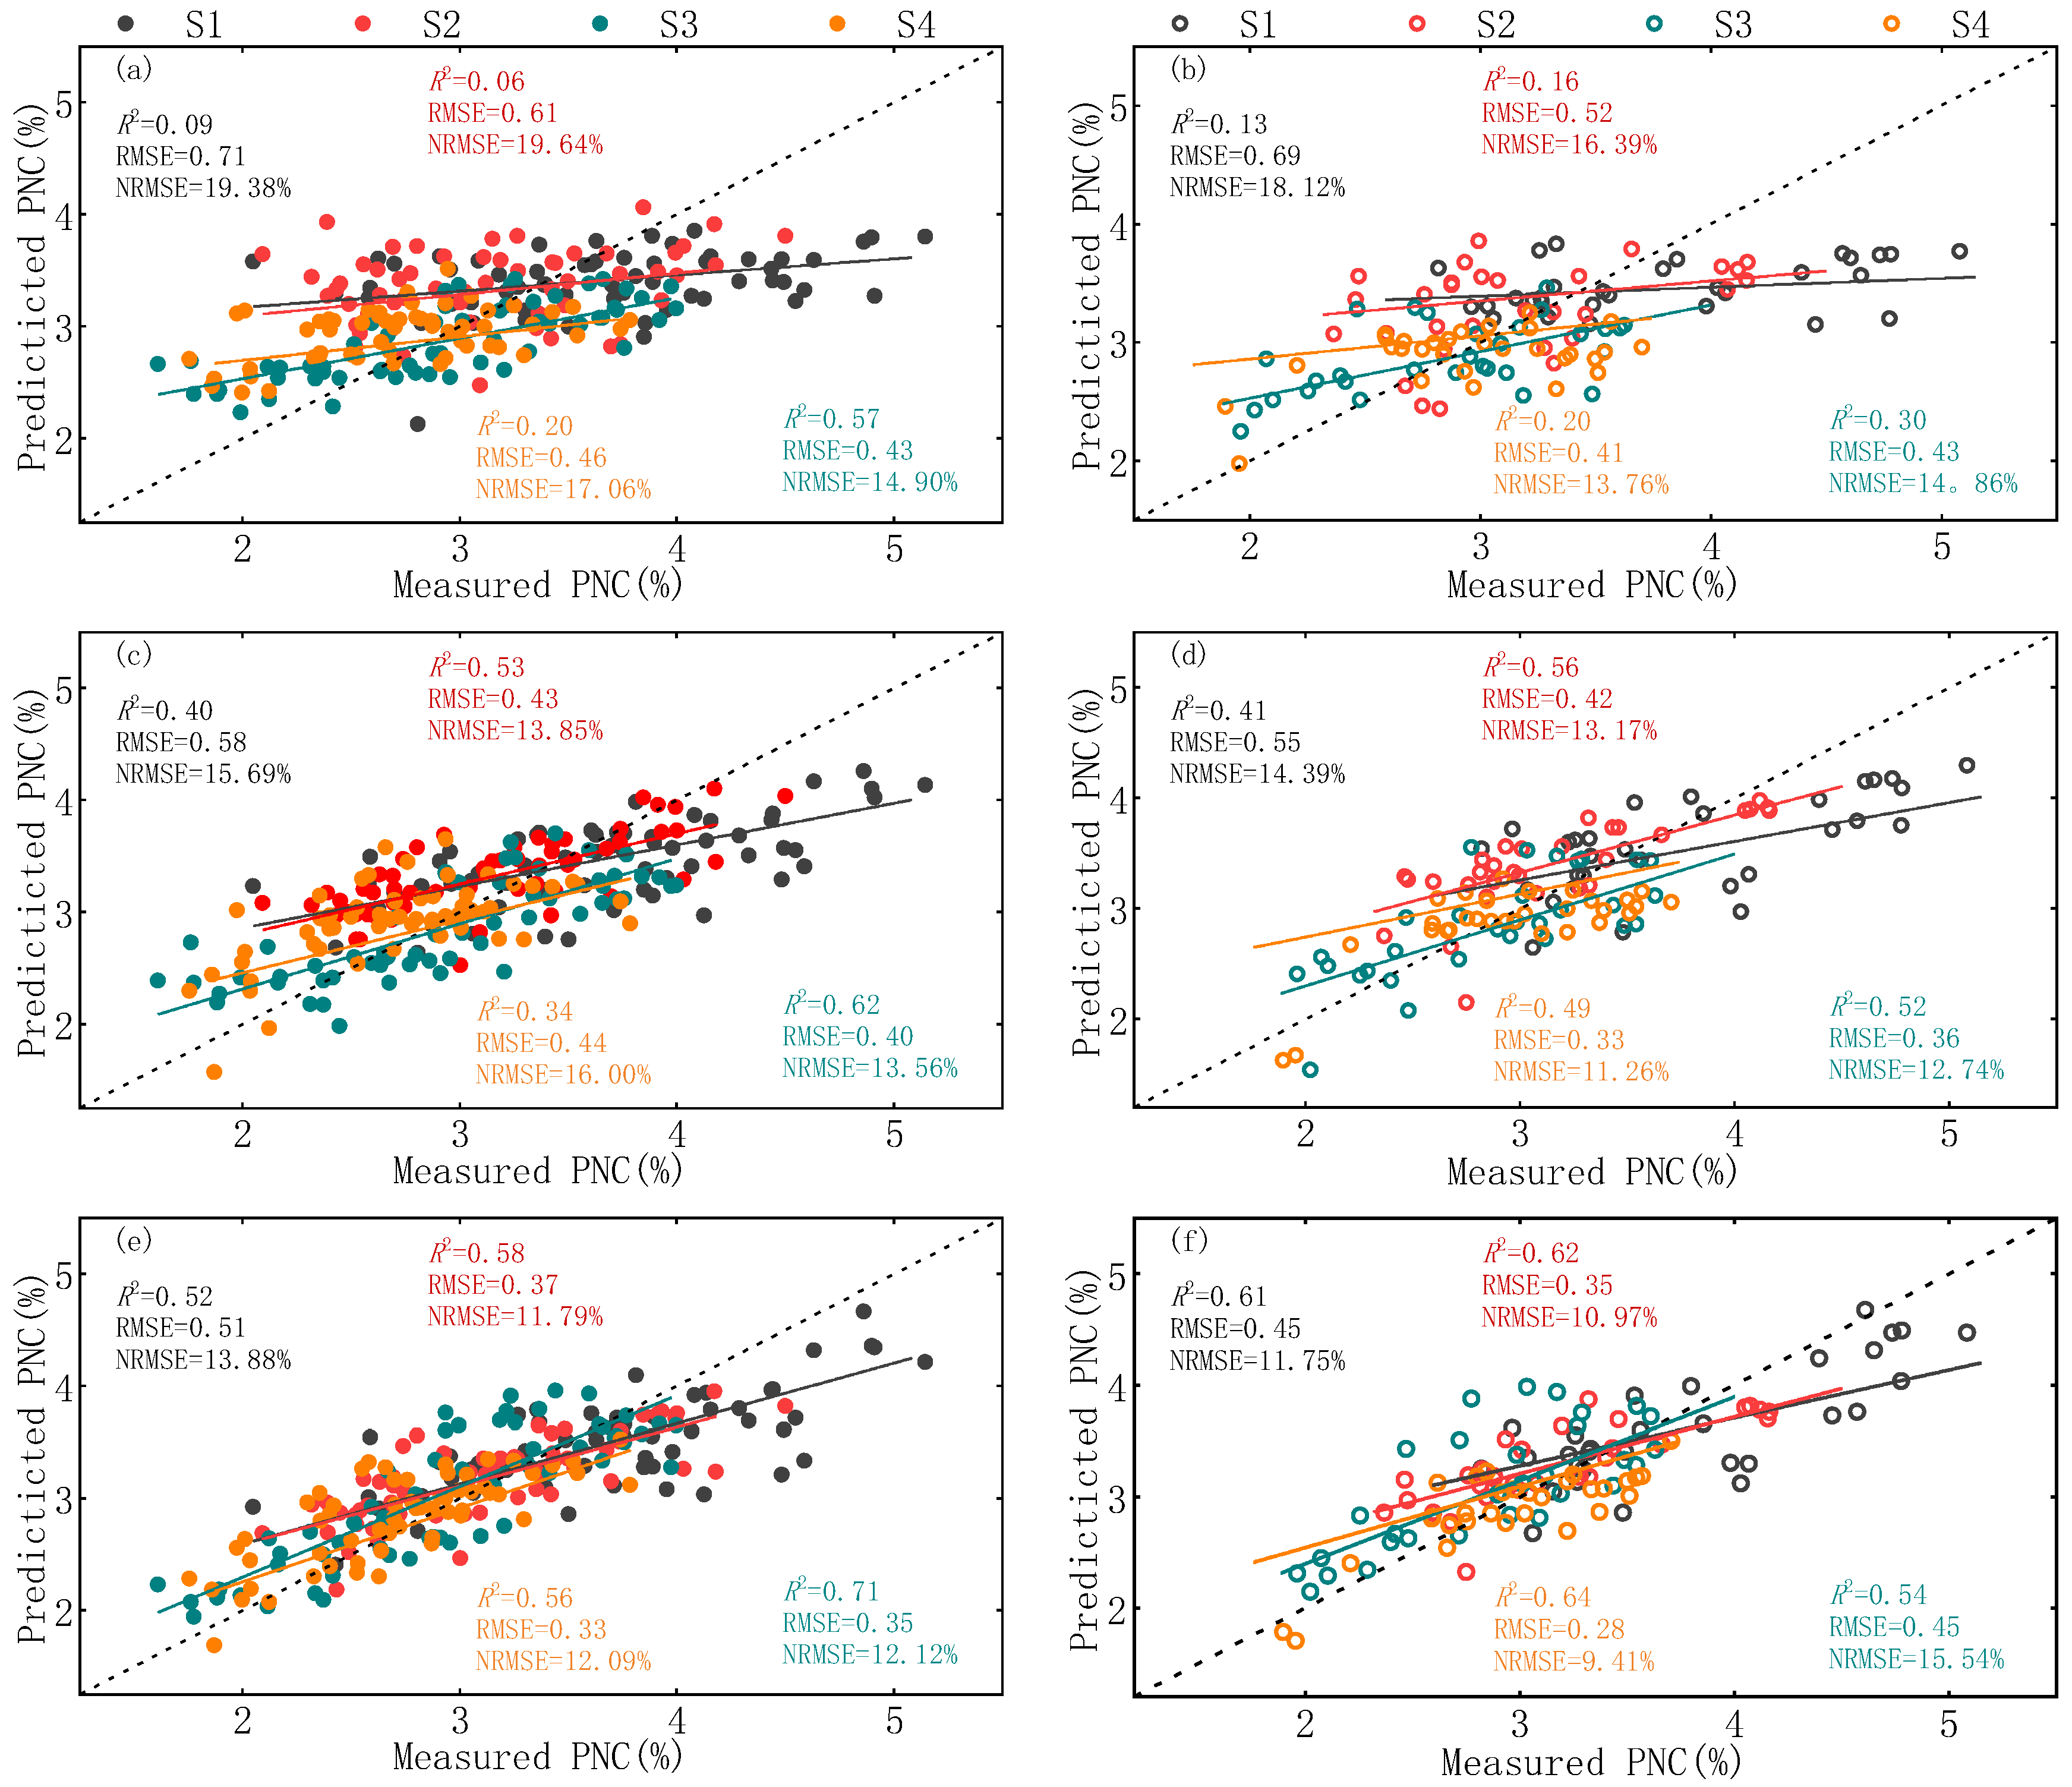
3.3. Estimation of Potato PNC Based on Single-, Two-, and Three-Dimensional Spectral Indices

Table 4 shows the band composition and correlation coefficients of the two- and three-band spectral indices that correlate most strongly with PNC over the multiple potato-growth periods. Table 3 and Table 4 show that FDR542, DSI (578,494), and TBI5 (530,734,514) correlate the most strongly with potato PNC.
Potato PNC estimation models were constructed using FDR542, DSI (578,494), and TBI5 (530,734, 514) as the optimal spectral indices to evaluate their suitability for estimating potato PNC over multiple growth periods. As shown in Figure 5, the PNC estimation model based on hyperspectral optimal single-band reflectance overestimates PNC at low-N levels and underestimates PNC at high-N levels when considering potato PNC data from different years, cultivars, and growth periods. Thus, the estimations are not sufficiently accurate. In contrast, the optimal two- and three-band hyperspectral indices correlate significantly more strongly with potato PNC than the hyperspectral single-band reflectance. In particular, the optimal three-band spectral index TBI5 (530,734,514) is the most strongly correlated with the PNC over multiple potato growth periods (r = −0.82). This PNC estimation model offers optimal accuracy and stability, with modeling and validation R2 values of 0.67 and 0.65, RMSE values of 0.39 and 0.39, and NRMSE values of 12.64% and 12.17%, respectively, and the underestimation and overestimation of potato PNC were significantly improved.

3.4. Using Spectral Indices to Estimate PNC: Effect of Year, Cultivar, and Growth Period

Numerous studies show that planting year, cultivar, and growth period significantly affect the suitability of spectral indices for estimating crop N nutrient status. Therefore, to more comprehensively evaluate the suitability of the three optimal spectral indices for estimating potato PNC, we compare and analyze the use of FDR542, DSI (578,494), and TBI5 (530,734,514) for estimating potato PNC over different planting years, cultivars, and growth periods. Figure 6 shows the results of using the three optimal spectral indices to estimate potato PNC over different years. The modeling and validation results show that the model constructed from FDR542 significantly overestimates or underestimates in the validation data. Compared with FDR542, the model constructed from DSI (578,494) provides better results for the different years, but the accuracy and stability of the model need to be further enhanced. The PNC estimation model constructed from TBI5 (530,734,514) produces stable and accurate results compared with the FDR542 and DSI (578,494) models, with R2 = 0.40 and 0.82, RMSE = 0.46 and 0.31, and NRMSE = 14.95% and 9.40% for the 2018 and 2019 validation data, respectively. The measured and predicted values for each sample point are more evenly distributed around the 1:1 line, indicating that the model may be applied to different years. In addition, all three optimal spectral indices constructed for estimating potato PNC produce more accurate estimates in 2019 than in 2018, indicating that the constructed models are more applicable in 2019.
Figure 7 shows the accuracy of the three optimal spectral indices for estimating PNC in different potato cultivars. The modeling and validation results show that FDR542 does not accurately estimate PNC for any of the three potato cultivars, and the stability of the constructed model needs further improvement. More specifically, the PNC of cultivar Z3 is overestimated, and that of Z5 is underestimated. Compared with FDR542, the PNC estimation model constructed from DSI (578,494) produces more accurate PNC estimates for the different potato cultivars, and the stability of the model is improved. Finally, the potato PNC estimation model based on TBI5 (530,734,514) produces the most accurate PNC estimates for all three different cultivars, and the model is more stable than those based on FDR542 and DSI (578,494). For the TBI5 (530,734,514) model, the modeling and validation R2 values for the Z3 potato cultivar are 0.70 and 0.70, the RMSE values are 0.32 and 0.31, and the NRMSE values are 11.27% and 11.66%, respectively. For the Z5 cultivar, the values are R2 = 0.62 and 0.62, RMSE = 0.42 and 0.36, and NRMSE = 11.91% and 11.24%, respectively, and for the Z195 cultivar, the values are R2 = 0.39 and 0.50, RMSE = 0.48 and 0.61, and NRMSE = 16.30% and 18.79%, respectively. The combined modeling and validation results show that the potato PNC estimation models constructed by the three optimal spectral indices are more applicable for both the Z3 and Z5 cultivars than for the Z195 cultivar.
Figure 8 shows the accuracy of the three optimal spectral indices for estimating PNC in different potato growth periods. Figure 8a,b show that the PNC estimation model constructed from FDR542 for the multiple potato growth periods produces accurate PNC estimates only in S3 but inaccurate PNC estimates in the other three growth periods. Figure 8c,d indicate that, compared with FDR542, the PNC estimation model constructed from DSI (578,494) produces more accurate PNC estimates for all four growth periods. The most accurate PNC estimate is for growth period S3, which has modeling and validation R2 values of 0.62 and 0.52, RMSE values of 0.40 and 0.36, and NRMSE values of 13.56% and 12.74%, respectively. Figure 8e,f show that the PNC estimation model built from TBI5 (530,734,514) produces the most accurate PNC estimates of the three spectral indices for all potato growth periods. The best estimates are for growth period S3, which has modeling and validation R2 values of 0.71 and 0.54, RMSE values of 0.35 and 0.45, and NRMSE values of 12.12% and 15.54%, respectively. The poorest estimates are for growth period S1, which has modeling and validation R2 values of 0.52 and 0.61, RMSE values of 0.51 and 0.45, and NRMSE values of 13.88% and 11.75%, respectively. The combined modeling and validation results show that the PNC estimation models constructed from the three optimal spectral indices all work best in S3 and poorly in S1.

4. Discussion

4.1. Selecting Optimal Spectral Indices in Different Dimensions

The abundance of hyperspectral sensor bands provides a large amount of information on crop canopy conditions, and combining various bands greatly expands their usefulness for monitoring the physical and chemical parameters of crops. Furthermore, the accuracy of estimates of crop physical and chemical parameters can be improved by using multiple linear regression or complex machine learning algorithms based on multiple spectral indices. However, increasing the number of variables and the modeling complexity increases the computational cost and application threshold of the model [13]. Agricultural workers who lack professional mathematical and statistical knowledge and remote sensing skills prefer to use a single spectral index to estimate the N status of crops over multiple growth periods, an approach that is also more conducive to the integration and development of N-monitoring devices [12,32]. Therefore, this study investigates the use of single-, two-, and three-dimensional spectral indices for estimating, via a linear regression method, potato PNC over multiple growth periods.
For hyperspectral single-band reflectance, five spectral transformation techniques, i.e., FDR, Log(1/R), SNVR, SDR, and CR, are used to process the OR data. The reasons for this are as follows: (1) FDR and SDR not only eliminate the effect of background, but also resolve overlapping signals and enhance dark peaks, which improves the sensitivity of spectral features to crop physicochemical parameters [44]. (2) Log(1/R) highlights the spectral differences in the visible and makes spectral reflectance less sensitive to variations in light intensity [42]. (3) SNVR eliminates the dependence of hyperspectral reflectance on solid particles and surface scattering and improves the extraction accuracy of spectral information. (4) CR highlights the location of the feature band, which facilitates its selection.
The results in Figure 2 show that using the spectral transformation technique for OR facilitates the deep mining of practical spectral information, which provides a more comprehensive reference for monitoring potato PNC based on hyperspectral single-band reflectance. Twelve two- and three-band spectral indices, based on spectral indices that have been reported to indicate the crop N status, are constructed by using the lambda-by-lambda band-optimization algorithm. The lambda-by-lambda algorithm considers all possible combinations of bands from 450 to 950 nm, which improves the robustness and accuracy of estimates of vegetation properties [45,46]. To investigate the best indicator of potato PNC, this study investigates the accuracy of estimation models constructed from spectral indices based on hyperspectral reflectance or two- or three-band combinations for estimating potato PNC over different years, cultivars, and growth periods.

4.2. Comparison of Sensitive Wavelengths

Table 3 and Table 4 show that the spectral index wavelengths sensitive to potato PNC are all in the visible, which is because N is primarily present in the crop in the form of chlorophyll and proteins [47,48], and chlorophyll reflects mainly in the visible region (400–700 nm). Therefore, the visible region correlates more strongly with crop PNC [4]. More specifically, the wavelengths at which single-band reflectance is sensitive to PNC over multiple potato growth periods are all located in the red-edge (670–740 nm) or green-edge (502–554 nm) and most of the sensitive wavelengths of the three-band spectral indices also include these spectral regions. In contrast, the sensitive wavelengths of the six two-band spectral indices all contain the 490–494 nm band, which is consistent with the results of Hansen and Schjoerring, Pettersson and Eckersten, and Sun et al. [12,49,50] This is because different treatments (density and N and K fertilization) lead to different potato PNC, which is more evident in the green-and red-edge due to the strong absorption and reflection of chlorophyll. Thus, these spectral regions provide a good indication of the PNC. In addition, the 490–494 nm band is in the absorption band of chlorophyll and carotenoids [51] and N is an essential component of chlorophyll and protein, so this band correlates strongly with PNC.

4.3. Comparison of Single-, Two-, and three-Dimensional Spectral Indices for Estimating Potato PNC

To investigate the use of single-, two-, and three-dimensional spectral indices for estimating potato PNC, this study presents an in-depth comparison of hyperspectral single-band reflectance and two- and three-band spectral indices for estimating PNC over different years, cultivars, and growth periods. Consistent with the results of Li and Yu et al. [52,53], this study reveals the significant effects of planting year, cultivar, and growth period on the ability of spectral indices to estimate PNC. In addition, cultivar and growth period more strongly affect PNC estimates than the planting year. This result confirms the importance of exploring generic spectral indices across years, cultivars, and growth periods to ensure accurate estimates of the PNC to monitor the N status of crops. The discussion in Section 3.4 shows that, for potato PNC data from different years, cultivars, and growth periods, the PNC estimation model constructed from single-band reflectance is less accurate and stable. In contrast, the model constructed from the three-band spectral index produces the most accurate and stable PNC estimates over different years, cultivars, and growth periods. Several reasons may be invoked to explain this result: (1) Although spectral transformation techniques such as FDR can improve the correlation between spectra and potato PNC, the information available from single-band reflectance is limited and cannot effectively reflect the dynamic variations in PNC. (2) Compared with the two-band spectral indices, the red-edge and green-edge regions included in the three-band spectral indices carry more information related to PNC [54,55], effectively enhancing the correlation between spectral indices and PNC and improving the accuracy of PNC estimation.
The estimation results for different years (Figure 6) show that the estimation models constructed from the three optimal spectral indices are more accurate in 2019 than in 2018, which may be due to (1) the larger number of samples in 2019 than in 2018, and (2) the greater number of potato cultivars planted in 2018, which requires higher demands on the generality of the models. The PNC estimation results of different cultivars (Figure 7) show that the models constructed by the three optimal spectral indices produce more accurate PNC estimates for Z3 and Z5, whereas the estimates for Z195 are mediocre. This is because Z195 was planted only for a single year, so it has a small sample size and thus contributes less to the modeling. The estimation results of different growth periods (Figure 8) show that the models constructed from the three optimal spectral indices produce the most (least) accurate estimates for growth period S3 (S1). The PNC is underestimated in S1 because the potato plants were still small and the vegetation cover was low, so the difference in the extracted spectral information was slight and perturbed by soil factors. Therefore, the estimation accuracy was poor during this period. In contrast, the potato plants were thriving and the leaves were extended in S3 when the potato were in the closed monopoly state, so the spectral reflectance was less perturbed by soil and other factors and thus better reflected the potato PNC.

4.4. Implications for Future Study

This study investigates the performance of single-, two-, and three-dimensional spectral indices for estimating PNC by using the spectral transformation technique and the lambda-by-lambda band-optimization algorithm based on UAV hyperspectral data of potato over different years and multiple growth periods. The results show that TBI 5 (530,734,514) may be used for different types of potato PNC data and can serve as a reference for the development and integration of rapid N-monitoring devices. In addition, the constituent bands of TBI 5(530,734,514) are also available from existing hyperspectral satellites, such as ZY-1 02D, 02E, and GF5. With the development and maturation of hyperspectral satellite technology, the spatiotemporal resolution is continuously improving, and large area crop N-nutrient monitoring is gradually becoming possible. Therefore, the spectral index TBI 5 (530,734,514) has a strong potential for use in large area PNC monitoring based on hyperspectral satellite platforms.
Although this study used data from two years, three cultivars, and four growth periods to construct the potato PNC estimation models, the effects of different cultivation environments on the spectral indices for estimating PNC should also be considered. Therefore, the reliability and adaptability of the optimal spectral indices should be studied in more regions with differing ecology. In addition, although six forms of hyperspectral single-band reflectance were used in this study and 12 forms of band combinations that are widely used and proven to be effective were screened separately, more spectral transformation methods and band combinations should be investigated to determine their response to potato PNC.

5. Conclusions

This study uses six hyperspectral single-band reflectance and 12 band-combination indices to develop optimal spectral indices of single-, two-, and three-dimensions. Quantitative models to estimate potato PNC over multiple growth periods are then established based on these optimal spectral indices. The results show that (1) the red-edge and green-edge spectral correlate strongly with the N status of potato, which provide relevant information for the rapid and accurate estimation of potato PNC. (2) Although the spectral transformation technique can enhance the correlation between spectral information and PNC, the PNC estimation model based on the optimal single-band reflectance produces less accurate and stable results over different years, cultivars, and growth periods. (3) Compared with the optimal two-band spectral index, the PNC estimation model constructed from the optimal three-band spectral index TBI5 (530,734,514) is more accurate and stable. This index may thus be used to estimate potato PNC over different years, cultivars, and growth periods. The results of this study can thus be used to design fast and efficient N diagnostic systems and enhance the linkage between UAV and satellite sensors to provide technical support for the large area nitrogen monitoring of potato crops.

Author Contributions

H.F., X.X., G.Y. and J.Y. designed the experiments. H.F., Y.L., Y.M. and X.S. collected the AGB, CH, and UAV hyperspectral images. Y.F. and H.F. analyzed the data and wrote the manuscript. X.J. and J.Y. made comments and revised the manuscript. All authors have read and agreed to the published version of the manuscript.

Funding

This study was supported by the Key scientific and technological projects of Heilongjiang province (2021ZXJ05A05), the National Natural Science Foundation of China (41601346), the Platform Construction Funded Program of Beijing Academy of Agriculture and Forestry Sciences (No.PT2022-24), and the Key Field Research and Development Program of Guangdong Province (2019B020216001).

Data Availability Statement

Not applicable.

Acknowledgments

We thanks to Weiguo Li, Hong Chang, Yang Meng, and Yu Zhao for field management and data collection. We thank the National Precision Agriculture Experiment Station for providing the test site and employees.

Conflicts of Interest

The authors declare no conflict of interest.

References

  1. Niu, Y.; Zhang, L.; Zhang, H.; Han, W.; Peng, X. Estimating Above-Ground Biomass of Maize Using Features Derived from UAV-Based RGB Imagery. Remote Sens. 2019, 11, 1261. [Google Scholar] [CrossRef] [Green Version]
  2. Thorp, K.R.; Gore, M.A.; Andrade-Sanchez, P.; Carmo-Silva, A.E.; Welch, S.M.; White, J.W.; French, A.N. Proximal hyperspectral sensing and data analysis approaches for field-based plant phenomics. Comput. Electron. Agric. 2015, 118, 225–236. [Google Scholar] [CrossRef] [Green Version]
  3. Li, B.; Xu, X.; Zhang, L.; Han, J.; Bian, C.; Li, G.; Liu, J.; Jin, L. Above-ground biomass estimation and yield prediction in potato by using UAV-based RGB and hyperspectral imaging. ISPRS J. Photogramm. Remote Sens. 2020, 162, 161–172. [Google Scholar] [CrossRef]
  4. Fu, Y.; Yang, G.; Pu, R.; Li, Z.; Li, H.; Xu, X.; Song, X.; Yang, X.; Zhao, C. An overview of crop nitrogen status assessment using hyperspectral remote sensing: Current status and perspectives. Eur. J. Agron. 2021, 124, 126241. [Google Scholar] [CrossRef]
  5. Chen, P.; Haboudane, D.; Tremblay, N.; Wang, J.; Vigneault, P.; Li, B. New spectral indicator assessing the efficiency of crop nitrogen treatment in corn and wheat. Remote Sens. Environ. 2010, 114, 1987–1997. [Google Scholar] [CrossRef]
  6. Kefauver, S.C.; Vicente, R.; Vergara-Díaz, O.; Fernandez-Gallego, J.A.; Kerfal, S.; Lopez, A.; Melichar, J.P.E.; Serret Molins, M.D.; Araus, J.L. Comparative UAV and Field Phenotyping to Assess Yield and Nitrogen Use Efficiency in Hybrid and Conventional Barley. Front. Plant Sci. 2017, 8, 1733. [Google Scholar] [CrossRef] [PubMed]
  7. Zhang, H.; Du, H.; Zhang, C.; Zhang, L. An automated early-season method to map winter wheat using time-series Sentinel-2 data: A case study of Shandong, China. Comput. Electron. Agric. 2021, 182, 105962. [Google Scholar] [CrossRef]
  8. Battude, M.; Al Bitar, A.; Morin, D.; Cros, J.; Huc, M.; Sicre, C.M.; Le Dantec, V.; Demarez, V. Estimating maize biomass and yield over large areas using high spatial and temporal resolution Sentinel-2 like remote sensing data. Remote Sens. Environ. 2016, 184, 668–681. [Google Scholar] [CrossRef]
  9. Clevers, J.G.P.W.; Kooistra, L. Using Hyperspectral Remote Sensing Data for Retrieving Canopy Chlorophyll and Nitrogen Content. IEEE J. Sel. Top. Appl. Earth Obs. Remote Sens. 2012, 5, 574–583. [Google Scholar] [CrossRef]
  10. Yue, J.; Feng, H.; Yang, G.; Li, Z. A Comparison of Regression Techniques for Estimation of Above-Ground Winter Wheat Biomass Using Near-Surface Spectroscopy. Remote Sens. 2018, 10, 66. [Google Scholar] [CrossRef]
  11. Bendig, J.; Yu, K.; Aasen, H.; Bolten, A.; Bennertz, S.; Broscheit, J.; Gnyp, M.L.; Bareth, G. Combining UAV-based plant height from crop surface models, visible, and near infrared vegetation indices for biomass monitoring in barley. Int. J. Appl. Earth Obs. Geoinf. 2015, 39, 79–87. [Google Scholar] [CrossRef]
  12. Sun, H.; Feng, M.; Yang, W.; Bi, R.; Sun, J.; Zhao, C.; Xiao, L.; Wang, C.; Kubar, M.S. Monitoring Leaf Nitrogen Accumulation With Optimized Spectral Index in Winter Wheat Under Different Irrigation Regimes. Front. Plant Sci. 2022, 13, 913240. [Google Scholar] [CrossRef] [PubMed]
  13. Feng, W.; Zhang, H.-Y.; Zhang, Y.-S.; Qi, S.-L.; Heng, Y.-R.; Guo, B.-B.; Ma, D.-Y.; Guo, T.-C. Remote detection of canopy leaf nitrogen concentration in winter wheat by using water resistance vegetation indices from in-situ hyperspectral data. Field Crop. Res. 2016, 198, 238–246. [Google Scholar] [CrossRef]
  14. Yao, X.; Ren, H.; Cao, Z.; Tian, Y.; Cao, W.; Zhu, Y.; Cheng, T. Detecting leaf nitrogen content in wheat with canopy hyperspectrum under different soil backgrounds. Int. J. Appl. Earth Obs. Geoinf. 2014, 32, 114–124. [Google Scholar] [CrossRef]
  15. Osco, L.P.; Junior, J.M.; Ramos, A.; Furuya, D.; Teodoro, P.E. Leaf Nitrogen Concentration and Plant Height Prediction for Maize Using UAV-Based MultispectralImagery and Machine Learning Techniques. Remote Sens. 2020, 12, 3237. [Google Scholar] [CrossRef]
  16. Qiu, Z.; Ma, F.; Li, Z.; Xu, X.; Ge, H.; Du, C. Estimation of nitrogen nutrition index in rice from UAV RGB images coupled with machine learning algorithms. Comput. Electron. Agric. 2021, 189, 106421. [Google Scholar] [CrossRef]
  17. Zheng, H.; Cheng, T.; Li, D.; Zhou, X.; Yao, X.; Tian, Y.; Cao, W.; Zhu, Y. Evaluation of RGB, Color-Infrared and Multispectral Images Acquired from Unmanned Aerial Systems for the Estimation of Nitrogen Accumulation in Rice. Remote Sens. 2018, 10, 824. [Google Scholar] [CrossRef] [Green Version]
  18. Liu, Y.; Feng, H.; Yue, J.; Li, Z.; Yang, G.; Song, X.; Yang, X.; Zhao, Y. Remote-sensing estimation of potato above-ground biomass based on spectral and spatial features extracted from high-definition digital camera images. Comput. Electron. Agric. 2022, 198, 107089. [Google Scholar] [CrossRef]
  19. Yue, J.; Guo, W.; Yang, G.; Zhou, C.; Feng, H.; Qiao, H. Method for accurate multi-growth-stage estimation of fractional vegetation cover using unmanned aerial vehicle remote sensing. Plant Methods 2021, 17, 1–16. [Google Scholar] [CrossRef]
  20. Yue, J.; Yang, G.; Tian, Q.; Feng, H.; Xu, K.; Zhou, C. Estimate of winter-wheat above-ground biomass based on UAV ultrahigh-ground-resolution image textures and vegetation indices. ISPRS J. Photogramm. Remote Sens. 2019, 150, 226–244. [Google Scholar] [CrossRef]
  21. Lu, J.; Cheng, D.; Geng, C.; Zhang, Z.; Xiang, Y.; Hu, T. Combining plant height, canopy coverage and vegetation index from UAV-based RGB images to estimate leaf nitrogen concentration of summer maize. Biosyst. Eng. 2021, 202, 42–54. [Google Scholar] [CrossRef]
  22. Fan, Y.; Feng, H.; Jin, X.; Yue, J.; Liu, Y.; Li, Z.; Feng, Z.; Song, X.; Yang, G. Estimation of the nitrogen content of potato plants based on morphological parameters and visible light vegetation indices. Front. Plant Sci. 2022, 13, 1012070. [Google Scholar] [CrossRef] [PubMed]
  23. Fu, Y.; Yang, G.; Li, Z.; Song, X.; Li, Z.; Xu, X.; Wang, P.; Zhao, C. Winter Wheat Nitrogen Status Estimation Using UAV-Based RGB Imagery and Gaussian Processes Regression. Remote Sens. 2020, 12, 3778. [Google Scholar] [CrossRef]
  24. Liu, Y.; Feng, H.K.; Yue, J.B.; Jin, X.L.; Li, Z.H.; Yang, G.J. Estimation of potato above-ground biomass based on unmanned aerial vehicle red-green-blue images with different texture features and crop height. Front. Plant Sci. 2022, 13, 938216. [Google Scholar] [CrossRef] [PubMed]
  25. Fu, Y.; Yang, G.; Song, X.; Li, Z.; Xu, X.; Feng, H.; Zhao, C. Improved Estimation of Winter Wheat Aboveground Biomass Using Multiscale Textures Extracted from UAV-Based Digital Images and Hyperspectral Feature Analysis. Remote Sens. 2021, 13, 581. [Google Scholar] [CrossRef]
  26. Saberioon, M.M.; Amin, M.S.M.; Gholizadeh, A.; Ezri, M.H. A Review of Optical Methods for Assessing Nitrogen Contents During Rice Growth. Appl. Eng. Agric. 2014, 30, 657–669. [Google Scholar]
  27. Moharana, S.; Dutta, S. Spatial variability of chlorophyll and nitrogen content of rice from hyperspectral imagery. ISPRS J. Photogramm. Remote Sens. 2016, 122, 17–29. [Google Scholar] [CrossRef]
  28. Schlemmer, M.; Gitelson, A.; Schepers, J.; Ferguson, R.; Peng, Y.; Shanahan, J.; Rundquist, D. Remote estimation of nitrogen and chlorophyll contents in maize at leaf and canopy levels. Int. J. Appl. Earth Obs. Geoinf. 2013, 25, 47–54. [Google Scholar] [CrossRef] [Green Version]
  29. Wang, W.; Yao, X.; Yao, X.; Tian, Y.; Liu, X.; Ni, J.; Cao, W.; Zhu, Y. Estimating leaf nitrogen concentration with three-band vegetation indices in rice and wheat. Field Crop. Res. 2012, 129, 90–98. [Google Scholar] [CrossRef]
  30. Tian, Y.C.; Yao, X.; Yang, J.; Cao, W.X.; Hannaway, D.B.; Zhu, Y. Corrigendum to “Assessing newly developed and published vegetation indices for estimating rice leaf nitrogen concentration with ground- and space-based hyperspectral reflectance” [Field Crops Res. 120 (2011) 299–310]. Field Crop. Res. 2011, 121, 464. [Google Scholar] [CrossRef]
  31. Rouse, J.W.; Haas, R.H.; Deering, D.W. Monitoring the Vernal Advancement and Retrogradation (Green Wave Effect) of Natural Vegetation; NTRS-NASA Technical Report Server; University of Maryland: College Park, MD, USA, 1973. [Google Scholar]
  32. Hasituya; Li, F.; Elsayed, S.; Hu, Y.; Schmidhalter, U. Passive reflectance sensing using optimized two- and three-band spectral indices for quantifying the total nitrogen yield of maize. Comput. Electron. Agric. 2020, 173, 105403. [Google Scholar] [CrossRef]
  33. Li, Y.-J.; Wei, J.; Xu, X.-R. Image Processing Method of Linear Infrared Focal Plane Array. J. Infrared Millim. Waves 2010, 29, 91–93. [Google Scholar] [CrossRef]
  34. Baghi, N.G.; Oldeland, J. Do soil-adjusted or standard vegetation indices better predict above ground biomass of semi-arid, saline rangelands in North-East Iran? Int. J. Remote Sens. 2019, 40, 8223–8235. [Google Scholar] [CrossRef]
  35. Zhang, J.; Tian, H.; Wang, D.; Li, H.; Mouazen, A.M. A novel spectral index for estimation of relative chlorophyll content of sugar beet. Comput. Electron. Agric. 2021, 184, 106088. [Google Scholar] [CrossRef]
  36. Reyniers, M.; Walvoort, D.J.J.; De Baardemaaker, J. A linear model to predict with a multi-spectral radiometer the amount of nitrogen in winter wheat. Int. J. Remote Sens. 2006, 27, 4159–4179. [Google Scholar] [CrossRef]
  37. Dash, J.; Curran, P.J. The MERIS terrestrial chlorophyll index. Int. J. Remote Sens. 2004, 25, 5403–5413. [Google Scholar] [CrossRef]
  38. Feng, W.; Guo, B.-B.; Zhang, H.-Y.; He, L.; Zhang, Y.-S.; Wang, Y.-H.; Zhu, Y.-J.; Guo, T.-C. Remote estimation of above ground nitrogen uptake during vegetative growth in winter wheat using hyperspectral red-edge ratio data. Field Crop. Res. 2015, 180, 197–206. [Google Scholar] [CrossRef]
  39. Sims, D.A.; Gamon, J.A. Relationships between leaf pigment content and spectral reflectance across a wide range of species, leaf structures and developmental stages. Remote Sens. Environ. 2002, 81, 337–354. [Google Scholar] [CrossRef]
  40. Oliveri, P.; Malegori, C.; Simonetti, R.; Casale, M. The impact of signal pre-processing on the final interpretation of analytical outcomes—A tutorial. Anal. Chim. Acta 2019, 1058, 9–17. [Google Scholar] [CrossRef]
  41. Meng, X.; Bao, Y.; Liu, J.; Liu, H.; Zhang, X.; Zhang, Y.; Wang, P.; Tang, H.; Kong, F. Regional soil organic carbon prediction model based on a discrete wavelet analysis of hyperspectral satellite data. Int. J. Appl. Earth Obs. Geoinf. 2020, 89, 102111. [Google Scholar] [CrossRef]
  42. Wang, Y.; Wang, F.; Huang, J.; Wang, X.; Liu, Z. Validation of artificial neural network techniques in the estimation of nitrogen concentration in rape using canopy hyperspectral reflectance data. Int. J. Remote Sens. 2009, 30, 4493–4505. [Google Scholar] [CrossRef]
  43. Azadi, F.; Saadat, S.; Karimi-Jashni, A. Experimental Investigation and Modeling of Nickel Removal from Wastewater Using Modified Rice Husk in Continuous Reactor by Response Surface Methodology. Iran. J. Sci. Technol. Trans. Civ. Eng. 2018, 42, 315–323. [Google Scholar] [CrossRef]
  44. Liaghat, S.; Ehsani, R.; Mansor, S.; Shafri, H.Z.M.; Meon, S.; Sankaran, S.; Azam, S.H.M.N. Early detection of basal stem rot disease (Ganoderma) in oil palms based on hyperspectral reflectance data using pattern recognition algorithms. Int. J. Remote Sens. 2014, 35, 3427–3439. [Google Scholar] [CrossRef]
  45. Mariotto, I.; Thenkabail, P.S.; Huete, A.; Slonecker, E.T.; Platonov, A. Hyperspectral versus multispectral crop-productivity modeling and type discrimination for the HyspIRI mission. Remote Sens. Environ. 2013, 139, 291–305. [Google Scholar] [CrossRef]
  46. Rivera, J.P.; Verrelst, J.; Delegido, J.; Veroustraete, F.; Moreno, J. On the Semi-Automatic Retrieval of Biophysical Parameters Based on Spectral Index Optimization. Remote Sens. 2014, 6, 4927–4951. [Google Scholar] [CrossRef] [Green Version]
  47. Ollinger, S.V. Sources of variability in canopy reflectance and the convergent properties of plants. New Phytol. 2011, 189, 375–394. [Google Scholar] [CrossRef] [PubMed]
  48. Kokaly, R.F.; Asner, G.P.; Ollinger, S.V.; Martin, M.E.; Wessman, C.A. Characterizing canopy biochemistry from imaging spectroscopy and its application to ecosystem studies. Remote Sens. Environ. 2009, 113, S78–S91. [Google Scholar] [CrossRef]
  49. Pettersson, C.G.; Eckersten, H. Prediction of grain protein in spring malting barley grown in northern Europe. Eur. J. Agron. 2007, 27, 205–214. [Google Scholar] [CrossRef]
  50. Hansen, P.M.; Schjoerring, J.K. Reflectance measurement of canopy biomass and nitrogen status in wheat crops using normalized difference vegetation indices and partial least squares regression. Remote Sens. Environ. 2003, 86, 542–553. [Google Scholar] [CrossRef]
  51. Clevers, J.G.P.W.; Gitelson, A.A. Remote estimation of crop and grass chlorophyll and nitrogen content using red-edge bands on Sentinel-2 and -3. Int. J. Appl. Earth Observ. Geoinf. 2013, 23, 344–351. [Google Scholar] [CrossRef]
  52. Yu, K.; Li, F.; Gnyp, M.L.; Miao, Y.; Bareth, G.; Chen, X. Remotely detecting canopy nitrogen concentration and uptake of paddy rice in the Northeast China Plain. ISPRS J. Photogramm. Remote Sens. 2013, 78, 102–115. [Google Scholar] [CrossRef]
  53. Li, F.; Mistele, B.; Hu, Y.; Chen, X.; Schmidhalter, U. Optimising three-band spectral indices to assess aerial N concentration, N uptake and aboveground biomass of winter wheat remotely in China and Germany. ISPRS J. Photogramm. Remote Sens. 2014, 92, 112–123. [Google Scholar] [CrossRef]
  54. Shi, T.; Liu, H.; Chen, Y.; Wang, J.; Wu, G. Estimation of arsenic in agricultural soils using hyperspectral vegetation indices of rice. J. Hazard. Mater. 2016, 308, 243–252. [Google Scholar] [CrossRef] [PubMed]
  55. Wang, J.-J.; Li, Z.; Jin, X.; Liang, G.; Struik, P.C.; Gu, J.; Zhou, Y. Phenotyping flag leaf nitrogen content in rice using a three-band spectral index. Comput. Electron. Agric. 2019, 162, 475–481. [Google Scholar] [CrossRef]
Figure 1. Location of potato field and experimental design. Note: R is an abbreviation for Replication.
Remotesensing 15 00602 g001
Figure 2. Relationship between PNC and single-band reflectance: (a) original reflectance, (b) the first derivative, (c) the logarithm of the reciprocal of the spectra, (d) the standard normal variate transform, (e) the second derivative, and (f) continuous removal. The dashed lines indicate the critical correlation coefficient at α = 0.01.
Remotesensing 15 00602 g002
Figure 3. Correlation coefficient between PNC and two-band spectral indices. (a) normalized difference spectral index, (b) ratio spectral index, (c) difference spectral index, (d) soil-adjusted spectral index, (e) chlorophyll spectral index, and (f) optimal spectral index.
Remotesensing 15 00602 g003
Figure 4. Correlation coefficient between PNC and three-band spectral indices. (af) three-band spectral index 1- three-band spectral index 6.
Remotesensing 15 00602 g004
Figure 5. (a,c,e) Correlation of three optimal spectral indices of different dimensions with PNC over multiple potato-growth periods. (b,d,f) Optimal spectral indices for estimating PNC over multiple potato-growth periods.
Remotesensing 15 00602 g005
Figure 6. Predicted versus measured PNC. Predicted PNC was estimated by models constructed from the three optimal spectral indices to estimate the effect of potato PNC in different planting years (2018 and 2019). (a,c,e) modeling dataset; (b,d,f) validation dataset.
Remotesensing 15 00602 g006
Figure 7. Predicted versus measured PNC. Predicted PNC was estimated by models constructed from the three optimal spectral indices to estimate the effect of potato PNC in different cultivars. (a,c,e) modeling dataset; (b,d,f) validation dataset.
Remotesensing 15 00602 g007
Figure 8. Predicted versus measured PNC. Predicted PNC was estimated by models constructed from the three optimal spectral indices to estimate the effect of potato PNC in different growth periods. (a,c,e) modeling dataset; (b,d,f) validation dataset.
Remotesensing 15 00602 g008
Table 1. Formulas for selected two- and three-band spectral indices used in this study.
TypeSpectral IndexFormulaReference
Two-band
spectral indices
NDSI(Rλ1Rλ2)/(Rλ1 + Rλ2)[31]
RSIRλ1/Rλ2[32]
DSIRλ1Rλ2[33]
SASI(1 + L)(Rλ1Rλ2)/(Rλ1 + Rλ2 + L)[34]
CSI(Rλ1Rλ2)/Rλ1[35]
OSI(1 + 0.45)(2Rλ2 + 1)/(Rλ1 + 0.45)[36]
Three-band
spectral indices
TBI 1(Rλ1Rλ2)/(Rλ2 + Rλ3)[37]
TBI 2(Rλ1 − 1.8Rλ2)/(Rλ3 − 1.8Rλ2)[38]
TBI 3Rλ1/(Rλ2Rλ3)[12]
TBI 4Rλ1/(Rλ2 + Rλ3)[30]
TBI 5(Rλ1Rλ2)/(Rλ1 + Rλ2 − 2Rλ3)[39]
TBI 6(Rλ1Rλ2 + 2Rλ3)/(Rλ1 + Rλ2 + 2Rλ3)[29]
Table 2. Descriptive statistics of potato PNC for calibration and validation datasets.
YearGrowth PeriodCalibrationValidation
RangeMeanSDCV (%)RangeMeanSDCV (%)
2018S12.70–4.593.700.5013.503.06–4.573.660.4714.77
S22.32–4.033.110.5015.922.37–3.462.980.3417.80
S32.12–3.983.200.5116.012.02–3.633.000.4513.43
S41.76–3.792.620.4416.971.90–3.572.790.4414.41
2019S12.05–5.153.650.8122.182.82–5.083.910.7619.69
S22.09–4.503.150.6119.392.47–4.163.330.5918.73
S31.61–4.002.670.6022.541.96–3.542.750.5222.47
S41.86–3.742.820.4616.412.21–3.703.110.4016.99
Table 3. Statistics of bands sensitive to potato PNC and with single-band reflectance.
Reflectance TypeSensitive Band
Range (nm)
Optimal
Wavelength (nm)
Optimal
Correlation Coefficient
OR534–646, 718–9507340.30
FDR486–562, 638–670, 706–800,842–942542−0.57
Log(1/R)534–646, 718–950738−0.31
SNVR534–646, 718–9507380.30
SDR630–646, 658–682, 694–742, 766–7787060.56
CR506–826, 838–866554−0.53
Table 4. Sensitive wavelength of the three spectral indices.
TypesSpectral
Index
Rλ1 (nm)Rλ2 (nm)Rλ3 (nm)Correlation
Coefficient
Two-band
spectral indices
NDSI618490 0.62
RSI618490 0.61
DSI578494 0.74
SASI586494 0.73
CSI618494 0.62
OSI586490 −0.72
Three-band
spectral indices
TBI1562494750−0.76
TBI2586666550−0.74
TBI34625745620.70
TBI4734514534−0.81
TBI5530734514−0.82
TBI6510590514−0.62
Disclaimer/Publisher’s Note: The statements, opinions and data contained in all publications are solely those of the individual author(s) and contributor(s) and not of MDPI and/or the editor(s). MDPI and/or the editor(s) disclaim responsibility for any injury to people or property resulting from any ideas, methods, instructions or products referred to in the content.

