Article

Leaf-Level Field Spectroscopy to Discriminate Invasive Species (Psidium guajava L. and Hovenia dulcis Thunb.) from Native Tree Species in the Southern Brazilian Atlantic Forest

by
Caroline Lorenci Mallmann
1,2,
Waterloo Pereira Filho
1,
Jaqueline B. B. Dreyer
3,
Luciane A. Tabaldi
4 and
Flavia Machado Durgante
5,6,*
1
Department of Geoscience, Santa Maria Federal University, Santa Maria 97105-900, Brazil
2
Secretary of Environment and Infrastructure for the State of Rio Grande do Sul, Porto Alegre 86010-923, Brazil
3
Department of Forestry Engineering, Santa Maria Federal University, Santa Maria 97105-900, Brazil
4
Department of Biology, Santa Maria Federal University, Santa Maria 97105-900, Brazil
5
Institute of Geography and Geoecology, Karlsruhe Institute of Technology, 76131 Karlsruhe, Germany
6
Department of Botany, National Institute for Amazonian Research, Petrópolis 69011-970, Brazil
*
Author to whom correspondence should be addressed.
Remote Sens. 2023, 15(3), 791; https://doi.org/10.3390/rs15030791
Submission received: 12 December 2022 / Revised: 19 January 2023 / Accepted: 20 January 2023 / Published: 30 January 2023
(This article belongs to the Section Biogeosciences Remote Sensing)

Abstract

:
Invasive species are known to have potential advantages over the native community and can be expressed in their leaf functional traits. Thus, leaf-level traits with spectral reflectance can provide valuable insights for distinguishing invasive trees from native trees in complex forest environments. We conducted field spectroscopy measurements in a subtropical area, where we also collected trait data for 12 functional traits of invasive (Psidium guajava and Hovenia dulcis), and native species (Psidium cattleianum and Luehea divaricata). We found that photosynthetic pigments were responsible for the greatest interspecific variability, especially in the green region of the spectrum at 550 nm, therefore contributing to detection of invasive species. In addition, according to LDA and stepwise procedures, the most informative reflectance spectra were concentrated in the visible range that is closely related to pigment absorption features. Furthermore, we aimed to understand the leaf optical properties of the target invasive species by using a combination of narrow bands and linear regression models. P. guajava showed high correlations with specific leaf area, Car/Chl and relative water content. H. dulcis had a strong correlation with water content, specific leaf area and Chla/Chlb. Overall, this methodology proved to be appropriate for discriminating invasive trees, although parameterization by species is necessary.

Graphical Abstract

1. Introduction

1.1. Background

From the last century onwards, plant invasions have been increasing worldwide [1,2] and have been considered a major threat to global biodiversity [3]. Invasive alien species (IAS) are introduced by humans outside of their natural range and cause negative ecological, economic, and social impacts on the novel environment [4,5,6]. Invasive trees are usually adaptive and competitively distinct in relation to co-occurring native species [7]. Therefore, they can alter the richness, composition and abundance of the community and also produce changes in ecosystem functioning [8].

1.2. IAS in Protected Areas

Invasive species have been reported causing risks in protected areas all over the world [9]. In Brazil, the establishment of protected areas was a main strategy for biodiversity conservation [10]. However, in addition to habitat fragmentation and the presence of disturbed environments [11], these areas are also currently being threatened by biological invasions [12]. Outside the protected areas, land uses also need attention, as they mostly determine a strong propagule pressure and contribute to the success of plant invasions in these areas [13,14,15,16,17].
The occurrence of invasive species has increased in forest ecosystems in recent years, and negatively affects species composition, forest microclimate, and soil chemistry [8]. Additive or synergistic effects of habitat disturbance and species invasions, such as competition for light and nutrients, result in today’s landscapes being dominated by exotic species, which is a direct consequence of this competitive exclusion [18]. Changes caused by invasive plants that disrupt ecosystem functioning and promote the invasion and establishment of new invasive plants create a feedback loop between habitat disturbance and species invasion, i.e., “invasive collapse” of disturbed ecosystems [19,20].
IAS represent an ongoing challenge for the management of protected areas associated with high economic costs [20,21,22]. In this regard, remote sensing can potentially contribute as a methodological approach for the detection of invasive species and their monitoring over large and hard-to-reach areas, including forests.

1.3. Leaf Optical Properties

Remote sensing (RS) in the optical domain, which can be applied to a range of environmental studies, focuses on the spectral properties of the leaf in relation to its biochemical content (chlorophyll, water, dry matter) and its anatomical structure [23]. The diffuse reflectance of a leaf, modified by its internal properties, may contain features that are useful for mapping the functional properties of leaves [24]. In a healthy green leaf, the spectral region from 430 nm to 660 nm is characterized by a strong chlorophyll a absorption peak. In contrast, the absorption range of chlorophyll b is more intense (450 nm and 650 nm). The carotenoids have an absorption peak at 450 nm. In the near infrared (NIR) region, the reflectance increases dramatically (700 nm to 1200 nm), with a reflectance peak at 900 nm. Properties extracted from leaves and their reflectance spectra are input parameters and serve to feed canopy models. Combinations of narrow bands, such as the proposition of spectral indices, consist of a classical approach in remote sensing and are widely used for extracting information related to photosynthetic pigment content, water content, and dry mass, mainly due to their simplicity, and because they usually produce good results for individual datasets [23].

1.4. Remote Sensing for the Detection, Mapping, and Monitoring of IAS

Remote sensing has been used in recent years to detect invasive plants [25,26,27]. IAS detection and mapping is possible due to the dominance of invasive species that can form homogeneous and large patches in the area, which contrasts the seasonal phenology of IAS and the native plants, and biochemical, physiological, or structural traits that can distinguish the IAS from the native community [28]. However, the platform and sensor used for detection must be compatible with the target species and/or the environment characteristics. Multiscale approaches, such as integrating data from different platforms and sensors, are potential methodologies for the discrimination and mapping of IAS [29,30,31].
Phenology-based approaches are widely used, for example, to map IAS according to flowering and leaf senescence [32,33,34]. On the other hand, structural traits tend to be spatially separable within a native ecosystem using processing techniques based on image segmentation. However, their application is indicated when the IAS present aggressive and dominant characteristics [35], or they form groups that are distinct from the native community [36,37].
Recent studies, such as those of Omer [38], Tesfamichael [39], and Iqbal [40], have used methods based on field spectroscopy to discriminate invasive species. Omer [38] used continuous wavelet analysis and feature reduction techniques to discriminate five invasive plant species. Tesfamichael [39] investigated the potential of remote sensing in identifying native, non-native, and hybrid Tamarix species in South Africa. Classification of species at the leaf and canopy level was performed using field spectroradiometer data. Iqbal [40] used a hyperspectral field sensor to discriminate invasive plant species from adjacent native species in two protected areas in Pakistan. Spectral separability was calculated using the Jeffries-Matusita distance index based on selected wavebands.
In tropical and subtropical forest ecosystems, mapping target IAS seems to be complex as they are spread out in the woods and most have morphological traits that are similar to the native species. Therefore, methods that not only use structural traits, but also spectral data should be used [41,42]. Furthermore, to increase the potential for discrimination between native and invasive plants, physiological characteristics linked to plant functioning and growth must be included [32]. Invasive tree species can be detected directly via the forest canopy [43] or indirectly by measuring the leaves and simulating the canopy [44,45].
Functional traits at leaf-level, such as photosynthetic pigments [46], nitrogen concentration [47] and moisture content [48], are directly related to physiological functions such as photosynthesis, respiration, and transpiration. These characteristics can be reflected in the optical properties of the leaves and, when related to the spectral signatures, can contribute to improving the discrimination and mapping of IAS [49,50].
Given the importance of the topic, the present study fills a gap related to remote detection of IAS in complex forest ecosystems. Moreover, it intends to assess invasive forest species that exhibit sparse invasion characteristics and sometimes form clusters; however, these species are not characterized as monodominant. We pursued the following objectives: 1) determine leaf functional traits and spectral characterization of native and invasive trees; 2) discriminate invasive species from native species based on their reflectance values via field spectroscopy; and 3) understand the relationship between functional characteristics of invasive plants and their spectral patterns (optical types).

2. Materials and Methods
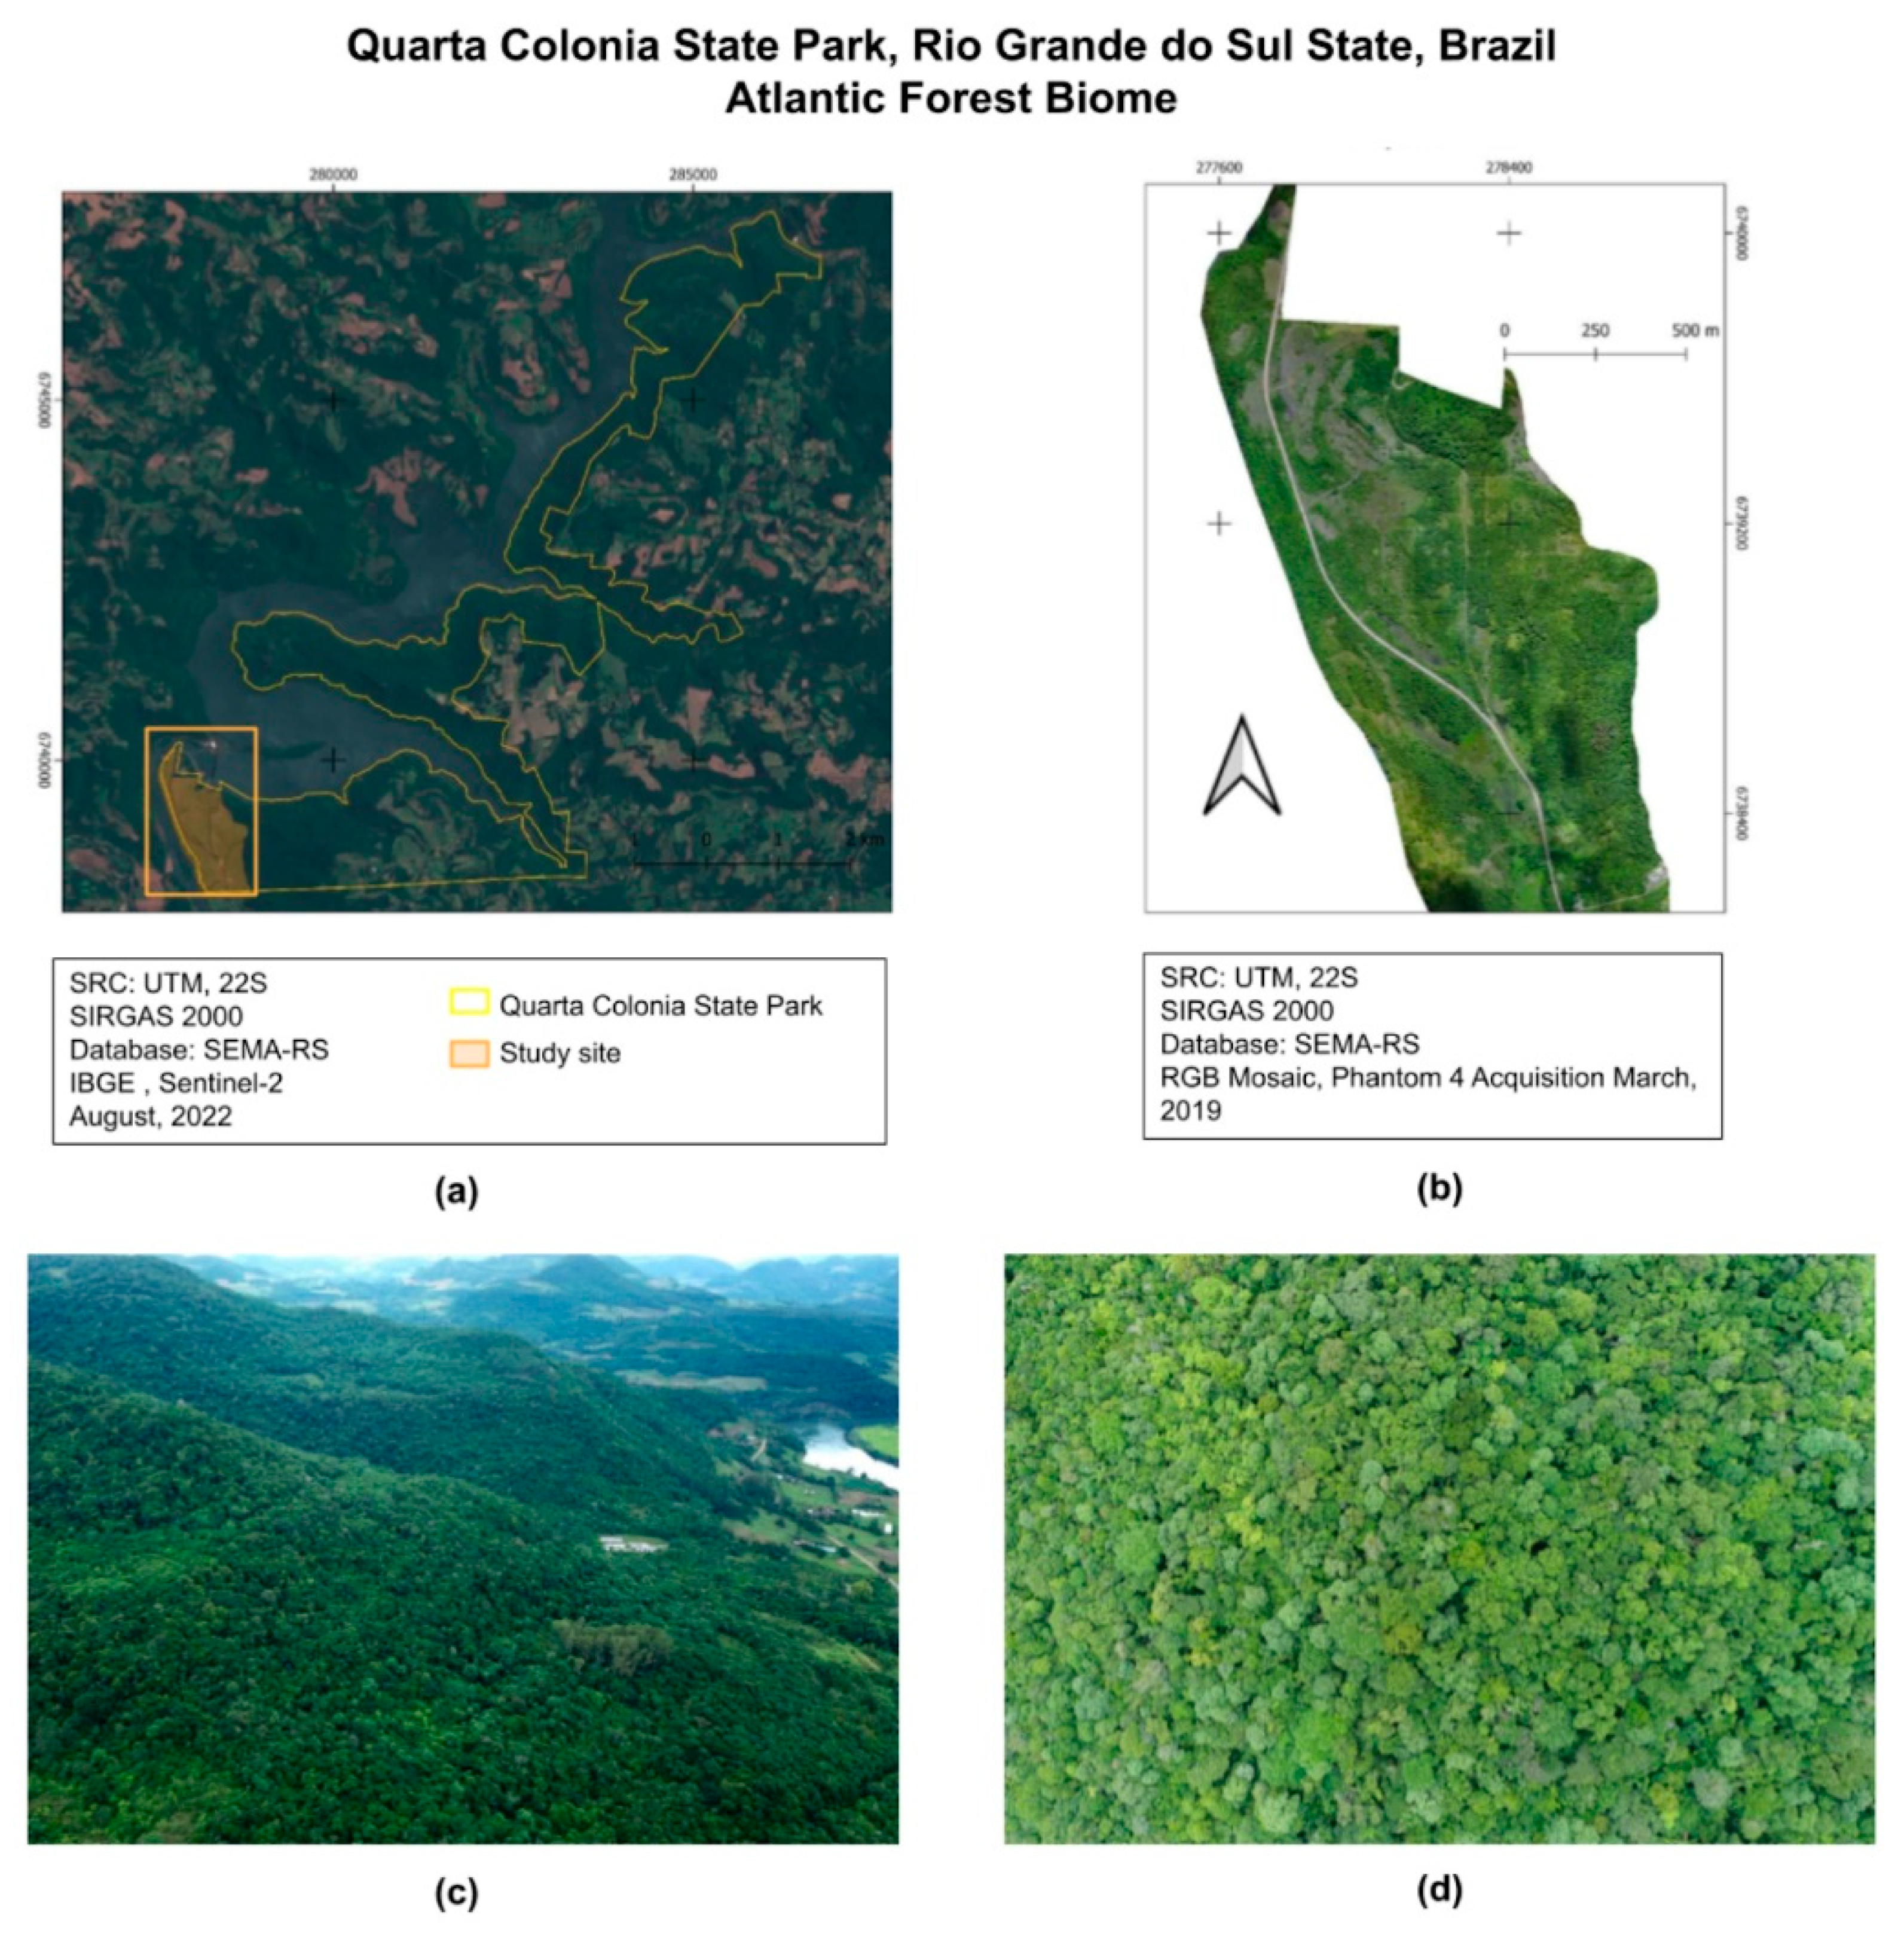
2.1. Study Site

The study was conducted at the Quarta Colonia State Park (hereafter QCSP) that protects an area of ca. 1847 ha of secondary forest in southern Brazil (29°27′57.39″ S, 53°16′51.30″ W), within the Atlantic Forest domain [51,52,53] (Figure 1a,c). The vegetation of QCSP is classified as seasonal deciduous and it is covered with native tree species such as Nectandra megapotamica (Spreng.) Mez, Cupania vernalis Cambess, Trichilia clausseni C.DC., Chrysophyllum marginatum (Hook. & Arn.) Radlk., Luehea divaricata Mart., Sebastiania commersoniana (Baill.) L.B.Sm. & Downs, Allophylus edulis (A.St.-Hil.) Hieron. ex Niederl., Cordia americana (L.) Gottschling & J.S.Mill. [54,55]. The landscape varies from undulating to mountainous, which leads to heterogeneous bio-physical soil conditions in which soils of the type Litolic Neosol and Regolitic Neosol predominate [56]. The mean annual temperature ranges from 18 °C to 20 °C and mean annual precipitation is approximately 1300 mm [57]. Plant invasions are a significant threat at QCSP and are closely linked to land use changes and anthropogenic impacts in the area prior to their establishment [53].

2.2. Target Species

We selected two invasive species, namely Hovenia dulcis Thunb. (Japanese raisin tree) and Psidium guajava L. (Guava), and two co-occurring native species, namely Luehea divaricata Mart. & Zucc. (Whips-horse) and Psidium cattleianum Sabine (Strawberry guava). Native–invasive species pairs were chosen according to morphological and taxonomic parameters (most similar to plant comparisons), and occurrence distribution (frequencies and population densities). (See Table S1 and Figure S1 in Supplementary Materials).

The Target IAS of the Study

Hovenia dulcis Thunberg

Hovenia dulcis, commonly known as Japanese raisin tree, is native to East Asia and grows in China, Japan, North Korea, South Korea, Thailand, and Vietnam [58]. It is described as a deciduous fast-growing tree that can reach 25 m in height, is tolerant of shade though prefers habitats with high incidences of light [59,60]. Leaves are alternate, simple, 10–15 cm long and 7–12 cm in width. It reproduces sexually by seed, and fruits are produced in large quantities [61]. It is considered to be an invasive species in forest ecosystems in South America, especially in the Atlantic Forest domain [62,63,64]. The species was brought to southern Brazil and introduced to rural properties motivated by economic reasons, shade and wood uses [61]. As a consequence, it has spread beyond cultivation areas and has become a growing problem in subtropical deciduous seasonal forests, often being found in the canopies of secondary forest fragments [64,65,66]. H. dulcis can outcompete other species for light and nutrients [67] and promotes changes in structure and in species composition in the plant community [68].

Psidium guajava L.

Psidium guajava (commonly known as guava) is a tropical tree from southern Mexico and northern South America that is under cultivation around the world and has become invasive in southern Brazil [69]. Adult guava trees grow to 3–8 m in height. Leaves are opposite, simple, 5–15 cm long and 3–7 cm wide [70]. It reproduces sexually and fruits are fleshy, edible, and produce large quantities of seeds [71,72,73]. The species is well adapted to a wide range of environmental conditions, and it can form dense monocultures and produce allelopathic effects that displace native plants [74].

2.3. Spectral Measurements in the Field

Field sampling was conducted in QCSP in the spring of 2020 when plants were actively growing and reaching greater photosynthetic capacity. The average field temperature and relative humidity were 32 °C and 49%, respectively. We collected data from six mature trees of each species. All individuals were sampled under similar solar radiation/light conditions, i.e., measurements occurred at the same time (they started at 10:00 am and ended at 1:30 pm) on cloudless and windless days in a homogeneous area with 20 years of secondary forest succession (Figure 1b,d).
Spectral data collection was conducted in three campaigns in the spring, resulting in the collection of 24 subsamples. Care was taken in the design of the sampling to represent the different light incidence directions when collecting the samples. For this purpose, six individuals (samples) per species were selected and only leaves from the upper third of the canopy were collected. The subsample was distributed among the quadrants (north, south, east, and west), with a replicate of four leaves for all variables analyzed, thus making a total of 384 measured leaves. Sampling for leaf functional traits was conducted simultaneously in the same field.

2.4. Leaf Sampling and Laboratory Processing

We analyzed 12 leaf functional traits for both native and invasive species, which were related to photosynthetic pigments, water content and vegetation structure (Table 1). These traits at leaf-level are relevant as they represent ecological strategies that can be correlated with measurable leaf spectral properties [50]. For the study, the same six individuals of each tree species previously selected were used for the measurements. In all cases, leaf sampling was conducted on the middle third of the canopy, and thirty-two healthy leaves were collected per individual. Four leaves were used in each analysis.
To avoid the degradation of photosynthetic pigments, leaf samples were immediately wrapped in aluminum foil, frozen in liquid nitrogen, and stored on thermal box in the field until they could be transferred to a −80 °C freezer in the Plant Biotechnology Lab at Santa Maria Federal University. Fresh leaf tissues (50 mg) were then homogenized in liquid nitrogen, incubated at 65 °C with dimethyl sulfoxide (DMSO) until the pigments were completely extracted, as per Hiscox and Israelstam [75], and estimated with Lichtenthaler’s formula [76]. Concentrations of chlorophyll a, chlorophyll b and carotenoids were quantified using a spectrophotometer (Spectrophotometer VM5, Celm E-205D, Bel Engineering, Monza, Italy) based on their absorbance at 663, 645 and 470 nm, respectively.
Leaf samples for water content and for structural measurements were stored in humidified bags in the field and kept in black plastic bags on thermal box to prevent wilting during transport. Leaf samples were first measured with a scanner/portable leaf area meter (Portable Leaf Area Meter -AM300, ADC BioScientific Ltd, Hoddesdon, UK) to determine the leaf area. Leaves were fresh weighed and then oven-dried at ±65 °C until constant weight before recording dry mass. We calculated leaf mass per area (LMA; g cm−2) as leaf dry mass divided by leaf area. Specific leaf area (SLA; cm2 g−1) was calculated as area per unit mass.

2.5. Collection of Leaf-Level Spectral Data

For leaf spectral characterization of the target species, field spectroscopy was performed using a handheld portable spectroradiometer (ASD FieldSpec®, Malvern Panalytical, Malvern, UK) within the 300–1200 nm range, with spectral resolution of 3 nm. However, the spectral range of 400–900 nm was delimited for this work due to noise observed in the equipment. One exposed branch from the higher third of the canopy for each tree was removed and four leaves were then collected. Immediately (less than 10 min), leaf samples were overlapped and placed on a black background and leaf-level spectral reflectance signatures were recorded for each sample.
The spectroradiometer was placed vertically over the target (leaf) at a distance of 10 cm, and data was collected by 25 degrees of field of view (FOV for field measurement). The positioning of the spectroradiometer was performed by moving in constant azimuthal movement (90°). The distance between the target and the object was kept constant to ensure that no reflectance came from the surroundings of the leaf. The spectroradiometer was calibrated with a Lambertian reference plate before each sample measurement. For each target, 10 readings were collected from the reference plate and leaf sample to obtain the average spectrum. All measurements were collected with RS3 software (ASD), and ViewSpecPro software (ASD) was used for post processing of spectra files. During the field work, meteorological information, such as temperature, humidity, wind speed and solar radiation inclination associated with each individual, was also collected. A thermo hygro-anemometer and a clinometer were used.

2.6. Statistical Analyses

Our study was analyzed via the following three steps: (1) analysis of the functional traits of the native and invasive trees using leaf traits measured in the field; (2) analysis of spectral reflectance; and (3) integrated analysis of leaf functional traits and spectral reflectance (Figure 2). All the analyses were performed using Microsoft Excel (Microsoft, Redemond, Whashington, USA) and R (R Core Team 2020). A descriptive statistical analysis of all 12 traits of the target species with a 95% confidence interval (CI) is also provided. Additionally, the Kruskal–Wallis test was performed to compare the species, followed by Dunn’s post hoc test.
To evaluate the spectral signatures of the species, the analytical technique was used. Linear discriminant analysis (LDA) was performed to distinguish the spectra with two subsets; one containing 70% of the spectral data to build the model and one containing the remaining 30% of the spectral data used for validation. Then, stepwise procedures were used to select important wavelengths that best explain the differences among species. This process selects the variables one by one in accordance with the p-value < 0.05 until no variable can be entered. The leave-one-out cross-validation (LOOCV) was used to estimate the model generalization, which is a disposition of k-fold cross-validation, where k is the number of examples in the dataset (n).
To test the correlation between leaf characteristics and their respective spectral reflectance for invasive species, a simple relationship was investigated to estimate the biophysical and biochemical parameters using an interactive correlation environment (ICE) according to Ogashawara [77]. The method was adapted for Microsoft Excel and consists of a correlation matrix to select the single band ratio. First, a correlation matrix was created for each independent variable in terms of reflectance values with a resolution of 1 nm. All spectral band ratios were calculated for each variable. This procedure was performed for each of the invasive species and permitted the identification of the wavelength with the best correlation for each trait. Finally, simple linear regression (SLR) was used to determine the significant functional optical properties based on the most significant functional characteristics of the leaves according to the best simple ratio correlation (r). The performance of the models was validated using the coefficient of determination (r2), root mean square error (RMSE), and residual sum of squares (RSS).

3. Results

3.1. Leaf Functional Traits for Native and Invasive Species

We measured twelve leaf traits that were closely related to plant photosynthesis in terms of water content, biochemical content, and leaf structure and physiology based on dry mass. The statistical summary of the analyses can be found in the Supplementary Materials (see Table S2 in Supplementary Materials).

3.1.1. Water Content

In general, the water content differed between species according to the Kruskal–Wallis test (Table 2). However, after post hoc testing, the significant differences were found for the EWT trait (Table 3). The native species L. divaricata had the highest LWC for the total dataset and the highest intraspecific variability. Nonetheless, when comparing the means, the invasive H. dulcis presented the highest mean value among the species (Figure 3a). The native species showed greater FMC as well as greater intraspecific variability. In contrast, invasive species had lower values for data amplitude and lower intraspecific variability (Figure 3b). The results also showed that, in general, both invasive species presented lower EWT values when compared to the corresponding native species, and less intraspecific variability (Figure 3c).

3.1.2. Vegetation Structure

The traits related to vegetation structure showed significant difference between species (Table 4). After the post hoc test (Table 5), the greatest differences were observed among the groups: invasive species H. dulcis and P. guajava; invasive species H. dulcis and native P. cattleianum; followed by the native species L. divaricata and P. cattleinum.
The evergreen species (P. cattleianum and P. guajava) in this study showed greater leaf mass per area (LMA; Figure 4a). On the other hand, the deciduous species (L. divaricata and H. dulcis) exhibited higher values of specific leaf area (SLA; Figure 4b). The native Psidium cattleianum presented the highest LMA (LMA = 0.018 g cm−2) and the smallest SLA (SLA = 40.56 cm2 g−1). In contrast, the invasive Hovenia dulcis had the lowest LMA (LMA = 0.004 g cm−2) and the largest SLA (SLA = 225.32 cm2 g−1).

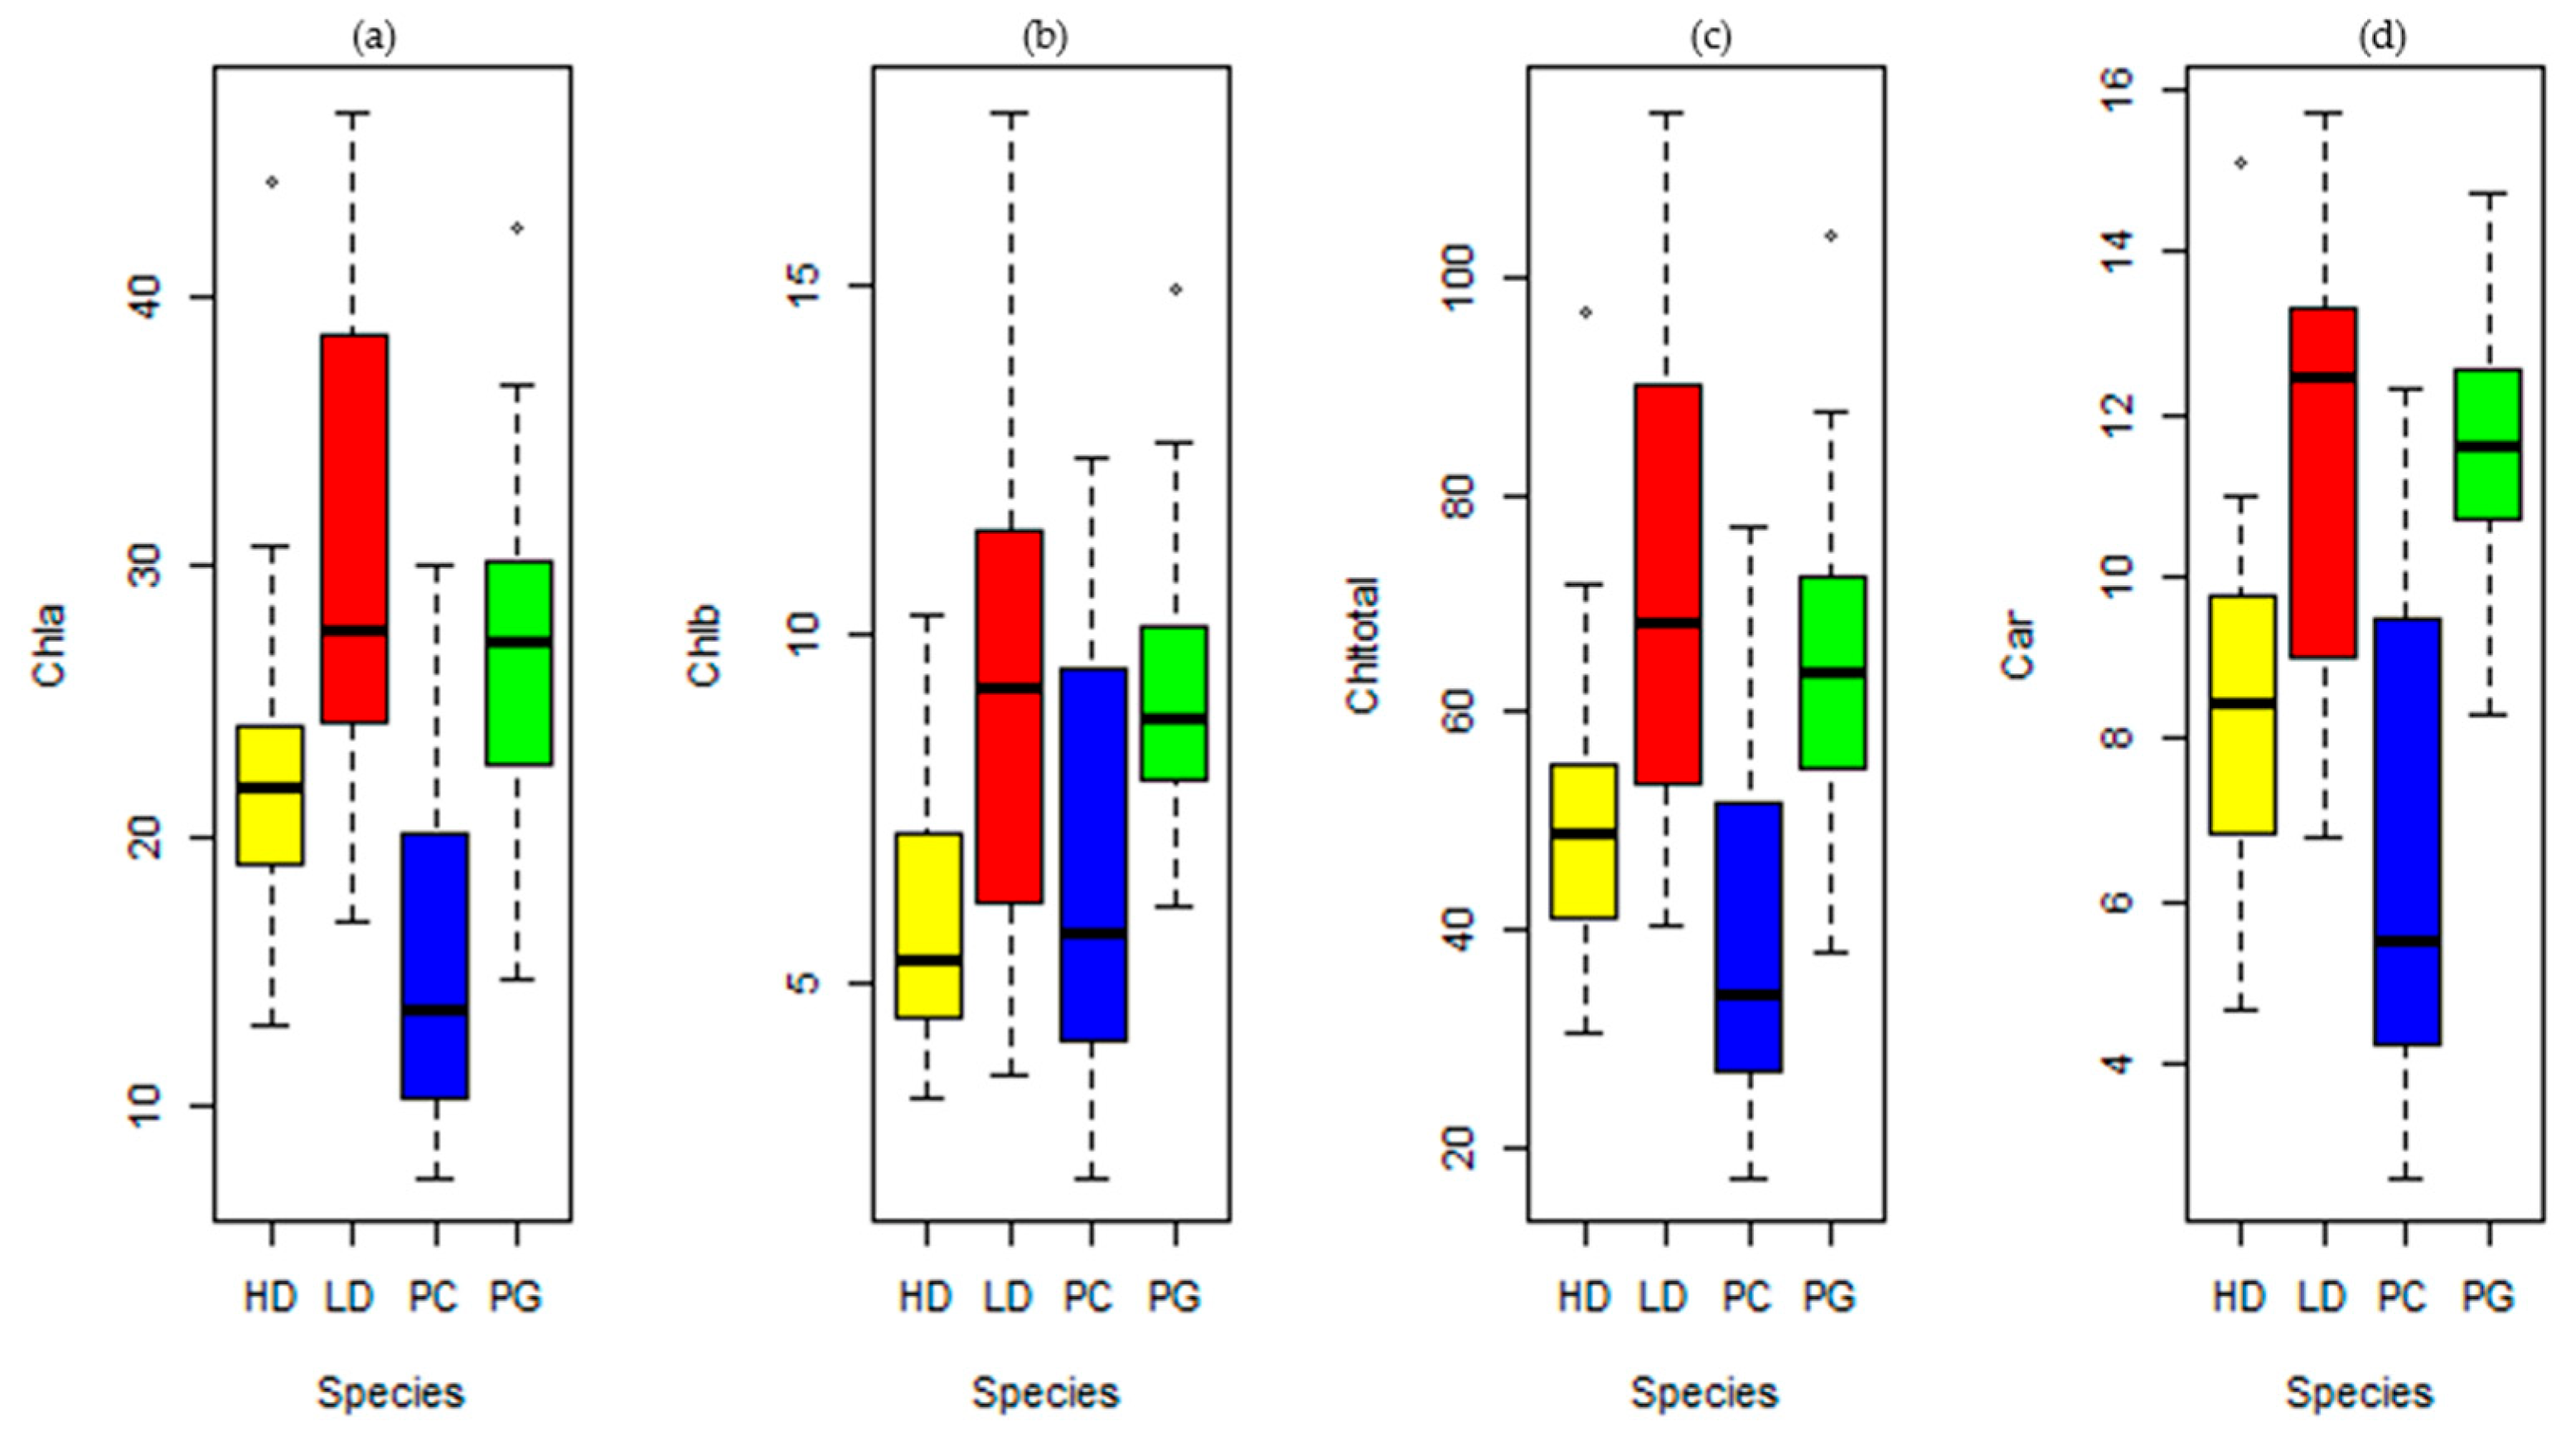
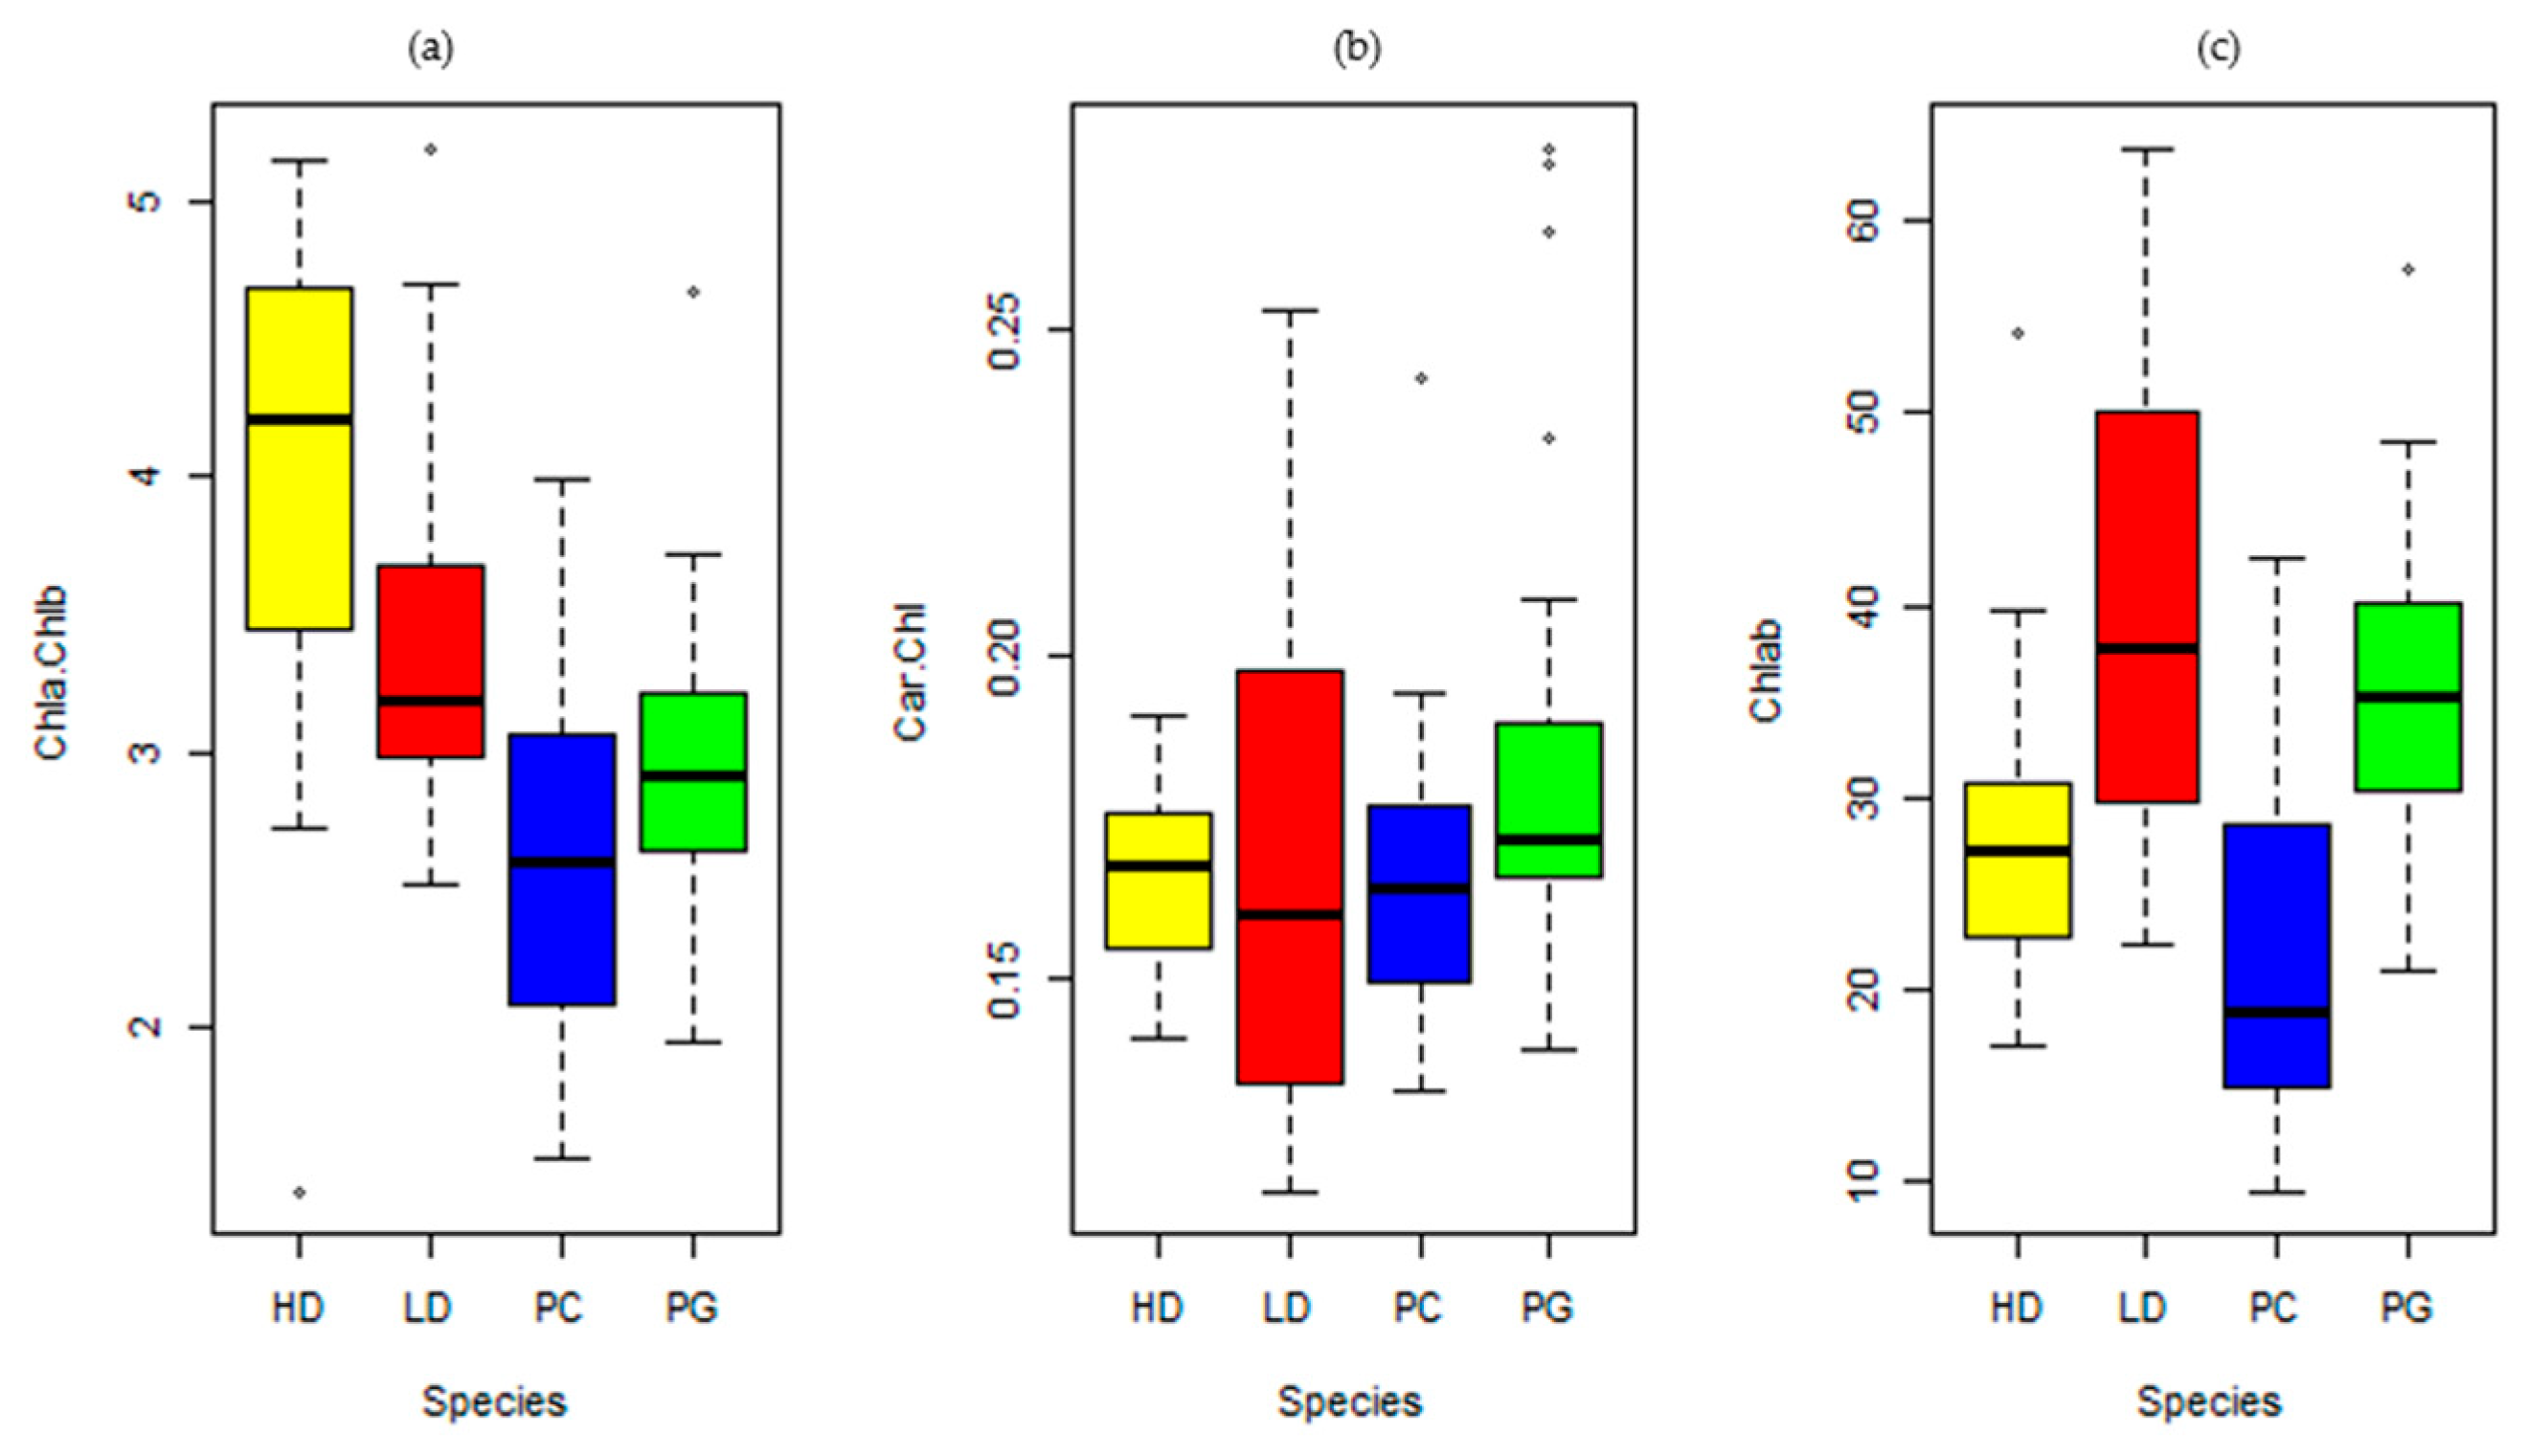
3.1.3. Photosynthetic Pigments

Photosynthetic pigments showed significant differences among the analyzed species groups, except for Car/Chl (Table 6). After the post hoc test, the differences found between the groups of corresponding invasive and native species, H. dulcis × L. divaricata and P. guajava × P. cattleianum, for the traits: Chla, Chlb, Chltotal, Car (Table 7).
For leaf chlorophyll a content (23.75 ± 8.98 µg cm−2), high values were indicated for L. divaricata (Chla = 30.38 µg cm−2) and P. guajava (Chla = 25.96 µg cm−2), then for H. dulcis (21.45 µg cm−2) and P. cattleianum (15.55 µg cm−2; Figure 5a). For chlo-rophyll b, high contents were also observed for L. divaricata (Chlb = 9.46 µg cm−2) and P. guajava (Chlb = 8.88 µg cm−2), followed by P. cattleianum (Chlb = 6.42 µg cm−2) and H. dulcis (Chlb = 5.9 µg cm−2; Figure 5b). Again, L. divaricata (Chl = 115.3 µg cm−2; Chl a + b = 63.8 µg cm−2) and P. guajava (Chl = 103.8 µg cm−2; Chl a + b = 57.4 µg cm−2) showed greater Chl and Chl a + b contents (Figure 5c and Figure 6c). In general, IAS presented less intraspecific variability, on average, than native species.
The lowest Chla/Chlb rates were associated with the Psidium congeneric species, such as P. cattleianum (Chla/Chlb = 2.58) and P. guajava (Chla/Chlb = 2.85; Figure 6a). Our results showed that although these species are described as initial secondary, in general, they could present shade-tolerant behavior. This suggests that P. guajava is also capable of extending the range of invasion from degraded areas and forest edges, where it usually occurs, to the understory of subtropical forests and, consequently, this should alert land managers to the risk. In contrast, H. dulcis showed the highest Chla/Chlb rates (Chla/Chlb = 2.58). This was expected as this IAS is associated with light demand characteristics, and, therefore, its invasion process is favored by the degradation and disturbance of forest ecosystems
Generally, leaf carotenoid content is found in the same proportion as chlorophyll a in the PSI and PSII photosystems. However, we found carotenoids to be around 2.5 times more abundant than Chl a. The highest contents were described for L. divaricata (Car = 11.49 µg cm−2) and P. guajava, which also had the highest Car/Chl ratio (Car = 11.59 µg cm−2; Car/Chl = 0.18; Figure 5d and Figure 6b).

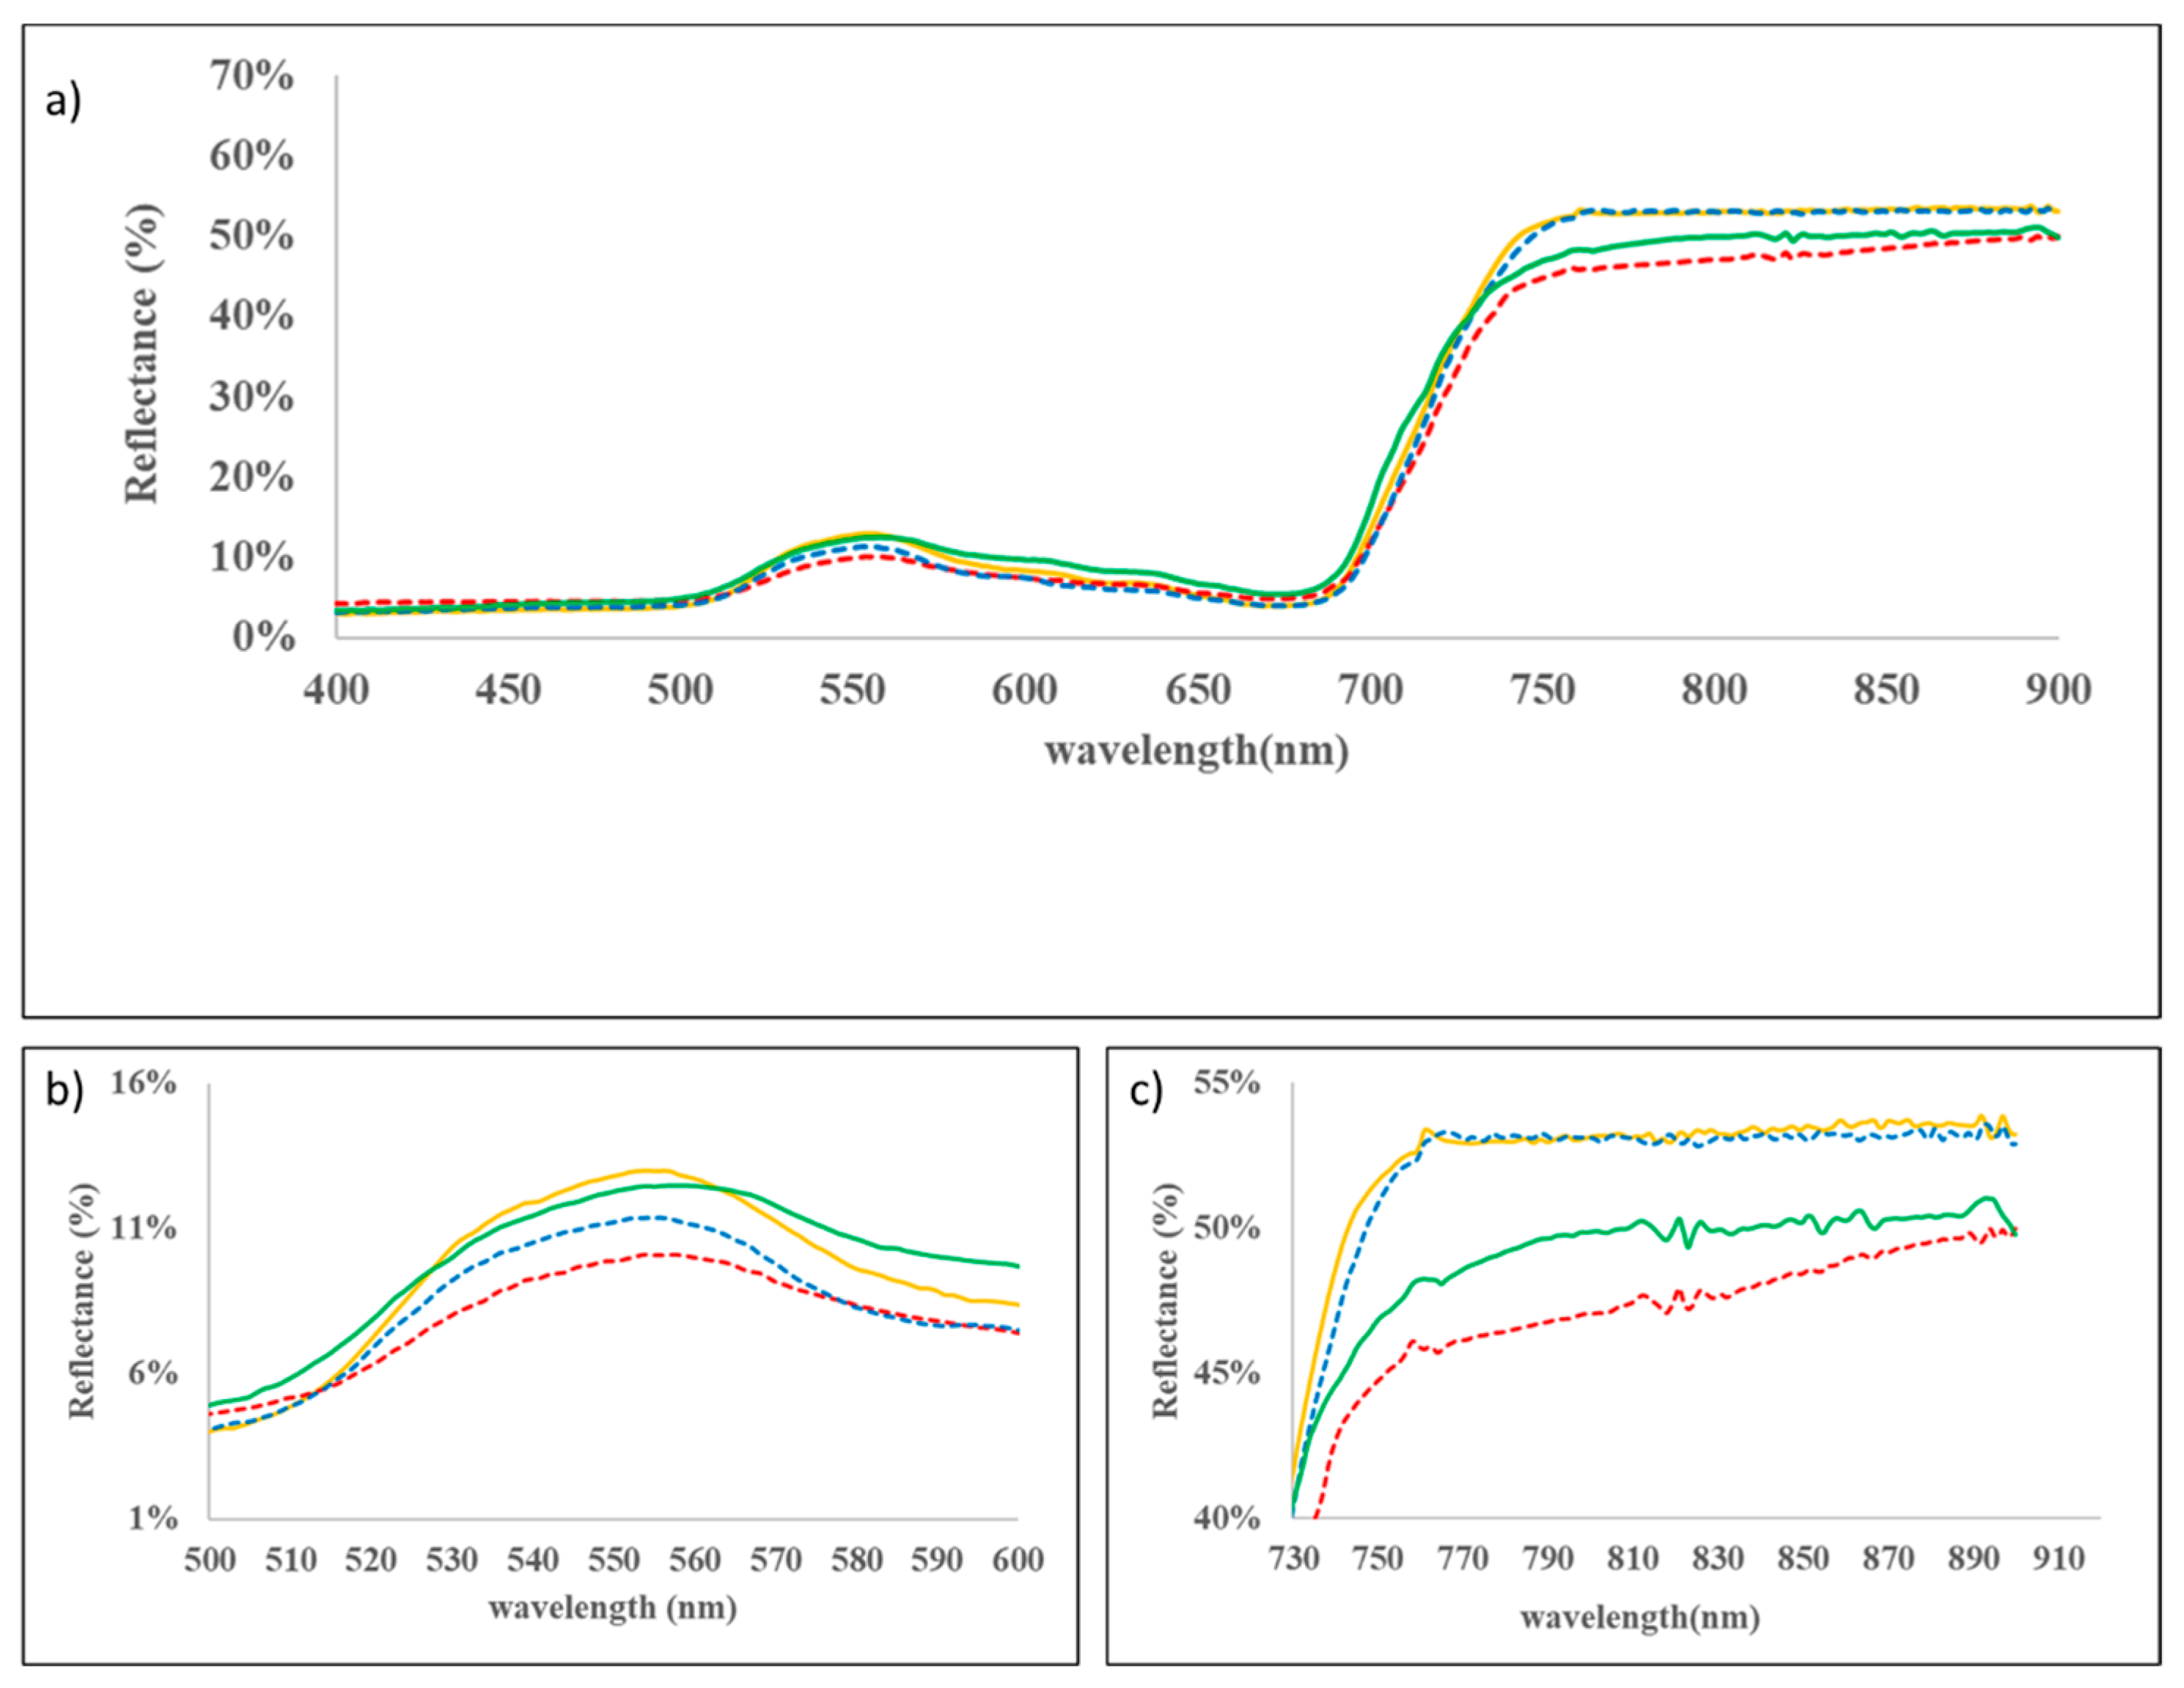
3.2. Leaf Spectral Reflectance

Differences in the spectral feature of species occur mainly in magnitude, as observed for the species shown here in Figure 7a. Two spectral regions showed a greater difference in features between species, the region of the spectral domain of green and NIR. In the green range, a gradual increase was observed for all species (Figure 7b), which was even higher for the invasive species. Furthermore, there was an approximation between the native species (P. cattleianum and L. divaricata) and, consequently, a greater distance in terms of magnitude, compared to the invasive species (P. guajava and H. dulcis). Results also showed that, in general, the NIR region of the spectrum was able to distinguish the invasive species with deciduous characteristics. The highest reflectance values were for the invasive H. dulcis (55%) when compared to the native L. divaricata (45%; Figure 7c).

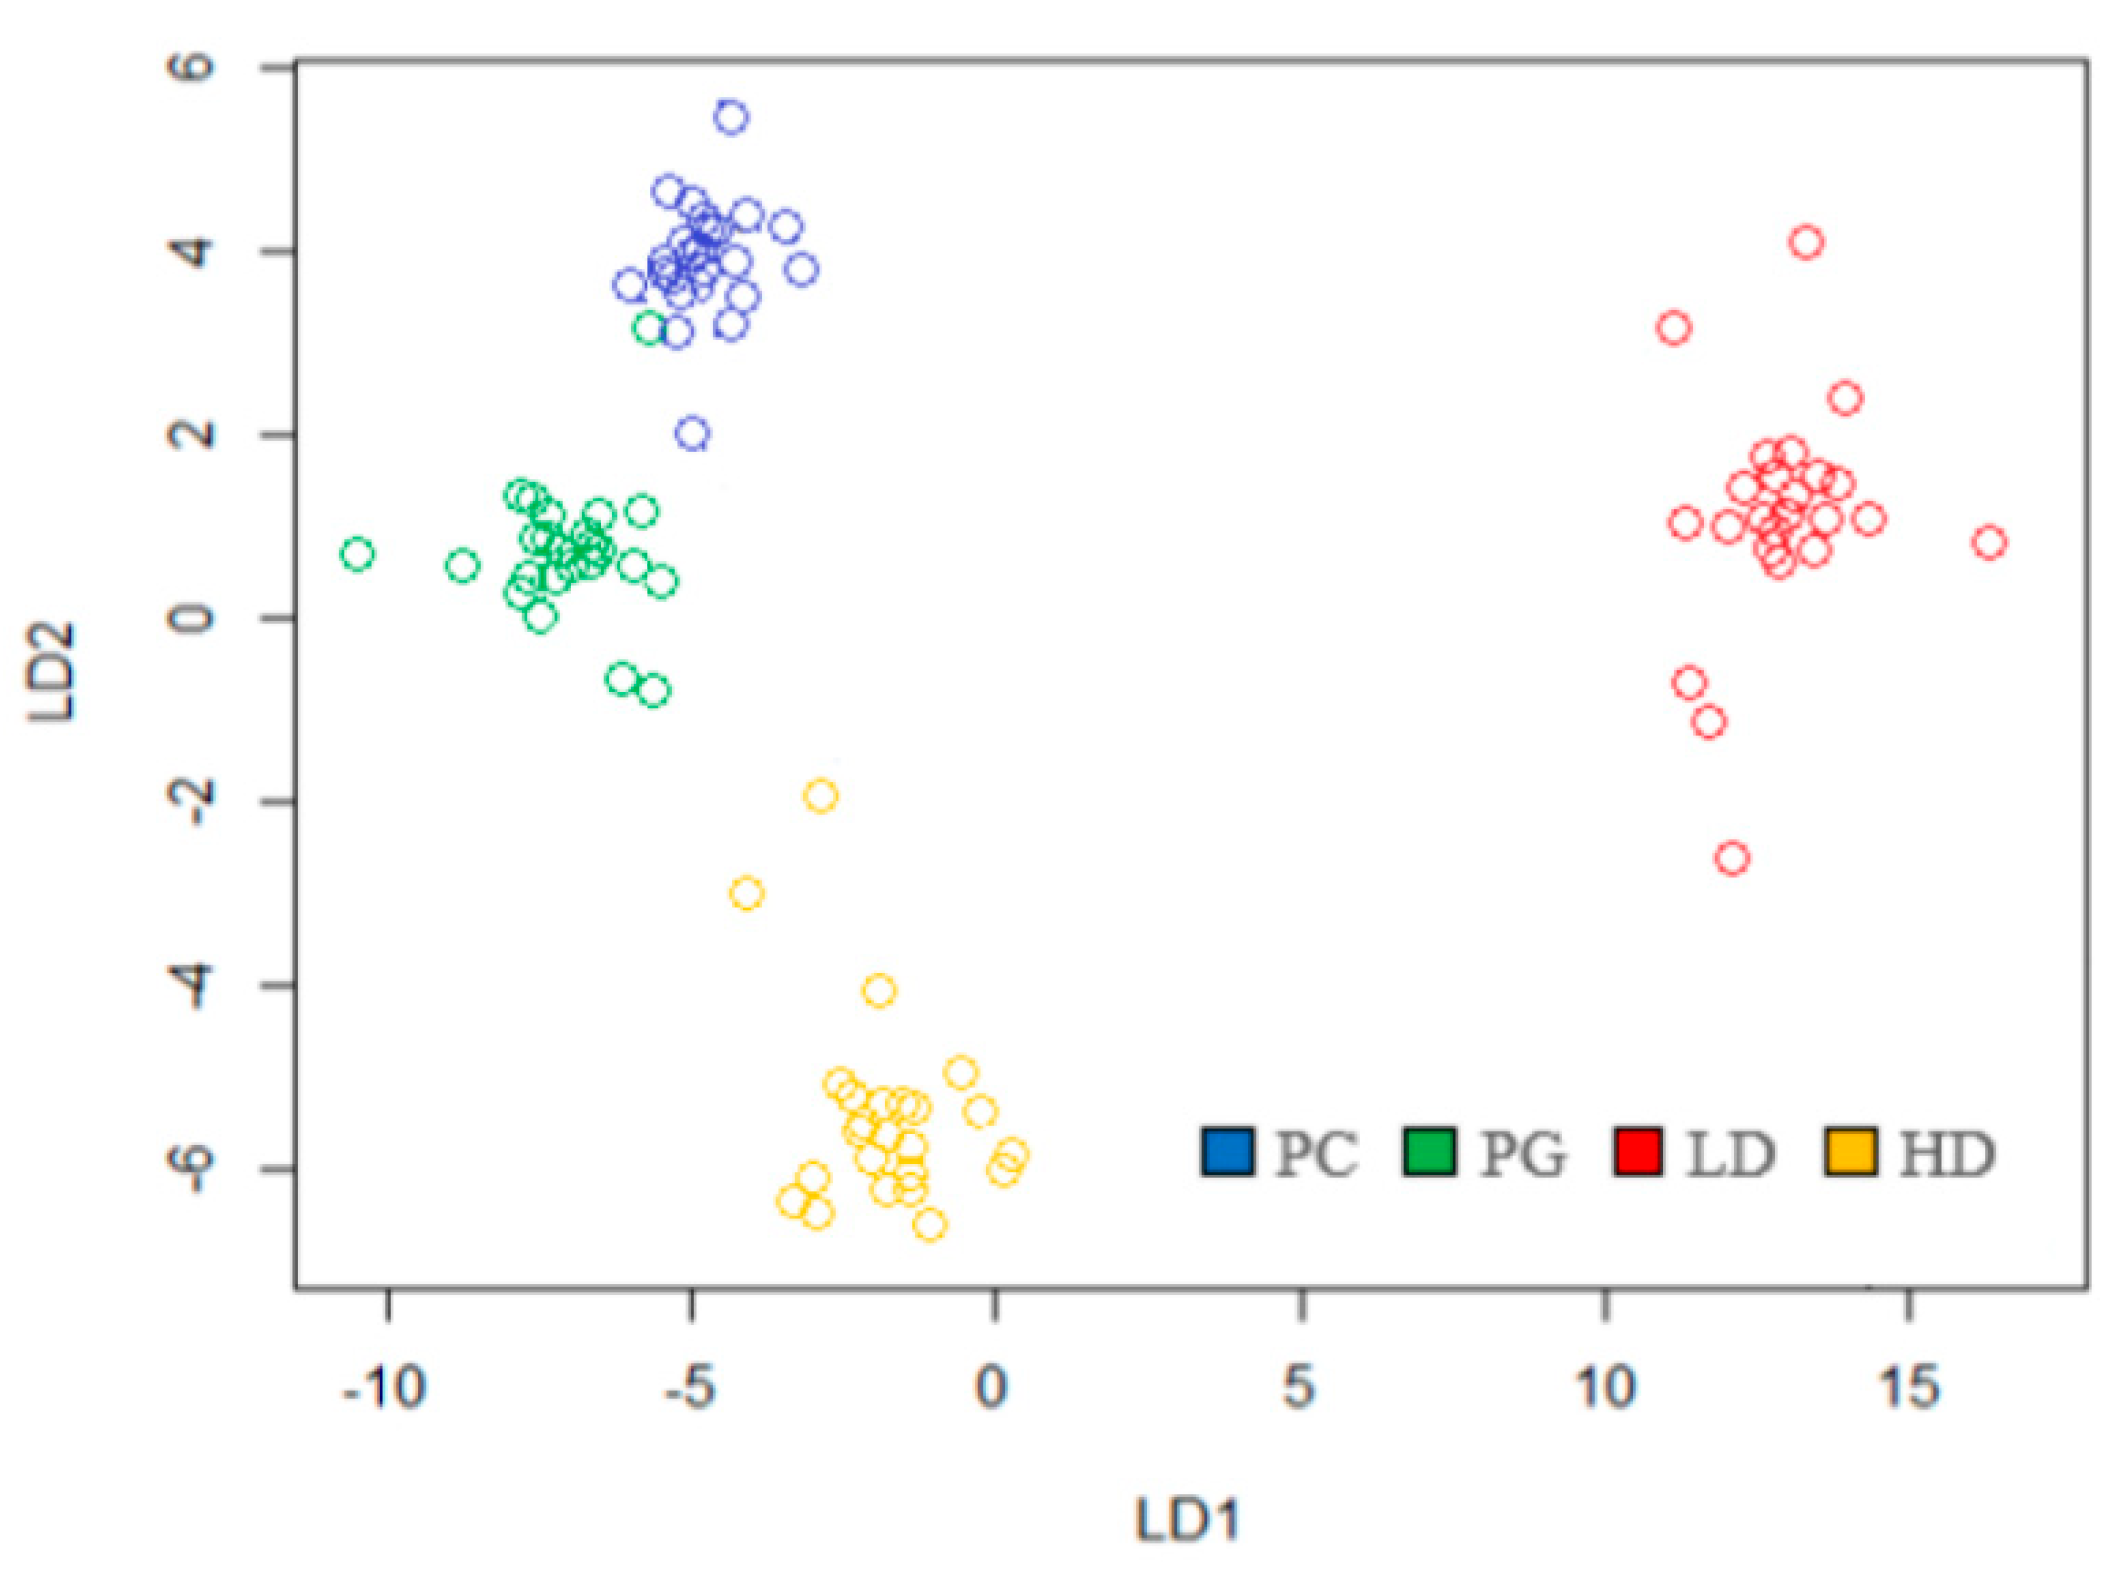
3.3. Discrimination of Reflectance Spectra

For the discrimination between native and invasive species, the model created using LDA achieved an overall accuracy of 97% via the 70/30 method, which indicates accurate discrimination. While LD1 clearly separated the native L. divaricata, LD2 was effective for the invasive H. dulcis. For the discrimination of the invasive P. guajava and the native P. cattleianum, the combination of the first and second discriminants was necessary (Figure 8).
The confusion matrix of the best-performing LDA model (Table 8) demonstrates the ability of generalization for the total set of samples, which achieved 95% classification accuracy.
The stepwise method was applied to identify the most informative variables that contributed to distinguishing IAS from native species. Thus, 32 spectral bands from the visible range were selected as the most significant for discriminating the species in this study (Table 9). Moreover, these bands are where pigment absorption features can be detected.

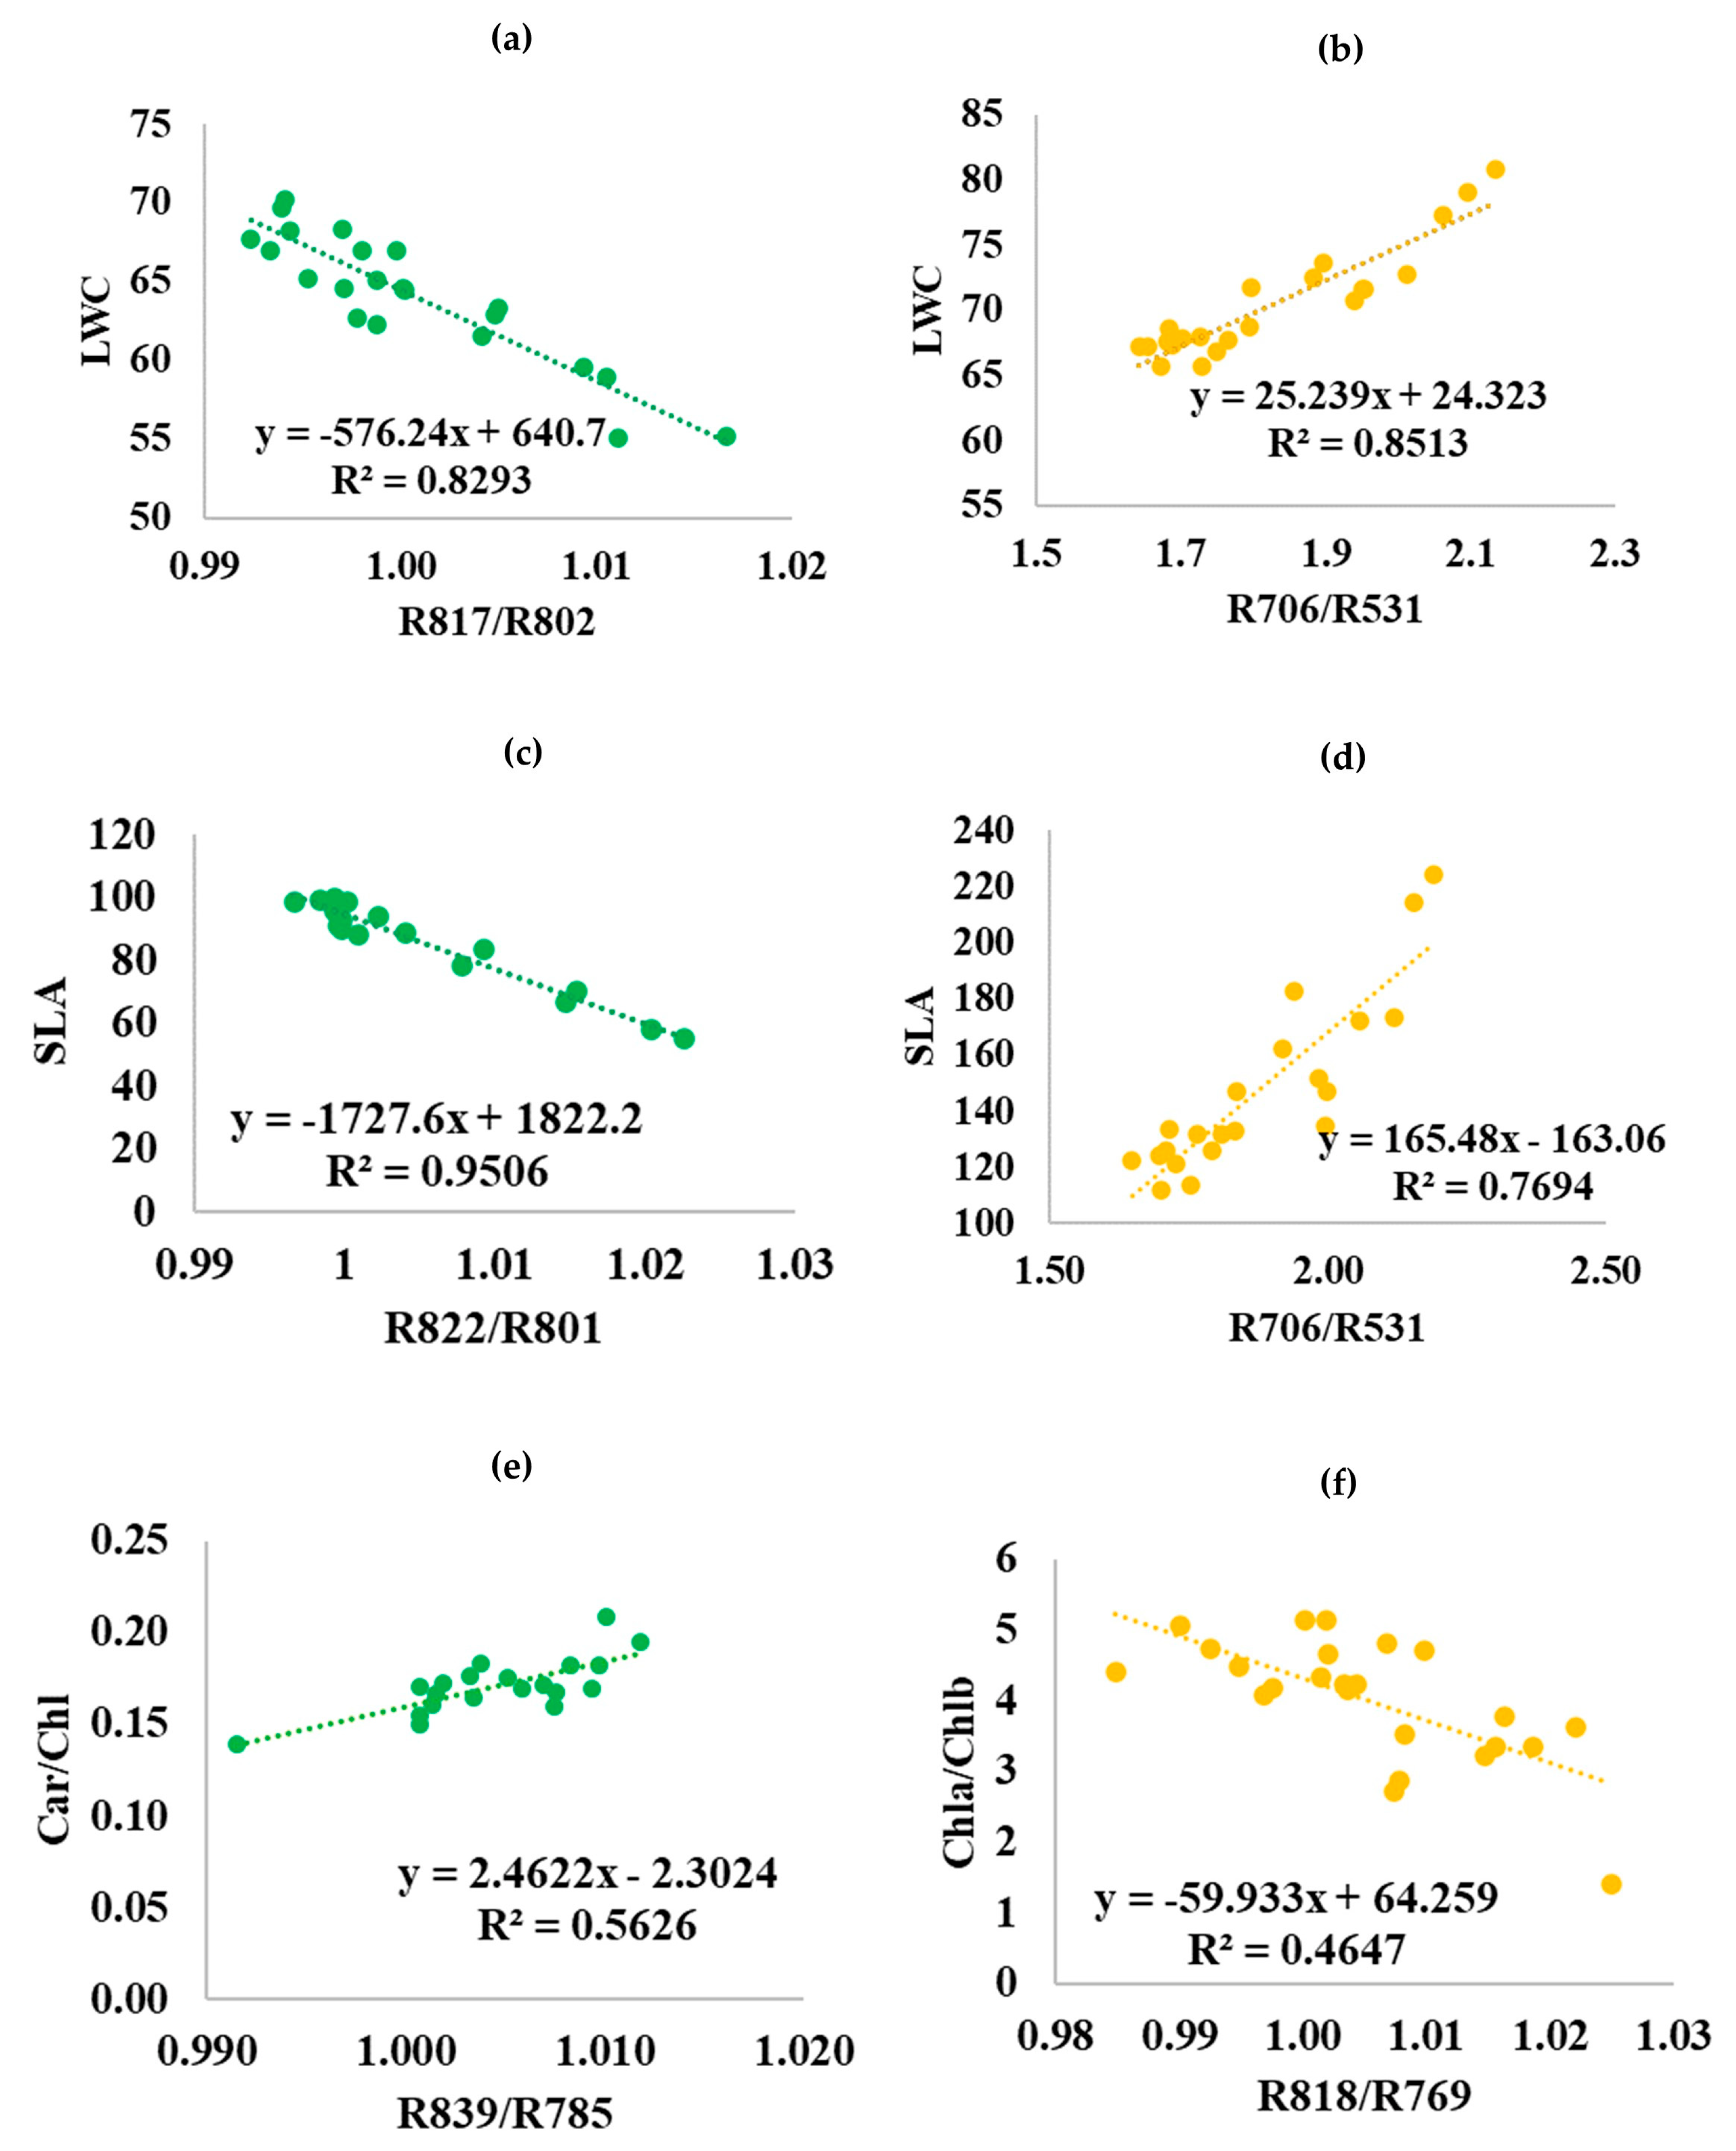
3.4. Leaf Optical Properties of the Invasive Target Species

The most significant simple ratio (SR) was individually selected for each leaf trait of each IAS. The most-significant optical properties for each group of leaf traits (water content, vegetation structure and photosynthetic pigments) are shown in in Table 10 and Figure 9. The total set of leaf traits analyzed, and their respective SR can be found in the Supplementary Materials (see Tables S2 and S3, and Figures S2 and S3).
According to the simple linear regression (Figure 9), P. guajava expressed the strongest correlations in NIR. The NIR reflectance ratio between 817 and 802 nm was correlated with LWC (r = 0.91), thus it was one of the best bands to predict the water content in P. guajava leaves (Figure 9a). However, we know that this result may not be exclusively related to water content. For SLA, a narrow waveband of NIR (R822/R801) showed good accuracy (r2 = 0.95) (Figure 9c). For Car/Chl, the spectral behavior of the species suggests an increase in reflectance at 839 nm and 785 nm) (r = 0.75), and an increase in carotenoids in leaves at the same time (Figure 9e).
Additionally, the other invasive species, H. dulcis, showed a strong correlation with LWC (r = 0.92) and SLA (r = 0.88) at the same reflectance ratio (R706/R532) in the visible region of the spectrum (Figure 9b,d). Lastly, Chla/Chlb was best correlated with R818 (NIR) and R769 (red) (Figure 9f). Analyzing the increase in reflectance in NIR, we can relate it to a decrease in chlorophyll a content and, consequently, an increase in chlorophyll b.

4. Discussion

The detection and mapping of IAS still represents a major challenge in remote sensing, especially in complex forest ecosystems [42,78]. Tropical and subtropical forests, mainly in the Atlantic Forest domain, still have not been studied in depth [79]. In this paper, the use of field spectrometry for native and invasive tree species discrimination was developed based on leaf functional traits and proved to be appropriate.

4.1. Characterization of Leaf Functional Traits and Spectral Behavior

The optical properties of leaves are related to their biochemical composition and structure depending on the species and the phenological age of the leaves [28]. Considering that the spectral curves of green leaves are generally similar in shape, the difference is mainly in magnitude, as was observed for the species in our study. The optical properties of water are well known [80], and EWT and FMC are two different ways to define leaf water content. As described by [81], these two attributes are perfectly correlated when LMA is constant. However, this was not observed since LMA was not constant for our species. In general, IAS presented lower FWC, FMC and EWT when compared to the native species. Mainly, low FMC values may suggest that invasive species are more susceptible to fire at leaf and canopy levels, thus increasing the risk of wildfires in invaded areas [80,81,82,83].
Leaf reflectance proved successful for generating LMA and SLA estimates [84]. However, there appears to be little agreement between physical and empirical bases of the methods, beyond which spectral wavelengths fit best for estimation [85]. Quantitative information on LMA provides a better understanding of the taxonomy of functional groups, regulation of physiological mechanisms and ecosystem functioning [86,87,88]. On the other hand, SLA is considered one of the main functional traits that drive plant differentiation since it is directly related to the efficiency of water use and, therefore, consists of a variable potential for the spectral characterization of vegetation [89,90,91,92,93]. Overall, deciduous species showed higher SLA than evergreen species; however, when the species were classified based on their origins, the IAS had higher SLA values, thus summarizing ecological strategies such as those related to the acquisitive end of the leaf economic spectrum and faster growing species [94]. The values obtained for LMA in this study confirm what was described by [28], i.e., that deciduous species are associated with lower LMA (H. dulcis and L. divaricata) when compared to evergreen species (P. guajava and P. cattleianum).
Photosynthetic pigments indicate that there is potential to differentiate species [80]. A marked difference was noticed in the green region at 550 nm, as mentioned by [95]. Additionally, the near-infrared reflectance plateau at 850 nm indicates the wavelength region with the greatest reflectance as well as the greatest differences between species [28]. The red edge, around 750 nm, demonstrates a distinct reflectance peak between the co-competing invasive and native species (H. dulcis × L. divaricata and P. guajava × P. cattleianum).

4.2. Spectral Discrimination of IAS from Native Species

Our results show that the VIS wavelengths are an important spectral region for discriminating the species, especially for pigment absorption features [28,96,97]. Moreover, differences in pigment content in the visible range are detected when comparing invasive and native species at the same site. [40] discriminated more plant species pairs (invasive species from the native species) within VIS regions (84%) than in NIR regions (60%). Our study also confirms the limitations of NIR as mentioned by [98] for 26 tree species in a tropical dry forest in Costa Rica. The reflectance in NIR has shown to be more promising for differentiating tree functional types based on leaf phenology (evergreen and deciduous species) than for differentiating IAS from the native community.

4.3. Leaf Optical Properties of IAS

Understanding the relationship between leaf functional traits and optical types of plants is still a knowledge gap [99]. Thus, we sought to fill this gap mainly on IAS in this study. Psidium guajava expressed the strongest correlations for LWC and SLA in NIR. Previous studies also proposed models based on wavelengths located in the NIR region for SLA [87,100] and for LWC [101]. Carotenoid and Car/Chl ratio contents represent indicators of photosynthetic activity and photoprotective mechanisms in plants [97]. Recently, [102] proposed two models exclusively in the VIS region (500, 660 and 700 nm) and accurately described Car/Chl changes in the range from 0.15 (r2 = 0.87) to 0.6 (r2 = 0.82), requiring no species-specific parameterization. Although the response obtained in our study may suggest the activation of photoprotection mechanisms by the species [97]. Hovenia dulcis, however, was optically significant for LWC and SLA in a narrow waveband of the visible region (R706/R530). Additionally, we found that the species seems to be water-efficient, even though water absorption is low in this region [103], and high correlations may be associated with leaf chlorophyll content [104] and structural aspects [28]. Even so, we must consider that the species did not have excessive losses in terms of water content, and the increase in visible reflectance reflects the increase in liquid water content.

5. Conclusions

It was shown that field spectroscopy is a potential method for correct discrimination of IAS from their co-occurring native species in the subtropical Brazilian Atlantic Forest. Although this method requires target species parameterization, these results are consistent, and the technique may be extended to other IAS and sites within the same subtropical forest ecosystem. This study is also important for the development of Dossel models with the goal of increasing the space–time resolution, and can be used with airborne or space-based remote sensing. We emphasize the importance of adding species leaf traits to the spectral database, as this may advance the expansion of knowledge in the field. Finally, the outcomes observed in this study may contribute to monitoring and improving IAS control practices in protected areas.
From this study we can conclude that:
  • Linear discriminant analysis (LDA) can be used to accurately discriminate Psidium guajava and Hovenia dulcis from Psidium cattleianum and Luehea divaricata;
  • The greatest discrimination for IAS is located in the VIS region, specifically in the red (705 nm) and green regions (553 nm), which are known for being highly sensitive to pigment content variation. This suggests improved separability in chlorophyll absorption pits, as it also may suggest that the difference in anthocyanin content may enhance discrimination between species;
  • For both IAS, the LWC and SLA showed similar behavior;
  • P. guajava correlated to Car/Chl (R = 0.75) in NIR (R839/R785), which may suggest photoprotection activation. This provides an efficient process of acclimatization to environments normally unfavorable for other species;
  • H. dulcis was best correlated to Chla/Chlb at R818/R769 (R = 0.7), which may suggest that photosynthetic activity is maintained even under conditions of high luminosity and temperature;
  • IAS showed good correlation with Car/Clh and Chla/Chlb. Therefore, we may extend the space-time resolution based on data from orbital and suborbital platforms.

Supplementary Materials

The following are available online at https://www.mdpi.com/article/10.3390/rs15030791/s1, Figure S1. Native-invasive species pairs according to tree functional types based on leaf phenology (columns: evergreen and deciduous species), and origin occurrence (lines: native and invasive species). Images were obtained by scanning the leaves in the laboratory. Figure S2. Simple linear regression (SLR) for the most significant functional optical properties and simple ratios (SR). Regressions are performed for the target invasive species Psidium guajava (PG). Water content: (a) FMC (%) = Fuel moisture content; (b) EWT (g cm−2) = Equivalent water thickness; Vegetation structure: (c) LMA (g cm−2) = Leaf mass area; Photosynthetic pigments (d) Chl (µg cm−2) = Total chlorophyll, (e) Chla+b (µg cm−2) = Sum of chlorophyll a and b, (f) Chla (µg cm−2) = Chlorophyll a, (g) Chlb (µg cm−2)= Chlorophyll b, (h) Car (µg cm−2) = Carotenoid,(i) Chla/Chlb = Chlorophyll a:b ratio. Significant results at α = 0.01, and at a 99% confidence level (p-value < 0.01). Figure S3. Simple linear regression (SLR) for the most significant functional optical properties and simple ratios (SR). Regressions are performed for the target invasive species Hovenia dulcis (HD). Water content: (a) FMC (%) = Fuel moisture content; (b) EWT (g cm−2) = Equivalent water thickness; Vegetation structure: (c) LMA (g cm−2) = Leaf mass area; Photosynthetic pigments: (d) Chl (µg cm−2) = Total chlorophyll, (e) Chla+b (µg cm−2) = Sum of chlorophyll a and b, (f) Chla (µg cm−2) = Chlorophyll a,(g) Chlb (µg cm−2) = Chlorophyll b, (h) Car (µg cm−2) = Carotenoid, (i) Car/Chl = Carotenoid: total chlorophyll ratio. Significant results at α = 0.01, and at a 99% confidence level (p-value < 0.01). Table S1. Comparative table of study target species (native x invasive) with key taxonomic, morphological, biological and ecological characteristics. Table S2. Summary of statistical analysis of 12 leaf traits for 96 subsamples collected from the four target species, namely P. cattleianum, P. guajava, L. divaricata and H. dulcis. FMC (%) = fuel moisture content; LWC (%) = liquid water content; EWT (g cm−2) = equivalent water thickness; LMA (g cm−2) = leaf mass per area; SLA (cm² g−1) = specific leaf area; Chla (µg cm−2) = chlorophyll a content; Chlb (µg cm−2) = chlorophyll b content; Chl (µg cm−2) = total chlorophyll content; Car (µg cm−2) = carotenoid content; Chla/Chlb = chlorophyll a:b ratio; Car/Chl = carotenoid:total chlorophyll ratio; Chla+b = sum of chlorophyll a and b. Significant results at α = 0.05. Table S3. Summary of the other leaf characteristics of Psidium guajava and the respective most significative simple ratio (SR); n = number of samples, r = simple ratio correlation; r² = coefficient of determination; RMSR = root mean square error; CV = coefficient of variation; RSS = residual sum of squares. Significant results at α = 0.01, and at a 99% confidence level (p-value < 0.01). Table S4. Summary of the other leaf characteristics of Hovenia dulcis and its respective most significative simple ratio (SR); n = number of samples, r = simple ratio correlation; r² = coefficient of determination; RMSR = root mean square error; CV = coefficient of variation; RSS = residual sum of squares. Significant results at α = 0.01, and at a 99% confidence level (p-value < 0.01).

Author Contributions

Conceptualization, C.L.M. and W.P.F.; methodology, C.L.M., W.P.F., J.B.B.D., L.A.T. and F.M.D.; formal analysis, C.L.M. and F.M.D.; resources, C.L.M., W.P.F., L.A.T. and F.M.D.; writing—original draft preparation, C.L.M. and J.B.B.D.; writing—review and editing, C.L.M., W.P.F., J.B.B.D., L.A.T. and F.M.D.; supervision, C.L.M.; project administration, W.P.F. All authors have read and agreed to the published version of the manuscript.

Funding

This research received no external funding.

Institutional Review Board Statement

Not applicable.

Informed Consent Statement

Not applicable.

Data Availability Statement

The data presented in this study are available on request from the corresponding author.

Acknowledgments

We would like to thank the Secretary of Environment and Infrastructure of Rio Grande do Sul—Brazil, in particular the entire team of the Quarta Colonia State Park. Thanks are also due to post-graduate course in Geography at the Federal University of Santa Maria, Brazil. As part of the ATTO project, FD acknowledges support from the German Federal Ministry of Education and Research (BMBF contracts 01LK1602F and 01LK2102D), as well as support from the KIT-Publication Fund of the Karlsruhe Institute of Technology.

Conflicts of Interest

The authors declare that there are no conflict of interest.

References

  1. Seebens, H.; Blackburn, T.; Dyer, E. No saturation in the accumulation of alien species worldwide. Nat. Commun. 2017, 8, 14435. [Google Scholar] [CrossRef] [PubMed]
  2. Seebens, H.; Bacher, S.; Blackburn, T.M.; Capinha, C.; Dawson, W.; Dullinger, S.; Genovesi, P.; Hulme, P.E.; Kleunen, M.V.; Kühn, I.; et al. Projecting the continental accumulation of alien species through to 2050. Glob. Change Biol. 2021, 27, 970–982. [Google Scholar] [CrossRef] [PubMed]
  3. Vilà, M.; Espinar, J.L.; Hejda, M.; Hejda, M.; Hulme, P.E.; Jarosík, V.; Maron, J.L.; Pergl, J.; Schaffner, U.; Sun, Y.; et al. Ecological impacts of invasive alien plants: A meta-analysis of their effects on species, communities and ecosystems. Ecol. Lett. 2011, 14, 702–708. [Google Scholar] [CrossRef] [PubMed]
  4. Hulme, P.E. Beyond control: Wider implications for the management of biological invasions. J. Appl. Ecol. 2006, 43, 835–847. [Google Scholar] [CrossRef]
  5. International Union for Conservation of Nature (IUCN). IUCN Guidelines for the Prevention of Biodiversity Loss due to Biological Invasion. Species, 31, 28–42. Available online: https://portals.iucn.org/library/efiles/documents/Rep-2000-052.pdf (accessed on 27 April 2020).
  6. Diagne, C.; Leroy, B.; Vaissière, A.C. High and rising economic costs of biological invasions worldwide. Nature 2021, 592, 571–576. [Google Scholar] [CrossRef]
  7. Golivets, M.; Wallin, K.F. Neighbour tolerance, not suppression, provides competitive advantage to non-native plants. Ecol. Lett. 2018, 21, 745–759. [Google Scholar] [CrossRef] [Green Version]
  8. Medvecká, J.; Jarolímek, I.; Hegedüšová, K. Forest habitat invasions—Who with whom, where and why. For. Ecol. Manag. 2018, 409, 468–478. [Google Scholar] [CrossRef]
  9. Foxcroft, L.C.; Pyšek, P.; Richardson, D.M.; Genovesi, P.; MacFadyen, S. Plant invasion science in protected areas: Progress and priorities. Biol. Invasions 2017, 19, 1353–1378. [Google Scholar] [CrossRef]
  10. Ministério do Meio Ambiente (MMA). Unidades de Conservação: O Que São. Available online: https://www.mma.gov.br/areas-protegidas/unidades-de-conservação/o-que-sao.html (accessed on 6 May 2020).
  11. Ribeiro, M.C.; Metzger, J.P.; Martensen, A.C.; Ponzoni, F.J.; Hirota, M.M. The Brazilian Atlantic Forest: How much is left, and how is the remaining forest distributed? Implications for conservation. Biol. Conserv. 2009, 142, 1141–1153. [Google Scholar] [CrossRef]
  12. Dechoum, M.S.; Sühs, R.B.; Futada, S.M.; Ziller, S.R. Distribution of Invasive Alien Species in Brazilian Ecoregions and Protected Areas. In Invasive Alien Species: Observations and Issues from Around the World, 1st ed.; Pullaiah, T., Ielmini, M.R., Eds.; Wiley: Hoboken, NJ, USA, 2021; Volume 4, pp. 24–42. [Google Scholar]
  13. Stadler, J.; Trefflich, A.; Klotz, S.; Brandl, R. Exotic plant species invade diversity hot spots: The alien flora of northwestern Kenya. Ecography 2000, 23, 169–176. [Google Scholar] [CrossRef]
  14. Stohlgren, T.J. Beyond theories of plant invasions: Lessons from natural landscapes. Comments Biol. 2002, 7, 355–379. [Google Scholar] [CrossRef]
  15. Stohlgren, T.J.; Jarnevich, W.E.C.; Morisette, J.T. Bounding Species-Environmental Matching Models. Curr. Zool. 2011, 57, 642–647. [Google Scholar] [CrossRef] [Green Version]
  16. Foxcroft, L.C.; Richardson, D.M.; Rouget, M.; Macfadyen, S. Patterns of alien plant distribution at multiple spatial scales in a large national park: Implications for ecology, management and monitoring. Divers. Distrib. 2009, 15, 367–378. [Google Scholar] [CrossRef]
  17. Foxcroft, L.C.; Jarosick, P.P.; Richardson, D.M.; Rouget, M. Protected-Area Boundaries as Filters of Plant Invasions. Conserv. Biol. 2011, 25, 2. [Google Scholar] [CrossRef] [Green Version]
  18. Didham, R.K.; Tylianakis, J.M.; Hutchison, M.A.; Ewers, R.M.; Gemmell, N.J. Are invasive species the drivers of ecological change? Trends Ecol. Evol. 2005, 20, 9. [Google Scholar] [CrossRef]
  19. Simberloff, D.; Von Holle, B. Positive interactions of nonindigenous species: Invasional meltdown? Biol. Inv. 1999, 1, 21–32. [Google Scholar] [CrossRef]
  20. Witt, A.; Beale, T.; Van Wilgen, B.W. An assessment of the distribution and potential ecological impacts of invasive alien plant species in eastern Africa. Transit. R. Soc. South Afr. 2018, 73, 3. [Google Scholar] [CrossRef] [Green Version]
  21. Allen, J.A.; Brown, C.S.; Stohlgren, T.J. Non-native plant invasions of United States National Parks. Biol. Invasions 2009, 11, 21–95. [Google Scholar] [CrossRef]
  22. Moodley, D.; Angulo, E.; Cuthbert, R.N.; Leung, B.; Turbelin, A.; Novoa, A.; Kourantidou, M.; Heringer, G.; Haubrock, P.J.; Renault, D.; et al. Surprisingly high economic costs of biological invasions in protected areas. Biol. Invasions 2022, 24, 1995–2016. [Google Scholar] [CrossRef]
  23. Jacquemoud, S.; Ustin, S. Leaf Optical Properties, 1st ed.; Cambridge University Press: Cambridge, UK, 2019; pp. 12–47, 320–556. [Google Scholar]
  24. Serbin, S.P.; Townsend, P.A. Scaling Functional Traits from Leaves to Canopies. In Remote Sensing of Plant Biodiversity; Cavender-Bares, J., Gamon, J., Townsend, P., Eds.; Springer: Cham, Switzerland, 2020. [Google Scholar]
  25. Eugenio, F.C.; Schons, C.T.; Mallmann, C.L.; Schuh, M.S.; Fernandes, P.; Badin, T.L. Remotely piloted aircraft systems and forests: A global state of the art and future challenges. Can. J. For. Research 2020, 50, 705–716. [Google Scholar] [CrossRef]
  26. Papp, L.; van Leeuwen, B.; Szilassi, P.; Tobak, Z.; Szatmári, J.; Árvai, M.; Mészáros, J.; Pásztor, L. Monitoring Invasive Plant Species Using Hyperspectral Remote Sensing Data. Land 2021, 10, 29. [Google Scholar] [CrossRef]
  27. Gholizadeh, H.; Friedman, M.S.; McMillan, N.A.; Hammond, W.M.; Hassani, K.; Sams, A.V.; Charles, M.D.; Garrett, D.R.; Joshi, O.; Hamilton, R.G.; et al. Mapping invasive alien species in grassland ecosystems using airborne imaging spectroscopy and remotely observable vegetation functional traits. Remote Sens. Environ. 2022, 271, 112887. [Google Scholar] [CrossRef]
  28. Bolch, E.A.; Santos, M.J.; Ade, C.; Khanna, S.; Basinger, N.T.; Reader, M.O.; Hestir, E.L. Remote Detection of Invasive Alien Species. In Remote Sensing of Plant Biodiversity; Cavender-Bares, J., Gamon, J., Townsend, P., Eds.; Springer Nature: Cham, Switzerland, 2020; pp. 267–307. [Google Scholar] [CrossRef]
  29. Khare, S.; Latifi, H.; Ghosh, S.K. Multi-scale assessment of invasive plant species diversity using Pléiades 1A, RapidEye and Landsat-8 data. Geocarto Int. 2018, 33, 681–698. [Google Scholar] [CrossRef]
  30. Große-Stoltenberg, A.; Hellmann, C.; Thiele, J.; Werner, C.; Oldeland, J. Early detection of GPP-related regime shifts after plant invasion by integrating imaging spectroscopy with airborne LiDAR. Remote Sens. Environ. 2018, 209, 780–792. [Google Scholar] [CrossRef]
  31. Piiroinena, R.; Fassnacht, F.E.; Heiskanen, J.; Maeda, E.; Mack, B.; Pellikka, P. Invasive tree species detection in the Eastern Arc Mountains biodiversity hotspot using one class classification. Remote Sens. Environ. 2018, 218, 119–131. [Google Scholar] [CrossRef]
  32. Niphadkar, M.; Nagendra, H. Remote sensing of invasive plants: Incorporating functional traits into the picture. Int. J. Remote Sens. 2016, 37, 3074–3085. [Google Scholar] [CrossRef]
  33. Diao, C.; Wang, L. Incorporating plant phenological trajectory in exotic saltcedar detection with monthly time series of Landsat imagery. Remote Sens. Environ. 2016, 182, 60–71. [Google Scholar] [CrossRef]
  34. Rajah, P.; Odindi, J.; Mutanga, O. Evaluating the potential of freely available multispectral remotely sensed imagery in mapping American bramble (Rubus cuneifolius). South Afr. Geogr. J. 2018, 100, 291–307. [Google Scholar] [CrossRef]
  35. Cheng, Y.B.; Tom, E.; Ustin, S.L. Mapping an invasive species, kudzu (Pueraria montana), using hyperspectral imagery in western Georgia. J. Appl. Remote Sens. 2007, 1, 013514. [Google Scholar] [CrossRef]
  36. Brenner, J.C.; Christman, Z.; Rogan, J. Segmentation of Landsat Thematic Mapper Imagery Improves Buffelgrass (Pennisetum Ciliare) Pasture Mapping in the Sonoran Desert of Mexico. Appl. Geogr. 2012, 34, 569–575. [Google Scholar] [CrossRef]
  37. Hantson, W.; Kooistra, L.; Slim, P.A. Mapping invasive woody species in coastal dunes in the Netherlands: A remote sensing approach using LIDAR and high-resolution aerial photographs. Appl. Veg. Sci. 2012, 15, 536–547. [Google Scholar] [CrossRef]
  38. Omeer, A.A.; Deshmukh, R.R. Improving the classification of invasive plant species by using continuous wavelet analysis and feature reduction techniques. Ecol. Inform. 2021, 61, 101181. [Google Scholar] [CrossRef]
  39. Tesfamichael, S.G.; Newete, S.W.; Adam, E.; Byrne, M.J. Discriminating pure Tamarix species and their putative hybrids using field spectrometer. Geocarto Int. 2021, 1–20. [Google Scholar] [CrossRef]
  40. Iqbal, I.M.; Balzter, H.; Shabbir, A. Identifying the Spectral Signatures of Invasive and Native Plant Species in Two Protected Areas of Pakistan through Field Spectroscopy. Remote Sens. 2021, 13, 4009. [Google Scholar] [CrossRef]
  41. Barbosa, J.M.; Asner, G.P.; Martin, R.E.; Baldeck, C.A.; Hughes, F.; Johnson, T. Determining Subcanopy Psidium cattleianum Invasion in Hawaiian Forests Using Imaging Spectroscopy. Remote Sens. 2016, 8, 33. [Google Scholar] [CrossRef] [Green Version]
  42. Tesfamichael, S.G.; Newete, S.W.; Adam, E.; Dubula, B. Field spectroradiometer and simulated multispectral bands for discriminating invasive species from morphologically similar cohabitant plants. GIScience Remote Sens. 2018, 55, 417–436. [Google Scholar] [CrossRef]
  43. Asner, G.P.; Martin, R.E. Spectral and chemical analysis of tropical forests: Scaling from leaf to canopy levels. Remote Sens. Environ. 2008, 112, 3958–3970. [Google Scholar] [CrossRef]
  44. Resasco, J.; Hale, A.N.; Henry, M.C.; Gorchov, D.L. Detecting an invasive shrub in a deciduous forest understory using late-fall Landsat sensor imagery. Int. J. Remote Sens. 2007, 28, 3739–3745. [Google Scholar] [CrossRef]
  45. Wilfong, B.N.; Gorchov, D.L.; Henry, M.C. Detecting an invasive shrub in deciduous forest understories using remote sensing. Weed Sci. 2009, 57, 512–520. [Google Scholar] [CrossRef]
  46. Asner, G.P.; Martin, R.E.K.; Carlson, M.; Rascher, U.; Vitousek, P.M. Vegetation-Climate Interactions among Native and Invasive Species in Hawaiian Rainforest. Ecosystems 2006, 9, 1106–1117. [Google Scholar] [CrossRef]
  47. Somers, B.; Asner, G.P. Hyperspectral Time Series Analysis of Native and Invasive Species in Hawaiian Rainforests. Remote Sens. 2012, 4, 2510–2529. [Google Scholar] [CrossRef] [Green Version]
  48. Asner, G.P.; Jones, M.O.; Martin, R.E.; Knapp, D.E.; Hughes, R.F. Remote Sensing of Native and Invasive Species in Hawaiian Forests. Remote Sens. Environ. 2008, 112, 1912–1926. [Google Scholar] [CrossRef]
  49. Muchoney, D.M. Earth observations for terrestrial biodiversity and ecosystems. Remote Sens. Environ. 2008, 112, 1909–1911. [Google Scholar] [CrossRef]
  50. Cavender-Bares, J.; Schweiger, A.K.; Pinto-Ledesma, J.N.; Meireles, J.M. Appling Remote Sensing to Biodiversity Science. In Remote Sensing of Plant Biodiversity; Cavender-Bares, J., Gamon, J., Townsend, P., Eds.; Springer Nature: Cham, Switzerland, 2020; pp. 13–42. [Google Scholar] [CrossRef]
  51. Schumacher, M.V.; Longhi, S.J.; Brun, E.J.; Kilca, R.V. (Eds.) A Floresta Estacional Subtropical—Caracterização e Ecologia no Rebordo do Planalto Meridional; Pallotti: Santa Maria, Brazil, 2011; 320p. [Google Scholar]
  52. Kilca, R.V.; Pedron, F.A.; Schwartz, G.; Longhi, S.J.; Deobald, G.A. Soil changes in a subtropical seasonal forest chronosequences in the south of Brazil. Ciência Rural 2015, 45, 2174–2180. [Google Scholar] [CrossRef] [Green Version]
  53. Mallmann, C.L.; Prado, D.A.; Pereira Filho, W. Índice de vegetação por diferença normalizada para caracterização da dinâmica florestal no parque estadual Quarta Colônia, estado do Rio Grande do Sul—Brasil. Rev. Bras. De Geogr. Física 2015, 8, 1–15. [Google Scholar] [CrossRef] [Green Version]
  54. Scipioni, M.C.; Longhi, S.J.; Reinert, D.J.; Araujo, M.M.; Pedron, F.A. Distribuição do compartimento arbóreo em gradiente de relevo e solos na encosta Meridional da Serra Geral, RS. Ciência Rural 2010, 40, 1295–1301. [Google Scholar] [CrossRef] [Green Version]
  55. Rovedder, A.P.M.; Almeida, C.M.; Araujo, M.M.; Tonetto, T.S.; Scotti, M.S.V. Relação solo-vegetação em remanescente da floresta estacional decidual na Região Central do Rio Grande do Sul. Ciência Rural 2014, 44, 2178–2185. [Google Scholar] [CrossRef] [Green Version]
  56. Pedron, F.A.; Azevedo, A.C.; Dalmolin, R.S.D.; Stürmer, S.L.K.; Menezes, F.P. Morfologia e Classificação Taxonômica de Neossolos e Saprolitos derivados de rochas vulcânicas da Formação Serra Geral no Rio Grande do Sul. Rev. Bras. Ciência Solo 2009, 33, 119–128. [Google Scholar] [CrossRef]
  57. Wrege, M.; Steinmetz, S.; Reisser-Junior, C.; Almeida, I. Atlas Climático da Região Sul do Brasil: Estados do Paraná Santa Catarina e Rio Grande do Sul; Embrapa Clima Temperado: Pelotas, Brazil; Embrapa Florestas: Colombo, Brazil, 2011. [Google Scholar]
  58. Witt, A.B.R.; Luke, Q. Guide to the Naturalized and Invasive Plants of Eastern Africa; CABI: Wallingford, UK, 2017; pp. 416–417. [Google Scholar] [CrossRef]
  59. Carvalho, P.E.R. Ecologia, silvicultura e usos da uva-do-japão (Hovenia dulcis Thunberg). Embrapa, 23; CNP-Florestas: Colombo, PR, Brazil, 1994; 24p. [Google Scholar]
  60. Dechoum, M.S.; Castellani, T.T.; Zalba, S.M.; Rejmánek, M.; Peroni, N.; Tamashiro, J.Y. Community structure, succession and invasibility in a seasonal deciduous Forest in southern Brazil. Biol. Inv. 2015, 17, 1697–1712. [Google Scholar] [CrossRef]
  61. Padilha, L.D.; Loregian, A.C.; Budck, J.C. Forest fragmentation does not matter to invasions by Hovenia dulcis. Biodivers. Conserv. 2015, 24, 2293–2304. [Google Scholar] [CrossRef]
  62. GBIF Home Page. Available online: https://www.gbif.org (accessed on 1 March 2021).
  63. CABI. Hovenia dulcis . In Invasive Species Compendium; CAB International: Wallingford, UK, 2020; Available online: http://www.cabi.org/isc. (accessed on 26 November 2020).
  64. Schorn, L.A.; Meyer, L.; Sevegnani, L.; Vibrans, A.C.; Vanessa, D.; Gasper, L.A.L.; Uhlmman, A.; Verdi, M.; Stival-Santos, A. Fitossociologia de fragmentos de floresta estacional decidual no estado de Santa Catarina—Brasil. Ciência Florest. 2014, 24, 821–831. [Google Scholar] [CrossRef] [Green Version]
  65. Horus Institute. Horus Institute for Environmental Development and Conservation. Brazilian Invasive Species Database. Available online: http://bd.institutohorus.org.br (accessed on 26 November 2020).
  66. Zenni, R.D.; Ziller, S.R. Visão geral das plantas exóticas invasoras no Brasil. Rev. Bras. Bot. 2011, 34, 431–446. [Google Scholar] [CrossRef] [Green Version]
  67. Schaff, L.; Figueiredo Filho, A.; Galvão, F.; Sanquetta, C.R.; Longhi, S.J. Modificações florístico-estruturais de um remanescente de Floresta Ombrofila Mista Montana no período de 1979 e 2000. Ciência Florest. 2006, 16, 271–291. [Google Scholar] [CrossRef] [Green Version]
  68. Sitther, V.; Zhang, D.; Harris, D.L. Genetic characterization of guava (Psidium guajava L.) germplasm in the United States using microsatellite markers. Genet. Resour. Crop Evol. 2014, 61, 829–839. [Google Scholar] [CrossRef]
  69. Tuler, A.C.; Carrijo, T.T.; Ferreira, M.F.S.; Peixoto, A.L. Flora of Espírito Santo: Psidium (Myrtaceae). Rodriguésia 2017, 68, 1791–1805. [Google Scholar] [CrossRef] [Green Version]
  70. Cronk, Q.C.B.; Fuller, J.L. Plant Invaders: The Threat to Natural Ecosystems; Chapman & Hall: London, UK, 1995; pp. 127–129. [Google Scholar] [CrossRef]
  71. Smith, C.W. Pest Plants of Hawaiian Native Ecosystems; Department of Botany, University of Hawaii: Honolulu, HI, USA, 1998. [Google Scholar]
  72. Weber, E. Invasive Plant Species of the World: A Reference Guide to Environmental Weeds; CAB International: Wallingford, UK, 2003. [Google Scholar]
  73. Henderson, L. Alien Weeds and Invasive Plants. In Plant Protection Research Institute; Handbook, n 12; Paarl Printers: Cape Town, South Africa, 2001; p. 193. [Google Scholar]
  74. Chapla, T.E.; Campos, J.B. Allelopathic evidence in exotic guava (Psidium guajava L.). Braz. Arch. Biol. Technol. 2010, 53, 1359–1362. [Google Scholar] [CrossRef]
  75. Hiscox, J.D.; Israelstam, G.F. A Method for Extraction of Chlorophyll from Leaf Tissue without Maceration. Can. J. Botany 1979, 57, 1332–1334. [Google Scholar] [CrossRef]
  76. Lichtenthaler, H.K. Chlorophylls and Carotenoids - pigments of photosynthetic biomembranes. Methods Enzymol. 1987, 148, 350–382. [Google Scholar] [CrossRef]
  77. Ogashawara, I.; Curtarelli, M.P.; Souza, A.F.; Augusto-Silva, P.B.; Alcântara, E.H.; Stech, J.L. Interactive Correlation Environment (ICE) - A Statistical Web Tool for Data Collinearity Analysis. Remote Sens. 2014, 6, 3059–3074. [Google Scholar] [CrossRef] [Green Version]
  78. Hill, J.; Buddenbaum, H.; Townsend, P.A. Imaging Spectroscopy of Forest Ecosystems: Perspectives for the Use of Space-borne Hyperspectral Earth Observation Systems. Surv. Geophys. 2019, 40, 553–588. [Google Scholar] [CrossRef]
  79. Murrins Misiukas, J.; Carter, S.; Herold, M. Tropical Forest Monitoring: Challenges and Recent Progress in Research. Remote Sens. 2021, 13, 2252. [Google Scholar] [CrossRef]
  80. Ustin, S.L.; Jacquemoud, S. How the Optical Properties of Leaves Modify the Absorption and Scattering of Energy and Enhance Leaf Functionality. In Remote Sensing of Plant Biodiversity; Cavender-Bares, J., Gamon, J., Townsend, P., Eds.; Springer Nature: Cham, Switzerland, 2020; pp. 349–384. [Google Scholar]
  81. Danson, F.M.; Bowyer, P. Estimating live fuel moisture content from remotely sensed reflectance. Remote Sens. Environ. 2004, 92, 309–321. [Google Scholar] [CrossRef]
  82. Riaño, D.; Vaughan, P.; Chuvieco, E.; Zarco-Tejada, P.J.; Ustin, S.L. Estimation of fuel moisture content by inversion of radiative transfer models to simulate equivalent water thickness and dry matter content: Analysis at leaf and canopy level. IEEE Trans. Geosci. Remote Sens. 2005, 43, 819–826. [Google Scholar] [CrossRef]
  83. Wang, X.; Wotton, B.M.; Cantin, A.S.; Parisien, M.A.; Anderson, K.; Moore, B.; Flannigan, M.D. CFFDRS: An R package for the Canadian forest fire danger rating system. Ecol. Process. 2017, 6, 5–16. [Google Scholar] [CrossRef]
  84. Yebra, M.; Quanc, X.; Riaño, D.; Larraondo, P.R.; van Dijik, A.I.J.M.; Cary, G.J. A fuel moisture content and flammability monitoring methodology for continental Australia based on optical remote sensing. Remote Sens. Environ. 2018, 212, 260–272. [Google Scholar] [CrossRef]
  85. Streher, A.S.; Torres, R.S.; Morellato, L.P.C.; Silva, T.S.F. Accuracy and limitations for spectroscopic prediction of leaf traits in seasonally dry tropical environments. Remote Sens. Environ. 2020, 244, 1118–1128. [Google Scholar] [CrossRef]
  86. Féret, J.B.; Le Maire, G.; Jay, S.; Berveiller, D.; Bendoula, R.; Hmimina, G.; Cheraiet, A.; Oliveira, J.C.; Ponzoni, F.J.; Solanki, T.; et al. Estimating leaf mass per area and equivalent water thickness based on leaf optical properties: Potential and limitations of physical modeling and machine learning. Remote Sens. Environ. 2018, 231, 110959. [Google Scholar] [CrossRef]
  87. Cheng, T.; Rivard, B.; Sánchez-Azofeifa, G.A.; Féret, J.B.; Jacquemoud, S.; Ustin, S.L. Deriving leaf mass per area (LMA) from foliar reflectance across a variety of plant species using continuous wavelet analysis. J. Photogramm. Remote Sens. 2014, 87, 28–38. [Google Scholar] [CrossRef]
  88. Asner, G.P.; Martin, R.E.; Knapp, D.E.; Tupayachi, R.; Anderson, C.; Carranza, L.; Martinez, P.; Houcheime, M.; Sinca, F.; Weiss, P. Spectroscopy of canopy chemicals in humid tropical forests. Remote Sens. Environ. 2011, 115, 3587–3598. [Google Scholar] [CrossRef]
  89. Poorter, H.; Niinemets, U.; Poorter, L.; Wright, I.J.; Villar, R. Causes and consequences of variation in leaf mass per area (LMA): A meta-analysis. New Phytol. 2009, 182, 565–588. [Google Scholar] [CrossRef]
  90. Wright, I.J.; Reich, P.B.; Westoby, M.; Ackerly, D.D.; Baruch, Z.; Bongers, F.; Cavender-Bares, J.; Chapin, T.; Cornelissen, J.H.C.; Diemer, M.; et al. The worldwide leaf economics spectrum. Nature 2004, 428, 821–827. [Google Scholar] [CrossRef]
  91. Wright, I.J.; Ackerly, D.D.; Bongers, F.; Harms, K.E.; Ibarra-Manriquez, G.; Martinez-Ramos, M.; Mazer, S.J.; Muller-Landau, H.C.; Paz, H.; Pitman, N.C.A.; et al. Relationships among ecologically important dimensions of plant trait variation in seven neotropical forests. Ann. Bot. 2007, 99, 1003–1015. [Google Scholar] [CrossRef] [Green Version]
  92. Hoffmann, W.A.; Franco, A.C.; Moreira, M.Z.; Haridasan, M. Specific leaf area explains differences in leaf traits between congeneric savanna and forest trees. Funct. Ecol. 2005, 19, 932–940. [Google Scholar] [CrossRef]
  93. Bucci, S.J.; Scholz, F.G.; Goldstein, G.; Meinzer, F.C.; Franco, A.C.; Campanello, P.I.; Villalobos-Vega, R.; Bustamante, M.; Miralles-Wilhelm, F. Nutrient availability constrains the hydraulic architecture and water relations of savannah trees. Plant Cell Environ. 2006, 29, 2153–2167. [Google Scholar] [CrossRef] [Green Version]
  94. Ball, A.; Sanchez-Azofeifa, A.; Portillo Quintero, C.; Rivard, B.; Castro-Contreras, S.; Fernandes, G. Patterns of Leaf Biochemical and Structural Properties of Cerrado Life Forms: Implications for Remote Sensing. PLoS ONE 2015, 10, e0117659. [Google Scholar] [CrossRef]
  95. Gitelson, A.A.; Merzlyak, M.N.; Chivkunova, O.B. Optical properties and nondestructive estimation of anthocyanin content in plant leaves. Photochem. Photobiol. 2001, 74, 38–45. [Google Scholar] [CrossRef]
  96. Noomen, M.F.; Skidmore, A.K.; Van Der Meer, F.D.; Prins, H.H.T. Continuum removed band depth analysis for detecting the effects of natural gas, methane and ethane on maize reflectance. Remote Sens. Environ. 2006, 105, 262–270. [Google Scholar] [CrossRef]
  97. Solovchenko, A. Photoprotection in Plants Optical Screening-Based Mechanisms; Springer: Berlin/Heidelberg, Germany, 2010; pp. 89–159. [Google Scholar]
  98. Harrison, D.; Rivard, B.; Sánchez-Azofeifa, A. Classification of tree species based on longwave hyperspectral data from leaves, a case study for a tropical dry forest. Int. J. Appl. Earth Obs. Geoinf. 2018, 66, 93–105. [Google Scholar] [CrossRef]
  99. Gamon, J.A.; Somers, B.; Malenovský, Z.; Middleton, E.M.; Rascher, U.; Schaepman, M.E. Assessing vegetation function with imaging spectroscopy. Surv. Geophys. 2019, 40, 489–513. [Google Scholar] [CrossRef] [Green Version]
  100. Le Maire, G.; Francois, C.; Soudani, K.; Berveiller, D.; Pontailler, J.Y.; Bréda, N.; Genet, H.; Davi, H.; Dufrêne, E. Calibration and validation of hyperspectral indices for the estimation of broadleaved forest leaf chlorophyll content, leaf mass per area, leaf area index and leaf canopy biomass. Remote Sens. Environ. 2008, 112, 3846–3864. [Google Scholar] [CrossRef]
  101. Penuelas, J.; Filella, I.; Biel, C.; Serrano, L.; Savé, R. The reflectance at the 950–970 nm region as an indicator of plant water status. Int. J. Remote Sens. 1993, 14, 1887–1905. [Google Scholar] [CrossRef]
  102. Gitelson, A. Towards a generic approach to remote non-invasive estimation of foliar carotenoid-to-chlorophyll ratio. J. Plant Physiol. 2020, 252, 153227. [Google Scholar] [CrossRef] [PubMed]
  103. Danson, F.M.; Steven, M.D.; Malthus, T.J.; Clark, J.A. High-spectral resolution data for determining leaf water content. Int. J. Remote Sens. 1992, 13, 461–470. [Google Scholar] [CrossRef]
  104. Kumar, L. High-spectral resolution data for determining leaf water content in Eucalyptus species: Leaf level experiments. Geocarto Int. 2007, 22, 3–16. [Google Scholar] [CrossRef]
Figure 1. Images show: (a) Quarta Colonia State Park (QCSP); (b) closer view of the study site; (c) aerial view image of woody cover and QCSP head office; and (d) secondary forest canopy.
Remotesensing 15 00791 g001
Figure 2. Schematic diagram illustrating flow of methodology. Detailed data processing and analyses are described in Section 2.6. Overall, steps represent data acquisition, data organization, processing and analysis, and results.
Remotesensing 15 00791 g002
Figure 3. Boxplot of leaf-level functional traits. Water content: (a) LWC (%) = liquid water content; (b) FMC (%) = fuel moisture content; and (c) EWT (g cm−2) = equivalent water thickness; were the species are: HD (yellow) = Hovenia dulcis; LD (red) = Luehea divaricata; PC (blue) = Psidium cattleianum; PG (green) = Psidium guajava. * Indicates outliers.
Remotesensing 15 00791 g003
Figure 4. Boxplot of leaf-level functional traits. Vegetation structure: (a) LMA (g cm−2) = leaf mass per area; (b) SLA (cm2 g−1) = specific leaf area; where the species are HD (yellow) = Hovenia dulcis; LD (red) = Luehea divaricata; PC (blue) = Psidium cattleianum; PG (green) = Psidium guajava. * Indicates outliers.
Remotesensing 15 00791 g004
Figure 5. Boxplot of leaf-level functional traits Photosynthetic pigments: (a) Chla (µg cm−2) = chlorophyll a content; (b) Chlb (µg cm−2) = chlorophyll b content; (c) Chl (µg cm−2) = total chlorophyll content; and (d) Car (µg cm−2) = carotenoid content; where the species are:HD (yellow) = Hovenia dulcis; LD (red)= Luehea divaricata; PC (blue) = Psidium cattleianum; PG (green)= Psidium guajava. * Indicates outliers.
Remotesensing 15 00791 g005
Figure 6. Boxplot of leaf-level functional traits. Photosynthetic pigments: (a) Chla/Chlb = chlorophyll a:b ratio; (b) Car/Chl = carotenoid:total chlorophyll ratio; (c) Chla + b = sum of chlorophyll a and b; were the species are: HD (yellow) = Hovenia dulcis; LD (red)= Luehea divaricata; PC (blue) = Psidium cattleianum; PG (green)= Psidium guajava. * Indicates outliers.
Remotesensing 15 00791 g006
Figure 7. Leaf-level spectral reflectance curves of the four target species: Psidium cattleianum (blue), Psidium guajava (green), Luehea divaricata (red) and Hovenia dulcis (yellow) with spectral ranges at 400–900 nm (a); zoom in green spectral range (b); and zoom in NIR spectral range (c). Native species are represented by the dashed lines, and invasive species by the solid lines.
Remotesensing 15 00791 g007
Figure 8. Two-dimensional linear discriminant analysis (LDA) of leaf reflectance for the four target species. PC (blue) = Psidium cattleianum; PG (green) = Psidium guajava; LD (red) = Luehea divaricata; HD (yellow) = Hovenia dulcis.
Remotesensing 15 00791 g008
Figure 9. Simple linear regression (SLR) for the most-significant functional optical properties and simple ratios (SR). Regressions are performed for the target invasive species Psidium guajava (PG, green = (ac)) and Hovenia dulcis (HD, yellow = (df)). Substitute to (PG, green = (a,c and e)) and Hovenia dulcis (HD, yellow = (d, e and f)).
Remotesensing 15 00791 g009
Table 1. Synthesis of traits and functions recorded for plant species at Quarta Colonia State Park during the 2020 field season.
Leaf TraitAcronymUnit Indicator of
Water content
Fuel moisture contentFMC%susceptibility of vegetation to fire
Liquid water contentLWC %water content estimate
Equivalent water thicknessEWT g cm−2hydric stress
Vegetation structure
Leaf mass per areaLMAg cm−2leaf longevity and hardness
Specific leaf area SLAcm2 g−1light capture efficiency
Photosynthetic pigments
Chlorophyll aChla µg cm−2main photosynthetic pigment
Chlorophyll bChlbµg cm−2accessory pigment
Total chlorophyllChlµg cm−2photosynthetic activity
CarotenoidCarµg cm−2photoprotective pigments
Chlorophyll a:b ratioChla/Chlb-photosynthetic response of the acclimatization process
Carotenoid:total chlorophyll ratioCar/Chl-changes in development and stress photosynthetic responses
Sum of chlorophyll a and bChla + bµg cm−2photosynthetic activity
Table 2. Kruskal–Wallis rank-sum test of the 3 leaf traits Water content: LWC (%) = liquid water content; FMC (%) = fuel moisture content; EWT (g cm−2) = equivalent water thickness; significance (p ≤ 0.05).
chi-Squareddf p-Value
LWC10.74730.01318
FMC10.74730.01318
EWT53.87431.19 × 10−8
Table 3. Dunn’s post hoc test adjusted using the Bonferroni method for the three leaf traits. Water content: LWC (%) = liquid water content; FMC (%) = fuel moisture content; EWT (g cm−2) = equivalent water thickness for 24 subsamples collected from each species invasive (PG = Psidium guajava an HD= Hovenia dulcis) and native (PC= Psidium cattleianum and LD= Luehea divaricata).
TraitSpecies Group_Statisticp-Valuep.Adjust
LWCHDLD−2.340.0194 0.117
HDPC−2.09 0.0368 0.221
HDPG−3.14 0.001690.0101
LDPC0.249 0.8041
LDPG−0.8030.422 1
PCPG−1.050.293 1
FMCHDLD−2.34 0.01940.117
HDPC−2.090.03680.221
HDPG−3.140.001690.0101
LDPC0.2490.8041
LDPG−0.8030.4221
PCPG−1.050.293 1
EWTHDLD1.291.97 × 10−110
HDPC6.847.67 × 10−124.60 × 10⁻¹¹
HDPG3.514.43 × 10−42.66 × 10⁻³
LDPC5.552.78 × 10−81.67 × 10⁻⁷
LDPG2.22 2.62 × 10−21.57 × 10−1
PCPG−3.338.63 × 10−45.18 × 10⁻³
Table 4. Kruskal–Wallis rank-sum test of the two leaf traits Vegetation structure: LMA (g cm−2) = leaf mass per area; SLA (cm2 g−1) = specific leaf area; significance (p ≤ 0.05).
chi-Squareddf p-Value
LMA46.12935.33 × 10−7
SLA46.55434.32 × 10−7
Table 5. Dunn’s post hoc test adjusted using the Bonferroni method for the two leaf traits. Vegetation structure: LMA (g cm−2) = leaf mass per area; SLA (cm2 g−1) = specific leaf area for 24 subsamples collected from each invasive species (PG = Psidium guajava and HD = Hovenia dulcis) and native species (PC = Psidium cattleianum and LD = Luehea divaricata).
TraitSpecies Group_Statisticp-Valuep.Adjust
LMAHDLD1.860.06220.373
HDPC6.011.81 × 10−91.08 × 10⁻⁸
HDPG4.976.79 × 10−74.08 × 10⁻⁶
LDPC4.153.34 × 10−52.00 × 10⁻⁴
LDPG3.100.00192 0.0115
PCPG1.050.2951
SLAHDLD−1.990.04610.260
HDPC−6.041.58 × 10−99.46 × 10⁻⁹
HDPG−5.09 3.62 × 10−72.17 × 10−6
LDPC−4.045.31 × 10−53.19 × 10⁻⁴
LDPG−3.090.001980.0119
PCPG0.9480.343 1
Table 6. Kruskal–Wallis rank-sum test of the seven leaf traits. Photosynthetic pigments: Chla (µg cm−2) = chlorophyll a content; Chlb (µg cm−2) = chlorophyll b content; Chl (µg cm−2) = total chlorophyll content; Car (µg cm−2) = carotenoid content; Chla/Chlb = chlorophyll a:b ratio; Car/Chl = carotenoid:total chlorophyll ratio; Chla + b = sum of chlorophyll a and b; significance (p ≤ 0.05).
chi-Squareddf p-Value
Chla37.41933.75 × 10−5
Chlb24.97831.56 × 10−2
Chltotal33.85332.13 × 10−4
Car39.85931.14 × 10−5
Chla/Chlb36.27136.56 × 10−5
Car/Chl51.10730.1639
Chla + b34.32231.70 × 10−4
Table 7. Dunn post hoc test by the adjusted method Bonferroni of the 7 leaf traits Photosynthetic pigments: Chla (µg cm−2) = chlorophyll a content; Chlb (µg cm−2) = chlorophyll b content; Chl (µg cm−2) = total chlorophyll content; Car (µg cm−2) = carotenoid content; Chla/Chlb = chlorophyll a:b ratio; Car/Chl = carotenoid:total chlorophyll ratio; Chla + b = sum of chlorophyll a and b for 24 subsamples collected from each species invasive (PG = Psidium guajava an HD= Hovenia dulcis) and native (PC= Psidium cattleianum and LD= Luehea divaricate).
TraitGroup_SpeciesStatisticp-Valuep.Adjust
ChlaHDLD2.940.003250.0195
HDPC−2.680.007280.0437
HDPG2.040.04120.247
LDPC−5.631.83 × 10−81.10 × 10⁻⁷
LDPG−0.9020.3671
PCPG4.732.30 × 10−61.38 × 10⁻⁵
ChlbHDLD3.281.34 × 10−48.05 × 10⁻⁴
HDPC0.6630.5071
HDPG3.851.18 × 10−47.09 × 10⁻⁴
LDPC−3.160.001600.00961
LDPG0.03110.9751
PCPG3.190.00144 0.00864
ChltotalHDLD3.340.0006030.00362
HDPC−1.63 0.1030.616
HDPG2.780.005400.0324
LDPC−5.064.14 × 10−72.49 × 10⁻⁶
LDPG−0.6480.5171
PCPG4.411.01 × 10−56.07 × 10⁻⁵
CarHDLD3.630.0002870.00172
HDPC−1.290.1971
HDPG3.820.0001340.000805
LDPC−4.92 8.78 × 10−75.27 × 10−6
LDPG0.1920.8481
PCPG5.113.24 × 10−71.94 × 10⁻⁶
Chla/ChlbHDLD−2.270.2290.138
HDPC−5.631.78 × 10−81.07 × 10⁻⁷
HDPG−4.301.70 × 10−51.02 × 10⁻⁴
LDPC−3.360.000786 0.00472
LDPG−2.030.04280.257
PCPG1.330.183 1
Car/ChlHDLD−2.270.2290.138
HDPC−5.63 1.78 × 10−81.07 × 10−7
HDPG−4.30 1.70 × 10−51.02 × 10−4
LDPC−3.360.0007860.00472
LDPG−2.030.04280.257
PCPG1.330.183 1
Chla + bHDLD3.390.0007020.00421
HDPC−1.740.0817 0.490
HDPG2.730.006420.0385
LDPC−5.132.90 × 10−71.74 × 10⁻⁶
LDPG−0.663 0.5071
PCPG4.477.96 × 10−64.77 × 10⁻⁵
Table 8. Confusion matrix obtained from the LDA-LOOCV species classification model showing invasive and native species. Numbers in the diagonal of the matrix are the number of samples predicted correctly. Were: P. cattleianum- Psidium cattleianum; P.guajava- Psidium guajava; H. dulcis- Hovenia dulcis; L. divaricata- Luehea divaricata.
P. cattleianumP. guajavaH. dulcisL.divaricatan
P. cattleianum2112 24
P. guajava222 24
H. dulcis 24 24
L. divaricata21 2124
Table 9. Most-significant spectral bands selected by stepwise procedures. Blue, green and red are the wavelength regions.
BlueGreenRed
403–407503–504614
467516668
484532–535694–696
497545–548705
553711
561–564
579–580
585
589–592
Table 10. Summary of the most-significant leaf optical properties and leaf characteristics of two invasive tree species in QCSP. LWC (%) = liquid water content; SLA (cm2.g−1) = specific leaf area; Chla/Chlb = chlorophyll a:b ratio; Car/Chl = carotenoid:total chlorophyll ratio; SR= simple ratio, n = number of samples, r = simple ratio correlation; r2 = coefficient of determination; RMSE = root mean square error; CV = coefficient of variation; RSS = residual sum of squares. Significant results at α = 0.01, and at a 99% confidence level (p-value < 0.01).
TraitsSRnMeanrr2RMSECV%RSS
Psidium guajava
LWCR817/R8022264.1250.910.831.760.02762.55
SLAR822/R8011885.890.970.953.200.037172.2
Car/ChlR839/R785200.1710.750.560.010.0610.002
Hovenia dulcis
LWCR706/R5312270.40.920.851.670.0256.2
SLAR706/R531211470.880.7715.40.10488
Chla/ChlbR818/R769234.00.70.470.660.169.6
Disclaimer/Publisher’s Note: The statements, opinions and data contained in all publications are solely those of the individual author(s) and contributor(s) and not of MDPI and/or the editor(s). MDPI and/or the editor(s) disclaim responsibility for any injury to people or property resulting from any ideas, methods, instructions or products referred to in the content.

