


Design and Application of a UAV Autonomous Inspection System for High-Voltage Power Transmission Lines

1
Graduate School of Engineering, Chiba University, 1-33 Yayoi-cho, Inage-ku, Chiba 263-8522, Japan
2
School of Automation, Nanjing University of Information Science & Technology, No. 219 Ningliu Road, Nanjing 210044, China
3
Jiangsu Collaborative Innovation Center of Atmospheric Environment and Equipment Technology (CICAEET), Nanjing University of Information Science & Technology, Nanjing 210044, China
*
Author to whom correspondence should be addressed.
Remote Sens. 2023, 15(3), 865; https://doi.org/10.3390/rs15030865
Submission received: 27 December 2022
/
Revised: 30 January 2023
/
Accepted: 2 February 2023
/
Published: 3 February 2023
(This article belongs to the Special Issue Unmanned Aerial Systems (UAS) for Global Challenges: Current Technologies and Future Prospects)
Abstract
:As the scale of the power grid continues to expand, the human-based inspection method struggles to meet the needs of efficient grid operation and maintenance. Currently, the existing UAV inspection system in the market generally has short endurance power time, high flight operation requirements, low degree of autonomous flight, low accuracy of intelligent identification, slow generation of inspection reports, and other problems. In view of these shortcomings, this paper designs an intelligent inspection system based on self-developed UAVs, including autonomous planning of inspection paths, sliding film control algorithms, mobile inspection schemes and intelligent fault diagnosis. In the first stage, basic data such as latitude, longitude, altitude, and the length of the cross-arms are obtained from the cloud database of the power grid, while the lateral displacement and vertical displacement during the inspection drone operation are calculated, and the inspection flight path is generated independently according to the inspection type. In the second stage, in order to make the UAV’s flight more stable, the reference-model-based sliding mode control algorithm is introduced to improve the control performance. Meanwhile, during flight, the intelligent UAV uploads the captured photos to the cloud in real time. In the third stage, a mobile inspection program is designed in order to improve the inspection efficiency. The transfer of equipment is realized in the process of UAV inspection. Finally, to improve the detection accuracy, a high-precision object detector is designed based on the YOLOX network model, and the improved model increased the metric by 2.22 percentage points compared to the original YOLOX_m for bird’s nest detection. After a large number of flight verifications, the inspection system designed in this paper greatly improves the efficiency of power inspection, shortens the inspection cycle, reduces the investment cost of inspection manpower and material resources, and successfully fuses the object detection algorithm in the field of high-voltage power transmission lines inspection.
1. Introduction
The stable transmission of electricity by high-voltage lines is of great importance to modern industry and people’s lives [1,2,3]. In daily life, power departments at all levels should carry out daily maintenance of high-voltage lines to prevent damage to them by lawless elements or by bad weather, natural losses, etc. The traditional high-voltage line inspection approach is walking along the line or with the help of transportation, while using binoculars and infrared thermal imaging cameras, such as line equipment and channel environment, for proximity inspection and detection, which are low-efficiency inspection methods [4,5,6]. Especially in high mountains, swamps, and other complex terrain, as well as rain, snow, ice, earthquakes, and other disaster conditions that are difficult for personnel to reach, difficult-to-find equipment damage on a tower, and other shortcomings. With the rapid development of aviation, remote sensing, and information processing technologies, the power industry can actively carry out line construction and the operation and maintenance of new technology research. Among such technology, UAVs have the advantages of operating with high flexibility and at a low cost for line erection traction and overhead line inspection [7]. UAVs are usually controlled by flyers and collect corresponding aerial images. Researchers have used the captured data to develop many automated analysis functions, such as defect detection [8], bird’s nest detection, etc. However, the existing UAV inspection system still has a single technical means, cannot synchronize line defects in real time, as well as other problems. These are mainly reflected in the following points:
- (1)
- The degree of autonomy of the inspection flight: This needs to be improved, as the inspection efficiency is low. At present, a mainstream inspection flight robot basically uses a combination of human and machine inspection, the need for the manual operation of the UAV for inspection target photography, which involves copying or first manually operating the UAV for photo point location collection, and then re-flying inspection. Photo copying requires manual participation, a low degree of autonomy, and low inspection efficiency;
- (2)
- Flight control stability issues: An inspection flight robot in response to the complex inspection environment, has difficulty in achieving high precision and stable hovering, which brings a serious impact on accurate data collection, so flight control stability has been a difficult point for industry applications;
- (3)
- Drone battery replacement issues: An existing inspection flight robot generally lacks the functions of fast and accurate recovery and power battery replacement, which means that inspection efficiency cannot significantly improve;
- (4)
- Inspection data fault detection: An inspection flight robot has a low accuracy for intelligent recognition and slow generation of inspection reports.
In order to solve the above problems, we have proposed innovations in autonomous flight, autonomous path planning, autonomous battery replacement, and intelligent detection and designed a new UAV inspection system, as shown in Figure 1. The main contributions of this paper are summarized as follows:
- (1)
- The ground station system that automatically generates the inspection program is designed, including fine inspection, arc-chasing inspection, and channel inspection, and the UAV can operate autonomously according to this plan to achieve the all-around inspection of high-voltage lines;
- (2)
- The self-developed flight control and navigation system achieves high robustness and high precision flight control for the UAV, solving the problem of poor flight control stability for existing inspection robots;
- (3)
- A mechanical device for automatic battery replacement is designed, and a mobile inspection scheme is provided to complete the transfer of equipment while the UAV performs its task, greatly improving the efficiency of inspection;
- (4)
- Based on the YOLOX object detection model, some improvements are proposed, and the improved YOLOX is deployed on the cloud server to improve detection accuracy.
The main work of this paper is summarized as follows: The experimental background and main contributions are presented in Section 1. The related work is presented in Section 2. Section 3 describes the system architecture and methodology. The validation platform and experimental results are presented in Section 4. The advantages and disadvantages of this system are discussed in Section 5. Finally, our work is summarized in Section 6.
2. Related Work
The traditional inspection method for high-voltage lines is that inspectors inspect the lines at high a altitude, which is still used in some areas. However, this is very dangerous for personal safety because they are likely to fall from height or die by electrocution, while also working very inefficiently [9,10]. Another method is that inspectors use binoculars to check the lines, which guarantees the safety of the operators, but the inspection is also very slow [11,12]. In recent years, UASs have been playing an increasingly important role in high-voltage line inspections. Li et al. [13] proposed an unmanned intelligent line inspection system applied to the transmission grid, pointing out the construction elements, operation mechanism, and data flow diagram of the unmanned system. Calvo et al. [14] proposed a path planning scheme for UAV inspection in a high-voltage line scenario with reasonable planning for both vehicle and operator tasks, but the reliability of the system was only verified by simulation. Luque-Vega et al. [15] proposed a quadrotor helicopter-based UAV inspection system for high-voltage lines to facilitate the qualitative inspection of high-voltage lines by power inspection departments. The UAV intelligent inspection system proposed by Li et al. [16] provided a new and efficient control and data processing method, enhanced the coordination and cooperation of UAV inspection departments, and improved the informationization and automation of UAV inspection. Guan et al. [17] proposed the concept of intelligent power line inspection by UAV with LIDAR, with a system that is able to inspect power lines with great efficiency and at a low cost, but ignores the inspection of the other components on high-voltage lines.
With the development of computer vision technology, object detection is also gradually being applied to all aspects of life, such as high-altitude vehicle detection and pedestrian detection. The mainstream object detection methods are divided into two types; one is the one-stage detection method, such as YOLO and SSD [18,19,20,21,22]. The other is the two-stage detection method, such as Faster RCNN [23]. The two-stage inspection method is highly accurate but slow, while the one-stage inspection method is fast but slightly less accurate. However, the one-stage inspection method has developed rapidly and now achieves almost the same accuracy as the two-stage inspection method. In recent years, many high-voltage line inspection projects have been combined with object detection, and many inspection functions, such as line detection [24], bird’s nest detection, and insulator detection, have been developed based on various datasets. Li et al. [25] compared the performance of YOLOv3, YOLOv5s, and YOLOX_s models and proposed an optimized YOLOv5s bird’s nest detection model, but the model was deployed on UAVs, which have certain real-time requirements, so the detection accuracy is not very high. Hao et al. [26] proposed a bird’s nest recognition method using a combination of a single-shot detector and an HSV color space filter to further improve the accuracy of bird’s nest detection. Nguyen et al. [27] proposed a method based on the combination of a single shot multibox detector and deep residual networks, capable of detecting common faults in electrical components, such as cracks in poles and cross-arms, damage on poles caused by woodpeckers, and missing top caps. However, this method is mainly used for low-voltage ordinary transmission lines and cannot be directly used for the detection of high-voltage line faults. Yang et al. [28] combined deep learning and migration learning approaches to propose a new aerial image defect recognition algorithm that can better detect insulators in complex environments.
3. Structure of the System and Methods
In this section, firstly, the overall structure of the system is described. Next, the generation of the scheme in the ground station system is described (path planning). Then a strong robust flight control algorithm is designed to make the UAV fly stably even during high-altitude operation. Next, a mobile inspection scheme is introduced to improve the inspection efficiency. Finally, based on the basic framework of YOLOX [29], some optimization schemes are designed to improve the model’s detection accuracy.
3.1. Structure of the System
The structure of the system in this paper is shown in Figure 2. Firstly, the operator needs to request the basic data of the high-voltage towers from the ground station and generate inspection tasks to send to the UAV. After the drone’s self-inspection is completed, upon receiving the start command, it begins to perform the operation task and inspect the electric tower. The drone inspection process uploads the photos of the inspection target to the cloud server in real time. After receiving the photos of the inspection, the cloud server uses a combination of manual and deep learning to detect the photos from the inspection. Manual detection is mainly for when they are some defects in the line, while intelligent detection is mainly for the detection of bird’s nests in high-voltage lines, and the inspection report is generated after the detection is completed. After viewing the report, the staff can arrange maintenance personnel to carry out maintenance. After the drone completes its task, it returns to the intelligent machine nest, which will replace the drone’s battery autonomously to improve the inspection efficiency and prepare for the next inspection task.
3.2. Path Planning
Inspection drones operate autonomously according to the mission plan planned by the ground station. Using the inspection equipment carried by the UAV, the inspection demand points are photographed, and the high-voltage line inspection is completed efficiently; and its inspection demand is shown in Table 1. According to this demand, this paper designs three path planning schemes for fine inspection, arc-chasing inspection, and channel inspection.
3.2.1. Fine Inspection
According to the inspection requirements of No. 1–10 in Table 1, a fine inspection scheme is designed, as shown in Figure 3. Each task point of the path planning is calculated by the base data of the electric tower in the database. The base data of the tower include latitude, longitude, height, directional angle, and the category of the tower. As shown in Figure 3, the direction perpendicular to the azimuth of the tower is the azimuth of the task point location. Taking mission points 2 and 8 as examples, their latitude and longitude can be obtained from Equations (1) and (2). and are the latitude and longitude of the center point of the current tower. D is the distance of the task point from the center point, determined by the length of the cross-arms of the tower and the safety distance, and the plus and minus signs indicate both sides of the tower. is the azimuth of the current tower. and are the conversion factors between actual distance and latitude and longitude at the current latitude and longitude. The mission point altitude can be obtained from Equation (3). The above method can obtain the 3D information for task point locations 2 and 8. Task points 3, 4, 5, 9, 10, and 11 can be based on the height of task points 2, and 8, minus the height of the cross-arms. Mission points 6 and 7 are determined by adding a certain safety distance (8 m) to mission points 2 and 8, to ensure that the UAV safely crosses the high-voltage lines.
According to the fine inspection scheme shown in Figure 3, the specific inspection strategy is designed as follows: Starting the inspection task from the ground, when the inspection drone reaches the starting point position, it starts to descend in height to task point 1, i.e., after the same height as the ground line, it performs the task of taking pictures at that point. Then, it proceeds to mission point 2 at the ground wire and takes a picture of the ground wire. After the ground line photo operation is completed, then the inspection drone’s height is lowered to reach task point 3 at the upper phase position of the tower, task point 4 at the middle phase position, and task point 5 at the lower phase position, to complete the photo task corresponding to each corresponding point. When the tasks of the single-side tower are finished, the inspection drone is raised to cross-tower task point 6 and reaches task point 7 on the opposite side of the tower by moving laterally. There is no photo task at these two points, so the role is to allow the inspection drone to traverse towers at a safe height. On the other side of the tower, the inspection drone lowers its altitude to reach task points 8 to 11 and complete the photo task. When all the tasks of the first tower are performed, the inspection drone is raised to the termination point, and then it flies to the starting point of the next tower. The inspection drone continues to perform the above inspection actions according to the task data until it reaches the end of the mission; at this point, the fine inspection task is completed.
3.2.2. Arc-Chasing Inspection and Channel Inspection
According to requirement 11 in Table 1, the arc-chasing inspection scheme is designed as shown in Figure 4a, and the 3D information of the task points can be obtained as described in Section 3.2.1. By using inspection drones to perform arc-chasing inspection tasks, operators can check whether the transmission lines are broken, damaged by by foreign objects, etc. According to requirement 12 in Table 1, the channel inspection scheme design is as shown in Figure 4b. Through the channel inspection task, operators can inspect the high-voltage line channel, which affects tower and line safety.
The specific strategy for the execution of the arc-chasing inspection task is as follows: The inspection task starts from the starting point, and since there is no demand for photography at the starting point, the inspection drone descends in altitude to task point 1. Once the drone arrives at task point 1, the flight control system adjusts the camera pitch angle to take pictures, while the inspection drone flies at a certain speed to the upper phase conductor of the second tower, i.e., task point 2. When mission point 2 is reached, the on-board camera is suspended at this point because there is no photo task at this mission point. The height of the inspection drone is lowered to reach the mid-phase conductor, i.e., task point 3. Then, the on-board camera equipment is turned on again and performs the same action as above, to complete the inspection operation of the middle-phase transmission lines at task points 3 and 4 and the lower-phase transmission lines at task points 5 and 6. When reaching task point 6, the last one, the inspection drone is raised to the termination point, so that the arc-chasing inspection task is completed.
The specific strategy for the execution of the channel inspection task is as follows: The inspection task is executed from the starting point, and the starting task point is located at a fixed height directly above the first pole tower; when the inspection drone reaches the starting point, the flight control system controls the on-board camera, which starts working and takes pictures of the channel below at regular intervals. When the inspection drone reaches the second point, it continues to fly to the subsequent task points until it reaches the last termination point; then, the on-board camera stops working, the inspection drone starts to return, and the channel inspection task is completed.
3.3. Sliding Mode Control Algorithm
The whole UAV control system adopts the structure of position control, speed control, attitude control, and bottom stabilization control, as shown in Figure 5. With this approach, complex control problems can be decomposed, thus facilitating the design and implementation of the overall controller. The control objects of the position controller include the velocity controller, the attitude angle controller, the attitude angle rate controller, and the robot’s power system. When the UAV receives the latitude and longitude of the target point, sent by the ground station as the control input, it can perform position control by combining the real-time latitude and longitude information during the inspection, thus calculating the target value for speed control. Velocity control refers to the process of calculating the attitude angle target value in the UAV body coordinate system by the velocity error in the N and E directions. Since both the attitude angle controller and the attitude angle rate controller operate at a high frequency, the main characteristics of this data source are the low amount of error and stable acquisition in all environments. Therefore, the performance of the attitude angle controller as well as the attitude angle rate controller is usually relatively stable, and the performance of the speed controller directly determines the stability and accuracy of the flight process of the inspection robot.
Regarding the choice of control algorithm, the sliding mode control has strong robustness and can tolerate external disturbances well, so we chose the sliding mode control algorithm to design the speed controller of the UAV.
Equation (4) is satisfied between the multi-rotor UAV motor speed and the velocity , where m is the weight of the multi-rotor UAV; and denotes the pitch and roll angles of the UAV, respectively; n denotes the specific number of rotors; is the lift coefficient; is the air density; S denotes the windward area of the UAV in flight; and is the air drag constant.
Ignoring the coupling between the axes during the motion and considering only the motion in a small angular range, the velocity model can be assumed as Equation (5), where is the dynamic acceleration, represents the real-time velocity, and , , and are the model parameters, which can be obtained by debugging. Since the measurement result of the speed sensor is usually accompanied by a measurement delay, we add the delayed speed to the system as an extended state, and then Equation (5) can be expressed again as Equation (6), where d is the delay factor.
Based on this model, the reference model for designing the speed control is shown in Equation (7), where r is the original velocity target information and the output matrix in the reference model is consistent with the real model, i.e., , while the input matrix , the specific calculation procedure of which is described in Ref. [30]. can be obtained by debugging.
By designing the reference model, the original velocity information can be transformed into the target value corresponding to each state, and the error between the actual state and the target state is noted as Equation (8), where and is the integral of the velocity error. The design switching function is , and the derivative is shown in Equation (9).
After each state converges and remains in the sliding mode plane, the switching function and its derivative are zero, and then its equivalent control can be expressed as Equation (10).
3.4. Intelligent Machine Nest
To improve the efficiency and inspection time, this paper designs a mobile inspection scheme, as shown in Figure 6. When the inspection drone starts to perform the task, the operator drives the vehicle to the ready landing position in advance and waits to replace the battery after the inspection drone work is completed. Transferring sites and putting away the equipment are completed during the inspection time period. The intelligent machine nest is able to charge the drone’s battery, which guarantees that the drone can carry out long inspection missions.
The whole structure of the intelligent machine nest is shown in the lower right corner of Figure 6. The upper surface is the apron, its structure with beveled edges on the left and right can make up for the accuracy error of the inspection drone landing on the apron, and four sensor brackets are installed on the apron to detect whether there is an inspection drone on the apron. Four cylinders are installed on the lower surface of the apron, which is the power equipment for the homing and locking device of the inspection drone. Six battery compartments are installed underneath the cylinders, which are fixed on two crossbeams. The space underneath the battery compartments is reserved for the optional installation of charging stewards, chargers, and air compressors. The robotic arm designed in this paper has three degrees of freedom, which are the Z-axis robotic arm providing up and down degrees of freedom, the X-axis robotic arm providing left and right degrees of freedom, and the Y-axis robotic arm providing front and rear degrees of freedom; the battery gripper is installed on the Y-axis robotic arm. Universal wheels are installed on the four corners of the bottom of the intelligent machine nest to form a mobile and fixed device of the intelligent machine nest.
3.5. YOLOX
YOLOX uses YOLOv3 as the baseline, with Darknet53 backbone architecture and spatial pyramid pooling (SPP) layer. The main contribution of YOLOX is the introduction of the “Decoupled Head”, “Data Augmentation”, “Anchor Free”, and “SimOTA Sample Matching” methods. An anchor-free end-to-end object detection framework is built and achieves top-level detection.
Decoupled Head is a standard configuration in object detection one-stage networks, such as RetinaNet [31], FCOS [32], etc. The final bounding box in YOLOv3 is implemented together with the confidence in a 1 × 1 convolution, while in YOLOX the confidence and regression boxes are implemented separately by decoupling the header and being combined into one at the prediction time. Decoupling the detection head increases the complexity of the operation; in order to achieve a balance between speed and performance, the experiments first used one 1 × 1 convolution to reduce the dimensionality and then used two 3 × 3 convolutions in each of the classification and regression branches, which ultimately allowed the model to increase the parameters only a little and brought a 1.1 percentage point improvement in AP on the COCO dataset. YOLOX uses the Mosaic and MixUp data enhancements, which add 2.4 percentage points to YOLOv3. It should be noted that these two data enhancements were turned off for the last 15 epochs of training; before that, Mosaic and Mixup data enhancements were turned on. It was found that ImageNet pre-training would be meaningless due to a stronger data enhancement approach, so all models were trained from scratch. YOLOX uses the Anchor Free method to reduce the model parameters. From the original three groups of anchors predicted by one feature map to one group, the coordinate value of the upper left corner of the grid and the height and width of the predicted box are predicted directly. The main role of SimOTA is to assign a ground truth box to each positive sample in the output prediction box of the network and let the positive sample fit that ground truth box. This replaces the previous anchor scheme to fit the anchor, thus achieving anchor free. SimOTA enables YOLOX to improve 2.3 percentage points on the COCO dataset.
3.6. Improved YOLOX
In order to improve the accuracy of the model, the following improvements are made in this paper based on the YOLOX_m network structure. Firstly, coordinate attention (CA) [33] is introduced after the output feature map of backbone, which embeds the location information of the feature map into the channel attention. Then, the binary cross entropy (BCE) Loss in the confidence loss is changed to the varifocal loss (VFL) [34], to solve the problem of the low confidence of the box where the location prediction is very accurate, i.e., the problem of unbalanced positive and negative samples. Finally, the SCYLLA-IoU (SIoU) [35] loss function is introduced to improve the capability of the bounding box regression. We also tried to add adaptively spatial feature fusion (ASFF) [36] after the output feature map of the neck, but the accuracy improvement on the validation set was very small and added a larger computational effort, so the trick was not increased. The structure of the improved YOLOX is shown in Figure 7.
3.6.1. Coordinate Attention
In the field of object detection, attention mechanism is a very common trick. The more commonly applied attention mechanisms are squeeze-and-excitation networks (SENet) [37], the convolutional block attention module (CBAM) [38], efficient channel attention (ECA) [39], and coordinate attention (CA). The main idea of SENet is to refine the values on the long-width dimension into a single value and then multiply it by the original value on top of the long-width, thus enhancing the useful information and suppressing the less-useful information [40]. CBAM can be considered as an enhanced version of SENet, where the main idea is to perform attentional operations on features in space and on channels. ECA builds on the SENeT module by changing the use of the fully connected layers in SENet to learn the channel attention information for the 1 × 1 convolutional learning of channel attention information. This avoids channel dimensionality reduction when learning channel attention information, while reducing the number of parameters.
Coordinate attention is mainly divided into coordinate information and coordinate attention generation. The specific structure is shown in Figure 8. For the input feature map x, the channels are first encoded along the horizontal and vertical coordinate directions using pooling kernels of dimensions and , respectively. Therefore, the outputs in two different directions are shown in Equations (13) and (14), respectively. The above two transformations not only return a pair of direction-aware attention graphs but also allow the attention module to capture the dependencies in one direction, while preserving the position information in the other direction, which allows the network to localize the target more accurately.
To make full use of the above information, the two feature maps generated by the previous module are first cascaded and then a shared 1 × 1 convolutional transform is used, as shown in Equation (15). The generated is an intermediate feature map of the spatial information in two directions, and denotes the downsampling scale.
Then, f is divided into two separate tensors, and , along the spatial dimension. Next, the number of channels of and are transformed to match the number of channels of input X using two 1×1 convolutions and , as shown in Equations (16) and (17).
Finally, and are expanded as weights, and the output of the final CA module is shown in Equation (18). It is important to consider that when the model introduces the attention mechanism, the number of input and output channels on the feature map should be consistent with the original network.
3.6.2. Varifocal Loss
The confidence loss in YOLOX is the binary crossentropy (BCE) loss, and the BCE is defined as in Equation (19), where is the binary label value 0 or 1, and is the probability of belonging to the label value. When the label value , , the label value , and . It can be seen that the loss is small when the predicted value is close to the labeled value and large when the predicted value is far from the labeled value.
However, BCE does not solve the problem of unbalanced sample classification very well, so focal loss was proposed based on BCE. Focal loss adds a moderator to reduce the weight of easy-to-classify samples based on the balanced BCE loss function, which focuses on the training of difficult samples. It is defined as Equation (20), where is the weight used to balance positive and negative samples, is the adjustment factor, and is the adjustable focusing parameter. The larger the value of is, the smaller the loss of the positive samples is, and the model’s attention is directed to the hard-to-classify samples; and a large expands the range of samples for which a small loss is obtained. This loss function reduces the weight of the easy-to-classify samples and focuses on the hard-to-classify samples.
Based on this idea of weighting in focal loss, Zhang et al. used to train the regression continuous IoU-aware classification score (IACS). Focal loss is treated the same for positive and negative samples, while is not equivalent, and is defined as shown in Equation (21).
Here, p is the predicted IACS and q is the target IoU score. q is the IoU between the prediction box and the ground truth box for positive samples, and q is 0 for negative samples. attenuates only the negative samples with , while the positive samples are weighted using q. If the positive samples have a high IoU, the loss should be larger, so that the training can focus on the samples with high quality. To balance the overall positive and negative samples, also used for weighting the negative samples.
3.6.3. SCYLLA-IoU
Intersection over union (IoU) loss is the most common loss function in object detection. The IoU loss defines the intersection ratio of the ground truth box and the prediction box, and the loss is 1 when there is no intersection between the prediction box and the ground truth box. However, when the prediction box is closer to the ground truth box, the loss is smaller, and when the prediction box and the ground truth box intersection and ratio are the same, the IoU loss cannot determine which prediction box is more accurate. Generalized intersection over union (GIoU) [41] loss proposes an external rectangular box and an intersecting rectangular box to better reflect the overlap between the two, which solves these two problems to some extent. However, when the prediction box is parallel to the ground truth box, GIoU loss degenerates to IoU loss. Distance-IoU (DIoU) [42] loss introduces a penalty term to directly minimize the normalized distance between the prediction frame and the center point of the ground truth box, which not only solves the nonoverlapping problem but also converges faster. Complete-IoU (CIoU) [42] loss adds a width-to-height ratio constraint over DIoU loss, which allows CIoU to have faster convergence and a further improvement in accuracy.
None of the above loss functions consider the angle, but the angle can indeed affect the regression, so the SCYLLA-IoU (SIoU) loss function was proposed by Gevorgyan et al. The SIoU loss function consists of four cost functions: angle, distance, shape, and IoU. The angle cost is shown in Figure 9a, where B is the prediction box and is the ground truth box. When the angle from B to converges to , the opposite converges to . The maximum value is obtained at . The specific definition is shown in Equation (22).
Distance cost is defined in Equations (23) and (24). Taking the horizontal direction as an example, that is, when the two boxes are nearly parallel, tends to 0, so that the calculated angular distance between the two boxes is close to 0; at this time is also close to 2, and then the distance between the two boxes for the overall loss of the contribution becomes less. In addition, when tends to 45°, the angle cost between the two boxes is calculated to be 1; at this time is close to 1, and the distance between the two boxes should be taken seriously and needs to account for a larger loss.
Shape cost is defined in Equations (25) and (26). Shape cost shows whether the prediction box is consistent with the ground truth box in terms of length and width, using in the experiment. In summary, the specific definition of the SIoU loss function is given in Equation (27).
4. Experiments
In this section, the dataset for the experiments, the evaluation metrics of the model, and the training conditions are presented first. Then the ablation experiments are performed on the YOLOX network model. Finally, a practicality validation test of the system is performed.
4.1. Dataset Establishment
The datasets in this paper were partly obtained by autonomous UAV flights and partly collected from the Internet. Since there are fewer datasets for problems related to defects such as displacement of the grading ring and defective locking pins, the current dataset involved in this experiment is mainly about bird’s nests on electric towers. A total of 2822 images of bird’s nest data were collected, divided into a training set of 2430 images, a validation set of 282 images, and a test set of 110 images. In our experiments, we found that Mosaic data augmentation is not applicable to the dataset in this paper, so we turned off Mosaic data augmentation during the model training. We also found that by adding the L1 loss function at the beginning of the training, the model performs a little better on the test set.
4.2. Evaluation Metrics
The evaluation metrics of the object detection model in this experiment are , , and . is able to detect the performance of the network model in predicting positive samples, i.e., how many of the positive samples predicted by the network model are correct positive samples; the higher the value is, the higher the accuracy of the model detection is. is the proportion of true positive samples predicted as positive by the network model to the total positive samples. In general, the values of and are mutually constrained: the higher the is, the lower the is, and vice versa.
The area under the Precision-Recall curve is called , and the average value of each category is mean Average Precision (). is for small objects: area < 32 × 32, is for medium objects: 32 × 32 < area <96 × 96, is for large objects: area > 96 × 96. is the average value of AP for each category when the value of intersection over union (IOU) is 0.5. is the average value of mAP for different IOU thresholds (IOU = 0.5, 0.55, 0.6, 0.65, 0.7, 0.75, 0.8, 0.85, 0.9, and 0.95). N is the total number of each category, K is the range of values of IOU, and K denotes the current threshold of IOU. and represent the and of the network model when the threshold of IOU is K, respectively.
4.3. Model Training
The experimental platform for model training in this paper is as follows: OS is Windows 11, GPU is GeForce RTX3090, CPU is Intel(R) Core(TM) i9-12900K, application development language is Python3.8, deep learning framework is Pytorchv1.11.0, and CUDA11.3. The initial parameters of the model training are as follows: the input size of the image is 768 × 1280, the initial learning rate is 0.01, the epoch value of warmup is 5, the value of weight decay is 0.0005, the L1 loss function is increased from the beginning of training, and the epoch of training is 200.
4.4. Ablation Experiments
YOLOX has six different versions of the network model YOLOX_s, YOLOX_m, YOLOX_l, YOLOX_x, YOLOX_tiny and YOLOX_nano. Among them, YOLOX_tiny and YOLOX_nano are lightweight models that require little computing power from the hardware platform and are very friendly for deployment on embedded platforms [43]. The network model in this paper is deployed on a cloud server and is not particularly focused on speed. Therefore, we compared the performance of four other models on the dataset, and the results are shown in Table 2. As seen in Table 2, although the YOLOX_x model had a deep network and a relatively large number of computations and parameters, the accuracy was not the highest. YOLOX_m and YOLOX_l achieve almost the same accuracy, but the number of parameters and computation of YOLOX_m was only half of that of YOLOX_l, so we finally chose YOLOX_m as the baseline of the object detection model.
4.4.1. Attentional Mechanisms
In our experiments, we added different attention mechanisms after the feature maps outputted by backbone, and the specific results are shown in Table 3, which shows that the best results are obtained after adding CA. The improvement over the initial network is 0.62 percentage points in the metric and 0.36 and 0.22 percentage points over CBAM and ECA, respectively, with almost no increase in the number of parameters and computational effort. We also tried to add the attention mechanism to the feature pyramid, but the accuracy not only did not improve, but actually decreased. So, finally, only the CA module was added after the output feature map of backbone.
4.4.2. Confidence Loss
The confidence loss function in YOLOX is the BCE loss function, and we replaced it with the FL loss function and VFL loss function to verify the performance of the model, respectively, and the results are shown in Table 4. The FL loss function not only did not improve the accuracy of the network model but also made the model decrease by 0.39 percentage points. The VFL loss function improved by 0.87 percentage points on the metric. Since the loss function is only used during model training and does not change the structure of the model, it does not increase the computational effort or the number of parameters of the model.
4.4.3. Bounding Box Regression
IoU and GIoU loss functions are provided in YOLOX for bounding box regression, and we tried to verify the performance of DIoU, CIoU, and SIoU loss functions on our dataset; the specific results are shown in Table 5. As can be seen from Table 5, the performance of the SIoU loss function is optimal, with a 0.73 percentage point improvement over the IoU loss function. However, different loss functions may perform differently on different datasets, so it depends on the variation of values on the validation set.
The performance of the improved YOLOX_m network model is shown in Table 6, where row 1 is the baseline and rows 2–4 are our improved model. On the metric, the final model improves 2.22 percentage points over the original network model YOLOX_m, with almost no increase in the number of parameters and computation.
4.5. System Validation
In order to verify the effectiveness of the autonomous inspection system for high-voltage transmission line drones, actual flight tests are very necessary. The actual flight test was conducted with the team’s self-developed UAV as the hardware platform. The experimental site was a high-voltage line in Xuzhou City, Jiangsu Province, China, and the actual flight test was conducted after approval by safety management, as shown in Figure 10. We not only verified the single UAV autonomous inspection operation but also carried out a test of a multiple UAVs simultaneous autonomous inspection operation.
4.5.1. Flight Data
The inspection drone took off from an open area around the high-voltage tower and completed its operational tasks according to the inspection plan described in Section 3.2. To facilitate the viewing of the data, the latitude, longitude, and altitude of the inspection drone flight were transformed into the true distance in the (N, E, D) coordinate system, as shown in Figure 11. Taking Figure 11b as an example, the inspection drone took off from (0,0,0) and conducted a single-side arc-chasing inspection of two high-voltage towers in the distance, returning to (0,0,0) after the inspection task was completed. Its real flight trajectory was consistent with the trajectory depicted in Figure 4a in Section 3.2, and the flight trajectories in Figure 11a,c correspond to the planned trajectories in Figure 3 and Figure 4b, respectively. This shows that inspection drones are able to operate precisely according to the tasks planned in the ground station.
As can be seen from Section 3.3, the speed control of the inspection UAV is the core of the control system, and the tracking results of the speed control can reflect the stability of the UAV flight well. The results of the speed tracking for the three inspection tasks are shown in Figure 12. VelN, VelE, and VelD are the values of the speed in the N direction, E direction, and vertical direction, respectively. Red dashed lines are the speed target values and blue solid lines are the actual speed values. The flight data shows that the inspection drone has good speed tracking performance and stable flight during the actual operation.
4.5.2. Inspection Data Collection
The schematic diagram of fine inspection data collection is shown in Figure 13, which shows the data pictures of arc-chasing wire, full tower, overhanging wire clip, grading ring, and insulator. These data will be uploaded to the cloud server, making it more convenient for operators to view.
A schematic diagram of the dataset collection for arc-chasing inspection and channel inspection is shown in Figure 14, which illustrates the specific details and surroundings of a high-voltage transmission line. The operator can check whether the high-voltage transmission line is broken and/or damaged by foreign objects according to the arc-chasing inspection data, and at the same time can observe whether there are ultra-high trees and illegal buildings in the high-voltage transmission line channel.
4.5.3. Results of the Bird’s Nest Detection
We compared the detection results of YOLOv3, YOLOX_m, and the improved YOLOX_m model for bird’s nests, from which we selected representative detection results, as shown in Figure 15, where the red rectangular box is the result of model detection, the interior of the yellow elliptical box is the result of model incorrect detection, and the yellow rectangular box is a zoomed-in view at the location of the yellow ellipse; the interior of the blue elliptical box is the result of model’s correct detection, and the blue rectangular box is a zoomed-in view at the location of the blue ellipse. The detection sample in the first image was relatively difficult, as the YOLOv3 model did not detect the bird’s nest in the image, while the YOLOX_m model detected the real bird’s nest, but there was a false detection. In the second image, both the YOLOv3 model and the YOLOX_m model had false detections, while the YOLOX_m model had a relatively small range of false detections. In the third image, there were three false detections in the YOLOv3 model and one false detection in the YOLOX_m model. In the fourth image, both the YOLOv3 model and the YOLOX_m model had a false detection, but the location of the false detection were different. The improved YOLOX_m model made a correct detection for all four images. Although the confidence level of some categories is lower than the original YOLOX_m model, no wrong detections were made for any images. In conclusion, the generalization of the improved YOLOX_m model was the best.
4.5.4. Comparison of Inspection Efficiency
After a large number of actual flight experiments, we summarized the relevant technical indicators of this UAV inspection system and compared it with the combined human-machine inspection scheme and the traditional manual inspection scheme, as shown in Table 7. Compared with the human-machine combined inspection scheme, this system inspection scheme’s fine inspection net time is only 5 min, saving about 10 min compared to the human-machine combined inspection scheme and saving about 40 min compared to the traditional manual inspection. The average number of pole towers inspected in a single day is 40, and the maximum number of towers inspected in a single sortie is 6, with the advantages of a duration of 42 min for a single sortie inspection and less than 3 min of intelligent machine nests for a battery replacement, plus only one staff member is needed for system monitoring. In summary, the data show that the UAS described in this paper leads to a significant increase in inspection efficiency.
5. Discussion
The design of the system in this paper is mainly considered with the engineering application of high-voltage transmission line inspection. Compared with the existing inspection system, the advantages of the system in this paper are as follows: (1) It designed and developed a ground station system integrating inspection path planning, task management allocation, data management, intelligent fault diagnosis, and other multi-functional functions, realizing the fully autonomous operation of the inspection process, improving the autonomy of inspection, and saving the cost investment of professional inspection operation training required by the existing inspection. (2) It independently developed a flight control system and navigation system to achieve high robustness and high precision flight control of the flying robot, solving the problem of poor stability of the existing inspection robot flight control. (3) It proposed a mobile inspection scheme, completing the autonomous battery replacement of the inspection robot on the intelligent machine nest and significantly improved the inspection efficiency. (4) It used a fusion YOLOX object detection algorithm, combined with manual detection, accomplishing the rapid generation of detailed inspection reports.
In Table 1, we list the many inspection requirements. At present, only the detection of the bird’s nest is better, and the detection of other defects in the line cannot be detected by applying the deployed algorithm yet. This still requires manual inspection, mainly because of the limited dataset currently collected and the more complex detection of various defects, which is the drawback of this paper. As shown in Figure 16, the grading ring is displaced, the insulator string is tilted, the locking pin is defective, etc. More data need to be collected and a reasonable data enhancement and neural network model needs to be applied to detect the defects.
Regarding the backbone of YOLOX, we also tried some newer backbones such as HorNet [44], EfficientFormer [45], RepVgg [46], MViT [47], etc. They have a good performance in the field of image classification, but placing them into YOLOX was not very satisfactory, as there was almost no improvement for the accuracy of the model, so we kept the backbone of the original model. For the neck part of YOLOX, we also tried to add ASFF after the neck output feature map to filter the interference information and improve the amount of useful information. However, there was little improvement in the accuracy of our dataset, and a large amount of computation was added. Therefore, in the end, ASFF was not added.
6. Conclusions
In this paper, we designed an autonomous inspection system for high-voltage power transmission line drones, which realizes the efficient inspection of high-voltage power transmission lines. Based on the inspection demand of high-voltage power transmission lines, three path planning schemes were designed, including fine inspection, arc-chasing inspection, and channel inspection, to achieve the all-around inspection of high-voltage power transmission lines. In order to make the UAV perform stable operational tasks even at high altitude, a reference model-based sliding mode control algorithm was designed to improve flight stability. A mobile inspection solution was designed to complete the transfer of equipment during the inspection and to complete the task of automatic battery replacement at the same time, which greatly saves time and improves work efficiency. Finally, a YOLOX-based high-precision object detection algorithm was designed. Firstly, CA was added to the backbone output of the three feature maps to improve the ability of the model to extract features. Then the VFL, SIoU loss function was used to further improve the accuracy of the model. The improved YOLOX increased the metric by 2.22 percentage points for bird’s nest detection. In conclusion, after a large amount of flight verification, the high-voltage transmission line UAV autonomous inspection system designed in this paper greatly improves the inspection efficiency and reduces the cost of inspection manpower and material input. It also combines object detection technology, which makes the inspection system more intelligent.
Author Contributions
Conceptualization, Z.L. and W.W.; methodology, Z.L.; software, Z.L.; validation, Z.L., Y.Z. and H.W.; formal analysis, Z.L.; investigation, Z.L.; resources, S.S.; data curation, Z.L.; writing—original draft preparation, Z.L.; writing—review and editing, Z.L.; visualization, Y.Z.; supervision, A.N.; project administration, A.N.; funding acquisition, W.W. All authors have read and agreed to the published version of the manuscript.
Funding
This research received no external funding.
Data Availability Statement
Not applicable.
Conflicts of Interest
The authors declare no conflict of interest.
References
- Mao, T.; Huang, K.; Zeng, X.; Ren, L.; Wang, C.; Li, S.; Zhang, M.; Chen, Y. Development of Power Transmission Line Defects Diagnosis System for UAV Inspection based on Binocular Depth Imaging Technology. In Proceedings of the 2019 2nd International Conference on Electrical Materials and Power Equipment (ICEMPE), Guangzhou, China, 7–10 April 2019; pp. 478–481. [Google Scholar] [CrossRef]
- Wu, C.; Song, J.G.; Zhou, H.; Yang, X.F.; Ni, H.Y.; Yan, W.X. Research on Intelligent Inspection System for HV Power Transmission Lines. In Proceedings of the 2020 IEEE International Conference on High Voltage Engineering and Application (ICHVE), Chongqing, China, 25–29 September 2022; pp. 1–4. [Google Scholar] [CrossRef]
- Knapik, W.; Kowalska, M.K.; Odlanicka-Poczobutt, M.; Kasperek, M. The Internet of Things through Internet Access Using an Electrical Power Transmission System (Power Line Communication) to Improve Digital Competencies and Quality of Life of Selected Social Groups in Poland’s Rural Areas. Energies 2022, 15, 5018. [Google Scholar] [CrossRef]
- Yong, Z.; Xiuxiao, Y.; Yi, F.; Shiyu, C. UAV Low Altitude Photogrammetry for Power Line Inspection. ISPRS Int. J. Geoinf. 2017, 6, 14. [Google Scholar] [CrossRef]
- Chen, D.Q.; Guo, X.H.; Huang, P.; Li, F.H. Safety Distance Analysis of 500kV Transmission Line Tower UAV Patrol Inspection. IEEE Electromagn. Compat. Mag. 2020, 2, 124–128. [Google Scholar] [CrossRef]
- Larrauri, J.I.; Sorrosal, G.; González, M. Automatic system for overhead power line inspection using an Unmanned Aerial Vehicle—RELIFO project. In Proceedings of the 2013 International Conference on Unmanned Aircraft Systems (ICUAS), Dubrovnik, Croatia, 28–31 May 2013; pp. 244–252. [Google Scholar] [CrossRef]
- Vemula, S.; Frye, M. Mask R-CNN Powerline Detector: A Deep Learning approach with applications to a UAV. In Proceedings of the 2020 AIAA/IEEE 39th Digital Avionics Systems Conference (DASC), San Antonio, TX, USA, 11–15 October 2020; pp. 244–252. [Google Scholar] [CrossRef]
- Zhao, Z.; Qi, H.; Qi, Y.; Zhang, K.; Zhai, Y.; Zhao, W. Detection method based on automatic visual shape clustering for pin-missing defect in transmission lines. IEEE Instrum. Meas. Mag. 2020, 69, 6080–6091. [Google Scholar] [CrossRef]
- Debenest, P.; Guarnieri, M.; Takita, K.; Fukushima, E.F.; Hirose, S.; Tamura, K.; Kimura, A.; Kubokawa, H.; Lwama, N.; Shiga, F. Expliner—Robot for inspection of transmission lines. In Proceedings of the 2008 IEEE International Conference on Robotics and Automation, Anchorage, AK, USA, 19–23 May 2008; pp. 244–252. [Google Scholar] [CrossRef]
- Matikainen, L.; Lehtomäki, M.; Ahokas, E.; Hyyppä, J.; Karjalainen, M.; Jaakkola, A.; Kukko, A.; Heinonen, T. Remote sensing methods for power line corridor surveys. ISPRS J. Photogramm. Remote Sens. 2016, 119, 10–31. [Google Scholar] [CrossRef] [Green Version]
- Finotto, V.C.; Horikawa, O.; Hirakawa, A.; Chamas Filho, A. Pole type robot for distribution power line inspection. In Proceedings of the 2012 2nd International Conference on Applied Robotics for the Power Industry (CARPI), Zurich, Switzerland, 11–13 September 2012; pp. 244–252. [Google Scholar] [CrossRef]
- Martinez, C.; Sampedro, C.; Chauhan, A.; Collumeau, J.F.; Campoy, P. The Power Line Inspection Software (PoLIS): A versatile system for automating power line inspection. Eng. Appl. Artif. Intell. 2018, 71, 293–314. [Google Scholar] [CrossRef]
- Li, J.; Wang, L.; Shen, X. Unmanned aerial vehicle intelligent patrol-inspection system applied to transmission grid. In Proceedings of the 2018 2nd IEEE Conference on Energy Internet and Energy System Integration (EI2), Beijing, China, 20–22 October 2018; pp. 1–5. [Google Scholar] [CrossRef]
- Calvo, A.; Silano, G.; Capitán, J. Mission Planning and Execution in Heterogeneous Teams of Aerial Robots supporting Power Line Inspection Operations. In Proceedings of the 2022 International Conference on Unmanned Aircraft Systems, Dubrovnik, Croatia, 21–24 June 2022. [Google Scholar]
- Luque-Vega, L.F.; Castillo-Toledo, B.; Loukianov, A.; Gonzalez-Jimenez, L.E. Power line inspection via an unmanned aerial system based on the quadrotor helicopter. In Proceedings of the MELECON 2014—2014 17th IEEE Mediterranean Electrotechnical Conference, Beirut, Lebanon, 13–16 April 2014; pp. 393–397. [Google Scholar] [CrossRef]
- Li, Z.; Mu, S.; Li, J.; Wang, W.; Liu, Y. Transmission line intelligent inspection central control and mass data processing system and application based on UAV. In Proceedings of the 2016 4th International Conference on Applied Robotics for the Power Industry (CARPI), Jinan, China, 11–13 October 2016; pp. 1–5. [Google Scholar] [CrossRef]
- Guan, H.; Sun, X.; Su, Y.; Hu, T.; Wang, H.; Wang, H.; Peng, C.; Guo, Q. UAV-lidar aids automatic intelligent powerline inspection. Int. J. Electr. Power Energy Syst. 2021, 130, 106987. [Google Scholar] [CrossRef]
- Redmon, J.; Divvala, S.; Girshick, R.; Farhadi, A. You only look once: Unified, real-time object detection. In Proceedings of the IEEE Conference on Computer Vision and Pattern Recognition (CVPR), Las Vegas, NV, USA, 26 June–1 July 2016; pp. 779–788. [Google Scholar] [CrossRef]
- Redmon, J.; Farhadi, A. YOLO9000: Better, faster, stronger. In Proceedings of the IEEE Conference on Computer Vision and Pattern Recognition (CVPR), Honolulu, HI, USA, 21–26 July 2017; pp. 6517–6525. [Google Scholar] [CrossRef]
- Redmon, J.; Farhadi, A. Yolov3: An incremental improvement. arXiv 2018, arXiv:1804.02767. [Google Scholar]
- Bochkovskiy, A.; Wang, C.Y.; Liao, H.Y.M. YOLOv4: Optimal Speed and Accuracy of Object Detection. arXiv 2020, arXiv:2004.10934. [Google Scholar]
- Liu, W.; Anguelov, D.; Erhan, D.; Szegedy, C.; Reed, S.E. SSD: Single Shot MultiBox Detector. In Proceedings of the European Conference on Computer Vision, Amsterdam, The Netherlands, 11–14 October 2016. [Google Scholar] [CrossRef]
- Ren, S.; He, K.; Girshick, R.; Sun, J. Faster r-cnn: Towards real-time object detection with region proposal networks. IEEE Trans. Pattern Anal. Mach. Intell. 2017, 39, 1137–1149. [Google Scholar] [CrossRef] [Green Version]
- Xu, C.; Li, Q.; Zhou, Q.; Zhang, S.; Yu, D.; Ma, Y. Power Line-Guided Automatic Electric Transmission Line Inspection System. IEEE Instrum. Meas. Mag. 2022, 71, 1–18. [Google Scholar] [CrossRef]
- Li, H.; Dong, Y.; Liu, Y.; Ai, J. Design and Implementation of UAVs for Bird’s Nest Inspection on Transmission Lines Based on Deep Learning. Drones 2022, 6, 252. [Google Scholar] [CrossRef]
- Hao, J.; Wulin, H.; Jing, C.; Xinyu, L.; Xiren, M.; Shengbin, Z. Detection of bird nests on power line patrol using single shot detector. In Proceedings of the 2019 Chinese Automation Congress (CAC), Hangzhou, China, 22–24 November 2019; pp. 3409–3414. [Google Scholar] [CrossRef]
- Jenssen, R.; Roverso, D. Intelligent Monitoring and Inspection of Power Line Components Powered by UAVs and Deep Learning. IEEE Power Energy Technol. Syst. J. 2019, 6, 11–21. [Google Scholar] [CrossRef]
- Yang, L.; Fan, J.; Song, S.; Liu, Y. A light defect detection algorithm of power insulators from aerial images for power inspection. Neural. Comput. Appl. 2022, 34, 17951–17961. [Google Scholar] [CrossRef]
- Ge, Z.; Liu, S.; Wang, F.; Li, Z.; Sun, J. Yolox: Exceeding yolo series in 2021. arXiv 2021, arXiv:2107.08430. [Google Scholar]
- Wang, W.; Ma, H.; Xia, M.; Weng, L.; Ye, X. Attitude and altitude controller design for quad-rotor type MAVs. Math. Probl. Eng. 2013, 2013, 587098. [Google Scholar] [CrossRef]
- Lin, T.Y.; Goyal, P.; Girshick, R.; He, K.; Dollár, P. Focal loss for dense object detection. In Proceedings of the IEEE International Conference on Computer Vision (ICCV), Venice, Italy, 22–29 October 2017; pp. 2980–2988. [Google Scholar] [CrossRef]
- Tian, Z.; Shen, C.; Chen, H.; He, T. Fcos: Fully convolutional one-stage object detection. In Proceedings of the IEEE International Conference on Computer Vision (ICCV), Seoul, Republic of Korea, 27 October–2 November 2019; pp. 9627–9636. [Google Scholar] [CrossRef]
- Hou, Q.; Zhou, D.; Feng, J. Coordinate attention for efficient mobile network design. In Proceedings of the IEEE/CVF Conference on Computer Vision and Pattern Recognition (CVPR), Online, 14–19 June 2021; pp. 13713–13722. [Google Scholar] [CrossRef]
- Zhang, H.; Wang, Y.; Dayoub, F.; Sunderhauf, N. Varifocalnet: An iou-aware dense object detector. In Proceedings of the IEEE/CVF Conference on Computer Vision and Pattern Recognition (CVPR), Online, 19–25 June 2021; pp. 8514–8523. [Google Scholar] [CrossRef]
- Gevorgyan, Z. SIoU Loss: More Powerful Learning for Bounding Box Regression. arXiv 2022, arXiv:2205.12740. [Google Scholar]
- Liu, S.; Huang, D.; Wang, Y. Learning spatial fusion for single-shot object detection. arXiv 2019, arXiv:1911.09516. [Google Scholar]
- Hu, J.; Shen, L.; Sun, G. Squeeze-and-excitation networks. In Proceedings of the IEEE Conference on Computer Vision and Pattern Recognition (CVPR), Salt Lake City, UT, USA, 18–22 June 2018; pp. 7132–7141. [Google Scholar]
- Woo, S.; Park, J.; Lee, J.Y.; Kweon, I.S. Cbam: Convolutional block attention module. In Proceedings of the European Conference on Computer Vision (ECCV), Munich, Germany, 8–14 September 2018; pp. 3–19. [Google Scholar]
- Wang, Q.; Wu, B.; Zhu, P.; Li, P.; Hu, Q. ECA-Net: Efficient Channel Attention for Deep Convolutional Neural Networks. In Proceedings of the IEEE/CVF Conference on Computer Vision and Pattern Recognition (CVPR), Seattle, WA, USA, 14–19 June 2020. [Google Scholar]
- Li, Z.; Namiki, A.; Suzuki, S.; Wang, Q.; Zhang, T.; Wang, W. Application of Low-Altitude UAV Remote Sensing Image Object Detection Based on Improved YOLOv5. Appl. Sci. 2022, 12, 8314. [Google Scholar] [CrossRef]
- Rezatofighi, H.; Tsoi, N.; Gwak, J.; Sadeghian, A.; Reid, I.; Savarese, S. Generalized intersection over union: A metric and a loss for bounding box regression. In Proceedings of the IEEE/CVF Conference on Computer Vision and Pattern Recognition (CVPR), Long Beach, CA, USA, 16–20 June 2019; pp. 658–666. [Google Scholar]
- Zheng, Z.; Wang, P.; Liu, W.; Li, J.; Ye, R.; Ren, D. Distance-IoU loss: Faster and better learning for bounding box regression. In Proceedings of the AAAI Conference on Artificial Intelligence, New York, NY, USA, 7–12 February 2020; pp. 12993–13000. [Google Scholar] [CrossRef]
- Chunxiang, Z.; Jiacheng, Q.; Wang, B. YOLOX on Embedded Device With CCTV & TensorRT for Intelligent Multicategories Garbage Identification and Classification. IEEE Sens. J. 2022, 22, 16522–16532. [Google Scholar] [CrossRef]
- Rao, Y.; Zhao, W.; Tang, Y.; Zhou, J.; Lim, S.N.; Lu, J. Hornet: Efficient high-order spatial interactions with recursive gated convolutions. arXiv 2022, arXiv:2207.14284. [Google Scholar]
- Li, Y.; Yuan, G.; Wen, Y.; Hu, E.; Evangelidis, G.; Tulyakov, S.; Wang, Y.; Ren, J. EfficientFormer: Vision Transformers at MobileNet Speed. arXiv 2022, arXiv:2206.01191. [Google Scholar]
- Ding, X.; Zhang, X.; Ma, N.; Han, J.; Ding, G.; Sun, J. Repvgg: Making vgg-style convnets great again. In Proceedings of the IEEE/CVF Conference on Computer Vision and Pattern Recognition (CVPR), Online, 19–25 June 2021; pp. 13733–13742. [Google Scholar] [CrossRef]
- Li, Y.; Wu, C.Y.; Fan, H.; Mangalam, K.; Xiong, B.; Malik, J.; Feichtenhofer, C. MViTv2: Improved Multiscale Vision Transformers for Classification and Detection. In Proceedings of the IEEE/CVF Conference on Computer Vision and Pattern Recognition (CVPR), New Orleans, LA, USA, 19–24 June 2022; pp. 4804–4814. [Google Scholar]
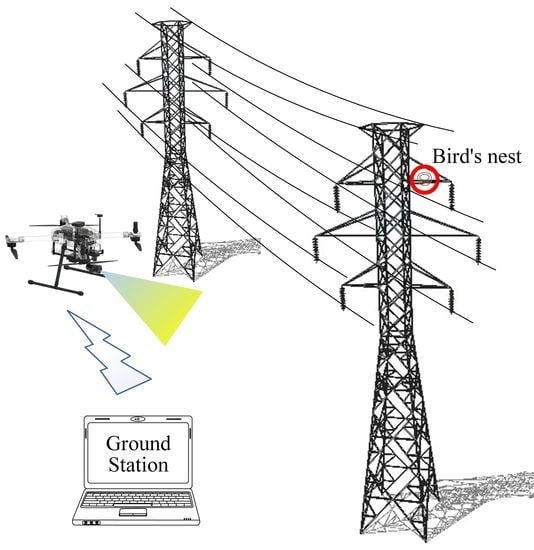
Figure 1.
Comparison of the traditional inspection solution and our solution.

Figure 2.
The structure of the system.

Figure 3.
The process of fine inspection.

Figure 4.
(a) The process of arc-chasing inspection; (b) The process of channel inspection.

Figure 5.
The structure of the control.

Figure 6.
Intelligent machine nest. Green is the drone inspection route and gray is the vehicle route.
Figure 6.
Intelligent machine nest. Green is the drone inspection route and gray is the vehicle route.

Figure 7.
The structure of the improved YOLOX.

Figure 8.
The structure of the coordinate attention.

Figure 9.
(a) Graphical explanation of SIoU loss function; (b) The definition of IoU.

Figure 10.
Actual flight environment. (a) Preparation stage of autonomous inspection operation of UAV; (b) Intelligent machine nest test; (c) Single UAV for autonomous inspection operation; (d) Multiple UAVs for autonomous inspection operations.
Figure 10.
Actual flight environment. (a) Preparation stage of autonomous inspection operation of UAV; (b) Intelligent machine nest test; (c) Single UAV for autonomous inspection operation; (d) Multiple UAVs for autonomous inspection operations.

Figure 11.
(a) The trajectory of fine inspection; (b) The trajectory of arc-chasing inspection; (c) The trajectory of channel inspection.The red points are mission points and the blue lines are the flight paths of the drones.
Figure 11.
(a) The trajectory of fine inspection; (b) The trajectory of arc-chasing inspection; (c) The trajectory of channel inspection.The red points are mission points and the blue lines are the flight paths of the drones.

Figure 12.
(a) Speed-tracking results for fine inspection; (b) Speed-tracking results for chasing inspection; (c) Speed-tracking results for channel inspection.
Figure 12.
(a) Speed-tracking results for fine inspection; (b) Speed-tracking results for chasing inspection; (c) Speed-tracking results for channel inspection.

Figure 13.
Fine inspection task data collection.

Figure 14.
Arc-chasing inspection and channel inspection task data collection.

Figure 15.
Comparison of the detection results of the different models. The red rectangular box is the detection result of the model, inside the yellow border is the incorrect detection result, and inside the blue border is the correct detection result.
Figure 15.
Comparison of the detection results of the different models. The red rectangular box is the detection result of the model, inside the yellow border is the incorrect detection result, and inside the blue border is the correct detection result.

Figure 16.
(a) The grading ring is displaced; (b) The locking pin is defective; (c) The insulator string is tilted.
Figure 16.
(a) The grading ring is displaced; (b) The locking pin is defective; (c) The insulator string is tilted.


Table 1.
High-voltage power transmission line inspection demands.
| No. | Point of Demand | Inspection Contents |
|---|---|---|
| 1 | High-voltage line towers | Detection of whether the tower is deformed or tilted, the presence of a bird’s nest, etc. |
| 2 | Tower bases | Detection of the ground conditions near the tower base |
| 3 | Cross-arms | Detection of whether the cross-arms are tilted and other abnormalities |
| 4 | Insulators | Detection of an insulator skirt and grading ring damage |
| 5 | Bolts | Detection of whether the installed bolts and nuts have popped out or fallen off, etc. |
| 6 | Lightning rod and grounding device | Detection of whether the discharge gap between them has changed significantly |
| 7 | Anti-vibration hammer | Detection of the fracture of the anti-vibration hammer connection |
| 8 | Lead wire pegging point fixtures | Testing of small size fixtures such as wire pendant locking pins |
| 9 | Ground wire | Detection of ground wire for loose strands and other defects |
| 10 | Ground wire pegging point fixtures | Detection of ground peg locking pin and other objects |
| 11 | Power transmission lines | Detection of whether the transmission line is broken, damaged by foreign objects, etc. |
| 12 | Channel | Checking of over-height trees and illegal buildings in the passage |
Table 2.
Different versions of YOLOX performance comparison.
| Methods | Size | Par | Gflops | (%) | (%) | |||
|---|---|---|---|---|---|---|---|---|
| YOLOX_s | 768 × 1280 | 8.94 M | 64.22 | 97.7 | 70.05 | / | 77.6 | 69.6 |
| YOLOX_m | 768 × 1280 | 25.28 M | 176.94 | 97.8 | 70.63 | / | 75.6 | 70.5 |
| YOLOX_l | 768 × 1280 | 54.15 M | 373.61 | 97.9 | 70.65 | / | 74.9 | 70.6 |
| YOLOX_x | 768 × 1280 | 99.00 M | 676.87 | 97.8 | 70.37 | / | 77.3 | 70.0 |
Table 3.
Performance comparison of different attention mechanisms.
| Methods | Size | Par | Gflops | (%) | (%) | |||
|---|---|---|---|---|---|---|---|---|
| YOLOX_m | 768 × 1280 | 25.28 M | 176.94 | 97.8 | 70.63 | / | 75.6 | 70.5 |
| YOLOX_m + SENet | 768 × 1280 | 25.38 M | 176.96 | 97.8 | 70.30 | / | 75.2 | 70.0 |
| YOLOX_m + CBAM | 768 × 1280 | 25.47 M | 177.00 | 97.8 | 70.89 | / | 76.7 | 70.7 |
| YOLOX_m + ECA | 768 × 1280 | 25.28 M | 176.95 | 97.8 | 71.03 | / | 76.7 | 70.8 |
| YOLOX_m + CA | 768 × 1280 | 25.36 M | 177.03 | 97.8 | 71.25 | / | 76.8 | 71.0 |
Table 4.
Performance comparison of different confidence loss functions.
| Methods | (%) | (%) | |||
|---|---|---|---|---|---|
| YOLOX_m + BCE | 97.8 | 70.63 | / | 75.6 | 70.5 |
| YOLOX_m + FL | 97.7 | 70.22 | 2.8 | 72.4 | 70.4 |
| YOLOX_m + VFL | 98.3 | 71.50 | 20.5 | 76.6 | 71.2 |
Table 5.
Performance comparison of different regression loss functions.
| Methods | (%) | (%) | |||
|---|---|---|---|---|---|
| YOLOX_m + IoU | 97.8 | 70.63 | / | 75.6 | 70.5 |
| YOLOX_m + GIoU | 97.8 | 70.92 | / | 76.7 | 70.7 |
| YOLOX_m + DIoU | 97.8 | 71.12 | / | 76.7 | 70.8 |
| YOLOX_m + CIoU | 97.8 | 71.18 | / | 76.7 | 70.8 |
| YOLOX_m + SIoU | 97.9 | 71.36 | / | 76.7 | 71.1 |
Table 6.
Performance of the improved YOLOX_m model.
| YOLO_m | CA | VFL | SIoU | Par | Gflops | (%) |
|---|---|---|---|---|---|---|
| ✓ | 25.28 M | 176.94 | 70.63 | |||
| ✓ | ✓ | 25.36 M | 177.03 | 71.25 (+0.62) | ||
| ✓ | ✓ | ✓ | 25.36 M | 177.03 | 72.12 (+0.87) | |
| ✓ | ✓ | ✓ | ✓ | 25.36 M | 177.03 | 72.85 (+0.73) |
Table 7.
Comparison of performance indicators of different inspection schemes.
| Inspection Scheme Technical Index | Our Inspection Scheme | Combined Human-Machine Inspection Scheme | Traditional Manual Inspection Scheme |
|---|---|---|---|
| Fine inspection net inspection time | 5 min | 10–20 min | 50 min |
| Average number of towers inspected per day | 40 | 20 | 5 |
| Maximum number of towers inspected in a single sortie | 6 | 2 | 1 |
| Endurance of single sortie inspection | 42 min | 25 min | / |
| Maximum inspection distance for a single sortie | 5000 m | 2000 m | / |
| Number of maximum waypoints inspected | 1000 | 300 | / |
| Battery replacement time | <3 min | 5 min | / |
| Number of staff | 1 | 3 | 6 |
| Inspection report issuance time | 1 day | 2 days | 3–4 days |
Disclaimer/Publisher’s Note: The statements, opinions and data contained in all publications are solely those of the individual author(s) and contributor(s) and not of MDPI and/or the editor(s). MDPI and/or the editor(s) disclaim responsibility for any injury to people or property resulting from any ideas, methods, instructions or products referred to in the content. |
© 2023 by the authors. Licensee MDPI, Basel, Switzerland. This article is an open access article distributed under the terms and conditions of the Creative Commons Attribution (CC BY) license (https://creativecommons.org/licenses/by/4.0/).
Share and Cite
MDPI and ACS Style
Li, Z.; Zhang, Y.; Wu, H.; Suzuki, S.; Namiki, A.; Wang, W. Design and Application of a UAV Autonomous Inspection System for High-Voltage Power Transmission Lines. Remote Sens. 2023, 15, 865. https://doi.org/10.3390/rs15030865
AMA Style
Li Z, Zhang Y, Wu H, Suzuki S, Namiki A, Wang W. Design and Application of a UAV Autonomous Inspection System for High-Voltage Power Transmission Lines. Remote Sensing. 2023; 15(3):865. https://doi.org/10.3390/rs15030865
Chicago/Turabian StyleLi, Ziran, Yanwen Zhang, Hao Wu, Satoshi Suzuki, Akio Namiki, and Wei Wang. 2023. "Design and Application of a UAV Autonomous Inspection System for High-Voltage Power Transmission Lines" Remote Sensing 15, no. 3: 865. https://doi.org/10.3390/rs15030865
Note that from the first issue of 2016, this journal uses article numbers instead of page numbers. See further details here.