
Weak Signal Processing Method for Moving Target of GNSS-S Radar Based on Amplitude and Phase Self-Correction
 , , , and
Abstract
:
1. Introduction
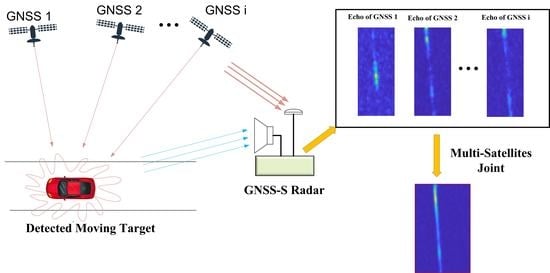
2. Overview of GNSS-S Radar System
2.1. System Composition
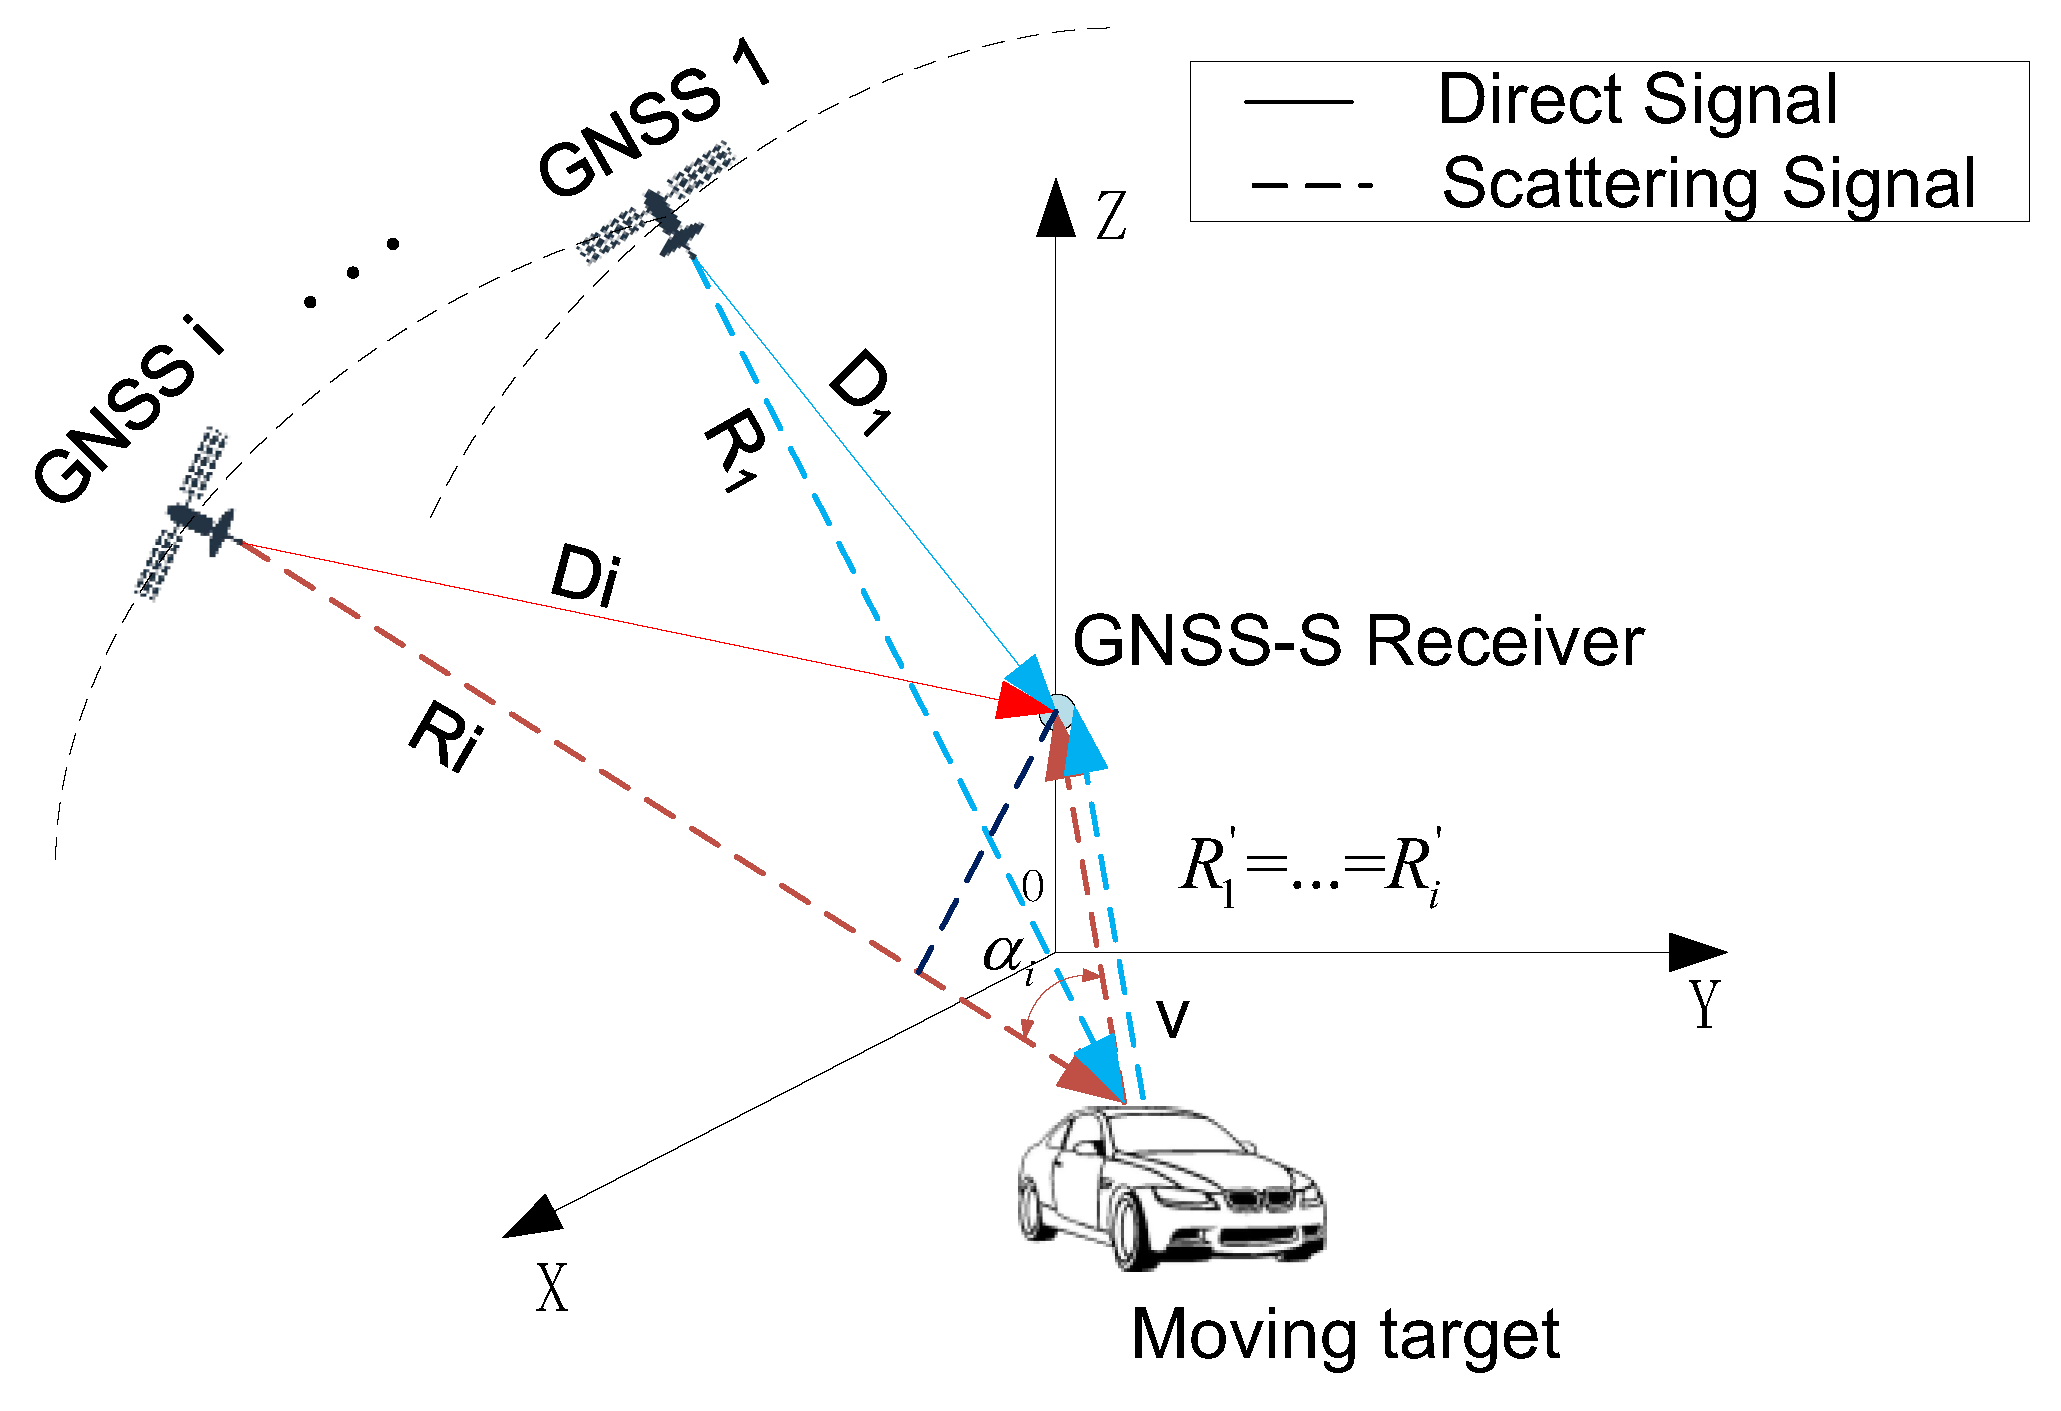
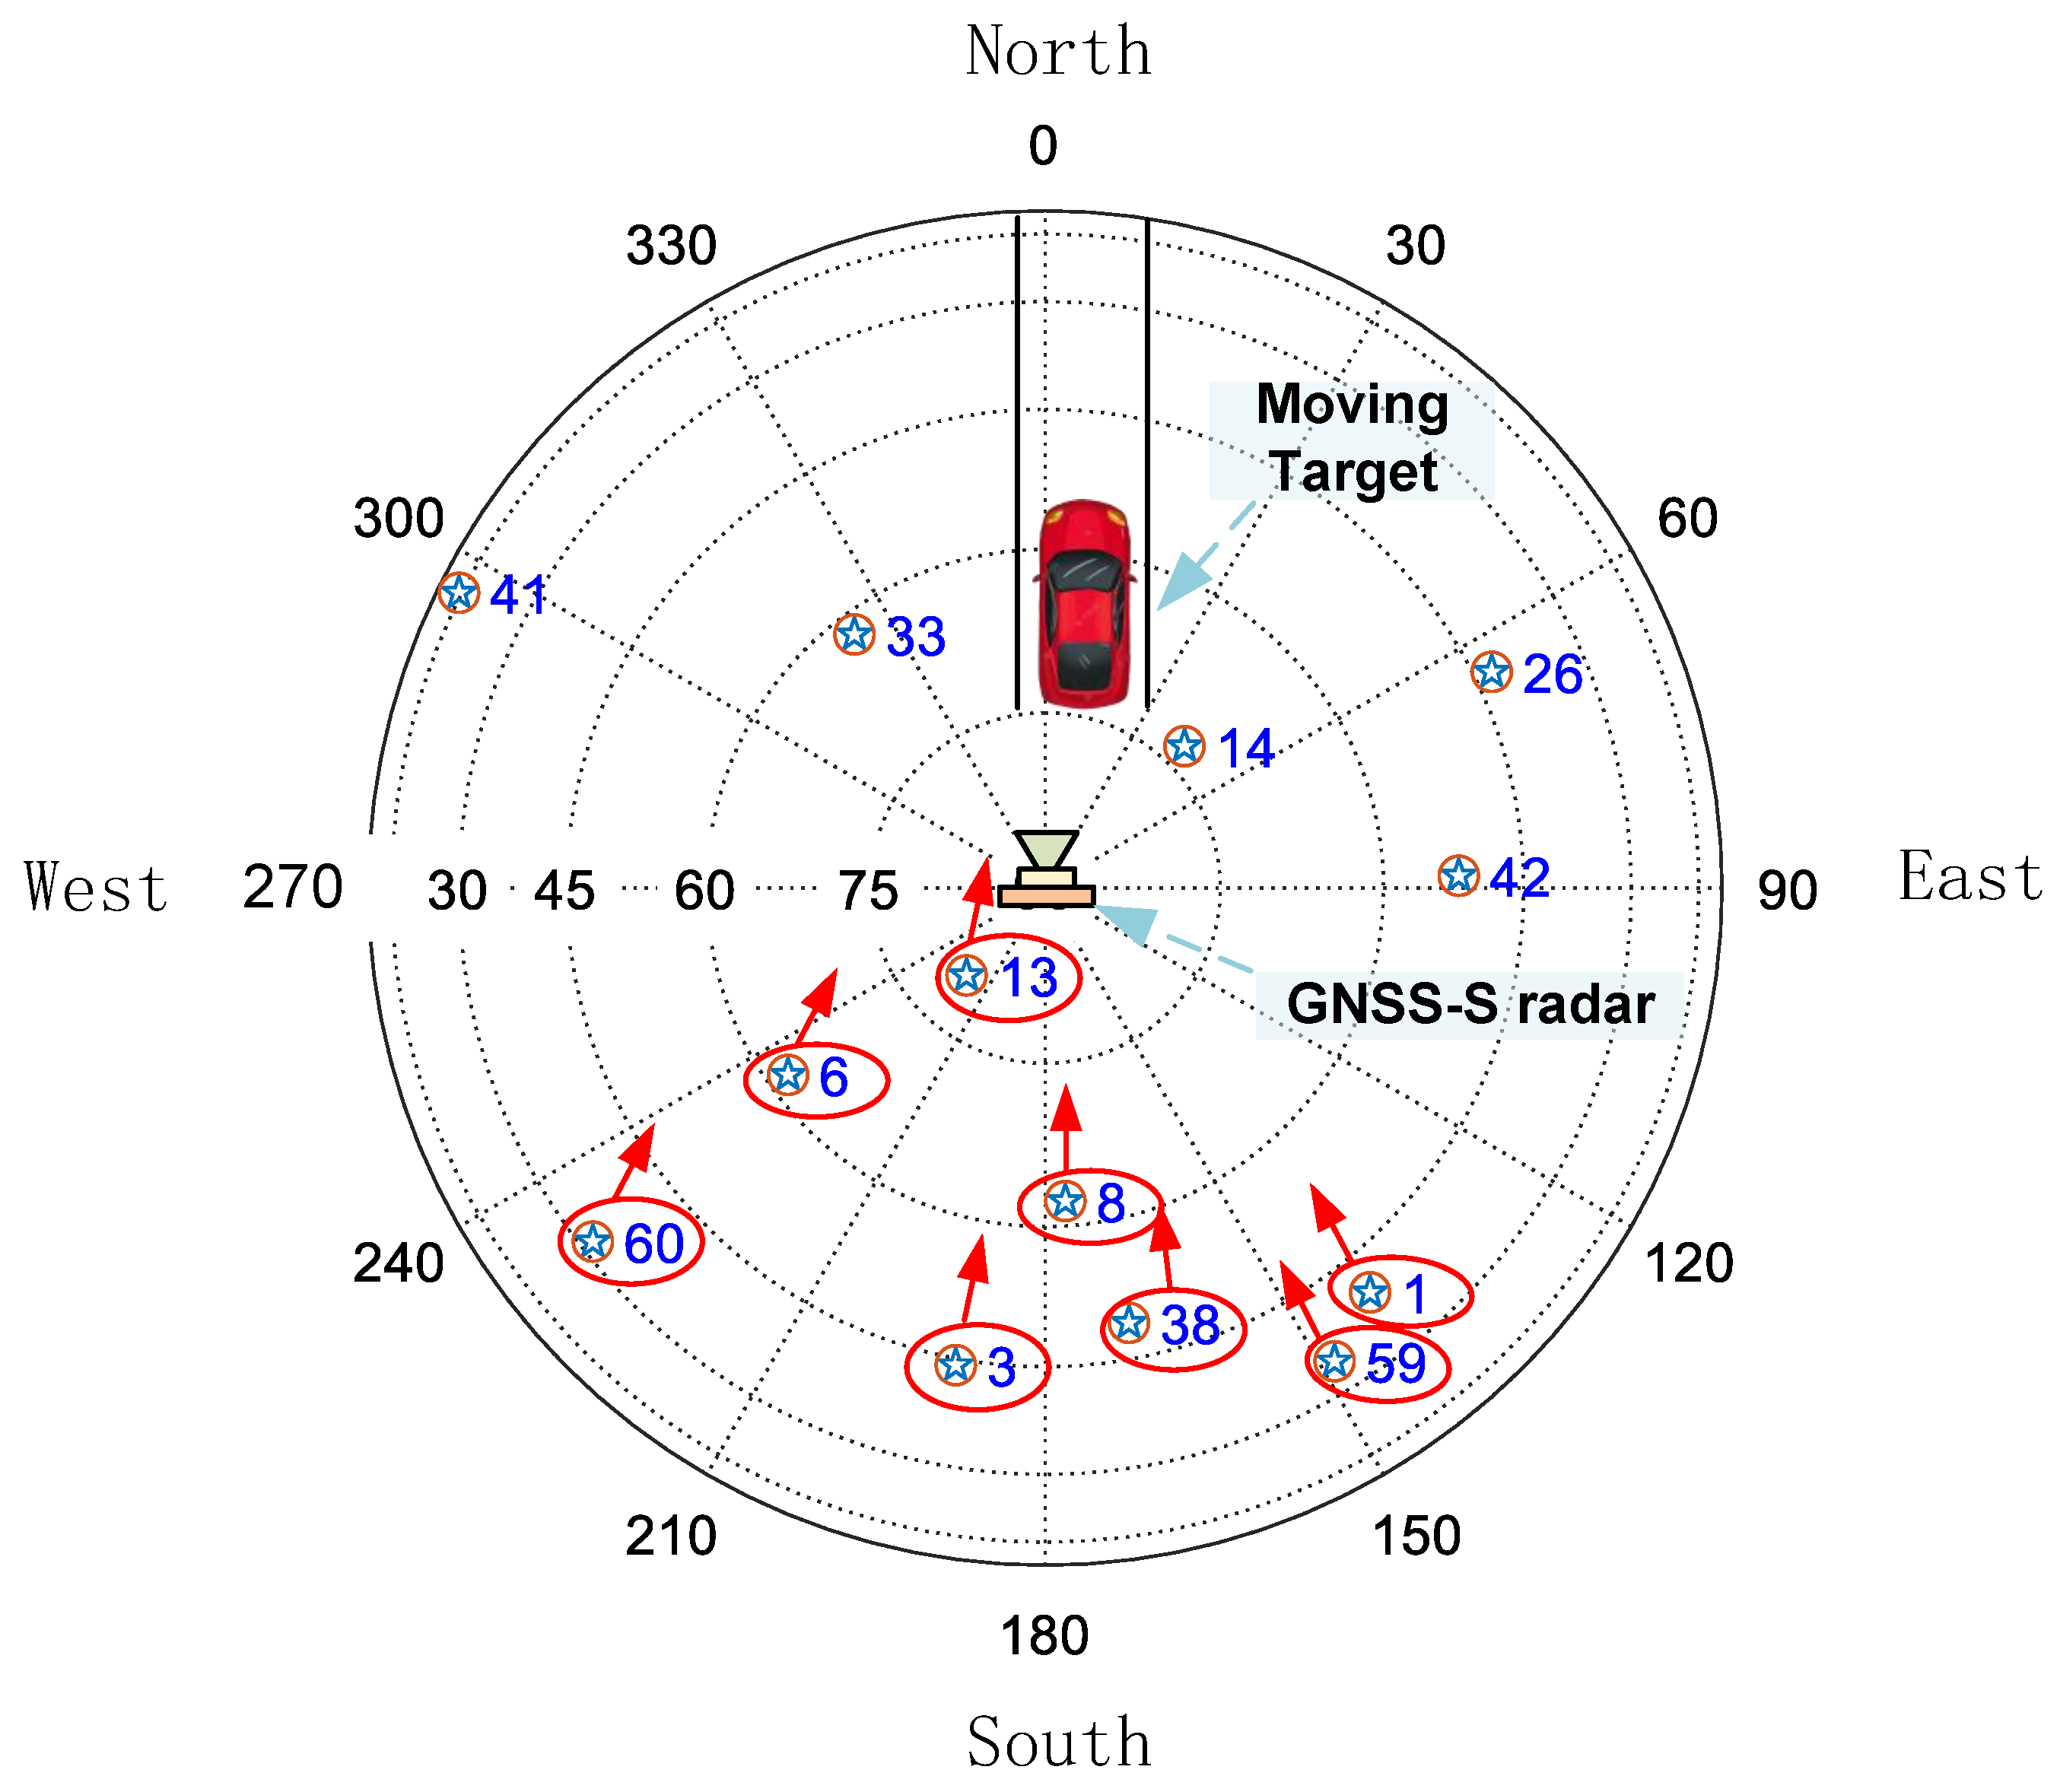
2.2. Geometry Configuration
2.3. Signal Model
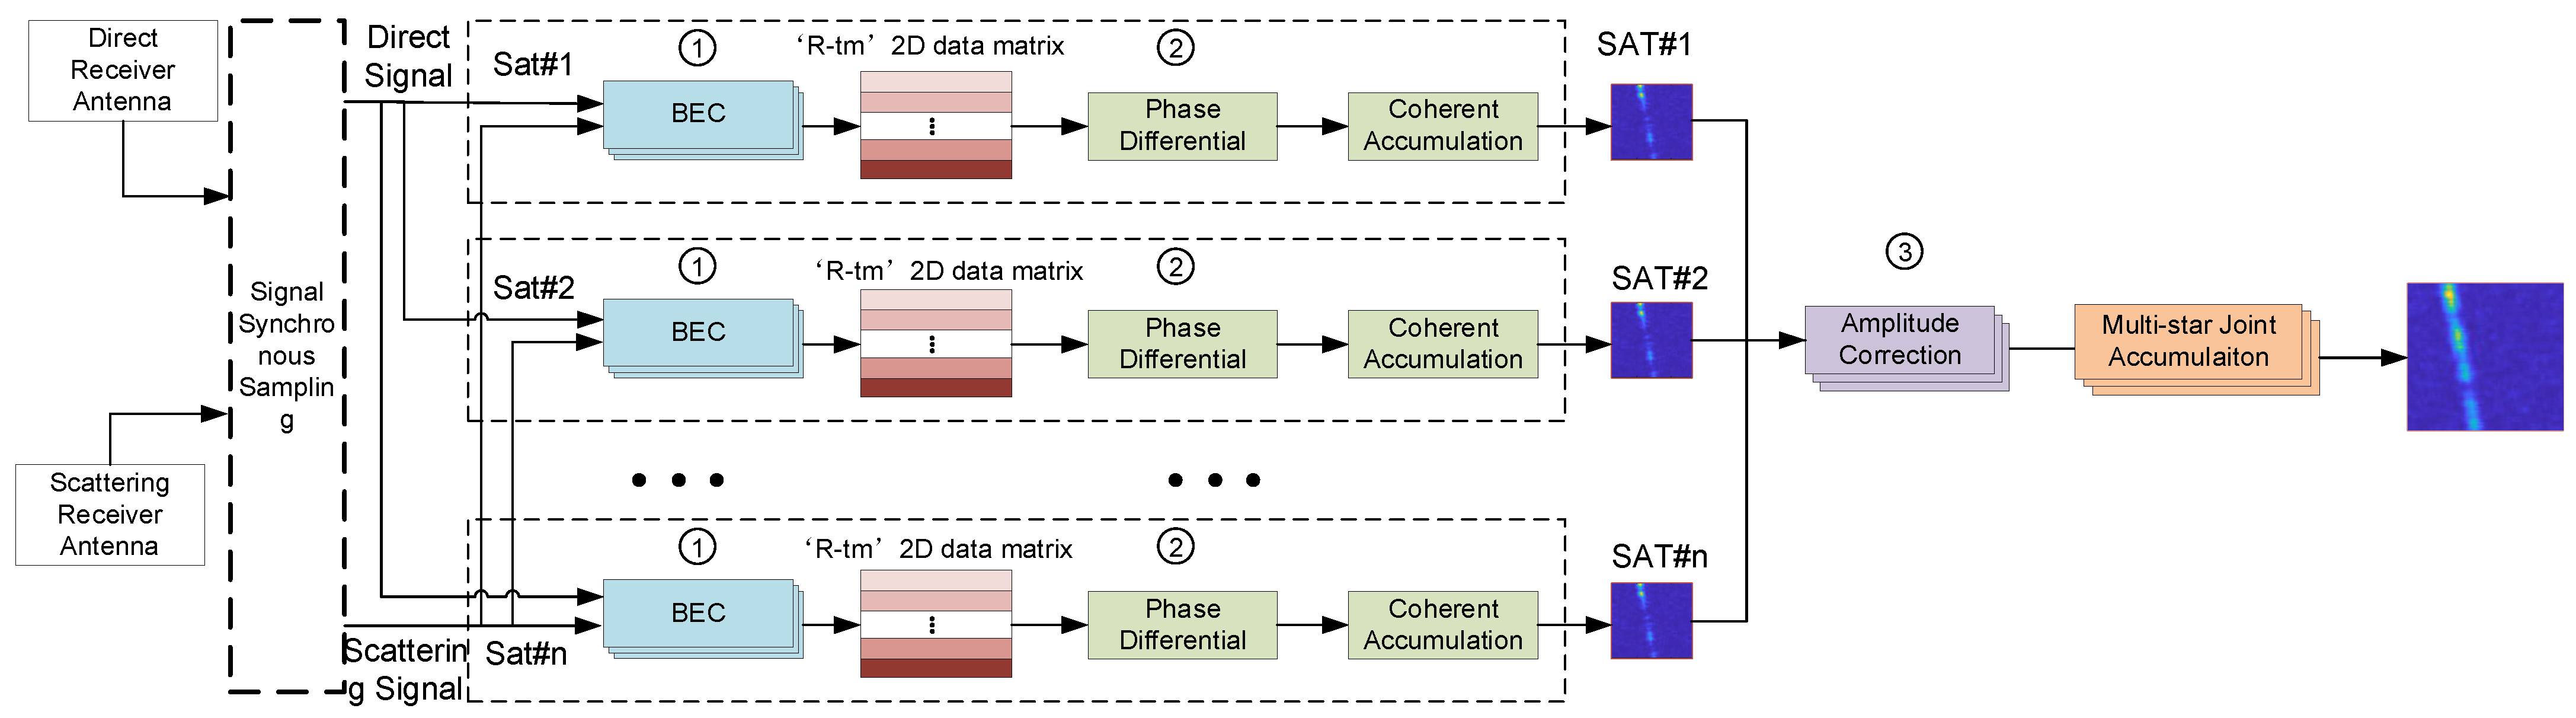
3. Phase and Amplitude Self-Correction Processing Methods
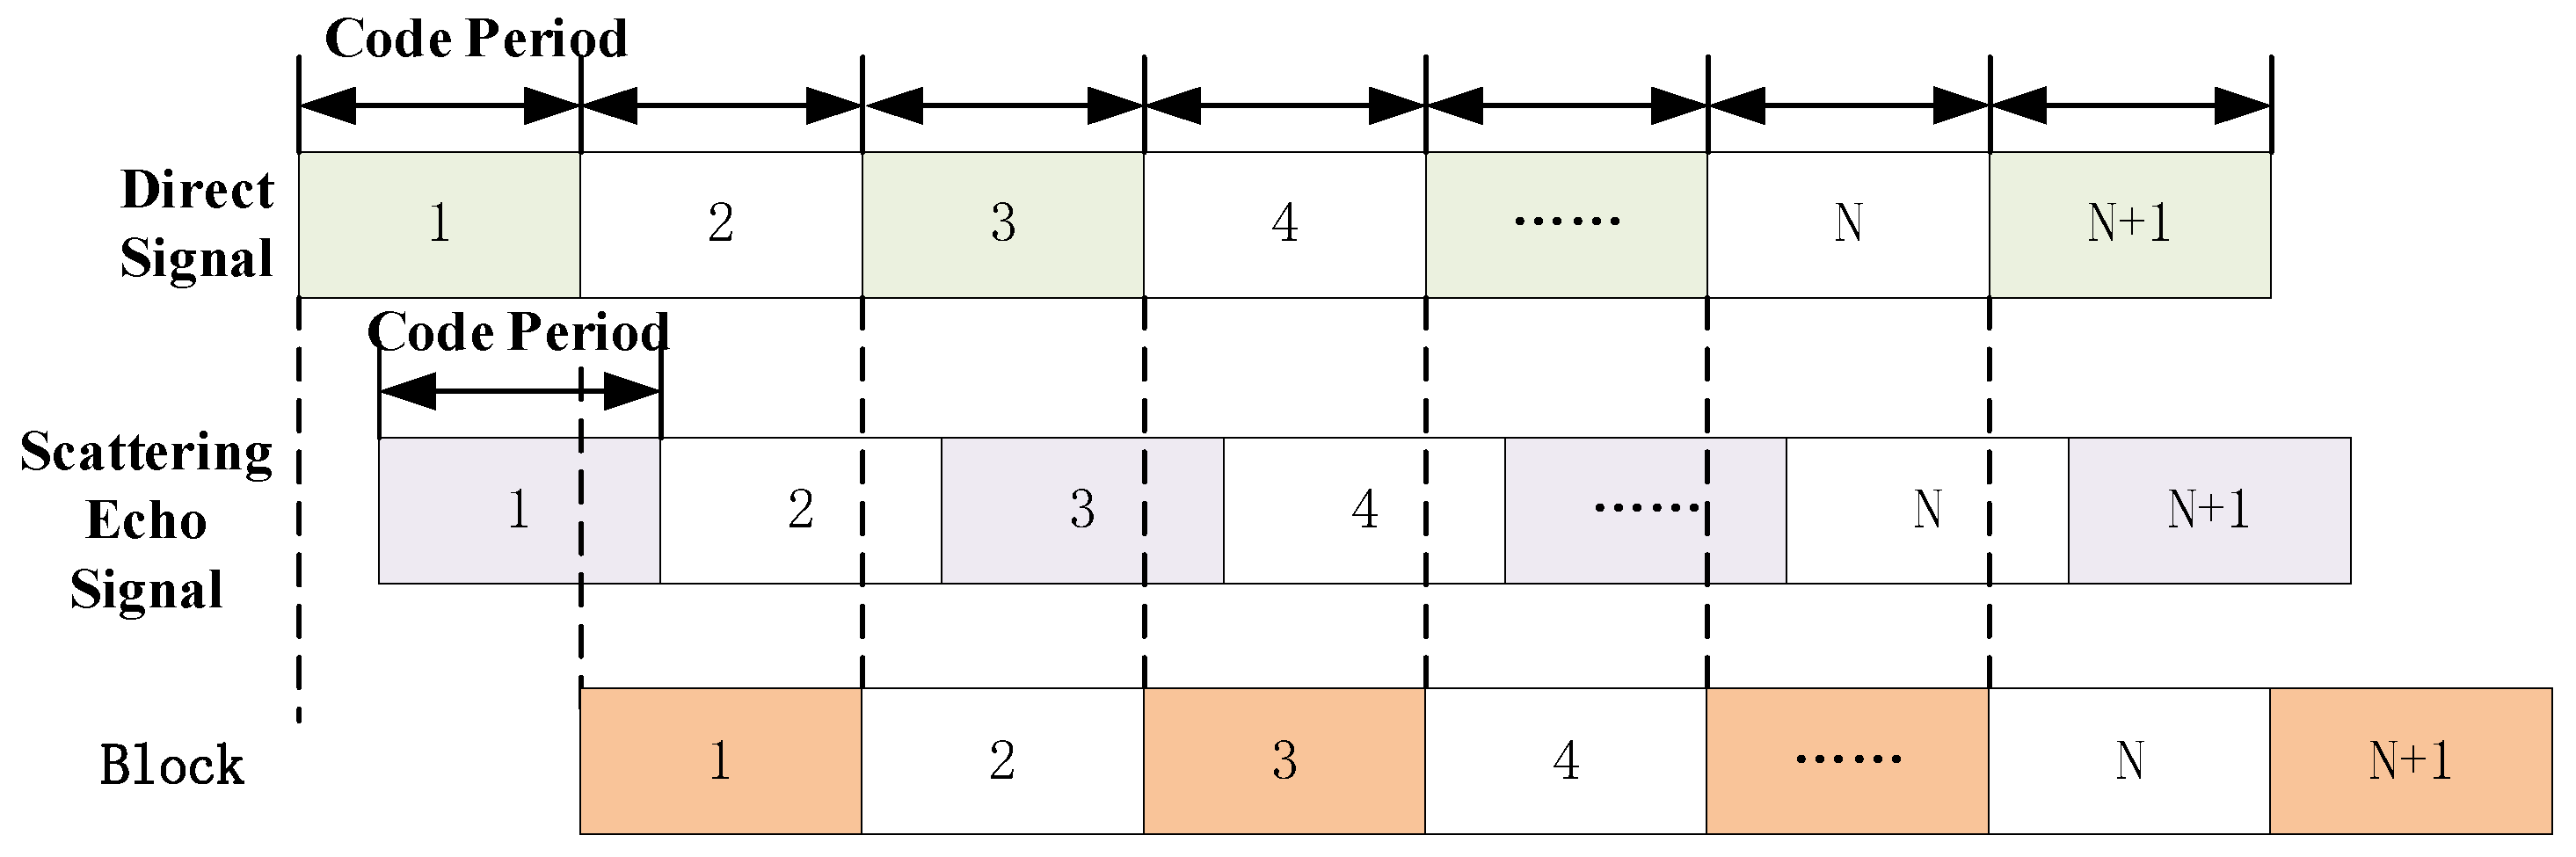
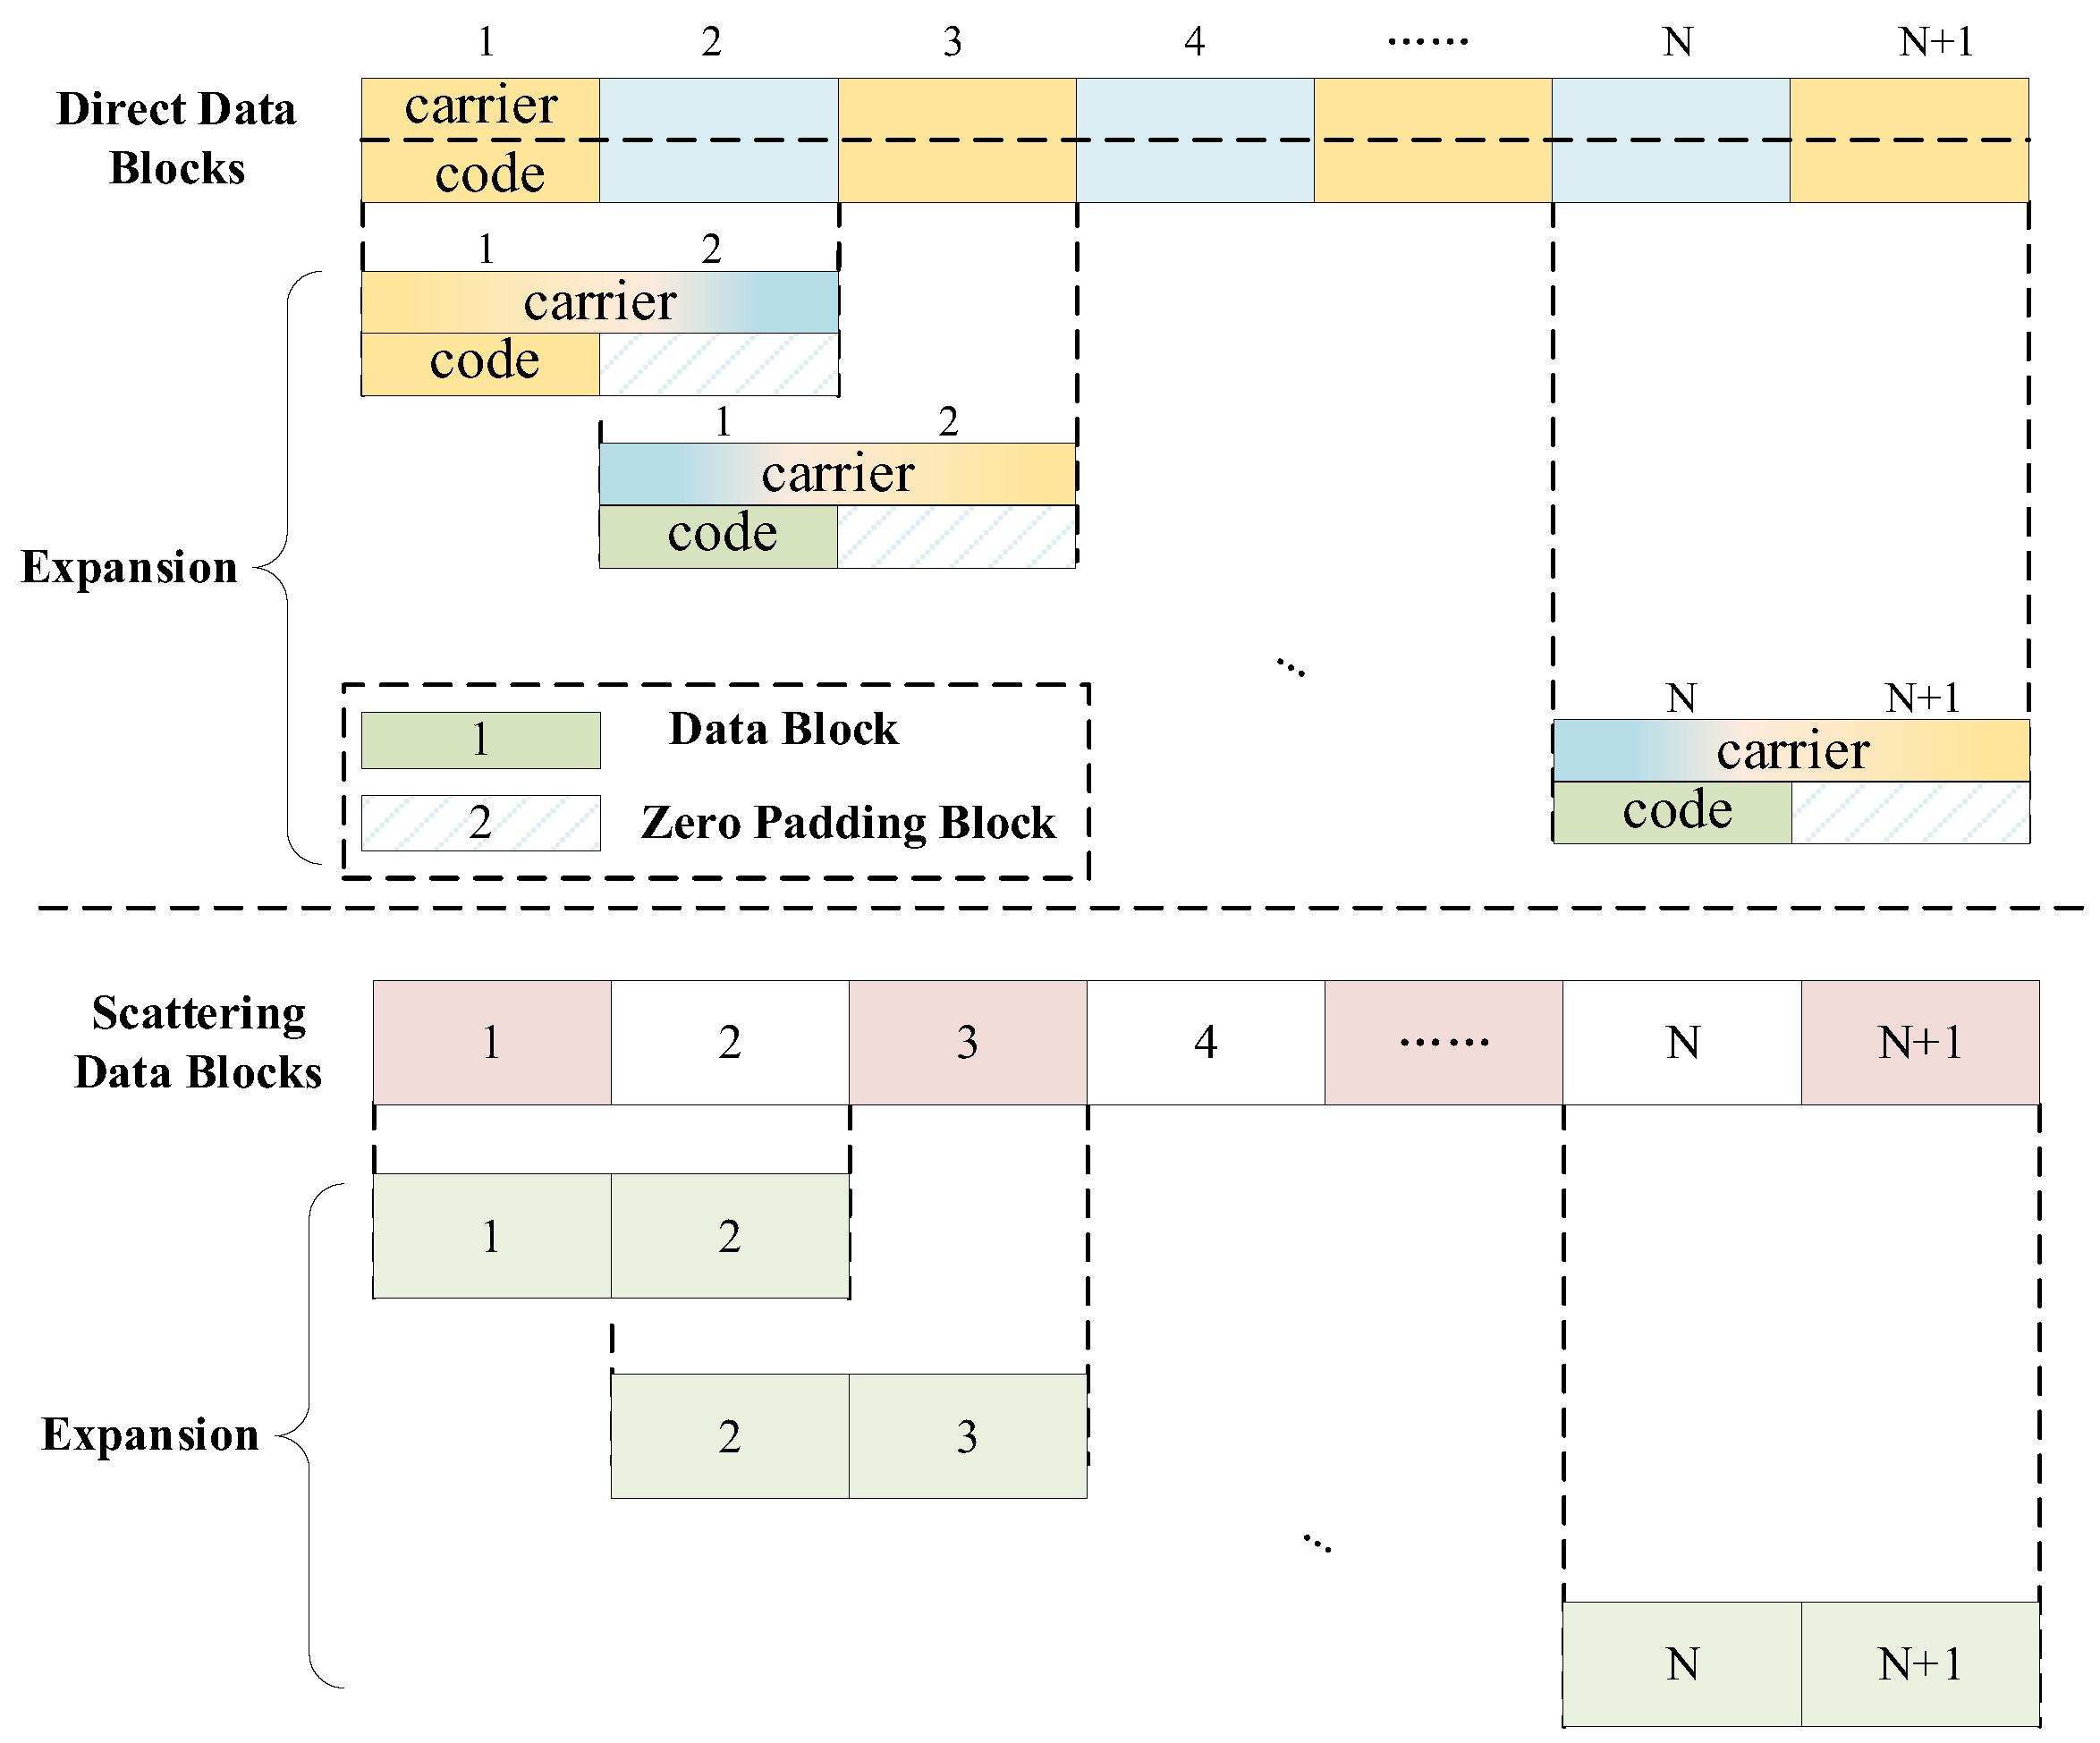
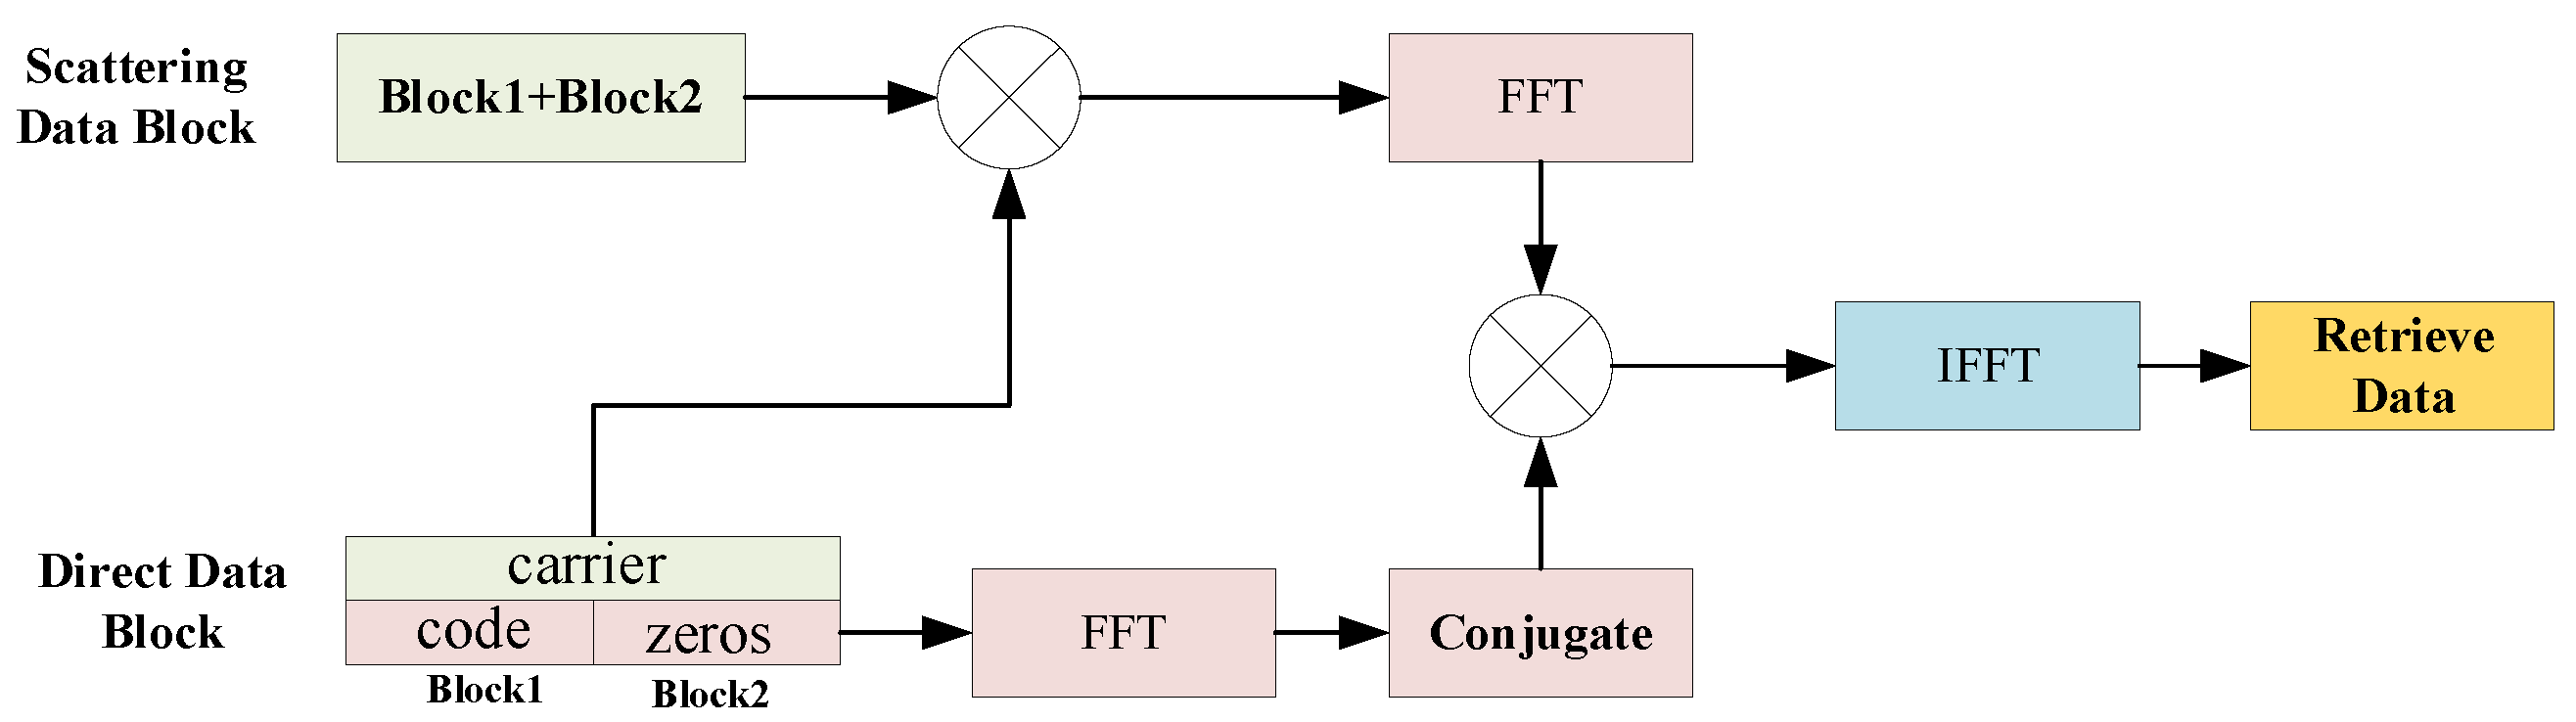
3.1. Block Expended Compression
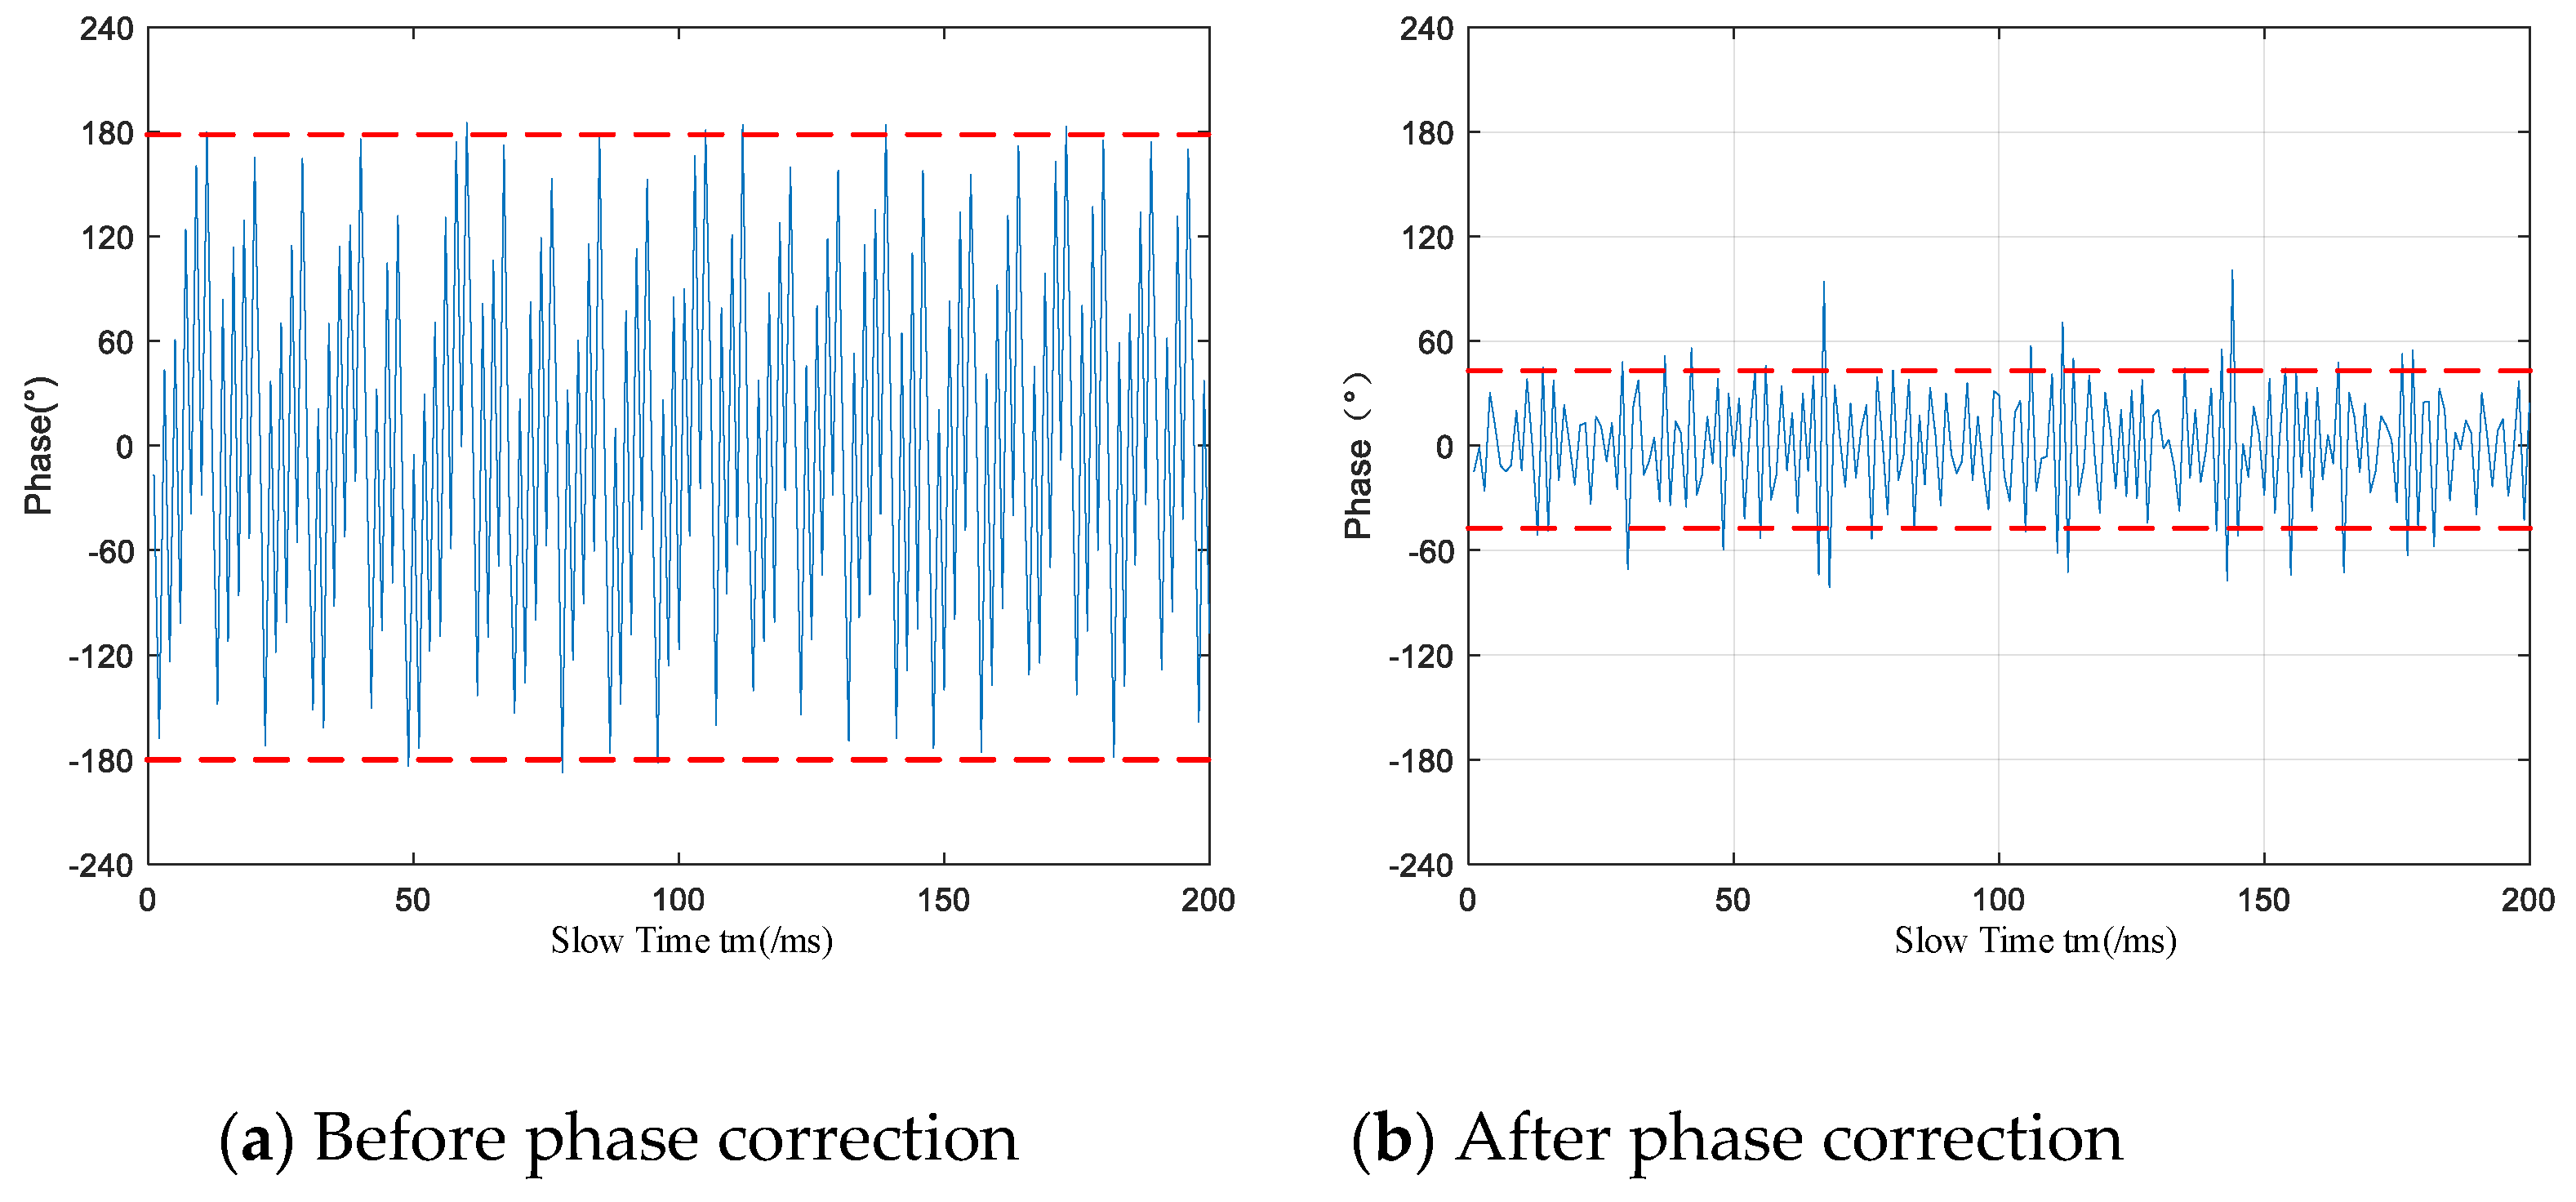
3.2. Phase Differential Alignment
3.3. Amplitude Correction
4. Results
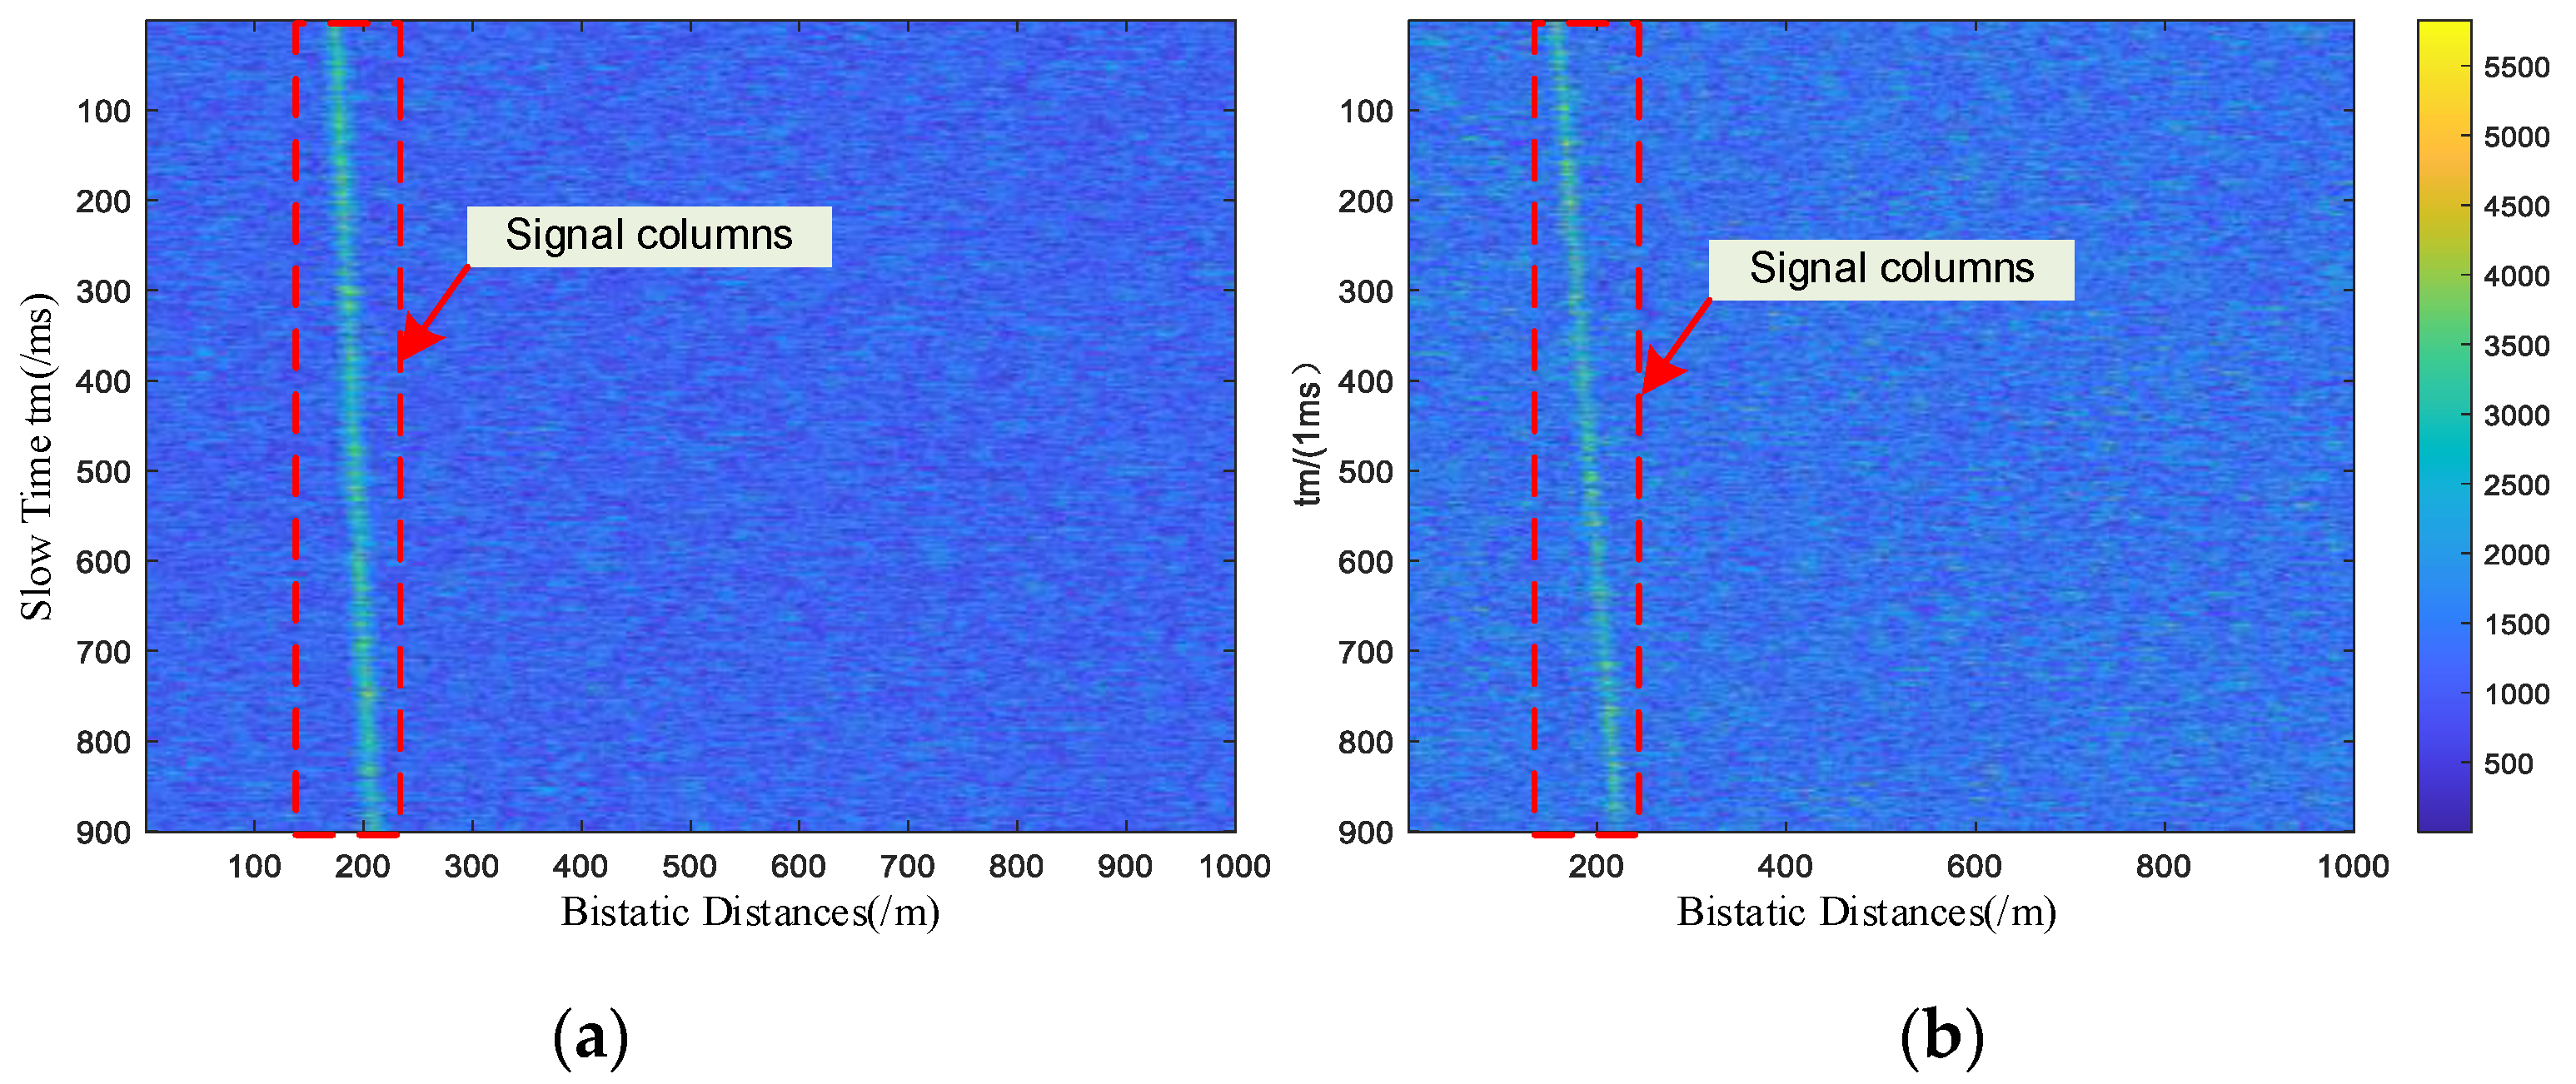
4.1. Simulated Results
4.2. Field Experimentation
5. Discussion
6. Conclusions
Author Contributions
Funding
Data Availability Statement
Conflicts of Interest
References
- Yan, Q.; Huang, W. Sea ice remote sensing using GNSS-R: A review. Remote Sens. 2019, 11, 2565. [Google Scholar] [CrossRef]
- Liu, J.; Shao, L.; Zhang, X. Advances in GNSS-R studies and key technologies. Geomat. Inf. Sci. Wuhan Univ. 2007, 32, 955–960. [Google Scholar]
- Ma, H.; Antoniou, M.; Cherniakov, M.; Pastina, D.; Santi, F.; Pieralice, F.; Bucciarelli, M. Maritime target detection using GNSS-based radar: Experimental proof of concept. In Proceedings of the 2017 IEEE Radar Conference(RadarConf), Seattle, WA, USA, 8–12 May 2017; pp. 0464–0469. [Google Scholar]
- Cherniakov, M.; He, X.; Zeng, T. Signal detectability in SS-BSAR with GNSS non-cooperative transmitter. IEE Proc. -Radar Sonar Navig. 2005, 152, 124–132. [Google Scholar]
- Pastina, D.; Santi, F.; Pieralice, F.; Bucciarelli, M.; Ma, H.; Tzagkas, D.; Antoniou, M.; Cherniakov, M. Maritime moving target long time integration for GNSS-based passive bistatic radar. IEEE Trans. Aerosp. Electron. Syst. 2018, 54, 3060–3083. [Google Scholar] [CrossRef]
- Pastina, D.; Sedehi, M.; Cristallini, D. Passive bistatic ISAR based on geostationary satellites for coastal surveillance. In Proceedings of the 2010 IEEE Radar Conference, Arlington, VA, USA, 10–14 May 2010; pp. 865–870. [Google Scholar]
- He, Z.; Yang, Y.; Chen, W. A hybrid integration method for moving target detection with GNSS-based passive radar. IEEE J. Sel. Top. Appl. Earth Obs. Remote Sens. 2020, 14, 1184–1193. [Google Scholar] [CrossRef]
- Li, Y.; Yan, S.; Gong, J.; Zeng, F. SNR enhancement of back scattering signals for bistatic radar based on beidou GEO satellites. Remote Sens. 2021, 13, 1254. [Google Scholar] [CrossRef]
- Xu, J.; Yu, J.; Peng, Y.-N.; Xia, X.-G. Radon-Fourier transform for radar target detection, I: Generalized Doppler filter bank. IEEE Trans. Aerosp. Electron. Syst. 2011, 47, 1186–1202. [Google Scholar] [CrossRef]
- Chen, X.; Guan, J.; Liu, N.; He, Y. Maneuvering target detection via Radon-fractional Fourier transform-based long-time coherent integration. IEEE Trans. Signal Process. 2014, 62, 939–953. [Google Scholar] [CrossRef]
- Xu, J.; Yan, L.; Zhou, X.; Long, T.; Xia, X.-G.; Wang, Y.-L.; Farina, A. Adaptive Radon–Fourier Transform for Weak Radar Target Detection. IEEE Trans. Aerosp. Electron. Syst. 2018, 54, 1641–1663. [Google Scholar] [CrossRef]
- De Luca, A.; Daniel, L.; Gashinova, M.; Cherniakov, M. Target parameter estimation in moving transmitter moving receiver forward scatter radar. In Proceedings of the International Radar Symposium, Prague, Czech Republic, 28–30 June 2017; IEEE Computer Society: Washington, DC, USA, 2017; pp. 1–7. [Google Scholar]
- Gao, W.; Yue, F.; Tang, D.; Liu, P. Research on GNSS Navigation Method of Lunar Orbiting Spacecraft Based on Ground Enhancement. In Proceedings of the China Satellite Navigation Conference (CSNC 2022) Proceedings, Beijing, China, 25–27 May 2022; Springer: Singapore, 2022; pp. 563–572. [Google Scholar]
- Gao, W.; Yue, F.; Xu, Z. Integrity Monitoring Methods of Beidou Receiver Based on Inertial Assistance. Navig. Position. Timing 2021, 8, 107–113. [Google Scholar]
- Carlson, B.; Evans, E.; Wilson, S. Search radar detection and track with the Hough transform. II. Detection statistics. IEEE Trans. Aerosp. Electron. Syst. 1994, 30, 109–115. [Google Scholar] [CrossRef]
- Cha, C.-C.; Michels, J.; Starczewski, E. An RCS analysis of generic airborne vehicles dependence on frequency and bistatic angle. In Proceedings of the 1988 IEEE National Radar Conference, Ann Arbor, MI, USA, 20–21 April 1988; pp. 214–219. [Google Scholar] [CrossRef]
- Stephan, S.R.; Thuringian, M.A.H. Simulations and Measurements of the Bistatic Radar Cross Section of Vulnerable Road Users between 2 GHz and 6 GHz. In Proceedings of the 2018 IEEE MTT-S International Conference on Microwaves for Intelligent Mobility (ICMIM), Munich, Germany, 15–17 April 2018; pp. 1–4. [Google Scholar] [CrossRef]
- Myint, S.J.; Schneider, C.; Röding, M.; Galdo, G.D.; Thomä, R.S. Statistical Analysis and Modeling of Vehicular Radar Cross Section. In Proceedings of the 2019 13th European Conference on Antennas and Propagation (EuCAP), Krakow, Poland, 31 March–5 April 2019; pp. 1–5. [Google Scholar]
- Abdul Aziz, N.H.; Raja Abdullah, R.S.A.; Abdul Rashid, N.E.; Hashim, F. RCS Predictions through Angle of Ground Moving Target using LTE-Based Passive Forward Scattering Radar. J. Telecommun. Electron. Comput. Eng. (JTEC) 2017, 9, 129–132. [Google Scholar]
- Xie, Z.; Yue, H.; Cao, Y. A RCS prediction method for multipath effect of the ground plane. In Proceedings of the 2017 International Applied Computational Electromagnetics Society Symposium (ACES), Suzhou, China, 1–4 August 2017; pp. 1–4. [Google Scholar]
- China Satellite Navigation Office. BeiDou Navigation Satellite System Signal In Space Interface Control Document Open Service Signal B3I (Version 1.0). Available online: http://en.beidou.gov.cn/SYSTEMS/ICD/ (accessed on 7 February 2023).


| Item | Parameter |
|---|---|
| Gain of direct receiving antenna | 3 dBi |
| Gain of scattering receiving antenna | 15 dBi |
| Working frequency | BDS B3: 1268.52 MHz |
| Beam width of scattering receiving antenna | ±13° |
| Sampling rate | 200 MSPS |
| Storage capacity | 1 TB |
| power | 200 W |
| Item | Parameter |
|---|---|
| Signal type | BDS B3 |
| Carrier frequency | 1268.52 MHz |
| Code frequency | 10.23 MHz |
| PRN code period | 1 ms |
| SNR | −30 dB |
| Target motion speed | 0~100 m/s |
| Target motion acceleration | 0~15 m/s2 |
| Satellite Number | Elevation /° | Azimuth/° |
|---|---|---|
| 1 | 35 | 140 |
| 3 | 44 | 189 |
| 6 | 62 | 234 |
| 8 | 69 | 166 |
| 13 | 80 | 222 |
| 38 | 49 | 169 |
| 59 | 39 | 146 |
| 60 | 32 | 232 |
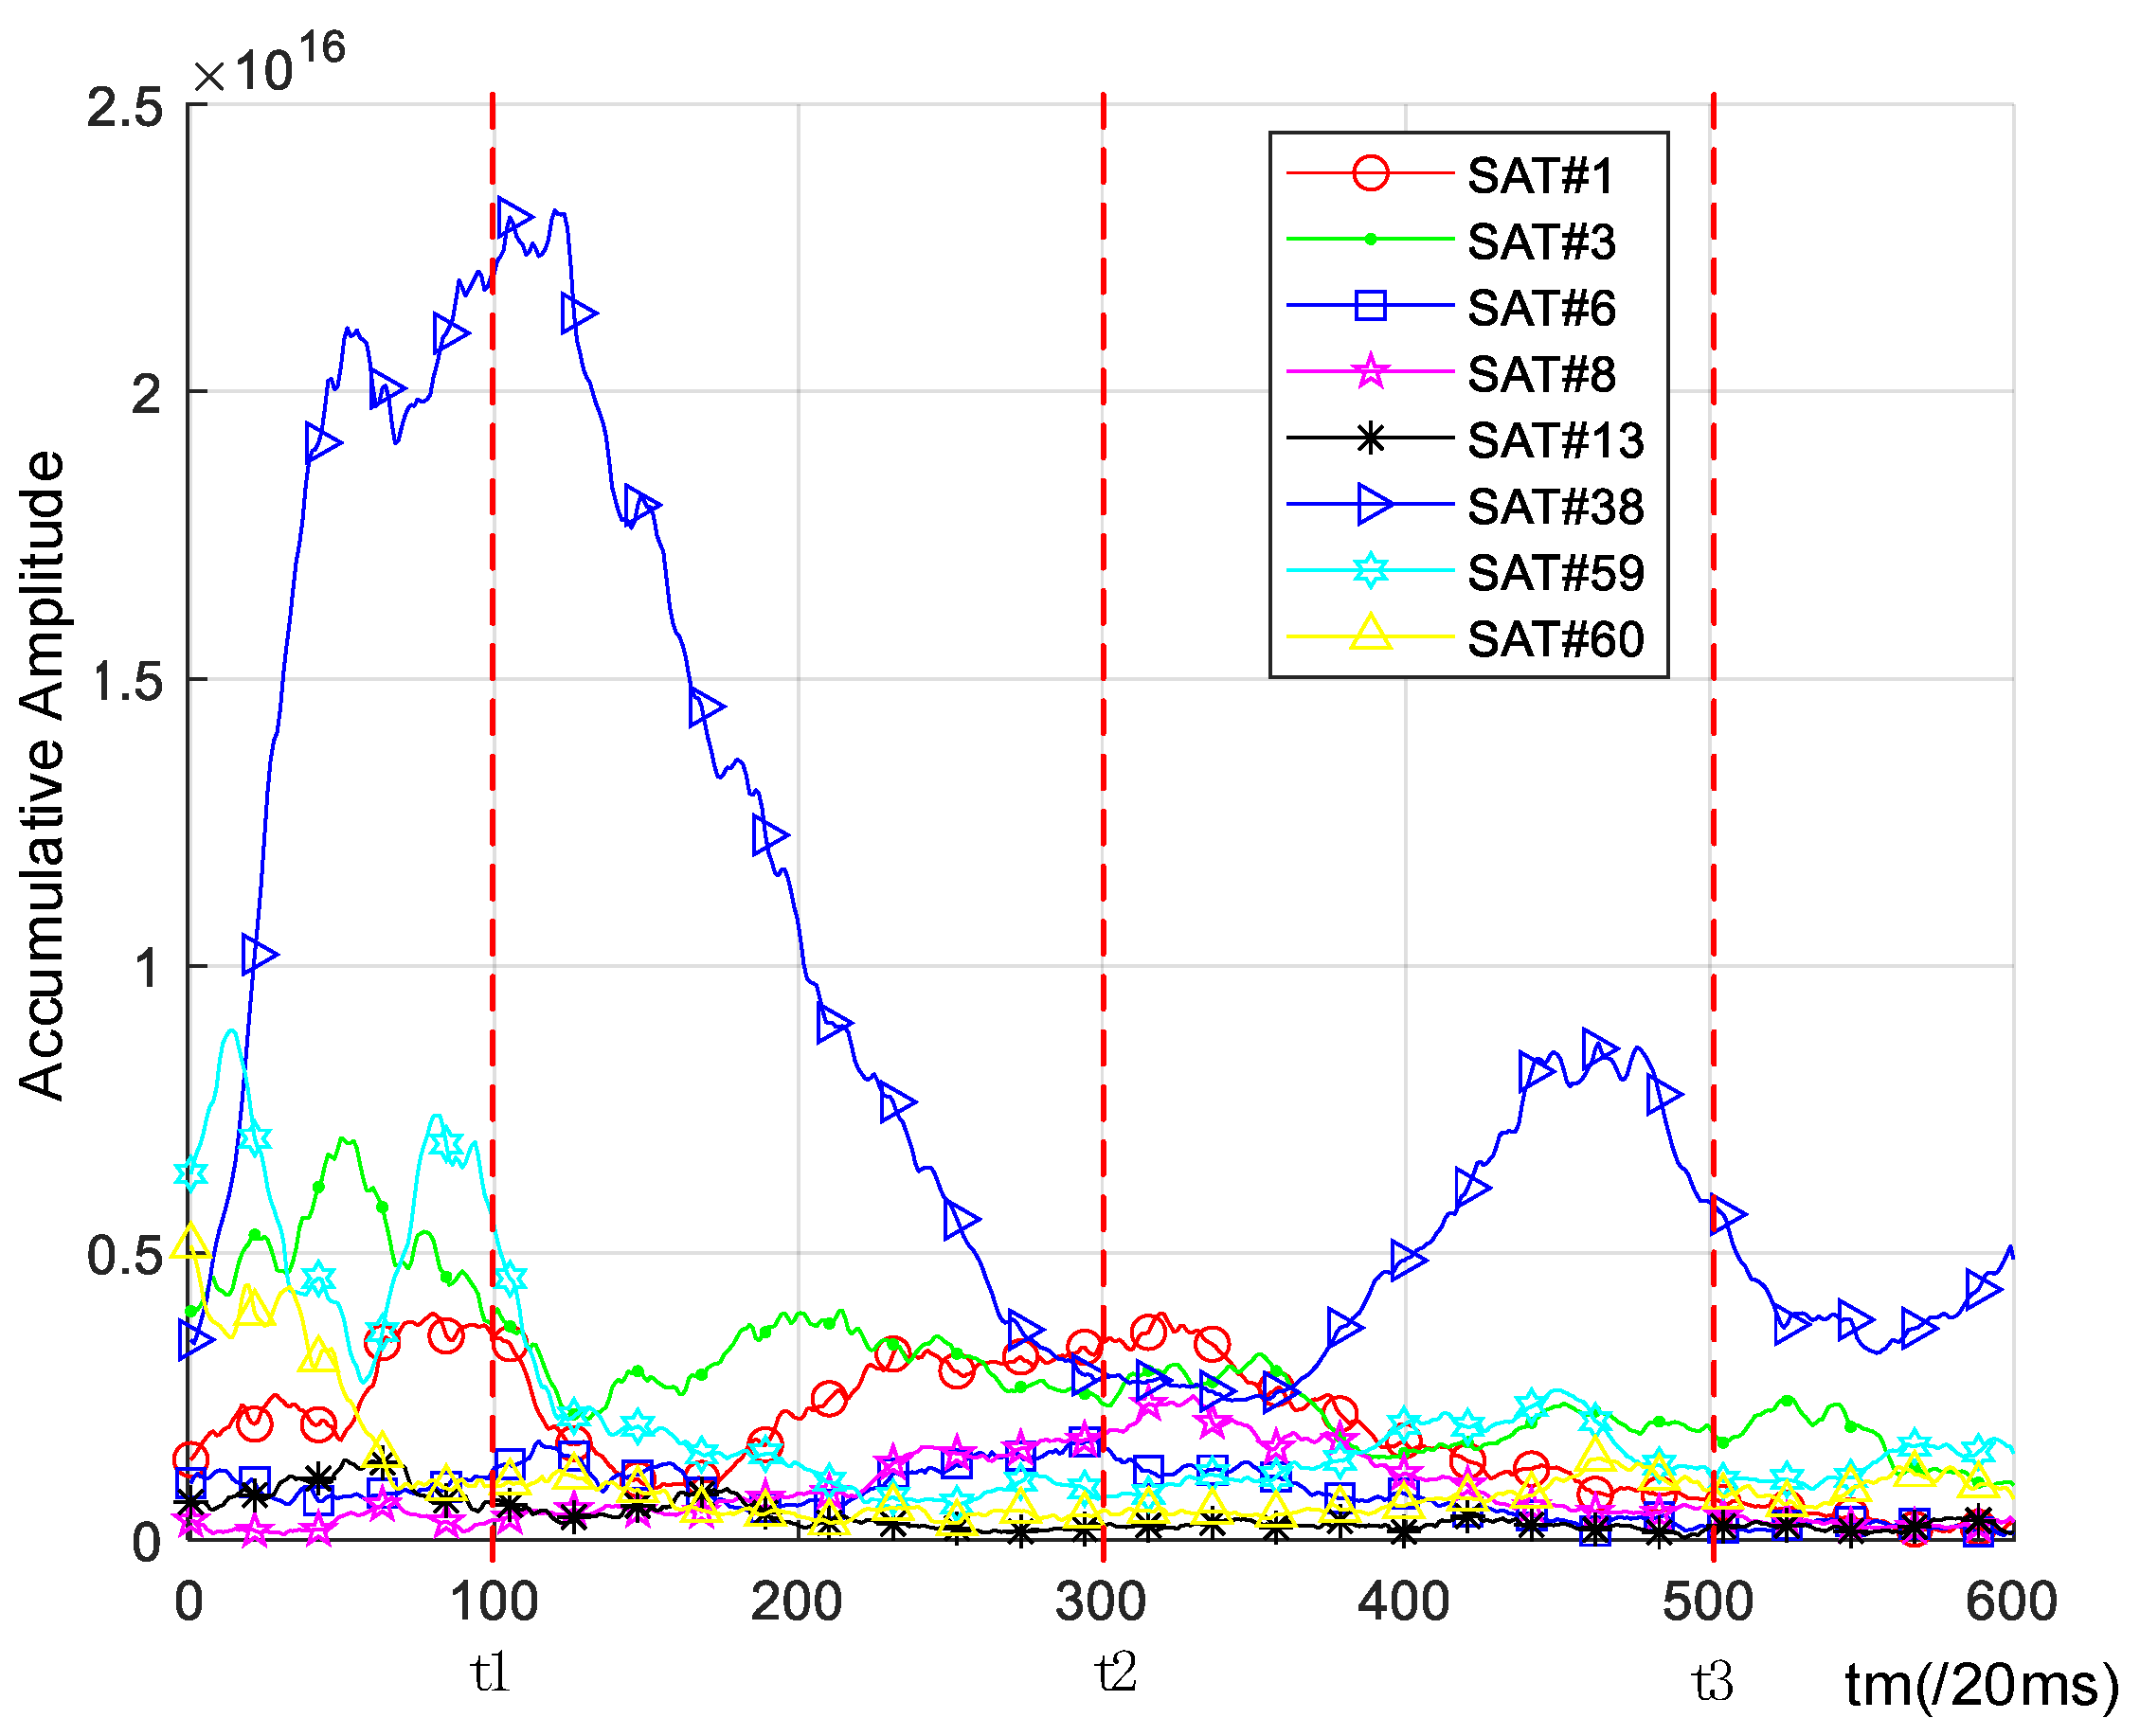
| Satellite Number | Time Proportion of Detected Echo | SNR |
|---|---|---|
| 1 | 58% | 13.4 |
| 3 | 67% | 14.1 |
| 6 | 47% | 11.6 |
| 8 | 32% | 11.9 |
| 13 | 37% | 8.7 |
| 38 | 55% | 18.2 |
| 59 | 35% | 15.6 |
| 60 | 34% | 14.4 |
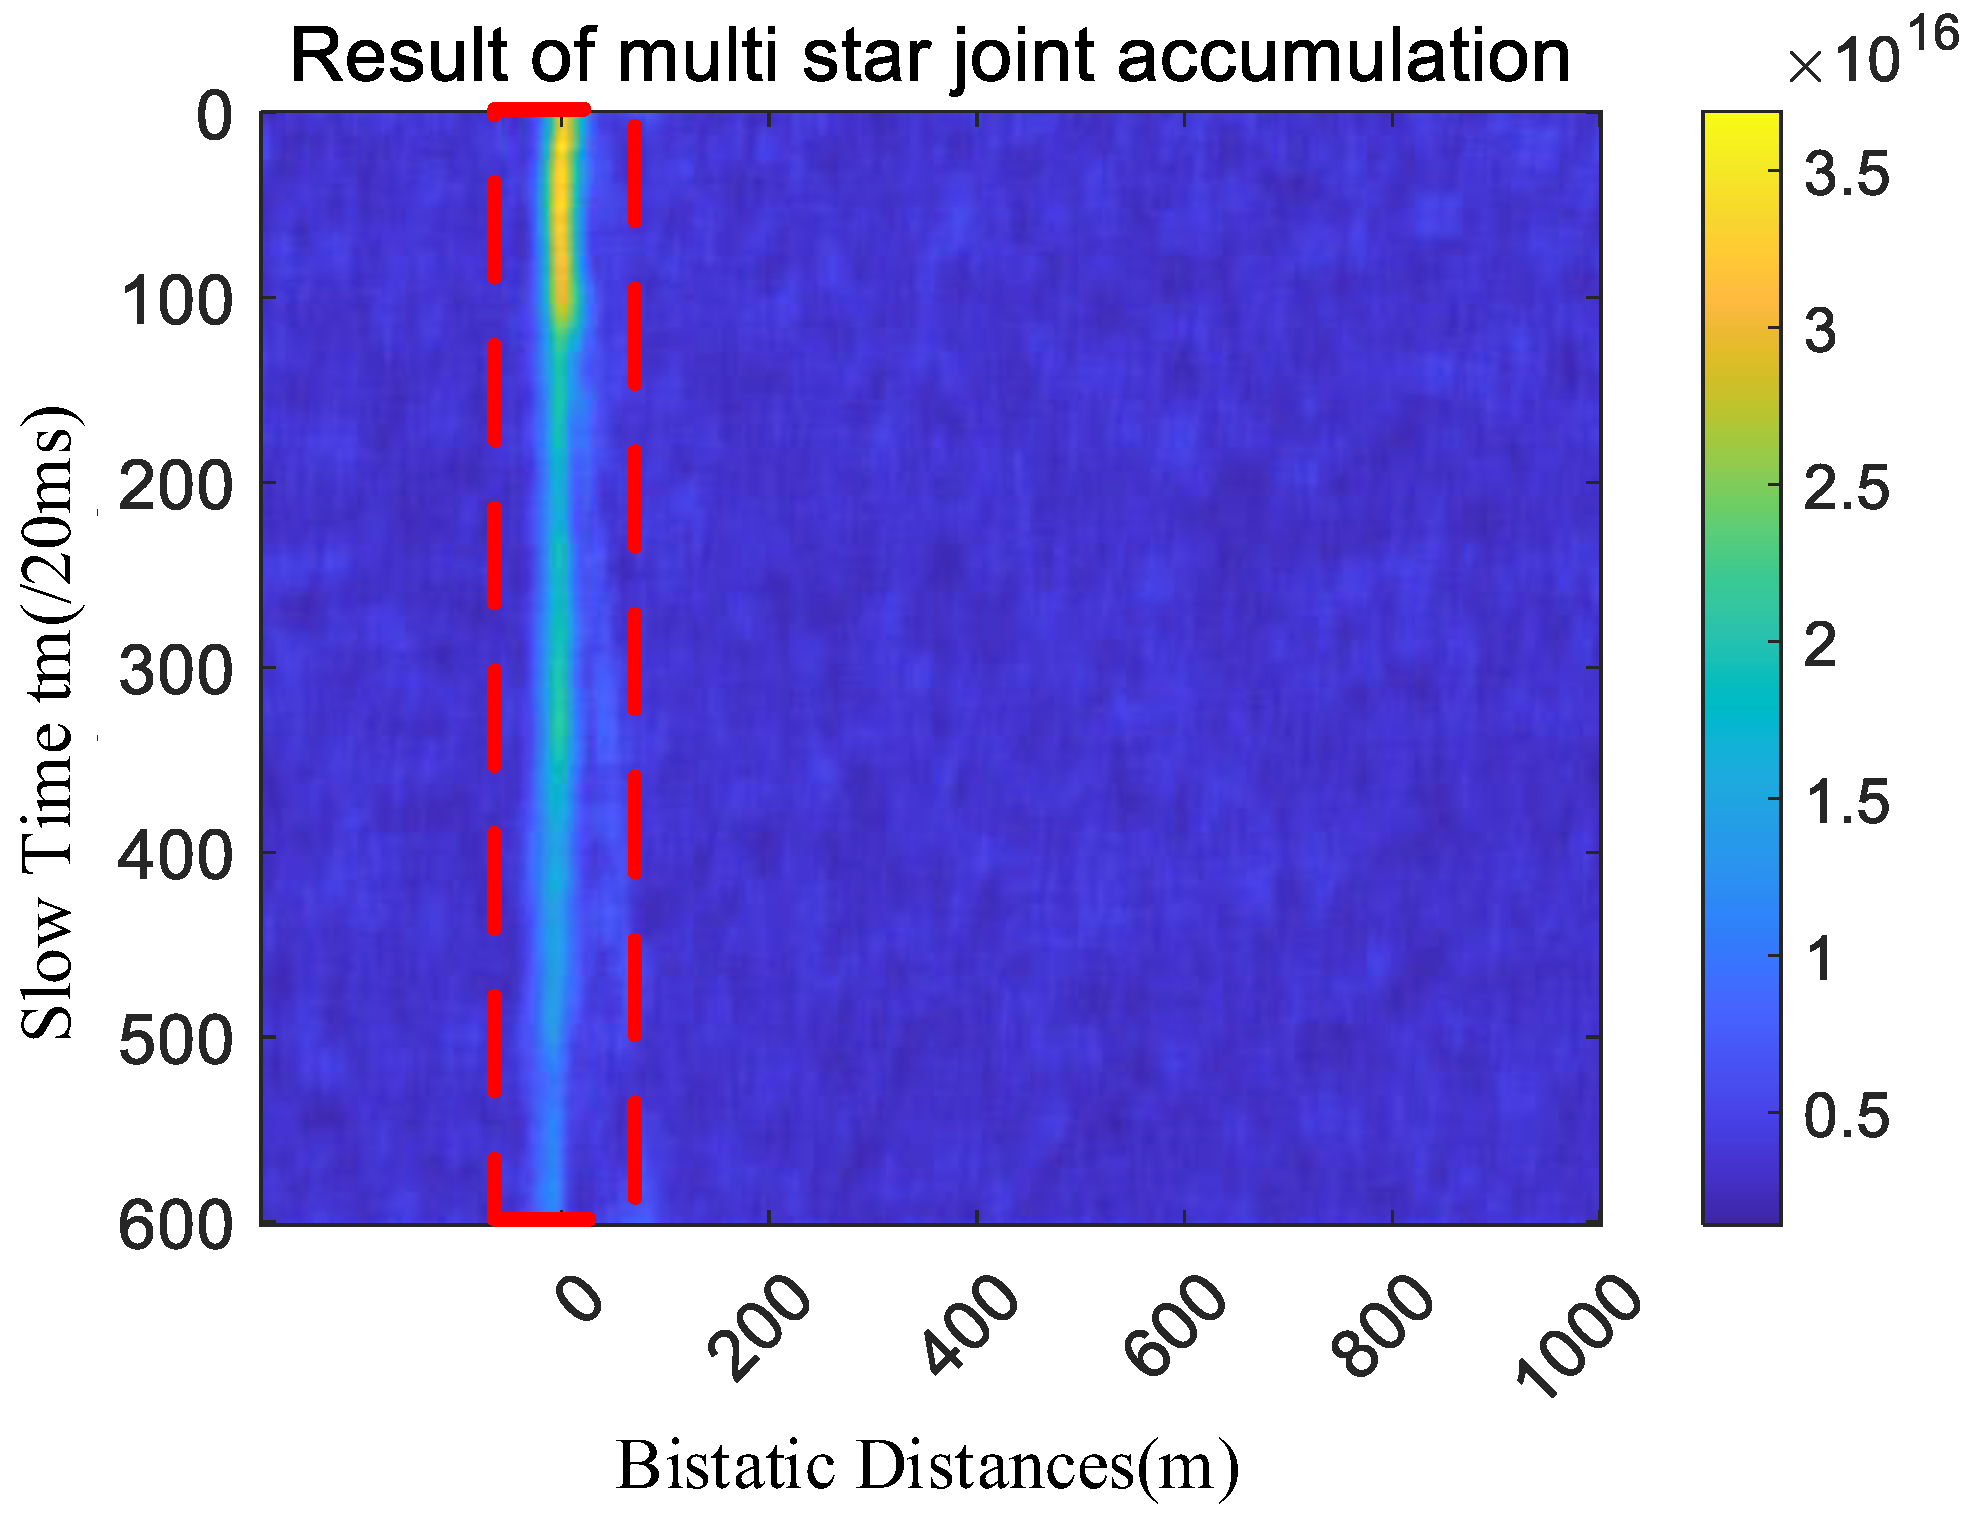
| Joint result of 8 satellites | 100% | 19.5 |
Disclaimer/Publisher’s Note: The statements, opinions and data contained in all publications are solely those of the individual author(s) and contributor(s) and not of MDPI and/or the editor(s). MDPI and/or the editor(s) disclaim responsibility for any injury to people or property resulting from any ideas, methods, instructions or products referred to in the content. |
© 2023 by the authors. Licensee MDPI, Basel, Switzerland. This article is an open access article distributed under the terms and conditions of the Creative Commons Attribution (CC BY) license (https://creativecommons.org/licenses/by/4.0/).
Share and Cite
Gao, W.; Yue, F.; Xia, Z.; Liu, X.; Zhang, C.; Liu, Z.; Jin, S.; Zhang, Y.; Zhao, Z.; Zhang, T.; et al. Weak Signal Processing Method for Moving Target of GNSS-S Radar Based on Amplitude and Phase Self-Correction. Remote Sens. 2023, 15, 969. https://doi.org/10.3390/rs15040969
Gao W, Yue F, Xia Z, Liu X, Zhang C, Liu Z, Jin S, Zhang Y, Zhao Z, Zhang T, et al. Weak Signal Processing Method for Moving Target of GNSS-S Radar Based on Amplitude and Phase Self-Correction. Remote Sensing. 2023; 15(4):969. https://doi.org/10.3390/rs15040969
Chicago/Turabian StyleGao, Wenning, Fuzhan Yue, Zhenghuan Xia, Xin Liu, Chuang Zhang, Zongqiang Liu, Shichao Jin, Yao Zhang, Zhilong Zhao, Tao Zhang, and et al. 2023. "Weak Signal Processing Method for Moving Target of GNSS-S Radar Based on Amplitude and Phase Self-Correction" Remote Sensing 15, no. 4: 969. https://doi.org/10.3390/rs15040969