


Hazard Potential in Southern Pakistan: A Study on the Subsidence and Neotectonics of Karachi and Surrounding Areas

1
Department of Earth and Atmospheric Sciences, University of Houston, Houston, TX 77204, USA
2
California Institute of Technology, Pasadena, CA 91125, USA
3
Jet Propulsion Laboratory, Pasadena, CA 91109, USA
*
Author to whom correspondence should be addressed.
Remote Sens. 2023, 15(5), 1290; https://doi.org/10.3390/rs15051290
Submission received: 19 January 2023
/
Revised: 23 February 2023
/
Accepted: 24 February 2023
/
Published: 26 February 2023
(This article belongs to the Special Issue Remote Sensing and GIS-Based Innovative Techniques for Confronting Land Subsidence and Landslides)
Abstract
:Coastal communities in deltaic regions worldwide are subject to subsidence through a combination of natural and anthropogenic processes. The city of Karachi in southern Pakistan is situated along the diffuse western boundary of the tectonically active Indian Plate, making it more susceptible to natural subsidence processes from plate motion-related deformational events such as earthquakes and faulting. Karachi has a dense population of over 16 million people, and determining the rate of subsidence and extent of neotectonic activity is crucial for mitigating seismic hazards. Excessive abstraction of groundwater and extensive groundwater use in irrigation are some of the anthropogenic contributions to subsidence in the area. A combination of the lack of historical data and few previous studies of the area make it difficult to determine the rate and extent of deformation in this region. We present an analysis of subsidence and neotectonic activity in Karachi and its surrounding areas using Interferometric Synthetic Aperture Radar (InSAR) timeseries techniques. The InSAR results for satellite LOS velocity change in both ascending and descending Sentinel-1 tracks indicate subsidence in key residential and industrial areas. Further decomposition into two dimensions (east–west and vertical) quantifies subsidence in these areas up to 1.7 cm per year. Furthermore, InSAR data suggest the presence of an active north–east dipping listric normal fault in North Karachi that is confirmed in the shallow subsurface by a 2D seismic line. Subsidence is known to cause the reactivation of faults, which increases the risk of damage to infrastructure.
1. Introduction
Coastal communities in deltaic regions worldwide are subject to subsidence through a combination of natural and anthropogenic processes [1,2,3,4]. Natural processes include the dewatering/compaction of sediments [2,5,6], faulting, and load-induced crustal downwarping [2]. These processes cause slow and steady deformation over time due to their interaction with other natural processes that offset the subsidence rate, such as sedimentation and the production of new soils from organic decay [2]. Conversely, anthropogenic processes that cause subsidence, such as the extraction of groundwater leading to the compaction of aquifers and induced fault motion through mining or fluid extraction, tend to cause relatively faster and temporally variant rates of subsidence [2,3,7].
A significant anthropogenic cause of subsidence is excessive groundwater abstraction. Fluid extraction rates outpacing recharge leads to compaction within the aquifer [3,8,9,10]. Combining these natural and anthropogenic processes significantly increases the risk of subsidence in densely populated coastal areas.
The city of Karachi in southeast Pakistan is one such coastal city in a deltaic environment. Situated along the diffuse western boundary of the tectonically active Indian Plate, it is more susceptible to natural subsidence processes from plate motion-related deformational events such as earthquakes and faulting. West of the city, the triple junction between the Indian, Eurasian, and Arabian plates lies just off the coast of Pakistan. This kind of deltaic setting near a tectonically active junction is also found at the San Francisco Bay area and Los Angeles, California, where the seismic hazard is characterized as high [3,11]. As such, it can be argued that the lack of existing data and research conducted in Karachi leaves this area in an extremely vulnerable position and susceptible to accelerating subsidence rates.
Due to the lack of regulatory legislation in place for the pumping of groundwater, extensive groundwater use in irrigation, and the Indus Basin being one of the most stressed aquifers in the world [12], water shortages are becoming increasingly frequent in Karachi. With all these factors in consideration, it would be safe to assume that the city of Karachi is on track to follow the same subsidence trends as the Houston–Galveston area before the establishment of the Groundwater Management and Subsidence Districts [8,13,14]. Understanding spatial and temporal variations in deformation may be the key for assessment of the current and potential future hazards related to subsidence and tectonics.
The mobile fold and thrust belt that underlies the city and extends out towards Hyderabad, termed the ‘Karachi Arc’ [15], is considered to be currently active and is suggested to have been for a long time. The earliest documented major earthquake (8 or greater on the Modified Mercalli Scale) occurred in 893 AD and is believed to be responsible for the destruction of the port city of Debal, which was located near modern-day Karachi [11,15,16]. Although there have been reports of shaking from earthquakes in the city over the past few decades, the city has never experienced severe damage due to an earthquake. Despite the evidence of recurrent low to moderate grade seismic activity [15], the time scale required to classify the seismic cycle of major earthquakes varies from 80 to 1000 years depending on the specific area within the region [11,16]. The question posed by past research [11], whether Karachi happens to be in an aseismic zone or whether it is simply a lack of information on the city’s history that would suggest so, remains unanswered, but there is evidence of nearby towns destroyed by earthquakes in the past [11,17]. Considering the given evidence and the lack of research conducted in the area, it is imperative that an innovative approach to risk assessment be adopted for the region.
We present an analysis of the subsidence and neotectonic activity of Karachi and its surrounding areas (Figure 1) using Interferometric Synthetic Aperture Radar (InSAR) timeseries analysis techniques. We estimate the rate of subsidence to be about 1.7 cm per year in key areas of Karachi such as Defense, Korangi, and North Karachi. For the first time, we present evidence of an active fault in the city using a new full resolution InSAR approach along with inverse fault modeling.
2. Geological Background
The city of Karachi is located at the southern end of the Kirthar Mountain Range—a fold and thrust belt that formed as a result of the Late Cretaceous collision between the Indian and Eurasian plates [18,19,20]. This range marks the diffuse western boundary of the Indian plate and has predominantly undergone transpressional deformation since its initial collision with the Afghan block of the Eurasian plate [18,21,22] (Figure 1). The city itself is built on what is known as the Karachi Arc, a large fold and thrust belt which shows thin-skinned deformation and eastward movement [15,18,23,24], with the detachment surface being located in the Goru shale sequences, about 2–4 km below sea level [15,18,23]. Northeast of the city, the Karachi arc is characterized by asymmetric, doubly plunging anticline–syncline pairs trending north–south in parallel to en echelon arrangement [18] (Figure 2). Historical seismicity data suggests that the Karachi Arc is still active [15,16]. The eastward creep may be due to active subsidence in the underlying Hyderabad graben [15,25].
3. Methods
We use the Interferometric synthetic aperture radar Scientific Computing Environment (ISCE) developed by NASA’s JPL to process 276 descending track and 134 ascending track Sentinel-1 Single Look Complex (SLC) images available from 2015 to 2020 with a 1 arc-second SRTM digital elevation model into a stack of coregistered SLCs. This is accomplished by using the Sentinel-1 Tops Stack Processor [26]. The stack of coregistered SLCs is then used as the input for the Miami Phase Linking in Python (MiaplPy) software to perform full resolution InSAR processing using non-linear phase inversion [27,28]. The resulting files are then imported and processed using MintPy [29] for phase unwrapping error corrections and timeseries analysis. A simplified diagram of the InSAR workflow can be seen in (Figure 3).
3.1. ISCE
We developed the stack using the 10 nearest neighbor connections for each acquisition and used the Network-based Enhanced Spectral Diversity (NESD) approach to perform coregistration [26].
3.2. Miaplpy
The SLC and geometry files output by ISCE are loaded into MiaplPy at full resolution. The SLC stack is then subdivided into patches (200 × 200 pixels) and processed in parallel using a Beowulf cluster with 16 workers. The patches are organized into mini-stacks of 10 images each for phase linking. A full network non-linear phase linking is performed by the sequential Eigenvalue decomposition-based Maximum Likelihood of Interferometric phase (EMI) method to estimate the wrapped phase timeseries [30,31] using the following equation [27,31]:
where is the estimated complex coherence matrix and represents the Hadamard product. The desired solution for this equation is the eigenvector that corresponds to the minimum eigenvalue [27].
After the patches are concatenated, interferograms are generated using a single reference and unwrapped using the Statistical Cost, Network Flow Algorithm for Phase Unwrapping (SNAPHU) [32]. The unwrapped interferograms are loaded into MintPy to correct for phase unwrapping errors before the network of interferograms is inverted into a timeseries of deformation. We use MiaplPy to perform least square inversion of the unwrapped interferogram network and convert the estimated unwrapped timeseries to a range-change timeseries. We then perform timeseries error corrections and geocode the final results in MintPy.
3.3. Mintpy
Once the stack is loaded into MintPy, a reference pixel is chosen in the far field of deformation with high temporal coherence (≥0.85). Temporal coherence is calculated to assess the quality of each pixel in the raw phase timeseries [29] using the initial phase value and the estimated phase value in the following equation [27,33]:
where is the number of SAR images in the stack, represents individual images, and is a wrapped phase interferogram generated using images acquired at time and . Temporal coherence is used as a reliability measure or statistical “goodness of fit” [27,33].
Unwrapping errors are then determined and corrected using the bridging method [29]. After network inversion in MiaplPy, we apply a temporal coherence threshold of 0.7 to mask out anomalous pixels. A quadratic phase ramp is estimated and removed from the reliable pixels in the data in order to correct for residual tropospheric and ionospheric delays [29]. This step is followed by correction of the topographic phase residual [29]. To improve the quality of the data, the estimated residual phase is used to determine noise in the timeseries. The root mean square error is calculated on the residual phase and used to identify and remove noisy acquisitions through the following equation from [29]:
where = [1, …, ], represents the reliable pixels chosen from temporal coherence masking, represents the residual phase at time , and represents the radar wavelength. The median absolute deviation is calculated and SAR acquisitions with an RMS higher than three median absolute deviations are considered noisy and excluded from further processing. Finally, the average velocity is estimated from the timeseries to determine the rate of deformation using the following equation [29]:
where is the velocity, represents the time at the acquisition, is an unknown offset constant, and is the displacement timeseries. The ascending and descending track velocities are resampled and subset to the same spatial resolution and coverage. The resampled datasets are then used as inputs for decomposition in two dimensions (horizontal and vertical) using Mintpy. The LOS velocity can be decomposed into three individual directional components of displacement. These are north–south (), east–west (), and vertical () [34,35]:
where is the line-of-sight displacement velocity, is the azimuth angle of the satellite heading, is the radar incidence angle at the ground surface, and is measurement error due to imprecise satellite orbit geometry, tropospheric delay, topographic phase contribution, etc. This equation can be applied to both ascending track () and descending track () results to form an equation with three unknowns for each track:
Assuming negligible contributions from both the measurement error and north–south displacement component , Equations (6) and (7) can be used to determine the displacements in the horizontal (east–west) and vertical directions using Equations (8) and (9), respectively [36]:
4. Results
The deformation time series and LOS velocity change in both ascending and descending tracks (Figure 4) indicate movement away from the satellite in the following key areas: Defence Housing Authority (DHA), Korangi, Landhi, Leely Town, and North Karachi.
There are apparent uplift regions due to the selection of a reference point with high temporal coherence in the far field of deformation. While it is possible to select a reference point in the areas that appear to be uplifting, these areas were determined to have a slightly lower temporal coherence, and they are in proximity to actively deforming regions. As such, the current reference point (denoted on the figure with a black star) was selected for reliability and stability.
The LOS velocities indicate a similar trend for these focus areas. North Karachi has a displacement rate of between −0.7 to −0.8 cm/yr and displays a sharp transition boundary between no displacement and movement away from the satellite. While there is no apparent pattern for DHA, the areas of Korangi, Landhi, and Leely Town all show a bullseye pattern of no displacement at the edges and increasing displacement inward with maximum displacement at the center of between −0.7 to −1.8 cm/yr. Further decomposition into two dimensions (east–west and vertical) quantifies the vertical component of displacement in these areas to about 1.7 cm downward per year (Figure 5).
Timeseries of individual pixels representing the average displacement in each of the key areas (Figure 6) show consistent displacement from 2015 to 2020.
5. Discussion
5.1. Natural Causes
Proximity to the Indus Delta renders Karachi susceptible to the effects of deltaic subsidence. The eastern Indus delta is influenced by footwall subsidence associated with thrust faulting in the Kachchh mainland, as well as recurrent tectonic activity in the Rann of Kachchh [37,38].
Subsidence in the north may be influenced by neotectonic activity. The line of sight velocity results (Figure 4) and the vertical displacement results (Figure 5) display a sharp boundary between downward motion and no displacement. This boundary is aligned with the inferred trace of the Allah Bund fault, which is estimated to have a 50–70°N dip with listric normal fault geometry [39]. The inferred fault trace is traced using the geological map of Sindh published by the Geological Survey of Pakistan. Although the displacement boundary is clear in the northwestern portion of the fault, it diminishes to the southeast. This may be due to a change in the fault dip or the fault terminating in the area. It is more likely that the signal is obscured by proximity to the river and the strong subsidence signals in the southeast compared to the relatively stable northwest. Recent earthquakes clustered in the hanging wall block suggest strain along the fault may be contributing to recurrent low- to moderate-grade seismic activity. Although there is a strong indication of neotectonic activity in the area, the fault parameters are poorly constrained. The geological map of Sindh published by the Geological Survey of Pakistan extends the inferred trace of the Allah Bund fault through this area. However, this is not the case for the published geological maps of the Karachi area. There is also conflicting information in the literature. According to Sarwar (2004), the Allah Bund fault is further south and characterized as a south-dipping thrust fault that terminates within the Rann of Kutchh. There is also an unknown dextral strike-slip fault with east–west orientation indicated that may coincide with this neotectonic activity (see [25], Figure 1). According to the structural analysis of the Mangho Pir anticline in Niamatullah and Imran (2012), the fault may be an extension of, or splay off, the Pir Mangho fault (see [40], Figures 6 and 11). Sarwar and Alizai (2013) further expand on the unknown fault in Sarwar (2004), and suggest it is a wrench fault that extends through the city and terminates at the western coast (see [15], Figure 6). The existence of conflicting information makes it difficult to constrain the fault parameters. However, the abundance of references suggests that it is highly likely there is some neotectonic activity occurring in the area. Considering the downward displacement north of the transition boundary and the curviplanar geometry of the inferred fault trace, our results align most with Roger Bilham’s interpretation of a north-dipping listric normal fault. Transections of the LOS velocity change results across this transition boundary from both tracks display clear evidence supporting the presence of a normal fault. In each plot, there is a clear change to a downward trend at the 2–2.5 km mark which correlates to the location of the transition boundary (Figure 7).
Analysis of a perpendicular seismic line from the Union Texas 1999 2D seismic reflection survey of Karachi shows clear displacement between reflectors and onlapping bedding planes consistent with listric normal fault geometry (Figure 8). We use the Geodetic Baysian Inversion Software (GBIS) [41] to model the fault parameters using InSAR LOS velocity data from both tracks. Optimal fault model parameters determined a strike of 278° and a slip at depth of about 9.9 cm over 1,000,000 trials. The model results can be seen in Table 1.
Fluvial processes may be contributing to subsidence in the central and southern regions of Karachi. In the case of the Korangi and Defence areas, these processes can be attributed to interaction with the Malir River. Subsurface compaction may be enhanced in these areas due to the dewatering of sediments and fluvial erosion. The Defence area is not only subject to similar effects at the outlet of the Malir River but is also exposed to high energy wave action [42].
Timeseries plots of individual pixels representative of average displacement in each of the key areas display a relatively consistent rate of subsidence from 2015 to 2020 (Figure 5). The highest variations are found during the monsoon season between the months of June and September each year. Historically, this is the time of year when Karachi experiences severe flooding. There have been varying degrees of flood severity between 2017 and 2019, but the city experienced its worst floods in August 2020 since precipitation data collection began in 1931 [43].
5.2. Anthropogenic Causes
The construction of dams and barrages upstream has had a significant impact on the geomorphology of the Indus delta by severely limiting the supply of water and sediment downstream, making it a sediment-starved delta. As a result, the now primarily tide-dominated delta front is eroding at a faster rate and experiencing further reworking of abandoned streams into intruding tidal channels [38,42].
Localized subsidence within areas of the city can be attributed to multiple causes. One of the primary potential reasons is excessive abstraction of groundwater fueled by rapid urbanization and a growing demand for water in domestic and industrial applications. A steadily increasing shortage in the municipal water supply has encouraged widespread reliance on groundwater abstraction through individual and community wells [44].
There are thousands of suction pumps and tube wells installed at private residences throughout the city, especially in areas like Defence and Nazimabad. However, there is no centralized database with records of these wells to determine a direct correlation between the locations of groundwater wells and rates of subsidence. A regional overview of groundwater in the area can be assembled using the Monthly Mass Grids of Water Equivalent Thickness produced by NASA’s Gravity Recovery & Climate Experiment (GRACE) [45,46,47]. Although the data has a coarse spatial resolution of 300 km, the groundwater in the Karachi region has been declining since 2002 (Figure 9). Recent studies have suggested that this decline is attributed to excessive groundwater abstraction for agricultural, industrial, and residential use due to the inadequate surface water supply from Haleji Lake, Kheenjar Lake, and Hub Dam [24,48,49].
Furthermore, a large portion of Defence is built on land reclaimed between 1984 and 2021 (Figure 10).
5.3. Risk to Infrastructure
Buildings and infrastructure most at risk of damage are not necessarily located in areas where subsidence is greatest. The risk is highest where there is a steep gradient in the deformation velocity [50], as differential subsidence is known to cause surficial faulting and fracturing [51]. We calculate an InSAR deformation gradient to highlight these areas in Karachi (Figure 11). The vertical displacement data is interpolated using an Inverse Distance Weighted approach and resampled to a 100 m resolution continuous raster. A sobel operator is applied to the raster and a 3 × 3 kernel is used to smooth the data. The resulting raster highlights those areas most at risk for damage.
A major cause for concern is that, in some cases, the subsiding areas may be caused in part by damaged infrastructure itself. Specifically, broken sewer and water lines can be attributed to variations in localized subsidence patterns where leaking water may cause liquefaction and subsidence over time [52,53]. This suggests that the areas where differential subsidence is greatest would have the problem further exacerbated by damage to sewer and water systems.
The high InSAR gradient areas in Defence Phase VIII are concentrated along the historical landmass extents (Figure 9). It has been suggested by [52,54] that this is especially alarming considering the extensive construction of high rise buildings and housing communities on reclaimed land, and that further unmitigated development could have catastrophic results [52].
Considering the density of Karachi’s population as well as the density of buildings, there is an alarming potential for catastrophe. As seen in cases like the Brownwood subdivision in the greater Houston area, unmitigated subsidence in coastal cities can lead to the sinking of entire neighborhoods [55]. The InSAR gradient map should help to serve as a guide for city planners to determine which areas require the most attention to address based on the amount of risk.
6. Limitations and Considerations
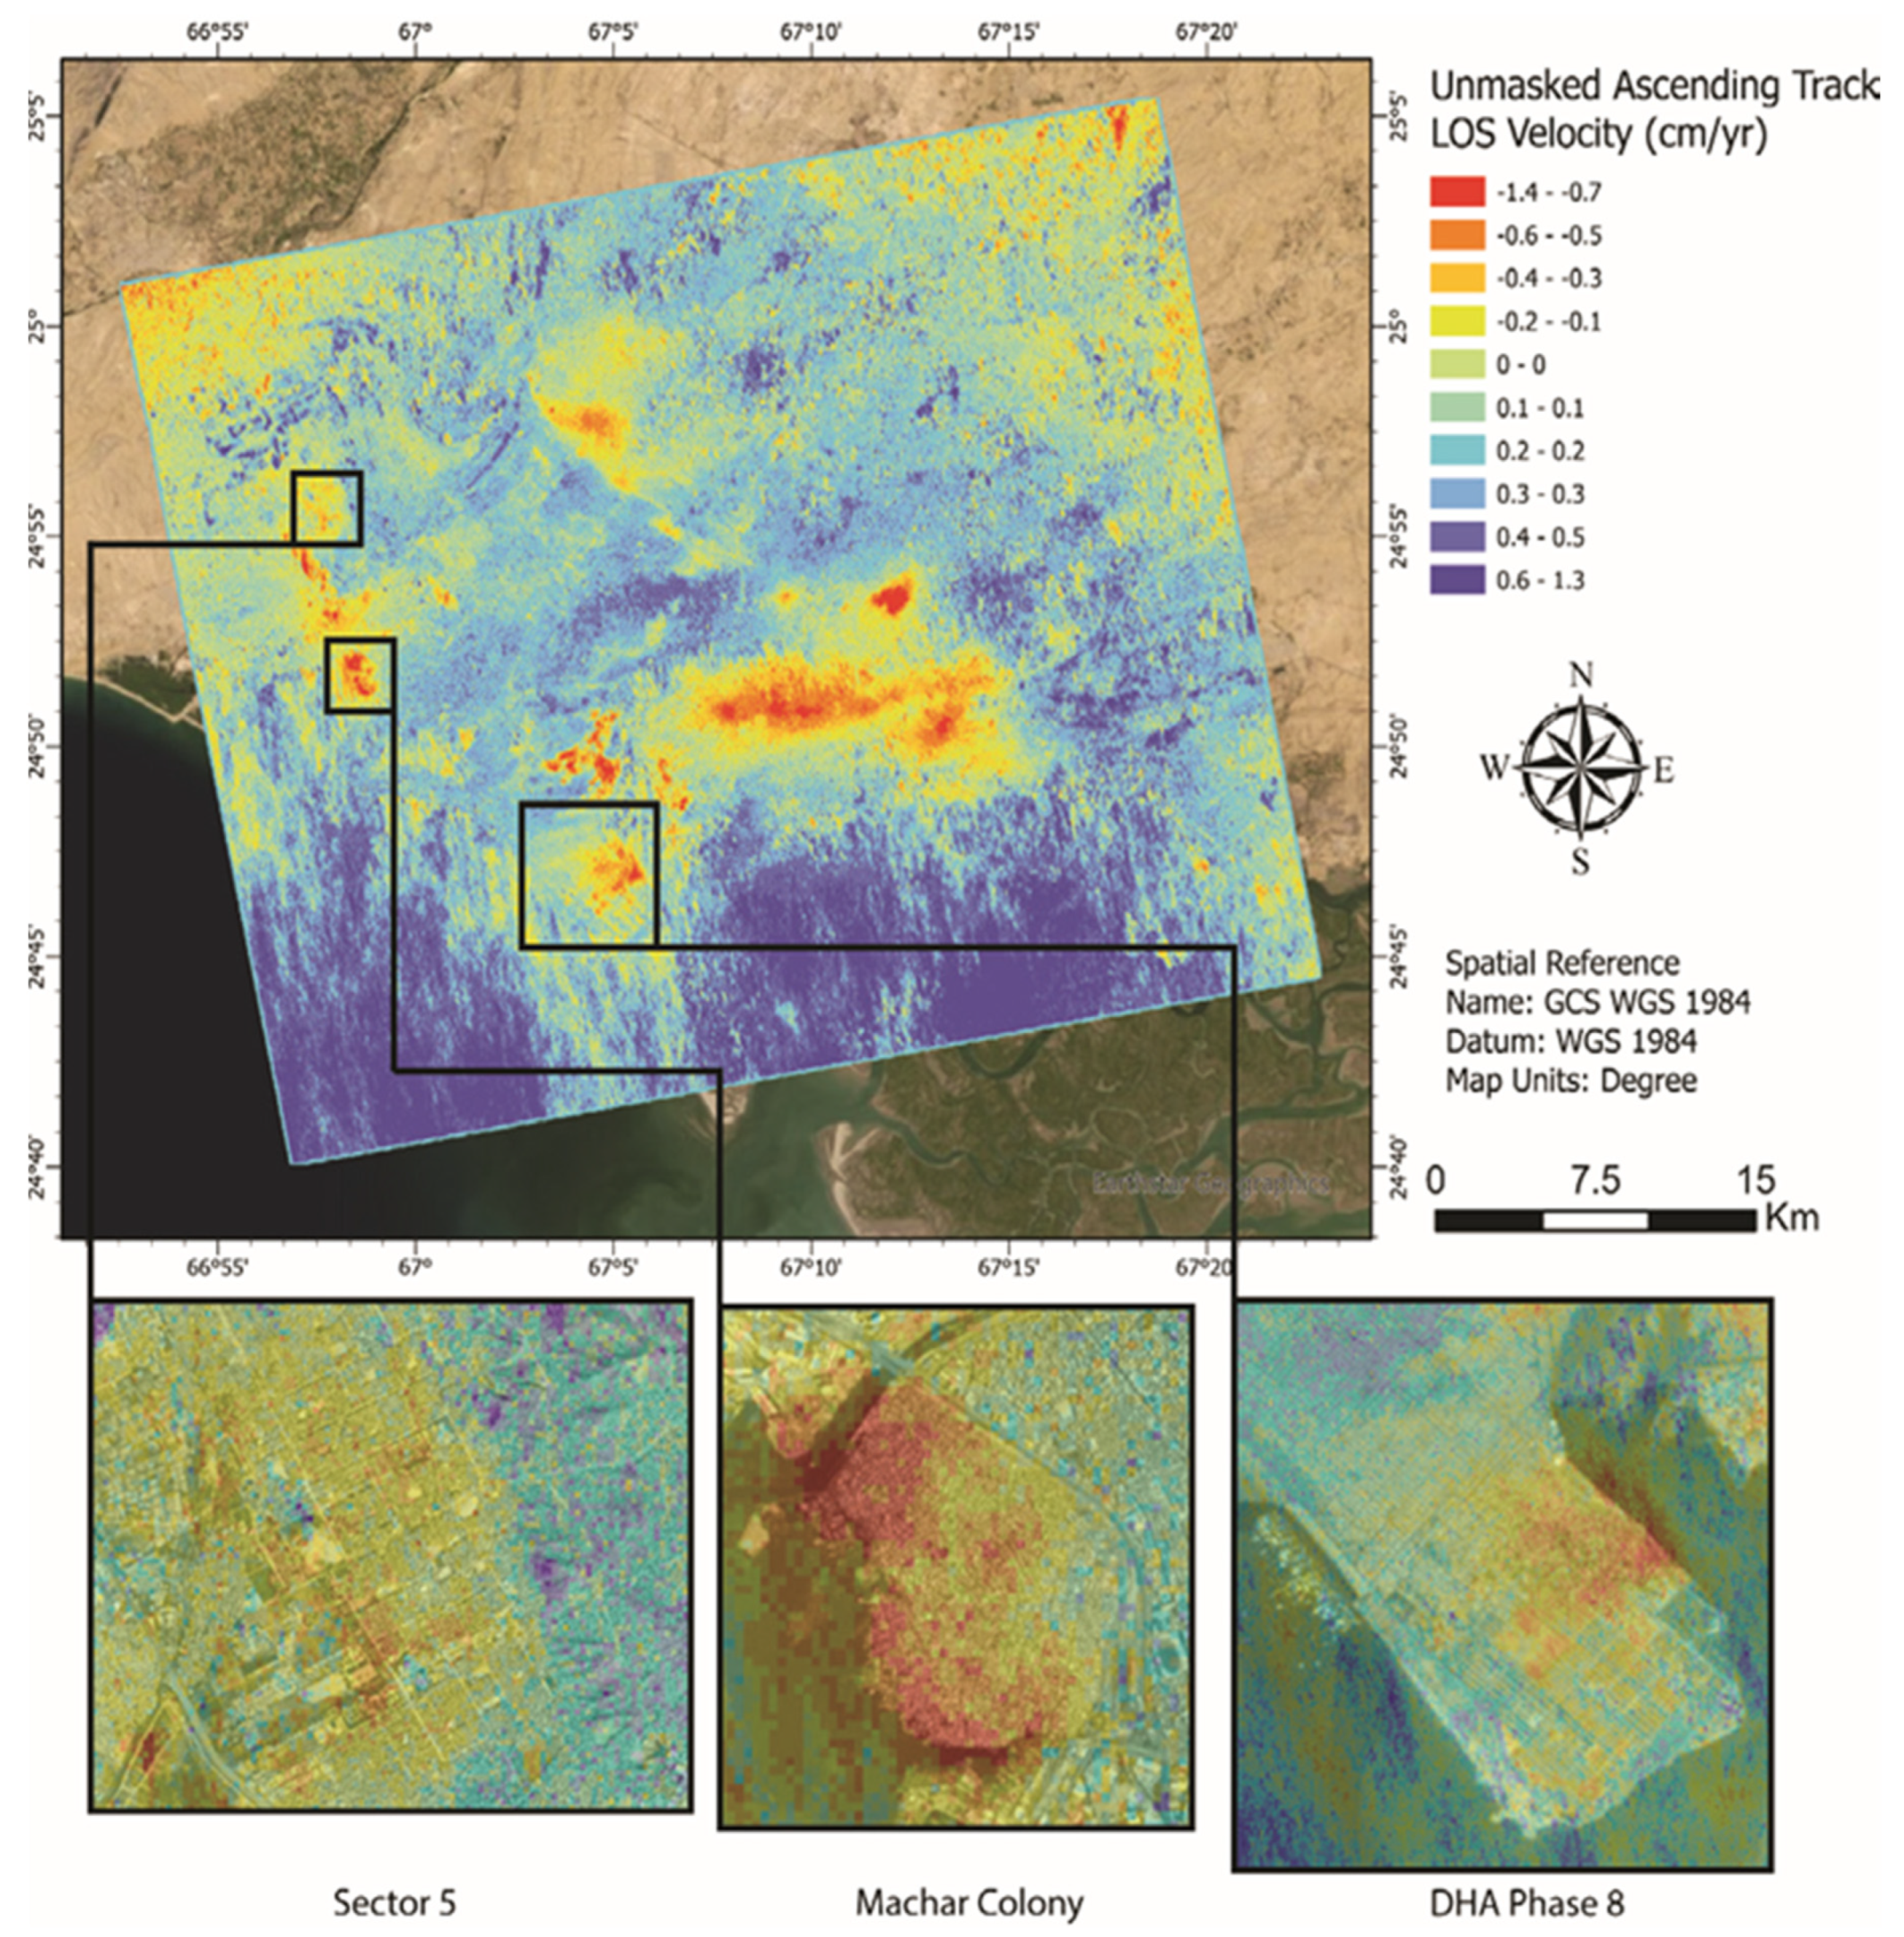
There are a few areas in Karachi where subsidence may be occurring but which are not explored in detail in this work. Areas of note include Defence Phase 8, Machar Colony, and Sector 5. DHA Phase 8 and Machar Colony are masked out due to low temporal coherence, likely caused by rapid and sporadic construction. Sector 5 has areas masked out due to the high concentration of vegetation. However, in each of these cases, the same gradient or pattern of deformation as the focus areas of this study can be seen partially formed. Specifically, lower rates of deformation are seen on the outsides, and the few reliable pixels in these areas show increasing deformation rates moving inward. These patterns are apparent in the unmasked data (Figure 12). However, as temporal coherence is used as a reliability measure, these areas have been masked out but should be taken into consideration in future work.
Moving forward, we recommend the establishment of a dense network of GPS stations encompassing the city. This would help develop a baseline reference for the ground surface and enable more detailed and precise research for subsidence in Karachi. While InSAR is an effective tool for studying subsidence and ground deformation, it is limited to comparative motion between the study area and the reference point. A network of GPS stations can help enhance InSAR studies by providing ground truth data that can be used to normalize the InSAR results and obtain absolute displacement values. This ground truth data can further be enhanced by the installation of extensometers to different depths/lithologic units to gather differential subsurface compaction data. The extensometer data would help to determine which units are compacting the most, and researchers can analyze the data to find the driving causes.
The establishment of a well locations catalogue would be of great benefit to researchers as this would allow them to perform colocation and hotspot analysis. The spatial distribution of groundwater wells plays an important role in subsidence as areas with densely clustered wells have been shown to have higher subsidence rates compared to wells distributed over a larger area [56].
7. Conclusions
The results of this study suggest that the city of Karachi and surrounding areas are undergoing subsidence due to both anthropogenic and natural causes. Interferometric analysis of Sentinel-1 data from 2015 to 2020 shows vertical motion of 1.7 cm/yr downward, which suggests that the rate of subsidence is steadily increasing. For the first time, we report the presence of an active normal fault that strikes south-east to north-west. InSAR data demonstrate clear displacement along the fault, most notably along a 10 km-long section. This poses an alarming risk to the densely inhabited city of Karachi as there is a lack of studies on the strain accumulation of this fault, leaving the city unprepared to forecast and plan for the potential of a large seismic event.
Author Contributions
O.T.: Data curation, Formal analysis, Investigation, Validation, Visualization, Writing—original draft, Writing—review & editing. S.D.K.: Conceptualization, Project administration, Supervision, Writing—review & editing. S.M.: Methodology, Software. H.F.: Methodology, Validation, Software. All authors have read and agreed to the published version of the manuscript.
Funding
This research received no external funding.
Data Availability Statement
Data can be requested by emailing corresponding author.
Acknowledgments
The research was partly carried out at the Jet Propulsion Laboratory, California Institute of Technology, under a contract with the National Aeronautics and Space Administration (80NM0018D0004). Seismic data provided by Directorate General of Petroleum Concessions. O.T. would like to thank Jonny Wu, Kamil Ahmad Qureshi, and Aydin Shahtakhtinskiy for their valuable insight and discussions on various aspects of this research; Scott Staniewicz, Yunjun Zhang, and the instructors of the UNAVCO ISCE 2020 short course for their help in troubleshooting issues with, and gaining a better understanding of, the ISCE and MintPy softwares.
Conflicts of Interest
The authors declare no conflict of interest.
References
- Tosi, L.; Teatini, P.; Strozzi, T. Natural versus anthropogenic subsidence of Venice. Sci. Rep. 2013, 3, 2710. [Google Scholar] [CrossRef] [PubMed] [Green Version]
- Jones, C.E.; An, K.; Blom, R.G.; Kent, J.D.; Ivins, E.R.; Bekaert, D. Anthropogenic and geologic influences on subsidence in the vicinity of New Orleans, Louisiana. J. Geophys. Res. Solid Earth 2016, 121, 3867–3887. [Google Scholar] [CrossRef]
- Blackwell, E.; Shirzaei, M.; Ojha, C.; Werth, S. Tracking California’s sinking coast from space: Implications for relative sea-level rise. Sci. Adv. 2020, 6, eaba4551. [Google Scholar] [CrossRef] [PubMed]
- Huang, J.; Khan, S.D.; Ghulam, A.; Crupa, W.; Abir, I.A.; Khan, A.S.; Kakar, D.M.; Kasi, A.; Kakar, N. Study of Subsidence and Earthquake Swarms in the Western Pakistan. Remote Sens. 2016, 8, 956. [Google Scholar] [CrossRef] [Green Version]
- National Oceanic and Atmospheric Administration. What Is Subsidence? Available online: https://oceanservice.noaa.gov/facts/subsidence.html (accessed on 15 February 2023).
- Törnqvist, T.E.; Wallace, D.J.; Storms, J.E.A.; Wallinga, J.; van Dam, R.L.; Blaauw, M.; Derksen, M.S.; Klerks, C.J.W.; Meijneken, C.; Snijders, E.M.A. Mississippi Delta subsidence primarily caused by compaction of Holocene strata. Nat. Geosci. 2008, 1, 173–176. [Google Scholar] [CrossRef]
- Tessler, Z.D.; Vörösmarty, C.J.; Grossberg, M.; Gladkova, I.; Aizenman, H.; Syvitski, J.P.M.; Foufoula-Georgiou, E. Profiling risk and sustainability in coastal deltas of the world. Science 2015, 349, 638–643. [Google Scholar] [CrossRef] [Green Version]
- Buckley, S.M.; Rosen, P.A.; Hensley, S.; Tapley, B.D. Land subsidence in Houston, Texas, measured by radar interferometry and constrained by extensometers. J. Geophys. Res. 2003, 108, 2542. [Google Scholar] [CrossRef]
- Sneed, M.; Brandt, J.T.; Solt, M. Land Subsidence along the California Aqueduct in West-Central San Joaquin Valley, California, 2003–2010; U.S. Geological Survey: Sacramento, CA, USA, 2018. [CrossRef]
- Braun, C.L.; Ramage, J.K. Status of Groundwater-Level Altitudes and Long-Term Groundwater-Level Changes in the Chicot, Evangeline, and Jasper Aquifers, Houston-Galveston Region, Texas, 2020; U.S. Geological Survey: Austin, TX, USA, 2020. [CrossRef]
- Bilham, R.; Lodi, S.; Hough, S.; Bukhary, S.; Khan, A.M.; Rafeeqi, S.F.A. Seismic Hazard in Karachi, Pakistan: Uncertain Past, Uncertain Future. Seismol. Res. Lett. 2007, 78, 601–613. [Google Scholar] [CrossRef] [Green Version]
- Richey, A.S.; Thomas, B.F.; Lo, M.-H.; Reager, J.T.; Famiglietti, J.S.; Voss, K.; Swenson, S.; Rodell, M. Quantifying renewable groundwater stress with GRACE. Water Resour. Res. 2015, 51, 5217–5238. [Google Scholar] [CrossRef]
- Kasmarek, M.C.; Ramage, J.K.; Johnson, M.R. Water-Level Altitudes 2016 and Water-Level Changes in the Chicot, Evangeline, and Jasper Aquifers and Compaction 1973–2015 in the Chicot and Evangeline Aquifers, Houston-Galveston Region, Texas; U.S. Geological Survey: Austin, TX, USA, 2016. [CrossRef]
- Khan, S.D.; Gadea, O.C.A.; Alvarado, A.T.; Tirmizi, O.A. Surface Deformation Analysis of the Houston Area Using Time Series Interferometry and Emerging Hot Spot Analysis. Remote Sens. 2022, 14, 3831. [Google Scholar] [CrossRef]
- Sarwar, G. Riding the mobile Karachi arc, Pakistan: Understanding tectonic threats. J. Himal. Earth Sci. 2013, 46, 9–24. [Google Scholar]
- Quittmeyer, R.; Farah, A.; Jacob, K.H. The seismicity of Pakistan and its relation to surface faults, Geodynamics of Pakistan. In Geodynamics of Pakistan; Geological Survey of Pakistan: Quetta, Pakistan, 1979; pp. 271–284. [Google Scholar]
- Bilham, R.; Lodi, S. The door knockers of Mansurah: Strong shaking in a region of low perceived seismic risk, Sindh, Pakistan. In Ancient Earthquakes; Geological Society of America: Boulder, Colorado, 2010. [Google Scholar]
- Schelling, D.D. Frontal structural geometries and detachment tectonics of the northeastern Karachi arc, southern Kirthar Range, Pakistan. In Himalaya and Tibet: Mountain Roots to Mountain Tops; Geological Society of America: Boulder, Colorado, 1999. [Google Scholar]
- Aitchison, J.C.; Ali, J.R.; Davis, A.M. When and where did India and Asia collide? J. Geophys. Res. 2007, 112, B05423. [Google Scholar] [CrossRef] [Green Version]
- Waseem, M.; Khan, M.A.; Khan, S. Seismic sources for southern Pakistan and seismic hazard assessment of Karachi. Nat. Hazards 2019, 99, 511–536. [Google Scholar] [CrossRef]
- Lawrence, R.D.; Yeats, R.S.; Khan, S.H.; Farah, A.; DeJong, K.A. Thrust and strike slip fault interaction along the Chaman transform zone, Pakistan. Geol. Soc. Lond. Spec. Publ. 1981, 9, 363–370. [Google Scholar] [CrossRef]
- Farah, A.; Abbas, G.; Jong, K.A.D.; Lawrence, R.D. Evolution of the lithosphere in Pakistan. Tectonophysics 1984, 105, 207–227. [Google Scholar] [CrossRef]
- Sarwar, G.; Dejong, K. Arcs, oroclines, syntaxes; the curvature of mountain belts in Pakistan. In Geodynamics of Pakistan; Geological Survey of Pakistan: Quetta, Pakistan, 1979; pp. 341–350. [Google Scholar]
- Sohail, M.T.; Hussan, A.; Ehsan, M.; Al-Ansari, N.; Akhter, M.M.; Manzoor, Z.; Elbeltagi, A. Groundwater budgeting of Nari and Gaj formations and Groundwater mappning of Karachi, Pakistan. Appl. Water Sci. 2022, 12, 267. [Google Scholar] [CrossRef]
- Sarwar, G. Earthquakes and the Neo-Tectonic Framework of the Kutch-Hyderabad-Karachi Triple Junction Area, Indo-Pakistan. Pak. J. Hydrocarb. Res. 2004, 14, 35–40. [Google Scholar]
- Fattahi, H.; Agram, P.; Simons, M. A Network-Based Enhanced Spectral Diversity Approach for TOPS Time-Series Analysis. IEEE Trans. Geosci. Remote Sens. 2017, 55, 777–786. [Google Scholar] [CrossRef] [Green Version]
- Mirzaee, S.; Amelung, F.; Fattahi, H. Non-linear phase inversion package for time series analysis. In AGU Fall Meeting Abstracts; American Geophysical: Washington, DC, USA, 2019; Volume 2019, p. G13C-0572. [Google Scholar]
- Mirzaee, S.; Amelung, F. Volcanic Activity Change Detection Using SqueeSAR-InSAR and Backscatter Analysis. In AGU Fall Meeting Abstracts; American Geophysical: Washington, DC, USA, 2018; Volume 2018, p. G41B-0707. [Google Scholar]
- Yunjun, Z.; Fattahi, H.; Amelung, F. Small baseline InSAR time series analysis: Unwrapping error correction and noise reduction. Comput. Ampmathsemicolon Geosci. 2019, 133, 104331. [Google Scholar] [CrossRef] [Green Version]
- Ansari, H.; Zan, F.D.; Bamler, R. Sequential Estimator: Toward Efficient InSAR Time Series Analysis. IEEE Trans. Geosci. Remote Sens. 2017, 55, 5637–5652. [Google Scholar] [CrossRef] [Green Version]
- Ansari, H.; Zan, F.D.; Bamler, R. Efficient Phase Estimation for Interferogram Stacks. IEEE Trans. Geosci. Remote Sens. 2018, 56, 4109–4125. [Google Scholar] [CrossRef]
- Chen, C.W.; Zebker, H.A. Two-dimensional phase unwrapping with use of statistical models for cost functions in nonlinear optimization. J. Opt. Soc. Am. A 2001, 18, 338. [Google Scholar] [CrossRef] [PubMed] [Green Version]
- Ferretti, A.; Fumagalli, A.; Novali, F.; Prati, C.; Rocca, F.; Rucci, A. A New Algorithm for Processing Interferometric Data-Stacks: SqueeSAR. IEEE Trans. Geosci. Remote Sens. 2011, 49, 3460–3470. [Google Scholar] [CrossRef]
- Fialko, Y.; Simons, M.; Agnew, D. The complete (3-D) surface displacement field in the epicentral area of the 1999 MW7.1 Hector Mine Earthquake, California, from space geodetic observations. Geophys. Res. Lett. 2001, 28, 3063–3066. [Google Scholar] [CrossRef] [Green Version]
- Wright, T.; Parsons, B.; Lu, Z. Toward mapping surface deformation in three dimensions using InSAR. Geophys. Res. Lett. 2004, 31, 169–178. [Google Scholar] [CrossRef] [Green Version]
- Zhong, W.; Chu, T.; Tissot, P.; Wu, Z.; Chen, J.; Zhang, H. Integrated coastal subsidence analysis using InSAR, LiDAR, and land cover data. Remote Sens. Environ. 2022, 282, 113297. [Google Scholar] [CrossRef]
- Niamatullah, M. Structural Geometry and Tectonics of Southern Part of Karachi Arc—A Case Study of Pirmangho and Lalji Area. Search Discov. Artic. 2012, 50581, 1–26. [Google Scholar]
- Giosan, L.; Constantinescu, S.; Clift, P.D.; Tabrez, A.R.; Danish, M.; Inam, A. Recent morphodynamics of the Indus delta shore and shelf. Cont. Shelf Res. 2006, 26, 1668–1684. [Google Scholar] [CrossRef]
- Syvitski, J.P.M.; Kettner, A.J.; Overeem, I.; Giosan, L.; Brakenridge, G.R.; Hannon, M.; Bilham, R. Anthropocene metamorphosis of the Indus Delta and lower floodplain. Anthropocene 2013, 3, 24–35. [Google Scholar] [CrossRef]
- Bilham, R. Slip parameters for the Rann of Kachchh, India, 16 June 1819, earthquake, quantified from contemporary accounts. Geol. Soc. Lond. Spec. Publ. 1999, 146, 295–319. [Google Scholar] [CrossRef]
- Bagnardi, M.; Hooper, A. Inversion of Surface Deformation Data for Rapid Estimates of Source Parameters and Uncertainties: A Bayesian Approach. Geochem. Geophys. Geosystems 2018, 19, 2194–2211. [Google Scholar] [CrossRef]
- Inam, A.; Clift, P.D.; Giosan, L.; Tabrez, A.R.; Tahir, M.; Rabbani, M.M.; Danish, M. The geographic, geological and oceanographic setting of the Indus River. In Large Rivers; John Wiley & Sons, Ltd.: Hoboken, NJ, USA, 2007; pp. 333–346. [Google Scholar]
- Hassan, S.R. August Rains Flood Pakistan’s Financial Capital, Shatter Records. Reuters, 27 August 2020. [Google Scholar]
- Khan, A.; Kanwal, A. Wasi Haider Zaidi Multidimensional Approach for Groundwater Quality Assessment of Miocene Rocks: A Case Study of Gulistan-e-Johar Area, Karachi, Pakistan. Int. J. Ground Sediment Wate 2019, 6, 449–474. [Google Scholar] [CrossRef]
- Swenson, S.; Wahr, J. Post-processing removal of correlated errors in GRACE data. Geophys. Res. Lett. 2006, 33, L08402. [Google Scholar] [CrossRef]
- Grace Monthly Land Water Mass Grids Netcdf Release 5.0. Available online: https://podaac.jpl.nasa.gov/dataset/TELLUS_LAND_NC_RL05 (accessed on 16 February 2023).
- Landerer, F.; Swenson, S. Accuracy of scaled GRACE terrestrial water storage estimates. Water Resour. Res. 2012, 48, 4531. [Google Scholar] [CrossRef]
- Groundwater Woes of Sindh. Daily Times, 17 September 2018.
- Iqbal, N.; Ashraf, M.; Imran, M.; Abdul Salam, H.; Hasan, F.; Khan, A. Groundwater Investigations and Mapping in the Lower Indus Plain; Pakistan Council of Research in Water Resources (PCRWR): Islamabad, Pakistan, 2020.
- Cabral-Cano, E.; Osmanoglu, B.; Dixon, T.; Wdowinski, S.; Demets, C.; Cigna, F.; D’iaz-Molina, O. Subsidence and fault hazard maps using PSI and permanent GPS networks in central Mexico. IAHS-AISH Publ. 2010, 339, 255–259. [Google Scholar]
- Holzer, T.L.; Johnson, A.I. Land subsidence caused by ground water withdrawal in urban areas. GeoJournal 1985, 11, 245–255. [Google Scholar] [CrossRef]
- Kanwal, S.; Ding, X.; Wu, S.; Sajjad, M. Vertical Ground Displacements and Its Impact on Erosion along the Karachi Coastline, Pakistan. Remote Sens. 2022, 14, 2054. [Google Scholar] [CrossRef]
- Lodi, S.; Sultan, W.; Bukhary, S.S.; Rafeeqi, S.F.A. Liquefaction potential along the coastal regions of Karachi. J. Himal. Earth Sci. 2015, 48, 89–98. [Google Scholar]
- Amin, G.; Shahzad, M.I.; Jaweria, S.; Zia, I. Measuring land deformation in a mega city Karachi-Pakistan with sentinel SAR interferometry. Geocarto Int. 2022, 37, 4974–4993. [Google Scholar] [CrossRef]
- Bernal, L. Brownwood: Baytown’s Most Historic Neighborhood. Ph.D. Thesis, University of Houston, Houston, TX, USA, 2020. [Google Scholar]
- Ellis, J.; Knight, J.E.; White, J.T.; Sneed, M.; Hughes, J.D.; Ramage, J.K.; Braun, C.L.; Teeple, A.; Foster, L.K.; Rendon, S.H.; et al. Hydrogeology, Land-Surface Subsidence, and Documentation of the Gulf Coast Land Subsidence and Groundwater-Flow (GULF) Model, Southeast Texas, 1897–2018; Professional Paper; U.S. Geological Survey: Reston, VA, USA, 2023; Volume 1877, p. 432.
Figure 1.
Simplified regional tectonic setting near Karachi showing historical seismicity with notable features highlighted. The location of Karachi is denoted with a star. (Source: Pakistan Meteorological Department, United States Geological Survey).
Figure 1.
Simplified regional tectonic setting near Karachi showing historical seismicity with notable features highlighted. The location of Karachi is denoted with a star. (Source: Pakistan Meteorological Department, United States Geological Survey).

Figure 2.
A map of the study area depicting key tectonic features such as anticlinesyncline pairs, faults, and recent earthquake hypocenters, along with InSAR coverage footprints. Earthquakes data source: Pakistan Meteorological Department Karachi, as presented by [14]. Faults and folds traced from Sindh geological map published by Geological Survey of Pakistan.
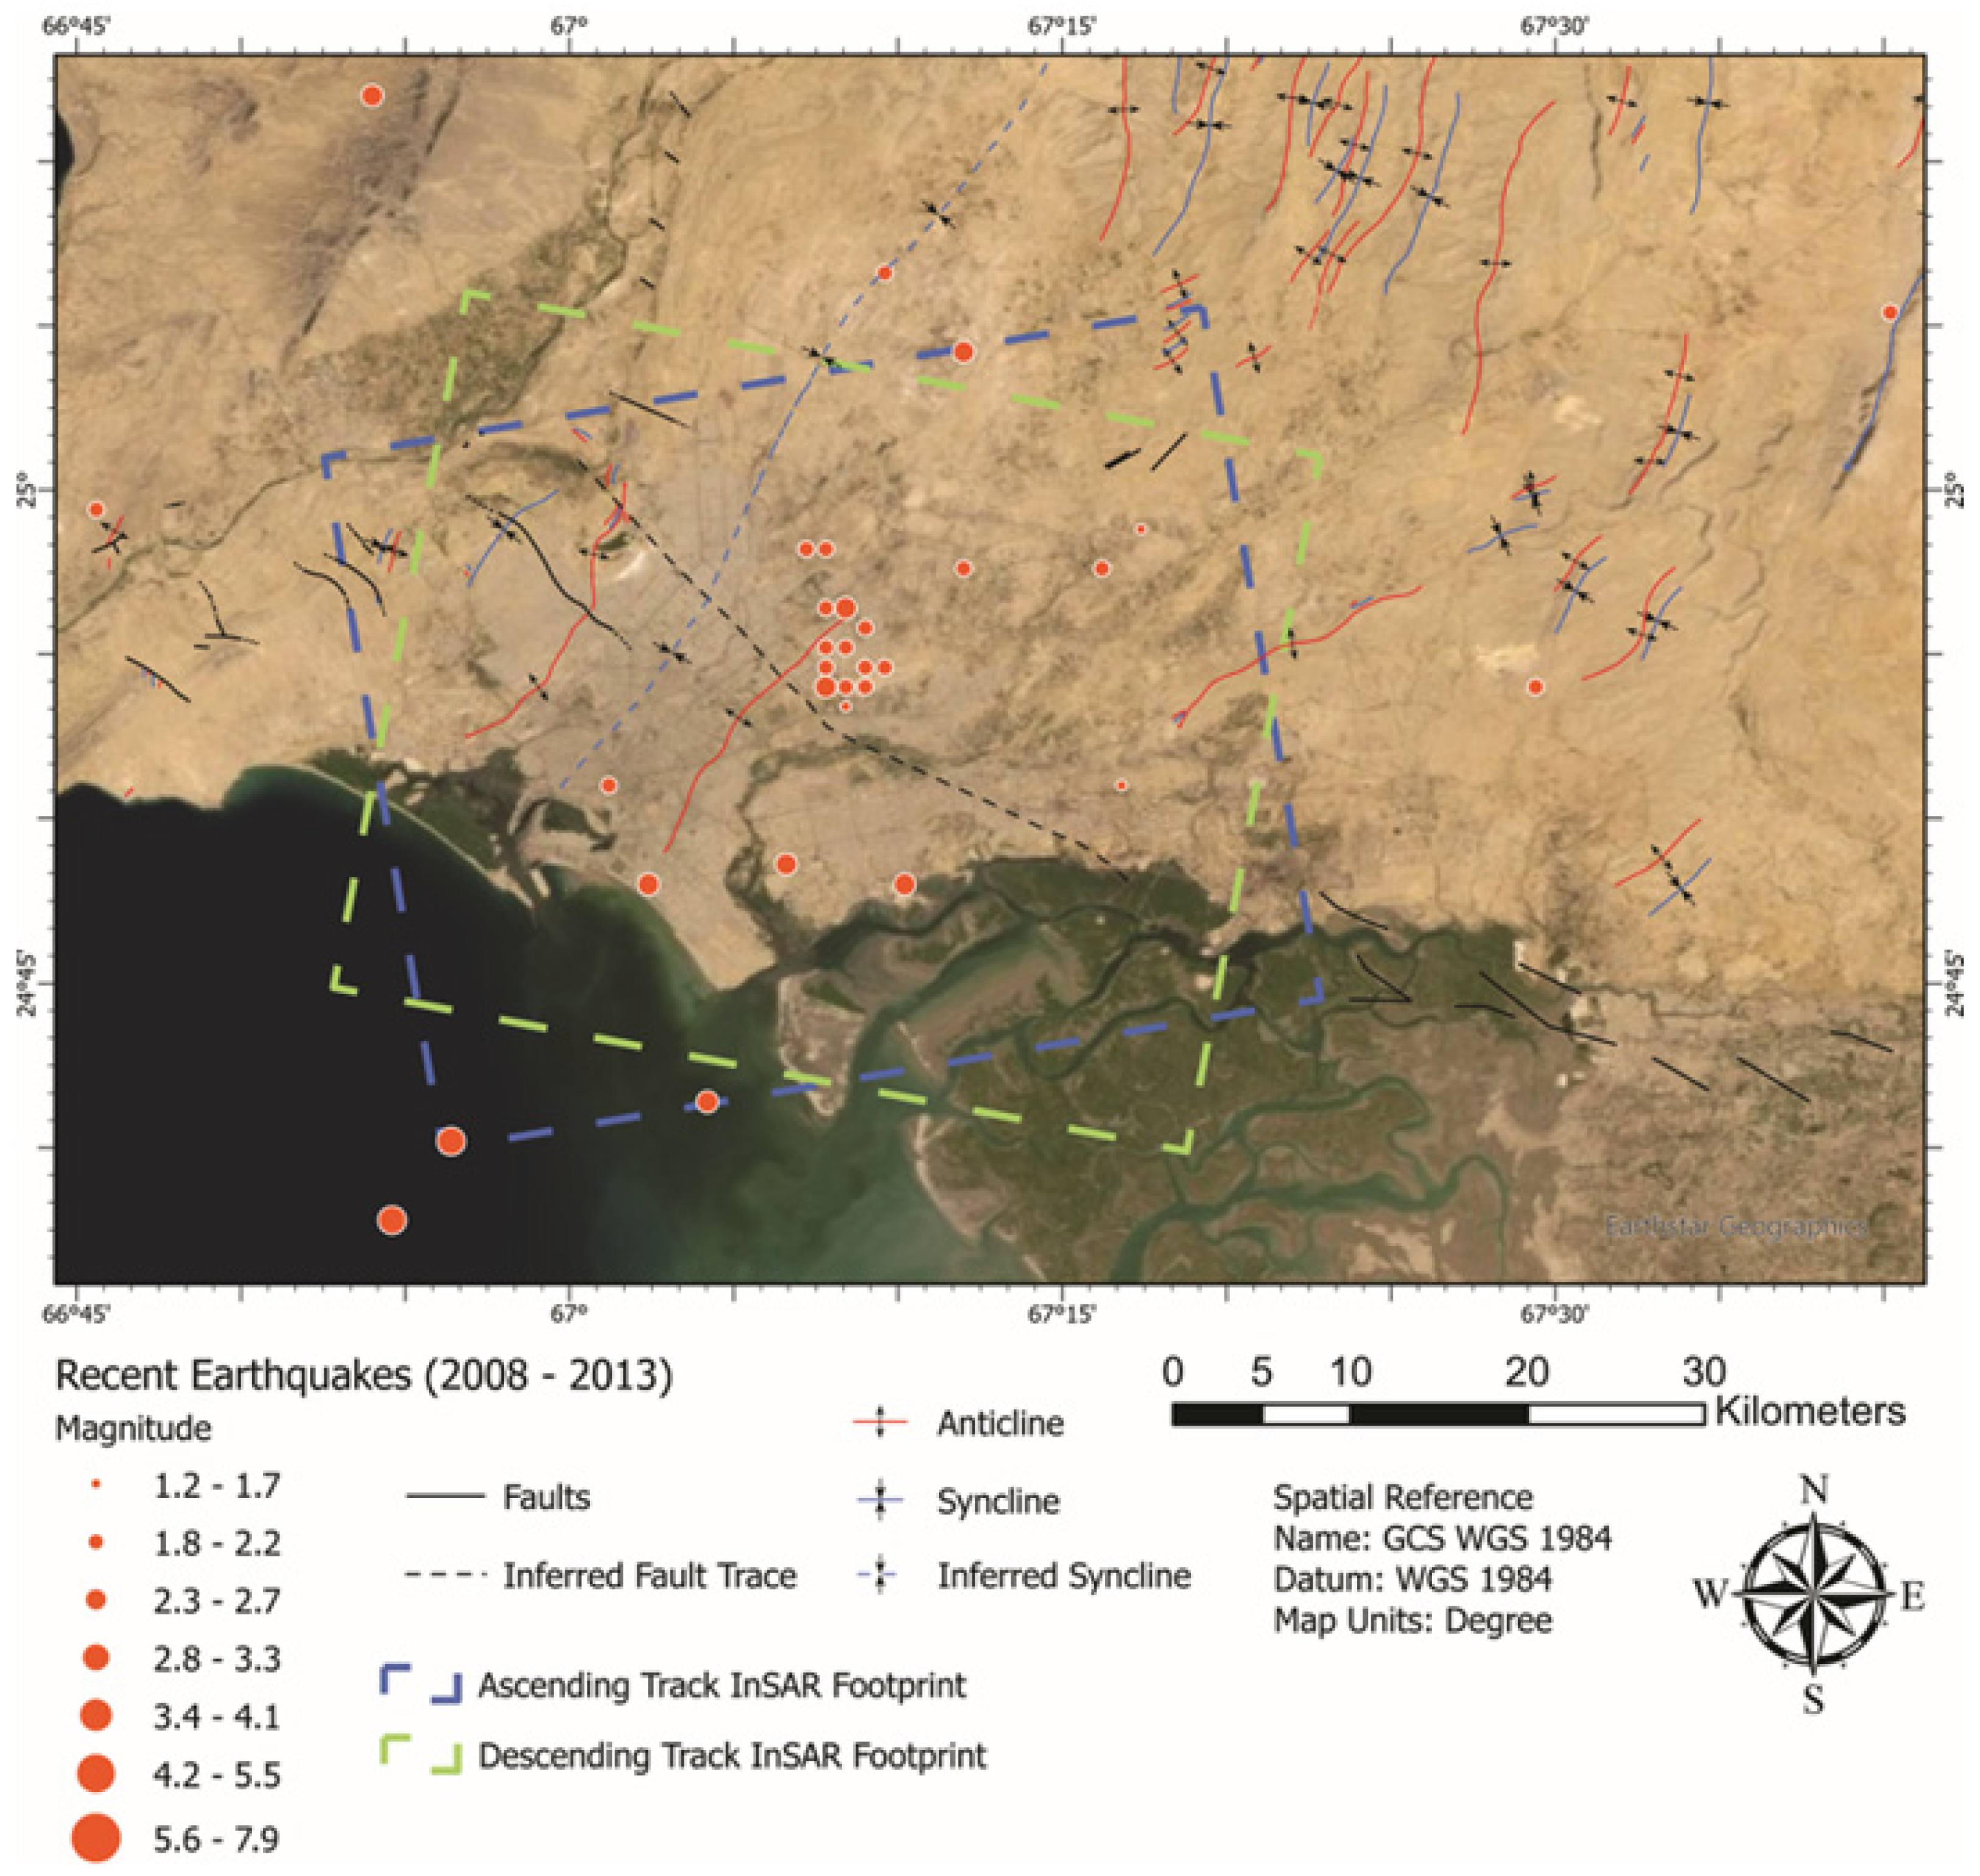
Figure 3.
Simplified InSAR workflow. Red boxes denote steps performed by MiaplPy and green boxes denote steps performed by MintPy.
Figure 3.
Simplified InSAR workflow. Red boxes denote steps performed by MiaplPy and green boxes denote steps performed by MintPy.
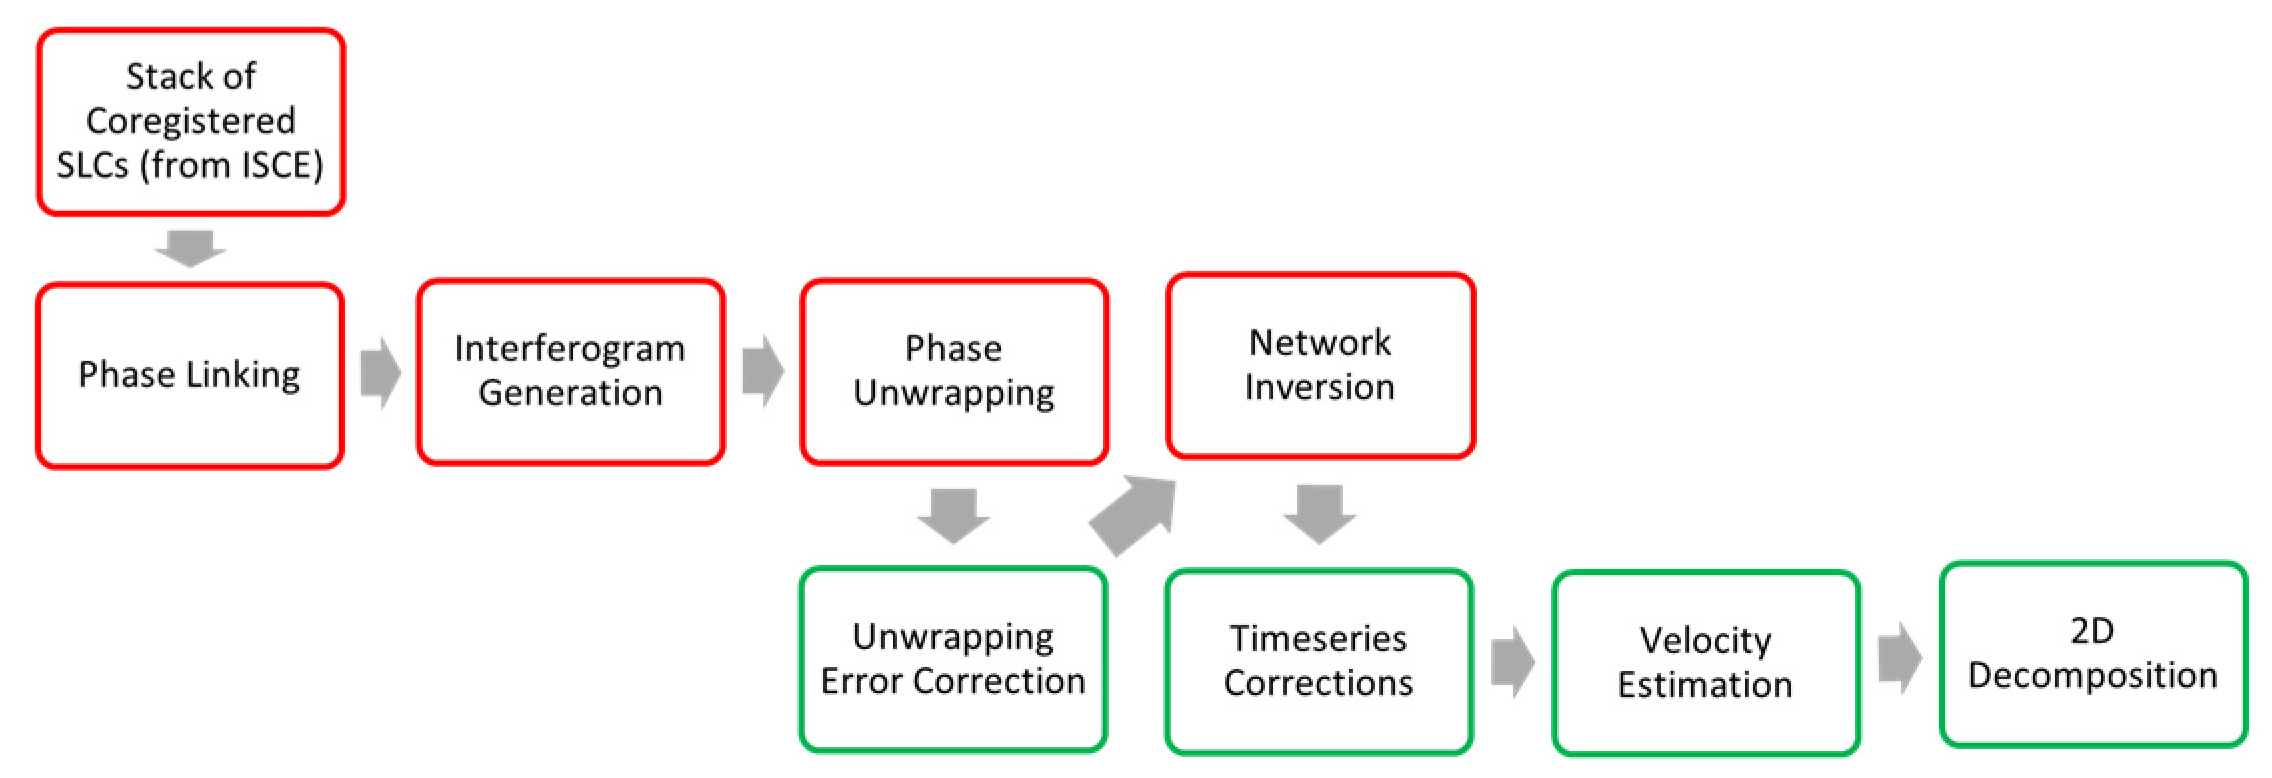
Figure 4.
LOS velocity change results derived from ascending and descending track deformation timeseries with 5 distinct areas emphasized. Black star denotes reference point. White arrows indicate satellite viewing geometry.
Figure 4.
LOS velocity change results derived from ascending and descending track deformation timeseries with 5 distinct areas emphasized. Black star denotes reference point. White arrows indicate satellite viewing geometry.
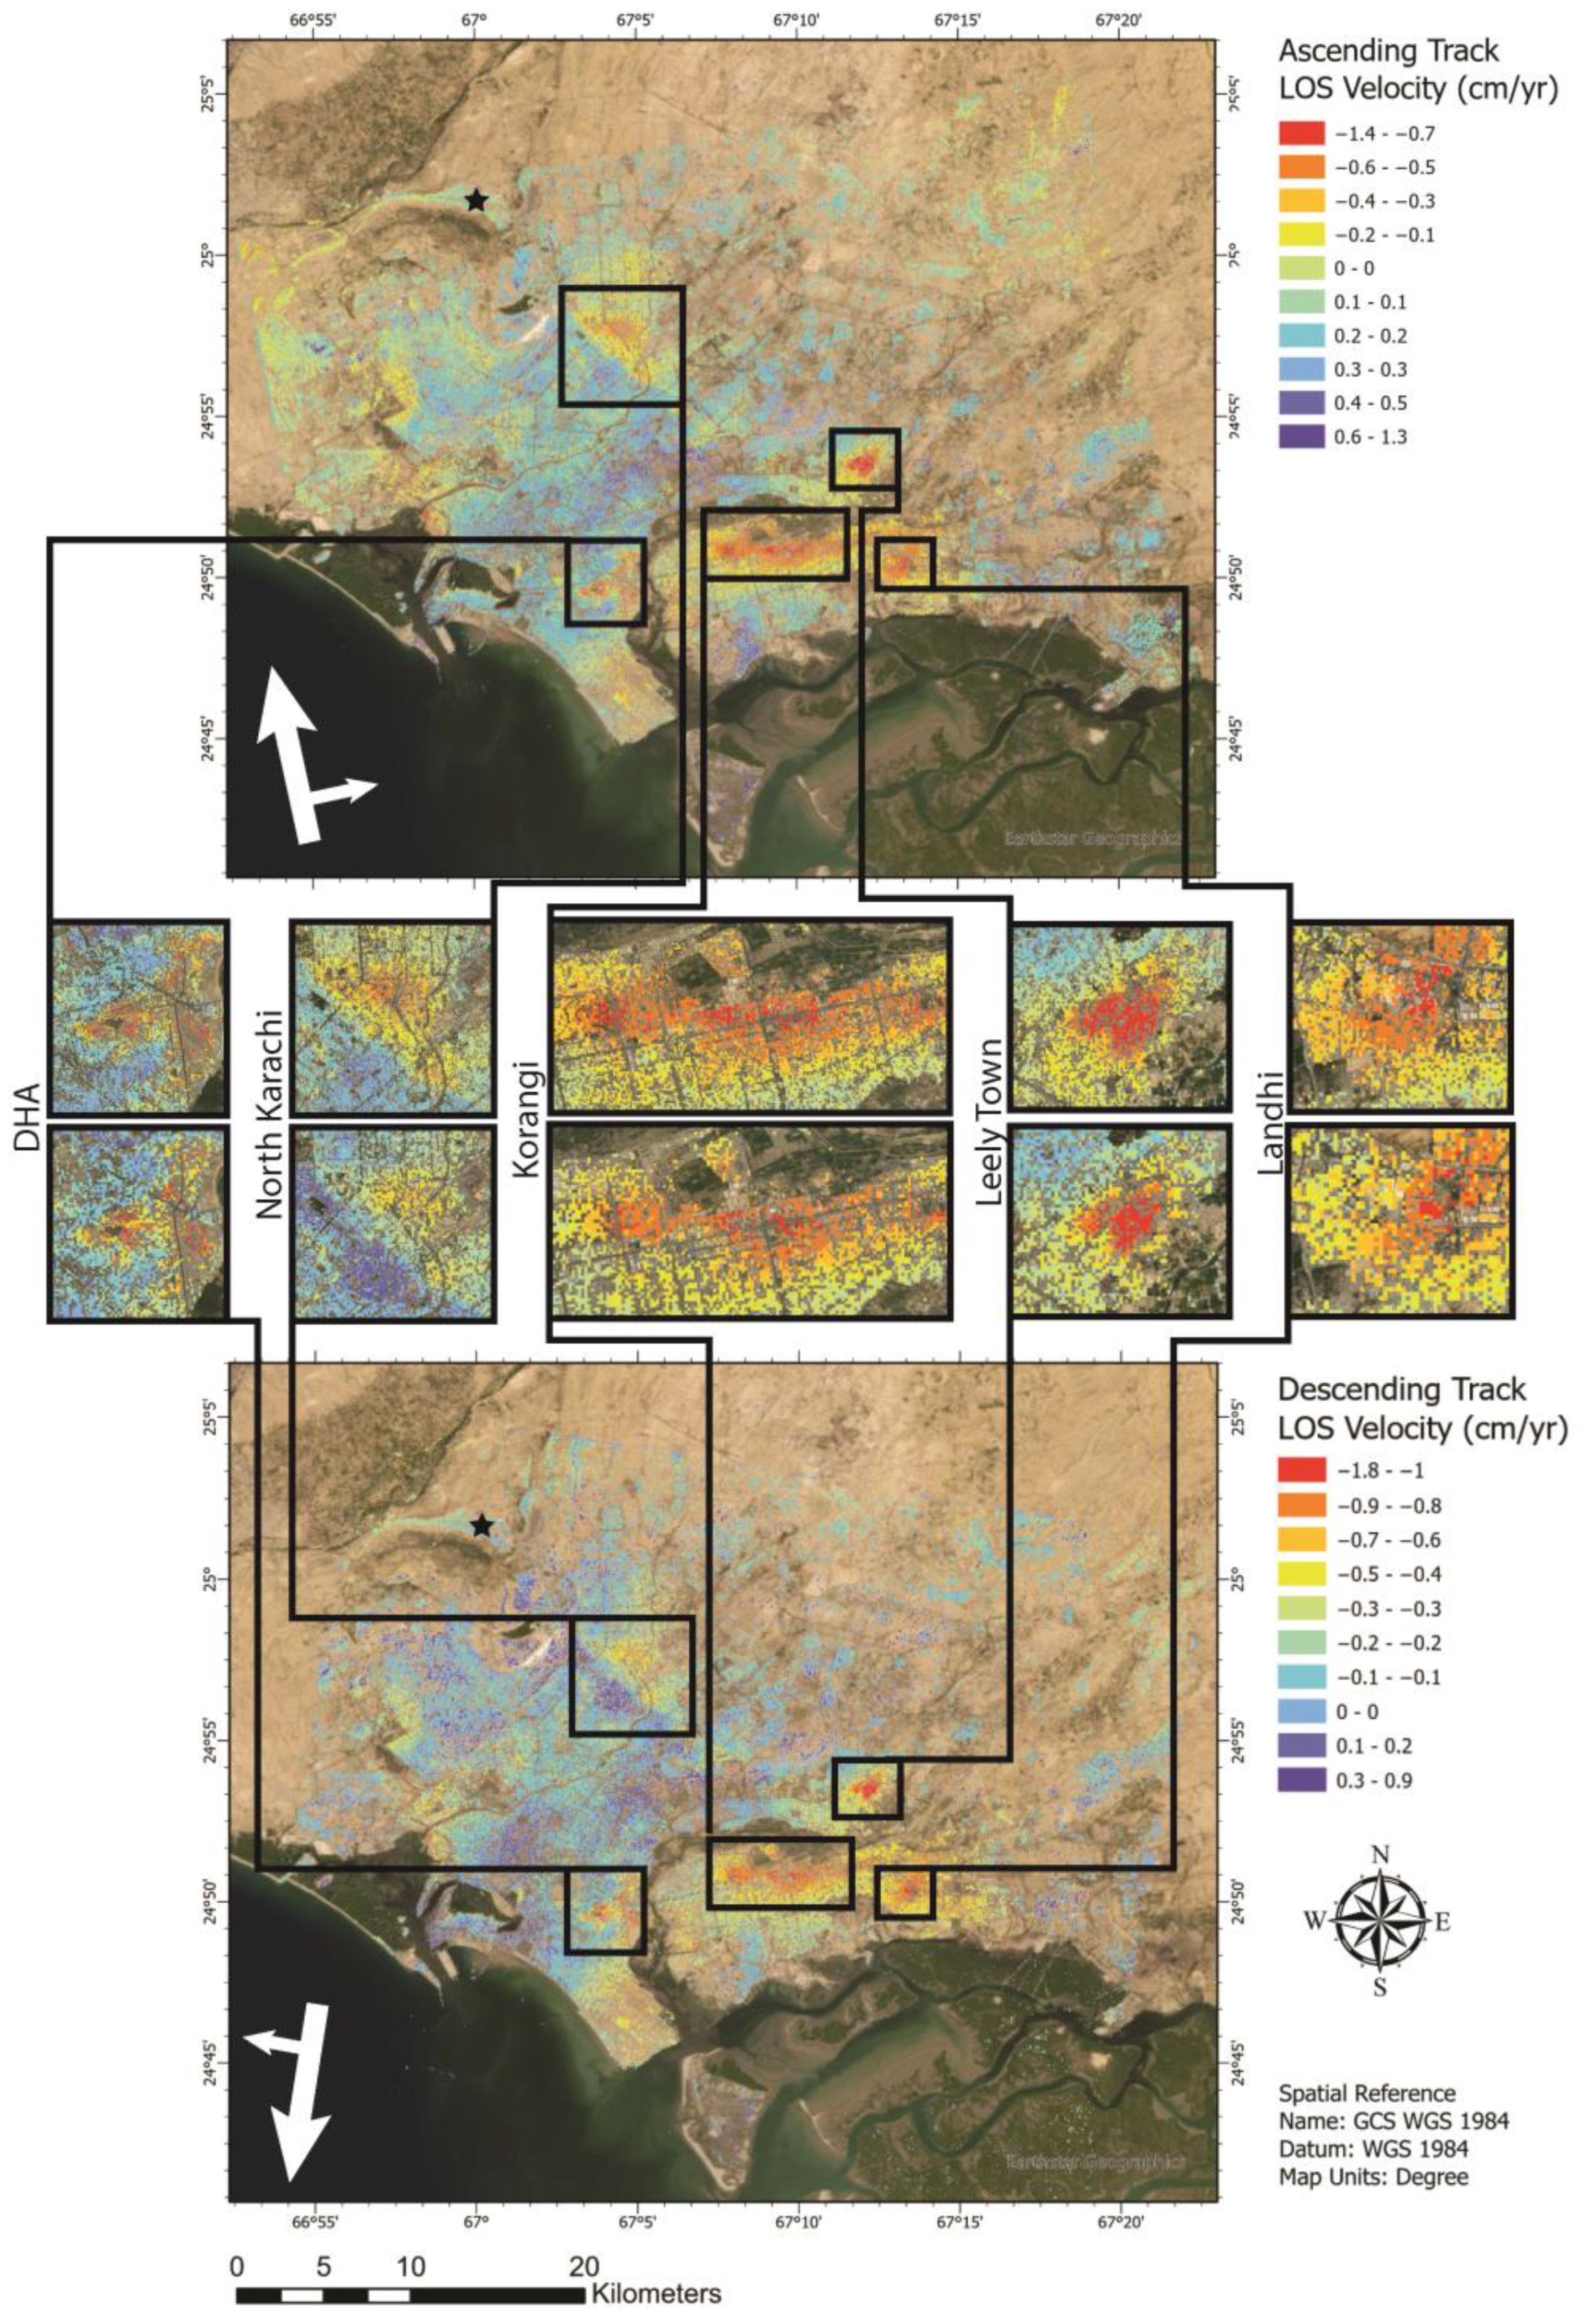
Figure 5.
Vertical component of deformation from LOS velocity decomposition. Negative values indicate subsidence.
Figure 5.
Vertical component of deformation from LOS velocity decomposition. Negative values indicate subsidence.
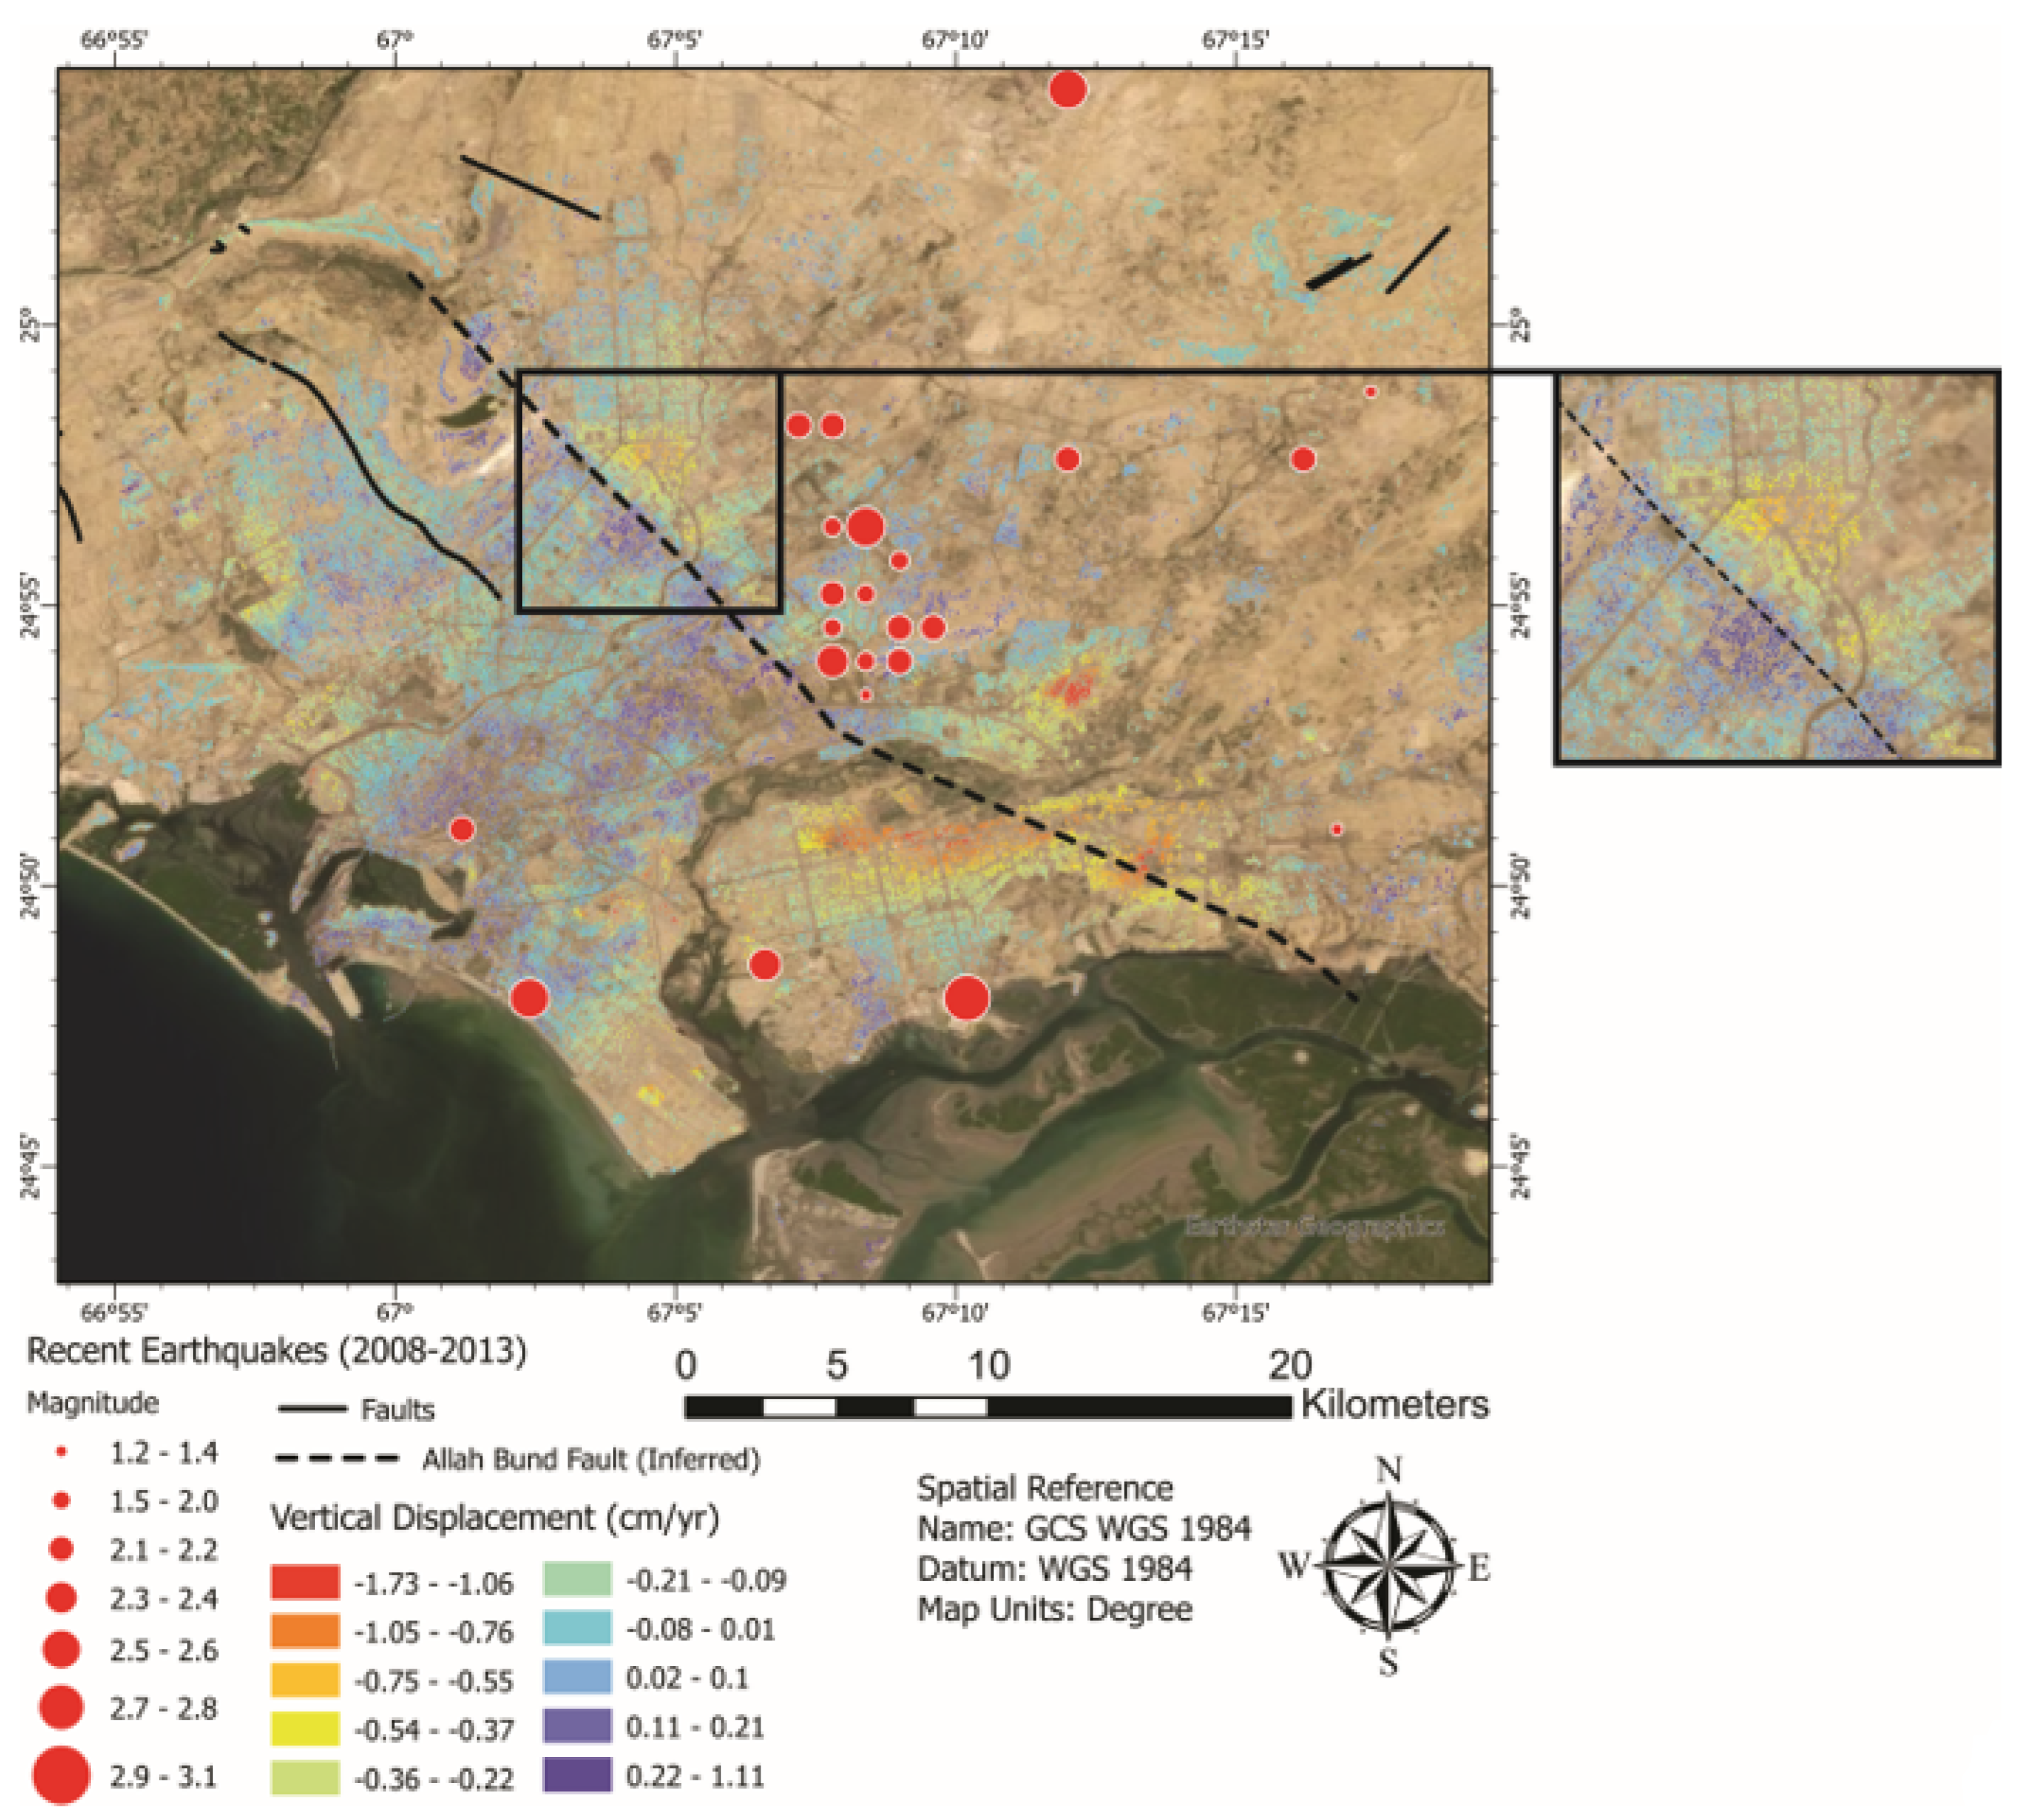
Figure 6.
Timeseries plots of individual pixels representative of average displacement in key areas produced from the results of Sentinel-1 InSAR processing.
Figure 6.
Timeseries plots of individual pixels representative of average displacement in key areas produced from the results of Sentinel-1 InSAR processing.
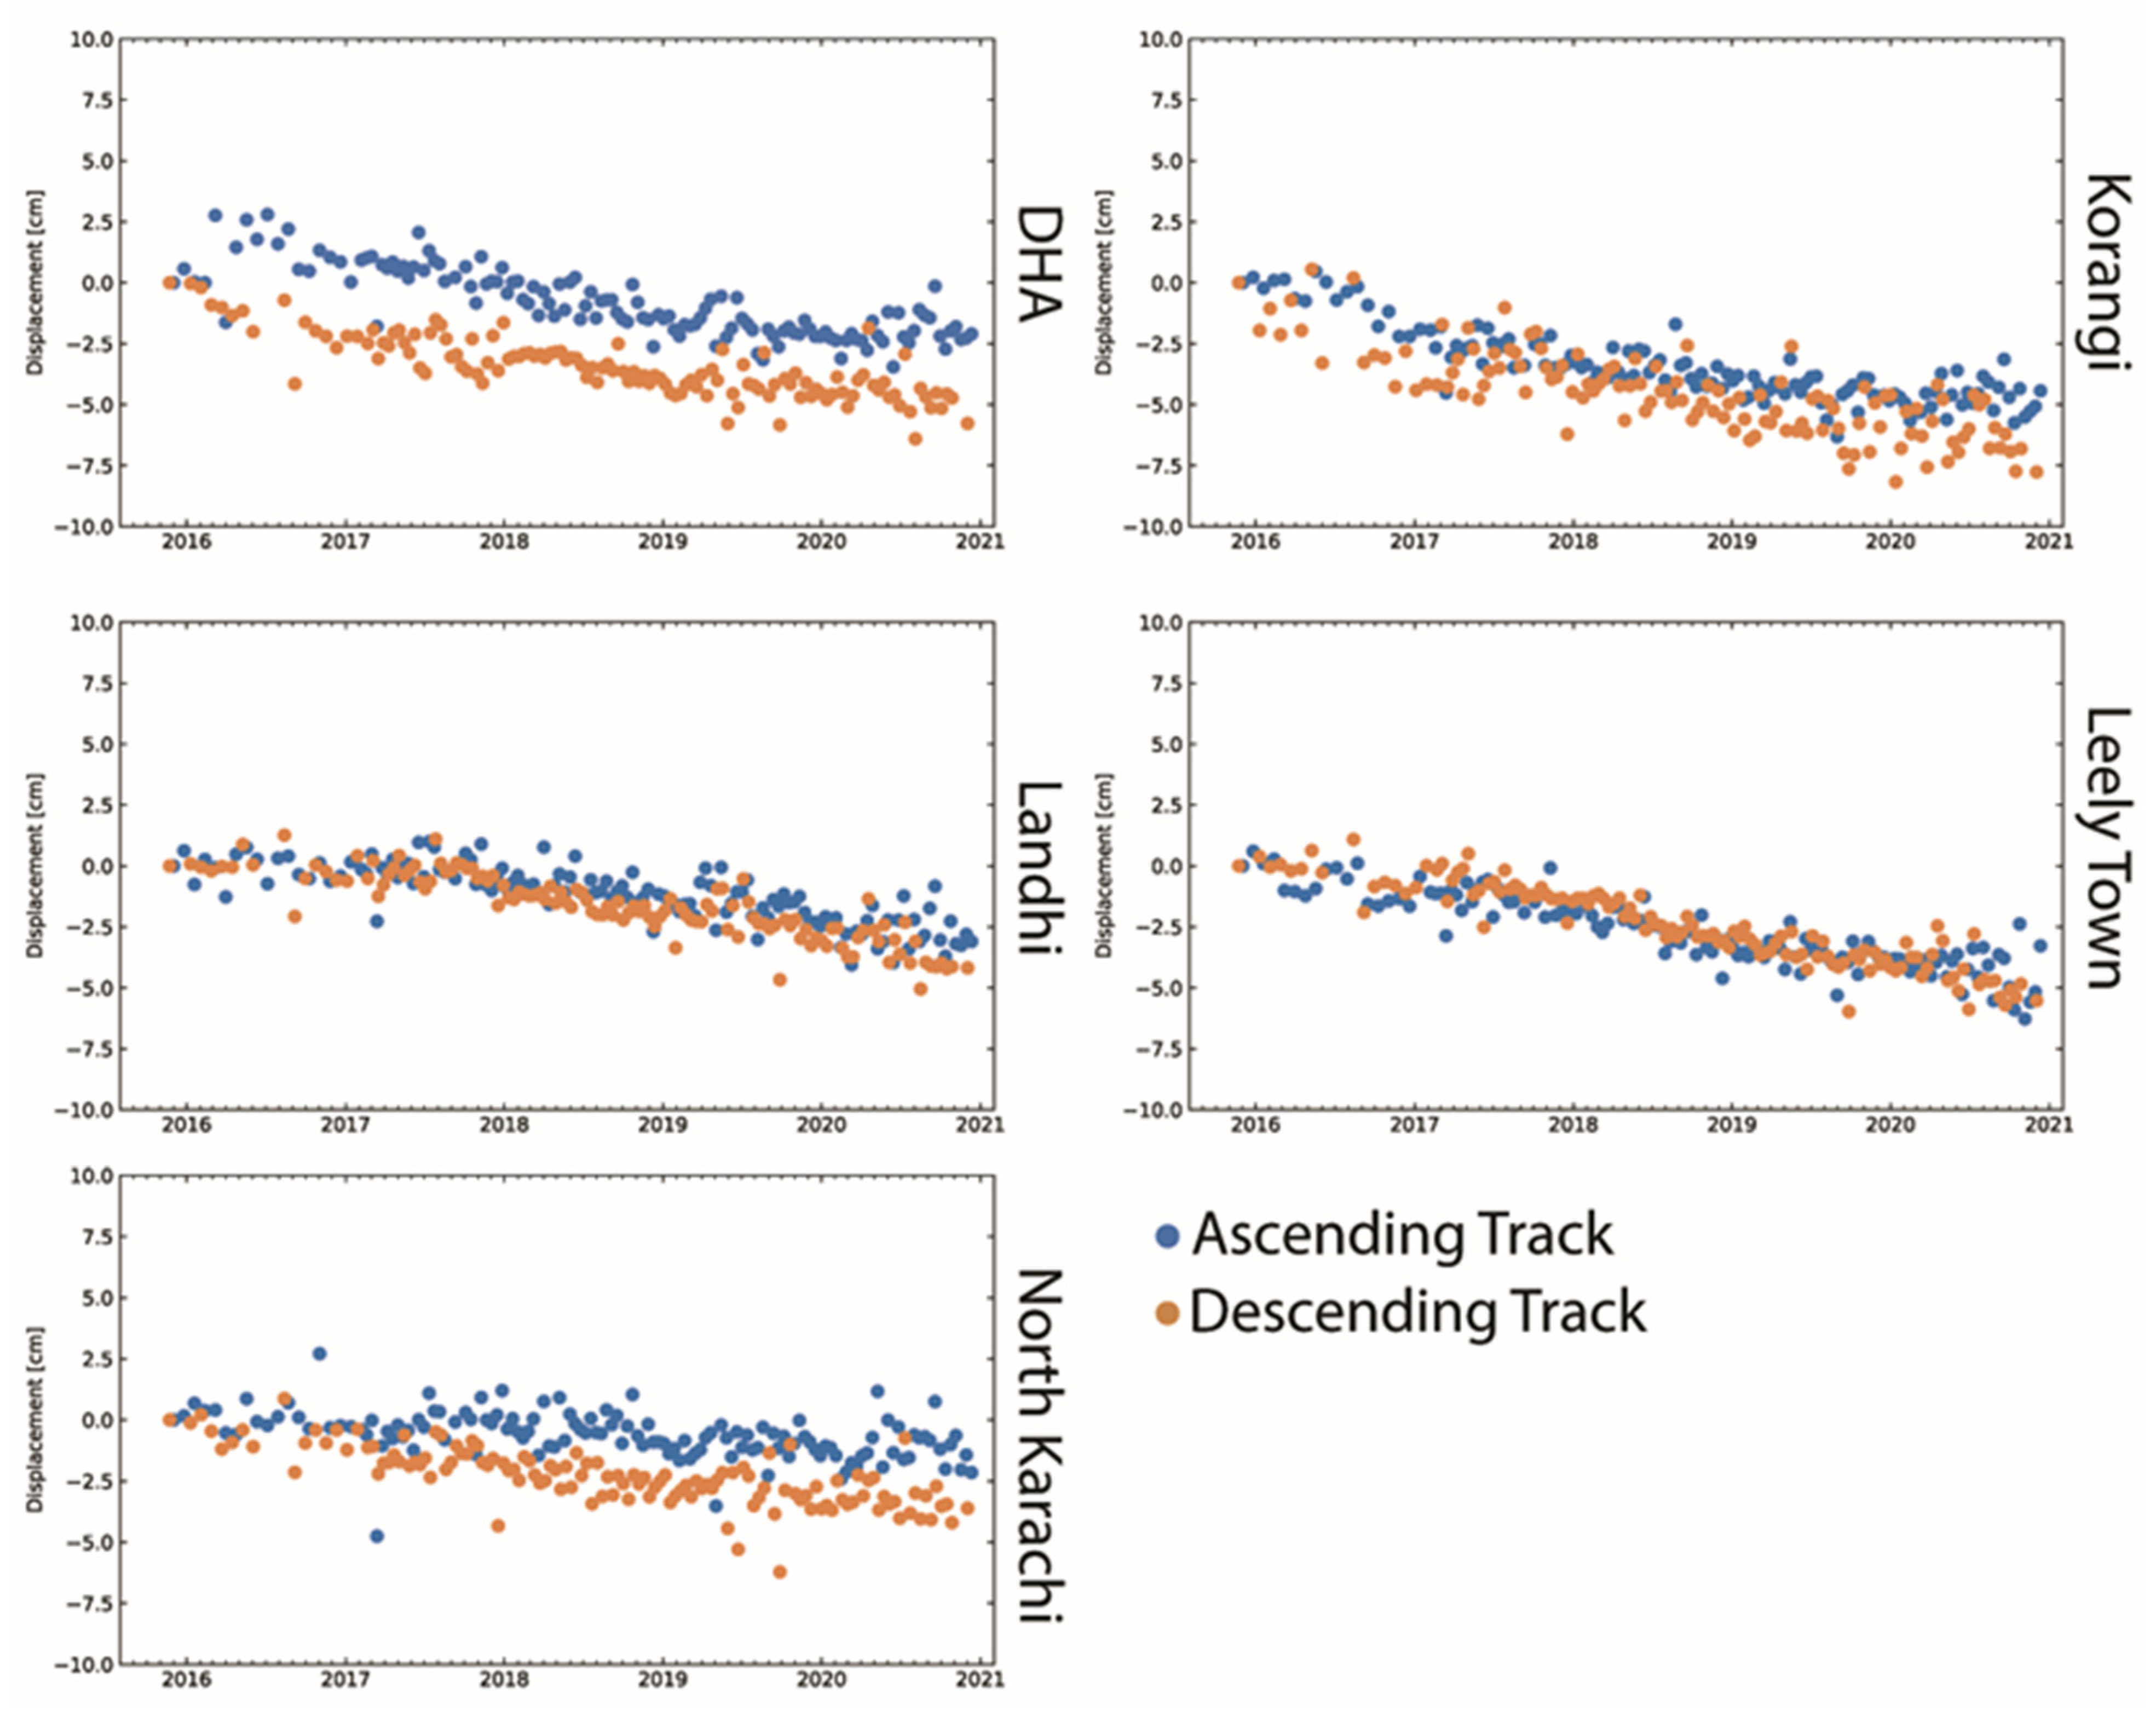
Figure 7.
Transection plots across transition boundary for both ascending and descending track LOS velocity change results. Each plot is denoted with the start and end point (e.g., A to A’) corresponding to the line and direction seen in the map view above.
Figure 7.
Transection plots across transition boundary for both ascending and descending track LOS velocity change results. Each plot is denoted with the start and end point (e.g., A to A’) corresponding to the line and direction seen in the map view above.
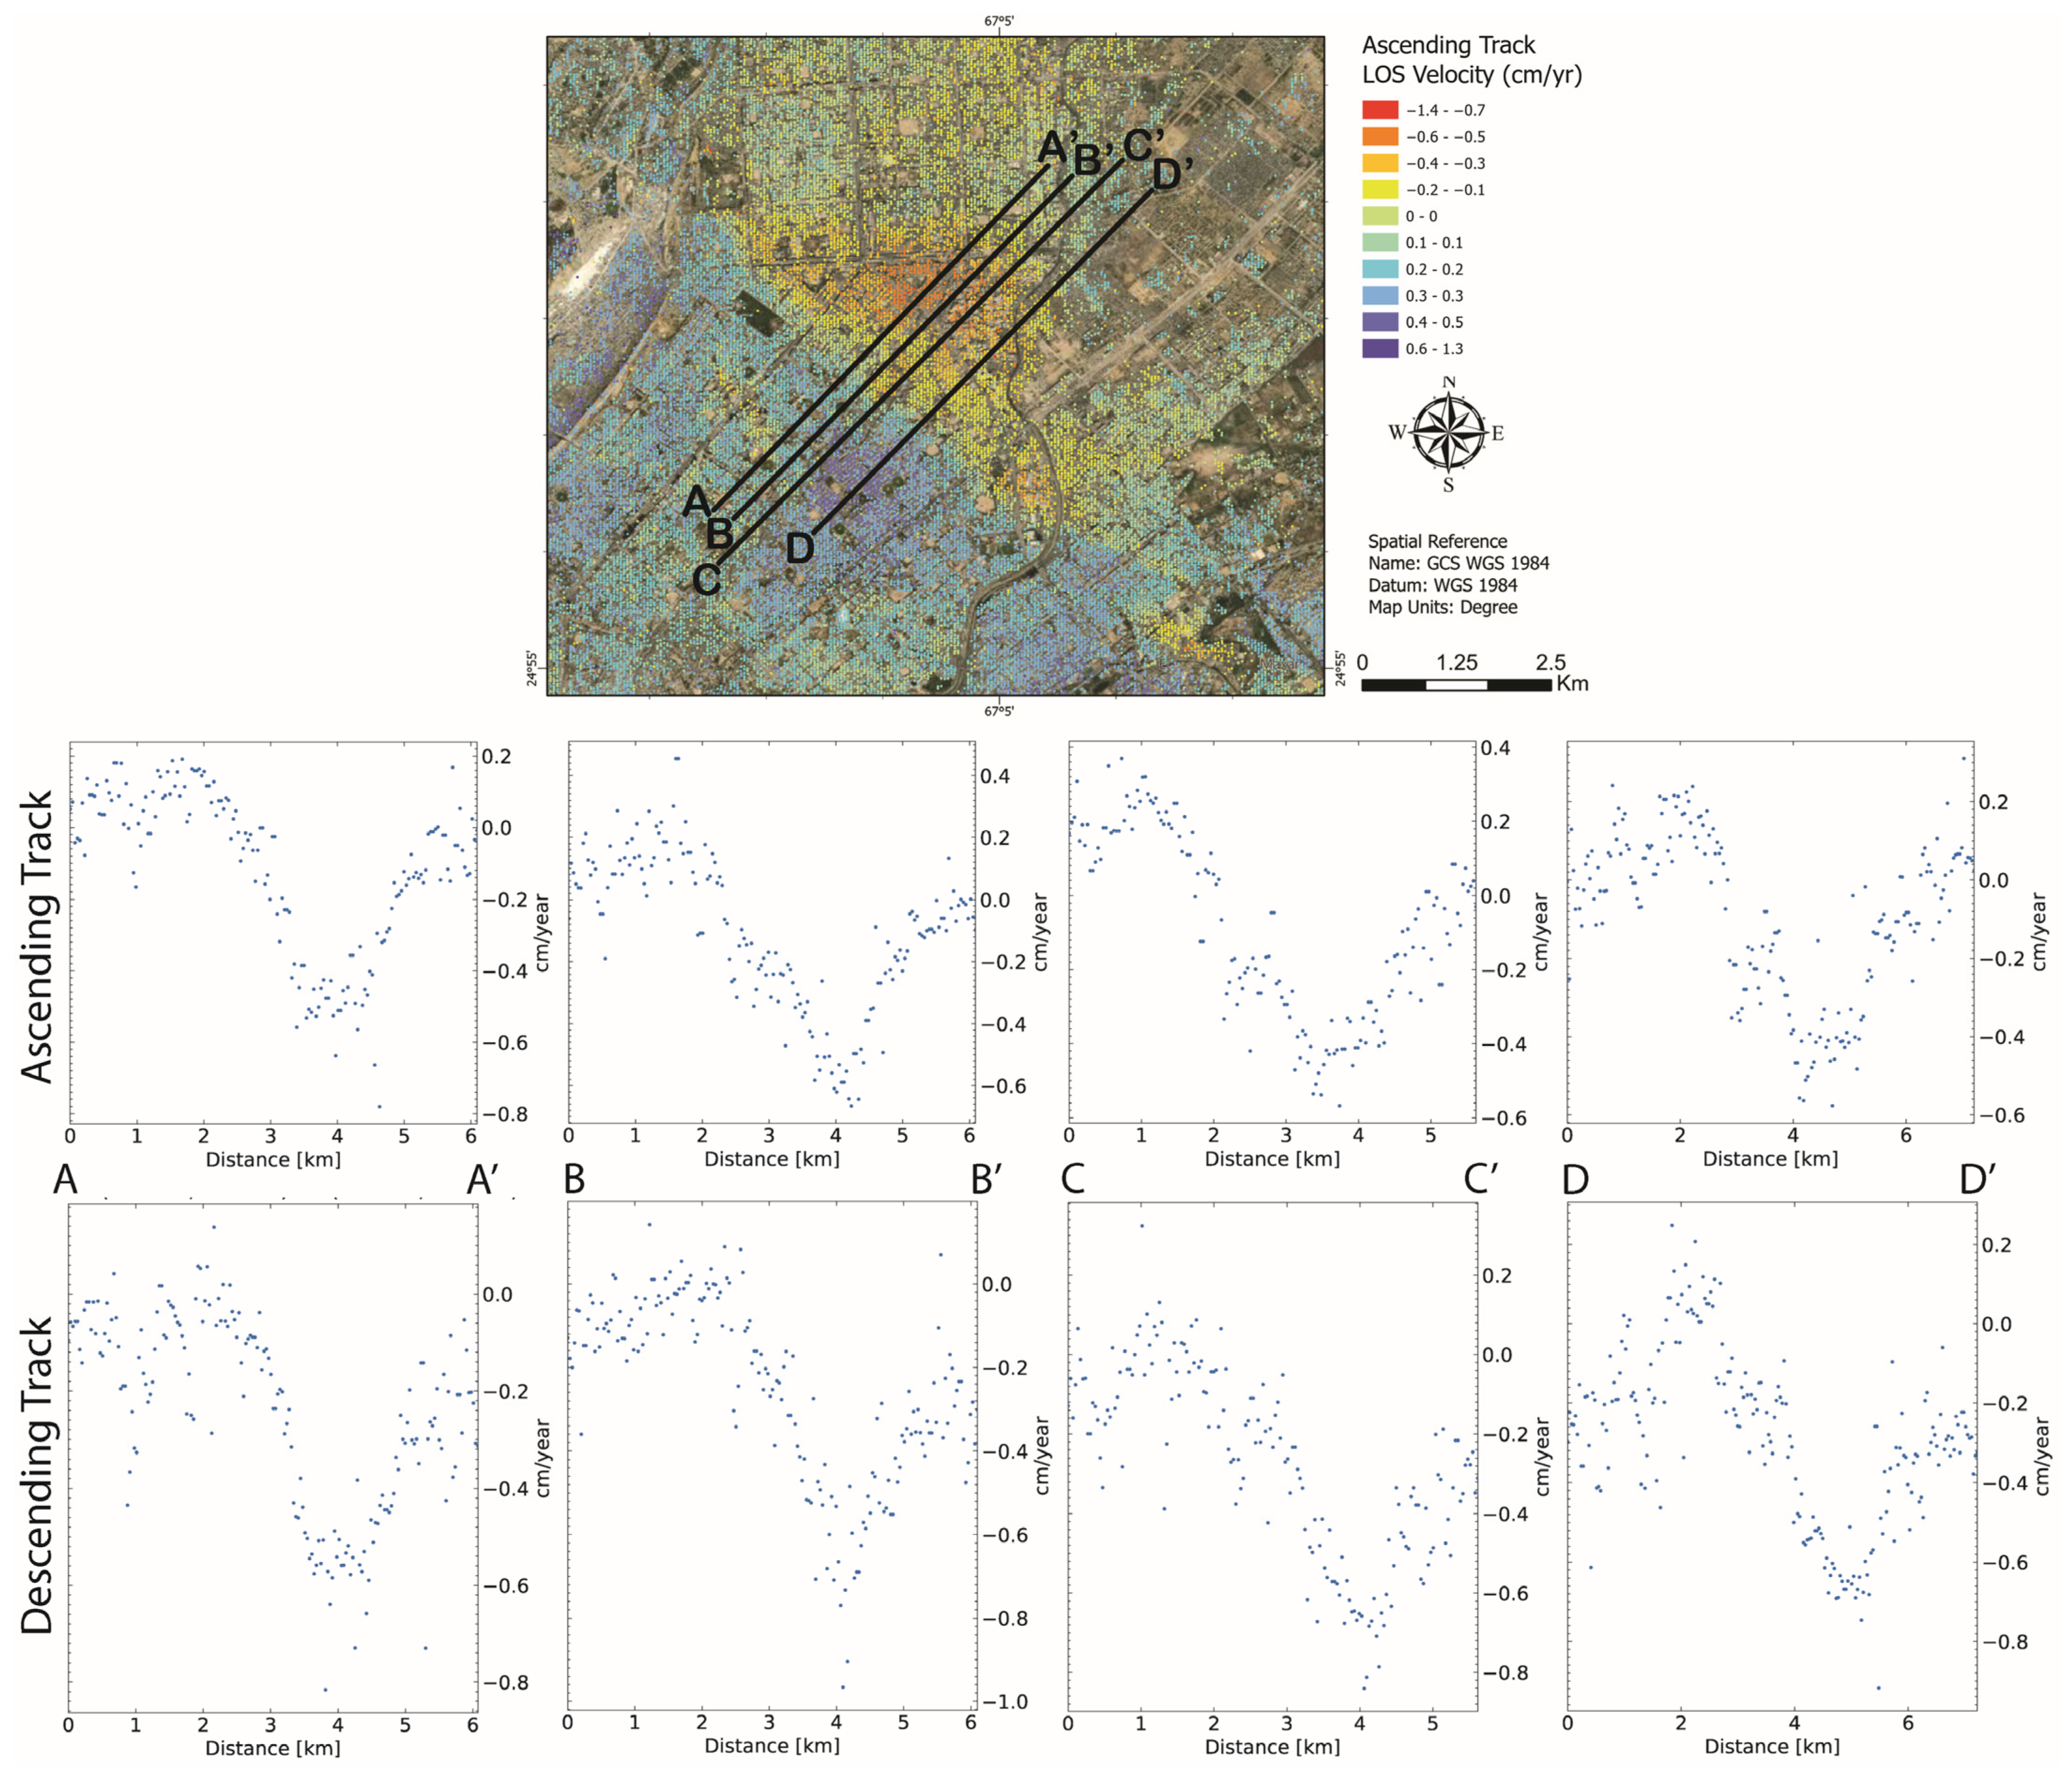
Figure 8.
2D seismic data (left) visualized using quadrature amplitude overlain with variance showing fault (black) and clear reflectors (blue). Google Earth image showing map view of seismic line (right).
Figure 8.
2D seismic data (left) visualized using quadrature amplitude overlain with variance showing fault (black) and clear reflectors (blue). Google Earth image showing map view of seismic line (right).
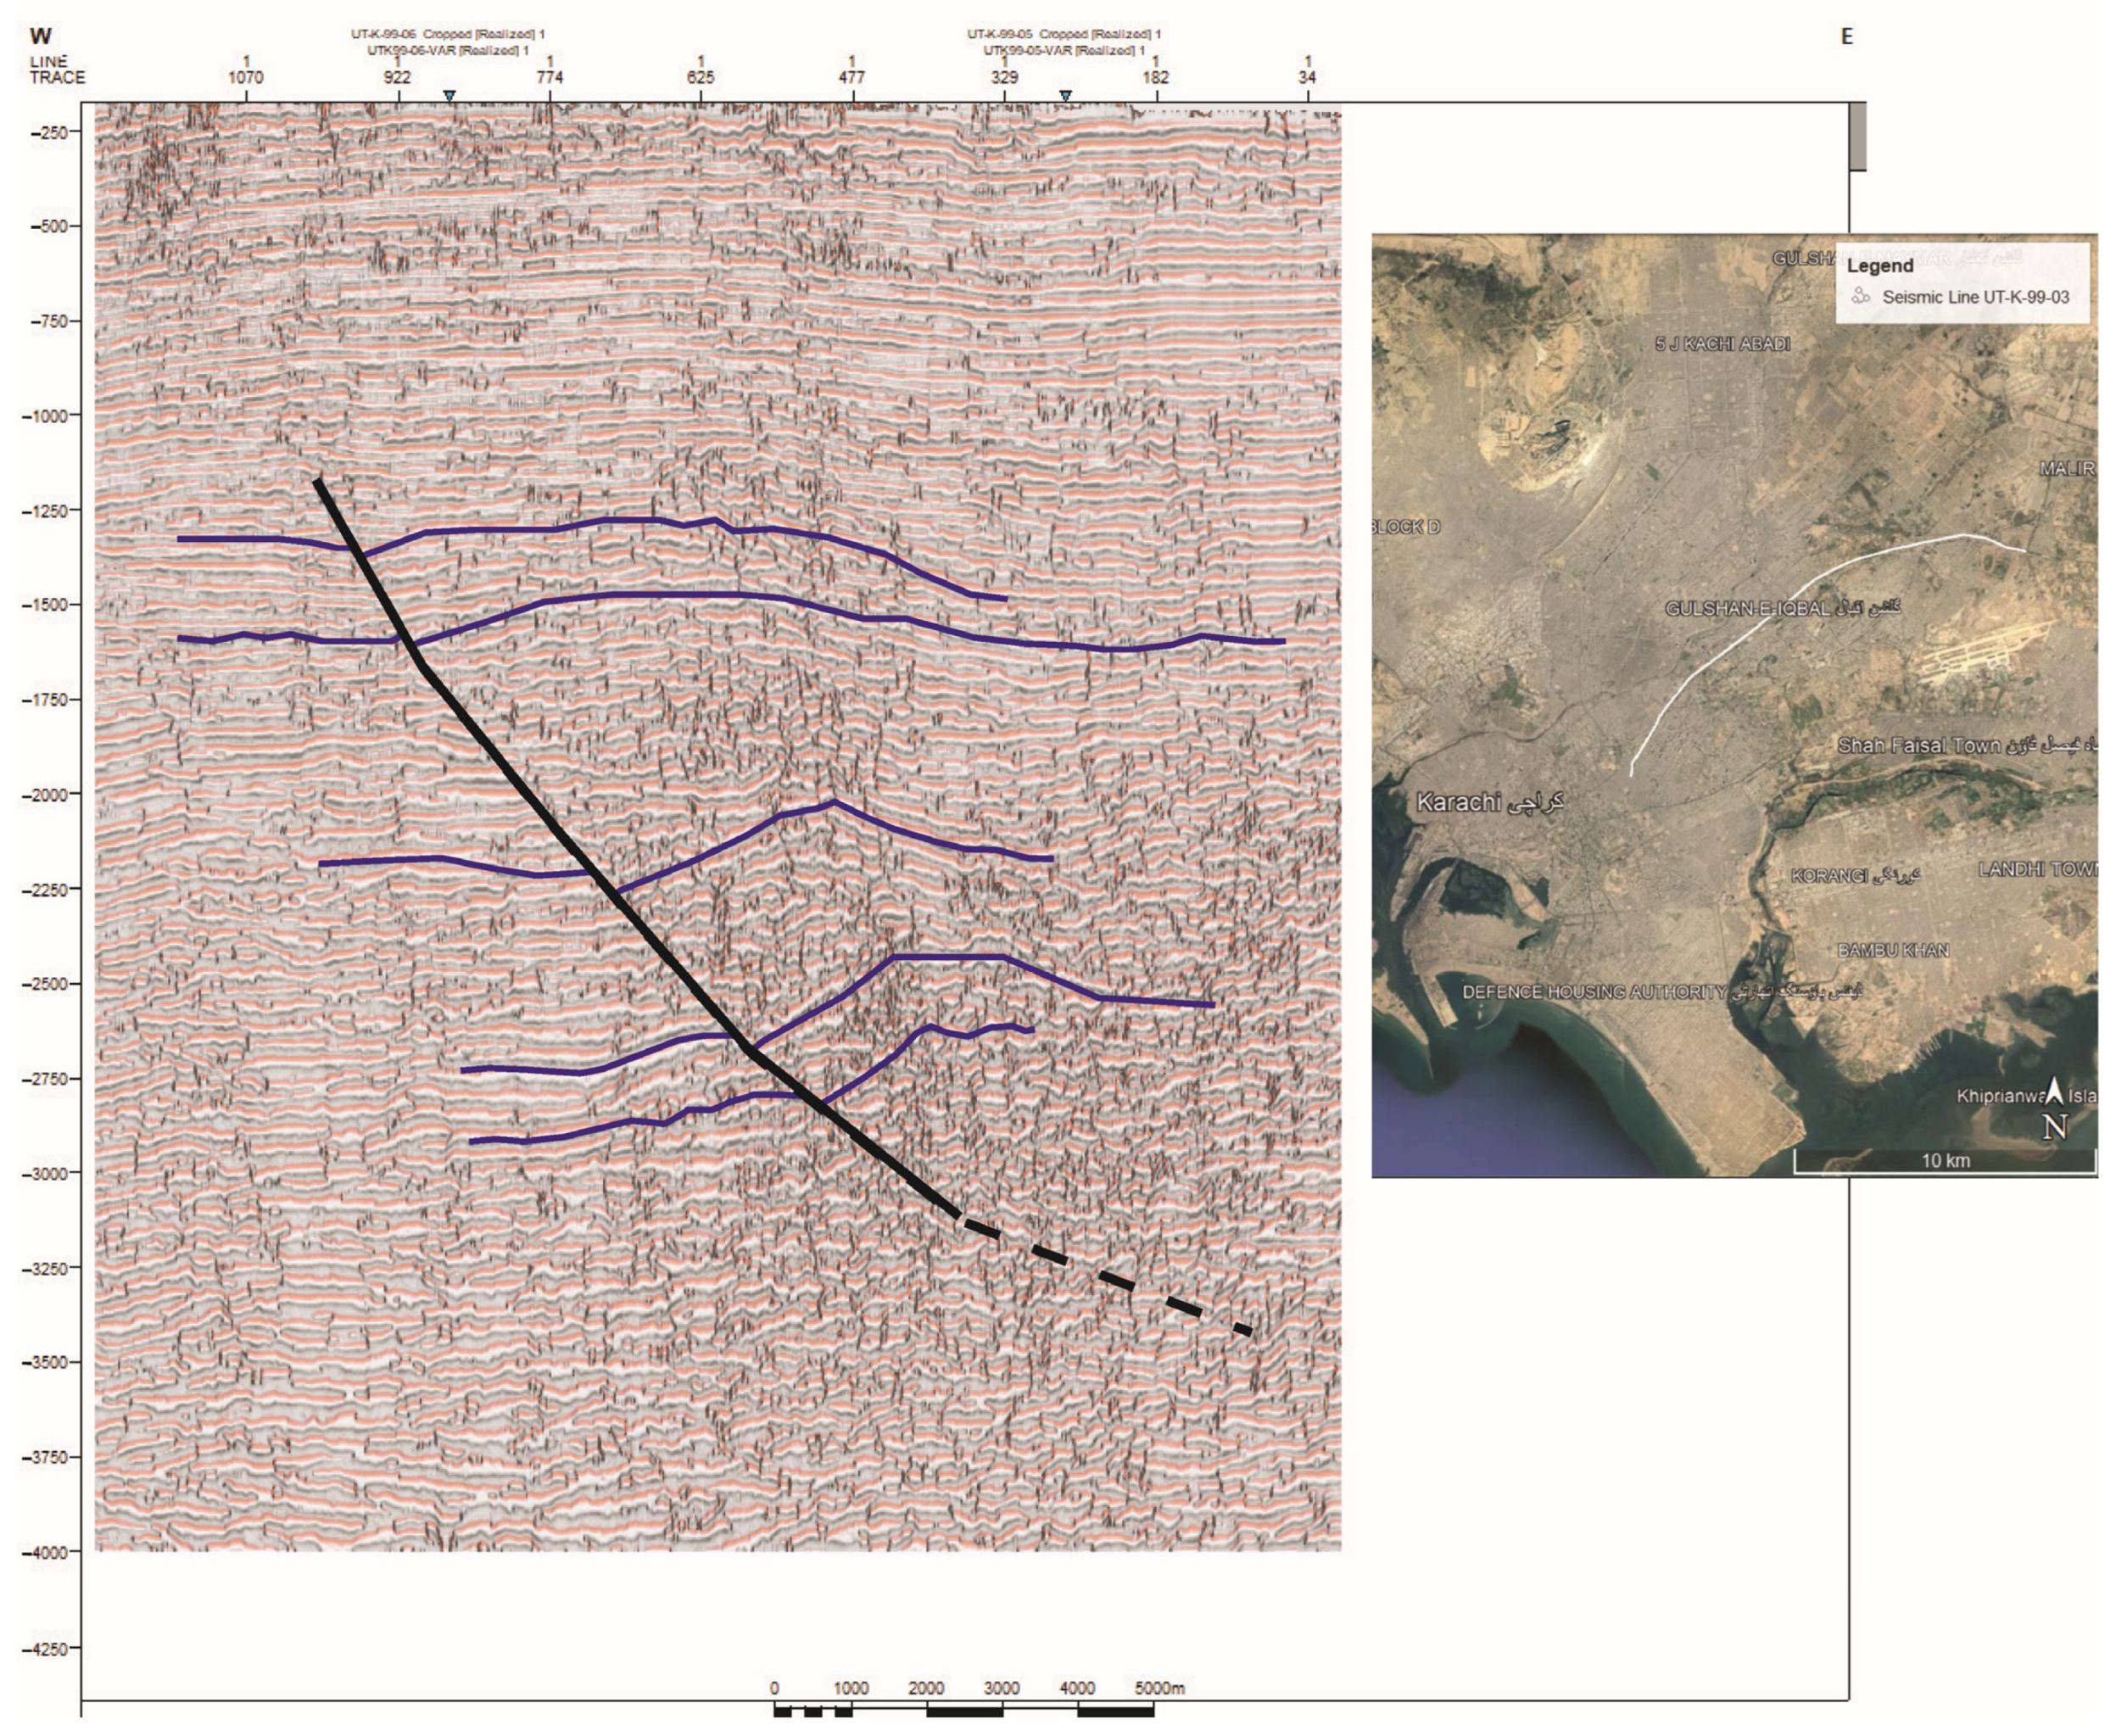
Figure 9.
Water Equivalent Thickness on land in the Karachi region from April 2002 to December 2021.
Figure 9.
Water Equivalent Thickness on land in the Karachi region from April 2002 to December 2021.
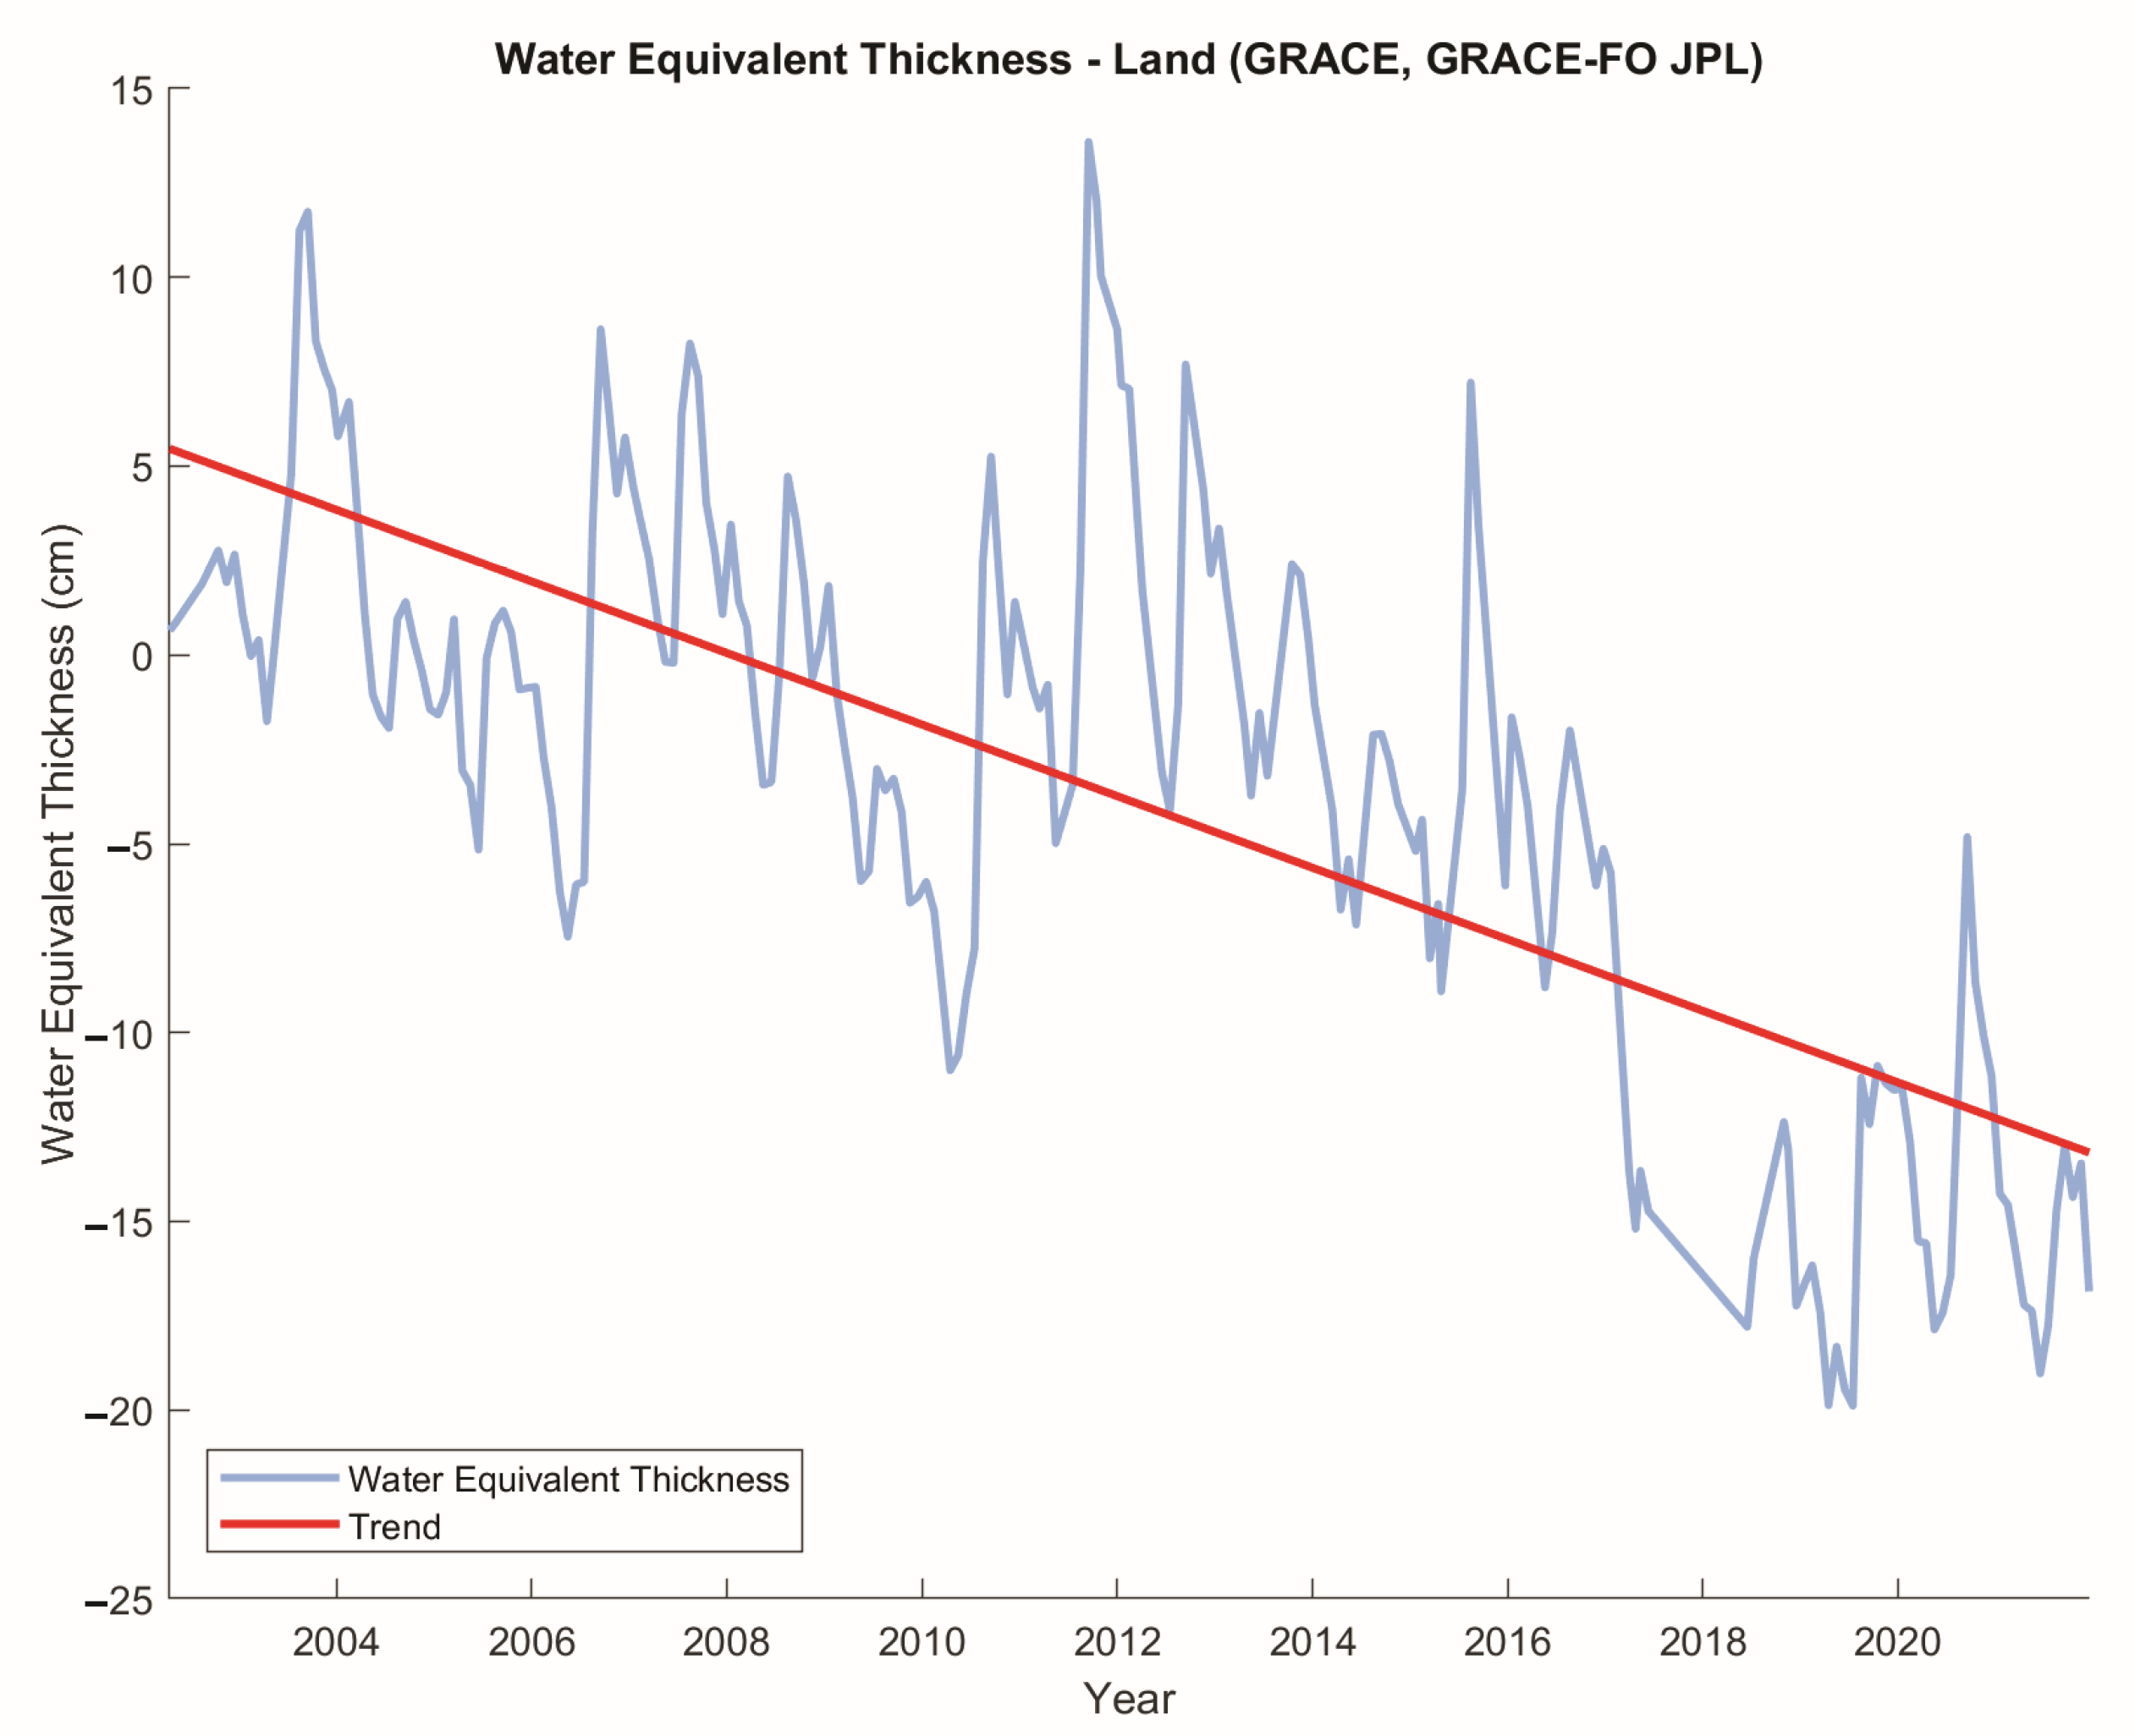
Figure 10.
Extent of Defence landmass over time traced from historical Google Earth imagery.
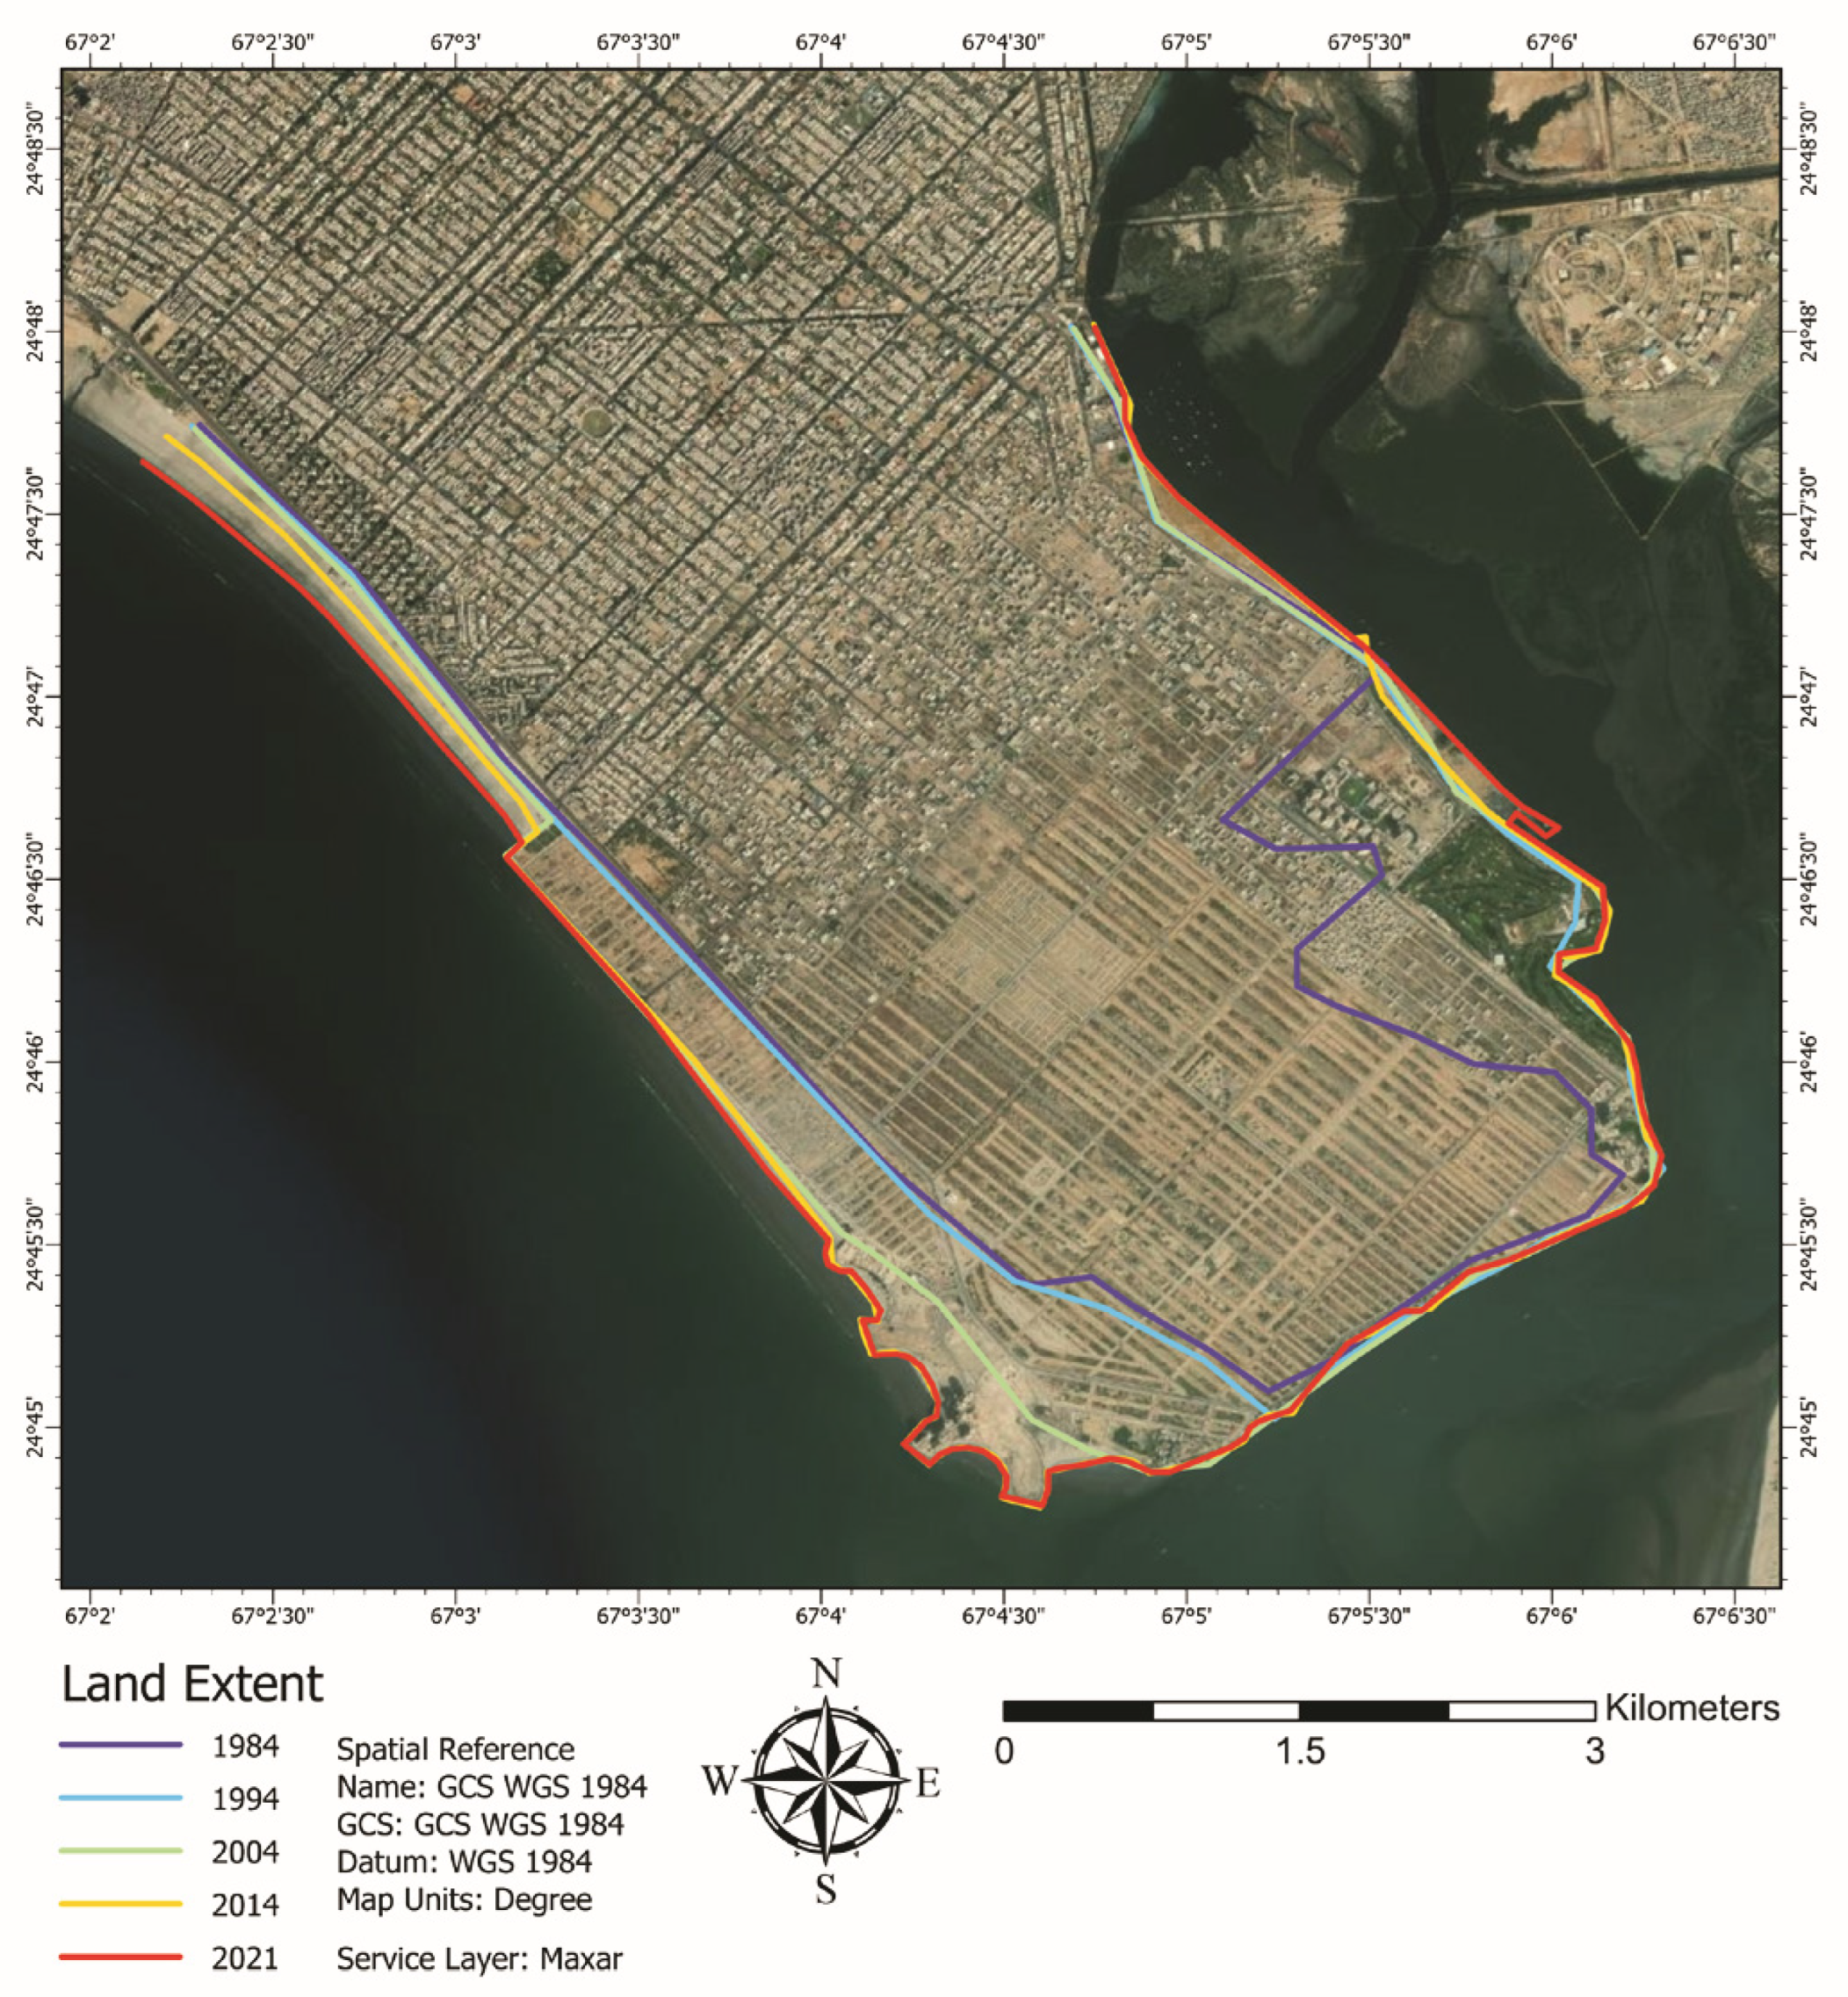
Figure 11.
InSAR gradient created using vertical displacement data.
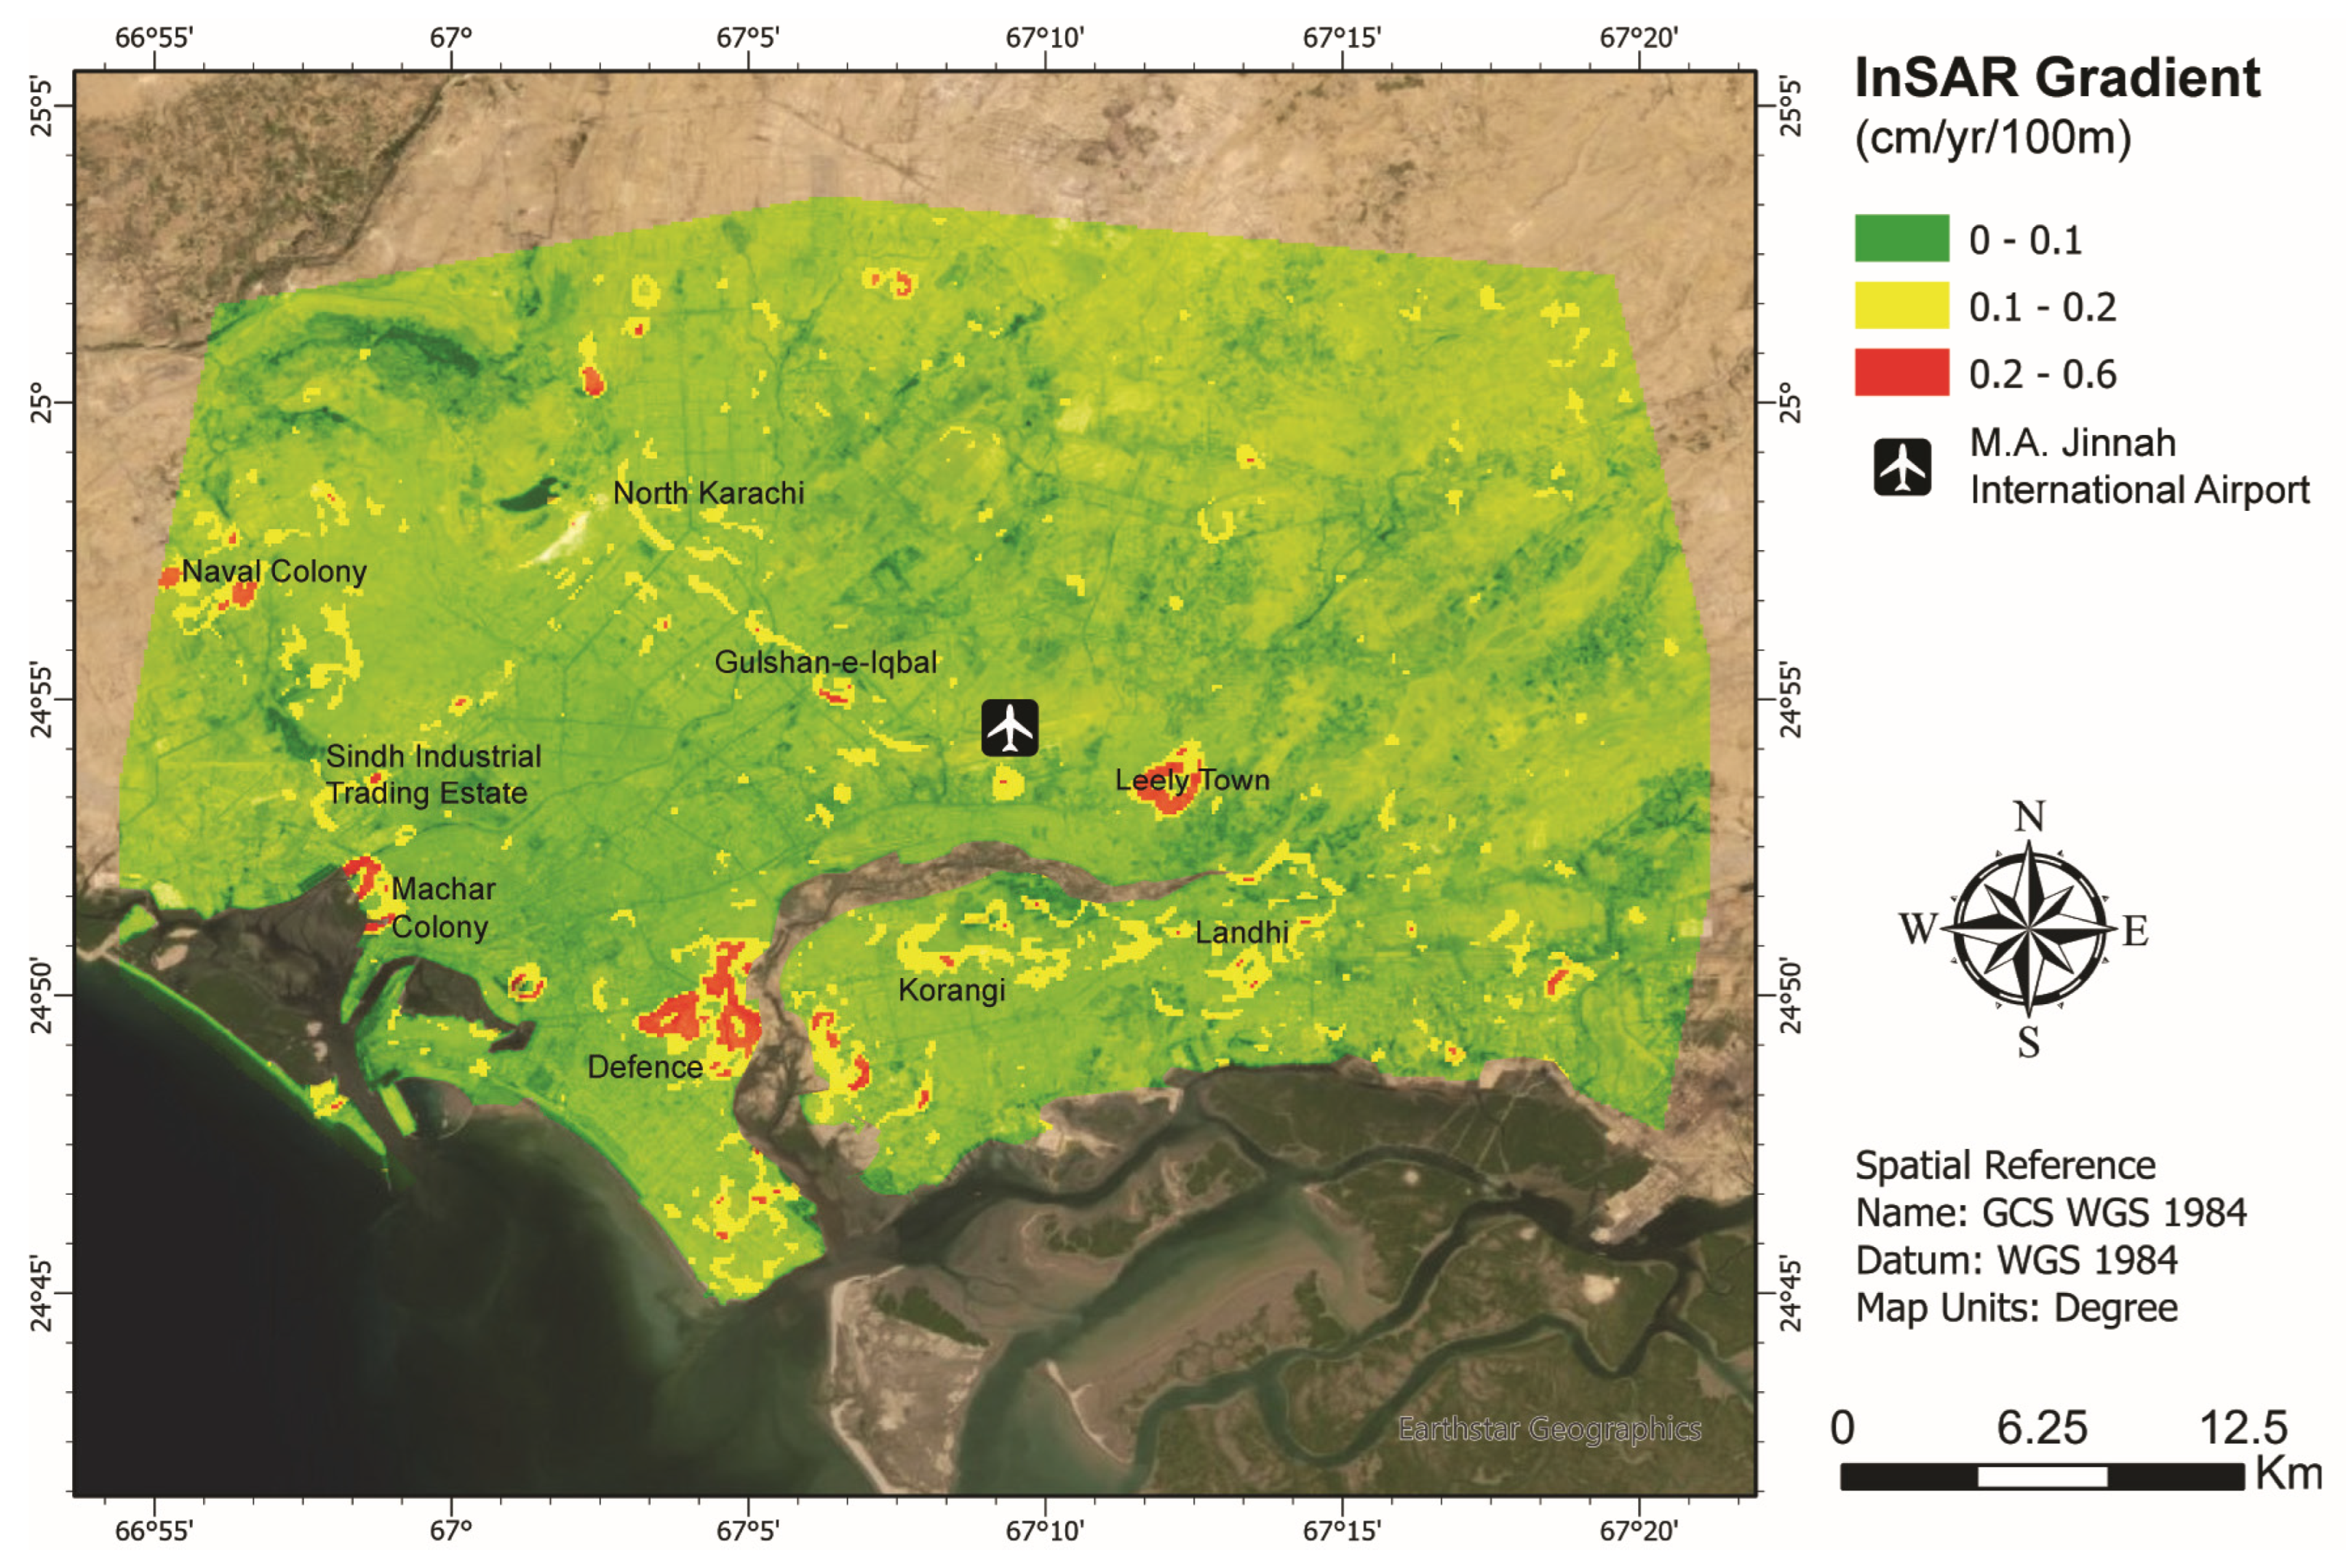
Figure 12.
Unmasked ascending track LOS velocity with areas of consideration highlighted.

Table 1.
Results of GBIS fault modeling.
| Model Parameter | Optimal | Mean | Median | 2.50% | 97.50% |
|---|---|---|---|---|---|
| FAULT Length (m) | 1613.46 | 1604.36 | 1606.11 | 1118.21 | 2020.83 |
| FAULT Width (m) | 6607.99 | 6570.46 | 6579.03 | 6457.62 | 6663.1 |
| FAULT Depth (m) | 6346.15 | 6346.12 | 6346.15 | 6346.15 | 6346.15 |
| FAULT Dip (degrees) | 70.5215 | 70.5207 | 70.5215 | 70.5215 | 70.5215 |
| FAULT Strike (degrees) | 278.13 | 277.919 | 277.892 | 274.49 | 281.444 |
| FAULT X | 7951.54 | 7953.02 | 7949.63 | 7762.89 | 8165.05 |
| FAULT Y | −4609.78 | −4586.25 | −4591.11 | −4636.5 | −4494.37 |
| FAULT Strike Slip (m) | 0.007765 | 0.007765 | 0.007765 | 0.007765 | 0.007765 |
| FAULT Dip Slip (m) | 0.098683 | 0.105138 | 0.101016 | 0.078063 | 0.15472 |
Disclaimer/Publisher’s Note: The statements, opinions and data contained in all publications are solely those of the individual author(s) and contributor(s) and not of MDPI and/or the editor(s). MDPI and/or the editor(s) disclaim responsibility for any injury to people or property resulting from any ideas, methods, instructions or products referred to in the content. |
© 2023 by the authors. Licensee MDPI, Basel, Switzerland. This article is an open access article distributed under the terms and conditions of the Creative Commons Attribution (CC BY) license (https://creativecommons.org/licenses/by/4.0/).
Share and Cite
MDPI and ACS Style
Tirmizi, O.; Khan, S.D.; Mirzaee, S.; Fattahi, H. Hazard Potential in Southern Pakistan: A Study on the Subsidence and Neotectonics of Karachi and Surrounding Areas. Remote Sens. 2023, 15, 1290. https://doi.org/10.3390/rs15051290
AMA Style
Tirmizi O, Khan SD, Mirzaee S, Fattahi H. Hazard Potential in Southern Pakistan: A Study on the Subsidence and Neotectonics of Karachi and Surrounding Areas. Remote Sensing. 2023; 15(5):1290. https://doi.org/10.3390/rs15051290
Chicago/Turabian StyleTirmizi, Osman, Shuhab D. Khan, Sara Mirzaee, and Heresh Fattahi. 2023. "Hazard Potential in Southern Pakistan: A Study on the Subsidence and Neotectonics of Karachi and Surrounding Areas" Remote Sensing 15, no. 5: 1290. https://doi.org/10.3390/rs15051290
Note that from the first issue of 2016, this journal uses article numbers instead of page numbers. See further details here.