Article

A Comprehensive Evaluation of Flooding’s Effect on Crops Using Satellite Time Series Data

1
College of Land Science and Technology, China Agricultural University, Beijing 100083, China
2
Key Laboratory of Remote Sensing for Agri-Hazards, Ministry of Agriculture and Rural Affairs, Beijing 100083, China
3
School of Natural and Applied Sciences, Sol Plaatje University, Kimberley 8301, South Africa
4
Qilu Aerospace Information Research Institute, Jinan 250100, China
*
Author to whom correspondence should be addressed.
Remote Sens. 2023, 15(5), 1305; https://doi.org/10.3390/rs15051305
Submission received: 27 January 2023 / Revised: 24 February 2023 / Accepted: 24 February 2023 / Published: 26 February 2023
(This article belongs to the Special Issue Crop Quantitative Monitoring with Remote Sensing)

Abstract

:
In July 2021, a flooding event, which attracted the attention of the whole country and even the world, broke out in Henan, resulting in dramatic losses across multiple fields (e.g., economic and agricultural). The basin at the junction of Hebi, Xinxiang, and Anyang was the most affected region, as the spread of water from the Wei river submerged surrounding agricultural land (e.g., corn-dominated). To comprehensively evaluate the flooding impacts, we proposed a framework to detect the flooding area and evaluated the degree of loss using satellite time series data. First, we proposed a double-Gaussian model to adaptively determine the threshold for flooding extraction using Synthetic Aperture Radar (SAR) data. Then, we evaluated the disaster levels of flooding with field survey samples and optical satellite images. Finally, given that crops vary in their resilience to flooding, we measured the vegetation index change before and after the flooding event using satellite time series data. We found the proposed double-Gaussian model could accurately extract the flooding area, showing great potential to support in-time flooding evaluation. We also showed that the multispectral satellite images could potentially support the classification of disaster levels (i.e., normal, slight, moderate, and severe), with an overall accuracy of 88%. Although these crops were temporarily affected by this flooding event, most recovered soon, especially for the slightly and moderately affected regions. Overall, the distribution of resilience of these affected crops was basically in line with the results of classified disaster levels. The proposed framework provides a comprehensive aspect to the retrospective study of the flooding process on crops with diverse disaster levels and resilience. It can provide rapid and timely flood damage assessment and support emergency management and disaster verification work.

1. Introduction

A series of heavy precipitation events caused the Henan flood in July 2021. On and after 17 July 2021, continuous heavy precipitation dominated Zhengzhou, Kaifeng, Xinxiang, Hebi, Anyang, and other places in Henan Province, causing infrequent and catastrophic floods with many casualties and injuries. The Zhengzhou weather station reported that the maximum hourly rainfall reached 201.9 mm, and around 19 national-level meteorological stations exceeded the highest daily rainfall since the establishment of stations. The maximum daily precipitation at Zhengzhou National Meteorological Station was 624.1 mm, which is close to the annual average precipitation (640.8 mm) of the station, and the maximum hourly rain intensity was as high as 201.9 mm, which is close to 1/3 of the annual average precipitation of Zhengzhou, breaking the historical record of China’s inland meteorological observation [1,2]. The torrential rain caused severe floods in many parts of Zhengzhou and surrounding areas. This flooding with heavy rain led to a total of 14.8 million people affected, of which 389 people died. The direct economic loss was estimated to be above 120 billion RMB. Flooding has profound physical and mental impacts on people, especially those whose houses and farms are destroyed [3,4].
With the advent of remote sensing and geographical information science, in-time monitoring and evaluation of flooding and its impacts have become possible [5,6,7]. Rapid acquisition of flood information using satellite observations with scientific evaluation of disaster loss can promote rapid emergent responses to flooding. Thus, extracting water bodies from satellite images is essential in flooding disaster monitoring and evaluation. Although optical satellite images are rich in terms of spectral information [8,9], it is expected that minimal satellite images are available due to the contamination of clouds and rain, failing the task of in-time monitoring of flooding. On the contrary, Synthetic Aperture Radar (SAR) satellite observations can penetrate the cloud and rain with clear images. Therefore, they are the primary data source for water detection during flooding [10].
Many studies have been carried out using backscatter from SAR data for flooding mapping. Ref. [11] found that the brightness of submerged areas (e.g., roads, squares, and other open areas) is diminished compared to the status before flooding due to the reduction of the scattering coefficient. Ref. [12] also pointed out that when the dry, bare soil is flooded, the SAR-derived backscatter coefficient drops suddenly, making it easier to be identified from satellite images. Presently, the relationship between backscatter coefficients from SAR data and the degree of flooding has not been comprehensively evaluated, especially in terms of automatic optical threshold determination for in-time flooding monitoring. Changes in backscatter coefficients of ground objects before and after the flooding can be well characterized by the SAR images. This proposes new challenges in automatic flood area extraction from multi-temporal SAR images.
Unlike other disasters (e.g., heat waves), flooding shows a typical intermediate effect within a couple of hours. That is, the duration of heavy rain is not long, and the disaster degree is heterogenous across spaces [13,14,15,16,17]. At the same time, bad weather during a disaster event (e.g., clouds and rains) presents challenges for optical satellite images [18,19], because satellite images acquired under these weather conditions are always associated with relatively poor quality. This limitation can be complemented by SAR images [20,21,22].
Many SAR-based studies for flood monitoring have been carried out [23]. It is worth noting that most of these studies only focus on the changes in the water area, with limited efforts in exploring the impact of flooding on crops, especially considering the differences in damage degree [24,25], although this is crucial for risk management and mitigation. Existing studies of flooding-induced agricultural impacts mainly focus on one single epoch, lacking a systematic perspective to study the resilience of agriculture to the flood disaster itself [26,27]. It is essential to conduct a comprehensive and systematic evaluation of flooding impacts on agricultural lands [28]. For instance, by analyzing the resilience of crops to floods, it is possible to further evaluate the potential loss of yield by tracking the vegetation growth instead of simply evaluating the crop status when the flooding event occurs [29].
In this study, we took the 2021 Henan flooding event as an example and evaluated the disaster degree and the resilience of impacted crops (i.e., corn). We chose the junction area of Hebi, Xinxiang, and Anyang as our study area. First, we mapped the flooding extent using multi-temporal SAR data. Then, we assessed the impact of flooding on crops with outcomes of mapped damage degree. Finally, we evaluated the resilience of flooding-impacted crops by combining long-term satellite remote sensing images. The remainder of this paper is organized as follows: Section 2 introduces the study area and datasets; Section 3 describes the details of the proposed method; Section 4 presents the results with discussion; and the concluding remarks are provided in Section 5.

2. Study Areas and Datasets

We chose the junction area of Hebi, Xinxiang, and Anyang as our study area, which was the most severely affected area in Henan (Figure 1). It is composed of plains, basins, and mountains. Since 17 July 2021, this area has experienced continuous heavy rains, resulting in dramatic flooding. Due to the impact of the mountains in the northwest corner, the rainwater flowed down and gathered in the basin area at a lower elevation. This region was determined by the watershed algorithm based on the digital elevation model (DEM). Therefore, the selected study area is rational choice, as it experienced extensive flooding during this event, making it a good candidate to evaluate our proposed monitoring and evaluation framework.
We collected multiple-source satellite observations to evaluate the flooding-induced crop loss and crop resilience. The adopted satellite observations can be divided into two categories. The first comprises SAR images. We collected all Sentinle-1 SAR images during the flooding week (i.e., 20–27 July 2021) on the Google Earth Engine (GEE) platform to obtain approximate intermediate flooding extents. Due to the cloudy weather during flooding periods, optical satellite images are commonly unavailable. The SAR images are the primary data sources we used in this study. The other group of satellite observations is the optical images derived from the Sentinel-2 and Landsat data. For these datasets, the radiance, atmosphere, and terrain collections were performed in advance, with clouds and shadows removed. In addition, we harmonized the Sentile-2 and Landsat images to composite the harmonized time series data. The optical images were used for two purposes: for collecting samples to represent different damage severity, and to measure the resilience of crops after a certain period. We also collected the crop data layer in 2021 in Henan and field-collected samples during the flooding event.
In addition, we also collected field-surveyed samples during the flooding event, as promoted by the Department of Emergency Management of China, for loss evaluation. Through visually inspecting the in situ damage situation and conducting field surveys of local farms, we evaluated the damage degree of crops and collected the sample set for disaster-level classification. The fieldwork involves on-the-spot surveys, visits, and photographic evidence, to collect adequate and helpful information, such as the submerged range, submerged depth, and submerged duration (Figure 2). After that, we built the sample database, which includes the geographical location, damage degree, and photos as supports. This dataset can be used as training samples for damage degree classification.

3. Methodology

We evaluated the damage degree and the resilience of crops using the proposed framework below (Figure 3). First, we identified the approximate immediate water extent before and after the flooding using multi-temporal SAR images (Figure 3a). A self-adaptive approach with the double Gaussian model was proposed during this step to identify the optical threshold for water extent mapping. Then, by jointly using field-collected survey data and the optical images from the Sentinel-2 observations, we mapped the damage degree of crops (i.e., slight, medium, and severe) caused by the extreme flooding event (Figure 3b). Finally, we evaluated the resilience of crops (i.e., corn) to the flooding by quantifying the recovery of crop growth in regions with different damage degrees (Figure 3c). In addition, influencing factors that were relevant to the crop resilience were discussed. Details of each component can be found in the following sections.

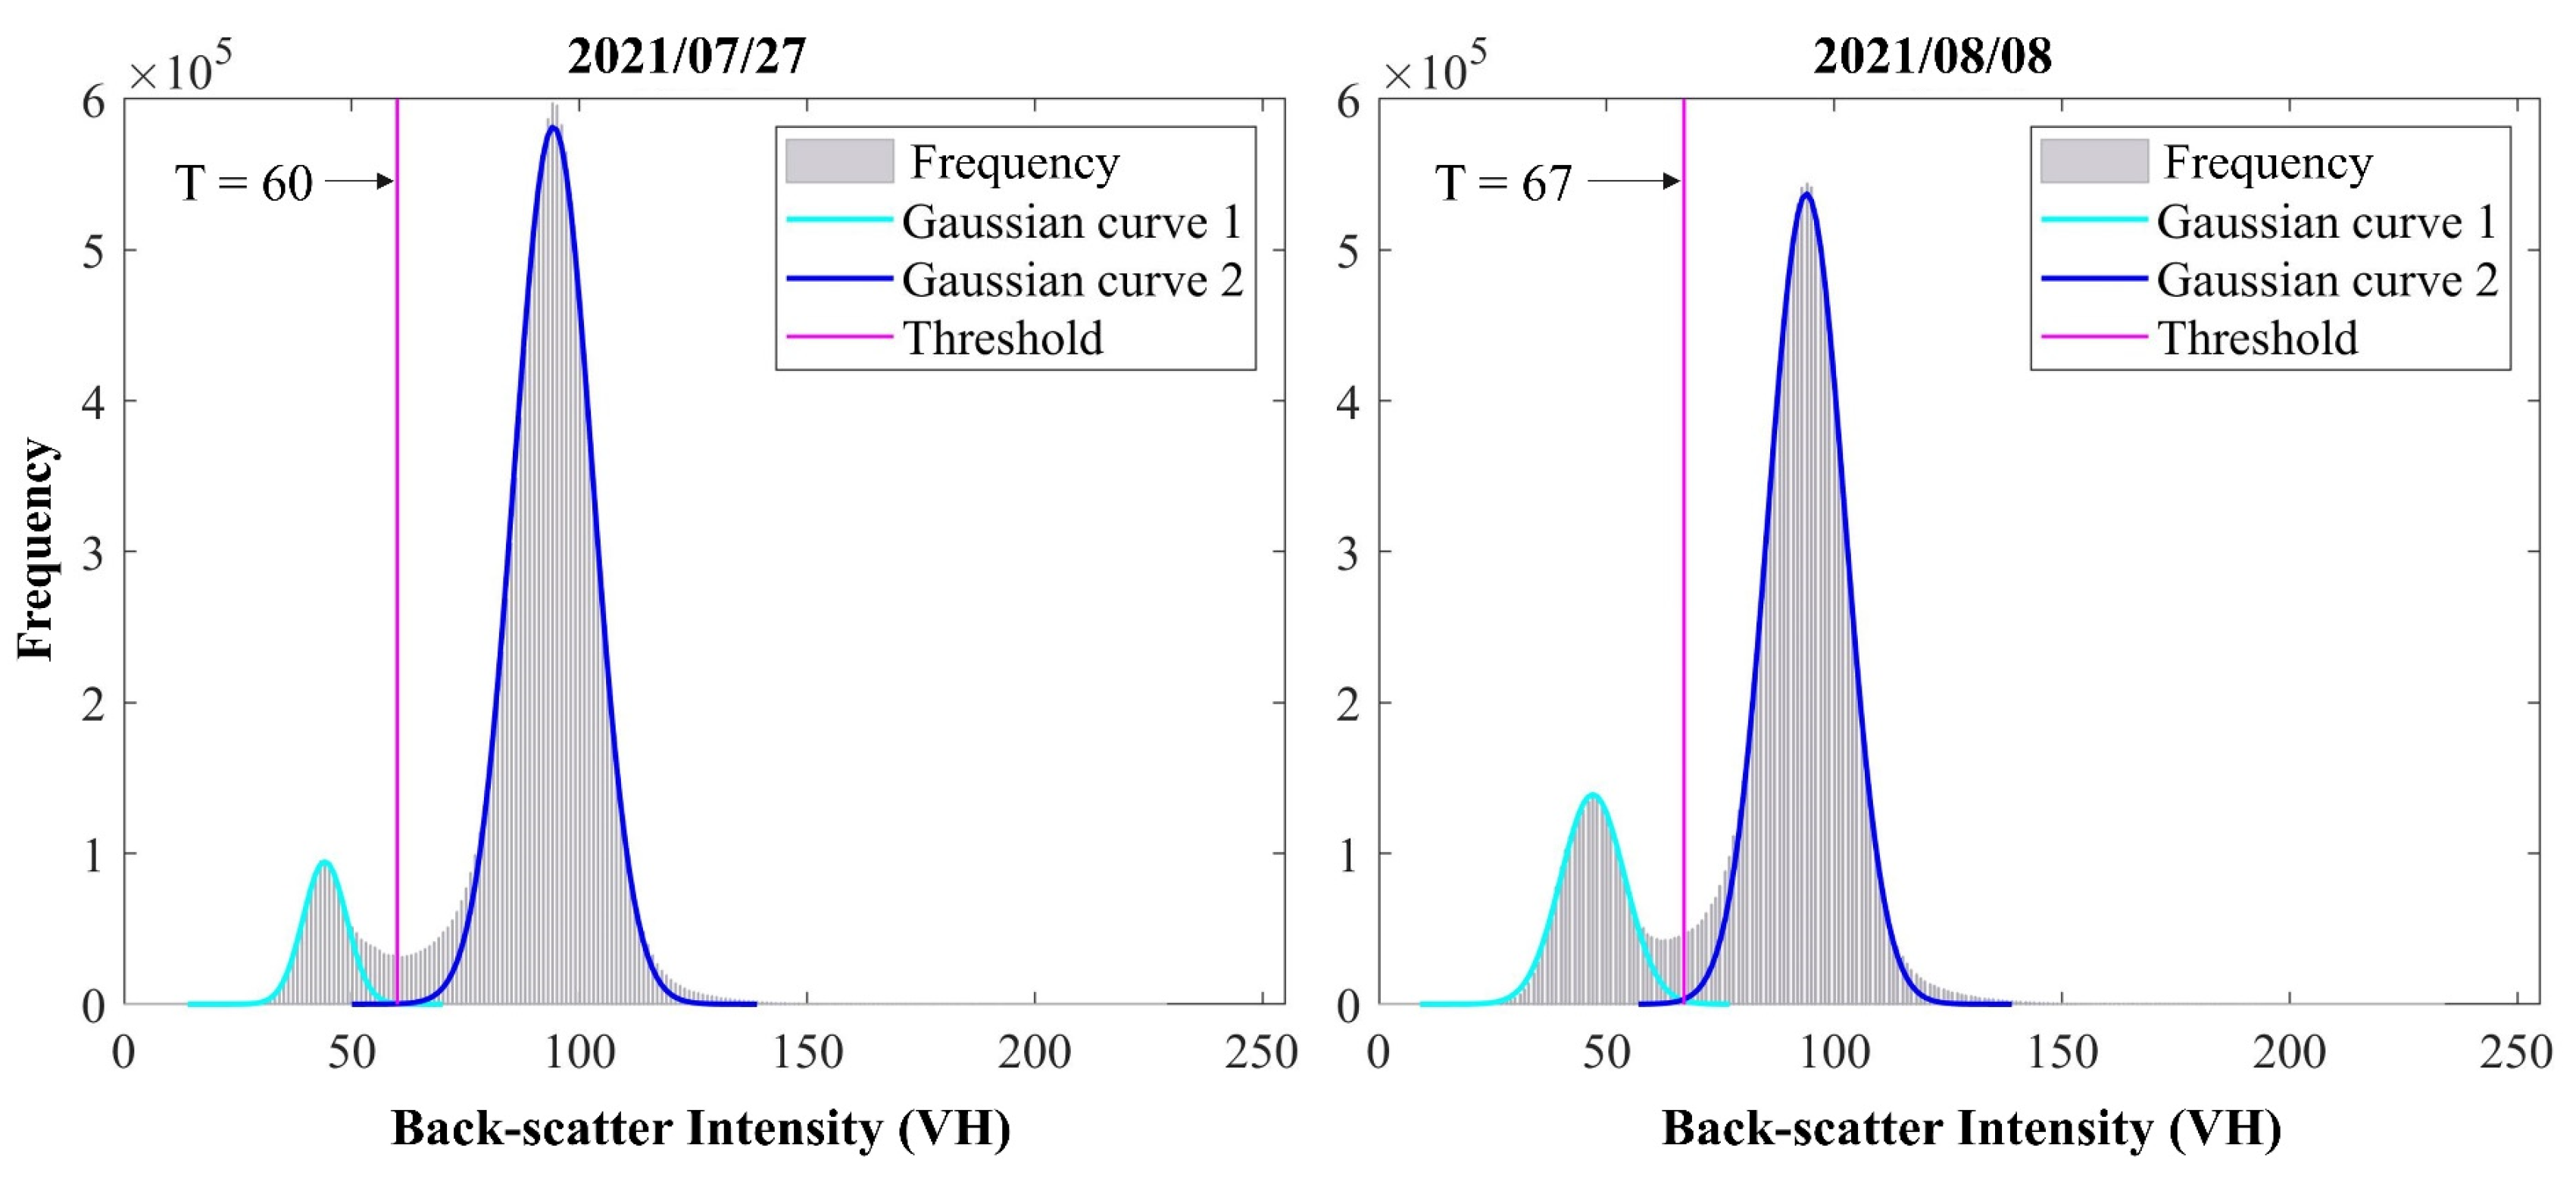
3.1. Mapping Immediate Flooding Extent Using Multi-Source SAR Images

We used multi-temporal SAR data to composite the images before and after the flooding event. We derived the level-1 Sentinel-1 GRD data [30] product through the Google Earth Engine (GEE) platform. The adopted data were preprocessed sequentially with thermal noise removal, radiometric calibration, and terrain correction. We collected Sentinel-1 SAR images during the flooding event time. First, we collected the Sentinel-1 data to composite the image before the flooding. Thus, the extent of the flooding area could be extracted from the composited SAR images from these two epochs (i.e., 27 July and 8 August). Then, we proposed a double-Gaussian approach to identify the optimal threshold for water extraction from SAR images [31]. We extended the river with buffers (i.e., 5 km) to locate potential influencing areas. After that, we implemented a double-Gaussian model to characterize the flooding and non-flooding areas (see Figure 4). In general, backscatters from the SAR images in flooding areas are notably lower than the non-flooding regions, and their values in these two areas can be quantitatively expressed as two Gaussian models. Thus, the interaction between these two curves was commonly regarded as the optimal threshold to separate the flooding and non-flooding regions.

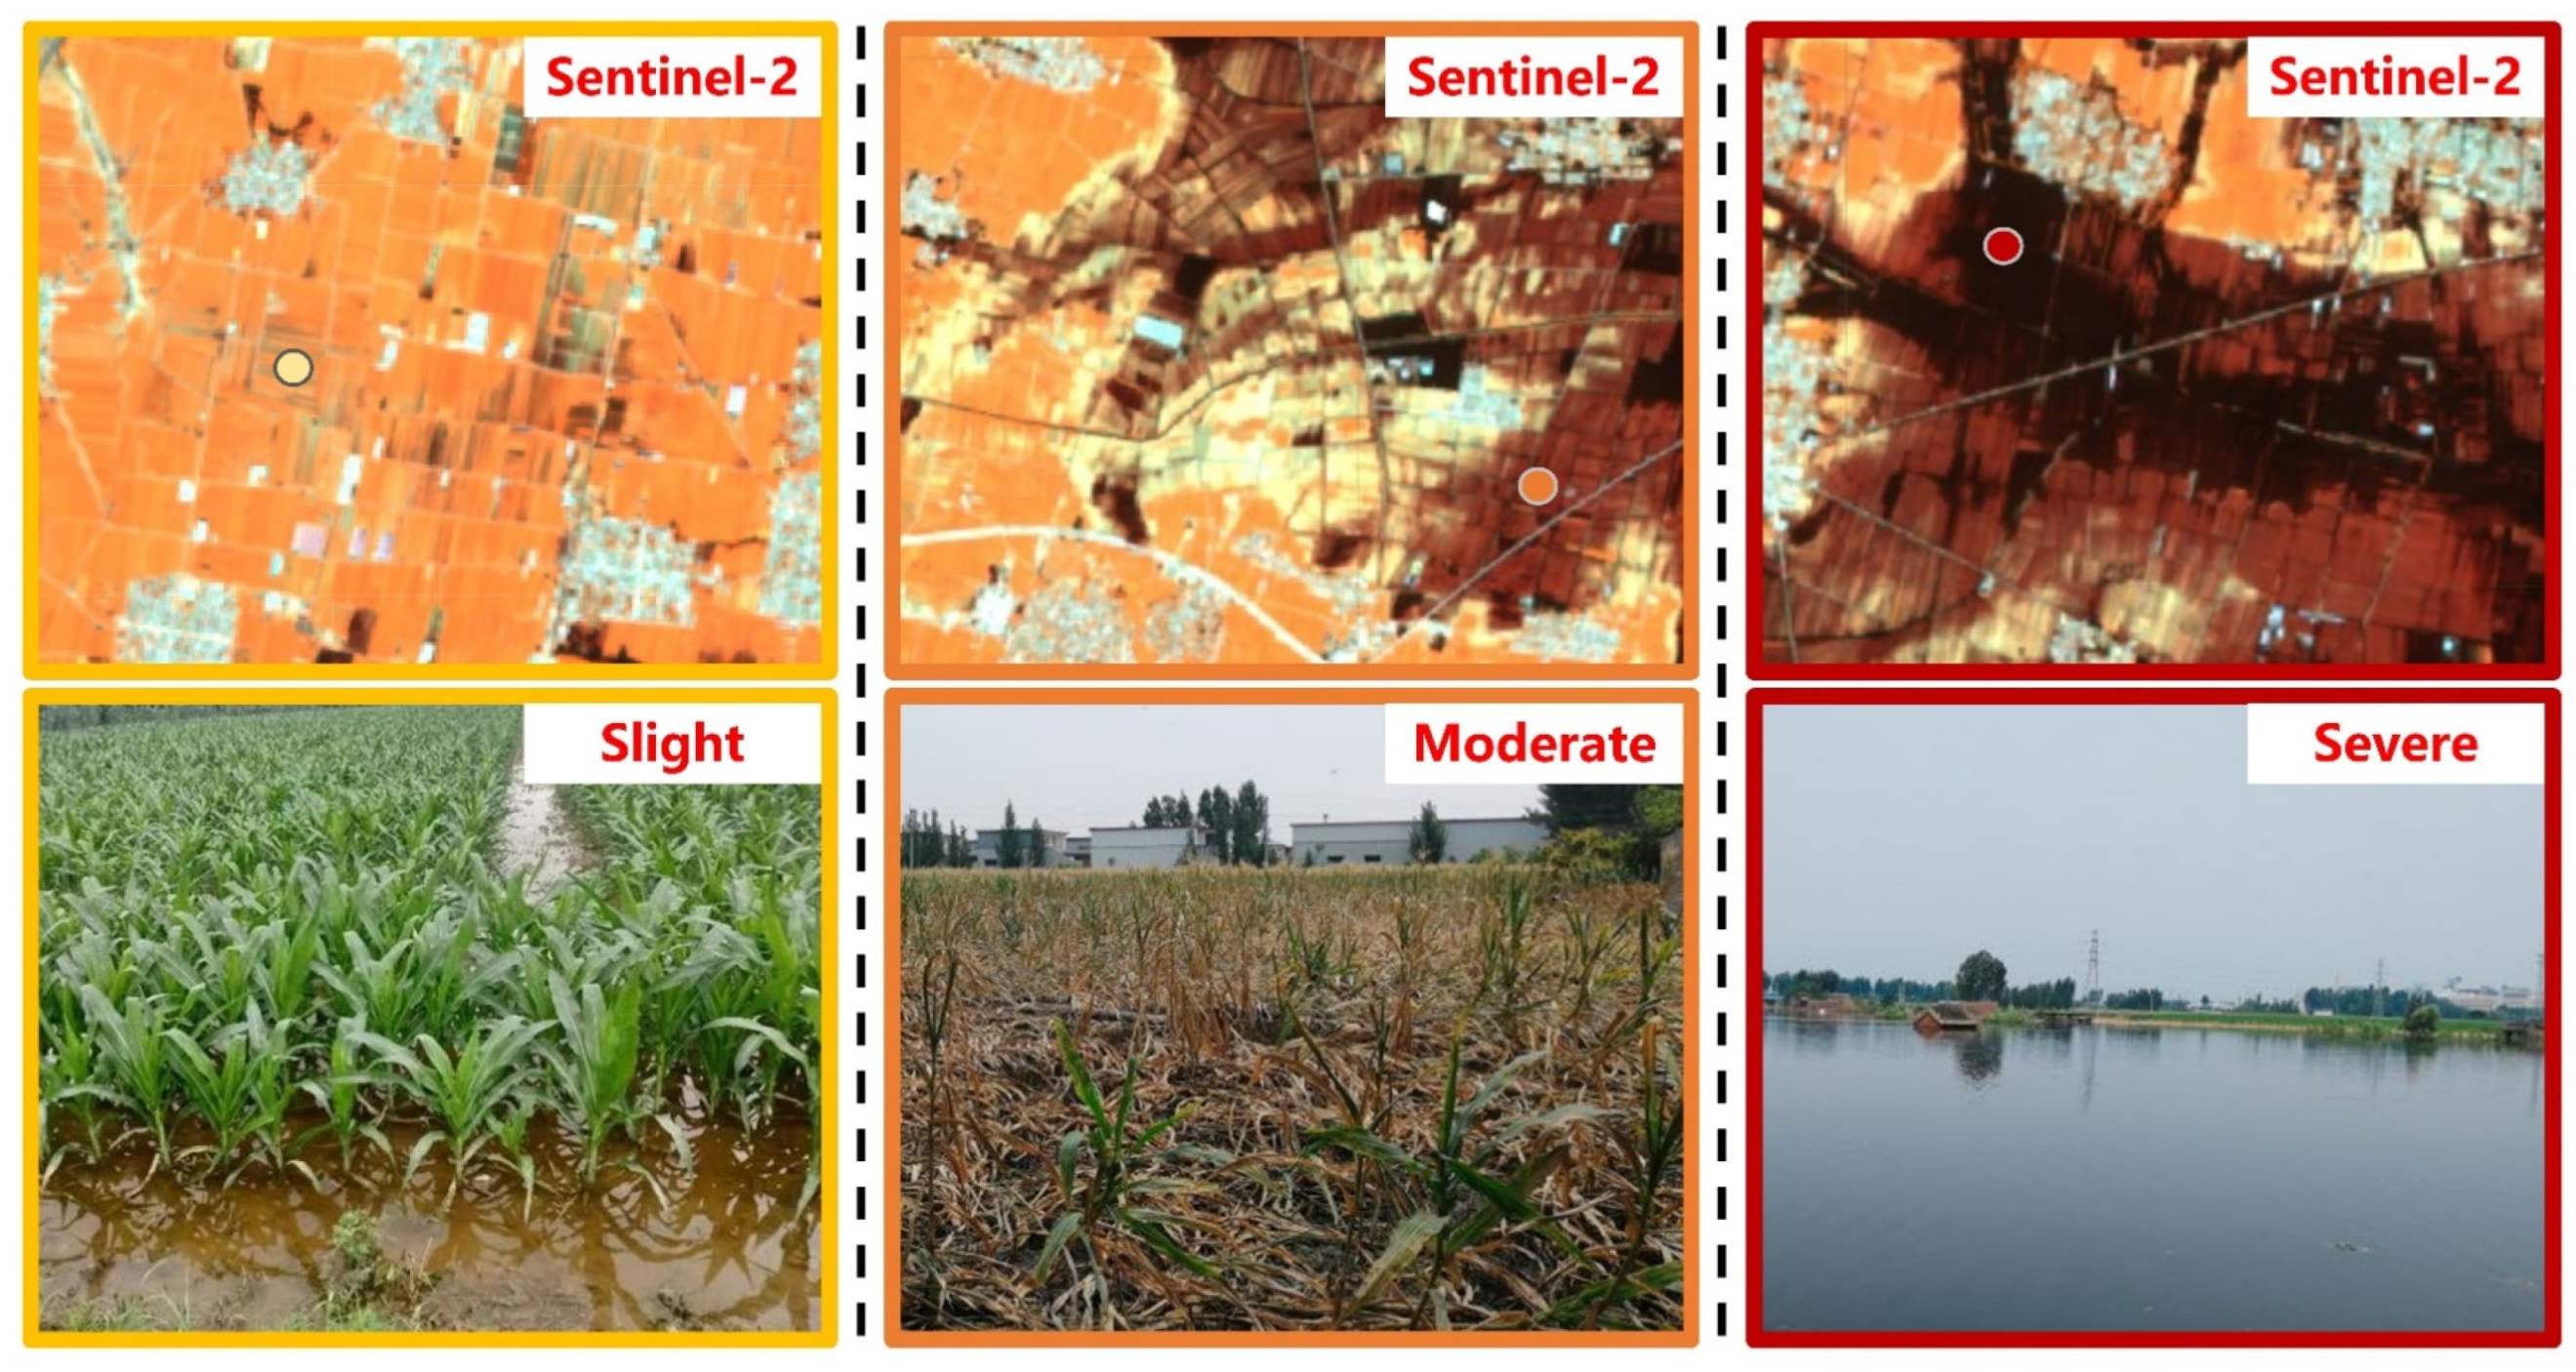
3.2. Evaluating the Severity of Flooding-Induced Loss

To evaluate the damage degree of impacted crops, we first collected samples that indicated different damage levels for classification. According to the Department of Emergency Disaster Management requirements, we divided the disaster degree into four types: normal, slight, moderate, and severe. Their distribution with the field survey can be found in Figure 5. Normal indicates that the crops were not affected by flooding, while slight, moderate, and severe damage correspond to different levels of damage (see Figure 6). The standard for these three degrees of crop damage is mainly guided by the National Emergency Management Department, with supports form field surveys according to the damage degree. For instance, for the category of severe damage, more than 80% of areas are visually submerged in water, while for categories of moderate and slight damage, the water coverage is more than 30% and 10%, respectively [32]. For crops that are slightly or moderately impacted, there is a relatively high chance to be recovered after the flooding due to the inherent resilience. In contrast, it is difficult to recover for those severely damaged, and the yield would be dramatically decreased compared with the normal condition. According to the in situ investigation, these four categories with different disaster levels can be measured.
We mapped the damage degree using collected field survey samples and the random forest classifier. This work was implemented on the GEE platform using Sentinel-2 images close to the flooding time. Random forest (RF) classification is a commonly used machine learning approach based on the ensemble decision of massive decision trees. The RF algorithm was trained using the bagging approach, and the final result was derived using the voting of decision trees. In general, around 70% of the samples we collected were randomly selected to build the RF classification model, and the remaining 30% were used for accuracy assessment, using commonly used indicators such as overall accuracy, kappa coefficient, and confusion matrix. Multiple bands from Sentinel-1 and Sentinel-2 images were used for classification using the RF classifier.

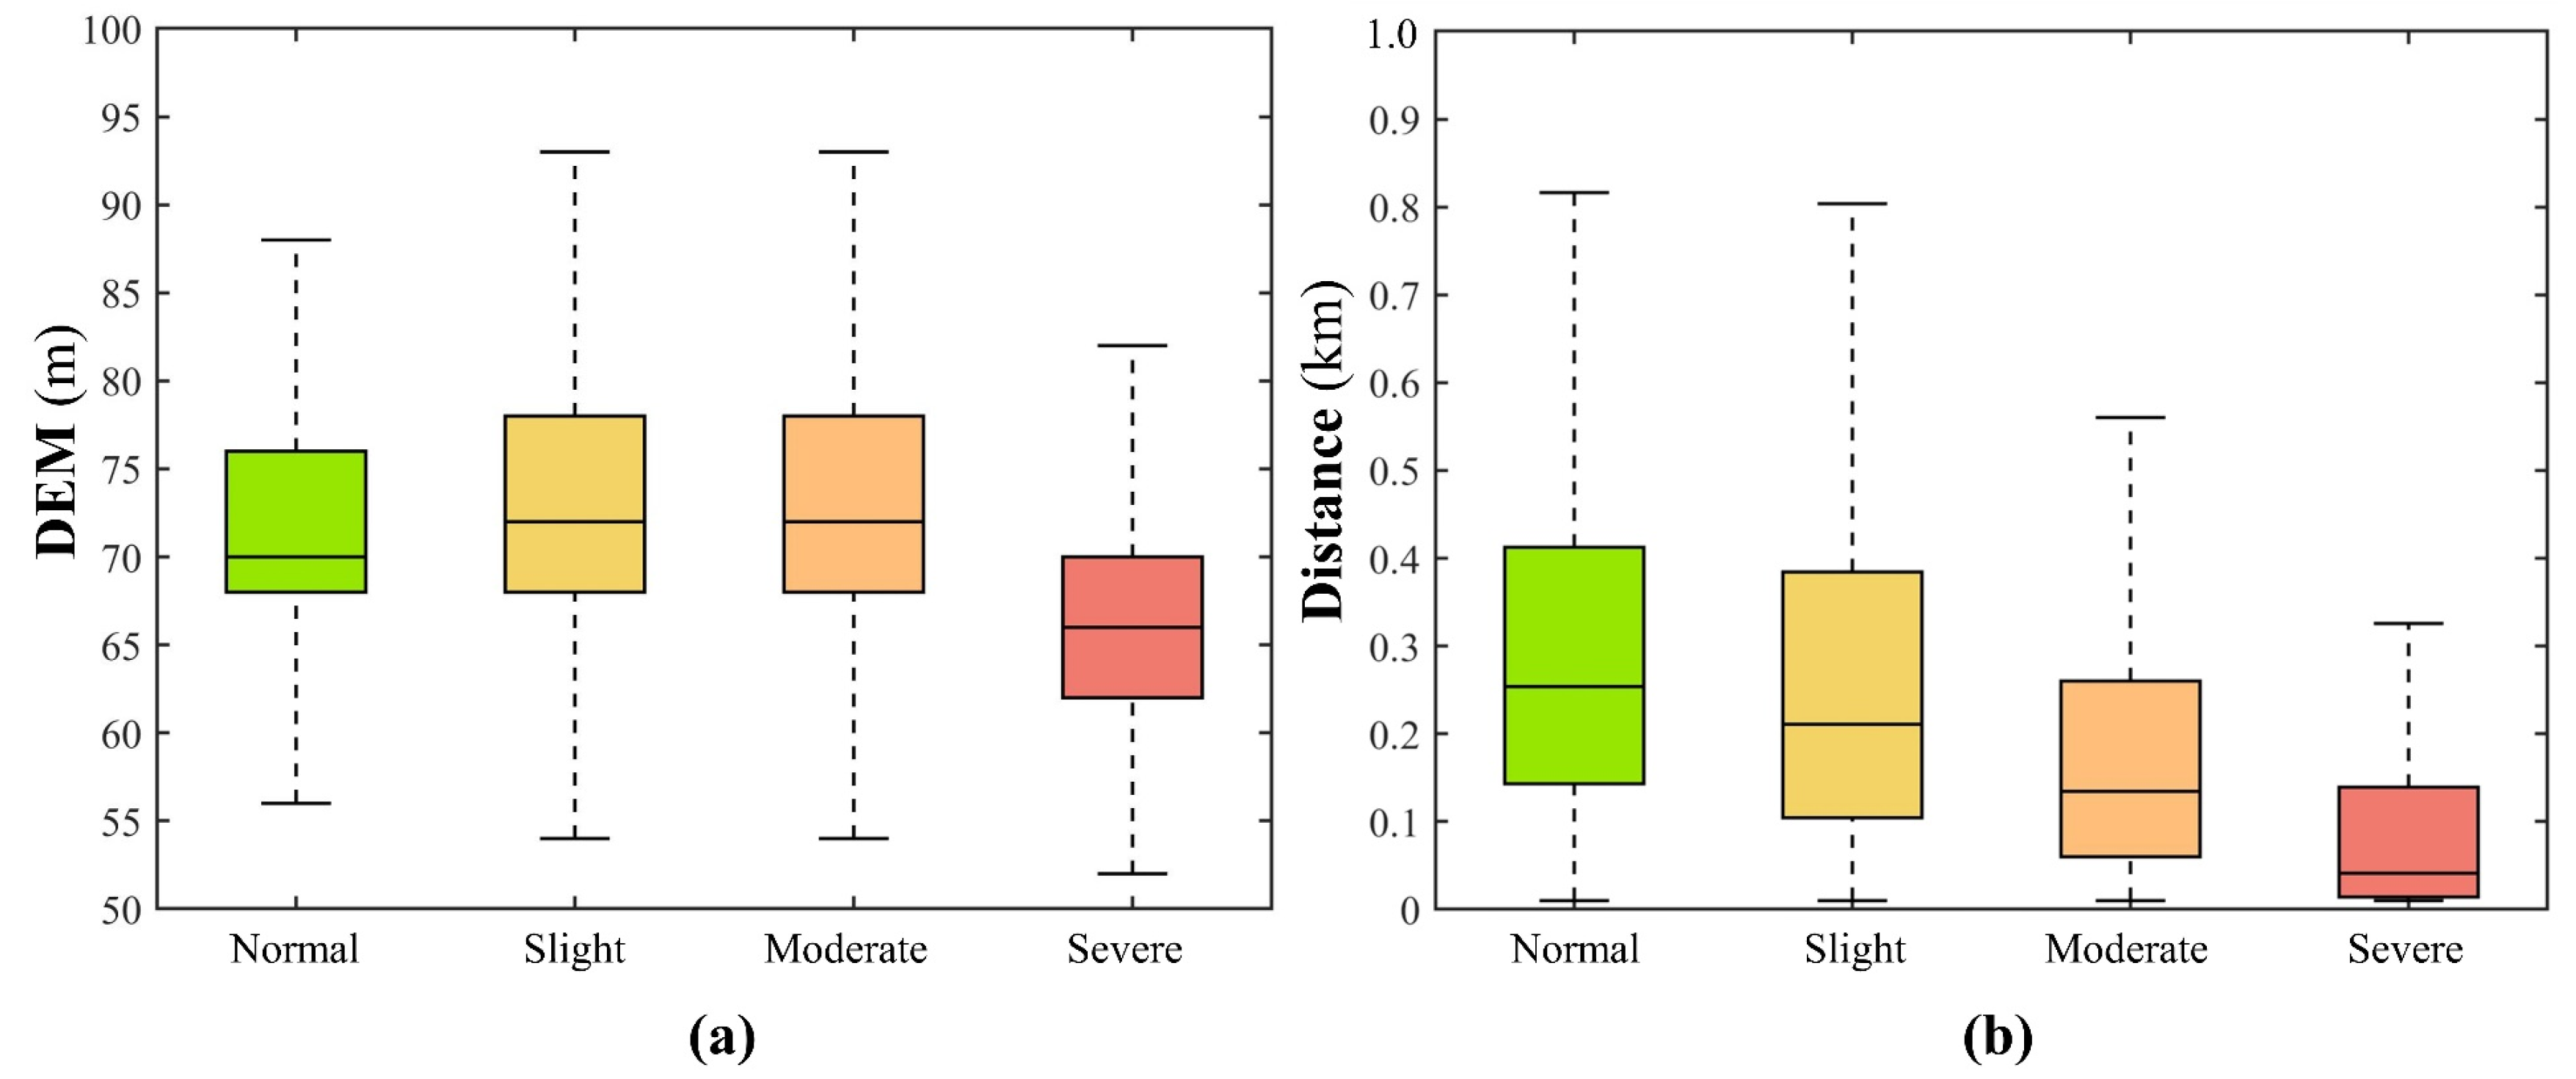
3.3. Measuring the Resilience of Crops to the Flooding

We measured the resilience of crops to flooding using the harmonized Landsat and Sentinel time series data. Although we mapped the damage level with field survived samples, the level only reflects the status during that time. This is not the actual damage evaluation, since some can be recovered from the time series data. To reflect the resilience of crops during the flooding, we analyzed the change of normalized vegetation difference index (NDVI) from the harmonized Landsat-8 OLI and Sentinel-2 data at the pixel scale (Figure 7). Before we used the data, the cloud impact was removed through atmospheric correction. Considering the phenology difference of different crops, which may impact the derived conclusions, here we only included corn. We measured the mean NDVI before (i.e., one month earlier) and after (i.e., one month later) the flooding event. We derived the ratio of NDVI between these two epochs and measured the NDVI increase relative to the mean status before the flooding. Finally, through jointly analyzing the NDVI change and the severity map, we measured the resilience of crops to flooding and analyzed their differences across different disaster degree levels.
Overall, the trend of NDVI change coincides with the damage caused by the flooding (Figure 7). The NDVI significantly decreased after 26 July, suggesting the flooding disturbed the crop growth within a short period; after that, it increased again due to the physical rhythm of recovery. The NDVI ratio between these two epochs across these four damage levels indicates crop resilience. If this value is greater than 1, it means that the crops are gradually recovering after the disaster. The recovery status is better if the ratio becomes large. Because maize is in the growing state, the value greater than 1 indicates the synthesized impacts of disaster and phenology patterns. Therefore, it is better to compare growing status in different regions to see the damage degree, because the phenology patterns are highly similar in this region. Obviously, for normal and slight damage, their NDVI becomes larger compared to the pre-disaster status. On the contrary, for regions with an NDVI ratio less than 1, the crop does not recover to the normal condition. Those regions categorized as severe damage have the lowest NDVI ratio compared to the moderately damaged ones. Finally, we counted the NDVI ratio change across different disaster levels and analyzed the resilience of damaged crops in our study area [33,34,35,36].

4. Results

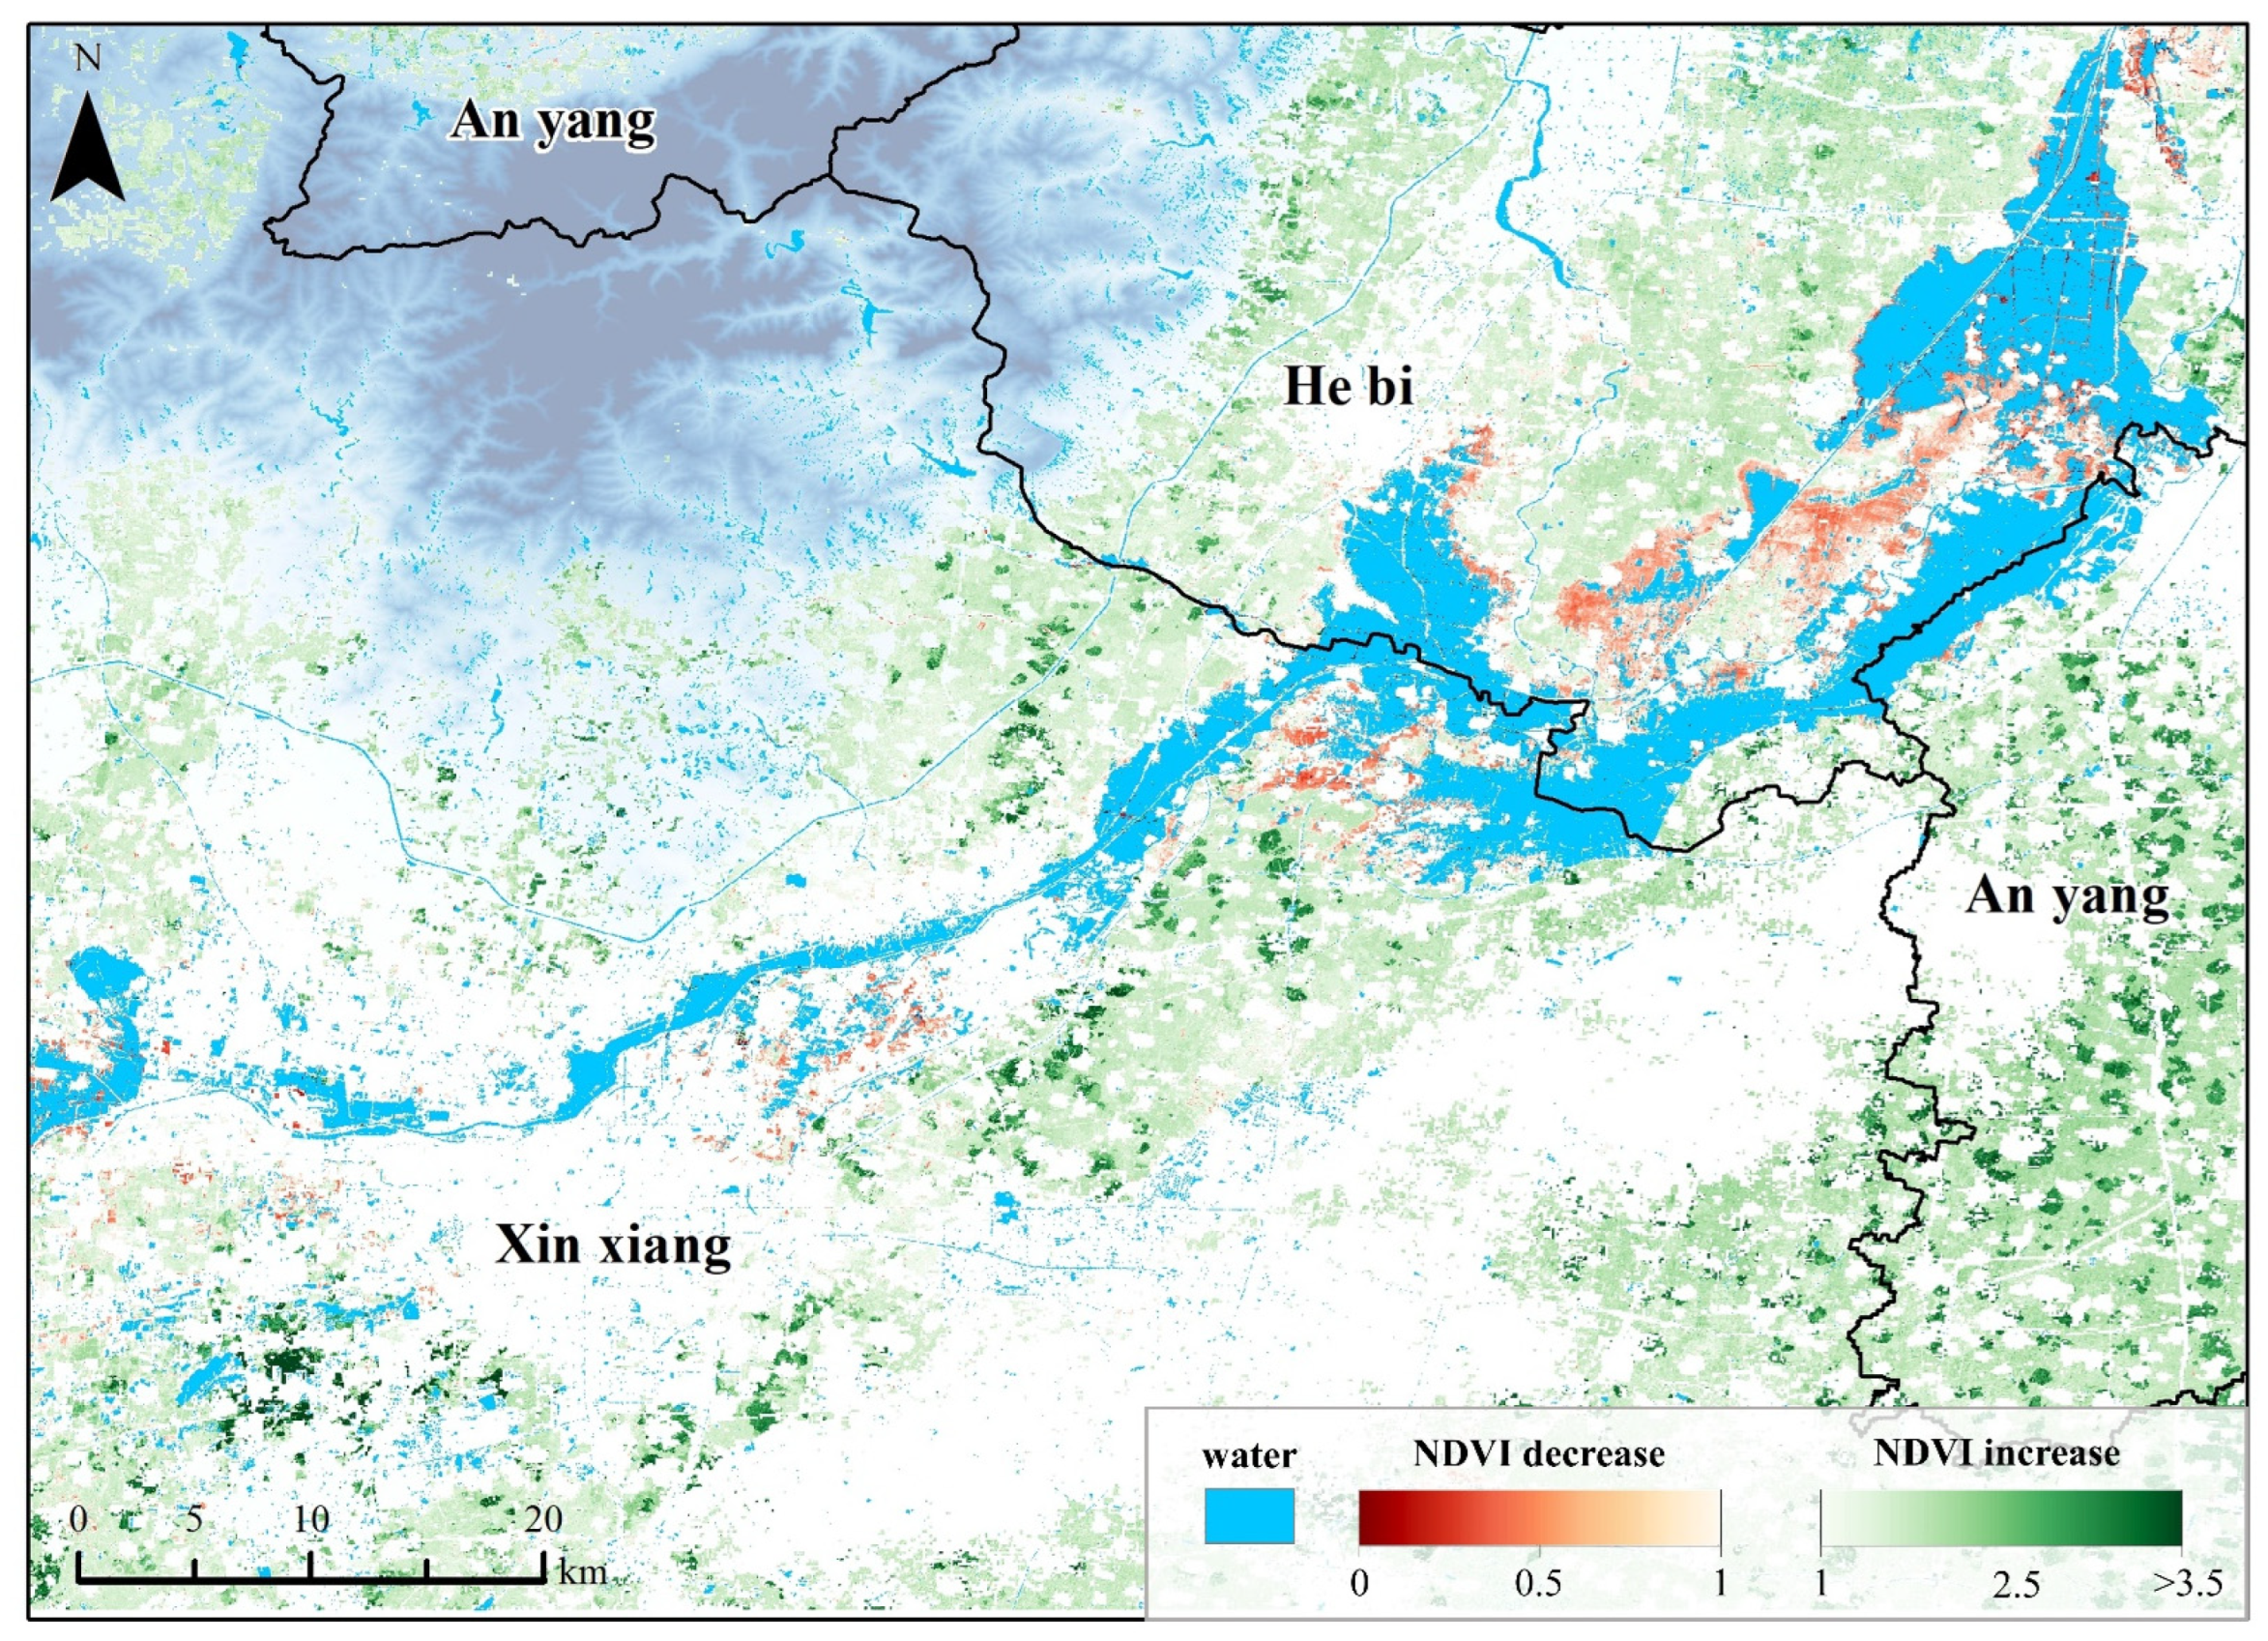
4.1. Detected Flooding Areas from Multi-Source Satellites

The double-Gaussian model performs well regarding the extracted water body from the Sentinel-1 SAR image. However, the terrain may slightly affect the model performance (Figure 8). Clearly, the water surface shows distinctly low backscatter values (i.e., black areas) in the SAR image. The optical threshold can be obtained directly from the double-Gaussian model (see Figure 4). For instance, the extracted water body clearly agrees with the distribution of backscatters from the Sentinel-1 SAR image. They are distributed around the river within a flattened terrain. There was almost no water before 20 July, and most areas were submerged due to the flooding around 27 July. Later, on 8 August, most of the water retreated, except for those regions in the northeast part of our study area. Despite the good performance of the double-Gaussian model, it is worth noting that in some mountain areas, shadows may be misclassified as water due to the impact of terrain. These regions can be eliminated using DEM in our study.
We validated the derived flooding areas from the double-Gaussian approach (see Table 1). Through random sampling of flooded and non-flooded areas, we visually interpreted their labels using high-resolution satellite images and SAR data. Overall, the accuracy of the proposed approach is high, with an overall accuracy of 94.77%, suggesting the double-Gaussian approach is suitable for flooding detection.
The flooding areas are mainly distributed in Xinxiang and Hebi, with the latter more severe, since the water did not retreat within a short period. Figure 9 shows the dynamics of the surface water body before, during, and after the flooding, with statistics of the flooding areas. Before the flood, there was almost no water in the study area. The total flooded area peaked during the flooding, as illustrated in regions along the Gong Chan Zhu Yi channel and the Weihe river. Due to the relatively low and flattened terrain, the flooding initially occurred on the north side of our study. Later, the flooding submerged the south side of these two rivers/channels, encroaching on the surrounding agricultural areas. Finally, the flooding slightly decreased and mainly centered around the north side. Overall, most flooded waters were effectively controlled and receded in Xinxiang. In contrast, waters converged in the junction area of Heibi and Anyang, and both experienced severe flooding damage. This is also supported by the area statistics of the water during these three epochs and the mapped water surface in Figure 9.

4.2. Severity of the Crops from Satellite Observations

In general, the mapped results with different damage levels agree with the mapped water surface, showing a noticeable distance-decay pattern from the river to surrounding areas (Figure 10). The area statistic results suggest the normal type has the largest area, accounting for about 50% of the total crop areas. Whereas for the other three types (i.e., slight, moderate, and severe), their areas are similar and spatially close regarding their water content differences. According to the distribution of mapped disaster levels, it can be found that most affected crops are roughly concentrated in the flooded areas, especially for Hebi and Xinxiang. The degree of damage overall shows a good agreement with the water distribution, as the field survey of crops took the water depth and extent as crucial criteria for judgment. As two categories distinctly affected by the flooding, the moderate and severe damage levels are close regarding their distribution.
Supported by the field survey samples and the RF classifier, we mapped these four damage categories with an overall accuracy of 88% and a kappa coefficient of 0.83 (see Table 2). Regarding the user’s s accuracy, the slight and moderate categories are likely to be confused, whereas normal and slight are easily misclassified for the producer’s accuracy. The confusion matrix suggests two transition categories—normal to slight, and slight to moderate—that are easily misclassified. This issue is related to the definition of these categories in the training samples, as well as the mixed pixel effect from the remote sensing aspect.
There is a distinct relationship between the terrain (e.g., DEM) and the damage degree (Figure 11a). To explore this issue, we analyzed their relationship using box plots. We excluded those high DEM regions using the threshold of 100, and only those crops in the flattened plain were considered. We found that the most severe damage regions were in relatively low regions, as the 25th and 75th quantile range was relatively low. The range of the box was between 70 and 60, with its median line near 65 m. The upper and lower quartiles and median positions of the three categories, except for severely damaged areas, show a general decreasing trend with the severity of the flooding event. The DEM value corresponding to its median line position gradually decreased from above 70 m to 65 m. Similarly, the closer the flood is, the more serious the damage will be, as illustrated in Figure 11b. Obviously, the category of severely damaged is closer to the flooded area, with a relatively close distance of less than 200 m, regarding the length of the boxplot. The distance corresponding to its median line position showed a decreasing trend from normal to severe, from above 0.2 km to below 0.1 km.

4.3. Identify Resilient Crops from the Sentinel-2 Time Series Data

The distribution of vegetation resilience was consistent with the results of disaster classification. The analysis was performed based on the estimated vegetation resilience (Figure 12). Because the NDVI calculation value of the flood part was negative, it affected the calculation results; thus, the maximum flood area extracted was used as a mask, and only the non-flooded areas were analyzed. An NDVI of less than one indicated a region in which crops were severely damaged; for crops that can be recovered, the NDVI ratio commonly was elevated due to corn’s growth stage during July–August. As illustrated in Figure 12, those severely damaged regions with an NDVI ratio below one are mainly distributed in the Gongchanzhuyi Channel and Weihe River, suggesting the hotspot of the flooded area has permanent damage from floods. Conversely, less severely damaged pixels are sparsely distributed in the southwest part of Xinxiang.
The overall resilience of corn agrees with the damage level pattern, as illustrated in Figure 13, using the NDVI ratio before and after the flooding event. It can be found that with the severity of the disaster, the resilience of maize gradually weakens until the harvest fails. We found along with the increase of damage degree (e.g., from slight to severely damaged), the resilience gradually decreases, as illustrated by the height of four boxes in Figure 13. For those regions with a normal status, due to the growth stage of corn during July–August, commonly the NDVI ratio increased. For instance, the NDVI after the flooding rose by about 50% relative to before. Such a pattern of NDVI ratio decrease across categories from slightly, moderately, and severely damaged categories, suggested our classification of the damage degrees agreed with the resilience reflected by the NDVI time series change. There is a clear trend of decrease from mild to severe, where the NDVI ratio corresponding to its median line changes from above 1.5 to 1. Using the NDVI ratio equal to 1, it can be found that more maize in the extinction and severe cases could not recover. In contrast, most of the maize in normal and light cases could recover after the damage.

5. Discussion

The double-Gaussian model is a statistical approach that is rapid and accurate in extracting flood areas. The model works by fitting two Gaussian distributions to a time series of satellite images, one representing the dry season and the other the wet season. The difference between the two distributions is then used to identify flooded areas. This approach has several advantages over other flood detection methods, including its ability to quickly and accurately identify flooded areas and its simplicity and applicability in a wide range of regions [37].
Exploring changes in crop growth over time can reveal the long-term impact of flooding on agricultural productivity. By examining the extent and severity of crop damage in a time series, it is possible to identify trends in crop growth and resilience after flood events. For example, certain crops may be more resilient to flooding than others, and the extent of the damage may depend on the timing and duration of the flood event. By examining these factors, farmers and policymakers can develop strategies for managing the risks associated with flooding and other environmental stresses. Moreover, the resilience of crops after flood events can depend on a variety of factors, such as soil quality, water availability, and climate conditions. By examining these factors in conjunction with crop damage, it is possible to develop a more comprehensive understanding of the long-term impact of flooding on agricultural productivity. For example, if a particular crop is found to be more resilient to flooding than others, it may be possible to promote the cultivation of that crop in flood-prone areas, thereby reducing the risk of crop damage and promoting food security.
There are still some uncertainties in this study. These include the effects of farmers replanting crops after the flooding, such as clearing existing crops to plant vegetables. Although we quantified this impact by exploring the changes in NDVI over time, the analysis based on NDVI time series still contains some uncertainties due to the lack of detailed crop type information and updated data.

6. Conclusions

The primary purpose of this study is to evaluate the damage degree and the resilience of crops caused by heavy flooding in Henan in 2021. First, we used the double-Gaussian model to determine the optical threshold and extract the flooding area from the Sentinel-1 SAR data. Then, we classified the damage degree (i.e., normal, slight, moderate, and severe) as the guideline from the Department of Emergency Management, using the samples collected from the field survey. Finally, we evaluated crop resilience to flooding across different damage categories, using NDVI time series before and after the flooding events.
The double-Gaussian model performs well in extracting the flood area, and it is suitable for in-time flooding monitoring during the event, especially for large-scale applications. With the supporting field survey samples, we mapped the damage degree of this flooding on agricultural lands. The overall accuracy and Kappa coefficient are above 80% and 0.8, respectively. The lower the DEM values and the closer to the flooding areas, the more severe the crop damage. This finding is in line with our understanding of disaster-affected factors. The resilience analysis suggests for those regions with slight or moderately damage that there is a relatively high chance of recovery after the flooding. Thus, a comprehensive evaluation of crops during and after flooding should be considered in future works to support a more rational and scientific evaluation of disaster-induced risks. In the future, diverse crop types’ response to flooding events should be comprehensively studied to better adapt to and mitigate agricultural climate risks.

Author Contributions

Conceptualization, S.M. and X.L.; methodology, S.M., Y.Z. (Yixuan Zhao) and Y.Z. (Yelu Zeng); writing–original draft preparation, J.H., R.W.; writing–review and editing, W.S. and M.A.M.A.E.; supervision, H.G. and J.Z. All authors have read and agreed to the published version of the manuscript.

Funding

This research is supported by the National Key Research and Development Program of China (2022YFB3903504) and National Natural Science Foundation of China (No. 41971383, 42001336).

Data Availability Statement

Not applicable.

Conflicts of Interest

The authors declare no conflict of interest.

References

  1. Chen, Z.; Kong, F.; Zhang, M. A Case Study of the “7–20” Extreme Rainfall and Flooding Event in Zhengzhou, Henan Province, China from the Perspective of Fragmentation. Water 2022, 14, 2970. [Google Scholar] [CrossRef]
  2. Ministry of Emergency Management of the People’s Republic of China. Top 10 National Natural Disasters in 2021. Available online: https://www.mem.gov.cn/xw/yjglbgzdt/202201/t20220123_407199.shtml (accessed on 23 January 2022).
  3. Adhikari, P.; Hong, Y.; Douglas, K.R.; Kirschbaum, D.B.; Gourley, J.; Adler, R.; Brakenridge, G.R. A digitized global flood inventory (1998–2008): Compilation and preliminary results. Nat. Hazards 2010, 55, 405–422. [Google Scholar] [CrossRef]
  4. Hallegatte, S.; Green, C.; Nicholls, R.J.; Corfee-Morlot, J. Future flood losses in major coastal cities. Nat. Clim. Change 2013, 3, 802–806. [Google Scholar] [CrossRef]
  5. Bofana, J.; Zhang, M.; Wu, B.; Zeng, H.; Nabil, M.; Zhang, N.; Elnashar, A.; Tian, F.; Silva, J.; Botao, A.; et al. How long did crops survive from floods caused by Cyclone Idai in Mozambique detected with multi-satellite data. Remote Sens. Environ. 2022, 269, 112808. [Google Scholar] [CrossRef]
  6. Chen, H.; Liang, Z.; Liu, Y.; Liang, Q.; Xie, S. Integrated remote sensing imagery and two-dimensional hydraulic modeling approach for impact evaluation of flood on crop yields. J. Hydrol. 2017, 553, 262–275. [Google Scholar] [CrossRef] [Green Version]
  7. Clement, M.A.; Kilsby, C.G.; Moore, P. Multi-temporal synthetic aperture radar flood mapping using change detection. J. Flood Risk Manag. 2018, 11, 152–168. [Google Scholar] [CrossRef] [Green Version]
  8. Sun, C.; Fagherazzi, S.; Liu, Y. Classification mapping of salt marsh vegetation by flexible monthly NDVI time-series using Landsat imagery. Estuarine. Coast. Shelf Sci. 2018, 213, 61–80. [Google Scholar] [CrossRef]
  9. Vittorro, A.; Georgakakos, A. Land cover classification and wetland inundation mapping using MODIS. Remote Sens. Environ. 2018, 204, 1–17. [Google Scholar] [CrossRef]
  10. Amitrano, D.; Di Martino, G.; Iodice, A.; Riccio, D.; Ruello, G. Unsupervised Rapid Flood Mapping Using Sentinel-1 GRD SAR Images. IEEE Trans. Geosci. Remote Sens. 2018, 56, 3290–3299. [Google Scholar] [CrossRef]
  11. Li, Y.; Martinis, S.; Wieland, M. Urban flood mapping with an active self-learning convolutional neural network based on TerraSAR-X intensity and interferometric coherence. ISPRS J. Photogramm. Remote Sens. 2019, 152, 178–191. [Google Scholar] [CrossRef]
  12. Schlaffer, S.; Matgen, P.; Hollaus, M.; Wagner, W. Flood detection from multi-temporal SAR data using harmonic analysis and change detection. Int. J. Appl. Earth Obs. Geoinf. 2015, 38, 15–24. [Google Scholar] [CrossRef]
  13. Brody, S.D.; Highfield, W.E.; Blessing, R. An analysis of the effects of land use and land cover on flood losses along the Gulf of Mexico coast from 1999 to 2009. J. Am. Water Resour. Assoc. 2015, 51, 1556–1567. [Google Scholar] [CrossRef]
  14. Rahman, M.S.; Di, L.; Shrestha, R.; Yu, E.G.; Lin, L.; Zhang, C.; Hu, L.; Tang, J.; Yang, Z. Agriculture flood mapping with soil moisture active passive (SMAP) data: A case of 2016 Louisiana flood. In Proceedings of the 2017 6th International Conference on AgroGeoinformatics, Agro-Geoinformatics, Fairfax, VA, USA, 7–10 August 2017; pp. 2–7. [Google Scholar] [CrossRef]
  15. Smith, A.B.; Katz, R.W. US billion-dollar weather and climate disasters: Data sources, trends, accuracy and biases. Nat. Hazards 2013, 67, 387–410. [Google Scholar] [CrossRef]
  16. Wobus, C.; Lawson, M.; Jones, R.; Smith, J.; Martinich, J. Estimating monetary damages from flooding in the United States under a changing climate. J. Flood Risk Manag. 2014, 7, 217–229. [Google Scholar] [CrossRef]
  17. Zhang, B.; Di, L.; Yu, G.; Shao, Y.; Shrestha, R.; Kang, L. A web service-based application serving vegetation condition indices for flood crop loss assessment. In Proceedings of the 2013 2nd International Conference on Agro-Geoinformatics: Information for Sustainable Agriculture, Agro-Geoinformatics, Fairfax, VA, USA, 12–16 August 2013; pp. 215–220. [Google Scholar] [CrossRef]
  18. Haq, M.; Akhtar, M.; Muhammad, S.; Paras, S.; Rahmatullah, J. Techniques of remote sensing and GIS for flood monitoring and damage assessment: A case study of Sindh province, Pakistan. Egypt. J. Remote Sens. Space Sci. 2012, 15, 135–141. [Google Scholar] [CrossRef] [Green Version]
  19. Pacetti, T.; Caporali, E.; Rulli, M.C. Floods and food security: A method to estimate the effect of inundation on crops availability. Adv. Water Resour. 2017, 110, 494–504. [Google Scholar] [CrossRef]
  20. Iervolino, P.; Guida, R.; Iodice, A.; Riccio, D. Flooding water depth estimation with high-resolution SAR. IEEE Trans. Geosci. Remote Sens. 2014, 53, 2295–2307. [Google Scholar] [CrossRef] [Green Version]
  21. Schumann, G.; Bates, P.D.; Horritt, M.S.; Matgen, P.; Pappenberger, F. Progress in integration of remote sensing–derived flood extent and stage data and hydraulic models. Rev. Geophys. 2009, 47, 1–20. [Google Scholar] [CrossRef]
  22. Voigt, S.; Giulio-Tonolo, F.; Lyons, J.; Kučera, J.; Jones, B.; Schneiderhan, T.; Platzeck, G.; Kaku, K.; Hazarika, M.K.; Czaran, L. Global trends in satellite-based emergency mapping. Science 2016, 353, 247–252. [Google Scholar] [CrossRef]
  23. Jo, M.J.; Osmanoglu, B.; Zhang, B.; Wdowinski, S. Flood extent mapping using dual-polarimetric sentinel-1 synthetic aperture radar imagery. Int. Arch. Photogramm. Remote Sens. Spat. Inf. Sci.-ISPRS Arch. 2018, 42, 711–713. [Google Scholar] [CrossRef] [Green Version]
  24. Markert, K.N.; Chishtie, F.; Anderson, E.R.; Saah, D.; Griffin, R.E. On the merging of optical and SAR satellite imagery for surface water mapping applications. Result Phys. 2018, 9, 275–277. [Google Scholar] [CrossRef]
  25. Martinis, S.; Kuenzer, C.; Wendleder, A.; Huth, J.; Twele, A.; Roth, A.; Dech, S. Comparing four operational SAR-based water and flood detection approaches. J. Remote Sens. 2015, 36, 3519–3543. [Google Scholar] [CrossRef]
  26. Martinis, S.; Plank, S.; Cwik, K. The use of Sentinel-1 time-series data to improve flood monitoring in arid areas. Remote Sens. 2018, 10, 583. [Google Scholar] [CrossRef] [Green Version]
  27. Song, Y.; Sohn, H.; Park, C. Efficient water area classification Usingradarsat-1 SAR imagery in a high reliefmountainous environment. Photogramm. Eng. Remote Sens. 2007, 73, 285–296. [Google Scholar] [CrossRef] [Green Version]
  28. Pulvirenti, L.; Chini, M.; Pierdicca, N.; Boni, G. Use of SAR data for detecting floodwater in urban and agricultural areas: The role of the interferometric coherence. IEEE Trans. Geosci. Remote Sens. 2015, 54, 1532–1544. [Google Scholar] [CrossRef]
  29. Martinis, S.; Twele, A.; Voigt, S. Unsupervised Extraction of Flood-Induced Backscatter Changes in SAR Data Using Markov Image Modeling on Irregular Graphs. IEEE Trans. Geosci. Remote Sens. 2011, 49, 251–263. [Google Scholar] [CrossRef]
  30. The European Space Agency. ASF DAAC 2014, Contains Modified Copernicus Sentinel Data 2014, Processed by ESA. Available online: https://sentinel.esa.int/web/sentinel/user-guides/sentinel-1-sar/ (accessed on 23 January 2022).
  31. Chen, X.; Wang, D.; Chen, J.; Wang, C.; Shen, M. The mixed pixel effect in land surface phenology: A simulation study. Remote Sens. Environ. 2018, 211, 338–344. [Google Scholar] [CrossRef]
  32. MZ/T042-2013; National Technical Committee for Disaster Reduction and Relief Standardization. Natural Disaster Loss Field Survey Specification. Ministry of Civil Affairs of the People’s Republic of China: Beijing, China, 2013.
  33. Huang, H.; Huang, J.; Li, X.; Zhuo, W.; Wu, Y.; Niu, Q.; Su, W.; Yuan, W. A dataset of winter wheat aboveground biomass in China during 2007–2015 based on data assimilation. Sci. Data 2022, 9, 200. [Google Scholar]
  34. Wen, Y.; Li, X.; Mu, H.; Zhong, L.; Chen, H.; Zeng, Y.; Miao, S.; Su, W.; Gong, P.; Li, B.; et al. Mapping corn dynamics using limited but representative samples with adaptive strategies. ISPRS J. Photogramm. Remote Sens. 2022, 190, 252–266. [Google Scholar] [CrossRef]
  35. Niu, Q.; Li, X.; Huang, J.; Huang, H.; Huang, X.; Su, W.; Yuan, W. A 30-m annual maize phenology dataset from 1985 to 2020 in China. Earth Syst. Sci. Data 2022, 14, 2851–2864. [Google Scholar] [CrossRef]
  36. Wang, X.; Huang, J.; Feng, Q.; Yin, D. Winter Wheat Yield Prediction at County Level and Uncertainty Analysis in Main Wheat-producing Regions of China with Deep Learning Approaches. Remote Sens. 2020, 12, 1744. [Google Scholar] [CrossRef]
  37. Huang, Z.; Chau, K. A new image thresholding method based on Gaussian mixture model. Appl. Math. Comput. 2008, 205, 899–907. [Google Scholar] [CrossRef] [Green Version]
Figure 1. The geographical map of our study area.
Remotesensing 15 01305 g001
Figure 2. Illustration of the severity of flooding-induced crop loss from satellite observations and samples.
Remotesensing 15 01305 g002
Figure 3. The proposed framework for crop resilience mapping of the flooding. (a) Approximate real-time flooding extent mapping; (b) Mapping the damage degree of crops from the flooding; (c) Evaluating the resilience of crops using satellite time series data.
Remotesensing 15 01305 g003
Figure 4. Illustration of the double-Gaussian model to identify the optimal threshold for flooding identification.
Remotesensing 15 01305 g004
Figure 5. The distribution of field survey samples with different damage levels during the flooding.
Remotesensing 15 01305 g005
Figure 6. The typical ground photos and satellite observations for the three categories.
Remotesensing 15 01305 g006
Figure 7. The NDVI ratio of four categories with different disaster levels, before and after the flooding time, separated by the date of 26 July.
Remotesensing 15 01305 g007
Figure 8. The extracted water body (with blue color) from the Sentinel-1 image using the double-Gaussian model. Three different periods before, during, and after the flooding events are illustrated. The top row includes the original Sentinel-1 SAR images, and the overlaid results with water are presented in the bottom row.
Remotesensing 15 01305 g008
Figure 9. Change of water bodies in the three epochs before, during, and after the flood.
Remotesensing 15 01305 g009
Figure 10. Distribution of four mapped categories with different damage levels.
Remotesensing 15 01305 g010
Figure 11. Study of influencing factors that may explain the distribution of the four categories, including the DEM (a) and the distance to the river (b). The central line indicates the median, and the bottom and top edges of the box indicate the 25th and 75th percentiles, respectively.
Remotesensing 15 01305 g011
Figure 12. The distribution of NDVI ratio before and after the flooding in our study area.
Remotesensing 15 01305 g012
Figure 13. Box plot of NDVI ratio in four categories with different damage degrees.
Remotesensing 15 01305 g013
Table 1. Confusion matrix of mapped flooding area.
FloodingNon-FloodingUser’s Accuracy
Flooding67395.71%
Non-Flooding69694.12%
Producer’s Accuracy91.78%96.97%172
Overall Accuracy94.77%Kappa:0.89
Table 2. Confusion matrix of mapped damage levels.
NormalSlightModerateSevereUser’s Accuracy
Normal2701096.43%
Slight3224075.86%
Moderate21541179.41%
Severe0388995.70%
Producer’s Accuracy84.38%84.62%90.00%89.00%218
Overall Accuracy88.07%Kappa:0.83
Disclaimer/Publisher’s Note: The statements, opinions and data contained in all publications are solely those of the individual author(s) and contributor(s) and not of MDPI and/or the editor(s). MDPI and/or the editor(s) disclaim responsibility for any injury to people or property resulting from any ideas, methods, instructions or products referred to in the content.

