
Multi-Scale Ship Detection Algorithm Based on YOLOv7 for Complex Scene SAR Images
1
College of Electronics and Information Engineering, Guangdong Ocean University, Zhanjiang 524088, China
2
Robotic Laboratory, Institute of Automatics and Control Process of Russian Academy of Sciences, 5, Radio St., 690041 Vladivostok, Russia
*
Author to whom correspondence should be addressed.
Remote Sens. 2023, 15(8), 2071; https://doi.org/10.3390/rs15082071
Submission received: 14 March 2023
/
Revised: 4 April 2023
/
Accepted: 12 April 2023
/
Published: 14 April 2023
(This article belongs to the Special Issue Artificial Intelligence Algorithm for Remote Sensing Imagery Processing Ⅱ)
Abstract
:Recently, deep learning techniques have been extensively used to detect ships in synthetic aperture radar (SAR) images. The majority of modern algorithms can achieve successful ship detection outcomes when working with multiple-scale ships on a large sea surface. However, there are still issues, such as missed detection and incorrect identification when performing multi-scale ship object detection operations in SAR images of complex scenes. To solve these problems, this paper proposes a complex scenes multi-scale ship detection model, according to YOLOv7, called CSD-YOLO. First, this paper suggests an SAS-FPN module that combines atrous spatial pyramid pooling and shuffle attention, allowing the model to focus on important information and ignore irrelevant information, reduce the feature loss of small ships, and simultaneously fuse the feature maps of ship targets on various SAR image scales, thereby improving detection accuracy and the model’s capacity to detect objects at several scales. The model’s optimization is then improved with the aid of the SIoU loss function. Finally, thorough tests on the HRSID and SSDD datasets are presented to support our methodology. CSD-YOLO achieves better detection performance than the baseline YOLOv7, with a 98.01% detection accuracy, a 96.18% recall, and a mean average precision (mAP) of 98.60% on SSDD. In addition, in comparative experiments with other deep learning-based methods, in terms of overall performance, CSD-YOLO still performs better.
1. Introduction
Synthetic aperture radar (SAR) has the ability to capture data, regardless of the weather, time of day, or other environmental factors that may interfere with other imaging systems, such as optical sensors [1,2,3]; it can provide accurate and timely information to maritime authorities. Therefore, SAR is used extensively for ship detection [4,5,6]. SAR can be used by the military to identify and track ships by examining how the ship’s hull reflects off the water through reflection and echo to determine the size, shape, type, and other features of the ship. This aids the military in ship surveillance and intelligence gathering. In the civilian area, SAR is used to detect fishing vessels and the extent of fishing activity, enabling effective regulation and management of fisheries and aquaculture [7]. The requirement for precision and real-time performance of the detection method is expanding as the amount of SAR image data that must be analyzed quickly increases. In addition, as a result of the high resolution of less than one meter produced by space borne SAR systems, the size variation of recognizable target ships has increased, which makes multi-scale detection techniques more challenging.
There are two stages in the development of ship detection algorithms: first, the constant false alarm rate (CFAR) [8] based conventional detection technique mainly relies on the expert’s experience and features obtained by hand, making it difficult to guarantee that the target features are always valid, leading to poor robustness. It works well for processing a single, straightforward SAR image, but it struggles to handle complicated maritime situations [9]. Second, convolutional neural networks (CNNs) have been shown exceptionally performance in a range of tasks involving image and video data. They are frequently utilized for many computer vision tasks, such as semantic segmentation [10], project detection [11], and image captioning [12]. The time-consuming task of manual feature extraction can be eliminated because deep learning networks can quickly and accurately learn object invariant features from big data. As a result, the network model exhibits good robustness, which lessens the impact of human factors. Consequently, CNN-based target detection algorithms have inherent advantages over traditional ship detection in SAR image ship detection. Meanwhile, SAR ship detection datasets are now readily available, thanks to the advancement of computer hardware. Many academics have looked at SAR ship detection using deep learning [13,14,15]. Two types of CNN-based detection techniques now exist. The first type consists of two-stage detectors. This sort of detector classifies and regresses these anchor boxes twice to provide recognition results. Typical two-stage detectors are: Faster RCNN [16], Libra R-CNN [17], Mask RCNN [18], etc. The second type of detector is the single-stage detector. The full convolution network is used by the single-stage detectors to classify and regress these anchor boxes once to produce the detection results. The typical algorithms are YOLO series [19,20,21], SSD [22], FCOS [23], etc. In general, the training mode used by the one-stage algorithm is end-to-end, so it is faster compared to the two-stage detectors, in terms of recognition accuracy; the two-stage algorithm can always achieve better results, but it requires extensive computational overhead.
Since SAR images of different vessel types from different sources have different resolutions, this results in differences between the largest and smallest pixel areas of vessels in the same dataset, approaching a factor of one thousand [24]. To accomplish this, models must be capable of multi-scale ship detection. Feature pyramid networks (FPN) [25] are frequently employed to address multi-scale target detection issues. One of the key advantages of the spatial pyramid algorithm is its ability to work effectively with images of varying sizes and resolutions. This is because it allows the features to be extracted and represented in a hierarchical manner, which helps to capture both fine-grained details and broader patterns in the image. Other algorithms, such as scale-invariant feature transform (SIFT) [26] and speeded-up robust features (SURF) [27], also offer multi-scale feature extraction capabilities. However, these algorithms are often more computationally expensive and may not be as effective at handling variability in image sizes and resolutions. Secondly, predictions can be made independently on various feature layers by simply altering the network connection, which greatly enhances the performance of small target detection without adding to the computational load of the original model. To handle multi-scale ship detection, numerous enhanced feature fusion networks have also been developed [28]. Cui et al. [29] suggested the dense attention pyramid network (DAPN). By leveraging the CBAM module, the structure completely connects the lower and upper portions of the feature pyramid. This technique addresses the issue of multi-scale ship detection by extracting rich features that contain resolution and semantic data, but the DAPN capacity for scenario adaptation is only moderate. In order to improve the detector to identify ships of different sizes in SAR images, Zhou et al. [30] constructs a new detector called MSSDNet, It has an important component FC-FPN module, which is a modified FPN that enhances the fusion of the model’s feature maps by setting a fusion coefficient that can be learned. To increase the effectiveness of detecting objectives of various ship sizes, Sun et al. [31] proposed Bi-DFFM; this module employs both top-down and bottom-up routes to achieve a higher level of feature integration, which enhances the recognition of multi-scale ships.
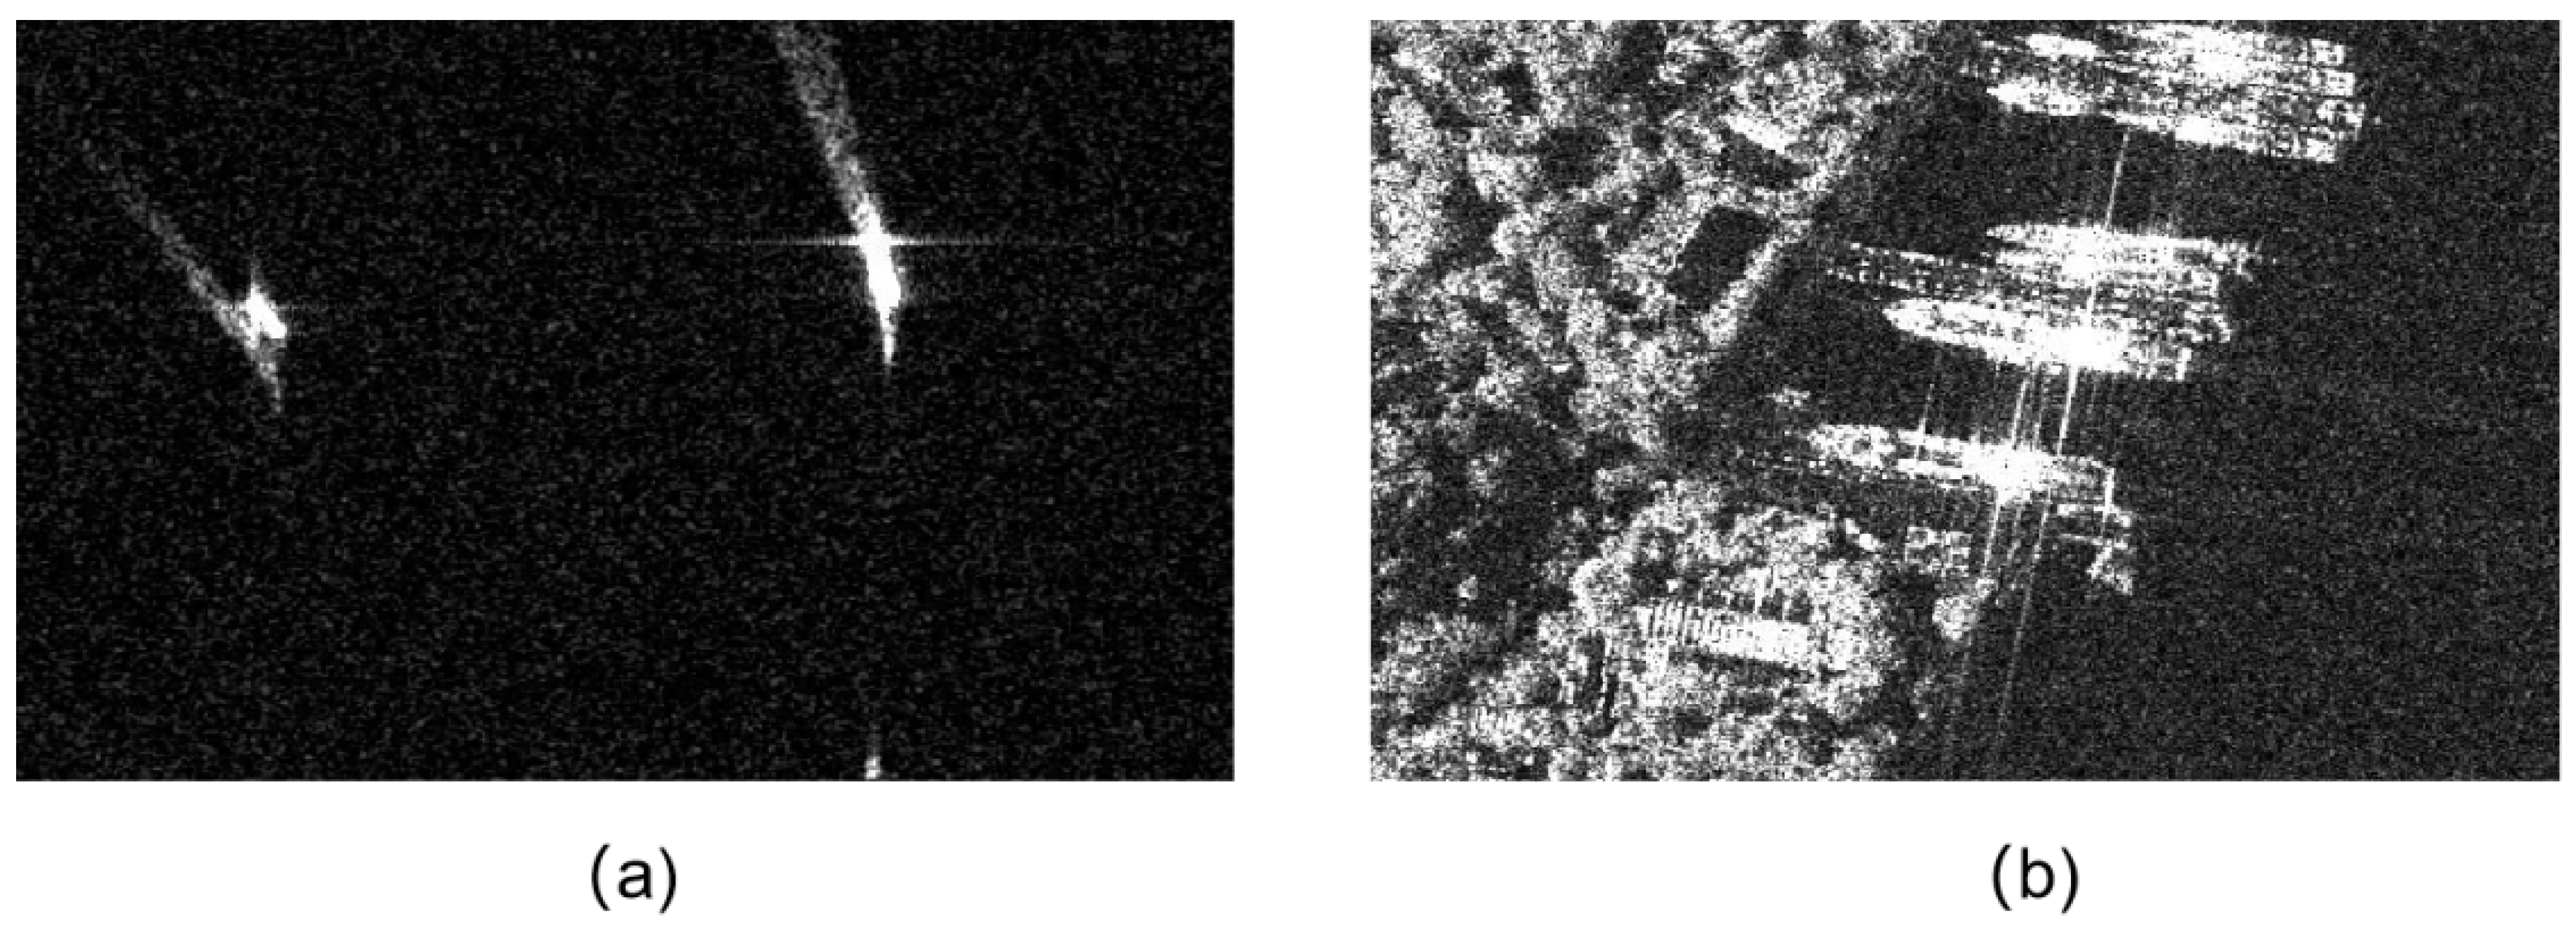
The above detector improves the model’s multi-scale ship detection capability by improving the FPN and other methods. Nevertheless, deep learning-based SAR image ship detection still faces significant challenges,. First, in most of the current multi-scale ship recognition models, better detection performance can be achieved in simple scenarios, with less interference. As shown in Figure 1a, the target of recognized is a ship traveling on the unobstructed sea. However, apart from this common situation, SAR images show moving ship targets in a variety of driving conditions, including sea operation, near-shore navigation, and berthing. Because the near-shore area is close to land, this significantly increases the background’s intricacy, particularly when the ships are grouped closely together, as in Figure 1b. Most models would be unable to locate the ship adequately in such a setting, leading to more missed detection. Second, there is the issue of missed detection of small-scale vessel targets. It can be said that small-scale target identification is the key to enhancing the model’s multi-scale ship recognition capability, as the feature pixels’ structure and size restrictions may allow them to readily lose target information regarding objects that occupy fewer blocks of pixels in multiple downsampling feature extraction. For the advancement of ship detection, the aforementioned issues must be resolved.
Considering the previous analysis, this paper uses the most recent YOLOv7 [32] algorithm, proposed CSD-YOLO, as the starting point. To perform better in terms of accuracy and processing efficiency, YOLOv7 makes use of techniques such as “extend” and “compound scaling”. It simultaneously resolves the dynamic label assignment allocation problem and the replacement problem of the re-parameterized module, making the target detector faster and more effective. Secondly, according to the characteristics of tiny and medium-sized ship objects on SAR images, SAS-FPN, which combines attention mechanism and atrous convolution composition, is added in the head portion to allow the network to concentrate more on the effective information and suppress irrelevant information to reduce small ship loss. Moreover, SAS-FPN fuses the ship target feature maps on several SAR picture levels, increasing the model’s multi-scale detection capacity and detection accuracy. Finally, to improve training effectiveness and inference accuracy, in the bounding box regression portion of the loss, the SIoU [33] loss function was employed.
To summarize, the main contributions of this paper are as follows:
- A new ship detection model called CSD-YOLO is proposed, with better multi-scale ship detection and ship identification capability in complex environments.
- Given the multi-scale and large-scale variation characteristics of the targets present in the SAR images of ships and the issue of missed ship detection in complex environments, we propose the SAS-FEN module in order to fuse the feature information of each layer and improve the detection effect of the model for ships of different scales while also being able to more accurately extract the scattering information of small targets and increase their detection accuracy.
- The experimental results on two datasets, SSDD and HRSID, demonstrate that CSD-YOLO has better generalizability and higher detection accuracy than various approaches, including YOLOv7, providing a better foundation for complicated projects (such as ship tracking and re-identification) and aiding in the advancement of intelligent border and sea defense construction.
2. Methodology
2.1. Overall Scheme of the CSD-YOLO
To more effectively detect multi-scale ships in SAR image data, especially small ships in complex backgrounds, we propose the optimized CSD-YOLO for multi-scale ships and complex scenes in SAR images, which can maintain the good performance of multi-scale ships, while the algorithm’s primary flow is depicted in Figure 2. Firstly, the pre-processed SAR images join a convolution group and then enter the feature extraction network consisting of an E-ELAN block and an MP block for feature extraction. After that, these features will enter our designed SAS-FPN module for feature fusion, producing better spatial and semantic data (P1, P2, P3), and the feature maps of various scales will enter the detection network. The prediction results are continuously optimized by the SIoU loss function. Finally, the final detection results are obtained by non-maximum suppression (NMS).
2.2. Feature Extraction Network
Firstly, to obtain multi-scale feature maps, a feature extraction network is built using YOLOv7. Currently, the most popular example of a one-stage object detection algorithm is the YOLO method, which is based on DNN for object recognition and object tracking. This network is not only relatively accurate, but also fast, and it can be applied to real-time systems. In July 2022, Wang et al. proposed YOLOv7 [32], the most advanced algorithm in the current YOLO family, which surpasses the previous YOLO family in terms of accuracy and speed, being more accurate and 120% (FPS) faster than YOLOv5, 180% (FPS) faster than YOLOX [19], 1200% (FPS) faster than Dual-Swin-T [34] for the same volume (FPS), 550% faster than ConvNext [35] (FPS), and 500% faster than SWIN-L [36] (FPS). YOLOv7 brought about numerous architectural alterations, such as compound scaling, the extended efficient layer aggregation network (EELAN), a bag of freebies with planned and reparametrized convolution, coarseness for auxiliary loss, and fineness for lead loss [32]. This series of operations enabled models to better support mobile GPUs and GPU. Therefore, we choose the backbone of YOLOv7 as the model feature extraction network.
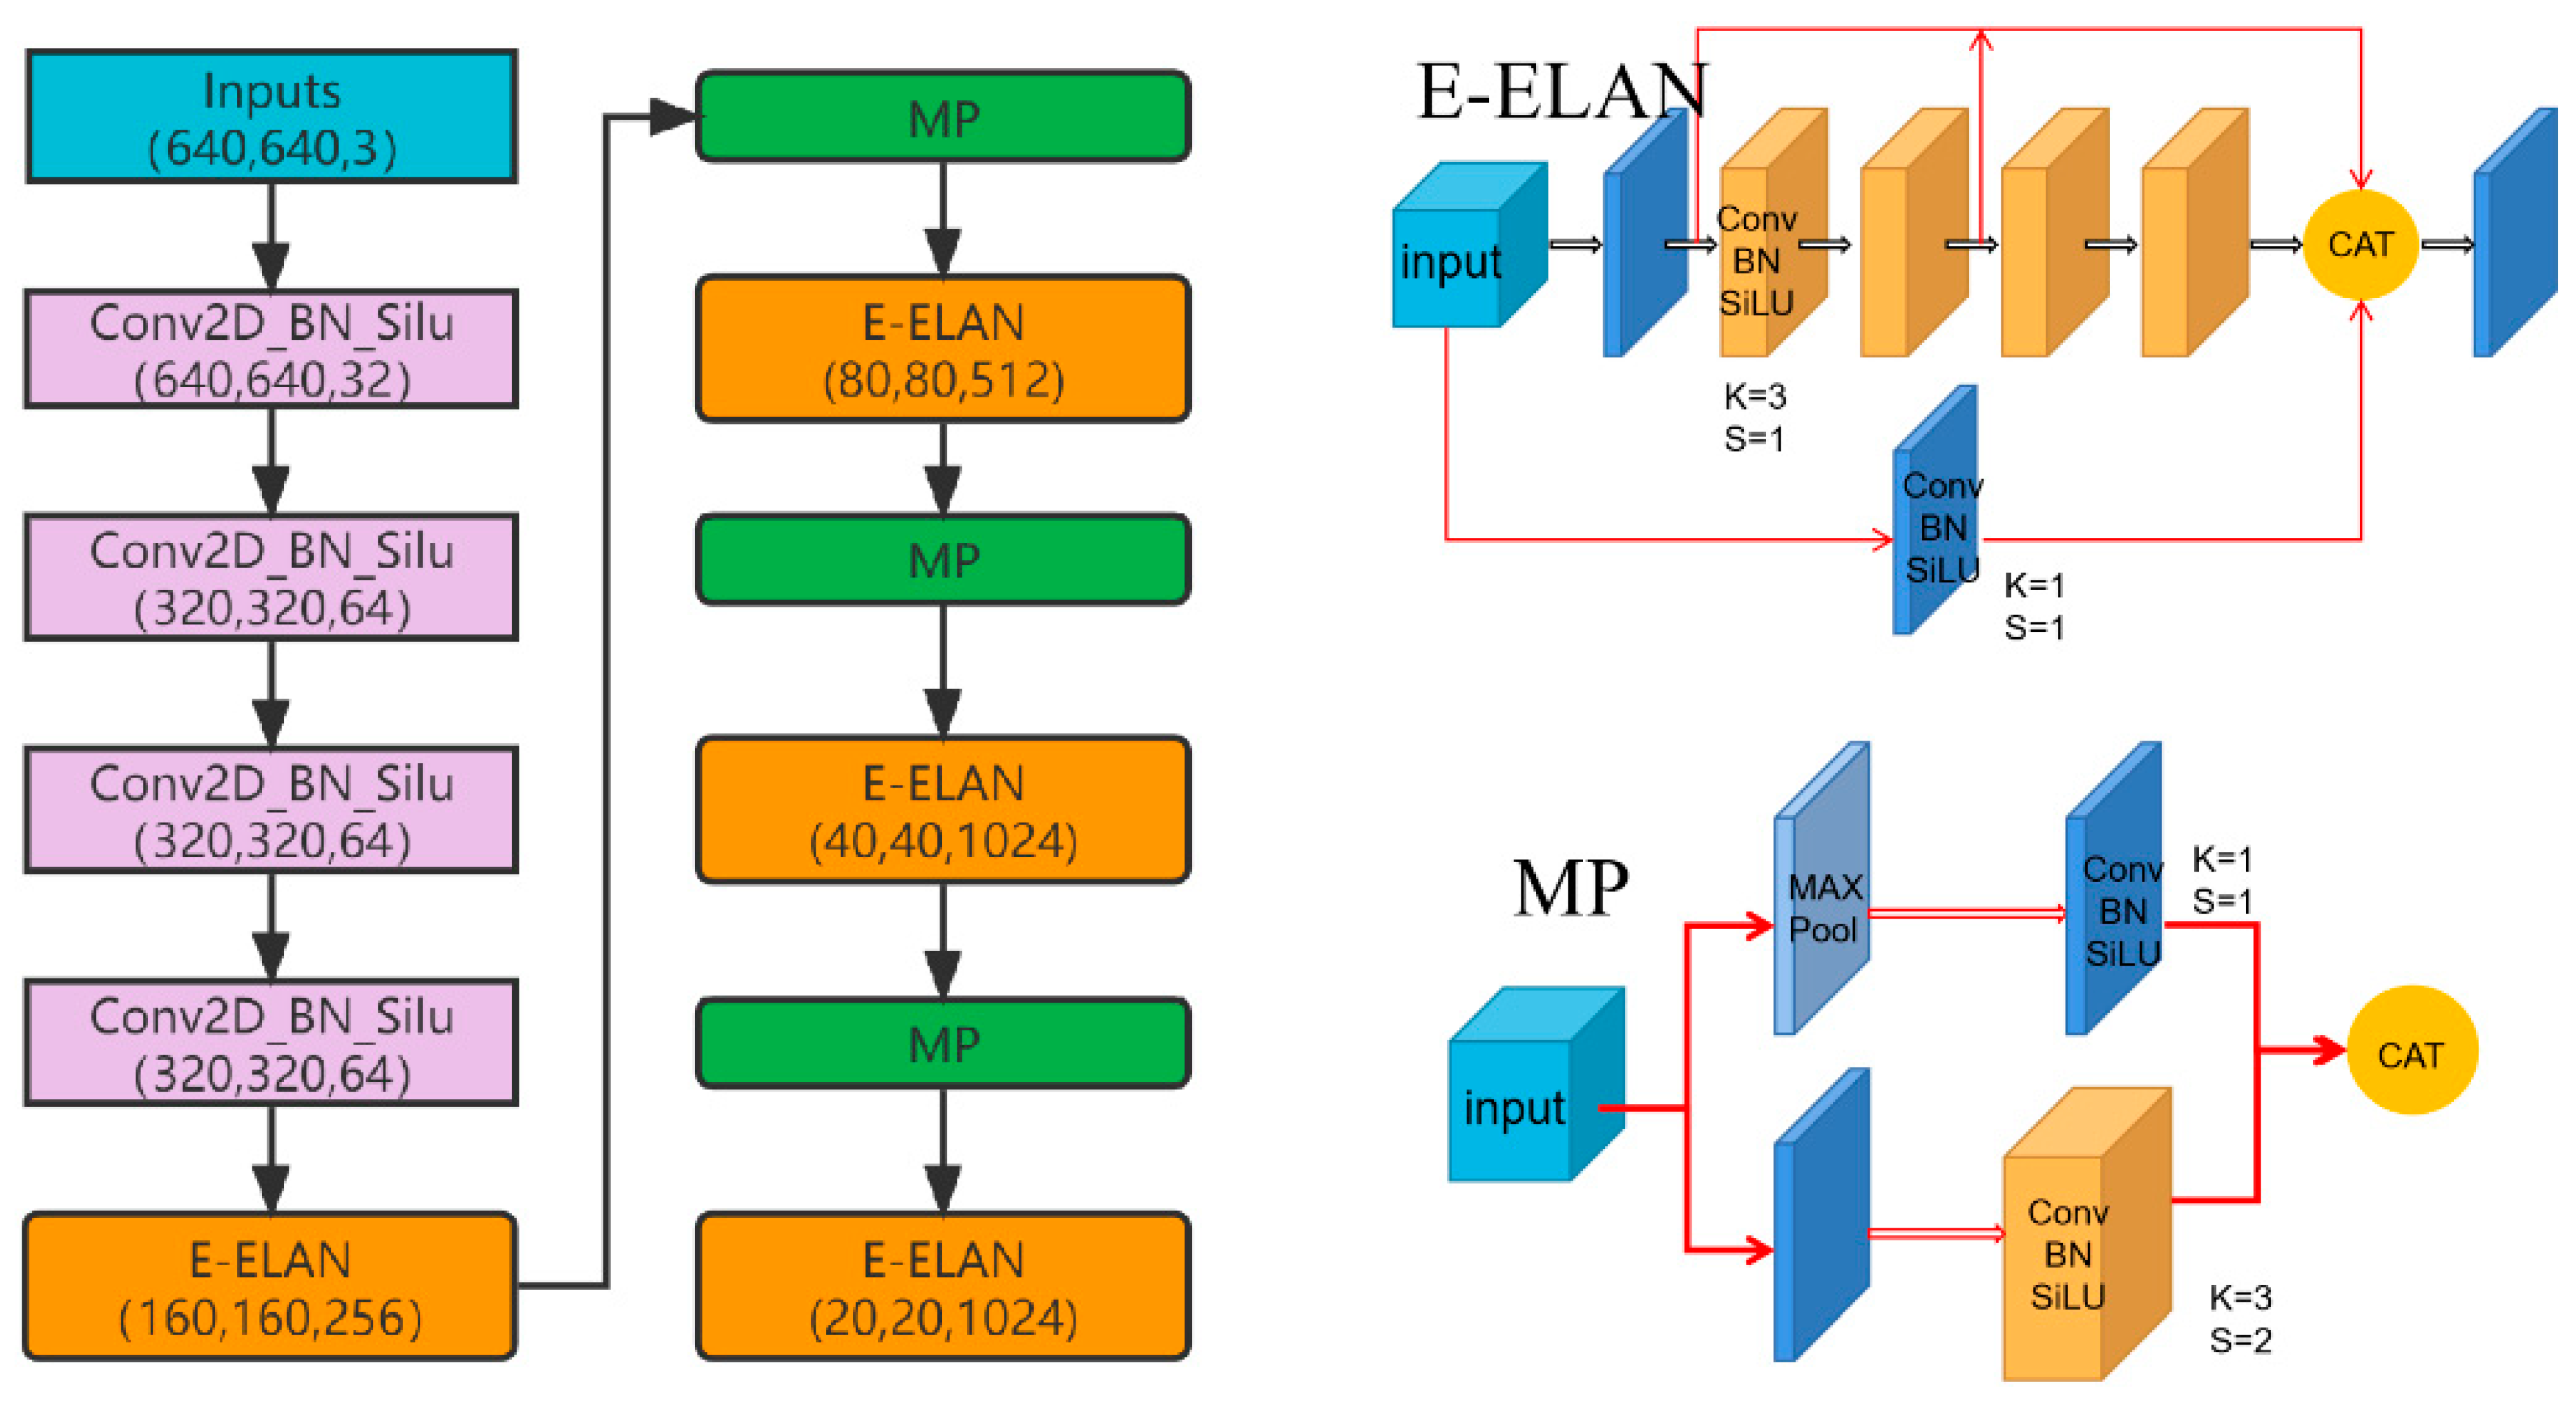
Figure 3 displays the CSD-YOLO FEN flowchart. Channel space is downsampled using a convolution layer with a kernel of 3 × 3 and a step size of 1, which concentrates information. The second step involves downsampling once more using a convolution layer with a kernel of 3 × 3 and a step size of 2. Features were improved by the E-ELAN block and MP block after repeating the aforementioned two convolution operations, and the aforementioned steps were repeated three times until the features were in the spatial E-ELAN block. This mode of operation can improve the use of parameters and calculations, as well as the features learned by various feature maps.
2.3. The Architecture of the Proposed SAS-FPN Model
Marine ship detection requires the processing of the marine environment, and since the oceanic environment is characterized by multi-scale, multi-directional, and complex backgrounds, a model capable of extracting multi-scale features is needed for processing. The features of the FPN model meet such a need. It can effectively improve detection accuracy by using multi-layer networks to extract features at different scales, as well as feature fusion, which are both suitable for the marine ship inspection of complex environments. However, a significant drawback of FPN and the existing FPN-based models is that while processing image tasks, standard deep convolutional neural networks lose internal data structure during the pooling operation, which causes issues including the loss of the ability to reconstruct information about small targets and spatially layered data. At the same time, in the complex background environment of ports and docks, the model is simultaneously disturbed by irrelevant information learned during training, making it more challenging to extract useful information and detect small targets.
In order to better extract the features of small ships from the complex environment and to be able to select meaningful feature maps from many feature maps for training, we designed the multi-scale feature pyramid network SAS-FPN, which is capable of combining shallow and deep feature maps and improved detector capability to gather spatial data, recognize small vessels, and identify targets across multiple scales. Figure 4 depicts the complete SAS-FPN architecture; we use the SA module to dock the backbone network from stage 3 to stage 5 to extract the feature information at each stage, and we have labeled the number of channels at different stages in the figure. At the same time, in stage 5, we use the ASPP module to sample the given input in parallel at different sampling rates of atrous convolution, which is equivalent to capturing the context of the image at multiple scales. Then, we add the extracted feature information to the top-down FPN for feature fusion and finally, output these results to the RepConv module for detection and recognition. For example, stage 3 enters through SA and then enters the P3 layer for upsampling, after which this output will be connected with the feature map on P2 and then enter the RepConv module for detection and identification. More detailed fusion methods and the number of input and output channels are also shown in detail in the figure.
The improved SAS-FPN has the following advantages over FPN. First, the SA attention module combines the spatial attention mechanism and the channel attention mechanism, which improves the model’s ability to extract ship features in complex environments and also improves the model’s ability to detect small ships. Second, the application of the ASPP module increases the receptive field of SAS-FPN, which is conducive to eliminating interference from complex backgrounds in SAR images. In the following section, we will introduce the working principles of the two modules in more detail.
2.3.1. Attention Mechanism for Small Ship
Because of the interference from a complex backdrop, YOLOv7 is unable to effectively address the problem of small ship detection. Inspired by the attention mechanism that enhances important information, taking the interference of a complicated background into account, YOLOv7 cannot adequately solve the identification problem of small ships. Inspired by the attention mechanism that enhances important information, we enhance the backbone network using the shuffle attention [37] module, which forces the network to consider the same tokens in different orders and relationships. Therefore, it can suppress environment-induced interference and enhance the model’s capacity to detect small objectives. The main idea behind shuffle attention is to first apply spatial attention to the input feature maps and then apply channel attention to the resulting spatially attended feature maps. This is followed by shuffling the units of the final attended feature maps using the channel shuffle operation. In the channel attention section, channel statistics are generated by global averaging pooling to embed global information; the formula is as follows:
In addition, a tight feature is created for accurate and adaptive selection, and the final output of channel attention is
Unlike channel attention, spatial attention focuses on “where”, is information-rich, and is complementary to channel attention. First, use the group norm for to obtain the spatial statistics. Then, is adopted to enhance the representation, and the final spatial attention output is
These easy computations make up the SA module, and the channel shuffle operations that go along with them make sure that the relationship between each group of supporting features may be efficiently avoided in terms of computing cost. Adding shuffle attention to the model allows the model to focus more on local information in the SAR image at a lower computational cost, preventing missing detection as a result of the image’s low contrast and the existence of small ships with few pixel points.
2.3.2. Multi-Scale Feature Extraction
The role of spatial pyramid pooling [38] (SPP) is to be able to increase the receptive field, allowing the algorithm to adapt to different resolution images, and it achieves this by maximum pooling to obtain different receptive fields. The visual SPPCSPC is used by the YOLOv7 model to widen the receptive field, and it is composed of 1 × 1 and 3 × 3 convolution used to extract the feature map. This causes the superficial features to be underutilized and the visual range of view to be insufficiently broad. Therefore, in this paper, ASPP is used to replace SPPCSPC. The ASPP module introduces depthwise separable convolution and atrous convolution with different expansion rates. Additionally, the use of various dilation rates will lessen the influence of environmental factors more significantly than by just using one large dilation rate, and it enhances background data on multiple scales to aid in the detection of small objects, so one can extract multi-scale context information while avoiding small target loss. This feature maps extraction procedure is demonstrated in Figure 5.
2.4. Loss Function
Target detection involves the precise prediction of the data contained within the confines of a detected target, which makes bounding box prediction an essential task. Despite the size of most SAR photos, some of them only contain a few ship targets. Thus, the performance of ship target identification models is significantly impacted by the definition of the loss function. While IoU metrics such as GIoU [39], DIoU, and CIoU [40] are frequently employed, they do not take the angle into account when analyzing regression. To address this issue, the SIoU loss function used in this paper accounts for both the overlapping area between the predicted and ground truth bounding boxes and their size difference. Moreover, SIoU takes into account the vector angle between the actual frame and the predicted frame. SIoU enables the model to perform better and reach convergence more quickly. The equation below can be used to explain the loss function:
It includes four parts:
- (1)
- Angle cost, defined as follows
is the real frame center coordinate, and is the center coordinate of the prediction frame.
- (2)
- Distance cost, defined as follows
Of which
- (3)
- Shape cost, defined as follows
Of which
- (4)
- IoU cost
3. Experiments and Results
3.1. Experiment Settings
In this article, all experiments were performed with the Windows 10 operating system, using Pytorch 1.7 for training, CUDA 11.0 was used to speed up the calculation, and the processor on the computer was Intel (R) Xeon (R) Platinum 8350C @2.60 GHz, with 24 GB memory and an RTX 3090 graphics card.
3.2. Datasets
To validate the model’s reliable performance across various datasets, the experiments were conducted using SAR Ship Detection Dataset (SSDD) [41] and High-Resolution SAR Images Dataset (HRSID) [42] datasets to evaluate the proposed method. In addition to the typical views of ships in the far-off sea, both datasets include a diverse range of scenarios, including inshore, ports, and islands. The two datasets will then be introduced. Additional information is provided below.
- (1)
- SSDD:
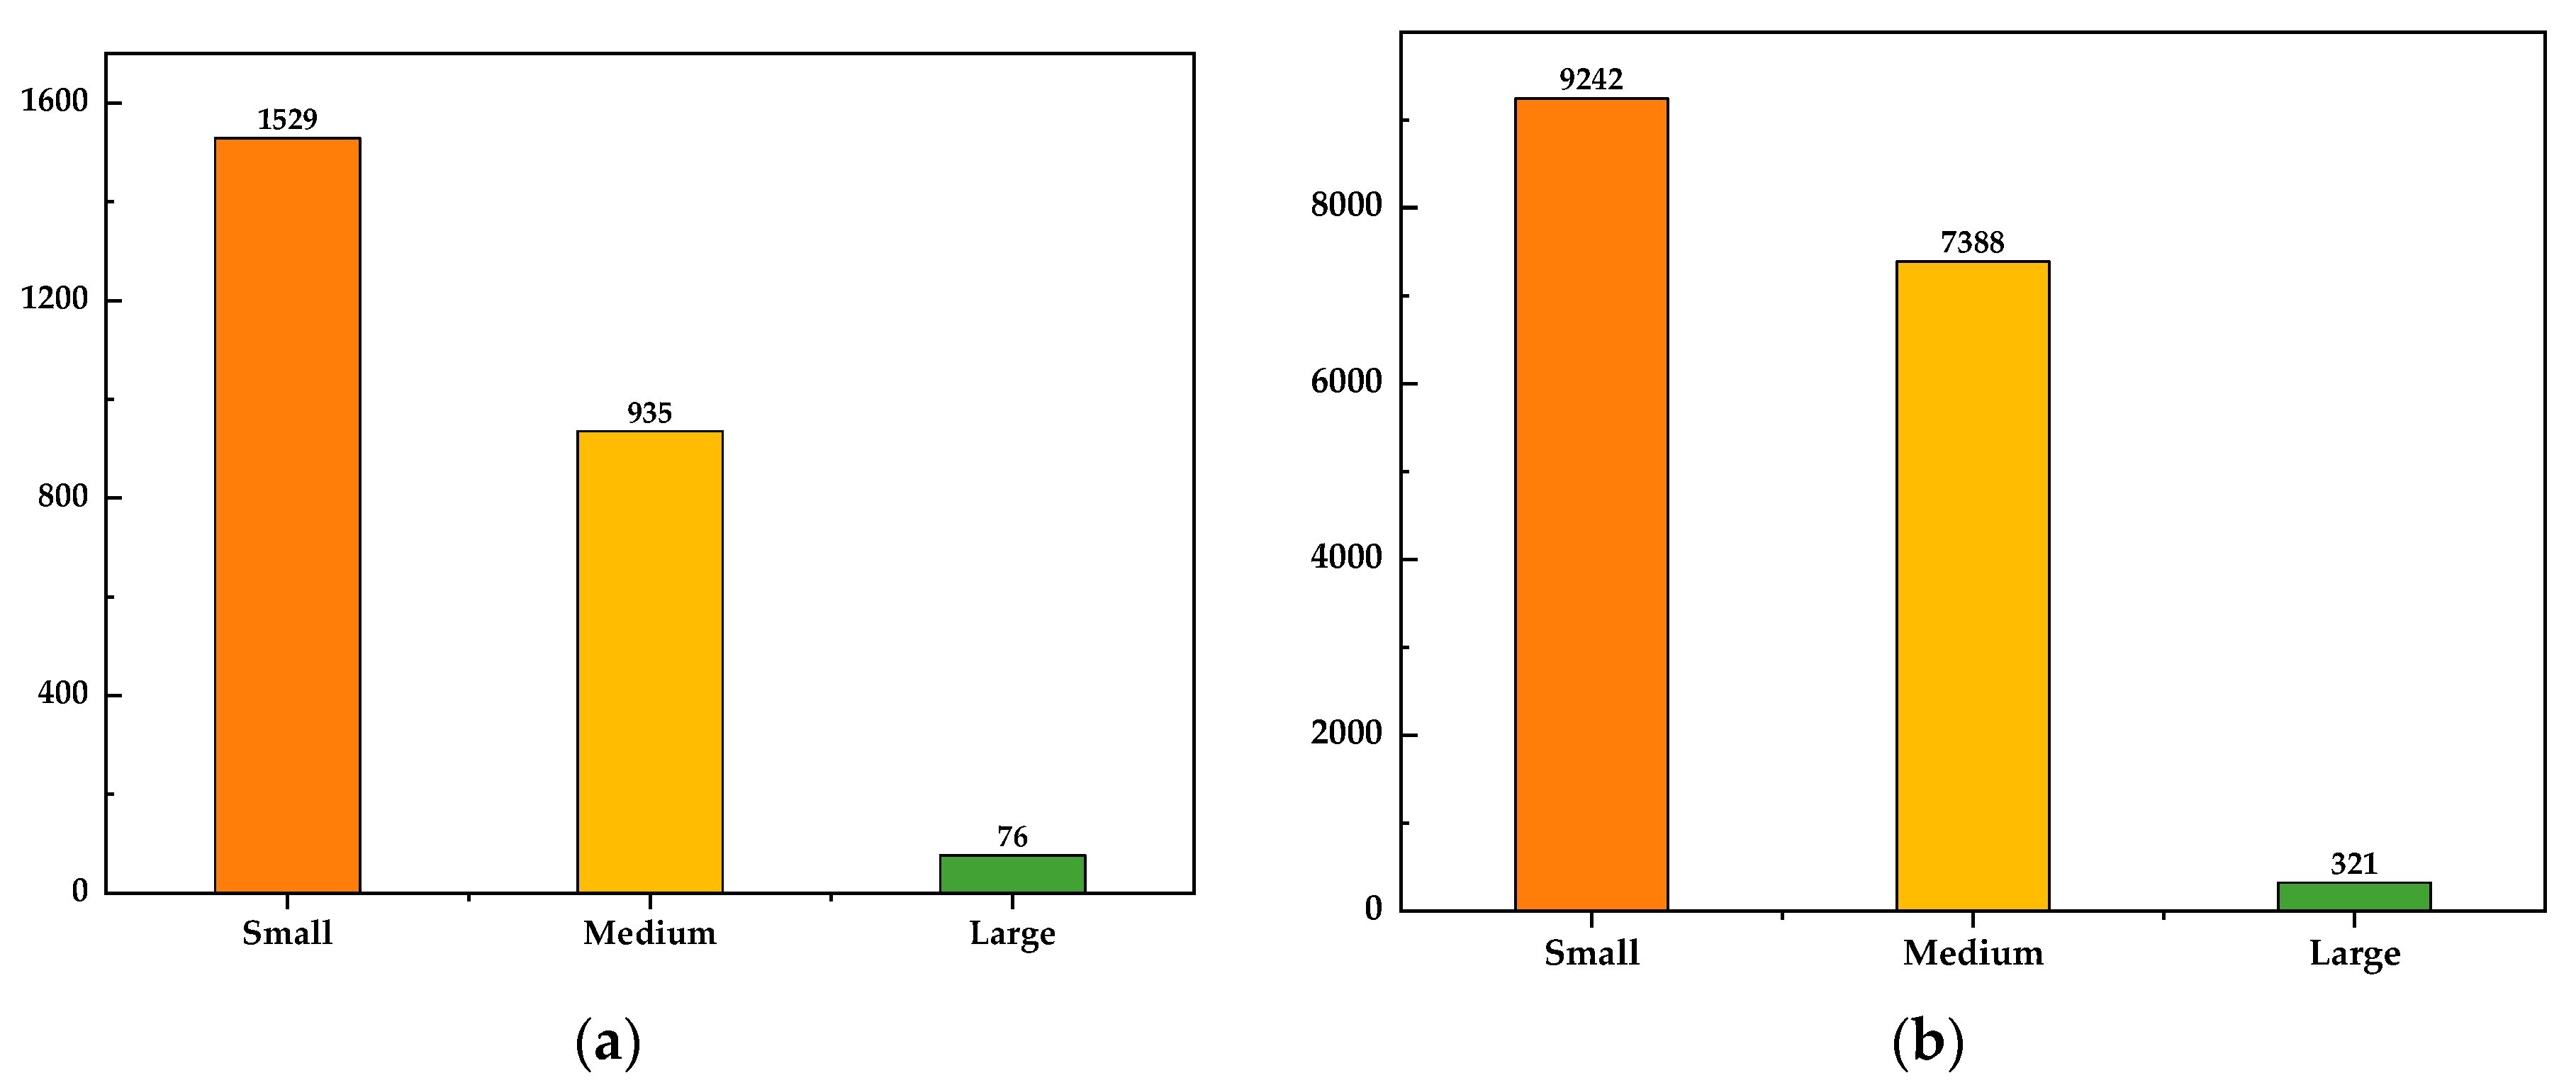
The SSDD dataset contains 1160 SAR images of different sizes, three satellite sensors provide the raw data, with image resolutions between 1 and 15 megapixels, and the imaging scenes include complex scenes such as docks and the near shore environment, and simple scenes, such as the sea surface. Each SAR image contains a different number, size, and category of ship objects. In this dataset, 60.2%, 36.8%, and 3% of all ships are made up of small, middle sized, and large ships, respectively. In addition, the image labels of the dataset are manually annotated by referring to the PASCALVOC dataset format.
- (2)
- HRSID:
The raw data of the HRSID dataset is obtained from three satellite sensors, TerraSAR-X, TanDEM-X, and Sentinel-B, and 136 panoramic SAR pictures are cut to 5604 SAR photos of 800 × 800, with resolutions ranging from 0.5 m to 3 m. The imaging scenes include complex scenes such as ports, docks, and the near shore environment, and simple scenes, such as the sea surface. Each SAR image contains a different number, size, and class of ship targets. There are 16,951 ships in the dataset, and 54.5%, 43.5%, and 2% of all ships, respectively, are small, medium-sized, and large ships. In addition, the image labels of the dataset are manually annotated by referring to the MS COCO dataset format.
Table 1 shows the details of the two different datasets, including image number, ship number, image size, etc. The HRSID picture set has greater quality and more detailed information about ship characteristics than does the SSDD image set.
Additionally, we count the ships of various sizes and provide these in the form of bar charts, as shown in Figure 7, to more clearly illustrate the number of ships of various sizes in the dataset. The chart shows that small and medium-sized ships make up the majority of the two datasets, while there are very few huge ships. This makes it possible to train and verify the proposed model in this paper’s tiny ship identification level and multi-scale ship recognition capability.
3.3. Experimental Evaluation Metrics
To assess the effectiveness of CSD-YOLO, we use mean average precision (mAP), precision (Precision), recall (Recall), and average precision (AP) as the assessment metrics. The following definitions of these indicators are provided:
3.4. Results and Discussion
3.4.1. Ablation Study
We used YOLOv7 as the baseline for the ablation experiments and SSDD as the experimental dataset to assess the impact of various improved components in CSD-YOLO. Comparative experiments were conducted to compare the advantages, disadvantages, and effects of various improvement strategies. The experimental results are shown in Table 2.
First, this paper switches out the SPPCSPC module in YOLOv7 for the ASPP model. From Table 2, it can be seen that ASPP has a more significant effect on SAR ship target detection, mainly because the traditional downsampling can increase the perceptual field, but will reduce the spatial resolution, while the use of cavity convolution can expand the perceptual field while ensuring the resolution, and different dilation rate settings give different perceptual fields to the network, allowing the model to capture multi-scale contextual information. From the experiment number 3, we can see that the model detection mAP improves to 98.36% after adding the attention module SA, showing that the SA module’s insertion lessens the missed detection brought on by the YOLOv7 algorithm due to unknown feature extraction. Finally, the application of the SIoU loss function significantly improves [email protected]:0.95 because in predicting the border regression, as a result of SIoU’s consideration of the overlapping region of the two frames, the centroid distance, and the aspect ratio, the final detection accuracy is better. Thus, this method is more comprehensive and integrated and is better for the training process.
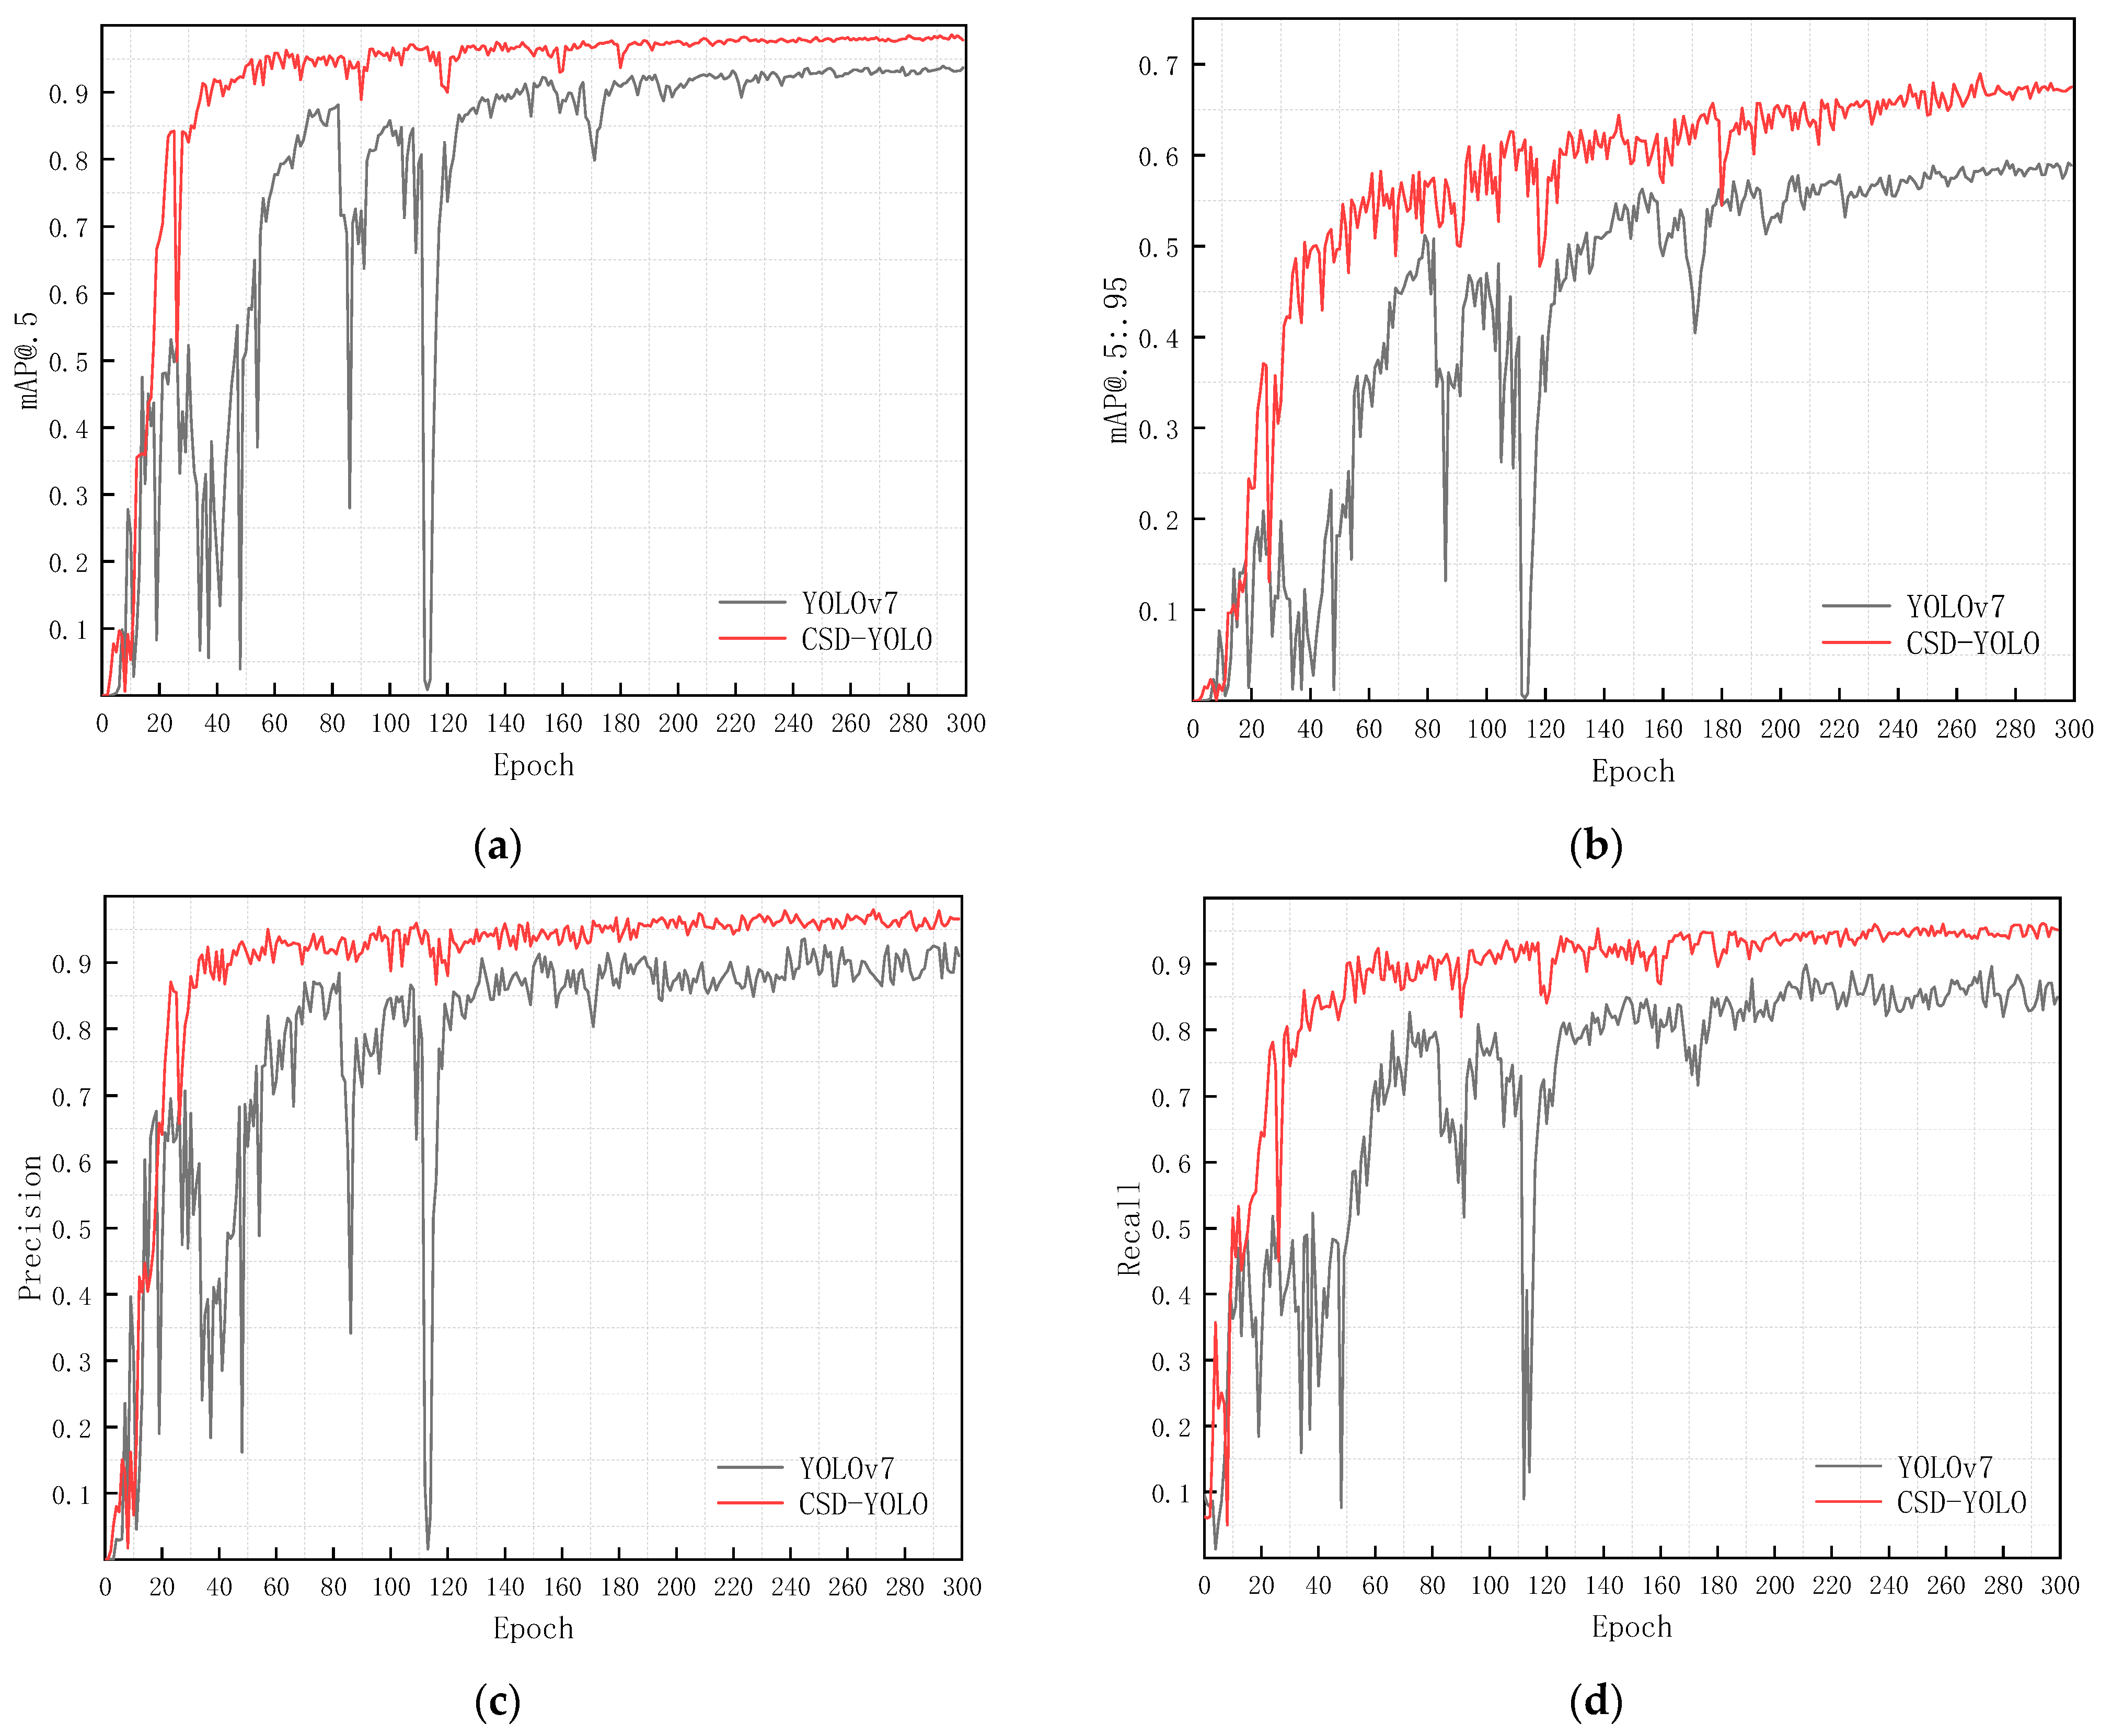
Moreover, based on the experimental results, we plotted Figure 8, which shows the comparison of CSD-YOLO and YOLOv7 for each metric, including the (a) curve of [email protected], (b) curve of [email protected]:0.95, (c) curve of precision, and (d) curve of recall. According to the comparison graphs, the CSD-YOLO proposed in this paper outperforms YOLOv7 in terms of each of these evaluation criteria. These findings show that CSD-YOLO performs significantly better overall than YOLOv7 in terms of its capacity to recognize multi-scale ships in complex environments.
Additionally, Figure 9 displays the proposed model’s bounding box loss, as well as the YOLOv7 bounding box loss, where (a) is the training set bounding box loss, and (b) is the validation set bounding box loss. The YOLOv7 box is presumed to be the mean GIoU loss function, and the proposed model box is presumed to be the mean SIoU loss function. We can see that the bounding box loss of CSD-YOLO is lower than YOLOv7 after training, which indicates that the prediction box of the model is more accurate.
The HRSID dataset is also utilized in this study to further validate the algorithm’s efficacy in terms of detection, and the outcomes are shown in Figure 10. Group A is a SAR image of a ship sailing on an unobstructed sea; the comparison of the recognition results shows that both the YOLOv7 model and CSD-YOLO have very good recognition results. However, when recognizing ships at the border position of the image, YOLOv7 has a missed detection phenomenon, as shown by the ships circled in the picture using yellow circles. This is because the ships are at the edge position of the image, with some missing information, and YOLOv7 wrongly assumes that these are not ships. The model proposed in this paper can accurately identify ships at the boundary of SAR images with higher confidence than the model proposed in YOLOv7. Group B is a multi-scale SAR image of a ship docked at a pier, which has a complex background, relatively close ship position, and multi-scale characteristics. From the experimental results, it can be seen that the YOLOv7 model not only retains the problem of missed ship detection at the edge of the picture, but also exhibits the error of missed and incorrect detection of ships on the shore. Ships that were missed because they were close to shore are circled in green, and incorrect detections are circled in brown. This is because the model recognition process is influenced by the background of the dock. Compared with the YOLOv7 model, the model proposed in this paper adds shuffle attention, which enables the model to focus more on the ship features and ignore the useless background information; thus, the model has higher recognition accuracy when facing the dock background. Group C is a SAR image of densely packed multi-scale ships. As can be seen from the experimental results, when the YOLOv7 model is faced with a dense stacking of ships, its detection results will have a more serious issue with missed detection, indicated with the pink circle. The CSD-YOLO model shows better performance in the face of the dense parking of multi-scale ships because this model incorporates depthwise separable convolution and atrous convolution with different expansion rates, which improves the extraction ability of multi-scale features of the model, even in the face of small target stacking, so the model has good recognition performance.
It is plain to observe that YOLOv7 is less clear for feature extraction, will be interfered with by the land, and will erroneously identify several dense ship targets as a single target, missing the objective, while CSD-YOLO effectively avoids these situations because the SAS-FPN modules in CSD-YOLO can enhance the extraction of multi-scale boat attributes and drastically decrease false alarm rates. This efficiently locates small ships under actual circumstances, facilitating a more accurate detection of ship targets at various scales. Table 3 displays the final identification results.
3.4.2. Comparison with Other Methods
In this section, we use five current popular ship detection models, Faster R-CNN, FCOS, YOLOv3, YOLOv5s, and YOLOv7, for comparison experiments with the proposed CSD-YOLO model on both SSDD and HRSID datasets. Considering that our model is a one-stage model, we selected more one-stage models for comparison, and only one two-stage square method, Faster R-CNN, was selected. In Table 4, the experimental findings are displayed. The experimental results showed that CSD-YOLO obtained the best mAP (98.60% on SSDD and 86.1% on HRSID). This is made possible by SAS-FPN’s enhanced sensitivity to small and medium-sized ships by redistributing the relevant parameters of the model, ignoring irrelevant information, reducing the false alarm rate of islands and other ship-like targets, and improving the recall of the model, which proves that it can extract accurate features to detect multi-scale ships in complex backgrounds. Compared with the base model YOLOv7, mAP improves from 93.93% to 98.60% on the SSDD dataset and from 83.64% to 86.10% on HRSID. Combined with Figure 8, we can see that CSD-YOLO performs better than YOLOv7 when faced with overlapping ships and intricate backdrops in SAR images. This is attributed to the SAS-FPN modules in CSD-YOLO, substantially improving the multi-scale ship target feature extraction and significantly lowering the false alarm rates.
3.4.3. Generalization Ability Test
The ability to generalize is a crucial factor for model evaluation [43]. As the SSDD was used for training and testing, it is important to assess the model’s generalizability using a variety of previously unseen SAR pictures. Images with complex backgrounds (in the harbor) coming from HRSID were used as a test dataset. The test samples included multi-scale ship of various scales against various backgrounds and had various temporal and polarization characteristics. Figure 11 shows the comparison chart. In group (b), the vessels in the green circle are misreported, and the ships in the red circle are not detected by other models. Notwithstanding the fact that there have been several cases of false alarms and missed identification for ship objects close to land, the CSD-YOLO can identify overlapping ships and ships in port better than other models.
4. Conclusions
Datasets of maritime SAR images naturally contain the presence of multi-scale ships. Current models are unable to efficiently extract multi-scale features, particularly in complicated situations such as docks and islands, where small ships are readily overlooked. We proposed CSD-YOLO based on YOLOv7 to address the aforementioned issue. It includes an SAS-FPN module combining an attention mechanism and atrous convolution, as well as the SIoU loss function. The SAS-FPN module improves the model’s multi-scale ship recognition capability by allowing the model to concentrate more on ship targets while ignoring the influence of irrelevant information. It can also fuse feature maps from different layers and is still effective even when recognizing small ships in complex environments. On the HRSID dataset and SSDD dataset made up of SAR images, studies using a variety of sophisticated detection models (Faster R-CNN, FCOS, YOLOv3, YOLOv5s, and YOLOv7) were compared. The findings reveal that CSD-YOLO has the best detection accuracy, and the generalization ability test further demonstrates this.
The major causes of the low accuracy of multi-scale ship identification in complex environments are incorrect and missing detection. The ASPP model and shuffle attention are features of the SAS-FPN module. The experimental results in Table 2 demonstrate that the model can identify more ships after incorporating the ASPP module, which offers a multi-scale sensory field for SAS-FPN. This is because ASPP uses global pooling and huge expansion rates, which frequently result in a variety of large receptive fields; however, in synthetic aperture radar images, where most of the data are small vessels, large receptive fields may introduce unexpected background noise. Additionally, in order for the model to pay less attention to extraneous variables, such as the environment, and devote more computational resources to shipping targets, particularly small targets, we offer shuffle attention, an attention mechanism that efficiently combines the spatial attention mechanism and the channel attention mechanism to obtain improved precision, while using relatively little computational power. This module also enables further improvement of recognition accuracy. Finally, compared with the baseline model YOLOv7, the mAP of CSD-YOLO improved from 93.68 to 98.60 on the SSDD dataset and from 83.64 to 86.10 on the HRSIDs dataset.
Furthermore, in complex environments, our suggested CSD-YOLO model can efficiently identify multi-scale ships, especially small ships, in SAR photos. Both defense ship detection and civilian ship search and rescue will benefit from this. We will investigate the model’s light weight and its deployment on mobile platforms in future research, making it possible to use this model in additional situations.
Author Contributions
Conceptualization, Z.C. and C.L.; methodology, Z.C. and C.L.; software, Z.C. and C.L.; validation, C.L.; formal analysis, C.L.; investigation, Z.C.; resources, Z.C. and C.L.; data curation, Z.C.; writing—original draft preparation, Z.C. and C.L.; writing—review and editing, Z.C. and C.L.; V.F.F. provided valuable suggestions for the overall concept of the paper; D.A.Y. provided valuable suggestions for the construction of algorithm model. All authors have read and agreed to the published version of the manuscript.
Funding
This article is supported by the 2021 project of Guangdong Province Science and Technology Special Funds (“College Special Project + Task List”) Competitive Distribution (2021A05237), by the project of Enhancing School with Innovation of Guangdong Ocean University (230420023 and 080507112201), and by the program for scientific research start-up funds of Guangdong Ocean University (R20065).
Data Availability Statement
The data presented in this study are available on request from the corresponding author.
Conflicts of Interest
The authors declare no conflict of interest.
References
- Zhang, Y.; Hao, Y. A Survey of SAR Image Target Detection Based on Convolutional Neural Networks. Remote Sens. 2022, 14, 6240. [Google Scholar] [CrossRef]
- Eldhuset, K. An Automatic Ship and Ship Wake Detection System for Spaceborne SAR Images in Coastal Regions. IEEE Trans. Geosci. Remote Sens. 1996, 34, 1010–1019. [Google Scholar] [CrossRef]
- Moreira, A.; Krieger, G.; Hajnsek, I.; Papathanassiou, K.; Younis, M.; Lopez-Dekker, P.; Huber, S.; Villano, M.; Pardini, M.; Eineder, M.; et al. Tandem-L: A Highly Innovative Bistatic SAR Mission for Global Observation of Dynamic Processes on the Earth’s Surface. IEEE Geosci. Remote Sens. Mag. 2015, 3, 8–23. [Google Scholar] [CrossRef]
- Feng, S.; Fan, Y.; Tang, Y.; Cheng, H.; Zhao, C.; Zhu, Y.; Cheng, C. A Change Detection Method Based on Multi-Scale Adaptive Convolution Kernel Network and Multimodal Conditional Random Field for Multi-Temporal Multispectral Images. Remote Sens. 2022, 14, 5368. [Google Scholar] [CrossRef]
- Zhou, Z.; Chen, J.; Huang, Z.; Luo, H.; Wu, B.; Li, Y. HRLE-SARDet: A Lightweight SAR Target Detection Algorithm Based on Hybrid Representation Learning Enhancement. IEEE Trans. Geosci. Remote Sens. 2023, 61, 5203922. [Google Scholar] [CrossRef]
- Yoshida, T.; Ouchi, K. Detection of Ships Cruising in the Azimuth Direction Using Spotlight SAR Images with a Deep Learning Method. Remote Sens. 2022, 14, 4691. [Google Scholar] [CrossRef]
- Brusch, S.; Lehner, S.; Fritz, T.; Soccorsi, M.; Soloviev, A.; van Schie, B. Ship Surveillance With TerraSAR-X. IEEE Trans. Geosci. Remote Sens. 2011, 49, 1092–1103. [Google Scholar] [CrossRef]
- Steenson, B.O. Detection Performance of a Mean-Level Threshold. IEEE Trans. Aerosp. Electron. Syst. 1968, AES-4, 529–534. [Google Scholar] [CrossRef]
- Wang, S.; Gao, S.; Zhou, L.; Liu, R.; Zhang, H.; Liu, J.; Jia, Y.; Qian, J. YOLO-SD: Small Ship Detection in SAR Images by Multi-Scale Convolution and Feature Transformer Module. Remote Sens. 2022, 14, 5268. [Google Scholar] [CrossRef]
- Yu, X.; Salimpour, S.; Queralta, J.P.; Westerlund, T. General-Purpose Deep Learning Detection and Segmentation Models for Images from a Lidar-Based Camera Sensor. Sensors 2023, 23, 2936. [Google Scholar] [CrossRef]
- Zhang, J.; Meng, Y.; Chen, Z. A Small Target Detection Method Based on Deep Learning With Considerate Feature and Effectively Expanded Sample Size. IEEE Access 2021, 9, 96559–96572. [Google Scholar] [CrossRef]
- Collobert, R.; Weston, J.; Bottou, L.; Karlen, M.; Kavukcuoglu, K.; Kuksa, P. Natural Language Processing (Almost) from Scratch. J. Mach. Learn. Res. 2011, 12, 2493–2537. [Google Scholar]
- Kang, M.; Ji, K.; Leng, X.; Lin, Z. Contextual Region-Based Convolutional Neural Network with Multilayer Fusion for SAR Ship Detection. Remote Sens. 2017, 9, 860. [Google Scholar] [CrossRef]
- Wang, J.; Cui, Z.; Jiang, T.; Cao, C.; Cao, Z. Lightweight Deep Neural Networks for Ship Target Detection in SAR Imagery. IEEE Trans. Image Process. 2023, 32, 565–579. [Google Scholar] [CrossRef] [PubMed]
- Jiang, Y.; Li, W.; Liu, L. R-CenterNet+: Anchor-Free Detector for Ship Detection in SAR Images. Sensors 2021, 21, 5693. [Google Scholar] [CrossRef] [PubMed]
- Ren, S.; He, K.; Girshick, R.; Sun, J. Faster R-CNN: Towards Real-Time Object Detection with Region Proposal Networks. IEEE Trans. Pattern Anal. Mach. Intell. 2017, 39, 1137–1149. [Google Scholar] [CrossRef] [PubMed]
- Pang, J.; Chen, K.; Shi, J.; Feng, H.; Ouyang, W.; Lin, D. Libra R-CNN: Towards Balanced Learning for Object Detection. In Proceedings of the 2019 IEEE/CVF Conference on Computer Vision and Pattern Recognition (CVPR), Long Beach, CA, USA, 15–20 June 2019; pp. 821–830. [Google Scholar]
- Nie, X.; Duan, M.; Ding, H.; Hu, B.; Wong, E.K. Attention Mask R-CNN for Ship Detection and Segmentation From Remote Sensing Images. IEEE Access 2020, 8, 9325–9334. [Google Scholar] [CrossRef]
- Ge, Z.; Liu, S.; Wang, F.; Li, Z.; Sun, J. YOLOX: Exceeding YOLO Series in 2021. arXiv 2021, arXiv:2107.08430. [Google Scholar] [CrossRef]
- Redmon, J.; Farhadi, A. YOLOv3: An Incremental Improvement. arXiv 2018, arXiv:1804.02767. [Google Scholar]
- Bochkovskiy, A.; Wang, C.Y.; Liao, H. YOLOv4: Optimal Speed and Accuracy of Object Detection. arXiv 2020, arXiv:2004.10934. [Google Scholar]
- Berg, A.C.; Fu, C.Y.; Szegedy, C.; Anguelov, D.; Erhan, D.; Reed, S.; Liu, W. SSD: Single Shot MultiBox Detector. arXiv 2015, arXiv:1512.02325. [Google Scholar]
- Tian, Z.; Shen, C.; Chen, H.; He, T. FCOS: Fully Convolutional One-Stage Object Detection. arXiv 2019, arXiv:1904.01355. [Google Scholar]
- Zhang, T.; Zhang, X.; Ke, X.; Zhan, X.; Shi, J.; Wei, S.; Pan, D.; Li, J.; Su, H.; Zhou, Y.; et al. LS-SSDD-v1.0: A Deep Learning Dataset Dedicated to Small Ship Detection from Large-Scale Sentinel-1 SAR Images. Remote Sens. 2020, 12, 2997. [Google Scholar] [CrossRef]
- Lin, T.-Y.; Dollár, P.; Girshick, R.; He, K.; Hariharan, B.; Belongie, S. Feature Pyramid Networks for Object Detection. arXiv 2016, arXiv:1612.03144. [Google Scholar]
- Zhou, D.; Zeng, L.; Zhang, K. A Novel SAR Target Detection Algorithm via Multi-Scale SIFT Features. J. Northwest. Polytech. Univ. 2015, 33, 867–873. [Google Scholar]
- Wang, W.; Cao, T.; Liu, S.; Tu, E. Remote Sensing Image Automatic Registration on Multi-Scale Harris-Laplacian. J. Indian Soc. Remote Sens. 2015, 43, 501–511. [Google Scholar] [CrossRef]
- Zhu, H.; Xie, Y.; Huang, H.; Jing, C.; Rong, Y.; Wang, C. DB-YOLO: A Duplicate Bilateral YOLO Network for Multi-Scale Ship Detection in SAR Images. Sensors 2021, 21, 8146. [Google Scholar] [CrossRef]
- Cui, Z.; Li, Q.; Cao, Z.; Liu, N. Dense Attention Pyramid Networks for Multi-Scale Ship Detection in SAR Images. IEEE Trans. Geosci. Remote Sens. 2019, 57, 8983–8997. [Google Scholar] [CrossRef]
- Zhou, K.; Zhang, M.; Wang, H.; Tan, J. Ship Detection in SAR Images Based on Multi-Scale Feature Extraction and Adaptive Feature Fusion. Remote Sens. 2022, 14, 755. [Google Scholar] [CrossRef]
- Sun, Z.; Leng, X.; Lei, Y.; Xiong, B.; Ji, K.; Kuang, G. BiFA-YOLO: A Novel YOLO-Based Method for Arbitrary-Oriented Ship Detection in High-Resolution SAR Images. Remote Sens. 2021, 13, 4209. [Google Scholar] [CrossRef]
- Wang, C.-Y.; Bochkovskiy, A.; Liao, H.-Y.M. YOLOv7: Trainable Bag-of-Freebies Sets New State-of-the-Art for Real-Time Object Detectors. arXiv 2022, arXiv:2207.02696. [Google Scholar]
- Gevorgyan, Z. SIoU Loss: More Powerful Learning for Bounding Box Regression. arXiv 2022, arXiv:2205.12740. [Google Scholar]
- Liang, T.; Chu, X.; Liu, Y.; Wang, Y.; Tang, Z.; Chu, W.; Chen, J.; Ling, H. CBNet: A Composite Backbone Network Architecture for Object Detection. IEEE Trans. Image Process. 2022, 31, 6893–6906. [Google Scholar] [CrossRef]
- Zhuang, L.; Mao, H.; Wu, C.-Y.; Feichtenhofer, C.; Darrell, T.; Xie, S. A ConvNet for the 2020s. arXiv 2022, arXiv:2201.03545. [Google Scholar]
- Liu, Z.; Lin, Y.; Cao, Y.; Hu, H.; Wei, Y.; Zhang, Z.; Lin, S.; Guo, B. Swin Transformer: Hierarchical Vision Transformer Using Shifted Windows. arXiv 2021, arXiv:2103.14030. [Google Scholar]
- Yang, Q.-L.Z.Y.-B. SA-Net: Shuffle Attention for Deep Convolutional Neural Networks. arXiv 2021, arXiv:2102.00240. [Google Scholar]
- He, K.; Zhang, X.; Ren, S.; Sun, J. Spatial Pyramid Pooling in Deep Convolutional Networks for Visual Recognition. IEEE Trans. Pattern Anal. Mach. Intell. 2015, 37, 1904–1916. [Google Scholar] [CrossRef]
- Rezatofighi, H.; Tsoi, N.; Gwak, J.; Sadeghian, A.; Reid, I.; Savarese, S. Generalized Intersection over Union: A Metric and A Loss for Bounding Box Regression. arXiv 2019, arXiv:1902.09630. [Google Scholar]
- Zheng, Z.; Wang, P.; Liu, W.; Li, J.; Ye, R.; Ren, D. Distance-IoU Loss: Faster and Better Learning for Bounding Box Regression. arXiv 2019, arXiv:1911.08287. [Google Scholar] [CrossRef]
- Zhang, T.; Zhang, X.; Li, J.; Xu, X.; Wang, B.; Zhan, X.; Xu, Y.; Ke, X.; Zeng, T.; Su, H.; et al. SAR Ship Detection Dataset (SSDD): Official Release and Comprehensive Data Analysis. Remote Sens. 2021, 13, 3690. [Google Scholar] [CrossRef]
- Wei, S.; Zeng, X.; Qu, Q.; Wang, M.; Su, H.; Shi, J. HRSID: A High-Resolution SAR Images Dataset for Ship Detection and Instance Segmentation. IEEE Access 2020, 8, 120234–120254. [Google Scholar] [CrossRef]
- LeCun, Y.; Bengio, Y.; Hinton, G. Deep Learning. Nature 2015, 521, 436–444. [Google Scholar] [CrossRef] [PubMed]
Figure 1.
SAR images in different scenes (a) without interference; (b) multi-scale ships in complex contexts.
Figure 1.
SAR images in different scenes (a) without interference; (b) multi-scale ships in complex contexts.

Figure 2.
Overall structure of CSD-YOLO.

Figure 3.
Detailed architecture of the FEN.

Figure 4.
The flow chart of the proposed method.

Figure 5.
Multi-scale feature extraction; various receptive fields result from various dilation rates.
Figure 5.
Multi-scale feature extraction; various receptive fields result from various dilation rates.

Figure 6.
Schematic diagram of angle cost.

Figure 7.
Statistics of the number of ship sizes in two datasets, (a) statistics of SSDD, (b) statistics of HRSID.
Figure 7.
Statistics of the number of ship sizes in two datasets, (a) statistics of SSDD, (b) statistics of HRSID.

Figure 8.
The training process of the two methods (YOLOv7 and the proposed model): (a) curve of [email protected], (b) curve of [email protected]:0.95, (c) curve of precision, (d) curve of recall.
Figure 8.
The training process of the two methods (YOLOv7 and the proposed model): (a) curve of [email protected], (b) curve of [email protected]:0.95, (c) curve of precision, (d) curve of recall.

Figure 9.
Bounding box loss (YOLOv7 and proposed model): (a) the training set bounding box loss and, (b) the validation set bounding box loss.
Figure 9.
Bounding box loss (YOLOv7 and proposed model): (a) the training set bounding box loss and, (b) the validation set bounding box loss.

Figure 10.
Detection results of YOLOv7 and CSD-YOLO.

Figure 11.
Comparison of the results of YOLOv5S, YOLOv7, and CSD-YOLO. The green circles are the wrong detection of each model; the red circles are the ship detected by CSD-YOLO but not detected by other models; the yellow circles are the target not identified by only one model.
Figure 11.
Comparison of the results of YOLOv5S, YOLOv7, and CSD-YOLO. The green circles are the wrong detection of each model; the red circles are the ship detected by CSD-YOLO but not detected by other models; the yellow circles are the target not identified by only one model.


Table 1.
Details of two datasets.
| Datasets | SSDD | HRSID |
|---|---|---|
| Polarization | HH, HV, VV, VH | HH, HV, VV |
| Image number | 1160 | 5640 |
| Ship number | 2551 | 16,965 |
| Image size (pixel) | 500 × 500, etc. | 800 × 800 |
| Resolution (m) | 1–15 | 0.5, 1, 3 |
Table 2.
Ablation study.
| NO. | Improvement Strategy | P | R | mAP 0.5 | mAP 0.5:0.9 |
|---|---|---|---|---|---|
| 1 | 91.05 | 84.92 | 93.68 | 59.35 | |
| 2 | +ASPP | 94.21 | 90.48 | 96.47 | 64.27 |
| 3 | +ASPP+SA | 96.8 | 93.7 | 98.36 | 67.57 |
| 4 | +ASPP+SA+SIOU | 95.9 | 95.9 | 98.60 | 69.13 |
Table 3.
Recognition performance of the two models on different datasets.
| Model | Dataset | Precision | Recall | mAP 0.5 |
|---|---|---|---|---|
| YOLOv7 | SSDD | 91.05 | 84.92 | 93.68 |
| HRSID | 85.52 | 74.58 | 83.64 | |
| CSD-YOLO | SSDD | 95.9 | 95.9 | 98.60 |
| HRSID | 93.22 | 80.42 | 86.10 |
Table 4.
Experimental results of different methods.
| Model | Dataset | Precision | Recall | mAP 0.5 |
|---|---|---|---|---|
| Faster R-CNN | SSDD | 81.63 | 85.31 | 89.63 |
| HRSID | 88.81 | 72.57 | 77.98 | |
| FCOS | SSDD | 84.15 | 92.52 | 90.61 |
| HRSID | 75.53 | 73.79 | 77.95 | |
| YOLOv3 | SSDD | 89.11 | 85.03 | 91.54 |
| HRSID | 88.73 | 69.19 | 80.59 | |
| YOLOv5s | SSDD | 95.14 | 90.01 | 96.28 |
| HRSID | 84.69 | 75.11 | 83.34 | |
| YOLOv7 | SSDD | 91.05 | 84.92 | 93.68 |
| HRSID | 85.52 | 74.58 | 83.64 | |
| CSD-YOLO | SSDD | 95.9 | 95.9 | 98.60 |
| HRSID | 93.22 | 80.42 | 86.10 |
Disclaimer/Publisher’s Note: The statements, opinions and data contained in all publications are solely those of the individual author(s) and contributor(s) and not of MDPI and/or the editor(s). MDPI and/or the editor(s) disclaim responsibility for any injury to people or property resulting from any ideas, methods, instructions or products referred to in the content. |
© 2023 by the authors. Licensee MDPI, Basel, Switzerland. This article is an open access article distributed under the terms and conditions of the Creative Commons Attribution (CC BY) license (https://creativecommons.org/licenses/by/4.0/).
Share and Cite
MDPI and ACS Style
Chen, Z.; Liu, C.; Filaretov, V.F.; Yukhimets, D.A. Multi-Scale Ship Detection Algorithm Based on YOLOv7 for Complex Scene SAR Images. Remote Sens. 2023, 15, 2071. https://doi.org/10.3390/rs15082071
AMA Style
Chen Z, Liu C, Filaretov VF, Yukhimets DA. Multi-Scale Ship Detection Algorithm Based on YOLOv7 for Complex Scene SAR Images. Remote Sensing. 2023; 15(8):2071. https://doi.org/10.3390/rs15082071
Chicago/Turabian StyleChen, Zhuo, Chang Liu, V. F. Filaretov, and D. A. Yukhimets. 2023. "Multi-Scale Ship Detection Algorithm Based on YOLOv7 for Complex Scene SAR Images" Remote Sensing 15, no. 8: 2071. https://doi.org/10.3390/rs15082071
Note that from the first issue of 2016, this journal uses article numbers instead of page numbers. See further details here.