

Remote Sensing Object Detection in the Deep Learning Era—A Review

1
Geospatial Data Analytics Laboratory, The Ohio State University, Columbus, OH 43210, USA
2
Department of Civil, Environmental and Geodetic Engineering, The Ohio State University, Columbus, OH 43210, USA
3
Department of Electrical and Computer Engineering, The Ohio State University, Columbus, OH 43210, USA
4
Translational Data Analytics Institute, The Ohio State University, Columbus, OH 43210, USA
*
Author to whom correspondence should be addressed.
Remote Sens. 2024, 16(2), 327; https://doi.org/10.3390/rs16020327
Submission received: 7 November 2023
/
Revised: 31 December 2023
/
Accepted: 9 January 2024
/
Published: 12 January 2024
(This article belongs to the Special Issue New Trends of GEOBIA in Remote Sensing)
Abstract
:Given the large volume of remote sensing images collected daily, automatic object detection and segmentation have been a consistent need in Earth observation (EO). However, objects of interest vary in shape, size, appearance, and reflecting properties. This is not only reflected by the fact that these objects exhibit differences due to their geographical diversity but also by the fact that these objects appear differently in images collected from different sensors (optical and radar) and platforms (satellite, aerial, and unmanned aerial vehicles (UAV)). Although there exists a plethora of object detection methods in the area of remote sensing, given the very fast development of prevalent deep learning methods, there is still a lack of recent updates for object detection methods. In this paper, we aim to provide an update that informs researchers about the recent development of object detection methods and their close sibling in the deep learning era, instance segmentation. The integration of these methods will cover approaches to data at different scales and modalities, such as optical, synthetic aperture radar (SAR) images, and digital surface models (DSM). Specific emphasis will be placed on approaches addressing data and label limitations in this deep learning era. Further, we survey examples of remote sensing applications that benefited from automatic object detection and discuss future trends of the automatic object detection in EO.
1. Introduction
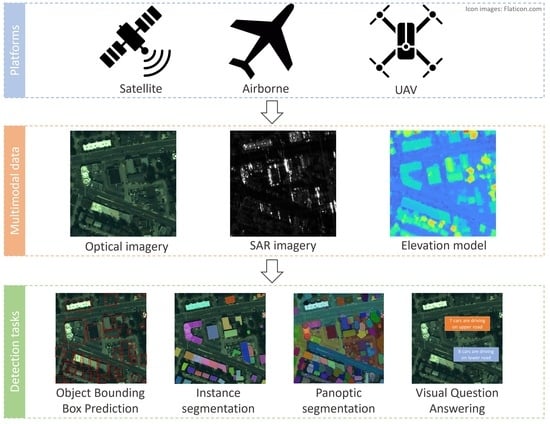
With the development of remote sensing technology in recent decades, spaceborne sensors with sub-meter spatial resolution (World-View2-4, Pleiades, etc.) achieved a comparable image quality to airborne images [1] a few decades ago. With these sensors running 24/7, the volume of data has dramatically grown to the extent that automatic image interpretation, or detection of objects, is becoming necessary. Objects of interest, such as buildings, vehicles, ships, powerplants, tanks, and solar panels, are nowadays readily detectable and could often be preformed repetitively given the frequent Earth observational (EO) datasets. These geographically located objects arguably become one of the most important information resources in many civilian applications and can be achieved at a low cost, and accurate object detection approaches should be available [2,3]. The prevalence of deep learning in the computer vision (CV) community has dramatically boosted this possibility by first demonstrating extremely well-catered results in everyday images using a large capacity model with millions of labeled images [4,5]. This has excelled at traditionally bounding box-based object detection and additionally driven newer classes of detection, i.e., instance segmentation or panoptic segmentation (instance segmentation with background), that establish object detection as the segmented object of interests containing well-delineated object boundaries at the instance level (See Figure 1 for the definition of different types of object detection).
Object detection methods date back to early and traditional methods that rely on hand-crafted and distinctive features, such as SIFT [6] and HOG [7], and match objects of interest in the images based on object examples (template image). Then, bounding boxes are extracted to describe the successful detections. As deep learning (DL) became standard in many image-recognition problems, the traditional handcrafted feature-based approach, at least in cases where sufficient labels could be found, was sooner superseded by DL models with learnable features. It was shown that, as larger and larger datasets are becoming more available [8,9,10,11,12,13], the performance of bounding box-based object detection has dramatically improved and further developed into instance and panoptic segmentation models where objects of interest are delineated at the individual pixel level [5,14,15].
As compared to everyday images, EO images are more diverse in content and data modality, and most importantly, they possess much fewer community contributions to labeled data. For example, typical CV images are mostly collected by citizen scientists or researchers using cameras at the ground level; thus, they share similar scene structures and can be well described as the number of training samples grown. However, the EO assets can be diverse in terms of their modality (optical and SAR), resolution, and content, making these well-consolidated approaches less applicable to EO data. For instance, it is difficult to directly transfer existing deep learning methods to deal with optical and SAR (synthetic aperture radar) images due to the highly diversified data across multiple modalities and resolutions as well as the lack of designated training sets. The nature of EO data with an overhead view inherently delineates objects on the ground (i.e., buildings, vehicles, etc.) with relatively smaller sizes as compared to their background [16], oftentimes taking up image footprints of fewer than 100 pixels, making them easily polluted by noise and randomness due to their geographical diversity, object scale, morphology, and sensor responses.
These challenges in EO make the object detection problem in this context much more open to address. Therefore, in order to approach the problem in a more tractable manner, researchers explored the use of multi-modal data to improve the discriminativeness of features in the scarcity of data labels. This assumes that data from multiple sources, including optical, SAR, and light detection and ranging (LiDAR) or photogrammetric data, can help the algorithm better comprehend the object classes, especially when limited training samples are available [17,18,19]. This, however, brings new challenges and solutions in DL from multi-modal data, which leads to flows of efforts to address. In parallel, more and more recent works consider leveraging the vast volume of both nature images in CV and remote sensing images to perform so-called X-shot learning [20,21,22,23,24,25], harnessing the power of pre-trained and fine-tuned networks to boost object detection performances [25,26]. This was further aided by using the nowadays well-developed language models to realize automated object detection in a much larger label space, i.e., fine-grained object detection.
We found that, despite the rich literature on the topic of object detection in EO data, there are no new surveys summarizing these emerging works in object detection with EO data, and a comprehensive survey of such is critically needed. In this paper, we provide an update and systematic synthesis of the current object detection methods for use in EO data, with a specific focus on methods driven by DL, such as instance and panoptic segmentation, as well as methods for use in the case of multi-modal data. We will also survey emerging methods that integrate language models to further automate fine-grained object detection. Compared to other review articles, we organize the object detection tasks from sensor and imagery features including optical, SAR, and 3D data. In addition, we also include the learning strategies for multi-modal source of remote sensing data and label imbalances and categorical inconsistency issue, which few remote sensing review papers study. Our survey will start by briefly introducing typical sensors and resolutions of EO data (Section 2), then set up a commonly used framework to encapsulate the various emerging works mentioned above, including multi-modal data, X-shot learning, and language models (Section 3). In order to make the readers aware of the ever-growing dataset, we compiled a short description of the most used datasets in the area (Section 4). Further, we provide an overview of existing EO applications that significantly benefited from the ever-enhanced object detection methods (Section 5). Finally, we conclude the review by providing our thoughts on the status quo of the current efforts and future trends.
2. Overview of EO Sensors and Data
Early remote sensing land-cover and land-use products adapt a spatial resolution varying from 100 m to 1 km per pixel [27], which is based on pixel-level classification. With the development of sensor technologies, high-resolution and very high-resolution (VHR) cameras and sensing devices are now readily available for a variety of platforms, including satellite, airborne, and unmanned aerial vehicles (UAVs). From these high spatial resolution images, ground object detection tasks can be achieved with aerial images, UAV images, and space-borne images with a higher spatial resolution than 10 m [28], and many more ground objects can be observed clearly from these images; then, researchers can use multiple automatic methods to locate and recognize these ground objects by using detection methods.
Remote sensing data for object detection can be divided into three categories: (1) 2D passive data, which will collect the reflectance of natural light or thermal using optical sensors and generate optical imagery; (2) 2D active data, which will actively transmit signals and then collect the reflectance, such as SAR; (3) 3D data, such as from LiDAR and photogrammetric data generated from 2D imagery. Both optical and SAR sensors can capture ground objects with their unique features in images, and 3D data can also be represented in an image/raster format (height or depth map). Therefore, this introduces a great level of flexibility when adapting image-based methods to different modalities. However, different modality information from sensors may provide complementary information (e.g., the SAR data can generally penetrate clouds, providing information about the scene under weathered conditions while the images are subject to strong speckle noise), and optical images, especially spaceborne images, are constrained to cloud-free acquisitions but can provide more object details with significantly less noise.
Therefore, understanding the imaging characteristics of these sensors is necessary to make full use of their potential. In the following subsections, we provide an overview of the characteristics of data from different sensors, including optical data, SAR, and LiDAR data.
2.1. 2D Passive Data: Optical Sensors and Images
Optical data are the most common source in remote sensing, which captures the reflected energy of the ground primarily from solar radiation. Spaceborne sensors are one of the preferred means to effectively reconstruct ground objects at the global level [29]. Currently, this is made possible with high-resolution satellite imagery (between 0.3–10 m ground sampling distance (GSD)). Most satellite sensors contain both panchromatic band and multispectral bands, in which the panchromatic band covers the entire visible and near-infrared range. Because it does not need to share pixels to store information from multiple bands, it can be made with a higher resolution. The multispectral bands store spectral information for individual and narrower ranges; they are designed with a lower resolution. Such a setup allows for users to extrapolate multispectral information by using the panchromatic image. This is performed through pan-sharpening [30], which essentially fuses the high-detailed panchromatic image with the high-spectral resolution multispectral image to produce high-resolution multispectral images. Oftentimes, the spatial and spectral resolution of the data may decide the level of granularity in the object categories. For example, cars usually take up tens of pixels in satellite images with a 0.3 m GSD, while for images with a GSD of 5 m or lower, cars are at sub-pixel level; hence, they are not detectable. In addition, spectral information may play an important role in identifying certain objects. For example, the near-infrared (NIR) band is the pivot for vegetation detection [31,32]; from the physical sensing perspective, the chlorophyll of the vegetation has a unique reflectance response for NIR. Moreover, spaceborne platforms have complex data logistics; since data transmission on the spaceborne platforms is subject to power and bandwidth [33], it has been more often recognized that on-board processing with light detection networks is important to perform on-demand and selective data and result transmission [34,35].
Airborne sensors are mounted either on manned airplanes or UAVs, which, as compared to those of spaceborne platforms, can capture data with a higher resolution. The common spatial resolution for aerial-based sensors is 0.1–0.3 m GSD (or National Agriculture Imagery Program (NAIP) with 1 m GSD), and for UAV-based sensors, it is smaller than 0.1 m GSD. Aerial and UAV platforms are often more flexible given that the sensor suites and flight design can be made based on specific project requirements per flight campaign.
In summary, Figure 2 lists spatial and spectral resolution ranges of the sensors on three platforms, i.e., satellite, airborne platform, and UAV. Depending on specific application scenarios and the size of the object of interest, users opt to use the appropriate sensors (and platforms), which cover object sizes from centimeters to meters.
2.2. 2D Active Data: Synthetic Aperture Radar Data
Synthetic aperture radar (SAR) provides an active observation solution to capture ground objects by using the microwave and measuring the backscattered signal. SAR sensors can capture scenes under all weather conditions, i.e., penetrate certain air elements (clouds and fog) and ground matters (leaves, snow, and sand). Given the imaging physics of SAR, its imagining-level preprocessing is often more complex; as SAR is a side-looking, ranging device (radar-image plane), the positioning of the backscattered returns in the image depends on how far away the target is from the antenna along the slant plane [36]. Typical SAR sensors for ground object detection tasks can reach a higher spatial resolution of 10 m and can reach 1 m for airborne SAR and sometimes spaceborne SAR (Table 1 lists the example of SAR systems in use). In addition, since SAR operates at the microwave level, it can measure signals with different polarizations (vertical and horizontal), which is specifically useful to differentiate ground objects with their surface properties [37,38]. For example, rough surfaces tend to scatter radar waves, while smooth surfaces tend to produce more specular reflections. SAR imagery of smooth surfaces tends to receive no signals, while the intensity of the received signal (a fraction of the emitted strength) may grow as the surface roughness increases. This feature allows for SAR imagery to easily differentiate objects on water surfaces, such as ships and oil spills. Ships create waves with distinct roughness patterns, while oil spills typically dampen waves and thus create a smoother surface. Such patterns can be robustly detected using simple algorithms [39,40,41,42]; therefore, they are widely used in practice. In addition, SAR signals are sensitive to 3D structure or height changes for ground objects due to the geometry mechanism of side-view radar waves and the shadowing and layover effects of radar, which benefit the detection of 3D structural changes of the object. However, one of the biggest challenges of SAR data is the well-known and undesired speckle effects of the signal, where the return signals are randomly influenced by each other, causing challenges for many of the detection algorithms [43,44].
2.3. 3D Data: LiDAR and Photogrammetry Data
Three-dimensional information from remote sensing is also significant to assist remote sensing-based object detection. Object height will bring crucial information on the geometry of the objects to better differentiate them into different categories [45,46]. Three-dimensional information can be acquired using remote sensing techniques, such as LiDAR (mostly airborne), photogrammetry, and SAR interferometry/tomography. These approaches generally produce 3D information in the form of point clouds. To facilitate an existing image-based object detection framework, this 3D information is typically converted into a raster format (height or depth map) through projection. Then, this height/depth map is used either as an additional band or source for the input of a detection framework.
LiDAR adapts nanometer wavelengths (laser) to obtain the backscatter as a point with distance and intensity information. It either measures the time of flight of the laser pulse or the phase differences for distance measurements. With a single scan, the resulting measurements contain millions of points, forming point clouds that characterize the accurate geometry of the surface. The point spacing (spatial resolution) for airborne LiDAR usually has a range of 0.05–0.1 m. Object detection approaches directly on LiDAR have been intensively investigated in the computer vision (CV) community, e.g., in automated driving [47]. Similar approaches were used for airborne or UAV-borne LiDAR. More often in a remote sensing context, LiDAR data are integrated into an image-based object detection pipeline, and a necessary conversion is required from an unevenly distributed point cloud to a raster format, such as a depth map or an elevation map [48,49].
In addition to LiDAR, there are other methods to generate 3D information. For example, 3D photogrammetric point clouds are generated based on dense stereo matching using multi-view optical remote sensing images [50,51,52,53,54,55,56,57]. InSAR (Interferometric SAR), although considered image-based 3D, uses a completely different mechanism to derive 3D. Instead of deriving 3D using perspective parallaxes, it uses the phase shifting of microwaves through interferences to derive topographic information [58]. Generally, LiDAR produces the most accurate topographic information, although it is expensive to acquire. Three-dimensional information derived with photogrammetry depends on the sensors and resolution, but InSAR-based topographic information is relatively coarse and is often used as the foundational terrain layer for orthorectification, e.g., the Shuttle Radar Topography Mission (SRTM) DEM.
3. An Overview of Remote Sensing Object Detection and Segmentation
Object detection aims to find the location and category of all interesting objects in images or 3D data; often, the results are in the form of bounding boxes. Instance segmentation [14,59] aims to delineate the extracted boundaries of the individually detected objects. When the background object/scene categories are of interest, panoptic segmentation [15] can be employed to extract the background categories where these objects sit. In remote sensing datasets, the processes of image-based object detection and segmentation are employed to extract pertinent feature information from optical or synthetic aperture radar (SAR) images, 3D data, or 2D data with height information. Due to the inherent characteristics of sensors, remotely sensed data exhibit greater diversity in terms of object scale, spectral reflectance, morphology, etc.; therefore, it poses unique challenges in object detection and related tasks.
A typical object detection and segmentation pipeline for both traditional and deep learning methods contains three major steps: proposal generation, feature extraction, and object classification (and segmentation), which will be introduced in Section 3.1. The performance of traditional methods, such as SVM [60] and a decision tree [61], highly relies on the quality of human-designed features and their limitations in terms of their model simplicity. Instead, the prevalent deep learning approaches nowadays are gaining enough thrust in a promising direction as they can easily achieve a much better performance than traditional methods, which will be introduced in Section 3.2.
Remote sensing imagery has special physical characteristics in terms of data accessibility and label distribution; often, both data and labels are relatively limited as compared to ground-level images (in the CV community). Therefore, utilizing muti-modality data is one of the necessary paths. The recently developed sensor systems allow for the simultaneous collection of both images and LiDAR point clouds, such as the commercial solution Citymapper [62] or the researcher-designed solution [63,64]. Oftentimes, the 3D information can also be derived through stereophotogrammetry. Therefore, it is possible to combine the image and the 3D information (e.g., DSM). Moreover, most optical remote sensing images typically include more than just visible (RGB) bands, allowing for the detection of a wider range of reflectance features of ground objects, which is in Section 3.3.
Despite the recent boost of community-contributed datasets, the label for EO datasets is still insufficient to develop object detection models at the global scale. Existing EO datasets suffer the label imbalances and categorical inconsistency. i.e., different label definitions across different datasets, and oftentimes, inaccuracy due to the citizen/crowdsource contributions lack quality control (e.g., the OpenStreetMap (OSM) [65,66]). Therefore, many object detection tasks still need to be operated on given weak labels (noisiness, imbalance, open-set [67,68]). Therefore, methods to perform object detection under weak supervision are necessary (detailed in Section 3.4). Furthermore, there is a growing trend in multi-modal interaction in human–machine teaming to enable a context-driven, text-based search, which utilizes language models to interact with detected remote sensing objects, and details of this topic are discussed in Section 3.5.
3.1. Common Pipeline for Object Detection in EO Data
The general framework to detect objects in an image with both traditional and deep learning image processing methods follows a cascade workflow, including (1) object proposal generation, (2) feature extraction, and (3) object classification, as shown in Figure 3, with various pre-processing or post-processing depending on the input and required output. Typical image pre-processing includes color normalization, image size scaling and clipping, or other methods to normalize images and improve the image quality. Pre-processing is also necessary for deep learning-based methods for object detection and instance segmentation.
Instead of assuming a window center on every pixel being a potential object candidate, proposal generation uses methods (often lightweight and efficient) to detect the region of interest (ROI), where potential candidates are. The traditional proposal generation method will adopt the sliding windows with a very efficient first pass of feature description and decision (e.g., intensity feature, template matching, or shallow classifiers) [69,70], where the subsequent detection will be based.
The feature extraction will discover color, texture, or height features inside a proposal using feature detectors such as Haar [71], HOG [7], SIFT [6], SURF [72], ORB [73], and so on. In optical (multispectral) images, features including color, texture, and edge information may be used to identify objects. In addition, in SAR images, features such as backscattering intensity and texture may be used instead. In the DSM/DEM raster, features can be height and height gradients or more complex shape indices [74].
In the object classification or decision step, the classifier is trained to distinguish the object class based on the feature inside the proposal. Typically, the classifier can be any common supervised classification method, such as SVM [60,70], a decision tree [61,75], random forest [76,77], or more complex deep learning models [78,79].
The post-processing may include heuristic steps that filter out small patches, remove duplicated detections, etc., to keep the results in compliance and, at the same time, eliminate possible false positives. Examples of techniques, such as connected component analysis (for small object removal), non-maximum suppression (for removing duplicated detections), or confidence-based filtering (removing objects with low posterior confidence scores), can be applied in this process.
When the exact boundaries of the individual objects are desired, segmentation approaches, such as instance segmentation and panoptic segmentation, can be further applied. Traditional image segmentation will group similar (color or features) pixels for a certain class, which will first segment the foreground and background within the bounding box (such as K-means [80], mean-shift [81], or supervised methods [70,82]), then segment multiple classes that the bounding box should contain.
Deep learning-based methods still follow the same object detection framework (as shown in Figure 3), while it uses a convolutional layer to replace the feature extraction step and a regional proposal network (RPN) to replace the proposal generation step in the traditional method framework, which have been shown to outperform traditional methods [83].
3.2. Deep Learning Methods for Object Detection in EO
3.2.1. Object Bounding Box Prediction
Traditional object detection algorithms rely on handcrafted features and cascaded frameworks, as partly discussed in Section 3.1. The cascaded framework (Figure 3), which consists of object proposal generation, feature extraction, and object classification, has been inherited by two-stage deep learning methods. In these methods, an end-to-end deep neural network replaces feature extraction and classification, while another neural network replaces the object proposal generator. These approaches were reported to have significantly improved the object detection performance and speed. Another class of methods performs object detection and classification in a single stage: instead of using sliding windows or selective search algorithms to find object proposals, single-stage methods use a grid-based approach to cover the entire image and perform object detection and classification in a single pass through a deep neural network.
Two-Stage Object Detection Methods
Among the two-stage object detection methods, the most famous representative is the region-based convolutional neural network (R-CNN) [5] and its variant/derived methods. The detection method can be divided into the region proposal stage and classification stage. In the first stage, selective search algorithms are applied to generate region proposals, which can be then passed to the classification network in the second stage. The R-CNN family of algorithms is known for its high accuracy, but it is computationally expensive, as it requires multiple forward passes through the CNN for each prediction. Most of its variants focus on improving speed and reducing computational efforts. Fast R-CNN [84] is a successor to R-CNN. To avoid feeding every region into the classification network, it applies feature extraction on the entire image and then crops feature maps according to region proposals, which has significantly improved the efficiency of the approach. Faster R-CNN [85] uses a region proposal network (RPN) to replace classical selective search algorithms to reduce the running time in the first stage. However, faster R-CNN still needs to pass each region into a fully connected network, a computational step. R-FCN [86] addresses the problem by introducing full convolutional architecture that further boosts the speed without a performance loss.
In remote sensing research, modifications are proposed to adapt the characteristics of overhead imagery. Remote sensing images are taken at a distance; thus, the size of most ground objects is small in their pixel footprints. Ren et al. [87] adjusted the RPN network to provide more anchors and modified the feature extraction network to provide high-resolution feature maps. In addition, the introduced contextual detection model utilized surrounding information to boost the performance of small object detection. Bai et al. [88] improved faster R-CNN by using a dense residual network (DRNet) as the backbone network and borrowed the ROI align method [14] to facilitate building detection in remote sensing images.
Single-Stage Object Detection Methods
YOLO [89] is a state-of-the-art system for object detection, which has been widely used due to its speed and accuracy. First, YOLO uses a single neural network to perform both classification and localization. In the process of the YOLO pipeline, it divides the image into a grid and predicts the bounding boxes, class probabilities, and confidence scores for each grid cell, which can be easily scaled and accelerated by distributing multiple tasks to computing nodes, such as clusters or clouds. The grid partition also makes it compatible with remote sensing applications where the tiling/partitioning schema was the most common strategy in large imagery processing. Second, the YOLO networks are highly efficient and can be beneficial to process large-format remote sensing images. Lastly, YOLO has a large community of researchers and industrial developers who continue to improve and expand the system. The YOLO system was initiated in 2015 and finished in 2018 [90,91], and then, the community continued pushing the boundary of the algorithm to be more accurate, more efficient, and more robust [92,93,94,95]. As of the date of submission, the latest version YOLOv8 [96] is known for its improved accuracy and speed compared to its predecessors. YOLO was known to be less effective on small objects. A single-shot detector (SSD) [97] addressed YOLO’s inability to detect small objects by incorporating anchor (prior boxes) ideas from faster R-CNN and utilizing a fully convolutional network for detection instead of fully connected layers.
To apply the YOLO methods or similar kinds to remote sensing datasets, modifications are also necessary. Improving the performance of small object detection is common sense. YOLO-Fine [98] is modified based on YOLOv3, which performs detection on multiple levels of the pyramid (scales). The authors discard low-res levels in the original network architecture and replace them with high-res levels, and the backbone was carefully pruned to relieve the computational burden without performance dropping. SSS-YOLO (small ship detection in SAR image with YOLO) [39] also removed low-res levels and proposed the path argumentation fusion network (PAFN) to exploit shallow features that capture more local texture and patterns. To detect objects with different orientations, BiFA-YOLO [99] introduced a bi-directional feature fusion module (Bi-DFFM) to aggregate features across different levels and integrated angular classification to predict the orientation of the region of interest (ROI) box.
3.2.2. Instance Segmentation in EO Data
Instance segmentation, as introduced earlier, also plays an important role in remotely sensed image analysis. Like object detection, instance segmentation will identify and localize individual interesting objects, while it will additionally delineate the boundary of individual objects by assigning labels to individual pixels. In addition, compared to another related task–semantic segmentation, instance segmentation separates the same object class with individual instances. An instance segmentation technique produces an image where each pixel has a class label corresponding to individual objects.
There are two main categories of methods for instance segmentation, which either starts from detection or starts from segmentation; detection-and-segmentation, like what the name entails, aims to detect interesting objects first and then segment pixels in the proposed window. Segmentation-and-detection, on the other hand, first classifies the label of each pixel at the pixel level and then segments (unsupervised) the pixel into instance-level objects. Besides these two categories with two stages, there are also several single-stage methods in instance segmentation, and self-attention-based methods use a transformer structure [100,101,102]. In the following subsections, we further introduce the details of instance segmentation and then common methods applied in remote sensing images.
Detection-and-Segmentation Methods
Detection-and-segmentation methods start from the object detection framework (Section 3.2.1) to first detect objects with bounding boxes. Recent methods mostly use R-CNN [5]-based approaches and their variants. R-CNN-like methods generate region proposals with selective search algorithms first and then adapt CNN to classify the object’s category. Mask R-CNN [14] added a mask branch to the faster R-CNN architecture [85], which predicts a binary mask for each object. The mask branch is layered on top of the detection pipeline to enable the generation of proposals using external object proposal methods (such as area proposal networks or selective search), which are then sent through the CNN backbone to produce a set of features. The class label, bounding box coordinates, and mask for each proposal are then predicted using these attributes.
Another network developed from faster R-CNN is MaskLab [103], which includes parallel branches for object detection and instance segmentation as well. Compared with mask R-CNN, MaskLab includes a semantic segmentation branch that can refine the object mask, and a shared feature pyramid network (FPN) in MaskLab ensures three branches perform at the same time to reduce the time cost. Cascade mask R-CNN [104,105] extended mask R-CNN, which uses a cascade of CNNs to refine the object proposals and the mask of segmentation. In the cascade mask R-CNN method, distinct CNN is used at each stage of the cascade to improve accuracy and reduce false positive results. HTC (hybrid task cascade) [106] is another instance segmentation method based on R-CNN, which leverages both local and global context information to further recognize objects with various sizes and shapes, and as a result, it produces results with improved accuracy over the original R-CNN.
When applying these methods to remote sensing data, existing works mostly adapt the models with additional components to remotely sense specific tasks and their data; CNN-based methods are the most popular models. Zhao et al. [107] used mask R-CNN and the following boundary vectorization and regularization to extract building footprints from optical satellite images instantly, Yekeen et al. [108] adapted mask R-CNN with ResNet as the backbone and FPN to detect marine oil spill from SAR images, [109] proposed semantic boundary-aware unified multitask learning ResFCN to segment vehicle objects from optical aerial images, and Su et al. [110] developed HQ-ISNet based on cascade mask R-CNN utilizing multi-level feature maps from SAR images to detect ships.
Segmentation-and-Detection Methods
Segmentation-and-detection methods first perform semantic segmentation on images and then detect the class for each segment. For example, the dynamic instantiated network (DIN) [59,111] proposes using a semantic segmentation subnetwork and instance segmentation subnetwork to dynamically instantiate segmented pixels with a shape term and global term to solve nearby instance issues. Based on the semantic segmentation in images, the shape and features within the segment can be extracted and used to separate the individual instances. SSAP (single-shot instance segmentation with affinity pyramid) [112] uses affinity pyramids to capture the spatial relationships between pixels, then detects the instance without a proposal generation. For segmentation-and-detection methods, the capability for distinguishing adjacent instances for the same class depends on the segmentation performance based on the image feature.
Single-Stage Methods
By combining the object detection and semantic segmentation task into a single network, single-stage methods aim to obtain instance-level masks to achieve both speed and performance robustness. Similar to YOLO methods (Section 3.2.1), YOLO-based object detection methods can be extended to instance segmentation task, which is named YOLACT (You Only Look At CoefficienTs) [100]. It is developed as a single-stage instance segmentation with a single feedforward pass network. By predicting a set of coefficients for each object, YOLACT creates instance segmentation masks that are then computed using a collection of prototype masks that have been previously learned. By learning the objects’ location and shape information, SOLO (segmenting objects by locations) [113] predicts instance categories, starting by dividing the image as grids, then analyzing the grid cover object geometric center to identify object semantic categories with a classification branch and predict an object instance-level mask with a mask branch.
Self-Attention Methods
With the development of the NLP field, the self-attention-based network has gained great interest in image understanding. Vision transformer [114] is among the first network architectures that intensively use the self-attention mechanism, first used in image recognition. DETR [101] is the first end-to-end object detection framework with a transformer structure. Given that the transformer architecture is based on patch-based encoding, it has its limitations on multi-scale and high-resolution images, the Swin transformer [102,115] was proposed to address these issues by using a hierarchical architecture and a shifting window to capture various resolution and scale information, which, as a result, has improved the accuracy and efficiency to segment an object. Based on the DETR structure, MaskFormer [116] uses a mask classification model with a transformer structure to simultaneously perform semantic segmentation and instance segmentation, Mask2Former [117] further enhanced the capability and efficiency of MaskFormer by replacing cross-attention with masked attention in the transformer and using multi-scale features as attention to deal with small objects that the original MaskFormer falls short in.
For networks designed for remote sensing data, researchers are going to use the benefits of self-attention methods to deal with large amounts of similar sources of Earth observation imagery. Numerous recent studies also include transformer structures in the instance segmentation task; for example, Xu et al. [118] proposed a local perception Swin transformer (LPSW) backbone to improve the performance for small-scale objects from optical satellite images, and Fan et al. [119] developed an efficient instance segmentation paradigm (EISP) based on a Swin transformer and context information flow (CIF) and confluent loss function for refining the predicted masks based on both optical and SAR images.
3.2.3. Panoptic Segmentation in EO Data
Panoptic segmentation [15] simultaneously segments individual objects of the foreground and the background pixels. In remote sensing images, the background class is mostly bare land, impervious surfaces, or vegetation in different scenarios.
Most panoptic segmentation methods first perform the semantic and instance segmentation for each class, then merge all segmentation as the final panoptic segmentation result. Panoptic FPN (feature pyramid network) [120] builds on the FPN architecture (originally for semantic segmentation). It uses a shared backbone network to generate feature maps at multiple scales and has separate semantic segmentation and instance segmentation branches. The semantic segmentation branch produces a pixel-wise semantic label map, while the instance segmentation branch produces a set of object detection boxes and corresponding masks. Mask R-CNN panoptic [121] builds based on the mask R-CNN instance segmentation model and adds a new branch in the network to predict all pixels with semantic labels without belonging to any instance.
In remote sensing images, the background pixels take a significant amount over the entire image, and individual object counts are often significantly more than those in everyday images. Moreover, there are significantly fewer labeled datasets available for panoptic segmentation. Carvalho et al. [122] utilized semantic segmentation and separation based on borders to achieve a semantic to panoptic segmentation. To deal with temporal changes, such as forests or croplands, U-TAE (U-net with temporal attention encoder) [123] was introduced to utilize time series satellite images to combine spatial convolution and temporal attention to segmented croplands.
3.3. Object Detection with Multi-Modal Data
Remote sensing imagery has rich spectral information compared to classic RGB images, as mentioned in Section 2.1. Besides multispectral information, geometric information about terrain can be derived from multiple very high-resolution (VHR) satellite imageries with stereo-matching methods [50,124]. The height information derived from satellite stereopsis has been demonstrated effective for classification [125,126,127].
Multi-modal data can be used for object detection through several levels of fusion. First, the source data can be directly fused at the data level by normalizing all source images into the same range and then combining them into multi-band raster images [54,128]. Next or alternatively, data can be fused with their features using PCA [129] or other decomposition methods to extract the main features from different sources, and then, the first several layers can be adapted to generate a multi-band image at the feature level. Multi-modality at both data and feature levels can be directly used in most object detection and instance segmentation methods by adapting the input channel to multi-band images and feature maps [126,130]. Finally or alternatively, decision-level fusion can be performed, which involves training separate models for each data modality, using all decisions from models through majority or weighted averages, etc. [131].
Most of the current studies utilize optical (multi-spectrum) images for different spatial and spectral resolutions. Typically, VHR satellite or aerial imagery has relatively few spectrum bands (PlanetScope PSD or NAIP: 4 bands for blue, green, red, and NIR), while medium-high resolution satellite images, such as Sentinel-2 and Landsat series, provide sufficient spectrum coverage (more than eight bands). Multi-source image fusion was proven capable of significantly improving the accuracy of object detection or segmentation [130,132]. Different data modalities can be complementary to each other; for example, SAR images can penetrate clouds and capture weathered ground scenes, which significantly improves the data availability for applications, such as the change detection of objects. Moreover, geometry information, such as DSM/DEM, is less affected by illumination changes and can be used to robustly characterize objects. For example, the multi-source change detection UNet++ network (MSCDUNet) [19] has been developed as a multi-level feature fusion module used to extract and combine various spatial and channel features to detect built-up area change detection from multispectral, SAR, and VHR data. For vehicle detection based on visible imagery and DSM, multi-source active fine-tuning vehicle detection (Ms-AFt) has been proposed, which combines transfer learning, segmentation, and active classification into one cohesive system for auto-labeling and detection [131].
3.4. Meta-Learning for X-Shot Problem and Unsupervised Learning in Object Detection
X-shot learning methods were developed in the computer vision and machine learning community to address occasions that labeled data are lacking, which has a great practical value in remote sensing-based object detection. For example, few-shot problems require the model to learn features from only a few ground truth labels, and zero-shot problems need a trained object detector to identify object categories that were not present in the training data. This can occur in real-world scenarios where new object categories may appear that were not previously known or observed during training or where there are insufficient labels for certain categories in the collected EO datasets.
In traditional object detection, the model is trained to recognize specific object categories from a predefined set of classes. However, in the zero-shot problem, the model is asked to detect objects from categories that were not included in the training set. This is a challenging problem because the model has no prior knowledge or examples of the new categories and therefore cannot rely on direct, supervised learning. Meta-learning [133,134] is introduced to learn from learning by adapting to new tasks or domains based on the prior learned knowledge from similar domains. Due to the similarity of ground objects for man-made or natural categories, meta-learning methods will help to find a similar category for unrecognized objects in remote sensing object detection tasks.
MAML (model-agnostic meta-learning) [135] is a gradient-based meta-learning algorithm that first initializes the model weights by learning from existing labels, which can then be adapted to new tasks with a few gradient updates. Typically, the initialized weights for well-performed backbone networks (e.g., a ResNet) can be learned/used, and then, the object detection head (e.g., a faster R-CNN) can be fine-tuned on new object classes. The fine-tuning can be performed based on a small set of labeled examples for the new object class, then using these examples to update the object detection head parameters in a few gradient steps.
Training a model with limited data will likely introduce overfitting issues [136]; in the few-shot problem, models tend to perform poorly once they can only access a few samples per seen class. Prototype-CNN (P-CNN) [136] has been designed to solve these issues by using prototype-guided RPN to highlight the regions for foreground objects and PLN to provide class-aware prototypes for guiding, which can produce superior proposals for the detection head.
Unlike the zero-shot learning task, which uses labeled data for training, in contrast, unsupervised learning aims to predict data without labels. Exemplar-FreeSOLO [137] was developed as an unsupervised instance segmentation approach, which employs an exemplar knowledge abstraction module for unsupervised object extraction and an exemplar embedding contrastive module to boost the instance segmentation network’s discriminative ability using contrastive exemplar guidance. Cut-and-LEaRn (CutLER) [138] was an approach for unsupervised object detection and instance segmentation, which explores the knowledge that self-supervised representations can discover objects [139] and uses MaskCut to take an unlabeled image and discover multiple objects as binary masks, then uses a dynamic loss dropping strategy to learn from masks.
3.5. Language and Foundational Models in EO Object Detection
Developing large models for interpreting EO data without reworking data labeling is a consistent need. This requires the use of various close-to-automated means to generate labels with minimized human effort. It uses approaches such as the use of language models to aid the human–machine interaction for labeling, question, and answering [140,141,142] as well as large foundational models for pre-processing, such as unsupervised image segmentation, e.g., segment anything model (SAM) [143]. The unsupervised segmentation, with some visual prompts to guide the labeling process, can obviously reduce the amount of needed labor for annotating objects.
3.5.1. General Language Model for Object Detection
Language models can create the natural interactive means between humans and machines and have the capability to produce symbolic representations of images to improve interpretability, which can subsequently be used to train vision models to recognize objects within images. CLIP (contrastive language–image pre-training) [144] is a pre-trained model using an extensive dataset comprising both natural language and imagery. Within this dataset, each image is accompanied by a corresponding caption or alternative form of description. The CLIP model is designed to encode images and text into a shared embedding space, where images and their associated descriptions are positioned nearby. In addition, language models have the potential to enhance object detection tasks by augmenting them with additional contextual information relevant to an image. Other multi-modal models integrating large language models recently, such as BEiT-3 [145] and InternImage [145], separately achieved the SOTA performance in object detection and segmentation tasks.
Natural language models can also be used to generate complicated scene descriptions in order to generate labeled-image generation through generative models. For a description generation from an EO image, Zhang et al. [146] and Sumbul et al. [147] adapted the combination of CNN and long short-term memory (LSTM) networks and weight associated them with the attribute and image to describe the features in remote sensing data. In addition, a ChatGPT-assistant method [148] is also able to benefit image-based tasks, including edge detection, line extraction, and image segmentation in remote sensing data. Remote sensing visual question answering (RQA) [141] is established to utilize a visual model to extract contextual information, which is then transformed into textual format and subsequently incorporated into a language model. In addition, the mode can be used to perform image processing, including image clipping, feature extraction, and segmentation [149].
3.5.2. Foundational Model for Object Detection
SAM [143] is one of the most well-known foundational models for image segmentation. It is a prompt-based model and is pre-trained on proprietary datasets developed by Meta, which can perform unsupervised segmentation in images, even using visual prompts (i.e., point or polygon). Practically tested on many images, it was proven to have good generalization capabilities. Therefore, SAM can be a promising approach to processing EO imagery from diverse geographical contexts [142,148,150]. Osco et.al [148] combined one-shot training with a general example produced from a text prompt to improve the performance of the SAM model for remote sensing imagery, which also reduces the need for manual annotation for remote sensing data. Their experiments show that SAM for remote sensing can segment different images with spatial resolution (UAV, aerial, and satellite). In addition, SAM is also used to assist zero-shot learning by pre-segmenting images before assigning semantics. It can help detect uncommon or unseen ground objects or special objects with a different feature to the same type from EO datasets to reduce the effort in reintroducing a large number of new samples. Wang et al. [151] attempted to obtain pixel-level remote sensing imagery annotations using SAM to quickly create additional data based on six different public sources.
Figure 4 presents a qualitative comparison of the performance (mAP) of various deep learning object detection methods on the COCO test-dev datasets [9], including fast R-CNN [84], faster R-CNN [85], SSD [97], mask R-CNN [14], YOLOv3 [91], cascade R-CNN [104], YOLOv4 [92], Swin trasnformerV2 [102], YOLOv7 [95], BEiT-3 [145], and InternImage [140]. Generally, newly developed transformer-based methods tend to outperform traditional CNN-based approaches when applied to large datasets, and language and foundational models will be the state-of-the-art methods in object detection tasks.
4. An Overview of Commonly Used Public EO Datasets
In this section, we introduce object detection and instance segmentation datasets for remote sensing data, including optical, SAR, and other multi-modality 3D data, such as DSM and DTM. Due to the fast development of methods and active contributions from the science community, datasets have developed from image-only EO datasets to multi-modality images with both optical and SAR images and more hard-to-collect optical images + DSM paired datasets, with semantic labels. Table 2 shows a summary of detailed information for each EO dataset.
4.1. Object Detection Datasets
Early-stage datasets, frequently pertaining to the transportation industry, concentrate only on a particular class. As opposed to cars, which are detected using DLR 3K Vehicle, VEDAI (vehicle detection in aerial imagery) [152], ships are detected using SAR imagery by SSDD (SAR ship detection dataset) [157]. In general, open challenges and datasets have a big impact on the subjects that academics investigate. The xView dataset [155] provided a large World-View 3 image-based dataset with 60 fine-grained classes, including building, transportation, and landmark categories, and dealt with challenges, including occlusion, varying lighting conditions, and objects with different sizes and orientations.
Generalization is necessary to aim for in learning models. Therefore, datasets should be large in volume and diverse in sensors and scenes. DOTA (dataset for object detection in aerial Images) [153] offers a multi-scale, multi-class object detection dataset that contains different spatial resolution images with 188,282 instances. Northwest Polytechnical University proposed DIOR [154], a large-scale remote sensing dataset with 23,463 images, 190,288 labeled object instances, and 20 object classes, including an airport, a baseball or basketball court, a bridge, a chimney, a dam, an expressway service area, an expressway toll station, a harbor, a golf course, a ground track field, an overpass, a ship, a stadium, a storage tank, a tennis court. Moreover, several datasets with fine-grained labels have been created for the detailed research of types. FAIR1M [159], a brand-new benchmark dataset called FAIR1M for fine-grained object recognition in high-resolution remote sensing imagery, which contains more than 1 million instances and more than 40,000 images, collect images with a resolution of 0.3 m to 0.8 m resolution remote sensing photos from various platforms that are dispersed throughout numerous nations and regions. By using oriented bounding boxes, all items in the FAIR1M dataset are tagged with to 5 categories and 37 fine-grained subcategories. However, since single classes can be easily retrieved from such datasets, they are also routinely utilized for the identification of ships, cars, and airplanes, all of which are classes that are frequently present in multi-class datasets.
4.2. Instance and Panoptic Segmentation and Multi-Task Dataset
Since object detection and instance and panoptic segmentation are similar tasks, to determine a wider generalization, some datasets also provide the object detection ground truth to test the performance of object detection and segmentation meanwhile. The high-resolution SAR image dataset (HRSID) [156] includes a label format for both object detection and instance segmentation. One hundred thirty-six panoramic SAR imageries with a ranging resolution from 1 m to 5 m are cropped to 800 × 800 pixels SAR images, with a ca. 25% overlapping ratio. Optical remote sensing imageries are also available to reduce noise. CrowdAI dataset [166] focused on building domains. The training and testing set each had 280,741 and 60,317 patches with 300 × 300 pixel tiles that were taken from the RGB channels of satellite images, respectively, with annotations in the common objects in context (COCO) [9] format. The SAMRS dataset [151] utilizes SAM and pre-existing RS (remote sensing) object detection datasets to create an efficient pipeline for generating a comprehensive RS segmentation dataset. This dataset is designed for tasks such as semantic segmentation, instance segmentation, and object detection, either independently or in conjunction with each other.
Multi-modal datasets containing more than only optical or SAR imagery have also been collected to utilize the potential of large models to produce wide use and accurate models by adapting 3D and text data. IEEE Geoscience and Remote Sensing Society (GRSS) data fusion contest 2023 [167] provides building detection and instance segmentation. With the help of high-resolution optical satellite imagery and SAR pictures, this collection focuses on the identification and categorization of different building roof types. The provided dataset includes seventeen cities from six different continents. There are twelve fine-grained, pre-defined roof types in the categorization task. Another multi-modality dataset is CORE3D [165], which also focuses on buildings. This dataset provides both LiDAR-derived and multi-view stereo matching-derived DSM, which help to detect the boundaries of building and the roof structure of building instances. The PASTIS dataset [123] is a benchmark dataset for the panoptic and semantic segmentation of agricultural parcels using satellite time series data. The dataset encompasses the entirety of the French metropolitan territory, accompanied by comprehensive annotations that include instance indices and semantic labels for each individual pixel. Each patch represents a time series of variable length consisting of Sentinel-2 multispectral images, and Sentinel-1 SAR data are also available for panoptic segmentation.
5. Applications of EO Object Detection
EO object detection is a fundamental task to many applications. Out of many of the enabling applications, in this section, we summarize several common applications divided into three broad categories, including (1) urban and civilian applications, (2) environmental/ecological monitoring, and (3) agricultural and forestry applications. A summary of these applications as shown in Table 3.
5.1. Urban and Civilian Applications
Understanding transportation patterns: EO object detection helps understand transportation patterns, port activities, and the daily operations of cities and coastal regions. Chen et al. [168] used PlanetScope multispectral images to capture traffic density at the city-level to understand how COVID-19 impacts were reflected by the urban traffic. They used a morphology-based car extraction algorithm to collection a city-level, on-road vehicle count for five major cities, including New York, Rome, New Delhi, Wuhan, and Tokyo. Despite the fact that the PlanetScope data resolution (3–5 m) of the images is barely sufficient to extract vehicle counts, they showed that the detected patterns (traffic density) respond well to the local COVID shut-down policy; thus, it can serve as a great tool to perform objective measurements for policy compliance without needing to go over an expensive and labor intensive surveying process. Other similar studies, using higher resolution images, such as Maxar data [169], can be found in [170,171,172] to detect the number of cars in the parking lots or on roads.
Ship Detection: Ship detections are also one of the most used applications. Chen et al. [173] developed YOLO infused with an attention mechanism to enhance ship detection speed using GF-1 and -2 optical imageries. It distinguishes ships across various scales and movement states within complex environments, such as the ocean, harbor, and island, in various lighting conditions, offering improvements for efficient maritime surveillance and prompt rescue responses. Chang et al. [40] take advantage of SAR images, which are particularly effective due to their abilities to penetrate cloud cover and provide reliable imaging regardless of weather conditions. This application is used for uninterrupted ship tracking when optical satellites fall short due to atmospheric disturbances. It helps monitor territorial waters for illegal fishing, smuggling, or human trafficking and monitor ship traffic in and around ports to optimize docking, loading, and unloading [39,156,157].
Rapid disaster response and management: Remote sensing has been a valid means for the rapid assessment of disasters and post-disaster action planning. Typically, once a natural disaster occurs, remote sensing images, such as those from a satellite, or aerial/UAV images are collected rapidly for analyzing its impact [152,174], such as collapsed buildings or blocked roads, to best optimize rescue operations. Real-time imaging is also proposed to identify any possible victims and those partially covered by debris [175,176]. In these applications, object detection techniques are the key. For example, Zheng et al. [177] applied object detection on damaged building assessments with satellite imagery and semantic segmentation in 19 disaster events from 2011 to 2019, including earthquakes, wildfires, volcanoes, storms, flooding, and tsunamis. Pi et al. [174] explored the role of object detection in the wake of the hurricanes that besieged the United States from 2017 to 2018, in which the focuses are on flood areas, building roofs, cars, debris, and vegetation.
Structure and utility monitoring: Satellite remote sensing imagery can detect individual buildings [178,179,180], and images of higher resolution (centimeter level), such as those from UAV, are nowadays used in structural damage detection and structure health monitoring due to the fact that they are flexibile enough to assess and collect imaging information that is traditionally difficult for human inspectors to access. For example, Park et al. [181] deployed UAVs to capture thermal images of cracks on concrete, with attention to recording parameters, such as air temperature, humidity, and illuminance. Bai et al. [182] employed UAVs and UGVs (un-manned ground vehicles) for object detection on cracks for field inspections. They curated a dataset comprising a large number of labeled images utilized for the training and validation phases; it was shown that the effectiveness and efficacy of object detection is well versed to human inspection in real applications.
Another common use of object detection is on utility inspection, specifically on monitoring of power transmission lines. Monitoring powerlines to ensure they have a safe distance from tree branches is essential for maintenance, but it is traditionally labor intensive since it covers very large areas and is difficult/risky to access for a full inspection by a human inspector. It was noted that the satellite images and UAV images coupled with object detection techniques can be used to perform the detection of, for example, overgrown vegetation in proximity to transmission lines that could cause disruptions, fires, or tower damage to ensure clearance at the vicinity of the powerline [183]. Other data modalities, such as ultraviolet imaging and thermal imaging [184], were also explored to detect more sophisticated powerline related issues, such as abnormal discharge locations and overheating components [185].
5.2. Environmental–Ecological Monitoring and Management
Studying wildlife migration: Detecting and tracking animal populations have great implications on wildlife migration. Field sampling has been the primary means to provide an estimate, and recently, it was proposed to use satellite and UAV images to perform sampling and tracking, where object detection is the key approach for image analyses. For example, Xue et al. [186] employed the GeoEye-1’s panchromatic satellite to detect large mammals in extensive open spaces. This approach demonstrates about a 20% improvement over the traditional threshold-based method, which underscores its potential for enhancing wildlife monitoring and conservation efforts. WildBook [187] is a Python-based platform developed by an international wildlife conservation organization—WildMe [188]. It was designed for object detection on wild animal preservations using camera traps, vehicular- or UAV-mounted cameras, and photographs contributed by social networks. These data are labeled and fed into networks for animal instances and species identification to answer biological and ecological questions about animal behaviors and migration patterns. The platform had utilized over 49,000 labeled photographs from various national parks in Kenya, facilitating studies on animal behavior and migration [189,190] that were not feasible before due to data limitations.
Debris detection on rivers and coastal areas: Researchers also use object detection techniques to assist environmental applications, such as debris detection in rivers. For example, Watanabe et al. [191] introduced object detection for debris monitoring using satellite-, UAV-, and AUV-based images with multi-modality data (optical and infrared) both on the surface and under water. They were applied at the Ishikari River estuary, Hokkaido, Japan, in September 2018 with the aim to support conservation efforts by identifying the most affected areas and types of debris. Identifying hazardous debris, such as plastic waste or toxic substances, helps in preventing potential health risks to humans and ecosystems.
Oil spills detection: Oil spills pose severe environmental issues and require rapid detection to localize the impacted regions. The work of [41,42,192] focus on the use of ENVISAT advanced synthetic aperture radar (ASAR) imagery for object detection vessels and oil slick. The case studies include images captured during notable ecological disasters, such as the Deepwater Horizon blowout in the Gulf of Mexico, the Hebei Spirit oil tanker collision off South Korea’s west coast, and incidents over the Black Sea, where the employed studies show effectiveness in using remote sensing methods for oil spill detection and tracking. Such applications are not only vital for mitigating the detrimental effects of oil spills but also enhance preparedness and strategic response, allowing for effective prioritization of remediation locations in future environmental assessments.
5.3. Agriculturical and Forestry Applications
Remote sensing imaging and analysis have been widely used in the agriculture and forestry sectors. With the use of satellite, UAV, and ground-level images, it was used for a crop yield analysis, forest management, invasive species identification [193,194], etc.
Forest management: Object detection-based species and tree counting are crucial for forest management. As an example, it can be used to count palm trees [195] in tropical regions, where they are grown or planted for palm oil, plywood, furniture, and paper production. Accurate counting is necessary for yield prediction, growth monitoring, and productivity optimization. It is also used for invasive plant detection since biological invasions can disrupt ecosystems. In the work of [196,197], hyperspectral images are used to detect individual plants and analyze their ecological niches, leading to a better understanding and prediction of the survival and proliferation patterns of species. The application of this technology has helped reduce the spread of invasive species and protect local biodiversity. In tree canopy detection utilizing 3D information, both the combination of tree top identification from DSM and multispectral imagery [128], along with the isolation of individual trees and the classification of leaf and wood components from point cloud data, enables the effective detection of individual trees [198]. In the 2018 Chornobyl Exclusion Zone study [199], an octocopter equipped with a LiDAR system and multispectral cameras was used to classify multiple tree species (pine, birch, alder) and identify standing dead trees. This approach, using the 3D deep neural network PointNet++ [200] and integrating multispectral data, achieved a remarkable 90.2% accuracy, showcasing its potential in forest ecosystem and health assessments. Studies on these areas have made significant achievements in forest and orchard management.
Agricultural applications: Other than typical crop-yield estimation applications [194,201], object detection has been used to optimize the agriculture industry. For example, at a higher resolution, remote sensing-based object detection was used for bale counting to automate and optimize the inventory estimation [202,203] and space and storage utilization. Their application automates the inventory process of bales, providing accurate counts and reducing manual labor. Moreover, beyond lower resolution-based, large-scale crop estimation [201,204,205], nowadays, precision agriculture utilizes tractor-mounted sensors, such as LiDAR and stereo images, to perform 3D object detection for individual corn plant counting, health monitoring (growth rate) [206], and weed control by detecting weeds in the field using optical images [207].
6. Conclusions
In this review, we provided an overview of the recent progress of deep learning-based object detection and segmentation structures, their characteristics, and how to apply these methods to remote sensing imagery. We introduce a common pipeline of object detection methods for both traditional and deep learning methods and illustrate the popular networks and categories for object bounding box prediction, instance segmentation, and panoptic segmentation. Based on the characteristics of Earth observation sensors and the imagery captured by these sensors, adjusted object detection methods designed for remote sensing are introduced as well. Multi-source sensors (optical, SAR, LiDAR, and photogrammetric) provide the accessibility to capture various physical features for ground objects from Earth observation; therefore, the usage and integration of these multi-modal data are important to receive a better performance in object detection and segmentation.
With various datasets from different types of sensors and the distribution of different labels, label imbalance and inconsistency have been a challenge. Multi-modality (including text), meta-learning, and the language description of objects help to align different datasets to solve X-shot and inconsistency problems. Besides the above contribution, we also reviewed popular datasets and applications for remote sensing object detection and instance segmentation to guide researchers to the overall applications.
As compared to everyday images used in the CV community, ground objects in remote sensing imagery usually take fewer pixel footprints with diverse distribution and are disparate with landforms and morphology in terms of different geographical locations. Thus, it is still challenging to create a general object detection or instance segmentation that performs well for various regions and various sensors. It has been recognized that large foundational models may serve for this purpose, a good example of which to base the idea on is the recently popular segment anything model (SAM). In addition, another potential direction, as being mostly practiced now, is to develop task-specific networks in different fields, such as for agriculture, urban planning, traffic, disaster, pedestrian, etc., conditional on more community contributions of labeled datasets as well as more automated means to generate high-quality labels.
Author Contributions
Conceptualization, S.G. and R.Q.; investigation, S.G., S.S. and Y.T.; writing—original draft preparation, S.G., S.S. and Y.T.; writing—review and editing, R.Q.; visualization, S.G.; supervision, R.Q.; funding acquisition, R.Q. All authors have read and agreed to the published version of the manuscript.
Funding
The authors (R.Q. and S.S.) are partially funded by Office of Naval Research (Award Nos. N000142012141 and N000142312670).
Data Availability Statement
No new data were created or analyzed in this study. Data sharing is not applicable to this article.
Conflicts of Interest
The authors declare no conflicts of interest.
References
- Sirmacek, B.; Unsalan, C. A Probabilistic Framework to Detect Buildings in Aerial and Satellite Images. IEEE Trans. Geosci. Remote Sens. 2010, 49, 211–221. [Google Scholar] [CrossRef]
- Cheng, G.; Han, J. A Survey on Object Detection in Optical Remote Sensing Images. ISPRS J. Photogramm. Remote Sens. 2016, 117, 11–28. [Google Scholar] [CrossRef]
- Yao, Q.; Hu, X.; Lei, H. Multiscale Convolutional Neural Networks for Geospatial Object Detection in VHR Satellite Images. IEEE Geosci. Remote Sens. Lett. 2020, 18, 23–27. [Google Scholar] [CrossRef]
- Krizhevsky, A.; Sutskever, I.; Hinton, G.E. Imagenet Classification with Deep Convolutional Neural Networks. In Proceedings of the Advances in Neural Information Processing Systems, Lake Tahoe, NV, USA, 3–5 December 2012; Curran Associates: New York, NY, USA, 2012; Volume 25. [Google Scholar]
- Girshick, R.; Donahue, J.; Darrell, T.; Malik, J. Rich Feature Hierarchies for Accurate Object Detection and Semantic Segmentation. In Proceedings of the IEEE Conference on Computer Vision and Pattern Recognition, Columbus, OH, USA, 23–28 June 2014; pp. 580–587. [Google Scholar]
- Lowe, D.G. Distinctive Image Features from Scale-Invariant Keypoints. Int. J. Comput. Vis. 2004, 60, 91–110. [Google Scholar] [CrossRef]
- Dalal, N.; Triggs, B. Histograms of Oriented Gradients for Human Detection. In Proceedings of the 2005 IEEE Computer Society Conference on Computer Vision and Pattern Recognition (CVPR’05), San Diego, CA, USA, 20–26 June 2005; IEEE: Piscataway, NJ, USA, 2005; Volume 1, pp. 886–893. [Google Scholar]
- Deng, J.; Dong, W.; Socher, R.; Li, L.-J.; Li, K.; Fei-Fei, L. ImageNet: A Large-Scale Hierarchical Image Database. In Proceedings of the 2009 IEEE Conference on Computer Vision and Pattern Recognition, Miami, FL, USA, 20–25 June 2009; pp. 248–255. [Google Scholar]
- Lin, T.-Y.; Maire, M.; Belongie, S.; Hays, J.; Perona, P.; Ramanan, D.; Dollár, P.; Zitnick, C.L. Microsoft COCO: Common Objects in Context. In Proceedings of the Computer Vision—ECCV 2014, Zurich, Switzerland, 6–12 September 2014; Fleet, D., Pajdla, T., Schiele, B., Tuytelaars, T., Eds.; Springer International Publishing: Cham, Switzerland, 2014; pp. 740–755. [Google Scholar]
- Everingham, M.; Van Gool, L.; Williams, C.K.I.; Winn, J.; Zisserman, A. The Pascal Visual Object Classes (VOC) Challenge. Int. J. Comput. Vis. 2010, 88, 303–338. [Google Scholar] [CrossRef]
- Everingham, M.; Eslami, S.M.A.; Van Gool, L.; Williams, C.K.I.; Winn, J.; Zisserman, A. The Pascal Visual Object Classes Challenge: A Retrospective. Int. J. Comput. Vis. 2015, 111, 98–136. [Google Scholar] [CrossRef]
- Cordts, M.; Omran, M.; Ramos, S.; Rehfeld, T.; Enzweiler, M.; Benenson, R.; Franke, U.; Roth, S.; Schiele, B. The Cityscapes Dataset for Semantic Urban Scene Understanding. In Proceedings of the IEEE Conference on Computer Vision and Pattern Recognition (CVPR), Las Vegas, NV, USA, 26 June–1 July 2016. [Google Scholar]
- Zhou, B.; Zhao, H.; Puig, X.; Fidler, S.; Barriuso, A.; Torralba, A. Scene Parsing Through ADE20K Dataset. In Proceedings of the IEEE Conference on Computer Vision and Pattern Recognition (CVPR), Honolulu, HI, USA, 21–26 July 2017. [Google Scholar]
- He, K.; Gkioxari, G.; Dollár, P.; Girshick, R. Mask R-Cnn. In Proceedings of the IEEE International Conference on Computer Vision, Venice, Italy, 22–29 October 2017; pp. 2961–2969. [Google Scholar]
- Kirillov, A.; He, K.; Girshick, R.; Rother, C.; Dollár, P. Panoptic Segmentation. In Proceedings of the IEEE/CVF Conference on Computer Vision and Pattern Recognition, Long Beach, CA, USA, 15–20 June 2019; pp. 9404–9413. [Google Scholar]
- Wang, Y.; Bashir, S.M.A.; Khan, M.; Ullah, Q.; Wang, R.; Song, Y.; Guo, Z.; Niu, Y. Remote Sensing Image Super-Resolution and Object Detection: Benchmark and State of the Art. Expert Syst. Appl. 2022, 197, 116793. [Google Scholar] [CrossRef]
- Sumbul, G.; Cinbis, R.G.; Aksoy, S. Multisource Region Attention Network for Fine-Grained Object Recognition in Remote Sensing Imagery. IEEE Trans. Geosci. Remote Sens. 2019, 57, 4929–4937. [Google Scholar] [CrossRef]
- Li, X.; Du, Z.; Huang, Y.; Tan, Z. A Deep Translation (GAN) Based Change Detection Network for Optical and SAR Remote Sensing Images. ISPRS J. Photogramm. Remote Sens. 2021, 179, 14–34. [Google Scholar] [CrossRef]
- Li, H.; Zhu, F.; Zheng, X.; Liu, M.; Chen, G. MSCDUNet: A Deep Learning Framework for Built-up Area Change Detection Integrating Multispectral, SAR, and VHR Data. IEEE J. Sel. Top. Appl. Earth Obs. Remote Sens. 2022, 15, 5163–5176. [Google Scholar] [CrossRef]
- Biffi, C.; McDonagh, S.; Torr, P.; Leonardis, A.; Parisot, S. Many-Shot from Low-Shot: Learning to Annotate Using Mixed Supervision for Object Detection. In Proceedings of the European Conference on Computer Vision, Glasgow, UK, 23–28 August 2020; Springer: Berlin/Heidelberg, Germany, 2020; pp. 35–50. [Google Scholar]
- Majee, A.; Agrawal, K.; Subramanian, A. Few-Shot Learning for Road Object Detection. In Proceedings of the AAAI Workshop on Meta-Learning and MetaDL Challenge, PMLR, Virtual, 9 February 2021; pp. 115–126. [Google Scholar]
- Sumbul, G.; Cinbis, R.G.; Aksoy, S. Fine-Grained Object Recognition and Zero-Shot Learning in Remote Sensing Imagery. IEEE Trans. Geosci. Remote Sens. 2017, 56, 770–779. [Google Scholar] [CrossRef]
- Kemker, R.; Luu, R.; Kanan, C. Low-Shot Learning for the Semantic Segmentation of Remote Sensing Imagery. IEEE Trans. Geosci. Remote Sens. 2018, 56, 6214–6223. [Google Scholar] [CrossRef]
- Li, A.; Lu, Z.; Wang, L.; Xiang, T.; Wen, J.-R. Zero-Shot Scene Classification for High Spatial Resolution Remote Sensing Images. IEEE Trans. Geosci. Remote Sens. 2017, 55, 4157–4167. [Google Scholar] [CrossRef]
- Pal, D.; Bundele, V.; Banerjee, B.; Jeppu, Y. SPN: Stable Prototypical Network for Few-Shot Learning-Based Hyperspectral Image Classification. IEEE Geosci. Remote Sens. Lett. 2021, 19, 5506905. [Google Scholar] [CrossRef]
- Zhu, D.; Xia, S.; Zhao, J.; Zhou, Y.; Niu, Q.; Yao, R.; Chen, Y. Spatial Hierarchy Perception and Hard Samples Metric Learning for High-Resolution Remote Sensing Image Object Detection. Appl. Intell. 2022, 52, 3193–3208. [Google Scholar] [CrossRef]
- Gong, P.; Li, X.; Zhang, W. 40-Year (1978–2017) Human Settlement Changes in China Reflected by Impervious Surfaces from Satellite Remote Sensing. Sci. Bull. 2019, 64, 756–763. [Google Scholar] [CrossRef]
- Zhang, X.; Han, L.; Han, L.; Zhu, L. How Well Do Deep Learning-Based Methods for Land Cover Classification and Object Detection Perform on High Resolution Remote Sensing Imagery? Remote Sens. 2020, 12, 417. [Google Scholar] [CrossRef]
- Kadhim, N.; Mourshed, M. A Shadow-Overlapping Algorithm for Estimating Building Heights from VHR Satellite Images. IEEE Geosci. Remote Sens. Lett. 2017, 15, 8–12. [Google Scholar] [CrossRef]
- Zhang, Y.; Mishra, R.K. A Review and Comparison of Commercially Available Pan-Sharpening Techniques for High Resolution Satellite Image Fusion. In Proceedings of the 2012 IEEE International Geoscience and Remote Sensing Symposium, Munich, Germany, 22–27 July 2012; IEEE: Piscataway, NJ, USA, 2012; pp. 182–185. [Google Scholar]
- Pettorelli, N.; Vik, J.O.; Mysterud, A.; Gaillard, J.-M.; Tucker, C.J.; Stenseth, N.C. Using the Satellite-Derived NDVI to Assess Ecological Responses to Environmental Change. Trends Ecol. Evol. 2005, 20, 503–510. [Google Scholar] [CrossRef]
- Park, H.G.; Yun, J.P.; Kim, M.Y.; Jeong, S.H. Multichannel Object Detection for Detecting Suspected Trees with Pine Wilt Disease Using Multispectral Drone Imagery. IEEE J. Sel. Top. Appl. Earth Obs. Remote Sens. 2021, 14, 8350–8358. [Google Scholar] [CrossRef]
- Zhang, B.; Wu, Y.; Zhao, B.; Chanussot, J.; Hong, D.; Yao, J.; Gao, L. Progress and Challenges in Intelligent Remote Sensing Satellite Systems. IEEE J. Sel. Top. Appl. Earth Obs. Remote Sens. 2022, 15, 1814–1822. [Google Scholar] [CrossRef]
- Yu, J.-Y.; Huang, D.; Wang, L.-Y.; Guo, J.; Wang, Y.-H. A Real-Time on-Board Ship Targets Detection Method for Optical Remote Sensing Satellite. In Proceedings of the 2016 IEEE 13th International Conference on Signal Processing (ICSP), Chengdu, China, 6–10 November 2016; IEEE: Piscataway, NJ, USA, 2016; pp. 204–208. [Google Scholar]
- Yang, J.; Li, D.; Jiang, X.; Chen, S.; Hanzo, L. Enhancing the Resilience of Low Earth Orbit Remote Sensing Satellite Networks. IEEE Netw. 2020, 34, 304–311. [Google Scholar] [CrossRef]
- Soumekh, M. Reconnaissance with Slant Plane Circular SAR Imaging. IEEE Trans. Image Process. 1996, 5, 1252–1265. [Google Scholar] [CrossRef]
- Lee, J.-S.; Grunes, M.R.; Pottier, E. Quantitative Comparison of Classification Capability: Fully Polarimetric versus Dual and Single-Polarization SAR. IEEE Trans. Geosci. Remote Sens. 2001, 39, 2343–2351. [Google Scholar]
- Leigh, S.; Wang, Z.; Clausi, D.A. Automated Ice–Water Classification Using Dual Polarization SAR Satellite Imagery. IEEE Trans. Geosci. Remote Sens. 2013, 52, 5529–5539. [Google Scholar] [CrossRef]
- Wang, J.; Lin, Y.; Guo, J.; Zhuang, L. SSS-YOLO: Towards More Accurate Detection for Small Ships in SAR Image. Remote Sens. Lett. 2021, 12, 93–102. [Google Scholar] [CrossRef]
- Chang, Y.-L.; Anagaw, A.; Chang, L.; Wang, Y.C.; Hsiao, C.-Y.; Lee, W.-H. Ship Detection Based on YOLOv2 for SAR Imagery. Remote Sens. 2019, 11, 786. [Google Scholar] [CrossRef]
- Fingas, M.; Brown, C. Review of Oil Spill Remote Sensing. Mar. Pollut. Bull. 2014, 83, 9–23. [Google Scholar] [CrossRef] [PubMed]
- Hasimoto-Beltran, R.; Canul-Ku, M.; Díaz Méndez, G.M.; Ocampo-Torres, F.J.; Esquivel-Trava, B. Ocean Oil Spill Detection from SAR Images Based on Multi-Channel Deep Learning Semantic Segmentation. Mar. Pollut. Bull. 2023, 188, 114651. [Google Scholar] [CrossRef] [PubMed]
- Domg, Y.; Milne, A.; Forster, B. Toward Edge Sharpening: A SAR Speckle Filtering Algorithm. IEEE Trans. Geosci. Remote Sens. 2001, 39, 851–863. [Google Scholar] [CrossRef]
- Lee, J.-S.; Wen, J.-H.; Ainsworth, T.L.; Chen, K.-S.; Chen, A.J. Improved Sigma Filter for Speckle Filtering of SAR Imagery. IEEE Trans. Geosci. Remote Sens. 2008, 47, 202–213. [Google Scholar]
- Fang, Q.; Wang, Z. Cross-Modality Attentive Feature Fusion for Object Detection in Multispectral Remote Sensing Imagery. Pattern Recognit. 2022, 130, 108786. [Google Scholar] [CrossRef]
- Sun, W.; Wang, R. Fully Convolutional Networks for Semantic Segmentation of Very High Resolution Remotely Sensed Images Combined with DSM. IEEE Geosci. Remote Sens. Lett. 2018, 15, 474–478. [Google Scholar] [CrossRef]
- Lee, B.; Wei, Y.; Guo, I.Y. Automatic Parking of Self-Driving Car Based on Lidar. Int. Arch. Photogramm. Remote Sens. Spat. Inf. Sci. 2017, 42, 241–246. [Google Scholar] [CrossRef]
- Khodadadzadeh, M.; Li, J.; Prasad, S.; Plaza, A. Fusion of Hyperspectral and LiDAR Remote Sensing Data Using Multiple Feature Learning. IEEE J. Sel. Top. Appl. Earth Obs. Remote Sens. 2015, 8, 2971–2983. [Google Scholar] [CrossRef]
- Zhang, J. Multi-Source Remote Sensing Data Fusion: Status and Trends. Int. J. Image Data Fusion 2010, 1, 5–24. [Google Scholar] [CrossRef]
- Qin, R. Rpc Stereo Processor (Rsp)–a Software Package for Digital Surface Model and Orthophoto Generation from Satellite Stereo Imagery. ISPRS Ann. Photogramm. Remote Sens. Spat. Inf. Sci. 2016, 3, 77. [Google Scholar] [CrossRef]
- Qin, R. A Critical Analysis of Satellite Stereo Pairs for Digital Surface Model Generation and a Matching Quality Prediction Model. ISPRS J. Photogramm. Remote Sens. 2019, 154, 139–150. [Google Scholar] [CrossRef]
- Rupnik, E.; Pierrot-Deseilligny, M.; Delorme, A. 3D Reconstruction from Multi-View VHR-Satellite Images in MicMac. ISPRS J. Photogramm. Remote Sens. 2018, 139, 201–211. [Google Scholar] [CrossRef]
- Liu, J.; Gao, J.; Ji, S.; Zeng, C.; Zhang, S.; Gong, J. Deep Learning Based Multi-View Stereo Matching and 3D Scene Reconstruction from Oblique Aerial Images. ISPRS J. Photogramm. Remote Sens. 2023, 204, 42–60. [Google Scholar] [CrossRef]
- Qin, R.; Huang, X.; Liu, W.; Xiao, C. Semantic 3D Reconstruction Using Multi-View High-Resolution Satellite Images Based on U-Net and Image-Guided Depth Fusion. In Proceedings of the IGARSS 2019—2019 IEEE International Geoscience and Remote Sensing Symposium, Yokohama, Japan, 28 July–2 August 2019; IEEE: Piscataway, NJ, USA, 2019; pp. 5057–5060. [Google Scholar]
- Huang, X.; Qin, R. Multi-View Large-Scale Bundle Adjustment Method for High-Resolution Satellite Images. arXiv 2019, arXiv:1905.09152. [Google Scholar]
- Chen, M.; Qin, R.; He, H.; Zhu, Q.; Wang, X. A Local Distinctive Features Matching Method for Remote Sensing Images with Repetitive Patterns. Photogramm. Eng. Remote Sens. 2018, 84, 513–524. [Google Scholar] [CrossRef]
- Xu, N.; Huang, D.; Song, S.; Ling, X.; Strasbaugh, C.; Yilmaz, A.; Sezen, H.; Qin, R. A Volumetric Change Detection Framework Using UAV Oblique Photogrammetry—A Case Study of Ultra-High-Resolution Monitoring of Progressive Building Collapse. Int. J. Digit. Earth 2021, 14, 1705–1720. [Google Scholar] [CrossRef]
- Zhang, W.; Wang, W.; Chen, L. Constructing DEM Based on InSAR and the Relationship between InSAR DEM’s Precision and Terrain Factors. Energy Procedia 2012, 16, 184–189. [Google Scholar] [CrossRef]
- Arnab, A.; Torr, P.H.S. Pixelwise Instance Segmentation with a Dynamically Instantiated Network. In Proceedings of the Computer Vision and Pattern Recognition (CVPR), Honolulu, HI, USA, 22–25 July 2017. [Google Scholar]
- Gualtieri, J.A.; Cromp, R.F. Support Vector Machines for Hyperspectral Remote Sensing Classification. In Proceedings of the 27th AIPR Workshop: Advances in Computer-Assisted Recognition; International Society for Optics and Photonics, Washington, DC, USA, 14–16 October 1999; Volume 3584, pp. 221–232. [Google Scholar]
- Friedl, M.A.; Brodley, C.E. Decision Tree Classification of Land Cover from Remotely Sensed Data. Remote Sens. Environ. 1997, 61, 399–409. [Google Scholar] [CrossRef]
- Toschi, I.; Remondino, F.; Rothe, R.; Klimek, K. Combining Airborne Oblique Camera and Lidar Sensors: Investigation and New Perspectives. Int. Arch. Photogramm. Remote Sens. Spat. Inf. Sci. 2018, 42, 437–444. [Google Scholar] [CrossRef]
- Gyongy, I.; Hutchings, S.W.; Halimi, A.; Tyler, M.; Chan, S.; Zhu, F.; McLaughlin, S.; Henderson, R.K.; Leach, J. High-Speed 3D Sensing via Hybrid-Mode Imaging and Guided Upsampling. Optica 2020, 7, 1253–1260. [Google Scholar] [CrossRef]
- Kufner, M.; Kölbl, J.; Lukas, R.; Dekorsy, T. Hybrid Design of an Optical Detector for Terrestrial Laser Range Finding. IEEE Sens. J. 2021, 21, 16606–16612. [Google Scholar] [CrossRef]
- Haklay, M.; Weber, P. Openstreetmap: User-Generated Street Maps. IEEE Pervasive Comput. 2008, 7, 12–18. [Google Scholar] [CrossRef]
- Haklay, M. How Good Is Volunteered Geographical Information? A Comparative Study of OpenStreetMap and Ordnance Survey Datasets. Environ. Plan. B Plan. Des. 2010, 37, 682–703. [Google Scholar] [CrossRef]
- Han, W.; Chen, J.; Wang, L.; Feng, R.; Li, F.; Wu, L.; Tian, T.; Yan, J. Methods for Small, Weak Object Detection in Optical High-Resolution Remote Sensing Images: A Survey of Advances and Challenges. IEEE Geosci. Remote Sens. Mag. 2021, 9, 8–34. [Google Scholar] [CrossRef]
- Yao, X.; Feng, X.; Han, J.; Cheng, G.; Guo, L. Automatic Weakly Supervised Object Detection from High Spatial Resolution Remote Sensing Images via Dynamic Curriculum Learning. IEEE Trans. Geosci. Remote Sens. 2020, 59, 675–685. [Google Scholar] [CrossRef]
- Fischler, M.A.; Elschlager, R.A. The Representation and Matching of Pictorial Structures. IEEE Trans. Comput. 1973, 100, 67–92. [Google Scholar] [CrossRef]
- Cortes, C.; Vapnik, V. Support-Vector Networks. Mach. Learn. 1995, 20, 273–297. [Google Scholar] [CrossRef]
- Viola, P.; Jones, M. Rapid Object Detection Using a Boosted Cascade of Simple Features. In Proceedings of the 2001 IEEE Computer Society Conference on Computer Vision and Pattern Recognition, CVPR 2001, Kauai, HI, USA, 8–14 December 2001; IEEE: Piscataway, NJ, USA, 2001; Volume 1, pp. I-511–I-518. [Google Scholar]
- Bay, H.; Tuytelaars, T.; Van Gool, L. Surf: Speeded up Robust Features. In Proceedings of the Computer Vision–ECCV 2006: 9th European Conference on Computer Vision, Graz, Austria, 7–13 May 2006; Proceedings, Part I 9. Springer: Berlin/Heidelberg, Germany, 2006; pp. 404–417. [Google Scholar]
- Rublee, E.; Rabaud, V.; Konolige, K.; Bradski, G. ORB: An Efficient Alternative to SIFT or SURF. In Proceedings of the 2011 International Conference on Computer Vision, Barcelona, Spain, 6–13 November 2011; IEEE: Piscataway, NJ, USA, 2011; pp. 2564–2571. [Google Scholar]
- Qin, R. Change Detection on LOD 2 Building Models with Very High Resolution Spaceborne Stereo Imagery. ISPRS J. Photogramm. Remote Sens. 2014, 96, 179–192. [Google Scholar] [CrossRef]
- Safavian, S.R.; Landgrebe, D. A Survey of Decision Tree Classifier Methodology. IEEE Trans. Syst. Man Cybern. 1991, 21, 660–674. [Google Scholar] [CrossRef]
- Ho, T.K. Random Decision Forests. In Proceedings of the 3rd International Conference on Document Analysis and Recognition, Montreal, QC, Canada, 14–16 August 1995; IEEE: Piscataway, NJ, USA, 1995; Volume 1, pp. 278–282. [Google Scholar]
- Belgiu, M.; Drăguţ, L. Random Forest in Remote Sensing: A Review of Applications and Future Directions. ISPRS J. Photogramm. Remote Sens. 2016, 114, 24–31. [Google Scholar] [CrossRef]
- Dollár, P.; Babenko, B.; Belongie, S.; Perona, P.; Tu, Z. Multiple Component Learning for Object Detection. In Proceedings of the Computer Vision–ECCV 2008: 10th European Conference on Computer Vision, Marseille, France, 12–18 October 2008; Proceedings, Part II 10. Springer: Berlin/Heidelberg, Germany, 2008; pp. 211–224. [Google Scholar]
- Erhan, D.; Szegedy, C.; Toshev, A.; Anguelov, D. Scalable Object Detection Using Deep Neural Networks. In Proceedings of the IEEE Conference on Computer Vision and Pattern Recognition, Columbus, OH, USA, 23–28 June 2014; pp. 2147–2154. [Google Scholar]
- Hartigan, J.A.; Wong, M.A. A K-Means Clustering Algorithm. JSTOR Appl. Stat. 1979, 28, 100–108. [Google Scholar] [CrossRef]
- Comaniciu, D.; Meer, P. Mean Shift Analysis and Applications. In Proceedings of the Seventh IEEE International Conference on Computer Vision, Corfu, Greece, 20–25 September 1999; IEEE: Piscataway, NJ, USA, 1999; Volume 2, pp. 1197–1203. [Google Scholar]
- Reynolds, D.A. Gaussian Mixture Models. Encycl. Biom. 2009, 741, 659–663. [Google Scholar]
- Hoeser, T.; Kuenzer, C. Object Detection and Image Segmentation with Deep Learning on Earth Observation Data: A Review-Part i: Evolution and Recent Trends. Remote Sens. 2020, 12, 1667. [Google Scholar] [CrossRef]
- Girshick, R. Fast R-Cnn. In Proceedings of the IEEE International Conference on Computer Vision, Santiago, Chile, 7–13 December 2015; pp. 1440–1448. [Google Scholar]
- Ren, S.; He, K.; Girshick, R.; Sun, J. Faster R-Cnn: Towards Real-Time Object Detection with Region Proposal Networks. In Proceedings of the Advances in Neural Information Processing Systems, Montréal, QC, Canada, 7–12 December 2015; Curran Associates: New York, NY, USA, 2015; Volume 28. [Google Scholar]
- Dai, J.; Li, Y.; He, K.; Sun, J. R-Fcn: Object Detection via Region-Based Fully Convolutional Networks. In Proceedings of the Advances in Neural Information Processing Systems, Barcelona, Spain, 5–10 December 2016; Curran Associates: New York, NY, USA, 2016; Volume 29. [Google Scholar]
- Ren, Y.; Zhu, C.; Xiao, S. Small Object Detection in Optical Remote Sensing Images via Modified Faster R-CNN. Appl. Sci. 2018, 8, 813. [Google Scholar] [CrossRef]
- Bai, T.; Pang, Y.; Wang, J.; Han, K.; Luo, J.; Wang, H.; Lin, J.; Wu, J.; Zhang, H. An Optimized Faster R-CNN Method Based on DRNet and RoI Align for Building Detection in Remote Sensing Images. Remote Sens. 2020, 12, 762. [Google Scholar] [CrossRef]
- Redmon, J.; Divvala, S.; Girshick, R.; Farhadi, A. You Only Look Once: Unified, Real-Time Object Detection. In Proceedings of the IEEE Conference on Computer Vision and Pattern Recognition, Las Vegas, NV, USA, 27–30 June 2016; pp. 779–788. [Google Scholar]
- Redmon, J.; Farhadi, A. YOLO9000: Better, Faster, Stronger. In Proceedings of the IEEE Conference on Computer Vision and Pattern Recognition, Honolulu, HI, USA, 21–26 July 2017; pp. 7263–7271. [Google Scholar]
- Redmon, J.; Farhadi, A. Yolov3: An Incremental Improvement. arXiv 2018, arXiv:1804.02767. [Google Scholar]
- Bochkovskiy, A.; Wang, C.-Y.; Liao, H.-Y.M. Yolov4: Optimal Speed and Accuracy of Object Detection. arXiv 2020, arXiv:2004.10934. [Google Scholar]
- Jocher, G. YOLOv5 by Ultralytics 2020. Available online: https://github.com/ultralytics/yolov5 (accessed on 16 July 2020).
- Li, C.; Li, L.; Jiang, H.; Weng, K.; Geng, Y.; Li, L.; Ke, Z.; Li, Q.; Cheng, M.; Nie, W.; et al. YOLOv6: A Single-Stage Object Detection Framework for Industrial Applications. arXiv 2022, arXiv:2209.02976. [Google Scholar]
- Wang, C.-Y.; Bochkovskiy, A.; Liao, H.-Y.M. YOLOv7: Trainable Bag-of-Freebies Sets New State-of-the-Art for Real-Time Object Detectors. In Proceedings of the IEEE/CVF Conference on Computer Vision and Pattern Recognition, Vancouver, BC, Canada, 18–22 June 2023; pp. 7464–7475. [Google Scholar]
- Jocher, G.; Chaurasia, A.; Qiu, J. YOLO by Ultralytics 2023. Available online: https://github.com/ultralytics/ultralytics (accessed on 10 October 2023).
- Liu, W.; Anguelov, D.; Erhan, D.; Szegedy, C.; Reed, S.; Fu, C.-Y.; Berg, A.C. Ssd: Single Shot Multibox Detector. In Proceedings of the Computer Vision–ECCV 2016: 14th European Conference, Amsterdam, The Netherlands, 11–14 October 2016; Proceedings, Part I 14. Springer: Berlin/Heidelberg, Germany, 2016; pp. 21–37. [Google Scholar]
- Pham, M.-T.; Courtrai, L.; Friguet, C.; Lefèvre, S.; Baussard, A. YOLO-Fine: One-Stage Detector of Small Objects under Various Backgrounds in Remote Sensing Images. Remote Sens. 2020, 12, 2501. [Google Scholar] [CrossRef]
- Sun, Z.; Leng, X.; Lei, Y.; Xiong, B.; Ji, K.; Kuang, G. BiFA-YOLO: A Novel YOLO-Based Method for Arbitrary-Oriented Ship Detection in High-Resolution SAR Images. Remote Sens. 2021, 13, 4209. [Google Scholar] [CrossRef]
- Bolya, D.; Zhou, C.; Xiao, F.; Lee, Y.J. Yolact: Real-Time Instance Segmentation. In Proceedings of the IEEE/CVF International Conference on Computer Vision, Seoul, Republic of Korea, 27 October–2 November 2019; pp. 9157–9166. [Google Scholar]
- Carion, N.; Massa, F.; Synnaeve, G.; Usunier, N.; Kirillov, A.; Zagoruyko, S. End-to-End Object Detection with Transformers. In Proceedings of the European Conference on Computer Vision, Glasgow, UK, 23–28 August 2020; Springer: Berlin/Heidelberg, Germany, 2020; pp. 213–229. [Google Scholar]
- Liu, Z.; Hu, H.; Lin, Y.; Yao, Z.; Xie, Z.; Wei, Y.; Ning, J.; Cao, Y.; Zhang, Z.; Dong, L.; et al. Swin Transformer v2: Scaling up Capacity and Resolution. In Proceedings of the IEEE/CVF Conference on Computer Vision and Pattern Recognition, New Orleans, LA, USA, 18–24 June 2022; pp. 12009–12019. [Google Scholar]
- Chen, L.-C.; Hermans, A.; Papandreou, G.; Schroff, F.; Wang, P.; Adam, H. Masklab: Instance Segmentation by Refining Object Detection with Semantic and Direction Features. In Proceedings of the IEEE Conference on Computer Vision and Pattern Recognition, Salt Lake City, UT, USA, 18–23 June 2018; pp. 4013–4022. [Google Scholar]
- Cai, Z.; Vasconcelos, N. Cascade R-Cnn: Delving into High Quality Object Detection. In Proceedings of the IEEE Conference on Computer Vision and Pattern Recognition, Salt Lake City, UT, USA, 18–23 June 2018; pp. 6154–6162. [Google Scholar]
- Cai, Z.; Vasconcelos, N. Cascade R-CNN: High Quality Object Detection and Instance Segmentation. IEEE Trans. Pattern Anal. Mach. Intell. 2019, 43, 1483–1498. [Google Scholar] [CrossRef]
- Chen, K.; Pang, J.; Wang, J.; Xiong, Y.; Li, X.; Sun, S.; Feng, W.; Liu, Z.; Shi, J.; Ouyang, W.; et al. Hybrid Task Cascade for Instance Segmentation. In Proceedings of the IEEE/CVF Conference on Computer Vision and Pattern Recognition, Long Beach, CA, USA, 15–20 June 2019; pp. 4974–4983. [Google Scholar]
- Zhao, K.; Kang, J.; Jung, J.; Sohn, G. Building Extraction from Satellite Images Using Mask R-CNN with Building Boundary Regularization. In Proceedings of the IEEE Conference on Computer Vision and Pattern Recognition Workshops, Salt Lake City, UT, USA, 18–22 June 2018; pp. 247–251. [Google Scholar]
- Yekeen, S.T.; Balogun, A.-L.; Yusof, K.B.W. A Novel Deep Learning Instance Segmentation Model for Automated Marine Oil Spill Detection. ISPRS J. Photogramm. Remote Sens. 2020, 167, 190–200. [Google Scholar] [CrossRef]
- Mou, L.; Zhu, X.X. Vehicle Instance Segmentation from Aerial Image and Video Using a Multitask Learning Residual Fully Convolutional Network. IEEE Trans. Geosci. Remote Sens. 2018, 56, 6699–6711. [Google Scholar] [CrossRef]
- Su, H.; Wei, S.; Liu, S.; Liang, J.; Wang, C.; Shi, J.; Zhang, X. HQ-ISNet: High-Quality Instance Segmentation for Remote Sensing Imagery. Remote Sens. 2020, 12, 989. [Google Scholar] [CrossRef]
- Li, Q.; Arnab, A.; Torr, P.H.S. Weakly- and Semi-Supervised Panoptic Segmentation. In Proceedings of the European Conference on Computer Vision (ECCV), Munich, Germany, 8–14 September 2018. [Google Scholar]
- Gao, N.; Shan, Y.; Wang, Y.; Zhao, X.; Yu, Y.; Yang, M.; Huang, K. Ssap: Single-Shot Instance Segmentation with Affinity Pyramid. In Proceedings of the IEEE/CVF International Conference on Computer Vision, Seoul, Republic of Korea, 27–28 October 2019; pp. 642–651. [Google Scholar]
- Wang, X.; Kong, T.; Shen, C.; Jiang, Y.; Li, L. Solo: Segmenting Objects by Locations. In Proceedings of the Computer Vision–ECCV 2020: 16th European Conference, Glasgow, UK, 23–28 August 2020; Proceedings, Part XVIII 16. Springer: Berlin/Heidelberg, Germany, 2020; pp. 649–665. [Google Scholar]
- Dosovitskiy, A.; Beyer, L.; Kolesnikov, A.; Weissenborn, D.; Zhai, X.; Unterthiner, T.; Dehghani, M.; Minderer, M.; Heigold, G.; Gelly, S.; et al. An Image Is Worth 16x16 Words: Transformers for Image Recognition at Scale. arXiv 2021, arXiv:2010.11929. [Google Scholar]
- Liu, Z.; Lin, Y.; Cao, Y.; Hu, H.; Wei, Y.; Zhang, Z.; Lin, S.; Guo, B. Swin Transformer: Hierarchical Vision Transformer Using Shifted Windows. In Proceedings of the IEEE/CVF International Conference on Computer Vision, Montreal, BC, Canada, 11–17 October 2021; pp. 10012–10022. [Google Scholar]
- Cheng, B.; Schwing, A.; Kirillov, A. Per-Pixel Classification Is Not All You Need for Semantic Segmentation. Adv. Neural Inf. Process. Syst. 2021, 34, 17864–17875. [Google Scholar]
- Cheng, B.; Misra, I.; Schwing, A.G.; Kirillov, A.; Girdhar, R. Masked-Attention Mask Transformer for Universal Image Segmentation. In Proceedings of the IEEE/CVF Conference on Computer Vision and Pattern Recognition (CVPR), New Orleans, LA, USA, 18–24 June 2022; pp. 1290–1299. [Google Scholar]
- Xu, X.; Feng, Z.; Cao, C.; Li, M.; Wu, J.; Wu, Z.; Shang, Y.; Ye, S. An Improved Swin Transformer-Based Model for Remote Sensing Object Detection and Instance Segmentation. Remote Sens. 2021, 13, 4779. [Google Scholar] [CrossRef]
- Fan, F.; Zeng, X.; Wei, S.; Zhang, H.; Tang, D.; Shi, J.; Zhang, X. Efficient Instance Segmentation Paradigm for Interpreting SAR and Optical Images. Remote Sens. 2022, 14, 531. [Google Scholar] [CrossRef]
- Kirillov, A.; Girshick, R.; He, K.; Dollár, P. Panoptic Feature Pyramid Networks. In Proceedings of the IEEE/CVF Conference on Computer Vision and Pattern Recognition, Long Beach, CA, USA, 15–20 June 2019; pp. 6399–6408. [Google Scholar]
- Zhang, D.; Song, Y.; Liu, D.; Jia, H.; Liu, S.; Xia, Y.; Huang, H.; Cai, W. Panoptic Segmentation with an End-to-End Cell R-CNN for Pathology Image Analysis. In Proceedings of the Medical Image Computing and Computer Assisted Intervention–MICCAI 2018: 21st International Conference, Granada, Spain, 16–20 September 2018; Proceedings, Part II 11. Springer: Berlin/Heidelberg, Germany, 2018; pp. 237–244. [Google Scholar]
- De Carvalho, O.L.; de Carvalho Júnior, O.A.; de Albuquerque, A.O.; Santana, N.C.; Borges, D.L. Rethinking Panoptic Segmentation in Remote Sensing: A Hybrid Approach Using Semantic Segmentation and Non-Learning Methods. IEEE Geosci. Remote Sens. Lett. 2022, 19, 3512105. [Google Scholar] [CrossRef]
- Garnot, V.S.F.; Landrieu, L. Panoptic Segmentation of Satellite Image Time Series with Convolutional Temporal Attention Networks. In Proceedings of the IEEE/CVF International Conference on Computer Vision, Montreal, BC, Canada, 11–17 October 2021; pp. 4872–4881. [Google Scholar]
- Qin, R. Automated 3D Recovery from Very High Resolution Multi-View Images Overview of 3D Recovery from Multi-View Satellite Images. In Proceedings of the ASPRS Conference (IGTF) 2017, Baltimore, MD, USA, 12–16 March 2017; pp. 12–16. [Google Scholar]
- Liu, W.; Qin, R.; Su, F.; Hu, K. An Unsupervised Domain Adaptation Method for Multi-Modal Remote Sensing Image Classification. In Proceedings of the 2018 26th International Conference on Geoinformatics, Kunming, China, 28–30 June 2018; IEEE: Piscataway, NJ, USA, 2018; pp. 1–5. [Google Scholar]
- Albanwan, H.; Qin, R.; Lu, X.; Li, M.; Liu, D.; Guldmann, J.-M. 3D Iterative Spatiotemporal Filtering for Classification of Multitemporal Satellite Data Sets. Photogramm. Eng. Remote Sens. 2020, 86, 23–31. [Google Scholar] [CrossRef]
- Mäyrä, J.; Keski-Saari, S.; Kivinen, S.; Tanhuanpää, T.; Hurskainen, P.; Kullberg, P.; Poikolainen, L.; Viinikka, A.; Tuominen, S.; Kumpula, T.; et al. Tree Species Classification from Airborne Hyperspectral and LiDAR Data Using 3D Convolutional Neural Networks. Remote Sens. Environ. 2021, 256, 112322. [Google Scholar] [CrossRef]
- Xiao, C.; Qin, R.; Huang, X. Treetop Detection Using Convolutional Neural Networks Trained through Automatically Generated Pseudo Labels. Int. J. Remote Sens. 2020, 41, 3010–3030. [Google Scholar] [CrossRef]
- Dunteman, G.H. Principal Components Analysis; Sage: Thousand Oaks, CA, USA, 1989; Volume 69. [Google Scholar]
- Chen, C.; He, X.; Guo, B.; Zhao, X.; Chu, Y. A Pixel-Level Fusion Method for Multi-Source Optical Remote Sensing Image Combining the Principal Component Analysis and Curvelet Transform. Earth Sci. Inform. 2020, 13, 1005–1013. [Google Scholar] [CrossRef]
- Wu, X.; Li, W.; Hong, D.; Tian, J.; Tao, R.; Du, Q. Vehicle Detection of Multi-Source Remote Sensing Data Using Active Fine-Tuning Network. ISPRS J. Photogramm. Remote Sens. 2020, 167, 39–53. [Google Scholar] [CrossRef]
- Albanwan, H.; Qin, R. A Novel Spectrum Enhancement Technique for Multi-Temporal, Multi-Spectral Data Using Spatial-Temporal Filtering. ISPRS J. Photogramm. Remote Sens. 2018, 142, 51–63. [Google Scholar] [CrossRef]
- Soh, J.W.; Cho, S.; Cho, N.I. Meta-Transfer Learning for Zero-Shot Super-Resolution. In Proceedings of the IEEE/CVF Conference on Computer Vision and Pattern Recognition, Seattle, WA, USA, 13–19 June 2020; pp. 3516–3525. [Google Scholar]
- Hospedales, T.; Antoniou, A.; Micaelli, P.; Storkey, A. Meta-Learning in Neural Networks: A Survey. IEEE Trans. Pattern Anal. Mach. Intell. 2021, 44, 5149–5169. [Google Scholar] [CrossRef] [PubMed]
- Yoon, J.; Kim, T.; Dia, O.; Kim, S.; Bengio, Y.; Ahn, S. Bayesian Model-Agnostic Meta-Learning. In Proceedings of the Advances in Neural Information Processing Systems, Montréal, QC, Canada, 4–5 December 2018; Curran Associates: New York, NY, USA, 2018; Volume 31. [Google Scholar]
- Cheng, G.; Yan, B.; Shi, P.; Li, K.; Yao, X.; Guo, L.; Han, J. Prototype-CNN for Few-Shot Object Detection in Remote Sensing Images. IEEE Trans. Geosci. Remote Sens. 2021, 60, 3078507. [Google Scholar] [CrossRef]
- Ishtiak, T.; En, Q.; Guo, Y. Exemplar-FreeSOLO: Enhancing Unsupervised Instance Segmentation With Exemplars. In Proceedings of the IEEE/CVF Conference on Computer Vision and Pattern Recognition, Vancouver, BC, Canada, 18–22 June 2023; pp. 15424–15433. [Google Scholar]
- Wang, X.; Girdhar, R.; Yu, S.X.; Misra, I. Cut and Learn for Unsupervised Object Detection and Instance Segmentation. In Proceedings of the IEEE/CVF Conference on Computer Vision and Pattern Recognition, Vancouver, BC, Canada, 18–22 June 2023; pp. 3124–3134. [Google Scholar]
- Caron, M.; Touvron, H.; Misra, I.; Jégou, H.; Mairal, J.; Bojanowski, P.; Joulin, A. Emerging Properties in Self-Supervised Vision Transformers. In Proceedings of the IEEE/CVF International Conference on Computer Vision, Montreal, BC, Canada, 11–17 October 2021; pp. 9650–9660. [Google Scholar]
- Wang, W.; Dai, J.; Chen, Z.; Huang, Z.; Li, Z.; Zhu, X.; Hu, X.; Lu, T.; Lu, L.; Li, H.; et al. Internimage: Exploring Large-Scale Vision Foundation Models with Deformable Convolutions. In Proceedings of the IEEE/CVF Conference on Computer Vision and Pattern Recognition, Vancouver, BC, Canada, 18–22 June 2023; pp. 14408–14419. [Google Scholar]
- Chappuis, C.; Zermatten, V.; Lobry, S.; Le Saux, B.; Tuia, D. Prompt-RSVQA: Prompting Visual Context to a Language Model for Remote Sensing Visual Question Answering. In Proceedings of the IEEE/CVF Conference on Computer Vision and Pattern Recognition, New Orleans, LA, USA, 19–20 June 2022; pp. 1372–1381. [Google Scholar]
- Chen, K.; Liu, C.; Chen, H.; Zhang, H.; Li, W.; Zou, Z.; Shi, Z. RSPrompter: Learning to Prompt for Remote Sensing Instance Segmentation Based on Visual Foundation Model. arXiv 2023, arXiv:2306.16269. [Google Scholar]
- Kirillov, A.; Mintun, E.; Ravi, N.; Mao, H.; Rolland, C.; Gustafson, L.; Xiao, T.; Whitehead, S.; Berg, A.C.; Lo, W.-Y.; et al. Segment Anything. arXiv 2023, arXiv:2304.02643. [Google Scholar]
- Radford, A.; Kim, J.W.; Hallacy, C.; Ramesh, A.; Goh, G.; Agarwal, S.; Sastry, G.; Askell, A.; Mishkin, P.; Clark, J.; et al. Learning Transferable Visual Models from Natural Language Supervision. In Proceedings of the International Conference on Machine Learning, PMLR, Virtual, 18–24 July 2021; pp. 8748–8763. [Google Scholar]
- Wang, W.; Bao, H.; Dong, L.; Bjorck, J.; Peng, Z.; Liu, Q.; Aggarwal, K.; Mohammed, O.K.; Singhal, S.; Som, S.; et al. Image as a Foreign Language: BEiT Pretraining for Vision and Vision-Language Tasks. In Proceedings of the IEEE/CVF Conference on Computer Vision and Pattern Recognition, Vancouver, BC, Canada, 18–22 June 2023; pp. 19175–19186. [Google Scholar]
- Zhang, X.; Wang, X.; Tang, X.; Zhou, H.; Li, C. Description Generation for Remote Sensing Images Using Attribute Attention Mechanism. Remote Sens. 2019, 11, 612. [Google Scholar] [CrossRef]
- Sumbul, G.; Nayak, S.; Demir, B. SD-RSIC: Summarization-Driven Deep Remote Sensing Image Captioning. IEEE Trans. Geosci. Remote Sens. 2020, 59, 6922–6934. [Google Scholar] [CrossRef]
- Osco, L.P.; de Lemos, E.L.; Gonçalves, W.N.; Ramos, A.P.M.; Marcato Junior, J. The Potential of Visual ChatGPT for Remote Sensing. Remote Sens. 2023, 15, 3232. [Google Scholar] [CrossRef]
- Yuan, Z.; Mou, L.; Wang, Q.; Zhu, X.X. From Easy to Hard: Learning Language-Guided Curriculum for Visual Question Answering on Remote Sensing Data. IEEE Trans. Geosci. Remote Sens. 2022, 60, 3173811. [Google Scholar] [CrossRef]
- Zhang, J.; Zhou, Z.; Mai, G.; Mu, L.; Hu, M.; Li, S. Text2Seg: Remote Sensing Image Semantic Segmentation via Text-Guided Visual Foundation Models. arXiv 2023, arXiv:2304.10597. [Google Scholar]
- Wang, D.; Zhang, J.; Du, B.; Xu, M.; Liu, L.; Tao, D.; Zhang, L. SAMRS: Scaling-up Remote Sensing Segmentation Dataset with Segment Anything Model. In Proceedings of the Thirty-Seventh Conference on Neural Information Processing Systems Datasets and Benchmarks Track, New Orleans, LA, USA, 10–16 December 2023. [Google Scholar]
- Liu, K.; Mattyus, G. Fast Multiclass Vehicle Detection on Aerial Images. IEEE Geosci. Remote Sens. Lett. 2015, 12, 1938–1942. [Google Scholar]
- Xia, G.-S.; Bai, X.; Ding, J.; Zhu, Z.; Belongie, S.; Luo, J.; Datcu, M.; Pelillo, M.; Zhang, L. DOTA: A Large-Scale Dataset for Object Detection in Aerial Images. In Proceedings of the IEEE Conference on Computer Vision and Pattern Recognition, Salt Lake City, UT, USA, 18–23 June 2018; pp. 3974–3983. [Google Scholar]
- Li, K.; Wan, G.; Cheng, G.; Meng, L.; Han, J. Object Detection in Optical Remote Sensing Images: A Survey and a New Benchmark. ISPRS J. Photogramm. Remote Sens. 2020, 159, 296–307. [Google Scholar] [CrossRef]
- Lam, D.; Kuzma, R.; McGee, K.; Dooley, S.; Laielli, M.; Klaric, M.; Bulatov, Y.; McCord, B. Xview: Objects in Context in Overhead Imagery. arXiv 2018, arXiv:1802.07856. [Google Scholar]
- Wei, S.; Zeng, X.; Qu, Q.; Wang, M.; Su, H.; Shi, J. HRSID: A High-Resolution SAR Images Dataset for Ship Detection and Instance Segmentation. IEEE Access 2020, 8, 120234–120254. [Google Scholar] [CrossRef]
- Zhang, T.; Zhang, X.; Li, J.; Xu, X.; Wang, B.; Zhan, X.; Xu, Y.; Ke, X.; Zeng, T.; Su, H.; et al. SAR Ship Detection Dataset (SSDD): Official Release and Comprehensive Data Analysis. Remote Sens. 2021, 13, 3690. [Google Scholar] [CrossRef]
- Du, D.; Qi, Y.; Yu, H.; Yang, Y.; Duan, K.; Li, G.; Zhang, W.; Huang, Q.; Tian, Q. The Unmanned Aerial Vehicle Benchmark: Object Detection and Tracking. In Proceedings of the European Conference on Computer Vision (ECCV), Munich, Germany, 8–14 September 2018; pp. 370–386. [Google Scholar]
- Sun, X.; Wang, P.; Yan, Z.; Xu, F.; Wang, R.; Diao, W.; Chen, J.; Li, J.; Feng, Y.; Xu, T.; et al. FAIR1M: A Benchmark Dataset for Fine-Grained Object Recognition in High-Resolution Remote Sensing Imagery. ISPRS J. Photogramm. Remote Sens. 2022, 184, 116–130. [Google Scholar] [CrossRef]
- Waqas Zamir, S.; Arora, A.; Gupta, A.; Khan, S.; Sun, G.; Shahbaz Khan, F.; Zhu, F.; Shao, L.; Xia, G.-S.; Bai, X. Isaid: A Large-Scale Dataset for Instance Segmentation in Aerial Images. In Proceedings of the IEEE/CVF Conference on Computer Vision and Pattern Recognition Workshops, Long Beach, CA, USA, 15–20 June 2019; pp. 28–37. [Google Scholar]
- Cheng, G.; Zhou, P.; Han, J. Learning Rotation-Invariant Convolutional Neural Networks for Object Detection in VHR Optical Remote Sensing Images. IEEE Trans. Geosci. Remote Sens. 2016, 54, 7405–7415. [Google Scholar] [CrossRef]
- Weir, N.; Lindenbaum, D.; Bastidas, A.; Etten, A.V.; McPherson, S.; Shermeyer, J.; Kumar, V.; Tang, H. Spacenet Mvoi: A Multi-View Overhead Imagery Dataset. In Proceedings of the IEEE/CVF International Conference on Computer Vision, Seoul, Republic of Korea, 27–28 October 2019; pp. 992–1001. [Google Scholar]
- Roscher, R.; Volpi, M.; Mallet, C.; Drees, L.; Wegner, J.D. Semcity Toulouse: A Benchmark for Building Instance Segmentation in Satellite Images. ISPRS Ann. Photogramm. Remote Sens. Spat. Inf. Sci. 2020, 5, 109–116. [Google Scholar] [CrossRef]
- Demir, I.; Koperski, K.; Lindenbaum, D.; Pang, G.; Huang, J.; Basu, S.; Hughes, F.; Tuia, D.; Raskar, R. Deepglobe 2018: A Challenge to Parse the Earth through Satellite Images. In Proceedings of the IEEE Conference on Computer Vision and Pattern Recognition Workshops, Salt Lake City, UT, USA, 18–22 June 2018; pp. 172–181. [Google Scholar]
- Brown, M.; Goldberg, H.; Foster, K.; Leichtman, A.; Wang, S.; Hagstrom, S.; Bosch, M.; Almes, S. Large-Scale Public Lidar and Satellite Image Data Set for Urban Semantic Labeling. In Proceedings of the Laser Radar Technology and Applications XXIII, Orlando, FL, USA, 17–18 April 2018; SPIE: Bellingham, WA, USA, 2018; Volume 10636, pp. 154–167. [Google Scholar]
- Mohanty, S.P.; Czakon, J.; Kaczmarek, K.A.; Pyskir, A.; Tarasiewicz, P.; Kunwar, S.; Rohrbach, J.; Luo, D.; Prasad, M.; Fleer, S.; et al. Deep Learning for Understanding Satellite Imagery: An Experimental Survey. Front. Artif. Intell. 2020, 3, 534696. [Google Scholar] [CrossRef]
- Persello, C.; Hansch, R.; Vivone, G.; Chen, K.; Yan, Z.; Tang, D.; Huang, H.; Schmitt, M.; Sun, X. 2023 IEEE GRSS Data Fusion Contest: Large-Scale Fine-Grained Building Classification for Semantic Urban Reconstruction [Technical Committees]. IEEE Geosci. Remote Sens. Mag. 2023, 11, 94–97. [Google Scholar] [CrossRef]
- Chen, Y.; Qin, R.; Zhang, G.; Albanwan, H. Spatial Temporal Analysis of Traffic Patterns during the COVID-19 Epidemic by Vehicle Detection Using Planet Remote-Sensing Satellite Images. Remote Sens. 2021, 13, 208. [Google Scholar] [CrossRef]
- Dolloff, J.; Settergren, R. An Assessment of WorldView-1 Positional Accuracy Based on Fifty Contiguous Stereo Pairs of Imagery. Photogramm. Eng. Remote Sens. 2010, 76, 935–943. [Google Scholar] [CrossRef]
- Bar, D.E.; Raboy, S. Moving Car Detection and Spectral Restoration in a Single Satellite WorldView-2 Imagery. IEEE J. Sel. Top. Appl. Earth Obs. Remote Sens. 2013, 6, 2077–2087. [Google Scholar] [CrossRef]
- Zhou, H.; Wei, L.; Lim, C.P.; Nahavandi, S. Robust Vehicle Detection in Aerial Images Using Bag-of-Words and Orientation Aware Scanning. IEEE Trans. Geosci. Remote Sens. 2018, 56, 7074–7085. [Google Scholar] [CrossRef]
- Drouyer, S. VehSat: A Large-Scale Dataset for Vehicle Detection in Satellite Images. In Proceedings of the IGARSS 2020—2020 IEEE International Geoscience and Remote Sensing Symposium, Waikoloa, HI, USA, 26 September–2 October 2020; pp. 268–271. [Google Scholar]
- Chen, L.; Shi, W.; Deng, D. Improved YOLOv3 Based on Attention Mechanism for Fast and Accurate Ship Detection in Optical Remote Sensing Images. Remote Sens. 2021, 13, 660. [Google Scholar] [CrossRef]
- Pi, Y.; Nath, N.D.; Behzadan, A.H. Convolutional Neural Networks for Object Detection in Aerial Imagery for Disaster Response and Recovery. Adv. Eng. Inform. 2020, 43, 101009. [Google Scholar] [CrossRef]
- Tijtgat, N.; Van Ranst, W.; Goedeme, T.; Volckaert, B.; De Turck, F. Embedded Real-Time Object Detection for a UAV Warning System. In Proceedings of the IEEE International Conference on Computer Vision (ICCV) Workshops, Venice, Italy, 22–29 October 2017. [Google Scholar]
- Dong, J.; Ota, K.; Dong, M. UAV-Based Real-Time Survivor Detection System in Post-Disaster Search and Rescue Operations. IEEE J. Miniaturization Air Space Syst. 2021, 2, 209–219. [Google Scholar] [CrossRef]
- Zheng, Z.; Zhong, Y.; Wang, J.; Ma, A.; Zhang, L. Building Damage Assessment for Rapid Disaster Response with a Deep Object-Based Semantic Change Detection Framework: From Natural Disasters to Man-Made Disasters. Remote Sens. Environ. 2021, 265, 112636. [Google Scholar] [CrossRef]
- Gui, S.; Qin, R. Automated LoD-2 Model Reconstruction from Very-High-Resolution Satellite-Derived Digital Surface Model and Orthophoto. ISPRS J. Photogramm. Remote Sens. 2021, 181, 1–19. [Google Scholar] [CrossRef]
- Müller Arisona, S.; Zhong, C.; Huang, X.; Qin, R. Increasing Detail of 3D Models through Combined Photogrammetric and Procedural Modelling. Geo-Spat. Inf. Sci. 2013, 16, 45–53. [Google Scholar] [CrossRef]
- Gruen, A.; Schubiger, S.; Qin, R.; Schrotter, G.; Xiong, B.; Li, J.; Ling, X.; Xiao, C.; Yao, S.; Nuesch, F. Semantically Enriched High Resolution LoD 3 Building Model Generation. Int. Arch. Photogramm. Remote Sens. Spat. Inf. Sci. 2019, 42, 11–18. [Google Scholar] [CrossRef]
- Park, M.J.; Kim, J.; Jeong, S.; Jang, A.; Bae, J.; Ju, Y.K. Machine Learning-Based Concrete Crack Depth Prediction Using Thermal Images Taken under Daylight Conditions. Remote Sens. 2022, 14, 2151. [Google Scholar] [CrossRef]
- Bai, Y.; Gao, C.; Singh, S.; Koch, M.; Adriano, B.; Mas, E.; Koshimura, S. A Framework of Rapid Regional Tsunami Damage Recognition from Post-Event TerraSAR-X Imagery Using Deep Neural Networks. IEEE Geosci. Remote Sens. Lett. 2018, 15, 43–47. [Google Scholar] [CrossRef]
- Hu, Y.; Liu, K. Inspection and Monitoring Technologies of Transmission Lines with Remote Sensing; Academic Press: Cambridge, MA, USA, 2017; ISBN 978-0-12-812645-5. [Google Scholar]
- Kim, S.; Kim, D.; Jeong, S.; Ham, J.-W.; Lee, J.-K.; Oh, K.-Y. Fault Diagnosis of Power Transmission Lines Using a UAV-Mounted Smart Inspection System. IEEE Access 2020, 8, 149999–150009. [Google Scholar] [CrossRef]
- Deng, X.D.; Zheng, K.; Wei, G.; Tang, J.H.; Zhang, Z.P. The Infrared Diagnostic Technology of Power Transmission Devices and Experimental Study. Appl. Mech. Mater. 2013, 423–426, 2372–2375. [Google Scholar] [CrossRef]
- Xue, Y.; Wang, T.; Skidmore, A.K. Automatic Counting of Large Mammals from Very High Resolution Panchromatic Satellite Imagery. Remote Sens. 2017, 9, 878. [Google Scholar] [CrossRef]
- Berger-Wolf, T.Y.; Rubenstein, D.I.; Stewart, C.V.; Holmberg, J.A.; Parham, J.; Menon, S.; Crall, J.; Van Oast, J.; Kiciman, E.; Joppa, L. Wildbook: Crowdsourcing, Computer Vision, and Data Science for Conservation. arXiv 2017, arXiv:1710.08880. [Google Scholar]
- Catlin, J.; Jones, T.; Norman, B.; Wood, D. Consolidation in a Wildlife Tourism Industry: The Changing Impact of Whale Shark Tourist Expenditure in the Ningaloo Coast Region. Int. J. Tour. Res. 2010, 12, 134–148. [Google Scholar] [CrossRef]
- Araujo, G.; Agustines, A.; Tracey, B.; Snow, S.; Labaja, J.; Ponzo, A. Photo-ID and Telemetry Highlight a Global Whale Shark Hotspot in Palawan, Philippines. Sci. Rep. 2019, 9, 17209. [Google Scholar] [CrossRef]
- Blount, D.; Gero, S.; Van Oast, J.; Parham, J.; Kingen, C.; Scheiner, B.; Stere, T.; Fisher, M.; Minton, G.; Khan, C.; et al. Flukebook: An Open-Source AI Platform for Cetacean Photo Identification. Mamm. Biol. 2022, 102, 1005–1023. [Google Scholar] [CrossRef]
- Watanabe, J.-I.; Shao, Y.; Miura, N. Underwater and Airborne Monitoring of Marine Ecosystems and Debris. J. Appl. Remote Sens. 2019, 13, 044509. [Google Scholar] [CrossRef]
- Akar, S.; Süzen, M.L.; Kaymakci, N. Detection and Object-Based Classification of Offshore Oil Slicks Using ENVISAT-ASAR Images. Environ. Monit. Assess. 2011, 183, 409–423. [Google Scholar] [CrossRef]
- Gao, Y.; Skutsch, M.; Paneque-Gálvez, J.; Ghilardi, A. Remote Sensing of Forest Degradation: A Review. Environ. Res. Lett. 2020, 15, 103001. [Google Scholar] [CrossRef]
- Lobell, D.B.; Thau, D.; Seifert, C.; Engle, E.; Little, B. A Scalable Satellite-Based Crop Yield Mapper. Remote Sens. Environ. 2015, 164, 324–333. [Google Scholar] [CrossRef]
- Li, W.; Fu, H.; Yu, L.; Cracknell, A. Deep Learning Based Oil Palm Tree Detection and Counting for High-Resolution Remote Sensing Images. Remote Sens. 2017, 9, 22. [Google Scholar] [CrossRef]
- Huang, C.; Asner, G.P. Applications of Remote Sensing to Alien Invasive Plant Studies. Sensors 2009, 9, 4869–4889. [Google Scholar] [CrossRef]
- Papp, L.; van Leeuwen, B.; Szilassi, P.; Tobak, Z.; Szatmári, J.; Árvai, M.; Mészáros, J.; Pásztor, L. Monitoring Invasive Plant Species Using Hyperspectral Remote Sensing Data. Land 2021, 10, 29. [Google Scholar] [CrossRef]
- Wang, D. Unsupervised Semantic and Instance Segmentation of Forest Point Clouds. ISPRS J. Photogramm. Remote Sens. 2020, 165, 86–97. [Google Scholar] [CrossRef]
- Briechle, S.; Krzystek, P.; Vosselman, G. Classification of Tree Species and Standing Dead Trees by Fusing UAV-Based Lidar Data and Multispectral Imagery in the 3D Deep Neural Network PointNet++. ISPRS Ann. Photogramm. Remote Sens. Spat. Inf. Sci. 2020, 2, 203–210. [Google Scholar] [CrossRef]
- Qi, C.R.; Yi, L.; Su, H.; Guibas, L.J. Pointnet++: Deep Hierarchical Feature Learning on Point Sets in a Metric Space. In Proceedings of the Advances in Neural Information Processing Systems, Long Beach, CA, USA, 4–9 December 2017; Curran Associates: New York, NY, USA, 2017; Volume 30. [Google Scholar]
- Song, X.-P.; Potapov, P.V.; Krylov, A.; King, L.; Di Bella, C.M.; Hudson, A.; Khan, A.; Adusei, B.; Stehman, S.V.; Hansen, M.C. National-Scale Soybean Mapping and Area Estimation in the United States Using Medium Resolution Satellite Imagery and Field Survey. Remote Sens. Environ. 2017, 190, 383–395. [Google Scholar] [CrossRef]
- Zhao, W.; Yamada, W.; Li, T.; Digman, M.; Runge, T. Augmenting Crop Detection for Precision Agriculture with Deep Visual Transfer Learning—A Case Study of Bale Detection. Remote Sens. 2021, 13, 23. [Google Scholar] [CrossRef]
- Yamada, W.; Zhao, W.; Digman, M. Automated Bale Mapping Using Machine Learning and Photogrammetry. Remote Sens. 2021, 13, 4675. [Google Scholar] [CrossRef]
- Dong, T.; Liu, J.; Shang, J.; Qian, B.; Ma, B.; Kovacs, J.M.; Walters, D.; Jiao, X.; Geng, X.; Shi, Y. Assessment of Red-Edge Vegetation Indices for Crop Leaf Area Index Estimation. Remote Sens. Environ. 2019, 222, 133–143. [Google Scholar] [CrossRef]
- Mateo-Sanchis, A.; Piles, M.; Muñoz-Marí, J.; Adsuara, J.E.; Pérez-Suay, A.; Camps-Valls, G. Synergistic Integration of Optical and Microwave Satellite Data for Crop Yield Estimation. Remote Sens. Environ. 2019, 234, 111460. [Google Scholar] [CrossRef]
- Lin, Y.-C.; Habib, A. Quality Control and Crop Characterization Framework for Multi-Temporal UAV LiDAR Data over Mechanized Agricultural Fields. Remote Sens. Environ. 2021, 256, 112299. [Google Scholar] [CrossRef]
- Huang, Y.; Lee, M.A.; Thomson, S.J.; Reddy, K.N. Ground-Based Hyperspectral Remote Sensing for Weed Management in Crop Production. Int. J. Agric. Biol. Eng. 2016, 9, 98–109. [Google Scholar]
Figure 1.
Visual definition of (A) bounding box-based object detection (building); (B) instance segmentation (building); (C) panoptic segmentation (combining both instance segmentation and other background classes).
Figure 1.
Visual definition of (A) bounding box-based object detection (building); (B) instance segmentation (building); (C) panoptic segmentation (combining both instance segmentation and other background classes).

Figure 2.
The spatial resolution and spectral range for each band of optical sensors for satellite, aerial, and UAV platforms, the spatial resolution represents the highest available resolution after pan-sharpening.
Figure 2.
The spatial resolution and spectral range for each band of optical sensors for satellite, aerial, and UAV platforms, the spatial resolution represents the highest available resolution after pan-sharpening.

Figure 3.
A typical framework for object detection and the following segmentation. Different colors represent different ground object types and instances.
Figure 3.
A typical framework for object detection and the following segmentation. Different colors represent different ground object types and instances.

Figure 4.
Object detection methods performance on COCO test-dev dataset from 2015 to 2023.


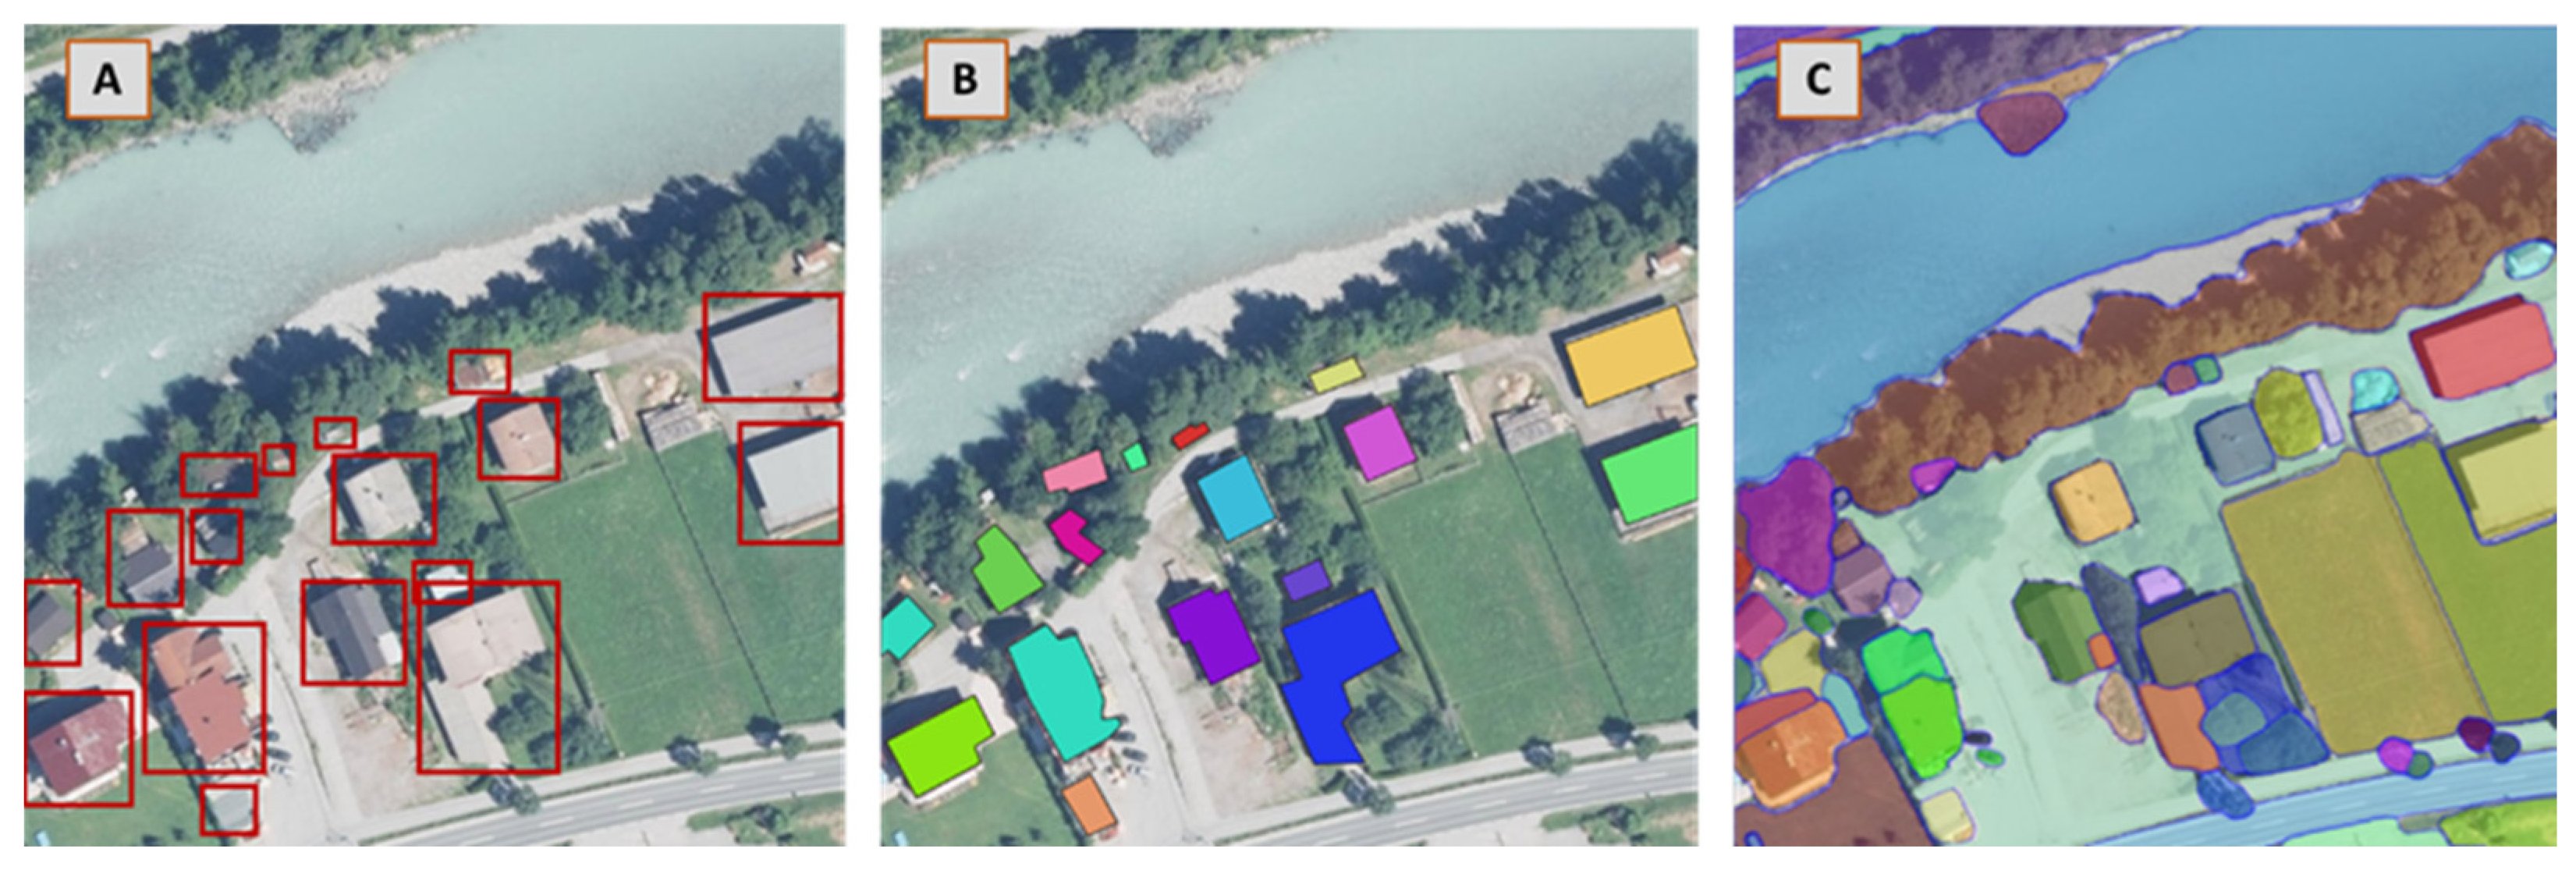
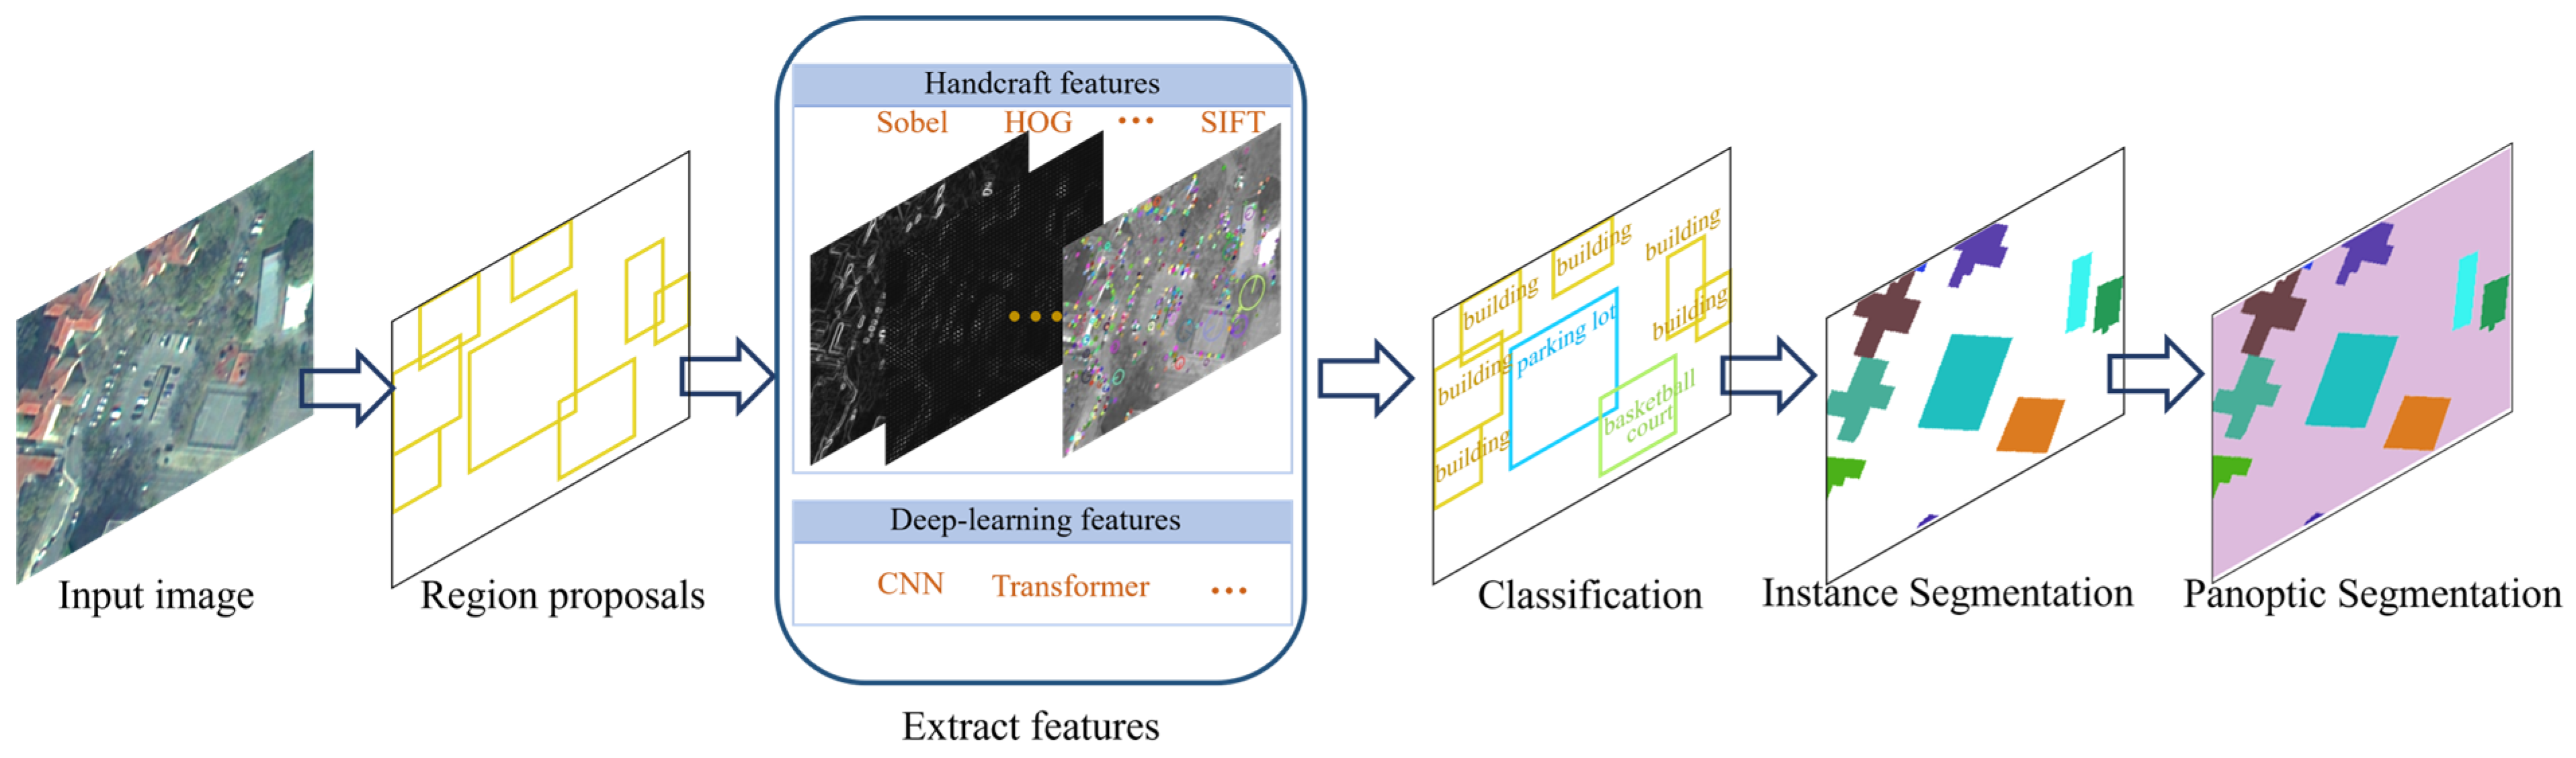
Table 1.
SAR sensor information with spatial resolution and band coverage.
| Sensor | Spatial Resolution (GSD) | Band Information | |||
|---|---|---|---|---|---|
| Staring SpotLight | SpotLight | Ultrafine | StripMap | ||
| TerraSAR-X | 0.25 m | 2 m | 3 m | X-band: 9.65 GHz | |
| COSMO-SkyMed | 1 m | 3 m | X-band: 9.6 GHz | ||
| Sentinel-1 | 5 m | C-band: 5.405 GHz | |||
| Geofen-3 | 1 m | 3 m | 5 m | C-band: 5.4 GHz | |
| RadarSat-2 | 1 m | 3 m | C-band: 5.405 GHz | ||
| ALOS PALSAR-2 | 1–3 m | 3 m | L-band: 1.27 GHz | ||
| ICEYE | 1 m | 3 m | X-band: 9.75 GHz | ||
| Capella-2 | 0.5 m | 1 m | 1.2 m | X-band (9.4–9.9 GHz) | |
Table 2.
Datasets for object detection and instance segmentation tasks.
| Dataset Name | Sensor Type | Image Spatial Resolution | Task | Year | Domain (Categories Number) | Image Number & Instance Number |
|---|---|---|---|---|---|---|
| DLR 3K Vehicle [152] | Optical | 0.02 m | Object detection | 2015 | Vehicle (2) | 20 (14,235) |
| DOTA [153] | Optical | 0.3–1 m | Object detection | 2018 | Multi-class (14) | 2806 (188,282) |
| DIOR [154] | Optical | 0.5–30 m | Object detection | 2020 | Multi-class (20) | 23,463 (192,472) |
| xView [155] | Optical | 0.3 m | Object detection | 2018 | Multi-class (60) | 1127 (1 million) |
| HRSID [156] | SAR | 1–5 m | Object detection and instance segmentation | 2020 | Ship | 5604 (16,951) |
| SSDD [157] | SAR | 1–15 m | Object detection | 2021 | Ship | 1160 (2456) |
| UAVDT [158] | Optical | \(UAV) | Object detection | 2018 | Multi-class (14) | 80,000 (841,500) |
| FAIR1M [159] | Optical | 0.3–0.8 m | Object detection | 2022 | Multi-class (37) | 42,796 (1.02 million) |
| iSAID [160] | Optical | \(aerial) | Instance segmentation | 2019 | Multi-class (15) | 2806 (655,451) |
| NWPU VHR-10 [161] | Optical | 0.08–2 m | Object detection and instance segmentation | 2016 | Multi-class (10) | 800 (3775) |
| SpaceNet MVOI [162] | Optical | 0.46–1.67 m | Object detection and instance segmentation | 2019 | Building | 60,000 (126,747) |
| SemCity Toulouse [163] | Optical | 0.5 m | Instance segmentation | 2020 | Building | 4 (9455) |
| DeepGlobe 2018 (road) [164] | Optical | 0.5 m | Instance segmentation | 2018 | Road | 8570 |
| DeepGlobe 2018 (building) [164] | Optical | 0.3 m | Instance segmentation | 2018 | Building | 24,586 (302,701) |
| IARPA CORE3D [165] | Optical + DSM + DTM | 0.3 m | Instance segmentation | 2018 | Building | 154 multi-stereo |
| CrowdAI mapping challenge [166] | Optical | 0.3 m | Instance segmentation | 2018 | Building | 341,058 |
| 2023 IEEE GRSS DFC [167] | Optical + SAR | 0.5 m | Instance segmentation | 2023 | Building roof (12) | 3720 × 2 (194,263) |
| PASTIS [123] | Optical + SAR | 10 m | Object detection and Panoptic segmentation | 2021 | Agricultural parcels (time series) | 2433 (124,422) |
| SAMRS [151] | Optical | 0.3–30 m | Object detection and Panoptic segmentation | 2023 | Multi-class (37) | 105,090 (1,668,241) |
Table 3.
An overview of the application that benefit from RS object detection.
| Domain | Application Area of Focus | Sensors and Data |
|---|---|---|
| Urban and civilian applications | Traffic density, urban mobility | PlanetScope Multispectral Images |
| Maritime security, ship detection | SAR | |
| Impact assessment of Hurricane, flood, infrastructure | Optical Satellite | |
| Powerlines monitor and management | UAV, airborne LiDAR data | |
| Structural Health Monitoring (SHM), bridges/buildings | UAVs, satellites, infrared, ultraviolet | |
| Environmental–ecological monitoring and management | Wildlife migration, animal counting | GeoEye-1’s Panchromatic Satellite |
| Wildlife conservation, species identification | Camera traps, UAV-mounted cameras, social media | |
| Marine ecosystem, debris monitoring | UAVs, AUVs (Autonomous Underwater Vehicle), IR cameras | |
| Ocean oil spill tracking and response | ENVISAT ASAR, Hyperspectral Imaging | |
| Agricultural and forestry applications | Bale counting and monitoring | UAVs |
| Tree counting, invasive plant detection | Satellites, Hyperspectral Imaging | |
| Locust migration routes, outbreak prediction | Satellite data, DEM. | |
| Classify tree species (pine, birch, alder) and identify standing dead trees | UAVs, LiDAR, Multispectral Imaging |
Disclaimer/Publisher’s Note: The statements, opinions and data contained in all publications are solely those of the individual author(s) and contributor(s) and not of MDPI and/or the editor(s). MDPI and/or the editor(s) disclaim responsibility for any injury to people or property resulting from any ideas, methods, instructions or products referred to in the content. |
© 2024 by the authors. Licensee MDPI, Basel, Switzerland. This article is an open access article distributed under the terms and conditions of the Creative Commons Attribution (CC BY) license (https://creativecommons.org/licenses/by/4.0/).
Share and Cite
MDPI and ACS Style
Gui, S.; Song, S.; Qin, R.; Tang, Y. Remote Sensing Object Detection in the Deep Learning Era—A Review. Remote Sens. 2024, 16, 327. https://doi.org/10.3390/rs16020327
AMA Style
Gui S, Song S, Qin R, Tang Y. Remote Sensing Object Detection in the Deep Learning Era—A Review. Remote Sensing. 2024; 16(2):327. https://doi.org/10.3390/rs16020327
Chicago/Turabian StyleGui, Shengxi, Shuang Song, Rongjun Qin, and Yang Tang. 2024. "Remote Sensing Object Detection in the Deep Learning Era—A Review" Remote Sensing 16, no. 2: 327. https://doi.org/10.3390/rs16020327
Note that from the first issue of 2016, this journal uses article numbers instead of page numbers. See further details here.