

Mapping Compound Flooding Risks for Urban Resilience in Coastal Zones: A Comprehensive Methodological Review


1
College of Engineering, Ocean University of China, Qingdao 266100, China
2
Key Laboratory of Marine Environment and Ecology, Ministry of Education, Ocean University of China, Qingdao 266100, China
3
School of Engineering, Design and Built Environment, Western Sydney University, Sydney 2745, Australia
4
College of Civil Engineering and Architecture, Qingdao Agricultural University, Qingdao 266109, China
5
Guangdong Provincial Seismological Bureau, Guangzhou 510070, China
*
Author to whom correspondence should be addressed.
Remote Sens. 2024, 16(2), 350; https://doi.org/10.3390/rs16020350
Submission received: 24 November 2023
/
Revised: 8 January 2024
/
Accepted: 9 January 2024
/
Published: 16 January 2024
(This article belongs to the Special Issue GIS and Remote Sensing in Ocean and Coastal Ecology)
Abstract
:Coastal regions, increasingly threatened by floods due to climate-change-driven extreme weather, lack a comprehensive study that integrates coastal and riverine flood dynamics. In response to this research gap, we conducted a comprehensive bibliometric analysis and thorough visualization and mapping of studies of compound flooding risk in coastal cities over the period 2014–2022, using VOSviewer and CiteSpace to analyze 407 publications in the Web of Science Core Collection database. The analytical results reveal two persistent research topics: the way to explore the return periods or joint probabilities of flood drivers using statistical modeling, and the quantification of flood risk with different return periods through numerical simulation. This article examines critical causes of compound coastal flooding, outlines the principal methodologies, details each method’s features, and compares their strengths, limitations, and uncertainties. This paper advocates for an integrated approach encompassing climate change, ocean–land systems, topography, human activity, land use, and hazard chains to enhance our understanding of flood risk mechanisms. This includes adopting an Earth system modeling framework with holistic coupling of Earth system components, merging process-based and data-driven models, enhancing model grid resolution, refining dynamical frameworks, comparing complex physical models with more straightforward methods, and exploring advanced data assimilation, machine learning, and quasi-real-time forecasting for researchers and emergency responders.

1. Introduction
Flooding, a major global natural disaster [1], annually affects a vast population, especially in coastal regions that are vulnerable to combined climatic and human-induced hazards [2,3]. Notably, 80% of flood-related fatalities occur within 100 km of coasts [4]. Climate change intensifies typhoons, storm surges, and heavy rains [5], increasing flood risks. With growing coastal economic activities and advancing global warming, the disaster vulnerability in these areas is expected to rise [6], escalating future flood hazards [7,8].
Accurately estimating the spatial extent of flood characteristics like velocity, depth, and frequency is crucial for flood risk analysis, a focus of extensive scholarly research [9,10,11]. As Vojtek [12] and Skakun [13] integrated spatial distribution data of flood inundation extent, depth, and flow velocity with relative flood inundation frequency for flood risk assessment, they have provided new ideas and methods for flood risk evaluation. These methods accurately assess the spatial extent and distribution of flood disasters. However, floods in coastal areas are often not caused by a single hazard but involve the interplay and combined impact of multiple factors. Recent research has shifted from single- to multiple-hazard studies, with the interaction and coupling of different hazards becoming a key challenge in comprehensive risk assessment. Storm cyclones, typically accompanied by heavy rain and storm surges [14,15,16,17,18], along with extreme river flow and astronomical tides, frequently lead to compound flooding. Coastal areas, with their flat terrain and dense river networks, are prone to flooding. Upstream heavy rains can cause river levels to exceed alert thresholds, and local heavy precipitation increases the risk of dam failures or overflows [19]. High tides, storm surges, and sea waves can further exacerbate flooding by causing seawater to back up, particularly when coinciding with river floods, hindering floodwater discharge and worsening drainage [20,21]. Additionally, coastal urbanization has increased the number of impervious surfaces [22,23,24], altering hydrological patterns and affecting precipitation and flow processes. Coastal cities also face challenges in flood management due to inadequate urban drainage infrastructure [25,26,27,28] and significant ground subsidence [29,30]. In summary, while significant progress has been made in understanding and mapping flood characteristics, there remains a critical gap in comprehensively assessing the risk of compound flooding, particularly in analyzing the complex interactions and cumulative impacts of multiple flood-inducing factors in coastal areas [31]. This highlights the need for more integrated and multifaceted research approaches to effectively address the nuances of compound flood risks.
Therefore, this study comprehensively analyzed the processes and mechanisms of compound flooding in coastal regions by reviewing the pertinent literature from the past decade. It focused on three key areas: statistical models, dynamic numerical models, and risk mapping methods employed in assessing coastal compound flood risks. The paper is structured into three distinct sections, each dedicated to one of these focal areas, offering a clear and concise overview of current methodologies and findings in this field. For a detailed process flow, refer to Figure 1.
Part 1: Analysis of the disaster mechanisms of compound flooding. A review of the literature from the past decade was conducted based on keywords, and three methods were discussed: statistical models, numerical simulation models, and risk mapping methods. The risk mapping methods were further categorized into artificial intelligence (AI) and multi-criteria decision-making (MCDM).
Part 2: Various case studies related to statistical models, numerical simulation models, and risk mapping methods were introduced. Additionally, a comprehensive discussion of the strengths and limitations of each category and subcategory was conducted.
Part 3: This chapter introduces the recent advancements in coupled methods, along with the associated uncertainties, and provides recommendations for future applications. By offering a comprehensive understanding of the methods, it aims to make meaningful contributions to the field of research.
Part 4: A summary and recommendations for future research are presented in this section.
In summary, this study offers an in-depth review of the three aforementioned methods, successfully delineating all essential topics to formulate a review structure. Additionally, it sheds light on recent advancements in coupled flood risk analysis and pinpoints areas for further research.
2. Overview of Methods
2.1. Mechanisms of Compound Coastal Flooding
Coastal compound floods are those that take place in coastal regions, influenced by an array of meteorological, hydrological, and hydrodynamic factors. These floods typically result from the interplay and combination of multiple disaster-inducing elements [32,33,34,35,36]. Large coastal cities are prone to suffering from multiple disasters in the course of a storm cyclone, leading to tremendous disaster losses and social impacts [37,38]. Overall, there are three main sources of composite flooding in coastal areas [39,40,41]: (1) the ocean, extraordinary weather events leading to dramatic seawater uplift in the form of superimposed astronomical tidal surges, tsunamis, catastrophic ocean waves, and slow-onset sea-level rise, i.e., so-called coastal flooding; (2) river-type flooding due to runoff from rivers generated by upstream precipitation; (3) localized precipitation, which provokes regional surface waterlogging, called precipitation-type flooding. However, there is still a lack of scientific understanding of the interactions between the aforementioned hazards and the coupled disaster-causing processes in the academic community [42,43]. The simulation assessment and prediction methods are relatively immature, which makes the simulation technology one of the key directions in the current research of composite disaster science. Figure 2 shows a schematic diagram of the flood generation process in coastal cities and the key factors contributing to flood inundation zones.
From a catchment-scale hydrological perspective, extreme precipitation and extreme coastal water levels are the main triggers of coastal flooding. In particular, coastal water levels can be decomposed into mean sea level (MSL), astronomical tides (ATs), non-tidal residuals (NTRs), and wave-gaining water levels, controlled by multiple processes at different spatial and temporal scales [1,44]. That is, in addition to the water levels observed on conventional tide gauges, high-frequency (i.e., orders of magnitude of seconds) fluctuations in water levels due to surface gravity waves should also be considered. Other physical factors, like catchment and river network shape and slope, land-use type (e.g., impervious areas), evapotranspiration, and saturated soils, increase surface runoff and upstream river flows. Simultaneously, from a hydrodynamic point of view, the topography of the river channel and floodplain, the geometry of the river cross-section, the roughness of the river channel and floodplain, and the presence of river structures are other critical factors influencing the area of flood inundation. Ultimately, rainfall caused by storm surges further increases river levels, and compound flooding occurs when river waves enter the river–ocean transition zone with ocean surges [45]. The river waves lose momentum while the surges hold momentum. The difference in velocity makes compound flood events the most likely to strike in inland segments of the river–ocean transition, approaching the tidal limit and increasing the flood risk immediately for coastal cities. Based on the above flood-triggering factors, we conducted searches, investigations, and summaries of relevant articles.
2.2. Detailed Overview of Search Strategy and Database Description
In this study, a comprehensive database was established using bibliometric methods [46], providing a holistic view of the field. This database served as the foundation for identifying current research trends, which were then utilized for subsequent categorical analysis. WOS stands as the leading research platform across various scientific domains and is globally recognized as the most dependable citation database independent of publishers. We utilized keywords related to compound flooding for searching the WOS core database. After removing the less relevant literature, a total of 654 results were obtained. The search terms used were as follows: (coastal/compound flood), (coastal flood/simulation/risk assessment), (coastal flood/simulation/risk perception), (compound flood/risk assessment), (compound flood/risk perception), (rainfall/river flood), (rainfall/storm surge), (storm surge/river flood), (rainfall/storm surge/river flood), (storm surge/wave), (coastal/inundation/risk assessment), (coastal flood/hazard), (coastal/inundation/hazard), (coastal/compound flood/vulnerability), (coastal/compound flood/flood mapping), (compound flood/MCDM), (compound flood/AHP), (compound flood/statistics), (compound flood/statistical), (compound flood/machine learning), (compound flood/numerical modeling), (compound flood/hydrodynamic), (compound flood/physically based). The timespan was from 2014 to 2023, focusing only on research articles and review papers. Within the publications, the selection was further refined based on research areas related to science and technology, physical sciences, social sciences, etc., ultimately identifying 440 publications linked to coastal flooding. Then, CiteSpace was used to exclude duplicate articles, resulting in a selection of 407 specialized publications focusing exclusively on compound coastal flooding. The overall framework of this article is shown in Figure 2. The following is the specific research methodology.
2.2.1. Research Stages in the Database Context
The research article output trends provide insights into the growth and focus of compound flood research within academia. Given that the 2023 publication data are still incomplete, our analysis was confined to the articles published between 2014 and 2022. Figure 3 shows all annual publications between 2014 and 2022. The analysis shows that from 2014 to 2022, the number of publications related to coastal flooding has been increasing annually, with a significant increase since 2019. Even though the literature on compound flooding existed prior to 2014, its systematic investigation commenced and took shape from that year onward. The Intergovernmental Panel on Climate Change (IPCC) stated in its report on managing risks to improve climate resilience measures that “compound events are a combination of multiple physical processes” [47]. Compound floods in coastal areas are among the most typical compound events. Therefore, this paper can state that, after the concept of composite events proposed by the IPCC in 2014, people started to recognize the significance of the research on coastal composite floods with regard to sustainable development, and the relevant field of research began to flourish. Since then, and most notably in 2019, as insights into nature ripen and computational capabilities improve, scholars have embarked on describing composite floods caused by multiple flood drivers. Thereafter, the annual publications increased from 9 in 2014 to 85 in 2022, an increase of 9.4 times in 9 years. The average number of published articles per year during this period was 40.4, for a total of 364 articles. The spike in the number of relevant articles indicates that this research area is becoming increasingly popular, with an upward trend.
Rising attention can also be traced to several factors. Firstly, climate change has intensified the impacts of compound coastal floods over the years, thereby leading to an urgent need for advanced research on disaster mechanisms, warning simulations, and emergency response strategies regarding compound coastal floods. Alternatively, new tools for the research of compound floods have been made available by technological and scientific advances, fueling the continuous growth of this domain of research.
2.2.2. Geospatial Dimensions in the Publications
Figure 4 displays the geographical distribution of the publishing countries or regions for the 407 articles, which are spread across the globe. It should be noted that some publications may have multiple countries as co-publishers. The United States of America (USA), China, the United Kingdom (UK), the Netherlands, Germany, and Australia, all of which have extensive coastlines, were the top publishing countries. Most publications predominantly came from these well-developed nations, indicating that countries with vast coastlines, especially developed ones, pay more attention to this research field. The United States published 186 articles, or 45.7% of the total papers, during 2014–2023 in the field of global coastal compound flooding research. is the US was followed by China (78 papers), the UK (37 papers), the Netherlands (34 papers), Germany (31 papers), and Australia (30 papers). The majority of the research on coastal compound flooding has been carried out in the United States and China. Table 1 provides an overview of the top ten countries in terms of global publication volume. The United States has an average citation count of 24.76 and a total citation count of 4606. Similarly, China has values of 17.41 and 1358, the United Kingdom has 25.02 and 926, the Netherlands has 25.20 and 857, Germany has 32.77 and 1016, and Australia has 93.2 and 2796. Notably, France and Australia exhibit the earliest average publication years among the top ten countries, namely, 2019.10 and 2019.2, respectively. In contrast, China and the United Kingdom have the latest average publication years of 2020.41 and 2020.56, respectively. These findings indicate that China and the United Kingdom have experienced significant development in coastal compound flooding research in recent years, suggesting a potential sustained scientific impact in the future. In conclusion, research on coastal compound flooding is primarily led by the United States and China, with other coastal countries playing important roles.
2.3. Research Trends through Keywords
Keyword analysis enables researchers to grasp core research topics, identify emerging trends, and pinpoint focal areas of study. Figure 5 illustrates a knowledge map created from the results of a keyword co-occurrence analysis conducted using VOSviewer. The green cluster is the largest cluster, with the representative keyword “Numerical Model”. The term “Numerical Model” appeared in 91 out of 407 articles, highlighting its pivotal role in this research domain. This cluster also contains the keywords model, hazard, HEC-HMS, flood modeling, hydrodynamic modeling, inundation model, scenarios, hazard assessment, hydrodynamic model, shallow-water equations, and compound flooding. The grey cluster is the second largest keyword cluster, including the keywords return period, frequency analysis, dependence, copula function, probability, and multivariate. The red cluster includes sea level, fluxes, waves, and wind. The blue cluster contains land use, machine learning, vulnerability assessment, and livelihoods. Furthermore, a selection of frequently occurring words was compiled for further analysis, as shown in Table 2. Through the clustered keywords, it can be observed that, in this study, the red cluster primarily focuses on the driving factors of coastal compound flooding, while the grey cluster is centered around terminologies related to statistical analysis. The green cluster revolves around numerical simulation methods used in compound flooding research, while the blue cluster involves methods of risk assessment. To succinctly represent these clusters, they have been categorized as “Variability”, “Encounter Probability Model”, “Numerical Simulation Model”, and “Integrated hazard risk mapping”, respectively.
The thematic evolution map is created by clustering the domain’s keyword networks of different topics [48]. Figure 6 shows an overall picture of the evolution of topics in compound research from 2014 to 2023. The analysis of the thematic evolution graph gives us an idea of the trend of relevant research contents and topics. Two cutoff times were selected based on the volume of the published works: 2015 and 2020. The period from 2017 to 2019 was an important period for the study of compound floods. Strongly related words such as “compound flood”, “compound event”, “sea-level rise”, “storm surge”, and “river flow” have appeared many times. The latest research is more inclined to analyze the composite risk of compound floods, and the keywords focus on words such as “pair copula construction”, “modeling dependence”, “bivariate frequency analysis”, and “risk management”.
The analysis of keywords and trends presented above highlights two primary concerns: The first is assessing the future relevance of these driving forces and the likelihood of their concurrent occurrence. A significant joint probability suggests an increased frequency of compound floods. The second concern is understanding the cumulative impact of these forces on flooding. Addressing these concerns, this paper discusses composite flood hazards in three main sections: statistical modeling, dynamic numerical modeling, and risk mapping.
3. Research Results and Discussion
This article examines the risk of compound floods, which is defined by their frequency (return period), intensity (such as water level, volume, and duration), and potential impact (like inundation depth). Statistical models are typically employed to determine flood frequency, while the intensity and scope of impacts are better assessed using dynamic numerical models and risk mapping. This paper systematically reviews advances in composite flood hazard simulations and evaluations, focusing on encounter probability models, numerical simulations, and integrated hazard mapping techniques.
Probabilistic modeling, numerical modeling, and risk mapping form an interconnected framework, where each component contributes to and utilizes data from the others. Probabilistic models use historical flood data to calculate flood occurrence probabilities or frequencies, known as return periods [49]. This output then informs numerical models, especially for evaluating scenarios at different return periods. These numerical models incorporate data like meteorological conditions, topography, land use, and flood frequency from probabilistic models to detail flood characteristics, such as levels, velocities, and flow rates [50,51]. These details are essential for risk mapping, which employs numerical model outputs and integrates them with GIS technology to create inundation and risk maps [52,53]. These maps provide critical insights for decision-makers about a flood’s potential geographic spread, inundation depth, and damage distribution. The interplay of inputs and outputs among these models is detailed in Table 3.
In summary, probabilistic models estimate the probability of flood occurrence, numerical models delineate the flood’s specific features, and risk mapping presents these details visually to highlight the potential scope of a flood’s impact.
3.1. Statistical Models
Within the realm of flood-related statistical model research, the initial studies mainly concentrated on the statistical analysis of rainfall, runoff, and storm surges. Table 4 concisely outlines the methodologies, findings, and insights from key research on various flood hazard factors.
Although many initial studies have acknowledged the individual impacts of extreme rainfall, coastal flooding, and river flooding, few have addressed their combined effects. This omission potentially compromises the accuracy of depicting the true dynamics of compound flooding events and the associated statistical features of disaster risk. Therefore, research on the joint analysis of multiple hazard factors, based on data from station observations and numerical simulations, is gaining increasing prevalence. The primary research objectives of multivariate analysis include evaluating the correlation [54], dependence [55], encounter probability [56], combination design, and conditional probability [57] among multiple hazard factors. Correlation and dependence studies aim to quantify the interrelationships among these hazard factors. Combination design is carried out to design different encounter scenarios, such as storm surge–astronomical high tide levels, extreme rainfall–storm surge, storm surge–extreme runoff, extreme runoff–sea-level rise, and so on. Encounter probability represents the probability of events occurring under these different combination scenarios [58]. Conditional probability indicates the probability of one event occurring given the condition of another event occurring [59]. For a comprehensive overview, refer to Table 5, which tabulates several case studies on multivariate flood analysis, encompassing causative factors, research outputs, scenario combinations, and employed methodologies.
Table 5 highlights the predominant use of the copula method in recent studies. The copula method was most widely used in these studies. Copula is one of the latest advancements in the field of multivariate dependence modeling, and it can be used for calculating joint probability distributions, dependencies, and return periods of bivariate or even multivariate relationships in compound flood scenarios, such as rainfall–storm surge [14,69,70], rainfall–tide [66,71,72], or sea-level rise–river [73,74]. More than a dozen linear copula functions have been identified in known studies, each of which corresponds to a different number of parameters, and which differ significantly in their fitting performance [59]. In general, copula functions can be classified into three main categories: Archimedean copula, elliptical copula, and quadratic copula. The Archimedean copula family includes both symmetric copulas (such as the Frank copula) and asymmetric copulas (such as the Joe copula). The elliptical copula family includes the Gaussian copula and the t copula. Detailed categorization information can be found in Figure 7. The Frank copula, Gumbel copula, and Clayton copula, which are the most commonly used Archimedean copulas in the field of hydrology, have different tail characteristics [75]. Different copula functions are used in practical applications, and the calculation results have large differences, so it is especially critical to select a suitable copula function. In practice, it is necessary to select the copula function that works best with the available data according to the root-mean-square error criterion (minimum RMSE), Akaike information criterion (minimum AIC), and BIC (minimum BIC) [76]. But regardless of the type of copula function, binary copulas are still predominant in the current research. Multivariate coupling modeling is more challenging compared to bivariate modeling, and it should be a future consideration to improve the model to accommodate more variables.
3.2. Numerical Modeling Approaches
In the past, both numerical simulation models and statistical models primarily concentrated on singular hazard factors, including rainfall, storm surges, and river flows, rather than a combination of elements. Recent trends, however, have shifted towards encompassing multiple hazard factors in flood simulation studies. The application research of numerical simulation models can be categorized into two types, namely, single-type and coupled-type, based on the number of compounded flood factors involved. Figure 8 displays the overall framework of the numerical simulation model.
3.2.1. Isolated Scenario Analysis (ISA)
In coastal regions, rainfall runoff serves as a principal driver of compound flooding events. Researchers use different control conditions and mathematical equations to create numerical models that simulate this process. These models are essential for predicting floods’ development and behavior in various environmental settings. Generally, these simulation models fall into two categories: static and dynamic numerical models.
In fluids with an extremely low viscosity coefficient, the resistance term becomes trivial to the extent that it can be omitted, and the momentum equation may also be considered unnecessary. When hydrodynamic equations exclude this dynamic term, the model is classified as a non-dynamic numerical model. In 2001, Liu introduced a flood assessment methodology utilizing digital elevation models (DEMs), categorized into two types: passive submergence and active submergence [77]. Both of these methods belong to the category of non-dynamic numerical models. The passive submergence analysis method, commonly referred to as the “bathtub model [78]”, utilizes a digital elevation model (DEM) by overlaying the floodplain surface onto a raster or triangulated irregular network (TIN) [79,80]. In this approach, all areas below the flat floodplain surface are classified as flooded, disregarding the impact of topography on water flow. However, previous studies have indicated that this method tends to overestimate the depth and extent of flooding due to its simplistic representation of flood routing [81,82]. This is due to the importance of considering topography in flood simulations, which cannot be ignored, as it directly affects the flow of floodwaters and can hinder the spread of floodwaters in higher-elevated areas. When the influence of both topography and discharge points is considered on top of the passive submergence model, it is referred to as active submergence. The cellular automaton (CA) method is commonly used to simulate active submergence. CA is a grid-based dynamical model that discretizes time, space, and states [83], enabling the capture of the spatiotemporal evolution of floods. Jamali (2019) proposed a rapid flood inundation model called CA-ffé, based on the CA method, and compared it with HEC-RAS and TUFLOW [84]. The results proved that CA is effective. However, it is worth noting that CA models are often tested under ideal conditions and may exhibit lower accuracy in reproducing 2D fluid dynamics compared to models based on the comprehensive shallow-water equations (SWEs).
In contrast with the approach of non-dynamic numerical models, many researchers incorporate the dynamic term in governing equations for more accurate flood flow simulation and precise data acquisition, known as dynamic numerical modeling. In the dynamic numerical models for single-element simulation, there are hydrological models, as well as 1D, 2D, and 3D hydrodynamic models. The hydrological model typically operates independently to calculate the inflow and outflow, determining the temporal variation in flow at upstream cross-sections and control sections of river branches [85,86]. This flow process can be used as an input boundary condition for hydrodynamic models. In hydrodynamic simulations, the 1D hydrodynamic model is inadequate for addressing the problem of urban surface floods that lack a fixed direction and path. At the same time, the computation of a 3D hydrodynamic model is both complex and time-consuming. Consequently, the application of 2D hydrodynamic models is more extensive.
In the realm of 2D hydrodynamic modeling, certain scholars have streamlined the governing equations, resulting in practical and computationally efficient models—for example, 2D diffusion wave models that ignore the local acceleration term and the convective acceleration term, simple inertial models that ignore the convective acceleration term (e.g., LISFLOOD-FP [87]), and a 2D kinematic wave model omitting the local acceleration term, convective acceleration term, and pressure term [88]. The kinematic wave model was initially developed for fluvial flooding with deeper water [89,90]. When conducting simulations of relatively shallow urban surface water inundation, the kinematic wave model has certain limitations, requiring several significant assumptions to be made, and it has a low level of accuracy itself. Therefore, the diffusion wave model [91,92,93] and the simplified inertial equation model [94,95] are considered to be more practical and commonly used simplified models in the field of flood disaster simulation and risk perception. However, simplified models may lead to inaccurate computational results.
Compared to simplified equations and models, the complete 2D SWE applies to various flow conditions and geographical environments, including meandering watercourses, complex terrain, and irregular water bodies. The complete 2D SWE model that considers more physical details and more accurate fluid dynamic simulation results can be obtained, yielding excellent performance in surface flood simulation research. However, in the full-process simulation of urban floods, the 2D model does not account for the influence of underground drainage pipes, which is a limitation. Therefore, to enhance the accuracy of coastal city flood simulations, many researchers have focused on the coupling of 1D drainage network models with 2D surface flow models [96,97,98,99]. By establishing a fluid exchange between the 2D and 1D models, a more comprehensive urban flood model can be constructed.
As crucial as rainfall runoff, another equally significant contributor to coastal flooding is the phenomenon of storm surges. Historically, most of the early storm-surge simulations were 2D models based on depth-integrated SWEs [100,101,102,103]. Their predominant advantages lie in their simplicity and computational efficiency, which is why they have been adopted extensively for storm-surge warnings across numerous countries [104]. As computing capabilities advanced alongside the refinement of algorithms, the realm of oceanography saw a gradual shift towards 3D numerical models for storm-surge simulation and operational forecasting, such as the ADCIRC, DELFT3D, POM, and FVCOM models [105]. For instance, Valle (2018) coupled the Weather Research and Forecasting (WRF) model with the Advanced Circulation Model (ADCIRC) to simulate the effects of storm surges [106]. Liu (2018) created a 3D visualization of the flood pathway process based on the volume-of-fluid (VOF) numerical model [107]. The study’s results indicated that 3D visualization can serve as an effective tool to visually and realistically present the dynamic changes in hydrological information. Ye (2020) proposed a 3D atmospheric pressure model for river-to-ocean flow based on unstructured grids [108]. This model integrates traditional hydrological and oceanographic models into a single modeling platform to simulate storm surges, subsequent river flooding events, and compound wave surges. This research demonstrates the significance of incorporating the 3D effect in storm-surge simulations. In comparison to two-dimensional (2D) modeling approaches, three-dimensional (3D) simulations provide a comprehensive inclusion of critical parameters such as topography, bathymetry, wind velocity, and wind direction. Additionally, by integrating these factors, more accurate storm-surge modeling and precise prediction of surge water levels can be achieved, leading to more precise estimations of inundation extents.
Expanding on this concept, it is important to highlight the distinct challenges posed by wave flooding. Wave flooding is a type of flooding caused by large amounts of seawater being pushed onto the coast by strong winds, leading to considerable infrastructural damages, including to structures like dikes and bridges. Notably, wave flooding intensifies the risks associated with compound flooding. Krishna’s 2023 study on India’s southwest coast delved into the interplay between waves, wind, and tides, illuminating wave activity’s pivotal role in flood catastrophes [109]. A comprehensive literature review reveals a research gap, with single-wave flooding being relatively less studied than rainfall-induced or storm-surge floods. This can be attributed to the fact that wave flooding is inherently triggered by intense winds, with extreme meteorological events, especially severe storms, typically resulting in outcomes like storm surges. Consequently, research on wave flooding typically integrates elements like tides and storm surges.
Broadly, global development issues like rising sea levels [110,111], the expansion of impervious surfaces [22,23,24], and land subsidence [112,113] significantly impact flood patterns. Their effects are particularly pronounced in determining the severity and frequency of compound flooding in coastal regions. Rather than studying these elements separately, they are often analyzed in tandem with other influencing factors to gain a deeper understanding of compound flooding mechanisms. A compilation of frequently utilized dynamic numerical simulation models for single-scenario simulations, complete with the associated control equations, access methodologies, and results, can be found in Table 6.
3.2.2. Composite Scenario Analysis (CSA)
Compound flood inundation typically encompasses multiple terrestrial processes, including rainfall and river flow, along with marine elements such as storm surges and waves [59]. Therefore, simulating compound flood scenarios requires the coupling of oceanographic, hydrological, and hydrodynamic processes. In common composite scenario numerical simulations, it is common to use the results of one model as input conditions for another model. Based on the type of model that ultimately determines the extent of flood inundation, these models can be classified into three categories [117]: hydrodynamics-dominated models (such as HEC-RAS, MIKE21, and LISFLOOD-FP), hydrology-dominated models (like SWMM, MIKE SHE, and VIC), and oceanography-dominated models (such as ADCIRC, POM, and Deleft3D), as shown in Figure 9. Hydrodynamics-dominated models use observed or simulated hydrological and oceanographic datasets as inputs to direct the final inundation extents. For example, Yin (2016) coupled the storm-surge model ADCIRC with the urban flood inundation model FloodMap, using the ADCIRC storm-surge modeling as an input to simulate the urban inundation in New York City during Hurricane Sandy [118]. Shen (2022) coupled a storm-surge model with a coupled 1D/2D urban flood model to quantify the impact of possible future climate scenarios on the transportation infrastructure in Norfolk, Virginia, USA [119]. Bennett (2023) studied compound flooding in North Jakarta, Indonesia caused by waves, tides, and river flow, using a coupling of the Delft3D and HEC-RAS models [120]. Hydrodynamics-based coupled models have the advantage of using readily available datasets or simulation results from open models as inputs. This can avoid the need for complex models, such as hydrological and oceanic circulation models, since there is no established mutual interaction between the two models; only using the results of the previous model as the input for the next model may lead to underestimation of the final simulation results, resulting in inaccurate outcomes.
The hydrology-dominated coupled models focus on establishing hydrological simulation processes and combining observed data or model-generated sea levels to simulate the entire process from precipitation runoff to inundation. Silva-Araya (2018) proposed an approach combining the simulated wave nearshore model and the Advanced Circulation Model (ADCIRC) with the gridded surface/subsurface hydrological analysis (GSSHA) 2D hydrological model to determine the levels of coastal flooding caused by a combination of storm surge and surface runoff [121]. Shi (2022) investigated the effects of compound flooding when rainfall and storm surges occur simultaneously, developing a coupled model based on the 1D hydrological model SWMM and the 2D hydrodynamic model ADCIRC [122]. Similarly, hydrology-dominated coupled models, in which the interaction between storm surges and runoff is not considered, can underestimate the simulation results.
In oceanography-dominated coupled flood simulations, the focus is primarily on simulating marine processes while utilizing simulated or observed data of hydrological processes such as rainfall and runoff as inputs. Tromble (2013) utilized the distributed hydrological model HL-RDHM to generate flow boundary conditions for ADCIRC and simulated storm-surge inundation [123]. Bacopoulos (2017) integrated the SWAT and ADCIRC models to develop a coupled model for flood prediction in coastal regions [124]. Lee (2019) coupled the hydrological model HEC-HMS with the hydrodynamic model Delft3D, where HEC-HMS was used for hydrological simulation, while Delft3D incorporated the runoff data, wind speed, pressure, and topography from HEC-HMS to calculate compound flood water levels and velocities [125]. In oceanography-dominated coupled flood simulations, the neglect of mutual interactions between rainfall, river flooding, and marine processes can also lead to an underestimation of the inundation outcomes in the coupled flood simulation.
Table 7 lists additional composite flood coupling modeling studies that employ this method, including their categories, models, and research subjects.
3.3. Integrated Hazard Risk Mapping
Flood hazard maps are essential for probing areas exposed that are to flood hazards, and they provide an effective representation of the spatial extent and distribution of flood hazards. Flood risk mapping plays an instrumental role in the identification of potential flood hazard areas, hazard intensities, flood depths, and initial damage levels. Compared to probability models and numerical simulation models, integrated hazard risk mapping is simpler and more suitable for large-scale and long-term risk assessment, and it has strong integration capabilities [134] with other methods. Based on the integration status with numerical simulation models, integrated hazard risk mapping methods can be classified into two categories: empirical methods and physical-based methods. Empirical methods include MCDM and AI methods [135]. Physical-based methods combine empirical models with numerical simulation models, using accurate physical information such as water depth, flow velocity, and inundation area obtained from the simulation models for more precise risk assessment. The structure and classification of integrated hazard risk mapping methods are shown in Figure 10.
MCDM refers to the decision to choose a limited (infinite) set of conflicting schemes that cannot be shared. This is a method that aims to help decision-makers integrate information to simplify the decision-making process. The result is usually a set of weights related to different goals [136,137]. Then, utilizing the weighted linear combination and sequential weighted average method [137], the weights are summarized, and the attributes of each factor are summed along with their weight to determine the final score of the factors considered in the analysis. After investigation, the analytic hierarchy process (AHP) [138,139] is the most popular MCDM method in flood risk assessment [140]. The AHP can rank alternative solutions based on several criteria through discrete or continuous pairwise comparisons to address decision-making problems [141], and today it is seldom used alone but, mostly, combined with other flood risk assessment tools to perceive the risk. For example, Cui (2017) considered flood factors in coastal cities, such as the geological deposition rate, rising sea levels, precipitation, the length of urban drainage pipes, annual GDP, and population, utilizing the AHP, Grey model (GM), and artificial neural network (ANN) to predict flood losses [142]. Currently, the application of MCDM in the field of composite flood risk perception is limited, but it has great potential for development.
Recently, the application of AI techniques, such as machine learning (ML) and deep learning (DL), in geological hazard modeling has been rapidly advancing. ML models are a subfield of AI capable of building predictive models from historical data. They use remote sensing (RS) and past flood data to detect spatial flood ranges and sensitive areas. According to different data and different needs, the researchers can choose different ML algorithms to determine the risk of coastal compound floods. Among these, the ANN is the most popular and widely used method [143]. Wang (2016) developed an ANN-based system to predict storm surges along the Louisiana coast [144]. Sahoo (2019) proposed an alternative approach to predict storm surges and onshore flooding using techniques such as ANNs, using pre-computed storm-surge and flood data scenarios to train ANN models for the entire Orissa coast, with a 99% success rate [145]. Chondros (2021) proposed an integrated approach for flood warning applicable to the flood-prone coastal area of Rohimno, Crete, Greece, developing an ANN model and demonstrating the superior performance of the developed ANN [146]. In addition to ANNs, other ML models—such as random forests (RF) [147,148,149,150,151], the Gaussian process metamodel (GPM) [152], support-vector machine (SVM) [147,150], and recurrent neural networks (RNNs) [153]—have also been applied. The ML model can make full use of historical data without considering the physical process of flood formation and can quickly train, verify, test, and evaluate the risk of floods based only on the historical flood record dataset, which provides an easier-to-implement approach to flood prediction, with high performance and relatively little complexity compared to physical models [154]. However, considering accuracy, it is still necessary to strengthen the close connection between ML and the physical process of flood formation. At present, there are few algorithms involved in the related flood mechanisms [155]. This will be one of the key research directions of ML methods in the field of flooding in the future. DL, as a subset of ML based on neural network structures [156], consists of multiple performance layers and obtains nonlinear modules through construction [157]. Convolutional neural networks (CNNs) are a commonly used method in DL. Liu (2019) developed an effective and robust method for coastal inundation mapping based on a deep CNN with dual-time-phase and dual-polarized synthetic-aperture radar (SAR) image information [158]. Munoz (2021) evaluated the performance of CNN and data fusion (DF) frameworks for generating composite flood maps along the southeast Atlantic coast of the United States under the influence of Hurricane Matthew [159]. The results show that the resulting composite flood map matches well (80%) with the backward-guided flood map for coastal emergency risk assessment. Although DL has been a hot research direction in recent years, the application of DL in flood risk perception is still a relatively new field.
Physical-based methods, as compared to empirical models, have several advantages. Firstly, physical-based methods can consider more complex scenarios by incorporating multiple interacting physical factors associated with compound flood hazards, leading to more accurate risk assessment results. Secondly, numerical simulation models used in physical-based methods can partition the study area into smaller grid cells, resulting in more precise risk assessment outcomes. Currently, many scholars have already employed physical-based methods for assessing flood risks. Hsu (2017) used the wind wave model (WWM), Princeton Ocean Model (POM), and WASH123D watershed model to simulate wave conditions, storm surges, and coastal inundation [160]. Based on the results of the inundation simulation, an analytic hierarchy process (AHP) was employed to establish a research area risk map using vulnerability and hazard analysis [160]. Afifi (2019) conducted a comprehensive study on flood risk by using the 3Di model and high-resolution DEM to simulate typhoon-induced flood inundation, assessing disaster losses and evaluating the vulnerability of the study area through the AHP [161]. Yan (2021) proposed a method that couples neural networks with numerical models to simulate and identify high-risk areas for urban floods [162]. The results indicated that this method achieved a high level of prediction accuracy. Ayyad (2022) utilized the ADCIRC model to simulate and generate a large dataset of synthetic tropical cyclones, which was then used to train, validate, and test an ANN model [163]. The study demonstrated that physical-based simulations can be combined with ANN models to provide faster and more efficient predictions for low-probability events. Zhang (2022) proposed a flood prediction model called QPF-RIF, which combines a hydraulic model (SOBEK), support-vector machine–multistep forecast (SVM-MSF), and a self-organizing map (SOM) [164]. The test results demonstrated that this model is capable of accurately predicting the long-term distribution and depth of floods, offering more reliable real-time and future information. Numerous studies have demonstrated that combining integrated hazard risk mapping methods with numerical simulation models can yield better predictive results.
Finally, some case studies are listed in Table 8, showcasing the methods, classifications, input indicators, and output results applied in integrated hazard risk mapping.
4. Challenges and Future Perspectives
Under climate change and urbanization, there will continue to be a rise in sea levels [170], an increase in the frequency and intensity of typhoons and extreme rainfall [171], and shifting interactions between runoff and storm surges [172], with the tendency for compound flooding in coastal areas to be increasingly severe [73]. Advancing research on compound floods in the context of climate change is crucial for enhancing flood response strategies and effective risk management. Given these circumstances, several key aspects should be considered in future studies of compound flooding in coastal regions.
In compound flood frequency analysis, the assumption of stationarity under a consistent distribution is paramount. However, this assumption has been increasingly challenged by the escalating frequency and intensity of typhoons, influenced by global climate change, rising sea levels, and anthropogenic activities. These factors have significantly altered the stationarity of key variables like precipitation, runoff, and tidal levels [59,173]. Consequently, compound flood studies that rest on the stationarity premise may not fully encapsulate the complexities of contemporary real-world scenarios [174]. Additionally, the data underpinning these statistical methods, whether sourced from observational stations or simulation outputs, often face challenges related to their quality and duration [175], which, in turn, can profoundly influence the assessment’s outcomes [59]. Moreover, under the non-stationarity assumption, there is a noticeable dearth of research on multidimensional statistical models for compound floods, especially those extending beyond two dimensions. The intricacies of developing such models under nonstationary conditions present not only computational challenges but also theoretical ones, as they require the integration of multiple approaches. Further research endeavors in this direction are not only warranted but essential for enhancing our understanding and predictive capabilities.
For example, Razmi (2022) considered the non-stationarity of extreme sea levels and precipitation, conducting bivariate frequency analysis using the copula method [176]. The results showed that under nonstationary conditions, the joint return period of compound floods was shorter. Naseri (2022) evaluated the dependencies and non-stationarity effects between variables in coastal–pluvial compound floods in the context of rising sea levels and changing precipitation patterns, using a copula-based Bayesian framework [55]. It was found that the risk of compound floods was greater under nonstationary scenarios. Pirani (2023) considered the non-stationarity of rainfall, river flow, and coastal floods in both the temporal and spatial dimensions, developing a nonstationary multivariate model using the C-vine copula method with constant, linear, and quadratic link functions for the parameters, and the uncertainties were quantified based on the Bayesian approach [177]. The results indicated that under nonstationary conditions, the joint return period of compound floods significantly shortened, and the failure probability exceeded that of the assumption of stationarity. However, because the higher uncertainty and complex dependencies lead to difficulties in constructing joint multivariate statistical models, there are still fewer studies on joint multivariate probabilistic analyses of compound floods. Future studies should consider more joint variables and select more flexible methods for modeling, which is the future trend.
Building on these insights about non-stationarity, it is clear that researchers need better tools to understand floods. This is where the recent shift towards coupling numerical simulation models comes into play. In recent years, the coupling of numerical simulation models has emerged as the predominant approach for composite flood simulation, with the objective of attaining a comprehensive and granular representation of flood dynamics. Huehne (2016) delineated this model coupling into four distinct categories: unidirectional-type coupling, loose coupling, tight coupling, and complete coupling [178]. Specifically, the unidirectional transfer of information, as detailed in Section 3.2.2 is indicative of unidirectional-type coupling. Loose coupling allows models to operate independently yet synchronize to facilitate concurrent information iteration. Conversely, tight coupling is achieved through code integration, enabling interaction within the same code, while complete coupling represents the seamless integration of various models into a unified framework that operates under a consistent equation set [117,178].
Notably, current research heavily leans towards unidirectional coupling [33,117], despite its inherent limitations. For instance, the unidirectional coupling between ocean and land hydrological models typically uses ocean model outputs as inputs for the hydrological model, potentially overlooking the risk of critical land–ocean interactions. This oversight underscores the need for advancing research into loose, tight, or even complete coupling for more accurate composite flood simulations. Presently, investigations into loose and tight couplings remain limited. Saleh (2017) employed a loose coupling technique, combining the HEC-HMS hydrological model, the NYHOPS ocean model, and the HEC-RAS hydrological model to simulate inundation during Hurricanes Irene (2011) and Sandy (2012) [128]. Similarly, Tang (2013) implemented a domain decomposition method, facilitating tight coupling between the Godunov-type shallow-water model (SWM) and the ocean model FVCOM [179]. Moreover, Shi (2022) amalgamated the one-dimensional SWMM model into the two-dimensional ADCIRC model, achieving tight coupling to examine various flood factors [122], while Li (2022) employed the tightly coupled ADCIRC-SWAN model to study storm-surge-induced coastal inundation in Laizhou Bay [180]. Nonetheless, merely amplifying the coupling intensity may not suffice for accurate simulations. It is paramount to recognize that coupled models inherently harbor uncertainties, such as initial topographical inaccuracies [181,182] and potential errors in prior driving data [183]. Other uncertainties, including those stemming from model parameters like roughness coefficients and wind resistance, are elaborated upon in Table 9. Addressing these challenges will be vital for future advancements in composite flood hazard assessment.
Data assimilation (DA) has emerged as a pivotal technique to counteract uncertainties, aiming to synergize model states with observational data, either from the field or from remote sensing, to refine predictions [184]. Its efficacy has been documented across various realms, including hydrology [185,186], meteorology [187,188], and ocean modeling [189]. Asher (2019) introduced an optimized interpolation-based DA approach, which significantly reduced the water-level residuals during Hurricane Matthew on the US’s southeastern Atlantic coast [190]. This method was observed to halve the storm’s overall surge error. Munoz (2022) coupled an integrated Kalman filter with hydrodynamic modeling, underscoring DA’s capacity to bolster composite flood hazard assessments in vulnerable regions, irrespective of the primary flood drivers—be they fluvial, stormwater, or coastal [191]. The potential of DA to address uncertainties in composite flood drivers presents a promising avenue for future research.
However, a salient challenge remains: coupled models, given their complexity, often lack real-time computational efficiency. This has led to a pivot towards harnessing acceleration technologies like GPU and parallel algorithms. Proven to exponentially enhance flood models’ computation speeds, GPU algorithms represent a game-changer in the field [192,193,194]. For instance, Li (2022) showcased a 2D hydrodynamic parallel model that achieved a staggering 42-fold acceleration in flood simulation for Harbin’s Nangang district [195]. Similarly, Buttinger-Kreuzhuber (2022) introduced a hybrid method merging GPU-accelerated runoff simulation with CPU-based sewer network simulation, achieving up to 1000 times the speed [196]. Yet, it is pertinent to note that while GPUs excel in accelerating simpler models, they falter with intricate ones. This necessitates refining the dynamical framework and simplifying the coupled model without compromising its essence.
Statistical models, while proficient at calculating dependencies between flood drivers, lack the capacity to depict the scope and depth of flood inundation or to quantify the mitigation impact of hydraulic engineering constructions [197]. In contrast, numerical modeling provides a vivid representation of compound flooding risks. Marrying statistical methods with numerical models leverages the benefits of both methodologies. However, risk assessments rooted solely in historical data often neglect the uncertainties ushered in by dynamic conditions. Hence, an amplified focus on research addressing hazard factor uncertainties is paramount [198,199]. This can be achieved by generating extensive datasets through stochastic simulations that encompass random rainfall, typhoon trajectories, and intensities. Utilizing numerical models can further dissect the inherent uncertainties in these simulations. Notably, current flood risk assessments under climate change uncertainties remain underexplored and tend to be limited to individual factors. As an illustration, Chaudhary (2022) introduced a probability-centric deep learning technique to ascertain uncertainties from intensified rainfall due to variables like climate change and urban expansion [200]. It is also crucial to acknowledge that extreme events, such as typhoons, can catalyze secondary hazards like landslides. A deeper understanding of the interconnected dynamics behind these cascading disaster sequences is vital. Equally important is the consideration of the evolving vulnerability of exposed elements [201], influenced by diverse factors, ranging from coastal defense strategies amidst global climate change to demographic shifts and socioeconomic developments, all of which collectively shape coastal risk projections.
The described approaches, while distinct, can be synergistically coordinated. For practical implementation, it is crucial to account for the study area’s unique disaster database, geographic nuances, and related factors. This involves tailoring methods to the required spatial scale and precision of the risk assessment. In forthcoming endeavors, researchers and policymakers can select or merge methods based on their merits, drawbacks, and suitability, ensuring enhanced compound flood assessments in coastal regions. A concise summary comparing the strengths, weaknesses, and best-use cases of these three flood hazard simulation methods is presented in Table 10.
5. Conclusions
In the face of global climate change, coastal urban areas increasingly grapple with compound flooding risks, stemming from multifaceted triggers like precipitation, river flows, storm surges, and tsunamis. Coping with these challenges requires advanced flood hazard modeling and risk perception techniques, which are essential for coastal disaster mitigation and sustainable development. While existing methods, ranging from probability models to numerical simulations and integrated hazard risk mapping, have achieved progress, there remains substantial room for refinement. Crucial advancements include better multivariate analyses, accounting for climate change disruptions, enhancing numerical models’ fidelity, and addressing the rising complexities in simulations, especially with the push from 2D to 3D representations. Furthermore, understanding the intricacies of hazard interrelations, like floods triggering landslides, is vital. Charting the way forward, it will be essential to select or synergize methods based on their specific merits, tailored to the study’s unique geographical and data attributes. This holistic, integrative approach will bolster our capacity for precise flood assessments, ultimately minimizing risks in vulnerable coastal regions.
Author Contributions
Conceptualization, H.S. and H.J.; methodology, H.S. and X.Z.; visualization, H.S. and X.R.; formal analysis, H.S., H.J. and W.S.; software, H.S., X.Z. and W.S.; writing original draft preparation, H.S. and X.Z.; writing—review and editing, H.S. and X.Z.; data curation, H.S. and X.Z.; supervision, H.S. and X.R. project administration, H.S. All authors have read and agreed to the published version of the manuscript.
Funding
This research was funded by the National Natural Science Foundation of China, grant numbers 52071307, U1901602; the Qingdao Natural Science Foundation, grant number 23-2-1-61-zyyd-jch; a Chinese Government Scholarship, grant number 202106335006; and the Key R&D projects of Shandong Province, grant number 2020CXGC010702.
Data Availability Statement
Not applicable.
Conflicts of Interest
The authors declare no conflict of interest.
References
- Jafarzadegan, K.; Moradkhani, H.; Pappenberger, F.; Moftakhari, H.; Bates, P.; Abbaszadeh, P.; Marsooli, R.; Ferreira, C.; Cloke, H.L.; Ogden, F.; et al. Recent Advances and New Frontiers in Riverine and Coastal Flood Modeling. Rev. Geophys. 2023, 61, e2022RG000788. [Google Scholar] [CrossRef]
- Barbaro, G.; Bombino, G.; Foti, G.; Barilla, G.C.; Puntorieri, P.; Mancuso, P. Possible Increases in Floodable Areas Due to Climate Change: The Case Study of Calabria (Italy). Water 2022, 14, 2240. [Google Scholar] [CrossRef]
- Garzon, J.L.; Ferreira, O.; Reis, M.T.; Ferreira, A.; Fortes, C.J.E.M.; Zozimo, A.C. Conceptual and quantitative categorization of wave-induced flooding impacts for pedestrians and assets in urban beaches. Sci. Rep. 2023, 13, 7251. [Google Scholar] [CrossRef]
- Hu, P.; Zhang, Q.; Shi, P.; Chen, B.; Fang, J. Flood-induced mortality across the globe: Spatiotemporal pattern and influencing factors. Sci. Total Environ. 2018, 643, 171–182. [Google Scholar] [CrossRef]
- Lap, T.Q. Researching the Variation of Typhoon Intensities under Climate Change in Vietnam: A Case Study of Typhoon Lekima, 2007. Hydrology 2019, 6, 51. [Google Scholar] [CrossRef]
- Rajasree, B.R.; Deo, M.C. Assessment of Coastal Vulnerability Considering the Future Climate: A Case Study along the Central West Coast of India. J. Waterw. Port Coast. Ocean Eng. 2020, 146, 05019005. [Google Scholar] [CrossRef]
- Chan, F.K.S.; Yang, L.E.; Scheffran, J.; Mitchell, G.; Adekola, O.; Griffiths, J.; Chen, Y.; Li, G.; Lu, X.; Qi, Y.; et al. Urban flood risks and emerging challenges in a Chinese delta: The case of the Pearl River Delta. Environ. Sci. Policy 2021, 122, 101–115. [Google Scholar] [CrossRef]
- Garzon, J.L.; Ferreira, O.; Zozimo, A.C.; Fortes, C.J.E.M.; Pinheiro, L.V.; Ferreira, A.M.; Reis, M.T. Development of a Bayesian networks-based early warning system for wave-induced flooding. Int. J. Disaster Risk Reduct. 2023, 96, 103931. [Google Scholar] [CrossRef]
- Pham, B.T.; Avand, M.; Janizadeh, S.; Phong, T.V.; Al-Ansari, N.; Ho, L.S.; Das, S.; Le, H.V.; Amini, A.; Bozchaloei, S.K.; et al. GIS Based Hybrid Computational Approaches for Flash Flood Susceptibility Assessment. Water 2020, 12, 683. [Google Scholar] [CrossRef]
- Dong, B.; Xia, J.; Zhou, M.; Li, Q.; Ahmadian, R.; Falconer, R.A. Integrated modeling of 2D urban surface and 1D sewer hydrodynamic processes and flood risk assessment of people and vehicles. Sci. Total Environ. 2022, 827, 154098. [Google Scholar] [CrossRef]
- Cui, Y.; Liang, Q.; Wang, G.; Zhao, J.; Hu, J.; Wang, Y.; Xia, X. Simulation of Hydraulic Structures in 2D High-Resolution Urban Flood Modeling. Water 2019, 11, 2139. [Google Scholar] [CrossRef]
- Vojtek, M.; Vojtekova, J.; De Luca, D.L.; Petroselli, A. Combined basin-scale and decentralized flood risk assessment: A methodological approach for preliminary flood risk assessment. Hydrol. Sci. J. 2023, 68, 355–378. [Google Scholar] [CrossRef]
- Skakun, S.; Kussul, N.; Shelestov, A.; Kussul, O. Flood Hazard and Flood Risk Assessment Using a Time Series of Satellite Images: A Case Study in Namibia. Risk Anal. 2014, 34, 1521–1537. [Google Scholar] [CrossRef]
- Xu, H.; Xu, K.; Lian, J.; Ma, C. Compound effects of rainfall and storm tides on coastal flooding risk. Stoch. Environ. Res. Risk Assess. 2019, 33, 1249–1261. [Google Scholar] [CrossRef]
- Li, Y.; Shen, P.; Yan, Y.; Zhou, W. Flood risk assessment of artificial islands under compound rain-tide-wind effects during tropical cyclones. J. Hydrol. 2022, 615, 128736. [Google Scholar] [CrossRef]
- Li, Y.; Zhou, W.; Shen, P. Flood risk assessment of loss of life for a coastal city under the compound effect of storm surge and rainfall. Urban Clim. 2023, 47, 101396. [Google Scholar] [CrossRef]
- Gao, J.; Ma, X.; Zang, J.; Dong, G.; Ma, X.; Zhu, Y.; Zhou, L. Numerical investigation of harbor oscillations induced by focused transient wave groups. Coast. Eng. 2020, 158, 103670. [Google Scholar] [CrossRef]
- Li, Y.; Zhou, W.; Shen, P. Pedestrian danger assessment under rainstorm-induced flood disaster for an artificial island. Int. J. Disaster Risk Reduct. 2022, 78, 103133. [Google Scholar] [CrossRef]
- Liang, H.; Zhou, X. Impact of Tides and Surges on Fluvial Floods in Coastal Regions. Remote Sens. 2022, 14, 5779. [Google Scholar] [CrossRef]
- van den Hurk, B.; van Meijgaard, E.; de Valk, P.; van Heeringen, K.; Gooijer, J. Analysis of a compounding surge and precipitation event in the Netherlands. Environ. Res. Lett. 2015, 10, 035001. [Google Scholar] [CrossRef]
- Khanal, S.; Ridder, N.; de Vries, H.; Terink, W.; van den Hurk, B. Storm Surge and Extreme River Discharge: A Compound Event Analysis Using Ensemble Impact Modeling. Front. Earth Sci. 2019, 7, 224. [Google Scholar] [CrossRef]
- Feng, B.; Zhang, Y.; Bourke, R. Urbanization impacts on flood risks based on urban growth data and coupled flood models. Nat. Hazards 2021, 106, 613–627. [Google Scholar] [CrossRef]
- Zhu, Y.; Xu, C.; Liu, Z.; Yin, D.; Jia, H.; Guan, Y. Spatial layout optimization of green infrastructure based on life-cycle multi-objective optimization algorithm and SWMM model. Resour. Conserv. Recycl. 2023, 191, 106906. [Google Scholar] [CrossRef]
- Xu, C.; Tang, T.; Jia, H.; Xu, M.; Xu, T.; Liu, Z.; Long, Y.; Zhang, R. Benefits of coupled green and grey infrastructure systems: Evidence based on analytic hierarchy process and life cycle costing. Resour. Conserv. Recycl. 2019, 151, 104478. [Google Scholar] [CrossRef]
- Peng, H.; Liu, Y.; Wang, H.; Ma, L. Assessment of the service performance of drainage system and transformation of pipeline network based on urban combined sewer system model. Environ. Sci. Pollut. Res. 2015, 22, 15712–15721. [Google Scholar] [CrossRef] [PubMed]
- Arora, A.S.; Reddy, A.S. Conceptualizing a decentralized stormwater treatment system for an urbanized city with improper stormwater drainage facilities. Int. J. Environ. Sci. Technol. 2015, 12, 2891–2900. [Google Scholar] [CrossRef]
- Liu, B.; Xu, C.; Yang, J.; Lin, S.; Wang, X. Effect of Land Use and Drainage System Changes on Urban Flood Spatial Distribution in Handan City: A Case Study. Sustainability 2022, 14, 14610. [Google Scholar] [CrossRef]
- Li, J.; Burian, S.J. Evaluating real-time control of stormwater drainage network and green stormwater infrastructure for enhancing flooding resilience under future rainfall projections. Resour. Conserv. Recycl. 2023, 198, 107123. [Google Scholar] [CrossRef]
- Yin, J.; Zhao, Q.; Yu, D.; Lin, N.; Kubanek, J.; Ma, G.; Liu, M.; Pepe, A. Long-term flood-hazard modeling for coastal areas using InSAR measurements and a hydrodynamic model: The case study of Lingang New City, Shanghai. J. Hydrol. 2019, 571, 593–604. [Google Scholar] [CrossRef]
- Antoniadis, N.; Alatza, S.; Loupasakis, C.; Kontoes, C.H. Land Subsidence Phenomena vs. Coastal Flood Hazard-The Cases of Messolonghi and Aitolikon (Greece). Remote Sens. 2023, 15, 2112. [Google Scholar] [CrossRef]
- Enriquez, A.R.; Wahl, T.; Baranes, H.E.; Talke, S.A.; Orton, P.M.; Booth, J.F.; Haigh, I.D. Predictable Changes in Extreme Sea Levels and Coastal Flood Risk Due to Long-Term Tidal Cycles. J. Geophys. Res. Oceans 2022, 127, e2021JC018157. [Google Scholar] [CrossRef]
- Eilander, D.; Couasnon, A.; Leijnse, T.; Ikeuchi, H.; Yamazaki, D.; Muis, S.; Dullaart, J.; Haag, A.; Winsemius, H.C.; Ward, P.J. A globally applicable framework for compound flood hazard modeling. Nat. Hazards Earth Syst. Sci. 2023, 23, 823–846. [Google Scholar] [CrossRef]
- Santiago-Collazo, F.L.; Bilskie, M.V.; Hagen, S.C. A comprehensive review of compound inundation models in low-gradient coastal watersheds. Environ. Modell. Softw. 2019, 119, 166–181. [Google Scholar] [CrossRef]
- Santiago-Collazo, F.L.; Bilskie, M.V.; Bacopoulos, P.; Hagen, S.C. An Examination of Compound Flood Hazard Zones for Past, Present, and Future Low-Gradient Coastal Land-Margins. Front. Clim. 2021, 3, 684035. [Google Scholar] [CrossRef]
- AghaKouchak, A.; Huning, L.S.; Mazdiyasni, O.; Mallakpour, I.; Chiang, F.; Sadegh, M.; Vahedifard, F.; Moftakhari, H. How do natural hazards cascade to cause disasters? Nature 2018, 561, 458–460. [Google Scholar] [CrossRef]
- Zscheischler, J.; Martius, O.; Westra, S.; Bevacqua, E.; Raymond, C.; Horton, R.M.; van den Hurk, B.; AghaKouchak, A.; Jezequel, A.; Mahecha, M.D.; et al. A typology of compound weather and climate events. Nat. Rev. Earth Environ. 2020, 1, 333–347. [Google Scholar] [CrossRef]
- Wijetunge, J.J.; Neluwala, N.G.P.B. Compound flood hazard assessment and analysis due to tropical cyclone-induced storm surges, waves and precipitation: A case study for coastal lowlands of Kelani river basin in Sri Lanka. Nat. Hazards 2023, 116, 3979–4007. [Google Scholar] [CrossRef]
- Tang, J.; Hu, F.; Liu, Y.; Wang, W.; Yang, S. High-Resolution Hazard Assessment for Tropical Cyclone-Induced Wind and Precipitation: An Analytical Framework and Application. Sustainability 2022, 14, 13969. [Google Scholar] [CrossRef]
- Curtis, S.; Mukherji, A.; Kruse, J.; Helgeson, J.; Ghosh, A.; Adeniji, N. Perceptions of risk to compound coastal water events: A case study in eastern North Carolina, USA. Prog. Disaster Sci. 2022, 16, 100266. [Google Scholar] [CrossRef]
- Camus, P.; Haigh, I.D.; Nasr, A.A.; Wahl, T.; Darby, S.E.; Nicholls, R.J. Regional analysis of multivariate compound coastal flooding potential around Europe and environs: Sensitivity analysis and spatial patterns. Nat. Hazards Earth Syst. Sci. 2021, 21, 2021–2040. [Google Scholar] [CrossRef]
- Zhang, Y.; Najafi, M.R. Probabilistic Numerical Modeling of Compound Flooding Caused by Tropical Storm Matthew over a Data-Scarce Coastal Environment. Water Resour. Res. 2020, 56, e2020WR028565. [Google Scholar] [CrossRef]
- Feng, D.; Fang, K.; Shen, C. Enhancing Streamflow Forecast and Extracting Insights Using Long-Short Term Memory Networks with Data Integration at Continental Scales. Water Resour. Res. 2020, 56, e2019WR026793. [Google Scholar] [CrossRef]
- Jafarzadegan, K.; Abbaszadeh, P.; Moradkhani, H. Sequential data assimilation for real-time probabilistic flood inundation mapping. Hydrol. Earth Syst. Sci. 2021, 25, 4995–5011. [Google Scholar] [CrossRef]
- Gregory, J.M.; Griffies, S.M.; Hughes, C.W.; Lowe, J.A.; Church, J.A.; Fukumori, I.; Gomez, N.; Kopp, R.E.; Landerer, F.; Le Cozannet, G.; et al. Concepts and Terminology for Sea Level: Mean, Variability and Change, Both Local and Global. Surv. Geophys. 2019, 40, 1251–1289. [Google Scholar] [CrossRef]
- Herdman, L.; Erikson, L.; Barnard, P. Storm Surge Propagation and Flooding in Small Tidal Rivers during Events of Mixed Coastal and Fluvial Influence. J. Mar. Sci. Eng. 2018, 6, 158. [Google Scholar] [CrossRef]
- Ellegaard, O.; Wallin, J.A. The bibliometric analysis of scholarly production: How great is the impact? Scientometrics 2015, 105, 1809–1831. [Google Scholar] [CrossRef] [PubMed]
- Leonard, M.; Westra, S.; Phatak, A.; Lambert, M.; van den Hurk, B.; McInnes, K.; Risbey, J.; Schuster, S.; Jakob, D.; Stafford-Smith, M. A compound event framework for understanding extreme impacts. Wiley Interdiscip. Rev. Clim. Chang. 2014, 5, 113–128. [Google Scholar] [CrossRef]
- Kaffash, S.; Nguyen, A.T.; Zhu, J. Big data algorithms and applications in intelligent transportation system: A review and bibliometric analysis. Int. J. Prod. Econ. 2021, 231, 107868. [Google Scholar] [CrossRef]
- Tuyls, D.M.; Thorndahl, S.; Rasmussen, M.R. Return period assessment of urban pluvial floods through modelling of rainfall-flood response. J. Hydroinform. 2018, 20, 829–845. [Google Scholar] [CrossRef]
- Scorah, M.; Stephens, D.; Nathan, R. Benchmarking the selection of probability neutral hydrologic design floods for use in 2D hydraulic models. Australas. J. Water Resour. 2019, 23, 137–147. [Google Scholar] [CrossRef]
- Olbert, A.I.; Moradian, S.; Nash, S.; Comer, J.; Kazmierczak, B.; Falconer, R.A.; Hartnett, M. Combined statistical and hydrodynamic modelling of compound flooding in coastal areas-Methodology and application. J. Hydrol. 2023, 620, 129383. [Google Scholar] [CrossRef]
- Zhou, Q.; Su, J.; Arnbjerg-Nielsen, K.; Ren, Y.; Luo, J.; Ye, Z.; Feng, J. A GIS-Based Hydrological Modeling Approach for Rapid Urban Flood Hazard Assessment. Water 2021, 13, 1483. [Google Scholar] [CrossRef]
- Chen, Y. Flood hazard zone mapping incorporating geographic information system (GIS) and multi-criteria analysis (MCA) techniques. J. Hydrol. 2022, 612, 128268. [Google Scholar] [CrossRef]
- Dougherty, E.; Morrison, R.; Rasmussen, K. High-resolution flood precipitation and streamflow relationships in two US river basins. Meteorol. Appl. 2021, 28, e1979. [Google Scholar] [CrossRef]
- Naseri, K.; Hummel, M.A. A Bayesian copula-based nonstationary framework for compound flood risk assessment along US coastlines. J. Hydrol. 2022, 610, 128005. [Google Scholar] [CrossRef]
- Ai, P.; Yuan, D.; Xiong, C. Copula-Based Joint Probability Analysis of Compound Floods from Rainstorm and Typhoon Surge: A Case Study of Jiangsu Coastal Areas, China. Sustainability 2018, 10, 2232. [Google Scholar] [CrossRef]
- Ward, P.J.; Couasnon, A.; Eilander, D.; Haigh, I.D.; Hendry, A.; Muis, S.; Veldkamp, T.I.E.; Winsemius, H.C.; Wahl, T. Dependence between high sea-level and high river discharge increases flood hazard in global deltas and estuaries. Environ. Res. Lett. 2018, 13, 084012. [Google Scholar] [CrossRef]
- Jin, H.; Chen, X.; Zhong, R.; Liu, M. Occurrence time distribution fitting and encounter probability analysis of extreme precipitation in the Huaihe River Basin. Theor. Appl. Climatol. 2023, 154, 161–177. [Google Scholar] [CrossRef]
- Jia-Yi, F.; Jie, Y.; Xian-Wu, S.; Jian, F.; Shi-Qiang, D.U.; Min, L. A review of compound flood hazard research in coastal areas. Progress. Inquisitiones Mutat. Clim. 2021, 17, 317–328. [Google Scholar]
- Pirani, F.J.; Najafi, M.R. Multivariate Analysis of Compound Flood Hazard Across Canada’s Atlantic, Pacific and Great Lakes Coastal Areas. Earth Future 2022, 10, e2022EF002655. [Google Scholar] [CrossRef]
- Hendry, A.; Haigh, I.D.; Nicholls, R.J.; Winter, H.; Neal, R.; Wahl, T.; Joly-Laugel, A.; Darby, S.E. Assessing the characteristics and drivers of compound flooding events around the UK coast. Hydrol. Earth Syst. Sci. 2019, 23, 3117–3139. [Google Scholar] [CrossRef]
- Wu, W.Y.; McInnes, K.; O’Grady, J.; Hoeke, R.; Leonard, M.; Westra, S. Mapping Dependence Between Extreme Rainfall and Storm Surge. J. Geophys. Res. Oceans 2018, 123, 2461–2474. [Google Scholar] [CrossRef]
- Zheng, F.F.; Westra, S.; Sisson, S.A. Quantifying the dependence between extreme rainfall and storm surge in the coastal zone. J. Hydrol. 2013, 505, 172–187. [Google Scholar] [CrossRef]
- Zheng, F.; Westra, S.; Leonard, M.; Sisson, S.A. Modeling dependence between extreme rainfall and storm surge to estimate coastal flooding risk. Water Resour. Res. 2014, 50, 2050–2071. [Google Scholar] [CrossRef]
- Latif, S.; Simonovic, S.P. Compounding joint impact of rainfall, storm surge and river discharge on coastal flood risk: An approach based on 3D fully nested Archimedean copulas. Environ. Earth Sci. 2023, 82, 63. [Google Scholar] [CrossRef]
- Chen, H.; Xu, Z.; Chen, J.; Liu, Y.; Li, P. Joint Risk Analysis of Extreme Rainfall and High Tide Level Based on Extreme Value Theory in Coastal Area. Int. J. Environ. Res. Public Health 2023, 20, 3605. [Google Scholar] [CrossRef] [PubMed]
- Xu, H.; Tian, Z.; Sun, L.; Ye, Q.; Ragno, E.; Bricker, J.; Mao, G.; Tan, J.; Wang, J.; Ke, Q.; et al. Compound flood impact of water level and rainfall during tropical cyclone periods in a coastal city: The case of Shanghai. Nat. Hazards Earth Syst. Sci. 2022, 22, 2347–2358. [Google Scholar] [CrossRef]
- Li, J.; Lei, Y.; Tan, S.; Bell, C.D.; Engel, B.A.; Wang, Y. Nonstationary Flood Frequency Analysis for Annual Flood Peak and Volume Series in Both Univariate and Bivariate Domain. Water Resour. Manag. 2018, 32, 4239–4252. [Google Scholar] [CrossRef]
- Wahl, T.; Jain, S.; Bender, J.; Meyers, S.D.; Luther, M.E. Increasing risk of compound flooding from storm surge and rainfall for major US cities. Nat. Clim. Chang. 2015, 5, 1093–1097. [Google Scholar] [CrossRef]
- Xu, K.; Ma, C.; Lian, J.; Bin, L. Joint Probability Analysis of Extreme Precipitation and Storm Tide in a Coastal City under Changing Environment. PLoS ONE 2014, 9, e109341. [Google Scholar] [CrossRef]
- Zellou, B.; Rahali, H. Assessment of the joint impact of extreme rainfall and storm surge on the risk of flooding in a coastal area. J. Hydrol. 2019, 569, 647–665. [Google Scholar] [CrossRef]
- Gao, C.; Hao, M.; Chen, J.; Gu, C. Simulation and design of joint distribution of rainfall and tide level in Wuchengxiyu Region, China. Urban Clim. 2021, 40, 101005. [Google Scholar] [CrossRef]
- Ghanbari, M.; Arabi, M.; Kao, S.; Obeysekera, J.; Sweet, W. Climate Change and Changes in Compound Coastal-Riverine Flooding Hazard Along the US Coasts. Earth Future 2021, 9, e2021EF002055. [Google Scholar] [CrossRef]
- Moftakhari, H.R.; Salvadori, G.; AghaKouchak, A.; Sanders, B.F.; Matthew, R.A. Compounding effects of sea level rise and fluvial flooding. Proc. Natl. Acad. Sci. USA 2017, 114, 9785–9790. [Google Scholar] [CrossRef]
- Latif, S.; Mustafa, F. Copula-based multivariate flood probability construction: A review. Arab. J. Geosci. 2020, 13, 1–25. [Google Scholar] [CrossRef]
- Zhangjun, L.; Shenglian, G.; Xinfa, X.; Shichao, X.; Jingqing, C. Application of Copula functions in hydrology and water resources: A state-of-the-art review. Adv. Water Sci. 2021, 32, 148–159. [Google Scholar]
- Liu, R.Y.; Liu, N. A GIS Based Model for Calculating of Flood Area. Acta Geogr. Sin. 2001, 56, 1–6. [Google Scholar]
- Carneiro-Barros, J.E.; Plomaritis, T.A.; Fazeres-Ferradosa, T.; Rosa-Santos, P.; Taveira-Pinto, F. Coastal Flood Mapping with Two Approaches Based on Observations at Furadouro, Northern Portugal. Remote Sens. 2023, 15, 5215. [Google Scholar] [CrossRef]
- Kumbier, K.; Carvalho, R.C.; Vafeidis, A.T.; Woodroffe, C.D. Comparing static and dynamic flood models in estuarine environments: A case study from south-east Australia. Mar. Freshw. Res. 2019, 70, 781–793. [Google Scholar] [CrossRef]
- Sadler, J.M.; Haselden, N.; Mellon, K.; Hackel, A.; Son, V.; Mayfield, J.; Blase, A.; Goodall, J.L. Impact of Sea-Level Rise on Roadway Flooding in the Hampton Roads Region, Virginia. J. Infrastruct. Syst. 2017, 23, 05017006. [Google Scholar] [CrossRef]
- Ramirez, J.A.; Lichter, M.; Coulthard, T.J.; Skinner, C. Hyper-resolution mapping of regional storm surge and tide flooding: Comparison of static and dynamic models. Nat. Hazards. 2016, 82, 571–590. [Google Scholar] [CrossRef]
- Castrucci, L.; Tahvildari, N. Modeling the Impacts of Sea Level Rise on Storm Surge Inundation in Flood-Prone Urban Areas of Hampton Roads, Virginia. Mar. Technol. Soc. J. 2018, 52, 92–105. [Google Scholar] [CrossRef]
- Hai, S.; Wenjie, J.; Yazhi, Z. Storm surge flood risk simulation and evaluation method based on grid and cloud model: A case study of Xiangzhou District, Zhuhai City. J. Nat. Disasters 2022, 31, 69–80. [Google Scholar]
- Jamali, B.; Bach, P.M.; Cunningham, L.; Deletic, A. A Cellular Automata Fast Flood Evaluation (CA-ffe) Model. Water Resour. Res. 2019, 55, 4936–4953. [Google Scholar] [CrossRef]
- McMillan, H.K.; Brasington, J. End-to-end flood risk assessment: A coupled model cascade with uncertainty estimation. Water Resour. Res. 2008, 44. [Google Scholar] [CrossRef]
- Grimaldi, S.; Petroselli, A.; Arcangeletti, E.; Nardi, F. Flood mapping in ungauged basins using fully continuous hydrologic-hydraulic modeling. J. Hydrol. 2013, 487, 39–47. [Google Scholar] [CrossRef]
- Bates, P.D.; Horritt, M.S.; Fewtrell, T.J. A simple inertial formulation of the shallow water equations for efficient two-dimensional flood inundation modelling. J. Hydrol. 2010, 387, 33–45. [Google Scholar] [CrossRef]
- Guo, K.; Guan, M.; Yu, D. Urban surface water flood modelling—A comprehensive review of current models and future challenges. Hydrol. Earth Syst. Sci. 2021, 25, 2843–2860. [Google Scholar] [CrossRef]
- Singh, V.P. Kinematic wave modelling in water resources: A historical perspective. Hydrol. Process. 2001, 15, 671–706. [Google Scholar] [CrossRef]
- Hunter, N.M.; Bates, P.D.; Horritt, M.S.; Wilson, M.D. Simple spatially-distributed models for predicting flood inundation: A review. Geomorphology 2007, 90, 208–225. [Google Scholar] [CrossRef]
- Zhang, H.; Wu, W.; Hu, C.; Hu, C.; Li, M.; Hao, X.; Liu, S. A distributed hydrodynamic model for urban storm flood risk assessment. J. Hydrol. 2021, 600, 126513. [Google Scholar] [CrossRef]
- Yin, J.; Yu, D.; Yin, Z.; Liu, M.; He, Q. Evaluating the impact and risk of pluvial flash flood on intra-urban road network: A case study in the city center of Shanghai, China. J. Hydrol. 2016, 537, 138–145. [Google Scholar] [CrossRef]
- Bradbrook, K.; Waller, S.; Morris, D. National floodplain mapping: Datasets and methods—160,000 km in 12 months. Nat. Hazards 2005, 36, 103–123. [Google Scholar] [CrossRef]
- Sadeghi, F.; Rubinato, M.; Goerke, M.; Hart, J. Assessing the Performance of LISFLOOD-FP and SWMM for a Small Watershed with Scarce Data Availability. Water 2022, 14, 748. [Google Scholar] [CrossRef]
- Rajib, A.; Liu, Z.; Merwade, V.; Tavakoly, A.A.; Follum, M.L. Towards a large-scale locally relevant flood inundation modeling framework using SWAT and LISFLOOD-FP. J. Hydrol. 2020, 581, 124406. [Google Scholar] [CrossRef]
- Xu, K.; Zhuang, Y.; Bin, L.; Wang, C.; Tian, F. Impact assessment of climate change on compound flooding in a coastal city. J. Hydrol. 2023, 617, 129166. [Google Scholar] [CrossRef]
- Sanudo, E.; Cea, L.; Puertas, J. Modelling Pluvial Flooding in Urban Areas Coupling the Models Iber and SWMM. Water 2020, 12, 2647. [Google Scholar] [CrossRef]
- Chen, Y.; Hou, H.; Li, Y.; Wang, L.; Fan, J.; Wang, B.; Hu, T. Urban Inundation under Different Rainstorm Scenarios in Lin’an City, China. Int. J. Environ. Res. Public Health 2022, 19, 7210. [Google Scholar] [CrossRef]
- Liu, Y.; Chen, B.; Duan, C.; Wang, H. Economic loss of urban waterlogging based on an integrated drainage model and network environ analyses. Resour. Conserv. Recycl. 2023, 192, 106923. [Google Scholar] [CrossRef]
- Wing, O.E.J.; Sampson, C.C.; Bates, P.D.; Quinn, N.; Smith, A.M.; Neal, J.C. A flood inundation forecast of Hurricane Harvey using a continental-scale 2D hydrodynamic model. J. Hydrol. X 2019, 4, 100039. [Google Scholar] [CrossRef]
- Krestenitis, Y.N.; Androulidakis, Y.S.; Kontos, Y.N.; Georgakopoulos, G. Coastal inundation in the north-eastern mediterranean coastal zone due to storm surge events. J. Coast. Conserv. 2011, 15, 353–368. [Google Scholar] [CrossRef]
- Pei, B.; Pang, W.; Testik, F.Y.; Ravichandran, N.; Liu, F. Mapping joint hurricane wind and surge hazards for Charleston, South Carolina. Nat. Hazards 2014, 74, 375–403. [Google Scholar] [CrossRef]
- Rao, A.D.; Murty, P.L.N.; Jain, I.; Kankara, R.S.; Dube, S.K.; Murty, T.S. Simulation of water levels and extent of coastal inundation due to a cyclonic storm along the east coast of India. Nat. Hazards 2013, 66, 1431–1441. [Google Scholar] [CrossRef]
- Chunxia, L.; Zhongkuo, Z.; Xueyan, B.; Jinnan, Y.; Guanhuan, W.; Huijun, H. Research and Application of Ocean Circulation and Wave Models: A Review and Prospects. Adv. Meteorol. Sci. Technol. 2017, 7, 12–22. [Google Scholar]
- Xianwu, S.; Jun, T.; Zhixing, G.; Qinzheng, L. A Review of Risk Assessment of Storm Surge Disaster. Adv. Earth Sci. 2013, 28, 866–874. [Google Scholar]
- Valle, A.; Curchitser, E.N.; Bruyere, C.L.; Fossell, K.R. Simulating Storm Surge Impacts with a Coupled Atmosphere-Inundation Model with Varying Meteorological Forcing. J. Mar. Sci. Eng. 2018, 6, 35. [Google Scholar] [CrossRef]
- Liu, X.J.; Zhong, D.H.; Tong, D.W.; Zhou, Z.Y.; Ao, X.F.; Li, W.Q. Dynamic visualisation of storm surge flood routing based on three-dimensional numerical simulation. J. Flood Risk Manag. 2018, 11, S729–S749. [Google Scholar] [CrossRef]
- Ye, F.; Zhang, Y.J.; Yu, H.; Sun, W.; Moghimi, S.; Myers, E.; Nunez, K.; Zhang, R.; Wang, H.; Roland, A.; et al. Simulating storm surge and compound flooding events with a creek-to-ocean model: Importance of baroclinic effects. Ocean Model. 2020, 145, 101526. [Google Scholar] [CrossRef]
- Krishna, P.S.S.; Tiju, V.I.; Nair, L.S.; Ramesh, M. Coastal flooding by wave, wind, tide interactions and related processes along the southern part of SW coast of India. Reg. Stud. Mar. Sci. 2023, 62, 102968. [Google Scholar]
- Ge, J.; Much, D.; Kappenberg, J.; Nino, O.; Ding, P.; Chen, Z. Simulating storm flooding maps over HafenCity under present and sea level rise scenarios. J. Flood Risk Manag. 2014, 7, 319–331. [Google Scholar] [CrossRef]
- Garcia, E.S.; Loaiciga, H.A. Sea-level rise and flooding in coastal riverine flood plains. Hydrol. Sci. J.-J. Sci. Hydrol. 2014, 59, 204–220. [Google Scholar] [CrossRef]
- Chang, Y.; Tsai, T.; Yang, J. Flood hazard mitigation in land subsidence prone coastal areas by optimal groundwater pumping. J. Flood Risk Manag. 2019, 12, e12517. [Google Scholar] [CrossRef]
- Wang, H.; Lin, C.; Yang, C.; Ding, C.; Hwung, H.; Hsiao, S. Assessment of Land Subsidence and Climate Change Impacts on Inundation Hazard in Southwestern Taiwan. Irrig. Drain. 2018, 67, 26–37. [Google Scholar] [CrossRef]
- Yu, D. Parallelization of a two-dimensional flood inundation model based on domain decomposition. Environ. Modell. Softw. 2010, 25, 935–945. [Google Scholar] [CrossRef]
- Su, B.; Huang, H.; Zhu, W. An urban pluvial flood simulation model based on diffusive wave approximation of shallow water equations. Hydrol. Res. 2019, 50, 138–154. [Google Scholar] [CrossRef]
- Bradbrook, K.F.; Lane, S.N.; Waller, S.G.; Bates, P.D. Two dimensional diffusion wave modelling of flood inundation using a simplified channel representation. Int. J. River Basin Manag. 2004, 2, 211–223. [Google Scholar] [CrossRef]
- Xu, K.; Wang, C.; Bin, L. Compound flood models in coastal areas: A review of methods and uncertainty analysis. Nat. Hazards 2023, 116, 469–496. [Google Scholar] [CrossRef]
- Yin, J.; Lin, N.; Yu, D.P. Coupled modeling of storm surge and coastal inundation: A case study in New York City during Hurricane Sandy. Water Resour. Res. 2016, 52, 8685–8699. [Google Scholar] [CrossRef]
- Shen, Y.W.; Tahvildari, N.; Morsy, M.M.; Huxley, C.; Chen, T.D.; Goodall, J.L. Dynamic Modeling of Inland Flooding and Storm Surge on Coastal Cities under Climate Change Scenarios: Transportation Infrastructure Impacts in Norfolk, Virginia USA as a Case Study. Geosciences 2022, 12, 224. [Google Scholar] [CrossRef]
- Bennett, W.G.; Karunarathna, H.; Xuan, Y.; Kusuma, M.S.B.; Farid, M.; Kuntoro, A.A.; Rahayu, H.P.; Kombaitan, B.; Septiadi, D.; Kesuma, T.N.A.; et al. Modelling compound flooding: A case study from Jakarta, Indonesia. Nat. Hazards 2023, 118, 277–305. [Google Scholar] [CrossRef]
- Silva-Araya, W.F.; Santiago-Collazo, F.L.; Gonzalez-Lopez, J.; Maldonado-Maldonado, J. Dynamic Modeling of Surface Runoff and Storm Surge during Hurricane and Tropical Storm Events. Hydrology 2018, 5, 13. [Google Scholar] [CrossRef]
- Shi, S.Y.; Yang, B.; Jiang, W.S. Numerical simulations of compound flooding caused by storm surge and heavy rain with the presence of urban drainage system, coastal dam and tide gates: A case study of Xiangshan, China. Coast. Eng. 2022, 172, 104064. [Google Scholar] [CrossRef]
- Tromble, E.; Kolar, R.; Dresback, K.; Luettich, R. River Flux Boundary Considerations in a Coupled Hydrologic-Hydrodynamic Modeling System. Estuar. Coast. Model. (2011) 2013, 510–527. [Google Scholar] [CrossRef]
- Bacopoulos, P.; Tang, Y.; Wang, D.; Hagen, S.C. Integrated Hydrologic-Hydrodynamic Modeling of Estuarine-Riverine Flooding: 2008 Tropical Storm Fay. J. Hydrol. Eng. 2017, 22, 04017022. [Google Scholar] [CrossRef]
- Lee, C.; Hwang, S.; Do, K.; Son, S. Increasing flood risk due to river runoff in the estuarine area during a storm landfall. Estuar. Coast. Shelf Sci. 2019, 221, 104–118. [Google Scholar] [CrossRef]
- Joyce, J.; Chang, N.; Harji, R.; Ruppert, T.; Singhofen, P. Cascade impact of hurricane movement, storm tidal surge, sea level rise and precipitation variability on flood assessment in a coastal urban watershed. Clim. Dyn. 2018, 51, 383–409. [Google Scholar] [CrossRef]
- Karamouz, M.; Zahmatkesh, Z.; Goharian, E.; Nazif, S. Combined Impact of Inland and Coastal Floods: Mapping Knowledge Base for Development of Planning Strategies. J. Water Resour. Plan. Manag. 2015, 141, 04014098. [Google Scholar] [CrossRef]
- Saleh, F.; Ramaswamy, V.; Wang, Y.; Georgas, N.; Blumberg, A.; Pullen, J. A multi-scale ensemble-based framework for forecasting compound coastal-riverine flooding: The Hackensack-Passaic watershed and Newark Bay. Adv. Water Resour. 2017, 110, 371–386. [Google Scholar] [CrossRef]
- Gori, A.; Lin, N.; Smith, J. Assessing Compound Flooding from Landfalling Tropical Cyclones on the North Carolina Coast. Water Resour. Res. 2020, 56, e2019WR026788. [Google Scholar] [CrossRef]
- Pandey, S.; Rao, A.D.; Haldar, R. Modeling of Coastal Inundation in Response to a Tropical Cyclone Using a Coupled Hydraulic HEC-RAS and ADCIRC Model. J. Geophys. Res. Oceans 2021, 126, e2020JC016810. [Google Scholar] [CrossRef]
- Tanim, A.H.; Goharian, E. Developing a hybrid modeling and multivariate analysis framework for storm surge and runoff interactions in urban coastal flooding. J. Hydrol. 2021, 595, 125670. [Google Scholar] [CrossRef]
- Bush, S.T.; Dresback, K.M.; Szpilka, C.M.; Kolar, R.L. Use of 1D Unsteady HEC-RAS in a Coupled System for Compound Flood Modeling: North Carolina Case Study. J. Mar. Sci. Eng. 2022, 10, 306. [Google Scholar] [CrossRef]
- Loveland, M.; Kiaghadi, A.; Dawson, C.N.N.; Rifai, H.S.S.; Misra, S.; Mosser, H.; Parola, A. Developing a Modeling Framework to Simulate Compound Flooding: When Storm Surge Interacts with Riverine Flow. Front. Clim. 2021, 2, 609610. [Google Scholar] [CrossRef]
- Wang, Y.; Hong, H.Y.; Chen, W.; Li, S.J.; Pamucar, D.; Gigovic, L.; Drobnjak, S.; Bui, D.T.; Duan, H.X. A Hybrid GIS Multi-Criteria Decision-Making Method for Flood Susceptibility Mapping at Shangyou, China. Remote Sens. 2019, 11, 62. [Google Scholar] [CrossRef]
- Mudashiru, R.B.; Sabtu, N.; Abustan, I.; Balogun, W. Flood hazard mapping methods: A review. J. Hydrol. 2021, 603, 126846. [Google Scholar] [CrossRef]
- Papaioannou, G.; Vasiliades, L.; Loukas, A. Multi-Criteria Analysis Framework for Potential Flood Prone Areas Mapping. Water Resour. Manag. 2015, 29, 399–418. [Google Scholar] [CrossRef]
- de Brito, M.M.; Evers, M. Multi-criteria decision-making for flood risk management: A survey of the current state of the art. Nat. Hazards Earth Syst. Sci. 2016, 16, 1019–1033. [Google Scholar] [CrossRef]
- Ghosh, S.; Mistri, B. Assessing coastal vulnerability to environmental hazards of Indian Sundarban delta using multi-criteria decision-making approaches. Ocean Coast. Manag. 2021, 209, 105641. [Google Scholar] [CrossRef]
- Sutrisno, D.; Rahadiati, A.; Rudiastuti, A.W.; Dewi, R.S.; Munawaroh. Urban Coastal Flood-Prone Mapping under the Combined Impact of Tidal Wave and Heavy Rainfall: A Proposal to the Existing National Standard. Isprs Int. J. Geo-Inf. 2020, 9, 525. [Google Scholar] [CrossRef]
- Mahmoud, S.H.; Gan, T.Y. Multi-criteria approach to develop flood susceptibility maps in arid regions of Middle East. J. Clean. Prod. 2018, 196, 216–229. [Google Scholar] [CrossRef]
- Le Cozannet, G.; Garcin, M.; Bulteau, T.; Mirgon, C.; Yates, M.L.; Mendez, M.; Baills, A.; Idier, D.; Oliveros, C. An AHP-derived method for mapping the physical vulnerability of coastal areas at regional scales. Nat. Hazards Earth Syst. Sci. 2013, 13, 1209–1227. [Google Scholar] [CrossRef]
- Cui, P.; Guan, Y.; Zhu, Y. Flood Loss Prediction of Coastal City Based on GM-ANN. In Proceedings of the 2017 IEEE International Conference on Grey Systems and Intelligent Services (Gsis), Stockholm, Sweden, 8–11 August 2017; pp. 187–190. [Google Scholar]
- Mosavi, A.; Ozturk, P.; Chau, K.W. Flood Prediction Using Machine Learning Models: Literature Review. Water 2018, 10, 1536. [Google Scholar] [CrossRef]
- Wang, Q.; Chen, J.; Hu, K. Storm Surge Prediction for Louisiana Coast Using Artificial Neural Networks. In Proceedings of the Neural Information Processing, Iconip 2016, Kyoto, Japan, 16–21 October 2016; Volume 9949, Pt III. pp. 396–405. [Google Scholar]
- Sahoo, B.; Bhaskaran, P.K. Prediction of storm surge and coastal inundation using Artificial Neural Network—A case study for 1999 Odisha Super Cyclone. Weather Clim. Extremes 2019, 23, 100196. [Google Scholar] [CrossRef]
- Chondros, M.; Metallinos, A.; Papadimitriou, A.; Memos, C.; Tsoukala, V. A Coastal Flood Early-Warning System Based on Offshore Sea State Forecasts and Artificial Neural Networks. J. Mar. Sci. Eng. 2021, 9, 1272. [Google Scholar] [CrossRef]
- Sampurno, J.; Vallaeys, V.; Ardianto, R.; Hanert, E. Integrated hydrodynamic and machine learning models for compound flooding prediction in a data-scarce estuarine delta. Nonlinear Process Geophys. 2022, 29, 301–315. [Google Scholar] [CrossRef]
- Sadler, J.M.; Goodall, J.L.; Morsy, M.M.; Spencer, K. Modeling urban coastal flood severity from crowd-sourced flood reports using Poisson regression and Random Forest. J. Hydrol. 2018, 559, 43–55. [Google Scholar] [CrossRef]
- Zahura, F.T.; Goodall, J.L. Predicting combined tidal and pluvial flood inundation using a machine learning surrogate model. J. Hydrol. Reg. Stud. 2022, 41, 101087. [Google Scholar] [CrossRef]
- Park, S.; Lee, D. Prediction of coastal flooding risk under climate change impacts in South Korea using machine learning algorithms. Environ. Res. Lett. 2020, 15, 094052. [Google Scholar] [CrossRef]
- Zahura, F.T.; Goodall, J.L.; Sadler, J.M.; Shen, Y.; Morsy, M.M.; Behl, M. Training Machine Learning Surrogate Models from a High-Fidelity Physics-Based Model: Application for Real-Time Street-Scale Flood Prediction in an Urban Coastal Community. Water Resour. Res. 2020, 56, e2019WR027038. [Google Scholar] [CrossRef]
- Torres, M.J.; Nadal-Caraballo, N.C.; Ramos-Santiago, E.; Campbell, M.O.; Conzalez, V.M.; Melby, J.A.; Taflanidis, A.A. StormSim-CHRPS: Coastal Hazards Rapid Prediction System. J. Coast. Res. 2020, 95, 1320–1325. [Google Scholar] [CrossRef]
- Liu, H.; Hao, Y.; Zhang, W.; Zhang, H.; Gao, F.; Tong, J. Online urban-waterlogging monitoring based on a recurrent neural network for classification of microblogging text. Nat. Hazards Earth Syst. Sci. 2021, 21, 1179–1194. [Google Scholar] [CrossRef]
- Mekanik, F.; Imteaz, M.A.; Gato-Trinidad, S.; Elmahdi, A. Multiple regression and Artificial Neural Network for long-term rainfall forecasting using large scale climate modes. J. Hydrol. 2013, 503, 11–21. [Google Scholar] [CrossRef]
- Chen, H.; Liu, Y.; Lin, K.; Lan, T.; Liu, Z.; Li, W. Flood Hazard Assessment Methods: Research Review. J. Water Resour. Res. 2020, 9, 597–605. [Google Scholar] [CrossRef]
- LeCun, Y.; Bengio, Y.; Hinton, G. Deep learning. Nature 2015, 521, 436–444. [Google Scholar] [CrossRef] [PubMed]
- Dikshit, A.; Pradhan, B.; Alamri, A.M. Pathways and challenges of the application of artificial intelligence to geohazards modelling. Gondwana Res. 2021, 100, 290–301. [Google Scholar] [CrossRef]
- Liu, B.; Li, X.F.; Zheng, G. Coastal Inundation Mapping from Bitemporal and Dual-Polarization SAR Imagery Based on Deep Convolutional Neural Networks. J. Geophys. Res. Oceans 2019, 124, 9101–9113. [Google Scholar] [CrossRef]
- Munoz, D.F.; Munoz, P.; Moftakhari, H.; Moradkhani, H. From local to regional compound flood mapping with deep learning and data fusion techniques. Sci. Total Environ. 2021, 782, 146927. [Google Scholar] [CrossRef]
- Hsu, T.; Shih, D.; Li, C.; Lan, Y.; Lin, Y. A Study on Coastal Flooding and Risk Assessment under Climate Change in the Mid-Western Coast of Taiwan. Water 2017, 9, 390. [Google Scholar] [CrossRef]
- Afifi, Z.; Chu, H.; Kuo, Y.; Hsu, Y.; Wong, H.; Ali, M.Z. Residential Flood Loss Assessment and Risk Mapping from High-Resolution Simulation. Water 2019, 11, 751. [Google Scholar] [CrossRef]
- Yan, X.; Xu, K.; Feng, W.; Chen, J. A Rapid Prediction Model of Urban Flood Inundation in a High-Risk Area Coupling Machine Learning and Numerical Simulation Approaches. Int. J. Disaster Risk Sci. 2021, 12, 903–918. [Google Scholar] [CrossRef]
- Ayyad, M.; Hajj, M.R.; Marsooli, R. Artificial intelligence for hurricane storm surge hazard assessment. Ocean Eng. 2022, 245, 110435. [Google Scholar] [CrossRef]
- Chang, M.; Huang, I.; Hsu, C.; Wu, S.; Lai, J.; Lin, G. Long-Term Flooding Maps Forecasting System Using Series Machine Learning and Numerical Weather Prediction System. Water 2022, 14, 3346. [Google Scholar] [CrossRef]
- Malakar, K.; Mishra, T.; Hari, V.; Karmakar, S. Risk mapping of Indian coastal districts using IPCC-AR5 framework and multi-attribute decision-making approach. J. Environ. Manag. 2021, 294, 112948. [Google Scholar] [CrossRef]
- Zheng, Q.; Shen, S.; Zhou, A.; Lyu, H.M. Inundation risk assessment based on G-DEMATEL-AHP and its application to Zhengzhou flooding disaster. Sustain. Cities Soc. 2022, 86, 104138. [Google Scholar] [CrossRef]
- Peng, J.; Zhang, J. Urban flooding risk assessment based on GIS- game theory combination weight: A case study of Zhengzhou City. Int. J. Disaster Risk Reduct. 2022, 77, 103080. [Google Scholar] [CrossRef]
- Wu, J.; Chen, X.; Lu, J. Assessment of long and short-term flood risk using the multi-criteria analysis model with the AHP-Entropy method in Poyang Lake basin. Int. J. Disaster Risk Reduct. 2022, 75, 102968. [Google Scholar] [CrossRef]
- Huang, P. An effective alternative for predicting coastal floodplain inundation by considering rainfall, storm surge, and downstream topographic characteristics. J. Hydrol. 2022, 607, 127544. [Google Scholar] [CrossRef]
- Mimura, N. Sea-level rise caused by climate change and its implications for society. Proc. Jpn. Acad. Ser. B-Phys. Biol. Sci. 2013, 89, 281–301. [Google Scholar] [CrossRef]
- Chen, Y.; Chen, C.; Chao, Y.; Tung, Y.; Liou, J.; Li, H.; Cheng, C. Future Landslide Characteristic Assessment Using Ensemble Climate Change Scenarios: A Case Study in Taiwan. Water 2020, 12, 564. [Google Scholar] [CrossRef]
- Hu, S.; Liu, B.; Hu, M.; Yu, X.; Deng, Z.; Zeng, H.; Zhang, M.; Li, D. Quantification of the nonlinear interaction among the tide, surge and river in Pearl River Estuary. Estuar. Coast. Shelf Sci. 2023, 290, 108415. [Google Scholar] [CrossRef]
- Jun, X.; Wei, S.; Liping, Z.; Dunxian, S.; Hui, W.; Lei, Z.; Ping, Z. Opportunity and Challenge of the Climate Change Impact on Flood Protection. J. Sichuan Univ. 2016, 48, 7–13. [Google Scholar]
- Yilmaz, A.G.; Imteaz, M.A.; Shanableh, A.; Al-Ruzouq, R.; Atabay, S.; Haddad, K. A Non-Stationarity Analysis of Annual Maximum Floods: A Case Study of Campaspe River Basin, Australia. Water 2023, 15, 3683. [Google Scholar] [CrossRef]
- Ren, H.; Hou, Z.J.; Wigmosta, M.; Liu, Y.; Leung, L.R. Impacts of Spatial Heterogeneity and Temporal Non-Stationarity on Intensity-Duration-Frequency Estimates—A Case Study in a Mountainous California-Nevada Watershed. Water 2019, 11, 1296. [Google Scholar] [CrossRef]
- Razmi, A.; Mardani-Fard, H.A.; Golian, S.; Zahmatkesh, Z. Time-Varying Univariate and Bivariate Frequency Analysis of Nonstationary Extreme Sea Level for New York City. Environ. Process. 2022, 9, 8. [Google Scholar] [CrossRef]
- Pirani, F.J.; Najafi, M.R. Nonstationary frequency analysis of compound flooding in Canadas coastal zones. Coast. Eng. 2023, 182, 104292. [Google Scholar] [CrossRef]
- Huehne, S.; Reinoso, J.; Jansen, E.; Rolfes, R. A two-way loose coupling procedure for investigating the buckling and damage behaviour of stiffened composite panels. Compos. Struct. 2016, 136, 513–525. [Google Scholar] [CrossRef]
- Tang, H.S.; Kraatz, S.; Wu, X.G.; Cheng, W.L.; Qu, K.; Polly, J. Coupling of shallow water and circulation models for prediction of multiphysics coastal flows: Method, implementation, and experiment. Ocean Eng. 2013, 62, 56–67. [Google Scholar] [CrossRef]
- Li, Z.; Li, S.; Hu, P.; Mo, D.; Li, J.; Du, M.; Yan, J.; Hou, Y.; Yin, B. Numerical study of storm surge-induced coastal inundation in Laizhou Bay, China. Front. Mar. Sci. 2022, 9, 952406. [Google Scholar] [CrossRef]
- Gallien, T.W.; Kalligeris, N.; Delisle, M.C.; Tang, B.; Lucey, J.T.D.; Winters, M.A. Coastal Flood Modeling Challenges in Defended Urban Backshores. Geosciences 2018, 8, 450. [Google Scholar] [CrossRef]
- Sanders, B.F.; Schubert, J.E. PRIMo: Parallel raster inundation model. Adv. Water Resour. 2019, 126, 79–95. [Google Scholar] [CrossRef]
- Moradkhani, H.; Nearing, G.; Abbaszadeh, P.; Pathiraja, S. Fundamentals of Data Assimilation and Theoretical Advances. In Handbook of Hydrometeorological Ensemble Forecasting; Duan, Q., Pappenberger, F., Thielen, J., Wood, A., Cloke, H.L., Schaake, J.C., Eds.; Springer: Berlin/Heidelberg, Germany, 2018; pp. 1–26. [Google Scholar]
- Moradkhani, H. Hydrologic remote sensing and land surface data assimilation. Sensors 2008, 8, 2986–3004. [Google Scholar] [CrossRef]
- Pathiraja, S.; Moradkhani, H.; Marshall, L.; Sharma, A.; Geenens, G. Data-Driven Model Uncertainty Estimation in Hydrologic Data Assimilation. Water Resour. Res. 2018, 54, 1252–1280. [Google Scholar] [CrossRef]
- Abbaszadeh, P.; Gavahi, K.; Moradkhani, H. Multivariate remotely sensed and in-situ data assimilation for enhancing community WRF-Hydro model forecasting. Adv. Water Resour. 2020, 145, 103721. [Google Scholar] [CrossRef]
- Navon, I.M. Data Assimilation for Numerical Weather Prediction: A Review. In Data Assimilation for Atmospheric, Oceanic and Hydrologic Applications; Park, S.K., Xu, L., Eds.; Springer: Berlin/Heidelberg, Germany, 2009; pp. 21–65. [Google Scholar]
- Houtekamer, P.L.; Zhang, F. Review of the Ensemble Kalman Filter for Atmospheric Data Assimilation. Mon. Weather Rev. 2016, 144, 4489–4532. [Google Scholar] [CrossRef]
- Bertino, L.; Evensen, G.; Wackernagel, H. Sequential data assimilation techniques in oceanography. Int. Stat. Rev. 2003, 71, 223–241. [Google Scholar] [CrossRef]
- Asher, T.G.; Luettich, R.A.; Fleming, J.G.; Blanton, B.O. Low frequency water level correction in storm surge models using data assimilation. Ocean Model. 2019, 144, 101483. [Google Scholar] [CrossRef]
- Munoz, D.F.; Abbaszadeh, P.; Moftakhari, H.; Moradkhani, H. Accounting for uncertainties in compound flood hazard assessment: The value of data assimilation. Coast. Eng. 2022, 171, 104057. [Google Scholar] [CrossRef]
- Kalyanapu, A.J.; Shankar, S.; Pardyjak, E.R.; Judi, D.R.; Burian, S.J. Assessment of GPU computational enhancement to a 2D flood model. Environ. Modell. Softw. 2011, 26, 1009–1016. [Google Scholar] [CrossRef]
- Vacondio, R.; Dal Palu, A.; Mignosa, P. GPU-enhanced Finite Volume Shallow Water solver for fast flood simulations. Environ. Modell. Softw. 2014, 57, 60–75. [Google Scholar] [CrossRef]
- Smith, L.S.; Liang, Q. Towards a generalised GPU/CPU shallow-flow modelling tool. Comput. Fluids 2013, 88, 334–343. [Google Scholar] [CrossRef]
- Li, W.; Zhang, S.; Yang, X.; Bao, H. Parallel Calculation Method for Urban Two-Dimensional Rainfall Flood Model Based on Compute Unified Device Architecture. Environ. Eng. Sci. 2022, 39, 685–696. [Google Scholar] [CrossRef]
- Buttinger-Kreuzhuber, A.; Konev, A.; Horvath, Z.; Cornel, D.; Schwerdorf, I.; Bloeschl, G.; Waser, J. An integrated GPU-accelerated modeling framework for high-resolution simulations of rural and urban flash floods. Environ. Modell. Softw. 2022, 156, 105480. [Google Scholar] [CrossRef]
- Shen, Y.; Morsy, M.M.; Huxley, C.; Tahvildari, N.; Goodall, J.L. Flood risk assessment and increased resilience for coastal urban watersheds under the combined impact of storm tide and heavy rainfall. J. Hydrol. 2019, 579, 124159. [Google Scholar] [CrossRef]
- Bhola, P.K.; Leandro, J.; Disse, M. Building hazard maps with differentiated risk perception for flood impact assessment. Nat. Hazards Earth Syst. Sci. 2020, 20, 2647–2663. [Google Scholar] [CrossRef]
- Garrote, J.; Pena, E.; Diez-Herrero, A. Probabilistic Flood Hazard Maps from Monte Carlo Derived Peak Flow Values-An Application to Flood Risk Management in Zamora City (Spain). Appl. Sci. 2021, 11, 6629. [Google Scholar] [CrossRef]
- Chaudhary, P.; Leitao, J.P.; Donauer, T.; D’Aronco, S.; Perraudin, N.; Obozinski, G.; Perez-Cruz, F.; Schindler, K.; Wegner, J.D.; Russo, S. Flood Uncertainty Estimation Using Deep Ensembles. Water 2022, 14, 2980. [Google Scholar] [CrossRef]
- Di Baldassarre, G.; Kemerink, J.S.; Kooy, M.; Brandimarte, L. Floods and societies: The spatial distribution of water-related disaster risk and its dynamics. Wires Water 2014, 1, 133–139. [Google Scholar] [CrossRef]
Figure 1.
Overall framework diagram of the article.

Figure 2.
Conceptual diagram of river–storm surge composite events in the fluvial–sea transition. Heavy rain causes floods by increasing surface runoff and river water levels. Flooding is influenced by factors like river shape, floodplain features, and defenses against extreme events. Coastal flooding can be made worse by tidal surges and storm-driven water-level rises that interfere with river drainage and raise sea levels.

Figure 3.
The number of journal article publications in 2014–2022.

Figure 4.
Geographical distribution zoning map of publications during 2014–2022 (figure based on data retrieved from the WOS core collection database on 1 May 2022, the red dot represents countries with a high volume of articles on compound flooding).
Figure 4.
Geographical distribution zoning map of publications during 2014–2022 (figure based on data retrieved from the WOS core collection database on 1 May 2022, the red dot represents countries with a high volume of articles on compound flooding).

Figure 5.
Mapping of co-occurrence of keywords in compound flood research (“#” symbol represents the number of the keyword cluster).
Figure 5.
Mapping of co-occurrence of keywords in compound flood research (“#” symbol represents the number of the keyword cluster).

Figure 6.
Thematic evolution of author keywords in compound flood research (“#” symbol represents the name of the keyword cluster).
Figure 6.
Thematic evolution of author keywords in compound flood research (“#” symbol represents the name of the keyword cluster).

Figure 7.
Classification of copula functions (the red dashed box represents the most commonly used types of copula in recent years).
Figure 7.
Classification of copula functions (the red dashed box represents the most commonly used types of copula in recent years).

Figure 8.
Classification of numerical simulation models (the red dashed box represents the most extensively studied factors and research methods related to compound flood hazards in recent years).
Figure 8.
Classification of numerical simulation models (the red dashed box represents the most extensively studied factors and research methods related to compound flood hazards in recent years).

Figure 9.
Three types of unidirectional compound flood simulation, and their relationships (“#” symbol represents the category of unidirectional compound flood simulation).
Figure 9.
Three types of unidirectional compound flood simulation, and their relationships (“#” symbol represents the category of unidirectional compound flood simulation).

Figure 10.
Classification and framework of integrated hazard risk mapping methods.


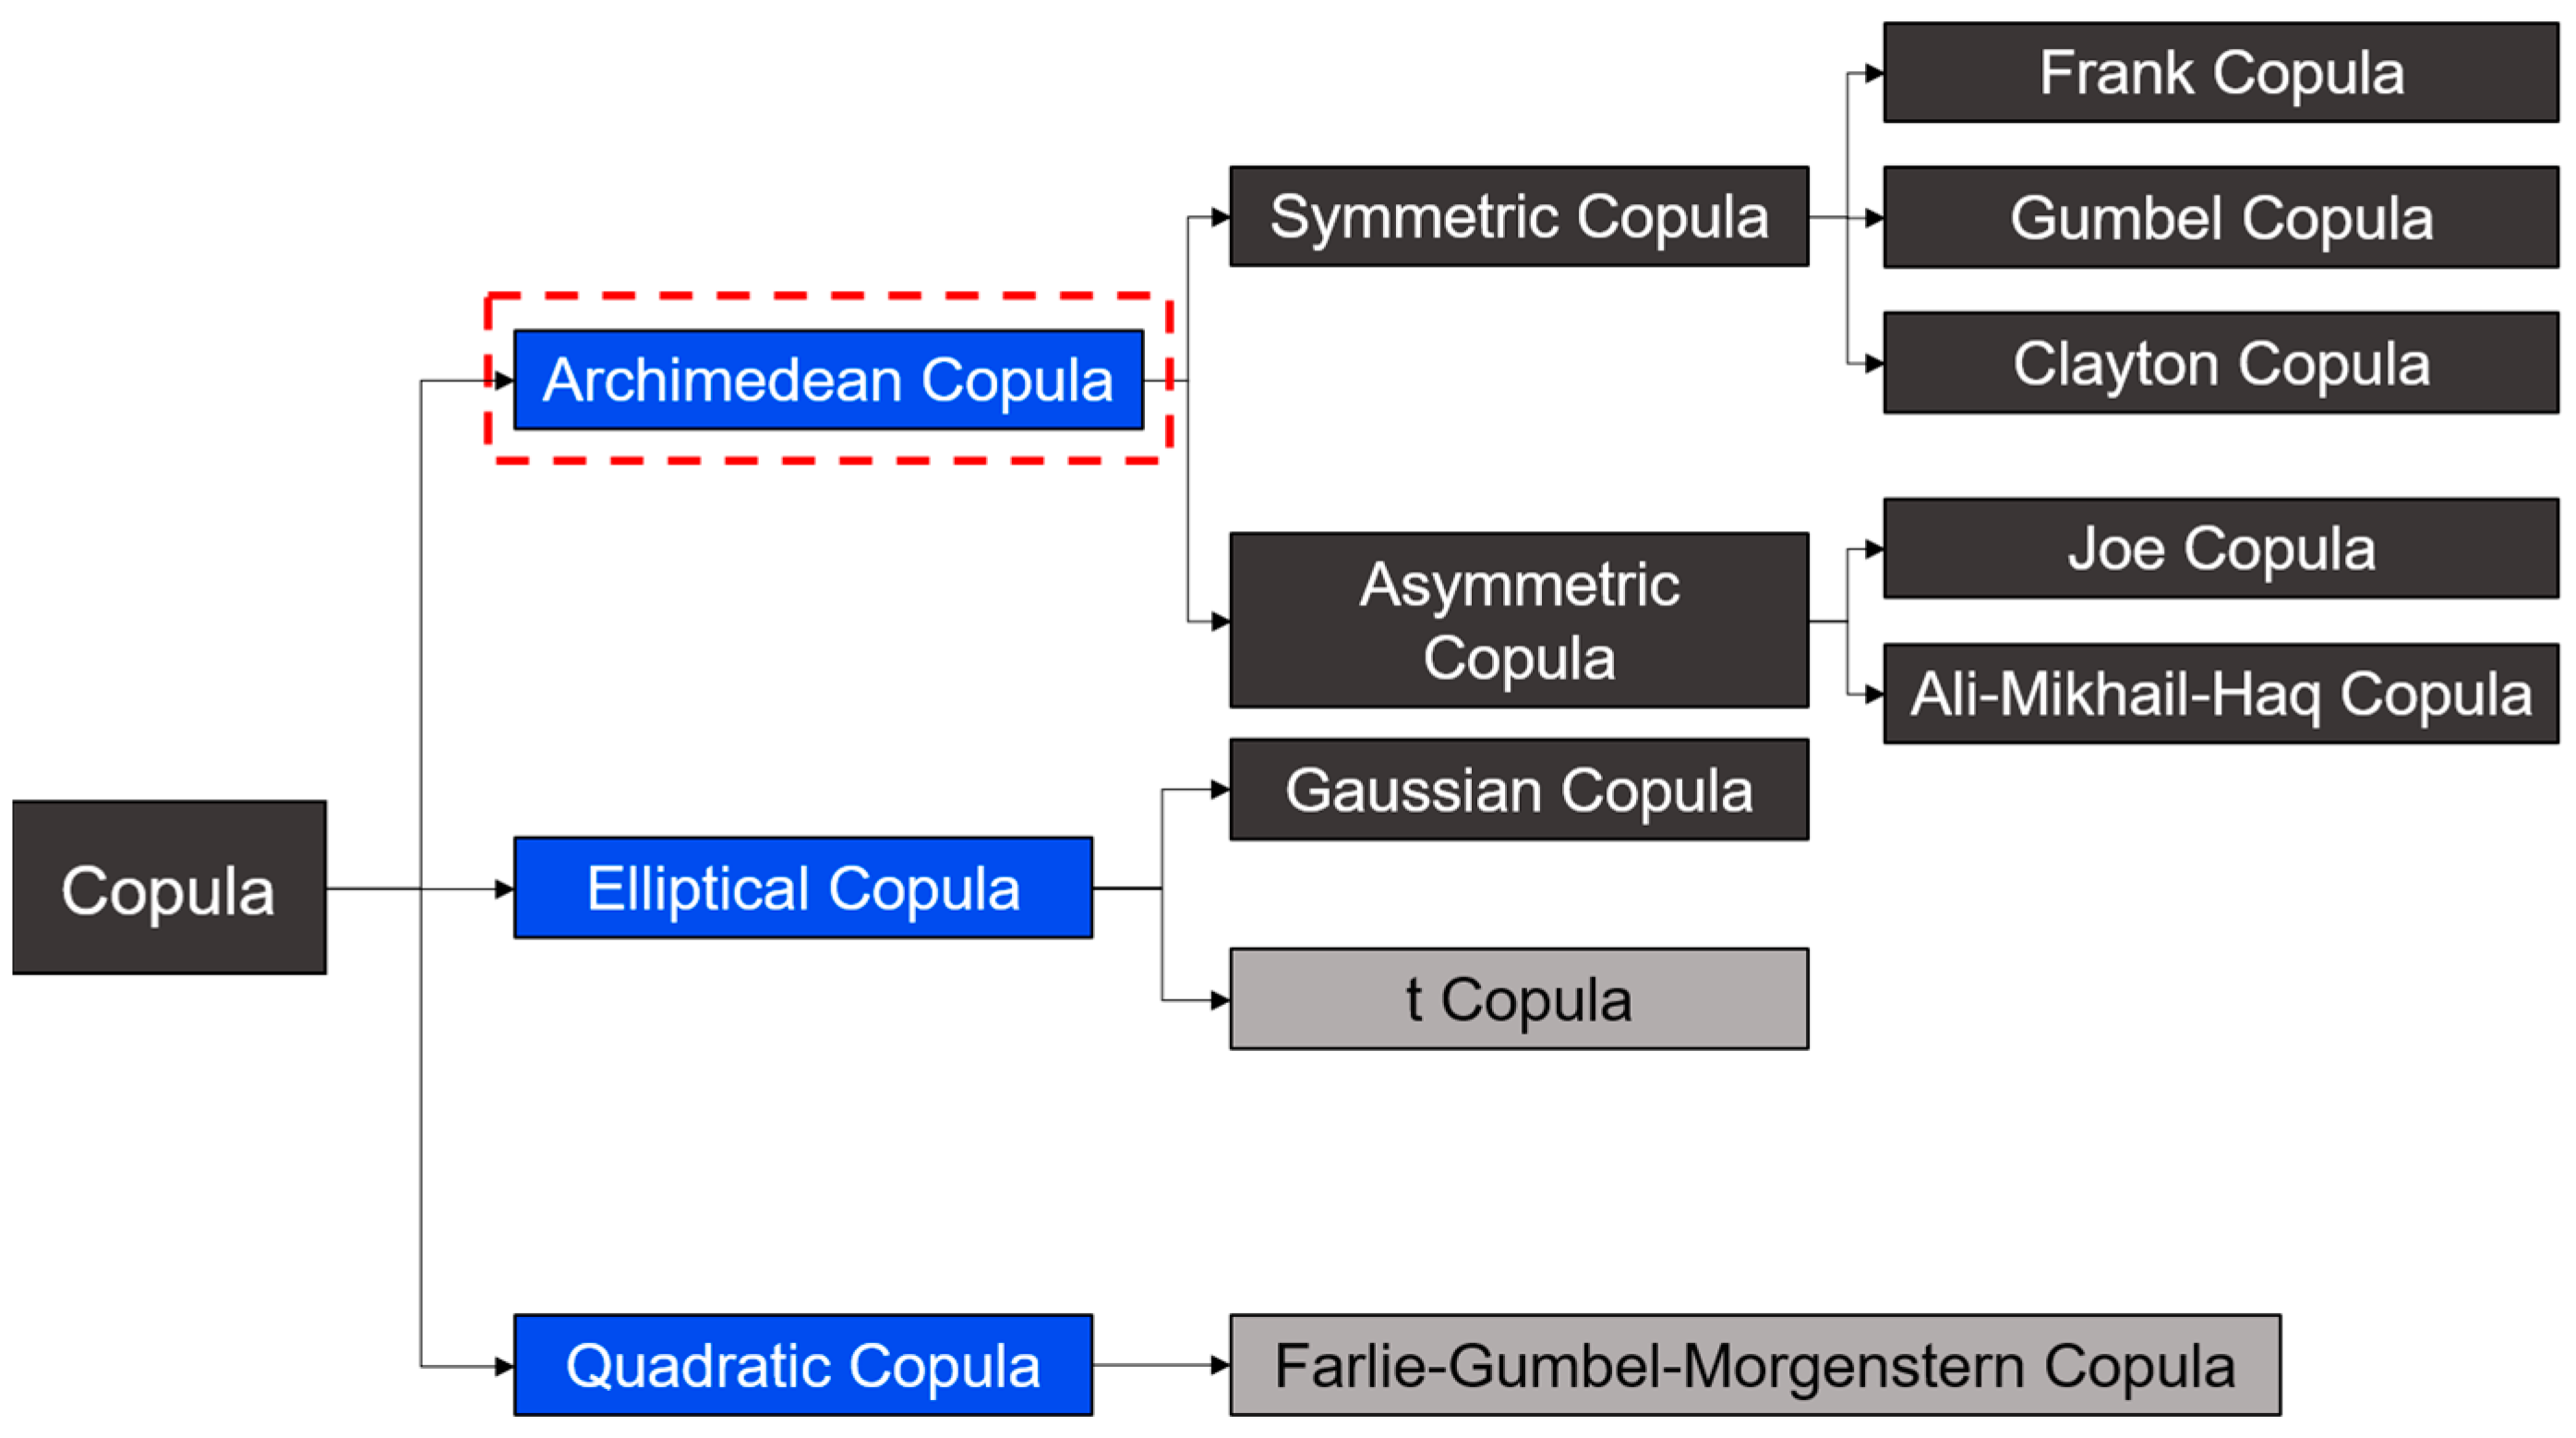
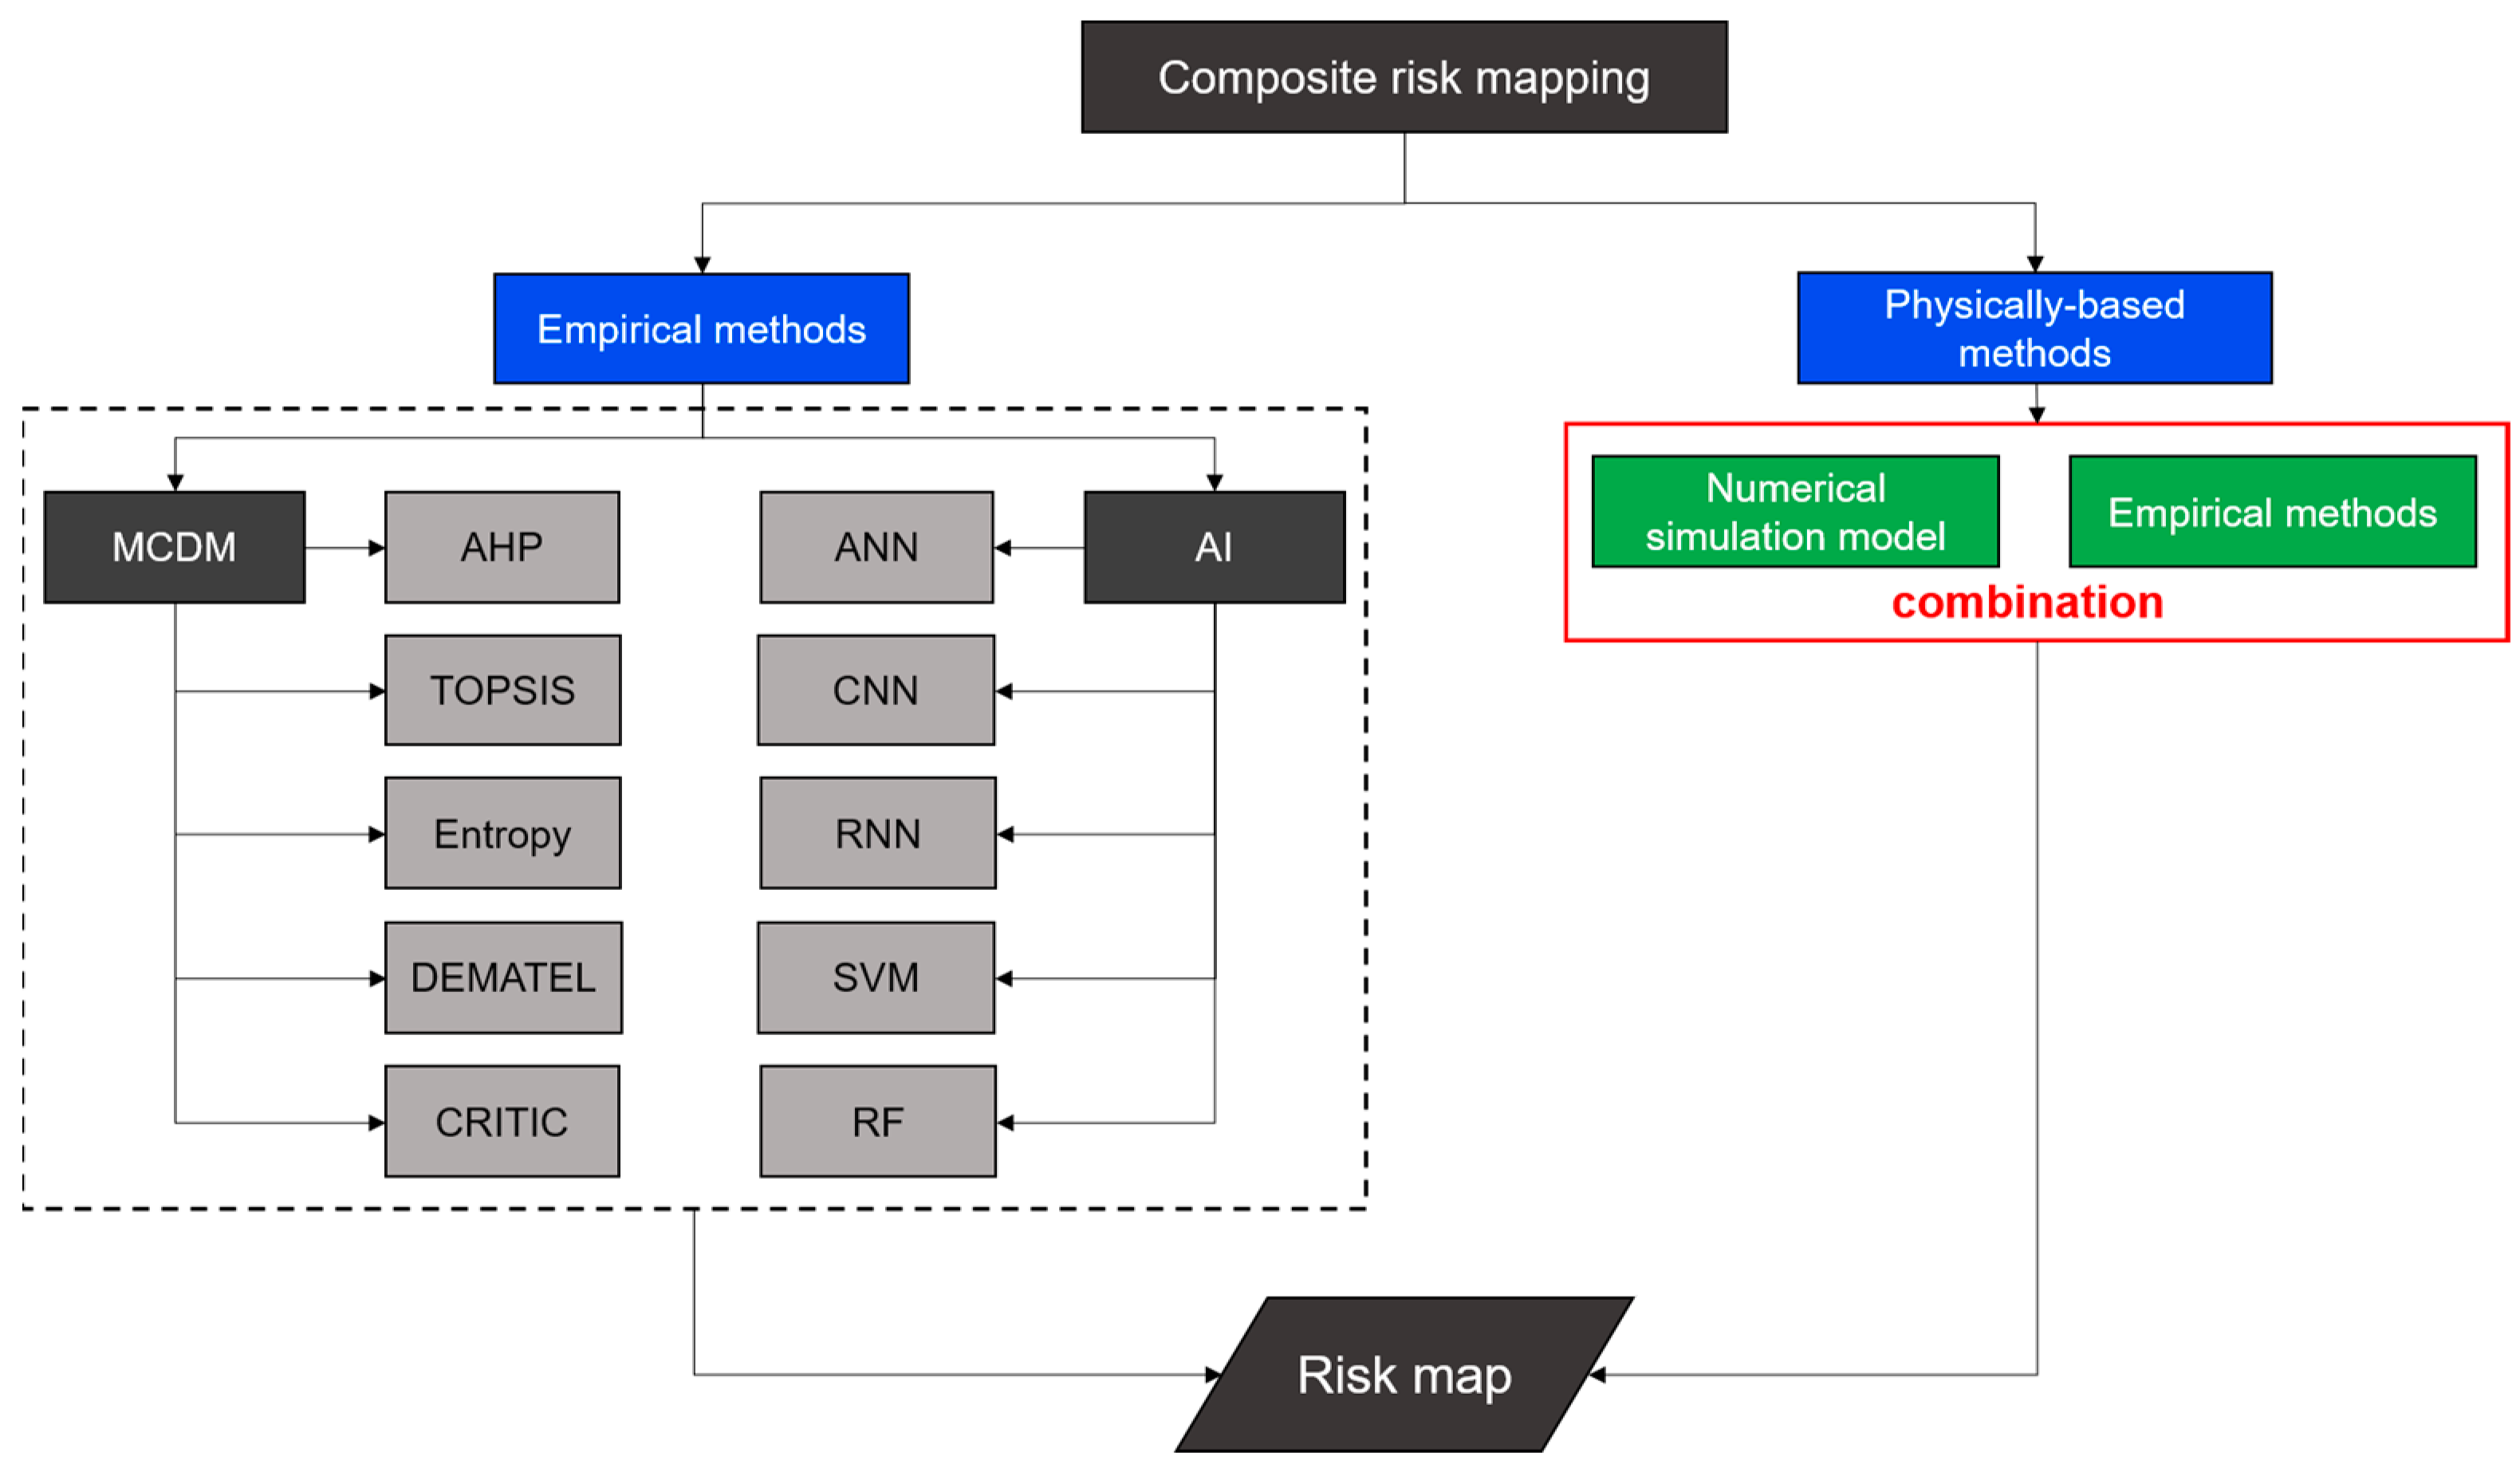
Table 1.
The top ten countries with the highest publication volume on coastal compound flooding, and corresponding research indicators.
Table 1.
The top ten countries with the highest publication volume on coastal compound flooding, and corresponding research indicators.
| No. | Country | Continent | Link | Total Link Strength | NP | APY | AC |
|---|---|---|---|---|---|---|---|
| 1 | USA | North America | 24 | 117 | 186 | 2020.18 | 24.76 |
| 2 | China | Asia | 19 | 67 | 78 | 2020.41 | 17.41 |
| 3 | United Kingdom | Europe | 21 | 65 | 37 | 2020.56 | 25.02 |
| 4 | Netherlands | Europe | 17 | 52 | 34 | 2019.70 | 25.20 |
| 5 | Germany | Europe | 21 | 56 | 31 | 2019.38 | 32.77 |
| 6 | Australia | Oceania | 22 | 42 | 30 | 2019.2 | 93.2 |
| 7 | Italy | Europe | 19 | 34 | 23 | 2019.65 | 29.13 |
| 8 | Canada | North America | 8 | 13 | 22 | 2020.31 | 17.09 |
| 9 | Spain | Europe | 12 | 21 | 20 | 2019.9 | 12.85 |
| 10 | France | Europe | 14 | 25 | 19 | 2019.10 | 28.36 |
Note: “Link” represents the number of other countries connected to that country (excluding duplicates). “Total Link Strength” represents the total number of connections that a country has with other countries (including duplicated connections). No. = number, NP = number of publications, APY = average publication year, AC = average citations.
Table 2.
Collation of some high-frequency keywords.
| Label | Cluster | Links | Link Strength | Frequency |
|---|---|---|---|---|
| Storm surge | #1 | 244 | 864 | 118 |
| Sea-level rise | #1 | 193 | 535 | 75 |
| Risk | #1 | 128 | 469 | 67 |
| Coastal flooding | #3 | 84 | 171 | 21 |
| Climate change | #1 | 206 | 536 | 91 |
| Dynamics | #0 | 63 | 109 | 32 |
| Variability | #0 | 85 | 144 | 28 |
| Compound flooding | #1 | 126 | 402 | 56 |
| Dependence | #1 | 113 | 409 | 49 |
| Compound events | #2 | 65 | 120 | 15 |
| Extreme rainfall | #1 | 104 | 384 | 47 |
| Model | #2 | 107 | 240 | 41 |
| Precipitation | #1 | 102 | 328 | 41 |
| River | #1 | 86 | 214 | 37 |
| Uncertainty | #1 | 52 | 97 | 13 |
| Tides | #2 | 73 | 145 | 24 |
| Copula | #1 | 56 | 132 | 16 |
| Inundation | #2 | 85 | 201 | 32 |
Note: “#” symbol represents the number of the keyword cluster.
Table 3.
Output and input data of three types of models.
| Model Classification | Output Data | Input Data |
|---|---|---|
| Encounter probability models | Dependence, correlation, joint return period, conditional probability, joint probability, risk, uncertainties, trend, failure probability | Historical flood event data |
| Numerical simulation models | Depth, flow, velocity, duration, extent of inundation, spread, hazard | Meteorological information, topography/geomorphology, land use, and flood frequency data |
| Integrated hazard risk mapping | Scope of influence, vulnerability, danger, exposure, potential risks, sensitivity | Flood levels, flow velocities, duration, people density, road network density, economic data |
Table 4.
Summary of the methodologies, results, and information of the early studies on floods.
| Consistent Hazard Factor | Output Results and Information | Common Research Methodology |
|---|---|---|
| Extreme rainfall | Rainfall intensity | Fixed threshold method, percentile threshold method |
| Duration | Sen slope estimation, Mann–Kendall trend test | |
| Return period | Extremal distribution, Gumbel distribution function, generalized Pareto distribution model(GPD) | |
| Frequency | Linear method of moments, Pearson type III frequency curve | |
| Spatial and temporal variation characteristics | Mann–Kendall trend test, linear regression, sliding averages, linear regression, wavelet analysis | |
| Runoff | Trend | Linear trend analysis method, cumulative distance curve method, Mann–Kendall trend test |
| Periodicity | Wavelet analysis, analysis of variance (ANOVA) cycle method, composite wavelet transform | |
| Runoff volume | Multiyear averaging, raw data trend analysis, M-K trend analysis | |
| Frequency | Non-smooth extremal model, polynomial normal transform | |
| Spatial and temporal variation characteristics | Spatial and temporal variation characteristics, GPD | |
| Storm surge | Frequency | Data analysis method, nonstationary statistics method |
| Extreme high-tide levels | Formulae for forecasting extreme high-tide levels | |
| Spatial and temporal variation characteristics | Wavelet analysis | |
| Return period | Combinatorial distribution method | |
| Extreme value | Pearson-III-Pareto distribution model | |
| Sea-level rise | Rising trend | Time-series analysis methods |
| Wave | Trend | Regression analysis, ARIMA model |
| Wave height | Weibull distribution, nonlinear shallow-water wave function, Rayleigh distribution | |
| Wave period | Longuet-Higgins distribution | |
| Ground subsidence | Spatial and temporal distribution characteristics | GIS spatial statistical methods |
| Trend | GIS spatial statistical methods | |
| Impervious surface | Spatial and temporal distribution characteristics | GIS spatial statistical methods |
| Trend | GIS spatial statistical methods |
Table 5.
Case studies related to the multifactor encounter probability modeling of floods.
| Case Studies | Key Constituent | Output Results and Information | Combinatorial Approach | Research Methodology | |
|---|---|---|---|---|---|
| OR | AND | ||||
| Dependence between high sea levels and high river discharge increases flood hazard in global deltas and estuaries [57] | Sea-level rise, river | Dependence, conditional probability | √ | Copula | |
| A Bayesian Copula-based nonstationary framework for compound flood risk assessment along US coastlines [55] | Sea-level rise, rainfall | Dependence, uncertainties, joint return period, trend | √ | √ | Copula |
| Multivariate analysis of compound flood hazard across Canada’s Atlantic, Pacific, and Great Lakes coastal areas [60] | Sea-level rise, river, rainfall | Joint return period, failure probability | √ | √ | Copula |
| Assessing the characteristics and drivers of compound flooding events around the UK coast [61] | Storm surge, river | Dependence, correlation, joint return period | √ | Dependence method, joint-occurrence method | |
| Mapping dependence between extreme rainfall and storm surge [62] | Storm surge, rainfall | Dependence | √ | Bivariate logistic threshold-excess model | |
| Quantifying the dependence between extreme rainfall and storm surge in the coastal zone [63] | Storm surge, rainfall | Dependence | √ | Bivariate logistic threshold-excess model | |
| Modeling dependence between extreme rainfall and storm surge to estimate coastal flooding risk [64] | Storm surge, rainfall | Dependence | √ | Bivariate logistic threshold-excess model, point process, the conditional methods | |
| Copula-based joint probability analysis of compound floods from rainstorm and typhoon surge: a case study of Jiangsu coastal areas, China [56] | Storm surge, rainfall | Encounter probability, joint return period, marginal distribution, risk | √ | Copula | |
| Compounding the joint impact of rainfall, storm surge and river discharge on coastal flood risk: an approach based on 3D fully nested Archimedean Copulas [65] | Storm surge, rainfall, river | Dependence, encounter probability, joint return period, failure probability, risk | √ | √ | Copula |
| Flood risk assessment of loss of life for a coastal city under the compound effect of storm surge and rainfall [16] | Storm surge, rainfall | Encounter probability | √ | Copula | |
| Joint risk analysis of extreme rainfall and high tide level based on extreme value theory in coastal area [66] | Rainfall, tide | Dependence, correlation, joint return period, encounter probability | √ | Copula | |
| Compound flood impact of water level and rainfall during tropical cyclone periods in a coastal city: the case of Shanghai [67] | Peak water levels (storm surge, astronomical tides, sea-level rise), rainfall | Dependency, encounter probability, peak water level | √ | Copula | |
Note: AND scenarios consider the possibility of two or more marginal variables simultaneously exceeding specific thresholds, while OR scenarios consider the possibility of at least one marginal variable exceeding the threshold [55]; AND and OR are the most commonly used combinations of hazard scenarios [68].
Table 6.
Description of some existing dynamic numerical models.
| Category | Typical Model | Model Equation Description | Access | Information Acquisition |
|---|---|---|---|---|
| Hydrological models | HEC-HMS | - | Commercial | Flow, spatial distribution |
| VIC | - | Open-source | Flow, water level, spatial distribution | |
| SWAT | - | Open-source | Flow, water level, spatial distribution | |
| MIKE SHE | - | Commercial | Flow, water level, velocity, spatial distribution, duration | |
| HEC-GEORAS | - | Commercial | Flow, water level, velocity, spatial distribution, duration | |
| 1D hydrodynamic models | HEC-RAS 1D | 1D SWE | Open-source | Flow, water level, velocity, spatial distribution, duration |
| MIKE 11 | 1D SWE | Commercial | Flow, water level, velocity, spatial distribution, duration | |
| ISIS 1D | 1D SWE | Commercial | Flow, water level, velocity, spatial distribution, duration | |
| 2D hydrodynamic models | Lisflood-FP [87] | Inertial formulation of 2D SWE | Research | Flow, water level, velocity, spatial distribution, duration |
| MIKE 21 | NSE | Commercial | Flow, water level, velocity, spatial distribution, duration | |
| TUFLOW | 2D SWE | Commercial | Flow, water level, velocity, spatial distribution, duration, wave height | |
| FloodMap [114] | The 2D diffusive wave model | Research | Water level, spatial distribution, duration | |
| HEC-RAS 2D | 2D SWE + diffusion wave | Open-source | Flow, water level, velocity, spatial distribution, duration | |
| CityCAT | 2D SWE | Open-source | Flow, water level, velocity, spatial distribution, duration, probability, vulnerability | |
| TELEMAC 2D | 2D SWE | Commercial | Flow, water level, velocity, spatial distribution, duration | |
| DHMUbran | The 2D diffusive wave model | Research | Flow, water level, velocity, spatial distribution, duration | |
| UPFLOOD [115] | 2D diffusive wave model | Research | Water level, velocity, spatial distribution | |
| JFLOW [116] | 2D diffusive wave model | Research | Flow, water level, velocity, spatial distribution, duration | |
| ISIS 2D | 2D SWE | Commercial | Flow, water level, velocity, spatial distribution, duration | |
| 3D hydrodynamic models | Delfet3D | NSE | Commercial | Flow, velocity, water level, flow direction, spatial distribution, duration |
| ADCIRC | NSE | Open-source | Flow, velocity, water level, flow direction, spatial distribution, duration, pressure | |
| TELEMAC 3D | NSE | Open-source | Flow, velocity, water level, flow direction, spatial distribution, duration, pressure |
Table 7.
More case studies of unidirectional transfer composite model research.
| Case Studies | Categories | Models | Research Subjects |
|---|---|---|---|
| Cascade impact of hurricane movement, storm tidal surge, sea level rise, and precipitation variability on flood assessment in a coastal urban watershed [126] | Hydrology-dominated model | ADCIRC-SWAN, ICPR | Hurricane, storm tidal surge, sea-level rise, precipitation changes |
| The combined impact of inland and coastal floods: mapping knowledge base for the development of planning strategies [127] | Hydrodynamics-dominated model | SWMM, HEC-RAS | Rainfall, runoff, sea-level rise, storm surge |
| A multi-scale ensemble-based framework for forecasting compound coastal-riverine flooding: The Hackensack-Passaic watershed and Newark Bay [128] | Hydrodynamics-dominated model | HEC-HMS, NYHOPS, HEC-RAS | Storm surge, river |
| Assessing compound flooding from landfalling tropical cyclones on the North Carolina coast [129] | Hydrodynamics-dominated model | HEC-HMS, ADCIRC, HEC-RAS | Rainfall, storm surge |
| Modelling of coastal inundation in response to a tropical cyclone using a coupled hydraulic HEC-RAS and ADCIRC model [130] | Hydrodynamics-dominated model | ADCIRC, HEC-RAS | Rainfall, runoff, storm surge |
| Developing a hybrid modeling and multivariate analysis framework for storm surge and runoff interactions in urban coastal flooding [131] | Hydrology-dominated model | Delft3D -SWAN, SWMM | Storm surge, runoff |
| Use of 1D unsteady HEC-RAS in a coupled system for compound flood modelling: North Carolina case study [132] | Hydrodynamics-dominated model | ADCIRC, HL-RDHM, HEC-RAS 1D | Rainfall, tidal |
| Developing a modelling framework to simulate compound flooding: when storm surge interacts with riverine flow [133] | Oceanography-dominated model | HEC-RAS, ADCIRC | Storm surge, river |
| A new 1D/2D coupled modelling approach for a riverine-estuarine system under storm events: application to Delaware River basin | Oceanography-dominated model | NWM, D-Flow FM, ADCIRC/WW3 | Tidal, surges, river, wind, atmospheric pressure |
Table 8.
Research case studies and method classifications, along with input and output information of integrated hazard risk mapping methods.
Table 8.
Research case studies and method classifications, along with input and output information of integrated hazard risk mapping methods.
| Case Studies | Classification | Methods | Input | Output |
|---|---|---|---|---|
| Assessing coastal vulnerability to environmental hazards of the Indian Sundarban delta using multicriteria decision-making approaches [138] | Empirical methods | Simple average method (SAM), AHP, principal component analysis (PCA) | 22 indicators of physical, climate, and socioeconomic variables | Vulnerability |
| Flood loss prediction of coastal city based on GM-ANN [142] | Empirical methods | AHP, Grey prediction model (GM), ANN | Geological deposition rate, sea-level rise, precipitation, length of urban drainage pipes, annual GDP, and population | Flood-prone areas |
| Risk mapping of Indian coastal districts using IPCC-AR5 framework and multi-attribute decision-making approach [165] | Empirical methods | IPCC-AR5, TOPSIS | 35 indicators, including hazard, vulnerability, and economic factors | Risk index |
| AHP and TOPSIS-based flood risk assessment-a case study of the Navsari City, Gujarat, India [117] | Empirical methods | AHP, TOPSIS | 14 indicators, including hazard and vulnerability | Hazard, vulnerability, risk |
| Inundation risk assessment based on G-DEMATEL-AHP and its application to the Zhengzhou flooding disaster [166] | Empirical methods | Grey-DEMATEL-AHP | Involving 12 indicators related to natural environment and vulnerability | Risk area |
| Urban flooding risk assessment based on GIS- game theory combination weight: A case study of Zhengzhou City [167] | Empirical methods | AHP-CRITIC | Water depth, population density, road network density, land use, lighting brightness, medical rescue points | Risk index |
| Assessment of long and short-term flood risk using the multi-criteria analysis model with the AHP-Entropy method in the Poyang Lake basin [168] | Empirical methods | AHP-entropy | 10 indicators, including hazard and vulnerability | Risk index |
| A coastal flood early-warning system based on offshore sea state forecasts and artificial neural networks [146] | Empirical methods | ANN | Characteristics of ocean waves (height, period, and direction), sea-level elevation | Flood-prone areas |
| From local to regional compound flood mapping with deep learning and data fusion techniques [159] | Empirical methods | CNN, DF | Multispectral Landsat analysis-ready data (ARD), synthetic-aperture radar (SAR) data with dual polarization, DEM | Compound flood map |
| An effective alternative for predicting coastal floodplain inundation by considering rainfall, storm surge, and downstream topographic characteristics [169] | Physical-based methods | ADCIRC, distributed hydrological model, RNN | 3 hydrological factors and 7 geomorphic factors | Flood depth |
| Integrated hydrodynamic and machine learning models for compound flooding prediction in a data-scarce estuarine delta [147] | Physical-based methods | SLIM 2D, RF, SVM, multiple linear regression (MLR) | Atmospheric, oceanic, and riverine variables | Water level |
| A study on coastal flooding and risk assessment under climate change in the mid-western coast of Taiwan [160] | Physical-based methods | WWM, POM, WASH123D, AHP | Engineering, socioeconomics, land use, geology, disaster prevention facilities | Astronomical tides, storm surges, typhoon waves generated by nearshore wave setup, wave runup, overflow |
| A rapid prediction model of urban flood inundation in a high-risk area coupling machine learning and numerical aimulation approaches [162] | Physical-based methods | PCSWMM, Elman | Rainfall, water depth | Water depth |
| Artificial intelligence for hurricane storm surge hazard assessment [163] | Physical-based methods | ADCIRC, ANN | Central pressure, maximum wind speed, maximum wind speed radius, storm-surge peak height, latitude distance, left–right longitudinal distance | Storm-surge height, return period |
Table 9.
Potential elements and factors contributing to model uncertainty.
| Category | Sources of Uncertainty |
|---|---|
| Parameter uncertainty | Roughness |
| Soil permeability | |
| Dam parameters | |
| River cross-section | |
| Eddy viscosity | |
| Diffusivity | |
| River permeability coefficient | |
| Data uncertainty | DEM |
| Wind power, wind speed, wind direction | |
| Land-use data | |
| Rainfall runoff data | |
| Dike data | |
| Water-level observation data | |
| Model uncertainty | Hydrological models |
| Hydrodynamic models | |
| Ocean models | |
| Coupling mode | |
| Model assumptions uncertainty | Spatiotemporal consistency |
| Stationary |
Table 10.
A concise overview comparing the strengths, weaknesses, and use cases of flood hazard simulation and risk perception techniques.
Table 10.
A concise overview comparing the strengths, weaknesses, and use cases of flood hazard simulation and risk perception techniques.
| Methods | Strength | Drawback | Applicable Scene |
|---|---|---|---|
| Encounter probability models | Simple calculation and clear thinking | Long-term historical disaster data will limit the results | Flood risk assessment |
| No precise geographic data required | It cannot accurately reflect the distribution law of flood risk | Flood prediction | |
| Factors such as hazard factors will change over time, resulting in inaccurate prediction results | Dependence prediction of flood-causing factors | ||
| Numerical simulation models | Can accurately predict flood depth, duration, inundation range, and other information | The calculation is more complicated, and the time cost is high | Construction of urban flood warning system |
| Better use of accurate data with high-resolution DEM | High requirements for data accuracy | Flood risk assessment | |
| Can reflect the connection of various elements in the disaster system and the evolution process of the disaster | Boundary conditions are not well defined, and complex flows cannot be simulated | Urban surface water modeling | |
| Flood monitoring | |||
| Integrated hazard risk mapping methods | Simple to calculate and easy to implement | Cannot accurately predict future events | Flood sensitivity mapping |
| Can accurately predict flood risk areas | Accuracy depends on the subjective opinion of experts | Flood vulnerability mapping | |
| Low data requirements | Some ML model rules are challenging to understand | Flood risk assessment | |
| Strong ability to combine with other methods | High precision is required for data | Emergency flood management | |
| Selection of flood control and disaster mitigation methods |
Disclaimer/Publisher’s Note: The statements, opinions and data contained in all publications are solely those of the individual author(s) and contributor(s) and not of MDPI and/or the editor(s). MDPI and/or the editor(s) disclaim responsibility for any injury to people or property resulting from any ideas, methods, instructions or products referred to in the content. |
© 2024 by the authors. Licensee MDPI, Basel, Switzerland. This article is an open access article distributed under the terms and conditions of the Creative Commons Attribution (CC BY) license (https://creativecommons.org/licenses/by/4.0/).
Share and Cite
MDPI and ACS Style
Sun, H.; Zhang, X.; Ruan, X.; Jiang, H.; Shou, W. Mapping Compound Flooding Risks for Urban Resilience in Coastal Zones: A Comprehensive Methodological Review. Remote Sens. 2024, 16, 350. https://doi.org/10.3390/rs16020350
AMA Style
Sun H, Zhang X, Ruan X, Jiang H, Shou W. Mapping Compound Flooding Risks for Urban Resilience in Coastal Zones: A Comprehensive Methodological Review. Remote Sensing. 2024; 16(2):350. https://doi.org/10.3390/rs16020350
Chicago/Turabian StyleSun, Hai, Xiaowei Zhang, Xuejing Ruan, Hui Jiang, and Wenchi Shou. 2024. "Mapping Compound Flooding Risks for Urban Resilience in Coastal Zones: A Comprehensive Methodological Review" Remote Sensing 16, no. 2: 350. https://doi.org/10.3390/rs16020350
Note that from the first issue of 2016, this journal uses article numbers instead of page numbers. See further details here.