
Remote Data for Mapping and Monitoring Coastal Phenomena and Parameters: A Systematic Review

Research Institute for Geo-Hydrological Protection (IRPI), National Research Council (CNR), 06128 Perugia, Italy
Remote Sens. 2024, 16(3), 446; https://doi.org/10.3390/rs16030446
Submission received: 3 December 2023
/
Revised: 11 January 2024
/
Accepted: 18 January 2024
/
Published: 23 January 2024
(This article belongs to the Special Issue Remote Sensing Applications in Monitoring of Protected Areas II)
Abstract
:Since 1971, remote sensing techniques have been used to map and monitor phenomena and parameters of the coastal zone. However, updated reviews have only considered one phenomenon, parameter, remote data source, platform, or geographic region. No review has offered an updated overview of coastal phenomena and parameters that can be accurately mapped and monitored with remote data. This systematic review was performed to achieve this purpose. A total of 15,141 papers published from January 2021 to June 2023 were identified. The 1475 most cited papers were screened, and 502 eligible papers were included. The Web of Science and Scopus databases were searched using all possible combinations between two groups of keywords: all geographical names in coastal areas and all remote data and platforms. The systematic review demonstrated that, to date, many coastal phenomena (103) and parameters (39) can be mapped and monitored using remote data (e.g., coastline and land use and land cover changes, climate change, and coastal urban sprawl). Moreover, the authors validated 91% of the retrieved parameters, retrieved from remote data 39 parameters that were mapped or monitored 1158 times (88% of the parameters were combined together with other parameters), monitored 75% of the parameters over time, and retrieved 69% of the parameters from several remote data and compared the results with each other and with available products. They obtained 48% of the parameters using different methods, and their results were compared with each other and with available products. They combined 17% of the parameters that were retrieved with GIS and model techniques. In conclusion, the authors addressed the requirements needed to more effectively analyze coastal phenomena and parameters employing integrated approaches: they retrieved the parameters from different remote data, merged different data and parameters, compared different methods, and combined different techniques.
1. Introduction
Earth is defined as a coastal planet [1] because its coastline has an extent of about 1,634,701 km [2]. In other words, if the coastline could be stretched, it would go 402 times around the equator [1]. Moreover, coastal areas are a very valuable resource. In 2016, around 102,108.4 km2 of these areas were declared an “exclusive economic zone” [3]. They provide the human population with many benefits (e.g., food, renewable and nonrenewable resources, and services) [4]. The wide range of benefits make them favorite places for permanent living, leisure, recreation, and tourism. Most people are concentrated in coastal cities, and many of them have more than 10 million people [5]. In 2000, Kullenberg [6] highlighted that 27 coastal cities had more than 1 million people, 12 cities had between 1 to 10 million people, 13 had between 10 to 20 million people, and 2 had more than 20 million people. Moreover, these numbers are expected to grow. The Intergovernmental Panel on Climate Change evaluated that 680 million people lived in coastal zones in 2019 and predicted that the number will become more than one billion in 2050 [7].
However, climate change has a great impact on coastal zones [8]. In 2019, Oppenheimer et al. [9] underlined that “coastal ecosystems are already impacted by the combination of sea level rise, other climate-related ocean changes, and adverse effects from human activities on ocean and land (high confidence)”. Moreover, the continuous interaction between humans and the land, sea, rivers, and atmosphere make coastal waters very fragile [10]. Crain et al. [11] classified human threats into four categories: effects of contaminants, eutrophication, habitat loss, and overexploitation of fishery resources.
Since 1971, remote sensing has been used to map and monitor coastal zone phenomena and parameters [12,13]. To further demonstrate how remote sensing is very useful for mapping and monitoring this valuable but vulnerable area, more than 500 reviews on remote sensing application in coastal zones were published from 1971 to June 2023. A total of 35 reviews published between 2021 and June 2023 were identified using the Web of Science (WoS) and Scopus search engines (Table 1).
Most reviews focused on a phenomenon and/or parameter, providing an overview of papers that examined or monitored them (89%). Among these reviews, some selected papers that analyzed only one study area (14%), whereas others selected papers that only employed one type of sensor or methodology (18%) (Table 2).
The other authors only considered coastal zone phenomena and parameters that were mapped using Indian remote sensing satellites [23] or unmanned aerial vehicles (UAVs) [14,22,47]. It is interesting to note that the authors who provided a comprehensive overview of the phenomena and parameters mapped using UAVs pointed out their limited use and advocated greater integration between satellite data and data collected by UAVs [14,22,47].
Objectvives
In conclusion, the most recent reviews provide a limited overview of coastal zone phenomena and parameters mapped and monitored using remote data. In other words, these reviews do not provide an exhaustive overview of remote data, methods, and/or approaches that might more effectively map and monitor these phenomena and parameters. As a matter of fact, for more accurate mapping and monitoring, it is important to remember that coastal areas are characterized by small-scale mosaics of different habitats and mainly affected by small-scale natural or man-made phenomena and that coastal waters are characterized by high spatial and temporal variability of biochemical and physical parameters [48].
Therefore, this paper provides an updated systematic review that aims to (a) identify the coastal zone phenomena and parameters that can be mapped and monitored using remote data, (b) examine how authors have addressed the required spatial, temporal, and thematic requirements to more effectively analyze the coastal zone phenomena and parameters, (c) and provide readers with recommendations for meeting them. The systematic review was carried out in accordance with the Preferred Reporting Items for Systematic reviews and Meta-Analysis (PRISMA) statement [49]. The methodological approach employed in this systematic literature review is explained in Section 2, whereas the results, discussion, and conclusions are presented in Section 3, Section 4 and Section 5, respectively.
2. Materials and Methods
2.1. Identification Criteria
This systematic literature review aims to provide readers with an updated overview of research that has exploited remote sensing data to map and monitor the phenomena and parameters of coastal zones. Because remote sensing is defined as a technique that retrieves information without physical contact with the target under examination [50], this study considered all kinds of remote sensing data acquired with any kind of platform (from satellite to aircraft and from UAV to fixed platform). Therefore, the search string used to initially identify papers was generated from all possible combinations between two groups of keywords: the first group identified the coastal area from a geographical point of view (i.e., “coastal waters”, “coasts”, “delta”, “estuarine”, “gulf”, and “lagoons”), while the second group included remote data acquired by all types of platforms (i.e., “remote sensing”, “remote sensed”, “satellite”, “drone”, “unmanned aerial vehicle”, “airborne”, and “aircraft”). For this purpose, the WoS and Scopus search engines were used. It is important to note that this systematic review provides an up-to-date overview that does not claim to be exhaustive given around 100,000 papers have studied coastal zones since 1971. Papers that were published from January 2021 to June 2023 were analyzed.
2.2. Screening and Eligible Criteria
As the search engines identified 15,141 papers published in this time (blue rectangle in Figure 1), the other criterion selected to screen the eligible papers was their number of citations.
Because the number of citations increase over time, no single citation threshold was fixed to papers that were published in different years. However, the number of papers that have to be analyzed for each year was fixed to around 600 papers. This large number was chosen to provide a meaningful sample of papers published during the period under review. The green rectangle in Figure 1 shows the citation threshold and last search engine access for each year of publication and the resulting number of papers screened.
Therefore, the abstracts of these articles were analyzed to identify research that exploited remote data to map and/or monitor coastal phenomena and parameters. A total of 502 eligible papers were identified after excluding duplicates (yellow rectangle in Figure 1).
3. Results
3.1. Remote Data
The analysis of 502 eligible papers highlighted that authors had used 1287 remote data and 396 products that were available online to map and monitor coastal phenomena and parameters. Among the remote data, 79%, 7%, 10%, and 4% of remote data were acquired from satellite, airborne, UAV, and fix platforms, respectively. In addition, 10% of the satellite data were characterized by high spatial resolutions (less than 10 m, e.g., WorldView images). Therefore, 29% of all remote data were characterized by spatial resolutions less than 10 m, and only 7% of the remote data were characterized by spatial resolutions greater than 100 m (e.g., MODIS images). Passive sensors acquired 85% of the remote data, and hyperspectral sensors acquired 5% of the passive data. Regarding active satellite data, Sentinel-1 sensors were the first to be employed. Regarding passive satellite data, Sentinel-2 sensors were the first to be employed. Therefore, most authors preferred to utilize sensor data with high temporal and spatial resolution, followed by sensors with high spectral resolution.
Atmospheric Correction
Because atmospheric correction is one of the major challenges in studying coastal waters with remote data [51,52], most authors (76%) paid special attention to atmospheric correction of passive data (e.g., Tavares et al. [52] and Vanhellemont and Ruddick [53] compared the performance of the main atmospheric correction algorithms). Some authors atmospherically corrected remote images that were acquired from different sensors and/or in different times to compare their spectra and/or products (e.g., [54,55]). Others proposed atmospheric correction algorithms (e.g., Luo et al. [56] developed a new algorithm to atmospherically correct the HY-1C/D data and compared the corrected data with the simultaneous Landsat data). Moreover, some authors also corrected the images by sun glint contamination (e.g., [52,57,58]).
3.2. Available Products
In order to explain how the authors exploited the 396 products, a careful analysis was performed. The following is an explanatory overview of them. Regarding chlorophyll-a products, Nadhairi et al. [59], for example, employed the daily mean chlorophyll-a satellite data (spatial resolution of 4 × 4 km) that were provided by the Copernicus Marine Environmental Monitoring Center (CMEMS). Regarding the digital elevation model, Xu et al. [60], for example, compared some products that play a critical role in flood simulation. Regarding dissolved iron products, Zanaty et al. [61], for example, compared land use and land cover maps with some water quality products that were provided by CMEMS to assess the anthropogenic impacts on environmental sustainability. Regarding hydrodynamic products, Brempong et al. [62], for example, utilized data produced by the Laboratory of Geophysical and Oceanographic Spatial Studies of Toulouse to assess the major factors contributing to coastal flooding. Regarding sea level altimetry products, Passaro et al. [63] and Pujol et al. [64], for example, compared some products. Regarding sea surface salinity products, Vazquez-Cuervo et al. [65], for example, analyzed the RSSSMAP (Remote Sensing Systems 70 km Soil Moisture Active/Passive Derived Sea Surface Salinity L3) and JPLSMAP (Jet Propulsion Laboratory Soil Moisture Active/Passive Derived Sea Surface Salinity) products to identify sea surface temperature and sea surface salinity fronts along the California coast. Regarding sea surface temperature products, Cavalli [66,67] and Kartal [68], for example, exploited several products to analyze the prediction capabilities of different models. Regarding primary production products, Tilstone et al. [69], for example, analyzed some products of CMEMS.
In conclusion, some authors compared available products with each other to minimize errors or with retrieved data to validate them, whereas others utilized available products to provide a complete view of all variables. The overview not only highlighted how the authors of the eligible papers utilized them but also showed that there are many coastal parameters available online, therefore highlighting the increased need for remote data for monitoring coastal areas.
Developed Tools
This increased need was also highlighted by many tools for extracting and analyzing some coastal parameters, such as the Coastal Analyst System from Space Imagery Engine (CASSIE), and (Digital Shoreline Analysis System (DSAS). CASSIE was developed to map and analyze shorelines and is freely available from Google Earth Engine [70], while DSAS was developed by the Woods Hole Coastal and Marine Science Center “to calculate rate-of-change statistics from multiple historical shoreline positions” [71]. These tools, along with others that were developed to atmospherically correct multispectral data (e.g., ACOLITE, POLYMER, and SeaWiFS Data Analysis System), were widely exploited by the authors of the eligible papers (e.g., [53]).
3.3. Coastal Parameters Mapped and Monitored
A study of the eligible papers highlighted that the authors mapped or monitored 39 parameters. Their analysis also showed that some authors mapped only one parameter, whereas others mapped multiple parameters. These parameters are listed in alphabetical order in Table 3 (first column). The second column shows the number of papers that mapped or monitored the parameter. Among these papers, the number of papers that mapped only this parameter and the number of those that also mapped other parameters are listed in the third and fourth columns, respectively.
These parameters were mapped or monitored 1158 times in the 502 eligible papers: the authors of 138 papers mapped or monitored only one parameter, whereas the authors of the remaining 365 papers mapped or monitored several parameters together. Therefore, the authors of the remaining 365 papers analyzed the 39 parameters 1019 times. In other words, they analyzed an average of about three parameters in each research.
3.3.1. Algae and Macroalgae
The characteristics of the 40 eligible papers whose authors mapped algae or macroalgae are summarized in Table A1. The authors exploited 69 remote data and 4 products that were available online. Among the remote data, 65, 1, 2, and 1 were acquired from satellite, aircraft, UAV, and fixed platforms, respectively. Among them, 1 was obtained from an active sensor (Sentinel-1), and 65 were acquired from passive sensors. Among these remote data, 62 were retrieved from multispectral sensors (the first sensor utilized was Sentinel-2, followed by MODIS and Landsat sensors) and 6 were obtained from hyperspectral sensors (the first sensor utilized was Huanjing-1A).
Most of the papers (88%) monitored algae or macroalgae over time (e.g., [72]), about half of the papers (63%) compared different methods in order to minimize errors (e.g., [73]), and 58% retrieved the algae or macroalgae from several remote data (e.g., [74]). Moreover, four studies merged remote sensing techniques with models (e.g., Fernandes-Salvador et al. [75] used satellite data and the results of oceanographic modeling for forecasting toxic harmful algae for the Northeast Atlantic shellfish aquaculture industry) or Geographic information system (GIS) techniques and (e.g., Izadi et al. [76] employed GIS technique).
3.3.2. Aquaculture Systems
The characteristics of the 21 eligible papers whose authors mapped aquaculture systems are summarized in Table A2. The authors exploited 36 satellite data and did not use available products. Among the remote data, 33 were acquired from passive sensors and 3 were acquired from active sensors (Sentinel-1). Among the passive data, 30 were acquired from multispectral sensors (Sentinel-2 sensors were the first to be employed, followed by Landsat sensors) and 3 were retrieved from hyperspectral sensors (GaoFen5-HIS and ZY1-02D-HIS sensors).
Most of the papers (90%) monitored aquaculture systems over time (e.g., [77]), about half of the papers (48%) retrieved aquaculture systems from several remote data (e.g., Luo et al. [78] retrieved coastal aquaculture ponds from Google Earth, Landsat, and Sentinel-2 images), and 38% compared different methods (e.g., [79]). Moreover, three studies combined remote sensing techniques with models or GIS techniques (e.g., Cheng et al. [80] matched the retrieved maps using the GIS technique).
3.3.3. Aquatic Vegetation and Coral
The characteristics of the 19 eligible papers whose authors mapped the aquatic vegetation and coral are summarized in Table A3. The authors exploited 20 remote data, which were acquired from passive sensors and did not use products. Among the remote data, 11, 4, and 5 were acquired from satellite, aircraft, and UAV platforms, respectively. One was obtained from an active sensor (airborne LIDAR) and 19 data were acquired from passive sensors. Among these remote data, 18 were retrieved from multispectral sensors (Sentinel-2 and UAV sensors were the first to be employed, followed by Landsat sensors) and 1 was obtained from a hyperspectral airborne sensor (HyMap).
Most of the papers (84%) monitored aquatic vegetation or coral over time (e.g., [81]), about half of the papers (58%) compared different methods (e.g., [82]), and 32% retrieved these parameters from several remote data (e.g., Ade et al. [81] retrieved aquatic vegetation from HyMap and Sentinel-2 images). Moreover, one study combined the remote sensing technique with GIS techniques [82].
3.3.4. Bathymetry, Seabed, and Tidal Creeks
The characteristics of the 84 eligible papers whose authors mapped the bathymetry, seabed, and tidal creeks are summarized in Table A4. The authors exploited 96 remote data and 29 products that were available online. Among the remote data, 56, 17, 14, and 9 were acquired from satellite, airborne, UAV, and fix platforms, respectively. Among these data, 64 were acquired from passive sensors and 32 were acquired from active sensors (9, 15, and 8 were acquired from fixed positions, airborne LIDAR, and ICESat-2 sensors, respectively). Among the 64 data that were retrieved from passive sensors, 63 were obtained from multispectral sensors (Sentinel-2 sensors were the first to be employed, followed by MODIS and Landsat sensors) and 1 was obtained from a hyperspectral sensor (Zhuhai-1).
About half of the papers (58%) retrieved the bathymetry or seabed from several remote data (e.g., Zhang et al. [83] retrieved bathymetry not only from ICESat-2 and airborne LiDAR data but also from GaoFen-2, LandSat-8, and Sentinel-2 images), and 48% compared different methods to obtain results with the lowest error (e.g., [84]). Moreover, 18 papers merged the remote sensing technique with models or GIS techniques (e.g., Lebrec et al. [85] matched the retrieved maps using the GIS technique).
3.3.5. Chlorophyll-a
The characteristics of the 71 eligible papers whose authors mapped chlorophyll-a (Chl-a), which is the primary pigment of all types of phytoplankton [86], are summarized in Table A5. The authors exploited 76 remote data and 30 available products. All remote data were obtained from passive sensors (of them, 72, 1, 2, and 1 were acquired from satellite, aircraft, platforms, UAV, and fixed platforms, respectively). Among these remote data, 70 were acquired from multispectral sensors (Sentinel-2 sensors were the first to be employed, followed by MODIS, Sentinel-3, Landsat, MERIS, and WorldView sensors) and 6 were acquired from hyperspectral sensors (the HICO sensor was the first to be employed, followed by the PRISMA sensor).
About half of the papers (65%) monitored Chl-a concentrations over time (e.g., [69]), 49% compared different methods to obtain results with the lowest error (e.g., [87]), and 39% retrieved the Chl-a concentrations from several remote data (e.g., Masoud et al. [88] retrieved Chl-a concentrations from Landsat, Sentinel-2, and Sentinel-3 images and compared them with CMEMS products). Moreover, 9 papers merged remote sensing techniques with models or GIS techniques (e.g., Vaičiūtė et al. [89] also employed some data retrieved from the SHYFEM model and Izadi et al. [76] also employed the GIS technique).
3.3.6. Colored Dissolved Organic Matter
The characteristics of the 14 eligible papers whose authors mapped colored dissolved organic matter (CDOM), also called gelbstoffe, gilvin, or yellow matter [48], are summarized in Table A6. The authors exploited 26 remote data and 3 products that were available online. All remote data were obtained from multispectral satellite sensors (Sentinel-2 sensors were the first to be employed, followed by Sentinel-3, Landsat, and MODIS sensors).
Most of the papers (93%) monitored CDOM over time (e.g., [90]), 64% compared different methods to obtain results with the lowest error (e.g., [88]), and 57% retrieved CDOM from several remote data (e.g., [88]). Moreover, two papers merged remote sensing techniques with models or GIS techniques [75,86].
3.3.7. Current Data
The characteristics of the 20 eligible papers whose authors analyzed current data are summarized in Table A7. The authors exploited 2 remote data and 18 products that were available online. The remote data were obtained from active sensors: one was acquired from a satellite (Sentinel-1) and one was obtained from a fixed platform (OMNI buoys).
3.3.8. Depths of Secchi Disk and Euphotic Layer
The characteristics of the nine eligible papers whose authors mapped depths of Secchi disk (Zsd) and euphotic layer (Zeu) [48] are summarized in Table A8. The authors exploited 11 remote data and 2 products that were available online. All remote data were acquired from multispectral satellite sensors (Sentinel-2 sensors were the first to be employed, followed by MERIS and MODIS sensors).
All papers monitored these parameters over time (e.g., [93]), about half of the papers (67%) compared different methods or products in order to minimize errors (e.g., [94]), and 56% retrieved depths of Secchi disk and euphotic layer from several remote data (e.g., Yin et al. [95] retrieved Zeu from Landsat and Sentinel-3 data). Moreover, two papers merged remote sensing techniques with models or GIS techniques [76,96].
3.3.9. Diffuse Attenuation Coefficient at 490 nm
The characteristics of the 14 eligible papers whose authors mapped diffuse attenuation coefficient at 490 nm (Kd 490) [97] are summarized in Table A9. The authors exploited 13 remote data and 4 products that were available online. All remote data were acquired from multispectral satellite sensors. MODIS images were the first to be employed, followed by Sentinel-2 and then Sentinel-3 and Landsat data.
Most of these papers (93%) monitored this parameter over time (e.g., [95]), about half of the papers (63%) compared different methods or products in order to minimize errors (e.g., [98]), and 57% retrieved Kd (490) from several remote data (e.g., Joshi et al. [98] retrieved Kd (490) data from MODIS and SeaWiFS images). Moreover, three papers combined remote sensing techniques with models or GIS techniques (e.g., [76]).
3.3.10. Digital Surface Model
The characteristics of the 84 eligible papers whose authors mapped the digital surface model (DSM) are summarized in Table A10. The authors analyzed 60 remote data and 35 products that were available online. Among the remote data, 19, 13, 25, and 3 were acquired from satellite, airborne, UAV, and fixed platforms, respectively. Among these data, 50 were acquired from active sensors (airborne LIDAR sensors were the first to be employed, followed by Sentinel-1 sensors), whereas 10 were obtained from passive sensors (PLEIADES tri-stereo images were the first to be employed).
About half of the papers (58%) monitored DSM over time (e.g., [99]), 56% acquired data from several platforms (e.g., Grottoli et al. [100] retrieved DSM from fixed position, UAV, and airborne platforms), and 51% compared different methods to minimize errors (e.g., [101]) and different data and products (e.g., [99]). Moreover, 15 papers merged remote sensing techniques with models (e.g., [60]) or GIS techniques (e.g., [102]).
3.3.11. Dissolved Organic Carbon
The characteristics of the five eligible papers whose authors mapped dissolved organic carbon (DOC) [48] are summarized in Table A11. The authors exploited eight multispectral satellite data and did not use available products. The sensors utilized were MODIS, Landsat, Sentinel-2, and Sentinel-3.
Most of these papers (80%) monitored DOC over time (e.g., [103]), whereas 40% of the papers compared different methods to minimize errors (e.g., [104]) and exploited data that were acquired from several platforms (e.g., Liu et al. [105] retrieved DOC from Landsat, Sentinel-2, and Sentinel-3 images).
3.3.12. Dissolved Iron and Dissolved Oxygen
The characteristics of the four eligible papers whose authors mapped dissolved iron and dissolved oxygen (DO) [48] are summarized in Table A12. The analysis of the papers highlighted that they exploited three available products and one remote image (Sentinel-2 data [61]). All authors monitored dissolved iron and oxygen over time [61].
3.3.13. Flood Extent
The characteristics of the 10 eligible papers whose authors mapped flood extent are summarized in Table A13. The authors exploited nine remote data and five available products. The remote data were obtained from satellite sensors: four were acquired from active sensors (Sentinel-1), and five were acquired from passive sensors (Landsat sensors were the first to be employed).
Most of these papers (90%) monitored flood extent over time (e.g., [106]), about half of the papers (50%) compared different methods to obtain results with the lowest error (e.g., [107]), and 50% retrieved this parameter from several remote data (e.g., Vu et al. [108] retrieved the flood extent from ASAR, MODIS, and TerraSAR-X). Moreover, Munoz et al. [109] utilized the retrieved maps to calibrate hydrodynamic models, and Nguyen et al. [110] computed flood risk combining hazard, exposure, and vulnerability using hydrodynamic modeling.
3.3.14. Ice
The characteristics of the seven eligible papers whose authors mapped ice extent are summarized in Table A14. The authors utilized three remote data and five products that were available online. Among the remote data, two were acquired from passive satellite sensors (MODIS and Sentinel-2 sensors) and one was acquired from fixed platforms (coastal global navigation satellite system reflectometry).
3.3.15. Land Surface Temperature
The characteristics of the 11 eligible papers whose authors mapped land surface temperature (LST) are summarized in Table A15. The authors exploited 13 remote data and 2 available products. All remote data were acquired from multispectral satellite sensors (Landsat and MODIS sensors).
3.3.16. Land Use and Land Cover
The characteristics of the 152 eligible papers whose authors mapped land use and land cover (LU/LC) are summarized in Table A16. The authors analyzed 190 remote data and 16 available products. Among the remote data, 166, 10, 9, and 5 were acquired from satellite, airborne, UAV, and fixed platforms, respectively. Among these data, 6 were obtained from active sensors (GaoFen-3, Sentinel-1, and UVA sensors), whereas 190 were acquired from passive sensors. Among these data, 158 were acquired from multispectral sensors (Landsat sensors were the first to be employed, followed by Sentinel-2 sensors) and 17 were acquired from hyperspectral sensors (GaoFen-5-HIS sensor was the first to be employed).
Most of these papers (77%) monitored LU/LC over time using different remote data (e.g., [114]) and 54% of the papers retrieved this parameter from several remote data (e.g., [115]). Moreover, 23 papers combined remote data with models (e.g., Acharyya et al. [116] coupled SWAT and DSAS models for assessment of deltaic estuarine transformations of rivers and also simulated SWAT models using LU/LC and shoreline maps retrieved from remote data) or GIS (e.g., [117]).
3.3.17. Leaf Area Index
The characteristics of the five eligible papers whose authors mapped the leaf area index (LAI) [118] are summarized in Table A17. The authors exploited nine remote data and did not use available remote products. All data were acquired from passive sensors: eight were obtained from satellite sensors (Sentinel-2 sensors were the first to be employed, followed by Landsat sensors and then SPOT and WorldView sensors) and one was acquired from UAV multispectral sensors.
3.3.18. Mangroves
The characteristics of the 35 eligible papers whose authors mapped mangroves are summarized in Table A18. The authors analyzed 55 remote data and 6 products that were available online. Among the remote data, 52, 2, and 1 were acquired from satellite, airborne, and UAV platforms, respectively. Among these data, 4 were obtained from active sensors (ALOS-2 and Sentinel-1 data), whereas 48 were acquired from passive sensors. Among them, 44 were acquired from multispectral sensors (Landsat sensors were the first to be employed, followed by Sentinel-2 sensors) and 4 were acquired from hyperspectral sensors (GaoFen-5-HIS, HSI ZiYuan1-02D, Hyperion, and PRISMA sensors).
Most of these papers (77%) monitored mangroves over time (e.g., [121]), whereas 30% of the papers compared different data (e.g., [122]) and methods (e.g., [123]). Moreover, four papers combined remote data with models (e.g., Gitau et al. [124] estimated the flood extent in the delta using the hydrological model, and these data were compared with mangrove and vegetation cover maps) and GIS (e.g., [124]).
3.3.19. Marine Litter
The characteristics of the 14 eligible papers whose authors mapped marine litter (i.e., “items that have been made or used by people and deliberately discarded, unintentionally lost, or transported by winds and rivers, into the sea and on beaches” [125]) are summarized in Table A19. The authors analyzed 14 remote data and 1 available product. Among the remote data, 4, 2, 7, and 1 were acquired from satellite, airborne, UAV, and fixed platforms, respectively. Among these data, one was obtained from an active sensor (GNSS-R systems) in the laboratory, whereas 13 were acquired from passive sensors. Among these data, 11 were acquired from multispectral sensors (UAV multispectral sensors were the first to be employed) and 2 were acquired from hyperspectral sensors (UAV hyperspectral and PRISMA sensors).
3.3.20. “Fires and Thermal Anomalies”, Nightlight, and Nighttime Light Intensity
The characteristics of the five eligible papers whose authors analyzed “fires and thermal anomalies”, nightlight, and nighttime light intensity are summarized in Table A20. The authors did not retrieve maps from remote data and exploited five available products that were provided by the Visible Infrared Imaging Radiometer Suite.
3.3.21. Methane and Oil
The characteristics of the 10 eligible papers whose authors mapped methane and oil are summarized in Table A21. The authors analyzed 17 remote data and did not use available products. Among the remote data, 14, 1, and 2 were acquired from satellite, UAV, and fixed platforms, respectively. Among these data, 11 were obtained from active sensors (Sentinel-1 sensors were the first to be employed), whereas 5 were acquired from multispectral sensors (Landsat, Sentinel-2, WorldView sensors).
3.3.22. Particulate Organic Carbon
The characteristics of the five eligible papers whose authors mapped particulate organic carbon (POC) [48] are summarized in Table A22. The authors analyzed seven available remote products and did not retrieve the maps from remote data.
Four papers monitored POC over time, compared different methods or products in order to minimize errors, and combined remote data with models or GIS (e.g., [98]).
3.3.23. Photosynthetically Active Radiation
The characteristics of the six eligible papers whose authors mapped photosynthetically active radiation (PAR) (i.e., the flux density of photons in the 400–700 nm waveband incident per unit time on a unit surface [132]) are summarized in Table A23. The authors analyzed six available products and did not retrieve maps from remote data.
All papers monitored PAR over time, and one study compared different methods and different products [133].
3.3.24. Phycocyanin
3.3.25. Plumes
The characteristics of the nine eligible papers whose authors mapped plumes are summarized in Table A25. The authors analyzed 17 remote data and 1 available product. Among the remote data, 16 and 1 were acquired from satellite and fixed platforms, respectively. All remote data were acquired from multispectral sensors (Landsat sensors were the first to be employed, followed by Sentinel-3 and MODIS and then MERIS and SeaWiFS sensors). All authors compared different remote data and monitored plumes over time (e.g., [135]).
3.3.26. Primary Production
3.3.27. Salt Marshes
The characteristics of the nine eligible papers whose authors mapped salt marshes are summarized in Table A27. The authors analyzed 13 remote data and did not use available products. Among the remote data, 9, 2, and 2 were acquired from satellite, UAV, and fixed platforms, respectively. Among these data, 4 were obtained from active sensors (Sentinel-1 and UAV LIDAR), whereas 9 were acquired from passive sensors. Among them, 8 were acquired from multispectral sensors (Sentinel-2 sensors were the first to be employed) and 1 was acquired from a hyperspectral sensor (ASD portable).
All papers monitored salt marshes over time (e.g., [140]), whereas about half of the papers (56%) compared different methods to minimize errors (e.g., [141]) and 56% retrieved this parameter from several remote data (e.g., [142]). Moreover, Zhang et al. [55] evaluated the invasion process, ecological impact, and coastal protection function of Spartina alterniflora using the saltmarsh classification and hydrodynamic modeling.
3.3.28. Sea Level Anomaly and Sea Level Rise
The characteristics of the 46 eligible papers whose authors mapped sea level anomaly (SLA) and sea level rise (SLR) are summarized in Table A28. The authors analyzed 7 remote data and 53 available products. Among the remote data, 3 and 1 were acquired from satellite and fixed platforms, respectively. All these data were obtained from active sensors (global navigation satellite systems were the first to be employed, followed by Jason-3 altimeter).
Most of these papers (70%) monitored SLA or SLR over time (e.g., [143]), whereas 26% of the papers compared different methods (e.g., [144]) and 33% retrieved these parameters from several remote data or used several available products (e.g., [145]). Moreover, eight papers combined remote data with models (e.g., Tsiaras et al. [146] assimilated SLA and SST data in the hydrodynamic model) or GIS (e.g., [147]).
3.3.29. Sea Surface Salinity
The characteristics of the 17 eligible papers whose authors mapped sea surface salinity (SSS) are summarized in Table A29. The authors analyzed 1 remote data and 16 available products. The remote data were acquired from an active satellite sensor (GNSS-R). Most of these papers (88%) monitored SSS over time (e.g., [148]).
3.3.30. Sea Surface Temperature
The characteristics of the 59 eligible papers whose authors mapped sea surface temperature (SST) are summarized in Table A30. The authors analyzed 32 remote data and 52 available products. Among the remote data, 30, 1, and 1 data were acquired from satellite, airborne, and UAV platforms, respectively. All remote data were acquired from multispectral sensors (MODIS sensors were the first to be employed, followed by Landsat sensors).
Most of these papers (88%) monitored SST over time (e.g., [149]), whereas about half of the papers (54%) retrieved SST from several remote data (e.g., [68]) and 46% compared different methods to obtain results with the lowest error (e.g., [68]). Moreover, 13 papers combined remote data with models (e.g., [146]) or GIS (e.g., [76]).
3.3.31. Shoreline
The characteristics of the 112 eligible papers whose authors mapped shorelines are summarized in Table A31. The authors analyzed 204 remote data and 6 available products. Among the remote data, 152, 29, 18, and 5 were acquired from satellite, airborne, UAV, and fixed platforms, respectively. Among these data, 17 were obtained from active sensors (Sentinel-1 sensors were the first to be employed, followed by GaoFen-3 and airborne LIDAR sensors), whereas 185 were acquired from passive sensors. Among the remote data, 183 were acquired from multispectral sensors (Landsat sensors were the first to be employed, followed by Sentinel-2 sensors) and 1 was acquired from a hyperspectral sensor (his ZiYuan1-02D sensor).
3.3.32. Soil Salinization and Soil Moisture
The characteristics of the 10 eligible papers whose authors analyzed soil salinization and soil moisture are summarized in Table A32. The authors analyzed 12 remote data and did not use available products. Among the remote data, 9, 1, and 2 were acquired from satellite, UAV, and fixed platforms, respectively. Among the remote data, 11 were acquired from multispectral sensors (Landsat and MODIS sensors were the first to be employed) and 1 was acquired from a hyperspectral sensor (ASD portable).
Most of the papers (70%) monitored soil salinization over time (e.g., [155]), whereas about half of the papers (60%) compared different methods to obtain results with the lowest error (e.g., [156]) and 30% retrieved this parameter from several remote data (e.g., [125]). Moreover, one paper also used models [113].
3.3.33. Suspended Sediments
The characteristics of the 30 eligible papers whose authors mapped suspended sediments are summarized in Table A33. In these papers, the concentrations of suspended sediments in the water column were quantified using different analytical methods (e.g., suspended particulate matter (SPM), suspended sediment concentrations (SSCs), and total suspended matter (TSM) [125]). The authors analyzed 55 remote data and 13 available products. Among the remote data, 49, 2, 3, and 1 were acquired from satellite, airborne, UAV, and fixed platforms, respectively. All these data were acquired from passive sensors. Among the remote data, 51 were acquired from multispectral sensors (Landsat and Sentinel-2 sensors were the first to be employed) and 3 were acquired from hyperspectral sensors (airborne hyperspectral sensors and ASD portable).
3.3.34. Tidal Data
The characteristics of the 27 eligible papers whose authors analyzed tidal data are summarized in Table A34. The authors analyzed 7 remote data and 26 available products. Among the remote data, 5, 1, and 1 were acquired from satellite, airborne, and fixed platforms, respectively. All these remote data were obtained from active sensors.
3.3.35. Vegetation Cover
The characteristics of the 98 eligible papers whose authors mapped vegetation cover are summarized in Table A35. The authors analyzed 130 remote data and 3 available products. Among the remote data, 103, 7, 19, and 1 were acquired from satellite, airborne, UAV, and fixed platforms, respectively. Among these data, 8 were obtained from active sensors (UAV LIDAR sensors were the first to be employed, followed by Sentinel-1 sensors), whereas 124 were acquired from passive sensors. Among the remote data, 118 were acquired from multispectral sensors (Landsat sensors were the first to be employed, followed by Sentinel-2 and UAV sensors) and 4 were acquired from hyperspectral sensors (airborne, Hyperion, and PRISMA sensors).
Most of these papers (73%) monitored vegetation cover over time (e.g., [160]), whereas about half of the papers (60%) compared different methods (e.g., [161]) and 42% retrieved this parameter from several remote data (e.g., [123]). Moreover, three papers combined remote data with models (e.g., [162]) or GIS (e.g., [163]).
3.3.36. Vegetation Species
The characteristics of the 19 eligible papers whose authors mapped vegetation species are summarized in Table A36. The authors analyzed 30 remote data and did not use available products. Among the remote data, 24, 1, and 5 were acquired from satellite, airborne, and fixed platforms, respectively. Among these data, 5 were obtained from active sensors (ALOS-2, Sentinel-1, and UAV sensors), whereas 25 were acquired from passive sensors. Among the remote data, 24 images were acquired from multispectral sensors (Landsat and Sentinel-2 sensors were the first to be employed) and 1 image was acquired from a hyperspectral sensor (ZiYuan1-02D-HIS).
Most of these papers (79%) monitored vegetation species over time (e.g., [164]), whereas about half of the papers (58%) compared different methods or products to obtain results with the lowest error (e.g., [165]) and 53% retrieved this parameter from several remote data (e.g., [161]). Moreover, one paper combined GIS and remote sensing techniques [166].
3.3.37. Water Turbidity
The characteristics of the 17 eligible papers whose authors mapped water turbidity [48] are summarized in Table A37. The authors analyzed 15 remote data and 6 available products. All remote data were acquired from multispectral satellite sensors (Sentinel-2 sensors were the first to be employed, followed by Landsat sensors and then Sentinel-3 and MODIS sensors).
Most of these papers (82%) monitored water turbidity over time (e.g., [167]), whereas about half of the papers (76%) compared different methods or different products to obtain results with the lowest error (e.g., [53]) and 47% retrieved this parameter from several remote data (e.g., [168]). Moreover, five papers combined remote sensing techniques with models (e.g., [169]) or GIS techniques (e.g., [76]).
3.3.38. Wave Data
The characteristics of the nine eligible papers whose authors analyzed wave data are summarized in Table A38. The authors of these nine papers analyzed one remote data and eight available products. The remote data was acquired from an active sensor that was installed on a fixed platform.
3.3.39. Wind Data
The characteristics of the 39 eligible papers whose authors analyzed wind data are summarized in Table A39. The authors of these 39 papers analyzed 4 remote data and 37 available products. All these data were obtained from active sensors. Among the remote data, 3, and 1 were acquired from satellite (Sentinel-1) and fixed platforms, respectively.
Most of the papers (79%) monitored wind data over time (e.g., [153]), whereas 41% retrieved this parameter from several remote data (e.g., [172]) and 38% compared different methods or different products to minimize errors (e.g., [173]). Moreover, 13 papers combined remote sensing techniques with models (e.g., [59]) or GIS techniques (e.g., [102]).
3.4. Coastal Phenomena Analized
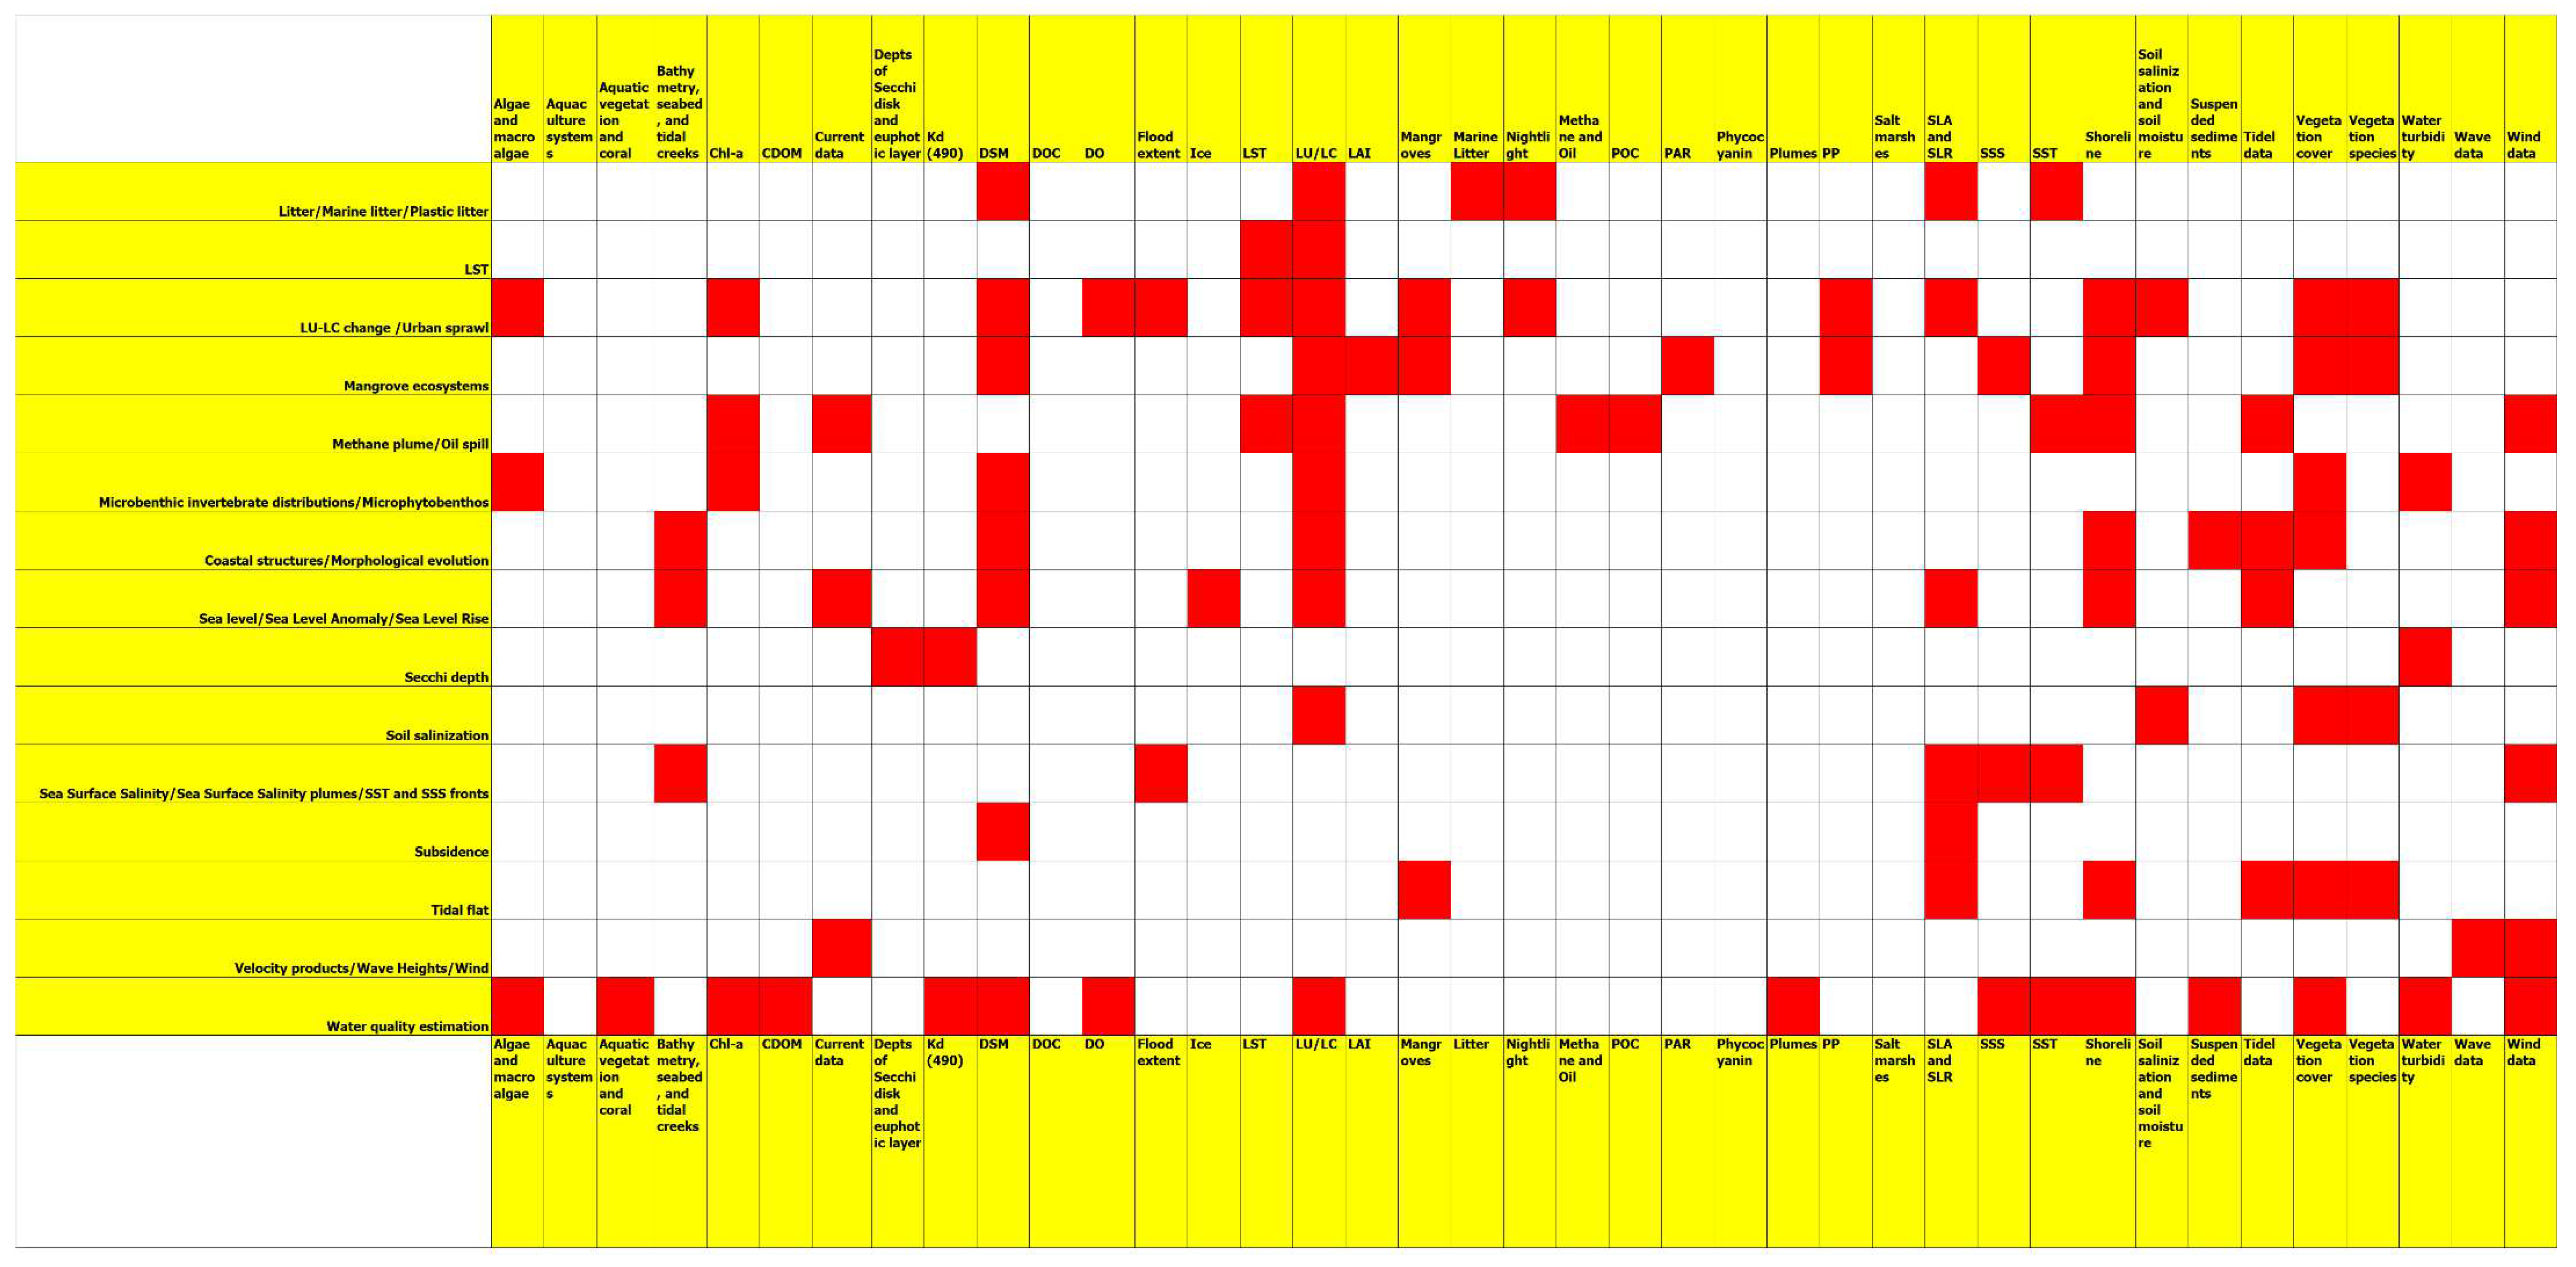
The analysis of the papers highlighted that the authors mapped or monitored 39 parameters to study 103 coastal phenomena, which are listed in the second column of Table A1, Table A2, Table A3, Table A4, Table A5, Table A6, Table A7, Table A8, Table A9, Table A10, Table A11, Table A12, Table A13, Table A14, Table A15, Table A16, Table A17, Table A18, Table A19, Table A20, Table A21, Table A22, Table A23, Table A24, Table A25, Table A26, Table A27, Table A28, Table A29, Table A30, Table A31, Table A32, Table A33, Table A34, Table A35, Table A36, Table A37, Table A38 and Table A39. It is important to specify that all the “purposes” of eligible papers are grouped generically with the name “phenomenon”, but not all of them can be called as such (e.g., atmospheric correction). As mentioned above, since 1971, the coastal zone has been mapped and monitored using remote data. Therefore, to identify coastal phenomena and parameters to be analyzed, researchers have considered both the state of the art and outstanding research challenges. Moreover, because most of the eligible papers (89%) were funded by international institutions and local governments, the choice of the phenomena analyzed was made not only by the scientific community but also by the policy-making community. Therefore, most of the phenomena affecting coastal areas were taken into account by the eligible papers. In Figure 2, the red cells show each parameter that was mapped or monitored (columns) to study each phenomenon (rows). Table A1, Table A2, Table A3, Table A4, Table A5, Table A6, Table A7, Table A8, Table A9, Table A10, Table A11, Table A12, Table A13, Table A14, Table A15, Table A16, Table A17, Table A18, Table A19, Table A20, Table A21, Table A22, Table A23, Table A24, Table A25, Table A26, Table A27, Table A28, Table A29, Table A30, Table A31, Table A32, Table A33, Table A34, Table A35, Table A36, Table A37, Table A38 and Table A39 and Figure 2 lists the names assigned by the authors to the phenomena analyzed. The phenomena that were mapped or monitored using the same parameters are grouped together. The 47 phenomena or groups of phenomena that were derived are shown in Figure 2.
The analysis of parameters according to the number of phenomena showed that the most mapped parameters were LU/LC, SST, bathymetry, and seabed, whereas the least mapped parameters were phycocyanin, soil salinization, and methane/oil (Figure 3).
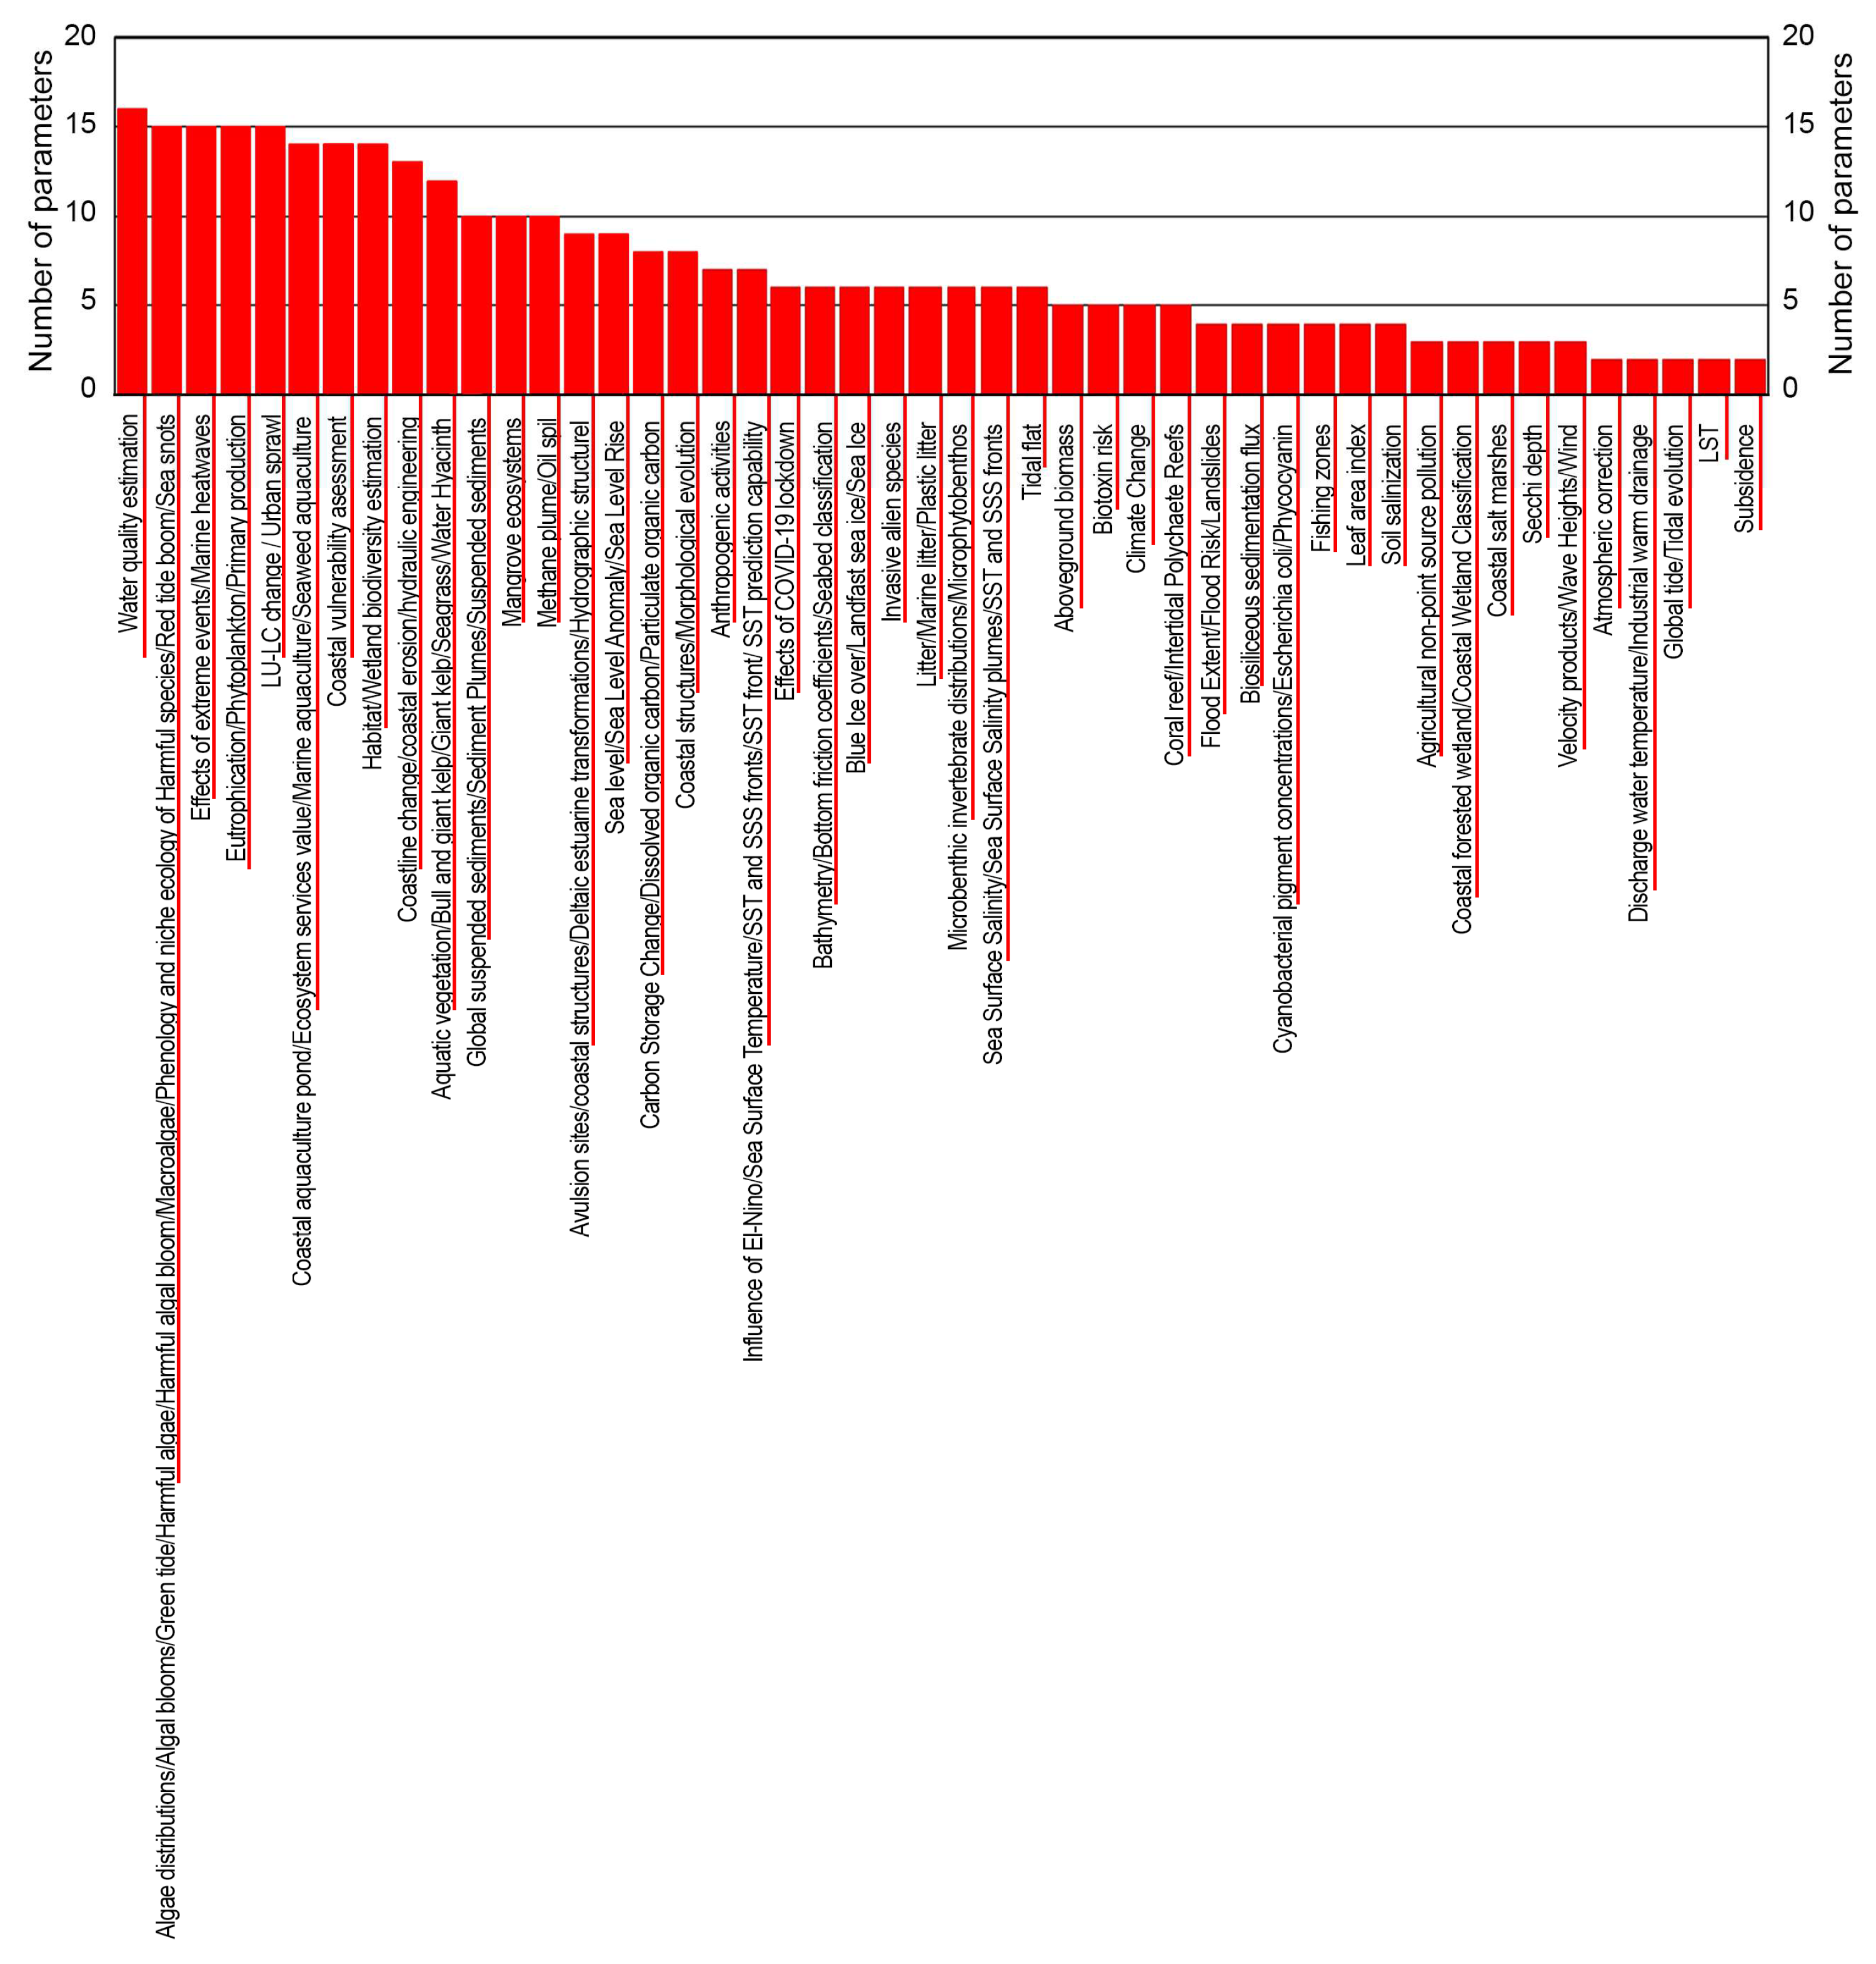
On the other hand, the analysis of phenomena according to the number of parameters showed that 36 phenomena were examined by mapping or monitoring more than 10 parameters (Figure 4).
It is very interesting to note that phenomena that mainly affect the coastal land were also analyzed by mapping or monitoring parameters of coastal water. LU/LC change and urban sprawl were also analyzed using algae or macroalgae, Chl-a, PP, SLA, or SLR maps, and water quality was also estimated using LU/LC and vegetation cover maps. Because the number of phenomena analyzed by the authors of eligible papers is very large, analysis of the number of phenomena according to the number of authors who examined them is of little value. However, the most studied phenomenon was coastline change and coastal erosion (15.9%), followed by the group including bathymetry, bottom friction coefficients, and seabed classification (8.6%) and then two other groups (8.2% and 7.3%, respectively): (i) habitat and wetland biodiversity estimation and (ii) LU/LC change and urban sprawl.
3.5. Validation of Retrieved Products
Analysis of the papers revealed another important issue: most authors (91%) validated the parameters that were retrieved from remote data. The term validation is defined as “the process of assessing, by independent means, the quality of the data products derived from the system outputs” by the Working Group on Calibration and Validation of the Committee on Earth Observing Satellites [174]. “Ground truth” or “reference data”, which are provided by independent means, are usually compared with “data products” to assess their “degree of correctness” or accuracy [175].
Therefore, only a few did not validate the parameters that were retrieved from remote data; for example, Barreto et al. [176] exploited a UAV system to monitor the marine megafauna, Bera et al. [177] analyzed socioeconomic vulnerability of Sagar Island (India) and linked it with land loss, and Shimada et al. [178] studied the parameters that determine the habitat of two important green turtle nests in the Red Sea.
4. Discussions
Coastal areas are the most valuable on Earth but also the most vulnerable because of many phenomena or processes looming over them [9]. To date, the main phenomena looming over them are climate change and coastal urban sprawl, which are closely interrelated and trigger many others [7,8]. Therefore, mapping and monitoring coastal phenomena and parameters are the most pressing requirements for ensuring sustainability of these valuable and vulnerable areas [9]. However, coastal areas are characterized by small-scale mosaics of different habitats and are mainly affected by small-scale natural or man-made phenomena, while coastal waters are characterized by high spatial and temporal variability of biochemical and physical parameters [48].
Remote sensing has taken up the challenge of characterizing these differences since 1971 and, to date, has become an indispensable tool for mapping and monitoring some phenomena (e.g., seal level rise and sea surface temperature [12,13]). As many updated reviews have provided a limited overview (e.g., [37,41]), this systematic review provides a comprehensive overview of data, methods, and/or remote approaches that map and monitor coastal zone phenomena and parameters more effectively. For this purpose, 502 eligible papers, which consisted of the most cited papers published from January 2021 to June 2023, were identified, screened, and carefully studied.
The analysis of 502 eligible papers highlighted that 103 phenomena were analyzed using 39 parameters. Therefore, most of the phenomena and parameters of coastal areas were mapped or monitored by the eligible papers. This wide variety of phenomena and parameters is strongly related to the key role of the coastal zone in social, economic, and environmental systems and the key role of the remote sensing technique to know, map, and monitor coastal phenomena and parameters. The eligible papers demonstrated that these key roles are clear not only to the scientific community, which published 15,141 papers in 2.5 years, but also to the policy-making community, which founded 89% of the eligible papers.
The phenomena most analyzed by the authors of the eligible papers were changes in coastline and land use and cover, climate change, coastal erosion, and coastal urban sprawl. However, it is very interesting to note that the phenomena analyzed covered multiple and diverse issues: some phenomena were general phenomena (e.g., anthropogenic activities, climate change, coastal erosion, coastal vulnerability assessment, urban sprawl, and water quality estimation); some were very specific (e.g., aboveground biomass, biotoxin risk, blue ice, hydraulic engineering, and leaf area index monitoring); some were more pertinent to coastal land (e.g., land surface temperature, land use and land cover changes, soil salinization, and urban sprawl), coastal waters (e.g., coral reef, depth of Secchi disk, sea surface salinity, and sea surface temperature), and intertidal zone (e.g., coastline changes, mangrove ecosystems, and tidal flat); and some addressed pollution (e.g., marine litter, methane plume, oil spill, and plastic litter) or the socioeconomic aspect of the coastal zone (e.g., coastal aquaculture pond, ecosystem services value, fishing zones, and marine aquaculture). Although there was variability in the phenomena analyzed, most of the phenomena were analyzed using the same parameters.
In order to more effectively analyze coastal zone phenomena and parameters, the authors validated most of the parameters (91%) that were retrieved or analyzed them by comparing them with reference data in order to assess their degree of correctness [85]. For this purpose, they exploited in situ data, products that were obtained from very high spatial resolution images, or validated products. The authors retrieved from remote data 39 parameters that were mapped or monitored 1158 times in the 502 eligible papers. In other words, the authors combined most of the parameters (88%) together with other parameters in order to analyze coastal phenomena. In addition, phenomena mainly affecting coastal land were analyzed not only by mapping parameters related to coastal land but also using parameters related to coastal waters and vice versa. The authors monitored 75% of the parameters over time and retrieved 69% of the parameters from several remote data and compared the results with each other and with available products. The authors combined different remote data: they were acquired from active (15% of the remote data) and passive (15% of the remote data) sensors; from satellites (79% of remote data), aircraft (7% of remote data), unmanned aerial vehicles (10% of remote data), and fixed platforms (4% of remote data); and from multispectral (95% of the passive data) and hyperspectral (5% of the passive data) sensors. The authors obtained 48% of the parameters using different methods, and their results were compared with each other and with available products. Moreover, the authors combined 17% of the parameters that were retrieved from remote data with geographic information system and model techniques.
Although this systematic review included 502 eligible papers that were the most cited and up to date, it cannot and does not claim to be totally comprehensive of a very broad topic.
5. Conclusions
This systematic review addressed three important questions, which lack up-to-date and effective answers: (1) Which coastal zone phenomena and parameters can be adequately mapped and monitored using remote data? (2) How have authors addressed the spatial, temporal, and thematic requirements required to more effectively analyze coastal zone phenomena and parameters? (3) What recommendations can be offered to readers to meet spatial, temporal, and thematic requirements?
Regarding the first question, the systematic review demonstrated that most coastal phenomena and parameters, to date, can be mapped and monitored using remote data.
Regarding the second question, 502 eligible papers showed that authors addressed these requirements in six ways and many of them were performed jointly, with authors found to have (i) retrieved parameters from different remote data (69%), (ii) validated the parameters retrieved (91%), (iii) merged different data and parameters (88%), (iv) monitored these different data and parameters over time (75%), (v) compared different methods (48%), and (vi) combined geographic information system, models, and remote sensing techniques (17%). In other words, the authors addressed the spatial, temporal, and thematic requirements needed to more effectively analyze coastal phenomena and parameters using and implementing the integrated approaches.
Therefore, regarding the third question, the systematic review recommends employing and implementing new and creative integrated approaches.
Funding
This research received no external funding.
Data Availability Statement
Not applicable.
Acknowledgments
I would like to thank the anonymous reviewers whose comments and suggestions helped to improve the final manuscript. Special thanks to MDPI editors.
Conflicts of Interest
The author declares no conflicts of interest.
Appendix A
The characteristics of the eligible papers whose authors analyzed 39 parameters are summarized in Table A1, Table A2, Table A3, Table A4, Table A5, Table A6, Table A7, Table A8, Table A9, Table A10, Table A11, Table A12, Table A13, Table A14, Table A15, Table A16, Table A17, Table A18, Table A19, Table A20, Table A21, Table A22, Table A23, Table A24, Table A25, Table A26, Table A27, Table A28, Table A29, Table A30, Table A31, Table A32, Table A33, Table A34, Table A35, Table A36, Table A37, Table A38 and Table A39. In each table, the eligible papers are organized according to the phenomenon analyzed (second column), remote data employed (third column), and/or available products employed (fourth column). All the “purposes” of the papers for which parameters were analyzed are grouped generically with the name “phenomenon”, but not all of them can be called as such (i.e., atmospheric correction). The names of phenomena (i.e., purposes) given in the tables are those assigned by the authors of the eligible papers. Columns 5, 6, and 7 provide the references of these papers, showing those that were published in 2023, 2022, and 2021, respectively. In addition, these tables highlight two other characteristics using the numbers 1 and 2 in parentheses (i.e., (1) and (2)) as follows: (1) the analyzed parameter was mapped and monitored together with other parameters and (2) the analyzed parameter was retrieved using hyperspectral data. Each of the following tables describe the characteristics of the papers according to the analyzed parameters.

Table A1.
The eligible papers that mapped and/or monitored algae and macroalgae.
| Parameter | Phenomena | Remote Data or Dataset | Available Products | References 2023 | References 2022 | References 2021 |
|---|---|---|---|---|---|---|
| Algae | Algae distribution | Sentinel-2 (10–20–60 m) | No | - | - | [179] |
| Algae (1) | Algal blooms | Landsat (15–30 m) | No | [72] | - | - |
| Algae (1) | Cyanobacterial pigment concentrations | HICO™ (Hyperspectral Imager for the Coastal Ocean, ~90 m) (2) | No | - | [180] | - |
| Algae (1) | Cyanobacterial pigment concentrations | Landsat (15–30 m) | No | - | - | [89] |
| Algae | Cyanobacterial pigment concentrations | MERIS (300 m) | No | - | - | [89,181] |
| Algae (1) | Cyanobacterial pigment concentrations | MODIS (0.5–1 km) | No | - | - | [182] |
| Algae (1) | Cyanobacterial pigment concentrations | Sentinel-2 (10–20–60 m) | No | - | - | [89,183] |
| Algae | Cyanobacterial pigment concentrations | Sentinel-3 (300 m) | No | - | - | [89,181] |
| Algae (1) | Coastal aquaculture ponds | Sentinel-2 (10–20–60 m) | No | - | [77,79] | - |
| Algae (1) | Harmful algae | MODIS (0.5–1 km) | No | [184] | - | [76] |
| Algae (1) | Harmful algae | Sentinel-3 (300 m) | No | - | [185] | |
| Algae | Red tide bloom | GaoFen-1 WFV (16 m) | No | - | [186] | [187] |
| Algae | Red tide bloom | HY-1D (50 m) | No | - | [186] | [187] |
| Algae (1) | Red tide bloom | Landsat (15–30 m) | No | - | [188] | - |
| Algae | Red tide bloom | MODIS (0.5–1 km) | No | - | [186] | - |
| Algae | Red tide bloom | Sentinel-2 (10–20–60 m) | No | [57] | [186] | - |
| Algae | Red tide bloom | Sentinel-3 (300 m) | No | [57] | - | - |
| Algae (1) | Red tide bloom | TechDemoSat-1 (TDS-1) GNSS-R | No | - | [188] | - |
| Algae | Sea snots | DESIS (30 m) (2) | No | - | [189] | - |
| Algae | Sea snots | MODIS (0.5–1 km) | No | - | [189] | - |
| Algae (1) | Sea snots | Sentinel-2 (10–20–60 m) | No | - | [190] | - |
| Algae | Sea snots | Sentinel-3 (300 m) | No | - | [189] | - |
| Algae (1) | Water quality estimation | Landsat (15–30 m) | No | - | [191] | - |
| Algae (1) | Water quality estimation | Sentinel-2 (10–20–60 m) | No | - | [191] | [192] |
| Algae (1) | Wetland biodiversity estimation | HSI ZiYuan1-02D (30 m) (2) | No | - | - | [193] |
| Macroalgae (1) | Green tides | Aerial photos | No | - | - | [194] |
| Macroalgae | Green tides | GaoFen-1 (2–8 m) | No | - | - | [74,195] |
| Macroalgae | Green tides | Geostationary Ocean Color Imager -GOCI (500 m) | No | - | - | [196] |
| Macroalgae | Green tides | Huanjing-1A (30–100 m) (2) | No | - | - | [74,195,197] |
| Macroalgae | Green tides | Huanjing-1B (150–300 m) | No | - | - | [74,195,197] |
| Macroalgae | Green tides | Landsat (15–30 m) | No | - | - | [195,197,198] |
| Macroalgae (1) | Green tides | Landsat (15–30 m) | No | - | [199] | [194,200] |
| Macroalgae | Green tides | MODIS (0.5–1 km) | No | [41] | - | [74,195,200] |
| Macroalgae (1) | Green tides | Sentinel-2 (10–20–60 m) | No | - | [199] | [74] |
| Macroalgae | Green tides | Sentinel-2 (10–20–60 m) | No | - | - | [74,195] |
| Macroalgae | Macroalgae | Portable photo camera | No | - | - | [201] |
| Macroalgae | Macroalgae | MODIS (0.5–1 km) | No | [73] | - | - |
| Macroalgae (1) | Macroalgae | MODIS (0.5–1 km) | No | [202] | [203] | [204] |
| Macroalgae (1) | Macroalgae | Sentinel-1 (~10 m) | No | - | [203] | - |
| Macroalgae | Macroalgae | Sentinel-2 (10–20–60 m) | No | - | [205] | - |
| Macroalgae (1) | Macroalgae | Sentinel-3 (300 m) | No | - | [206] | - |
| Macroalgae (1) | Macroalgae | UAV | No | - | [207] | - |
| Macroalgae (1) | Microphytobenthos | Sentinel-2 (10–20–60 m) | No | - | [208] | - |
| Macroalgae | Phytoplankton blooms | Sentinel-3 (300 m) | No | [73] | - | - |
| Macroalgae | Phytoplankton blooms | Visible Infrared Imaging Radiometer Suite (VIIRS) | Yes | [73] | - | - |
| Macroalgae (1) | Seagrass | UAV | No | - | [207] | - |
(1) This parameter was mapped and monitored together with other parameters; (2) hyperspectral data.
Table A2.
The eligible papers that mapped and/or monitored aquaculture systems.
| Parameter | Phenomena | Remote Data or Dataset | Available Products | References 2023 | References 2022 | References 2021 |
|---|---|---|---|---|---|---|
| Aquaculture (1) | Coastal aquaculture ponds | Google Earth images | No | - | [78] | - |
| Aquaculture | Coastal aquaculture ponds | Landsat (15–30 m) | No | - | [209] | [210] |
| Aquaculture (1) | Coastal aquaculture ponds | Landsat (15–30 m) | No | - | [78,79] | - |
| Aquaculture | Coastal aquaculture ponds | Sentinel-1 (~10 m) | No | - | - | [211] |
| Aquaculture | Coastal aquaculture ponds | Sentinel-2 (10–20–60 m) | No | - | - | [211] |
| Aquaculture (1) | Coastal aquaculture ponds | Sentinel-2 (10–20–60 m) | No | [212] | [77,78,79] | - |
| Aquaculture (1) | Coastline change | Landsat (15–30 m) | No | - | [213] | [117,214] |
| Aquaculture (1) | Habitat | Sentinel-1 (~10 m) | No | [165,215] | - | - |
| Aquaculture (1) | Habitat | Sentinel-2 (10–20–60 m) | No | [215] | - | - |
| Aquaculture (1) | Ecosystem services value | Landsat (15–30 m) | No | - | - | [216] |
| Aquaculture (1) | LU/LC change | Landsat (15–30 m) | - | - | [217] | |
| Aquaculture (1) | LU/LC change | Aerial photos | No | [218] | - | |
| Aquaculture (1) | LU/LC change | GaoFen5-HIS (30 m) (2) | No | - | [219] | - |
| Aquaculture (1) | LU/LC change | Landsat (15–30 m) | No | - | [218,220] | [217] |
| Aquaculture (1) | LU/LC change | Sentinel-2 (10–20–60 m) | No | - | [219,220] | - |
| Aquaculture (1) | LU/LC change | SPOT (~10–20 m) | - | - | [217] | |
| Aquaculture | Marine aquaculture | GaoFen-1 WFV (16 m) | No | - | - | [221] |
| Aquaculture | Marine aquaculture | Landsat (15–30 m) | No | - | - | [221] |
| Aquaculture | Marine aquaculture | Sentinel-2 (10–20–60 m) | No | - | - | [221] |
| Aquaculture | Marine aquaculture | ZY1-02D-HIS (30 m) (2) | No | - | [222] | - |
| Aquaculture (1) | Seaweed aquaculture | HY-1C (50 m) | No | - | [80] | - |
| Aquaculture (1) | Seaweed aquaculture | Sentinel-1 (~10 m) | No | - | [223] | - |
| Aquaculture (1) | Seaweed aquaculture | Sentinel-2 (10–20–60 m) | No | - | [80,223] | - |
(1) This parameter was mapped and monitored together with other parameters; (2) hyperspectral data.
Table A3.
The eligible papers that mapped and/or monitored aquatic vegetation and coral.
| Parameter | Phenomena | Remote Data or Dataset | Available Products | References 2023 | References 2022 | References 2021 |
|---|---|---|---|---|---|---|
| Aquatic vegetation (1) | Aquatic vegetation | HyMap airborne (2) | No | - | [81] | - |
| Aquatic vegetation (1) | Aquatic vegetation | Sentinel-2 (10–20–60 m) | No | - | [81,160,224] | - |
| Aquatic vegetation (1) | Water hyacinth | Sentinel-2 (10–20–60 m) | No | - | [160] | - |
| Aquatic vegetation (1) | Water quality estimation | Sentinel-2 (10–20–60 m) | No | - | [160] | - |
| Coral (1) | Coral reef | Airborne data (2 m) | No | [225] | - | |
| Coral (1) | Intertidal polychaete reefs | UAV-MSI | No | - | [82] | - |
| Giant kelp (1) | Bull and giant kelp | Landsat (15–30 m) | No | - | - | [226] |
| Giant kelp (1) | Giant kelp | Landsat (15–30 m) | No | - | [227] | - |
| Giant kelp (1) | Giant kelp | Sentinel-2 (10–20–60 m) | No | - | - | [228] |
| Giant kelp (1) | Giant kelp | UAV | No | - | - | [229] |
| Seagrass (1) | Habitat | Remotely piloted aircraft (RPAs) | No | - | - | [230] |
| Seagrass (1) | Macroalgae | UAV | No | - | [207] | - |
| Seagrass (1) | Seabed classification | Airborne lidar | No | - | [231] | - |
| Seagrass (1) | Seagrass | Landsat (15–30 m) | No | - | [232,233] | - |
| Seagrass (1) | Seagrass | Sentinel-2 (10–20–60 m) | No | - | [234] | - |
| Seagrass (1) | Seagrass | UAV | No | - | [207] | - |
| Seagrass (1) | Seagrass | WorldView 2–3 (~0.5–4 m) | No | [235] | [236] | - |
(1) This parameter was mapped and monitored together with other parameters; (2) hyperspectral data.
Table A4.
The eligible papers that mapped and/or monitored the bathymetry, seabed, and tidal creeks.
Table A4.
The eligible papers that mapped and/or monitored the bathymetry, seabed, and tidal creeks.
| Parameter | Phenomena | Remote Data or Dataset | Available Products | References 2023 | References 2022 | References 2021 |
|---|---|---|---|---|---|---|
| Bathymetry (1) | Aquatic vegetation | Sentinel-2 (10–20–60 m) | No | - | [224] | - |
| Bathymetry (1) | Bathymetry | Airborne lidar | No | [237] | [238,239] | - |
| Bathymetry | Bathymetry | Airborne lidar | No | [84] | [83,240,241] | [242,243] |
| Bathymetry | Bathymetry | Aerial photos | No | - | - | [244] |
| Bathymetry | Bathymetry | ASTER (15 m) | No | - | [245] | - |
| Bathymetry | Bathymetry | Multispectral camera—UAV | No | - | [246] | - |
| Bathymetry | Bathymetry | Jilin-1 | No | - | [158] | - |
| Bathymetry | Bathymetry | Ice, Cloud, and land Elevation Satellite-2 (ICESat-2) lidar | No | - | [83,247] | [242,248,249,250,251,252,253] |
| Bathymetry | Bathymetry | Landsat-based global surface water dataset (GSWD) | Yes | - | [247] | - |
| Bathymetry | Bathymetry | Landsat (15–30 m) | No | [254] | [83,245,255] | [250] |
| Bathymetry | Bathymetry | MODIS (0.5–1 km) | Yes | - | - | [252] |
| Bathymetry | Bathymetry | National Centers for Environmental Prediction (NCEP) datasets | Yes | - | - | [252] |
| Bathymetry | Bathymetry | Orthophotos | No | [256] | - | - |
| Bathymetry | Bathymetry | PlanetScope images | No | - | [257] | - |
| Bathymetry (1) | Bathymetry | Sentinel-2 (10–20–60 m) | No | [237] | - | [258] |
| Bathymetry | Bathymetry | Sentinel-2 (10–20–60 m) | No | [84,256] | [83,239,245,255,259,260,261,262] | [85,243,248,249,250,251,253] |
| Bathymetry (1) | Bathymetry | UAV | No | - | - | [263] |
| Bathymetry | Bathymetry | UAV | No | [256] | [240,264] | - |
| Bathymetry (1) | Bathymetry | WorldView-2/3 (~0.5–4 m) | No | - | [265] | - |
| Bathymetry | Bathymetry | WorldView-2/3 (~0.5–4 m) | No | - | [266] | - |
| Bathymetry | Bathymetry | Zhuhai-1 (10 m) (2) | No | - | [261] | - |
| Bathymetry (1) | Biosiliceous sedimentation flux | Landsat (15–30 m) | No | - | [267] | - |
| Bathymetry (1) | Bottom friction coefficients | - | Yes | - | - | [268] |
| Bathymetry (1) | Coastline change | - | Yes | [150,269] | [270] | [271] |
| Bathymetry (1) | Coastal structures | - | Yes | - | - | [272] |
| Bathymetry (1) | Coastal aquaculture ponds | - | Yes | - | [209] | [210] |
| Bathymetry (1) | Coastal vulnerability assessment | - | Yes | [273] | - | |
| Bathymetry (1) | Coastal vulnerability assessment | Changjiang Estuary Waterway Administration Bureau datasets | Yes | [55] | - | - |
| Bathymetry (1) | Coastal vulnerability assessment | BathySwath1 ITER System (interferometric sonar) | No | [91] | - | - |
| Bathymetry (1) | Coastal vulnerability assessment | Vegetation and Environment monitoring on a New Micro-Satellite (VENμS) | No | - | - | [274] |
| Bathymetry (1) | Coastal vulnerability assessment | General Bathymetric Chart of the Oceans (GEBCO) datasets | Yes | - | [275] | - |
| Bathymetry (1) | Coral reef | - | Yes | - | [225] | - |
| Bathymetry (1) | Distribution of heavy metals | MODIS (0.5–1 km) | No | [276] | - | - |
| Bathymetry (1) | Green tide | - | Yes | - | - | [200] |
| Bathymetry (1) | Habitat | Airborne lidar | No | - | [277] | - |
| Bathymetry (1) | Habitat | UAV | No | - | [277] | [278] |
| Bathymetry (1) | Habitat | UAV | No | - | - | [279] |
| Bathymetry (1) | Hydrographic structure | - | Yes | [280] | - | - |
| Bathymetry (1) | Intertidal polychaete reefs | - | Yes | - | [82] | - |
| Bathymetry (1) | Landfast sea ice | MODIS (0.5–1 km) | Yes | - | - | [281] |
| Bathymetry (1) | Marine heatwaves | - | Yes | - | [282] | - |
| Bathymetry (1) | Morphological evolution | - | Yes | [283] | - | - |
| Bathymetry (1) | Morphological evolution | COSMO-SkyMed | No | - | [284] | - |
| Bathymetry (1) | Morphological evolution | CSK-SA, UAV | No | - | [284] | - |
| Bathymetry (1) | Morphological evolution | Landsat (15–30 m) | No | - | [285] | - |
| Bathymetry (1) | Morphological evolution | Multibeam acquisitions (vessels) | No | - | [285,286] | - |
| Bathymetry (1) | Morphological evolution | Pleiades tri-stereo images (~0.5–2 m) | No | - | [284] | - |
| Bathymetry (1) | Morphological evolution | Bathymetry Reson Seabat | No | - | [284] | - |
| Bathymetry (1) | Morphological evolution | UAV | No | - | [285,287,288] | - |
| Bathymetry (1) | Morphological evolution | Airborne lidar | No | - | [285] | - |
| Bathymetry (1) | Primary production | - | Yes | - | [289] | - |
| Bathymetry (1) | Seabed classification | Airborne lidar | No | - | [231] | - |
| Bathymetry (1) | SLA | - | Yes | - | [290] | - |
| Bathymetry (1) | Sea snots | - | Yes | - | [190] | - |
| Bathymetry (1) | SST | - | Yes | - | [291] | - |
| Bathymetry (1) | Suspended sediments | Landsat (15–30 m) | No | - | [292] | - |
| Sandbar (1) | Coastline change | Landsat (15–30 m) | No | [293] | - | - |
| Sandbar (1) | Coastline change | RapidEye (5 m) | No | [293] | - | - |
| Sandbar (1) | Coastline change | Planetscope (3 m) | No | [293] | - | - |
| Sand ridge line (1) | Morphological evolution | Huanjing-1B (150–300 m) | No | - | [294] | - |
| Sand ridge line (1) | Morphological evolution | Landsat (15–30 m) | No | - | [294] | - |
| Seabed (1) | Coastal vulnerability assessment | Edgetech 4200 SP (side scan sonar) | No | [91] | - | - |
| Seabed (1) | Habitat | Airborne lidar | No | - | [277] | - |
| Seabed (1) | Habitat | UAV | No | - | [277] | [278] |
| Seabed (1) | Seabed classification | Airborne lidar | No | - | [231] | - |
| Tidal creeks | Morphological evolution | GaoFen-1 WFV (16 m) | No | - | [295] | - |
| Tidal creeks | Morphological evolution | Huanjing-1B (150–300 m) | No | - | [295] | - |
| Tidal creeks | Morphological evolution | Landsat (15–30 m) | No | - | [295] | - |
| Tidal creeks | Morphological Eevolution | Sentinel-2 (10–20–60 m) | No | - | [295] | - |
(1) This parameter was mapped and monitored together with other parameters; (2) hyperspectral data.
Table A5.
The eligible papers that mapped and/or monitored Chl-a.
| Parameter | Phenomena | Remote Data or Dataset | Available Products | References 2023 | References 2022 | References 2021 |
|---|---|---|---|---|---|---|
| Chl-a | Atmospheric correction | Sentinel-2 (10–20–60 m) | No | - | - | [52] |
| Chl-a (1) | Atmospheric correction | Sentinel-3 (300 m) | No | - | - | [53] |
| Chl-a (1) | Algal blooms | MODIS (0.5–1 km) | No | [72] | - | - |
| Chl-a (1) | Bathymetry | WorldView-2-3 (~0.5–4 m) | No | - | [265] | - |
| Chl-a (1) | Biosiliceous sedimentation flux | Landsat (15–30 m) | No | - | [267] | - |
| Chl-a (1) | Biosiliceous sedimentation flux | MODIS (0.5–1 km) | No | - | [267] | - |
| Chl-a (1) | Biotoxin risk | - | Yes | - | - | [296] |
| Chl-a (1) | Coastal aquaculture ponds | Sentinel-2 (10–20–60 m) | No | - | [77,79] | - |
| Chl-a (1) | Cyanobacterial pigment concentrations | HICO™ (~90 m) (2) | No | - | [180] | - |
| Chl-a (1) | Cyanobacterial pigment concentrations | Landsat (15–30 m) | No | - | - | [89] |
| Chl-a (1) | Cyanobacterial pigment concentrations | MERIS (300 m) | No | - | - | [89] |
| Chl-a (1) | Cyanobacterial pigment concentrations | Sentinel-2 (10–20–60 m) | No | - | - | [89] |
| Chl-a (1) | Cyanobacterial pigment concentrations | Sentinel-3 (300 m) | No | - | - | [89] |
| Chl-a (1) | Dissolved organic carbon | MODIS (0.5–1 km) | Yes | - | [297] | - |
| Chl-a (1) | Effects of COVID-19 lockdown | Sentinel-3 (300 m) | No | - | [169] | [298] |
| Chl-a | Effects of extreme events | - | Yes | [59] | - | - |
| Chl-a (1) | Eutrophication | DJI M600Pro-UAV (2) | No | [299] | - | - |
| Chl-a (1) | Eutrophication | hyperspectral imager Pika L (2) | No | [299] | - | - |
| Chl-a | Eutrophication | MODIS (0.5–1 km) | Yes | [300] | - | [301] |
| Chl-a | Eutrophication | Sentinel-2 (10–20–60 m) | No | - | - | [302] |
| Chl-a (1) | Fishing zones | MODIS (0.5–1 km) | Yes | [303] | - | - |
| Chl-a (1) | Giant kelp | MODIS (0.5–1 km) | Yes | - | - | [228] |
| Chl-a (1) | Harmful algal bloom | MODIS (0.5–1 km) | Yes | [304] | [305] | [76] |
| Chl-a (1) | Harmful algal bloom | Sentinel-2 (10–20–60 m) | No | - | - | [183] |
| Chl-a (1) | Harmful algal bloom | Sentinel-3 (300 m) | No | - | [185] | - |
| Chl-a (1) | Harmful algal risk | - | Yes | - | - | [296] |
| Chl-a (1) | LU/LC change | - | Yes | [61] | - | - |
| Chl-a (1) | Marine aquaculture | - | Yes | - | - | [75] |
| Chl-a (1) | Macroalgae | MODIS (0.5–1 km) | No | - | - | [204] |
| Chl-a (1) | Marine heatwaves | - | Yes | - | [282] | - |
| Chl-a (1) | Microbenthic invertebrate distribution | - | Yes | - | [306] | - |
| Chl-a (1) | Oil spill | - | Yes | - | [307,308] | - |
| Chl-a (1) | Particulate organic carbon | MODIS (0.5–1 km) | Yes | - | [309] | - |
| Chl-a (1) | Phenology and niche ecology of Harmful species | METEOSAT | Yes | - | [159] | |
| Chl-a (1) | Phycocyanin | HICO™ (~90 m) (2) | No | - | - | [134] |
| Chl-a (1) | Phycocyanin | PRISMA (30 m) (2) | No | - | - | [134] |
| Chl-a | Phytoplankton | - | Yes | - | [310] | - |
| Chl-a (1) | Phytoplankton | - | Yes | - | [311] | [312] |
| Chl-a | Phytoplankton | CZCS (~1 km) | No | - | [313] | - |
| Chl-a | Phytoplankton | HICO™ (~90 m) (2) | No | - | - | [87] |
| Chl-a | Phytoplankton | GER 1500 Portable | No | - | [314] | - |
| Chl-a | Phytoplankton | MERIS (300 m) | No | - | - | [315] |
| Chl-a | Phytoplankton | MODIS (0.5–1 km) | No | - | [313,316,317] | - |
| Chl-a | Phytoplankton | SeaWiFS (1.1–4.5 km) | No | - | [313] | - |
| Chl-a (1) | Phytoplankton | SeaWiFS (1.1–4.5 km) | Yes | - | [318] | - |
| Chl-a | Phytoplankton | Sentinel-2 (10–20–60 m) | No | [319] | - | - |
| Chl-a (1) | Phytoplankton | Sentinel-2 (10–20–60 m) | No | - | [320] | - |
| Chl-a | Phytoplankton | Sentinel-3 (300 m) | No | - | - | [315] |
| Chl-a (1) | Phytoplankton | VIIRS | Yes | - | [318] | - |
| Chl-a (1) | Primary production | - | Yes | - | - | [289] |
| Chl-a (1) | Primary production | Landsat (15–30 m) | Yes | [139] | - | - |
| Chl-a (1) | Primary production | MERIS (300 m) | Yes | - | [157] | - |
| Chl-a (1) | Primary production | MODIS (0.5–1 km) | Yes | [69,138] | [157] | - |
| Chl-a (1) | Seagrass | MODIS (0.5–1 km) | Yes | - | - | [321] |
| Chl-a (1) | Water hyacinth | Sentinel-2 (10–20–60 m) | No | - | [160] | - |
| Chl-a (1) | Water quality estimation | MODIS (0.5–1 km) | Yes | - | [88] | [322] |
| Chl-a (1) | Water quality estimation | Landsat (15–30 m) | No | - | [86,88,323,324] | [325] |
| Chl-a (1) | Water quality estimation | Sentinel-2 (10–20–60 m) | No | [326] | [86,88,323,324,327,328] | [168,192,329] |
| Chl-a (1) | Water quality estimation | Sentinel-3 (300 m) | No | - | [86] | [90,168] |
| Chl-a (1) | Water quality estimation | UAV | No | [326] | - | - |
| Chl-a (1) | Water quality estimation | - | Yes | - | [306] | - |
| Chl-a (1) | Water quality estimation | Sentinel-2 (10–20–60 m) | No | - | [160] | - |
(1) This parameter was mapped and monitored together with other parameters; (2) hyperspectral data.
Table A6.
The eligible papers that mapped and/or monitored CDOM.
| Parameter | Phenomena | Remote Data or Dataset | Available Products | References 2023 | References 2022 | References 2021 |
|---|---|---|---|---|---|---|
| CDOM (1) | Coastal aquaculture ponds | Sentinel-2 (10–20–60 m) | No | - | [79] | - |
| CDOM (1) | Dissolved organic carbon | Landsat (15–30 m) | No | - | - | [103] |
| CDOM (1) | Dissolved organic carbon | MODIS (0.5–1 km) | Yes | - | [104,297] | - |
| CDOM (1) | Dissolved organic carbon | Sentinel-2 (10–20–60 m) | No | - | - | [103] |
| CDOM (1) | Dissolved organic carbon | Sentinel-3 (300 m) | No | - | [330] | - |
| CDOM (1) | Effects of extreme events | Landsat | No | [105] | - | - |
| CDOM (1) | Effects of extreme events | Sentinel-2 (10–20–60 m) | No | [105] | - | - |
| CDOM (1) | Effects of extreme events | Sentinel-3 (300 m) | No | [105] | - | - |
| CDOM (1) | Marine aquaculture | - | Yes | - | - | [75] |
| CDOM (1) | Phytoplankton | Sentinel-2 (10–20–60 m) | No | - | - | [331] |
| CDOM (1) | Water quality estimation | MODIS (0.5–1 km) | Yes | - | [88] | - |
| CDOM (1) | Water quality estimation | Landsat (15–30 m) | No | - | [86,88] | - |
| CDOM (1) | Water quality estimation | Sentinel-2 (10–20–60 m) | No | - | [86,88] | - |
| CDOM (1) | Water quality estimation | Sentinel-3 (300 m) | No | - | [86] | [90] |
(1) This parameter was mapped and monitored together with other parameters.
Table A7.
The eligible papers that mapped and/or monitored the current data.
| Parameter | Phenomena | Remote Data or Dataset | Available Products | References 2023 | References 2022 | References 2021 |
|---|---|---|---|---|---|---|
| Current (1) | Biotoxin risk | - | Yes | - | - | [296] |
| Current (1) | Coastline change | - | Yes | - | - | [332] |
| Current (1) | Coastal vulnerability assessment | - | No | - | [333] | - |
| Current (1) | Coastal vulnerability assessment | - | Yes | [91] | - | - |
| Current (1) | Effects of COVID-19 lockdown | - | Yes | - | [169] | - |
| Current (1) | Green tide | - | Yes | - | - | [200] |
| Current (1) | Distribution of heavy metals | - | Yes | [276] | - | - |
| Current (1) | Harmful algal bloom | - | Yes | - | - | [296] |
| Current (1) | Marine aquaculture | - | Yes | - | - | [75] |
| Current (1) | Oil spill | - | Yes | - | [334,335] | [92] |
| Current (1) | Phytoplankton | - | Yes | - | [311] | - |
| Current (1) | Sea level anomaly | OMNI buoys | No | - | [290] | - |
| Current (1) | Sea snots | - | Yes | - | [190] | - |
| Current (1) | Suspended sediments | - | Yes | - | [336] | [337] |
| Current (1) | Velocity products | Sentinel-1 (~10 m) | No | [338] | - |
(1) This parameter was mapped and monitored together with other parameters.
Table A8.
The eligible papers that mapped and/or monitored Zsd and Zeu.
| Parameter | Phenomena | Remote Data or Dataset | Available Products | References 2023 | References 2022 | References 2021 |
|---|---|---|---|---|---|---|
| Zsd (1) | Harmful algal bloom | MODIS (0.5–1 km) | No | - | - | [76] |
| Zsd (1) | Seagrass | Sentinel-2 (10–20–60 m) | No | - | [234] | - |
| Zsd | Water quality estimation | GOCI | No | - | [339] | - |
| Zsd (1) | Water quality estimation | Sentinel-2 (10–20–60 m) | No | - | - | [94,192] |
| Zsd | Zsd | Landsat (15–30 m) | No | - | - | [95] |
| Zsd | Zsd | MERIS (300 m) | No | - | [93] | - |
| Zsd | Zsd | MODIS (0.5–1 km) | No | - | [93] | - |
| Zeu (1) | Phytoplankton crops and taxonomic composition | SeaWiFS (1.1–4.5 km) | Yes | - | [96] | - |
| Zeu (1) | Primary production | MERIS (300 m) | Yes | - | [157] | - |
(1) This parameter was mapped and monitored together with other parameters.
Table A9.
The eligible papers that mapped and/or monitored Kd (490).
| Parameter | Phenomena | Remote Data or Dataset | Available Products | References 2023 | References 2022 | References 2021 |
|---|---|---|---|---|---|---|
| Kd (490) (1) | Bathymetry | Sentinel-2 (10–20–60 m) | No | [237] | - | - |
| Kd (490) (1) | Biosiliceous sedimentation flux | Landsat (15–30 m) | No | - | [267] | - |
| Kd (490) (1) | Biosiliceous sedimentation flux | MODIS (0.5–1 km) | No | - | [267] | - |
| Kd (490) (1) | Effects of COVID-19 lockdown | Sentinel-3 (300 m) | No | - | - | [298] |
| Kd (490) (1) | Giant kelp | MODIS (0.5–1 km) | Yes | - | - | [228] |
| Kd (490) (1) | Harmful algal blooms | MODIS (0.5–1 km) | No | - | - | [76] |
| Kd (490) (1) | Particulate organic carbon | - | Yes | [98] | - | - |
| Kd (490) (1) | Phytoplankton | - | Yes | - | - | [312] |
| Kd (490) (1) | Harmful algal bloom | MODIS (0.5–1 km) | No | - | - | [76] |
| Kd (490) (1) | Seagrass | Sentinel-2 (10–20–60 m) | No | - | [234] | - |
| Kd (490) (1) | Water quality estimation | GOCI | No | - | [339] | |
| Kd (490) (1) | Water quality estimation | Sentinel-2 (10–20–60 m) | No | - | - | [94,192] |
| Kd (490) (1) | Zsd | Landsat (15–30 m) | No | - | - | [95] |
(1) This parameter was mapped and monitored together with other parameters.
Table A10.
The eligible papers that mapped and/or monitored DSM.
| Parameter | Phenomena | Remote Data or Dataset | Available Products | References 2023 | References 2022 | References 2021 |
|---|---|---|---|---|---|---|
| DSM (1) | Avulsion sites | TanDEM-X (12 m) | No | - | [340] | - |
| DSM (1) | Coastal aquaculture ponds | - | Yes | [212] | - | [210] |
| DSM (1) | Coastal forested wetland | UAV | No | - | [341] | - |
| DSM (1) | Coastline change | - | Yes | [150,269,342,343] | [344,345,346] | [347] |
| DSM (1) | Coastline change | UAV | No | [348] | - | |
| DSM (1) | Coastal structures | - | Yes | - | - | [272] |
| DSM | Coastal structures | Terrestrial Laser Scanner | No | - | [349] | - |
| DSM | Coastal structures | UAV | No | - | [349] | [350] |
| DSM (1) | Coastal vulnerability assessment | - | Yes | [116] | - | [166,351] |
| DSM (1) | Coastal vulnerability assessment | ASTER | Yes | - | - | [102] |
| DSM (1) | Coastal vulnerability assessment | Pleiades (0.5–2 m) | No | - | - | [352] |
| DSM (1) | Coastal vulnerability assessment | SRTM DEM, USGS (30 m) | Yes | - | [275] | - |
| DSM (1) | Coastal vulnerability assessment | VENμS | No | - | - | [274] |
| DSM (1) | Coastal wetland classification | Airborne lidar | No | - | [353] | - |
| DSM (1) | Flood extent | - | Yes | - | - | [109] |
| DSM (1) | Flood extent | Pleiades stereo image (0.5–2 m) | No | [62] | [354] | - |
| DSM | Flood risk | - | Yes | - | - | [60] |
| DSM (1) | Habitat | - | Yes | - | - | [355] |
| DSM (1) | Habitat | Airborne lidar | No | - | [277] | - |
| DSM (1) | Habitat | NASADEM | Yes | [215] | - | - |
| DSM (1) | Habitat | Sentinel-1 (~10 m) | No | [165] | - | - |
| DSM (1) | Habitat | UAV | No | - | [277,356,357,358] | [279,359,360] |
| DSM (1) | Habitat | UAV-LiDAR | No | - | [142,361] | |
| DSM (1) | Intertidal polychaete reefs | DJI Phantom 4 Multispectral UAV | No | - | [82] | - |
| DSM (1) | Invasive alien species | UAV | No | [161] | - | - |
| DSM (1) | Litter | - | Yes | - | [362] | |
| DSM (1) | LU/LC change | ALOS PALSAR (12.5 m) | Yes | - | [363] | - |
| DSM (1) | LU/LC change | ARCTIC DEM | Yes | [364] | ||
| DSM (1) | Mangrove ecosystems | - | Yes | - | [365,366] | [367,368] |
| DSM (1) | Mangrove ecosystems | NASA Goddard’s Lidar, Hyperspectral, and Thermal (G-LiHT) airborne image | No | - | - | [162] |
| DSM (1) | Mangrove ecosystems | SAR | No | - | [369] | - |
| DSM (1) | Marine litter | - | Yes | - | - | [128] |
| DSM (1) | Marine litter | UAV | No | [370] | - | - |
| DSM (1) | Microbenthic invertebrate distribution | - | Yes | - | [306] | - |
| DSM (1) | Morphological evolution | Airborne lidar | No | - | [285,371] | - |
| DSM (1) | Morphological evolution | HJ-1 CCD (30 m) | No | - | [294] | - |
| DSM (1) | Morphological evolution | Pleiades (0.5–2 m) | No | - | [284,286,371] | - |
| DSM (1) | Morphological evolution | UAV | No | - | [101,285,288] | [372] |
| DSM | Morphological structures | Airborne lidar | No | - | - | [100] |
| DSM | Morphological structures | Aerial photos | No | - | - | [100] |
| DSM | Morphological structures | Lidar | No | - | - | [373] |
| DSM (1) | Morphological structures | UAV | No | - | [120] | [263,374] |
| DSM | Subsidence | Sentinel-1 (~10 m) | No | - | [375,376,377,378,379] | [99] |
| DSM | Landslides | Sentinel-1 (~10 m) | No | - | [336] | [380] |
| DSM (1) | Sea level rise | Airborne lidar | No | - | [381] | - |
| DSM (1) | Suspended sediments | - | Yes | - | [336] | - |
| DSM (1) | Water quality estimation | - | Yes | - | [306] | - |
(1) This parameter was mapped and monitored together with other parameters.
Table A11.
The eligible papers that mapped and/or monitored DOC.
| Parameter | Phenomena | Remote Data or Dataset | Available Products | References 2023 | References 2022 | References 2021 |
|---|---|---|---|---|---|---|
| DOC (1) | Dissolved organic carbon | Landsat (15–30 m) | No | - | - | [103] |
| DOC (1) | Dissolved organic carbon | MODIS (0.5–1 km) | No | - | [104,297] | - |
| DOC (1) | Dissolved organic carbon | Sentinel-2 (10–20–60 m) | No | - | - | [103] |
| DOC (1) | Dissolved organic carbon | Sentinel-3 (300 m) | No | - | [330] | - |
| DOC (1) | Effects of extreme events | Landsat (15–30 m) | No | [105] | - | - |
| DOC (1) | Effects of extreme events | Sentinel-2 (10–20–60 m) | No | [105] | - | - |
| DOC (1) | Effects of extreme events | Sentinel-3 (300 m) | No | [105] | - | - |
(1) This parameter was mapped and monitored together with other parameters.
Table A12.
The eligible papers that mapped and/or monitored dissolved iron and DO.
| Parameter | Phenomena | Remote Data or Dataset | Available Products | References 2023 | References 2022 | References 2021 |
|---|---|---|---|---|---|---|
| Dissolved Iron (1) | LU/LC change | - | Yes | [61] | - | - |
| DO (1) | Fishing zones | - | Yes | [382] | - | - |
| DO (1) | LU/LC change | - | Yes | [61] | - | - |
| DO (1) | Water quality estimation | Sentinel-2 (10–20–60 m) | No | - | [328] | - |
(1) This parameter was mapped and monitored together with other parameters.
Table A13.
The eligible papers that mapped and/or monitored the flood extent.
| Parameter | Phenomena | Remote Data or Dataset | Available Products | References 2023 | References 2022 | References 2021 |
|---|---|---|---|---|---|---|
| Flood | Effects of extreme events | Sentinel-1 (~10 m) | No | - | [383] | - |
| Flood (1) | Flood extent | Airborne lidar | Yes | - | - | [109] |
| Flood (1) | Flood extent | Landsat (15–30 m) | No | [107] | [354] | - |
| Flood | Flood extent | Sentinel-1 (~10 m) | No | - | [106] | - |
| Flood (1) | Flood extent | Sentinel-1 (~10 m) | No | [107] | [120] | - |
| Flood (1) | Flood extent | Sentinel-2 (10–20–60 m) | No | [107] | - | - |
| Flood (1) | Flood extent | Pleiades stereo image (0.5–2 m) | No | [62] | - | - |
| Flood (1) | LU/LC change | ASAR | Yes | - | [108] | - |
| Flood (1) | LU/LC change | MODIS (0.5–1 km) | No | - | [108] | - |
| Flood (1) | LU/LC change | TerraSAR-X | Yes | - | [108] | - |
| Flood (1) | Sea level rise | - | Yes | [384] | - | - |
(1) This parameter was mapped and monitored together with other parameters.
Table A14.
The eligible papers that mapped and/or monitored the presence of ice.
| Parameter | Phenomena | Remote Data or Dataset | Available Products | References 2023 | References 2022 | References 2021 |
|---|---|---|---|---|---|---|
| Ice (1) | Blue ice | MODIS (0.5–1 km) | No | - | [385] | - |
| Ice (1) | Blue ice | Sentinel-2 (10–20–60 m) | No | - | [385] | - |
| Ice (1) | Landfast sea ice | MODIS (0.5–1 km) | Yes | - | - | [281] |
| Sea Ice (1) | Sea ice | - | Yes | - | [386] | - |
| Sea Ice (1) | Sea ice | - | Yes | - | - | [111] |
| Sea Ice | Sea ice | Coastal global navigation satellite system reflectometry (GNSS-R) fixed station | No | - | [387] | - |
| Sea Ice (1) | Sea level anomaly | - | Yes | [64] | - | [63] |
(1) This parameter was mapped and monitored together with other parameters.
Table A15.
The eligible papers that mapped and/or monitored LST.
| Parameter | Phenomena | Remote Data or Dataset | Available Products | References 2023 | References 2022 | References 2021 |
|---|---|---|---|---|---|---|
| LST (1) | Coastline change | Landsat (15–30 m) | No | [163] | - | - |
| LST (1) | Coastal salt marshes | MODIS (0.5–1 km) | Yes | [141] | - | [388] |
| LST | Habitat | - | Yes | - | - | [178] |
| LST (1) | LU/LC change | Landsat (15–30 m) | No | [389] | - | [390] |
| LST (1) | LU/LC change | MODIS (0.5–1 km) | No | [391] | - | - |
| LST (1) | LST | Landsat (15–30 m) | No | - | [112] | - |
| LST (1) | LST | MODIS (0.5–1 km) | No | - | [112] | - |
| LST (1) | Urban sprawl | Landsat (15–30 m) | No | - | - | [392] |
| LST (1) | Urban sprawl | MODIS (0.5–1 km) | No | [113] | - | - |
(1) This parameter was mapped and monitored together with other parameters.
Table A16.
The eligible papers that mapped and/or monitored LU/LC.
| Parameter | Phenomena | Remote Data or Dataset | Available Products | References 2023 | References 2022 | References 2021 |
|---|---|---|---|---|---|---|
| LU/LC (1) | Aboveground biomass | Landsat (15–30 m) | No | - | - | [393] |
| LU/LC (1) | Aboveground biomass | Sentinel-2 (10–20–60 m) | No | - | [140] | - |
| LU/LC (1) | Aboveground biomass | UAV | No | - | - | [393] |
| LU/LC (1) | Agricultural non-point source pollution | Sentinel-2 (10–20–60 m) | No | - | [394] | - |
| LU/LC (1) | Aquatic vegetation | HyMap airborne (2) | No | - | [81] | - |
| LU/LC (1) | Aquatic vegetation | Sentinel-2 (10–20–60 m) | No | - | [81,224] | - |
| LU/LC (1) | Blue ice | MODIS (0.5–1 km) | No | - | [385] | - |
| LU/LC (1) | Blue ice | Sentinel-2 (10–20–60 m) | No | - | [385] | - |
| LU/LC | Carbon storage change | Landsat (15–30 m) | No | - | [395] | - |
| LU/LC (1) | Climate change | - | Yes | - | - | [396] |
| LU/LC (1) | Climate change | Google Earth image | No | - | - | [147] |
| LU/LC (1) | Climate change | Landsat (15–30 m) | Yes | - | [177] | [397] |
| LU/LC (1) | Coastal aquaculture ponds | - | Yes | [212] | - | - |
| LU/LC (1) | Coastal aquaculture ponds | Landsat (15–30 m) | Yes | - | [209] | [210] |
| LU/LC (1) | Coastline change | Google Earth image | No | - | - | [398] |
| LU/LC (1) | Coastline change | Landsat (15–30 m) | No | [163,399,400,401,402] | [213,403,404,405] | [117,171,214] |
| LU/LC (1) | Coastline change | Sentinel-2 (10–20–60 m) | No | [399,401,406] | [346,407,408,409] | [171] |
| LU/LC (1) | Coastline change | RapidEye (5 m) | No | - | [410] | - |
| LU/LC (1) | Coastline change | Planetscope (3 m) | No | - | [410] | - |
| LU/LC (1) | Coastal vulnerability assessment | - | Yes | - | - | [145] |
| LU/LC (1) | Coastal vulnerability assessment | Google Earth images | No | - | - | [351] |
| LU/LC (1) | Coastal vulnerability assessment | Landsat (15–30 m) | No | [55,411] | [275] | [102,166,412,413] |
| LU/LC (1) | Coastal vulnerability assessment | Sentinel-2 (10–20–60 m) | No | - | - | [166] |
| LU/LC (1) | Coastal vulnerability assessment | Video camera systems | No | [273] | - | - |
| LU/LC (1) | Coastal wetland classification | Sentinel-2 (10–20–60 m) | No | - | [353] | - |
| LU/LC (1) | Deltaic estuarine transformations | Landsat (15–30 m) | No | [116] | - | - |
| LU/LC (1) | Flood extent | - | Yes | [107] | - | - |
| LU/LC (1) | Flood extent | Google Earth image | No | - | [120] | - |
| LU/LC (1) | Flood extent | Landsat (15–30 m) | No | - | [120] | [109] |
| LU/LC | Flood risk | Sentinel-2 (10–20–60 m) | No | - | - | [110] |
| LU/LC | Flood risk | SPOT (~10–20 m) | No | - | - | [110] |
| LU/LC (1) | Giant kelp | Landsat (15–30 m) | No | [227] | ||
| LU/LC (1) | Ecosystem services value | Landsat (15–30 m) | No | - | - | [216] |
| LU/LC (1) | Effects of extreme events | - | Yes | - | [383] | - |
| LU/LC (1) | Effects of extreme events | Sentinel-2 (10–20–60 m) | No | - | - | [414] |
| LU/LC | Habitat | GaoFen2 (0.8–3.2 m) | No | - | - | [415] |
| LU/LC (1) | Habitat | GaoFen3-SAR (4.5–5 m) | No | - | - | [416] |
| LU/LC | Habitat | GaoFen5-HIS (30 m) (2) | No | - | - | [417,418] |
| LU/LC (1) | Habitat | HSI ZiYuan1-02D (30 m) (2) | No | - | [419] | - |
| LU/LC (1) | Habitat | Landsat (15–30 m) | No | [165] | [119,420,421,422] | [423,424] |
| LU/LC | Habitat | Landsat (15–30 m) | No | - | [119,422] | [415] |
| LU/LC | Habitat | Landsat (15–30 m) | Yes | - | - | [425] |
| LU/LC (1) | Habitat | Remotely piloted aircraft (RPAs) | No | - | - | [230] |
| LU/LC (1) | Habitat | Sentinel-1 (~10 m) | No | [165,215] | - | - |
| LU/LC | Habitat | Sentinel-2 (10–20–60 m) | No | - | - | [418,426] |
| LU/LC (1) | Habitat | Sentinel-2 (10–20–60 m) | No | [215] | [420] | [427,428] |
| LU/LC (1) | Habitat | UAV-Lidar | No | - | [429] | |
| LU/LC (1) | Habitat | UAV | No | - | [277,356,429] | [360] |
| LU/LC | Habitat | WorldView-2 (~0.5–2 m) | No | - | [430] | - |
| LU/LC (1) | Invasive alien species | Landsat (15–30 m) | No | - | [431,432] | - |
| LU/LC | Invasive alien species | UAV | No | - | [431] | - |
| LU/LC (1) | LST | Landsat (15–30 m) | No | - | [112] | - |
| LU/LC (1) | LST | Sentinel-2 (10–20–60 m) | No | - | [112] | - |
| LU/LC (1) | LU/LC change | - | Yes | - | - | [433,434] |
| LU/LC (1) | LU/LC change | Aerial photos | No | [364] | [435,436] | - |
| LU/LC (1) | LU/LC change | GaoFen-5-HIS (30 m) (2) | No | - | [219] | - |
| LU/LC (1) | LU/LC change | Google Earth Image | No | - | - | [437] |
| LU/LC (1) | LU/LC change | Landsat (15–30 m) | No | [61,129,389,391,438,439,440] | [114,218,220,358,363,441,442] | [217,390,437,443,444] |
| LU/LC | LU/LC change | Landsat (15–30 m) | No | - | [445] | - |
| LU/LC (1) | LU/LC change | MODIS (0.5–1 km) | No | - | [108] | - |
| LU/LC (1) | LU/LC change | Quickbird (0.6–2.4 m) | - | - | [217] | |
| LU/LC (1) | LU/LC change | Sentinel-2 (10–20–60 m) | No | [440] | [114,219,220,441] | |
| LU/LC (1) | LU/LC change | SPOT (~10–20 m) | - | - | [217] | |
| LU/LC (1) | LU/LC change | Pleiades (0.5–2 m) | No | [364] | - | - |
| LU/LC (1) | Macroalgae | MODIS (0.5–1 km) | No | - | [203] | - |
| LU/LC (1) | Macroalgae | Sentinel-1 (~10 m) | No | - | [203] | - |
| LU/LC (1) | Macroalgae | UAV | No | - | [207] | - |
| LU/LC (1) | Mangrove ecosystems | - | Yes | - | - | [446] |
| LU/LC (1) | Mangrove ecosystems | Corona | No | [121] | - | - |
| LU/LC (1) | Mangrove ecosystems | Google Earth images | [121] | - | - | |
| LU/LC (1) | Mangrove ecosystems | Landsat (15–30 m) | No | [121,124] | [369,447,448,449] | [162,450,451] |
| LU/LC (1) | Mangrove ecosystems | Sentinel-1 (~10 m) | No | - | [452] | - |
| LU/LC (1) | Mangrove ecosystems | Sentinel-2 (10–20–60 m) | No | - | [369,447,452,453] | [450,454] |
| LU/LC (1) | Mangrove ecosystems | Pléiades-1 (0.5–2 m) | No | - | [369] | - |
| LU/LC (1) | Mangrove ecosystems | UAV | No | - | [369] | - |
| LU/LC (1) | Microbenthic invertebrate distribution | Landsat (15–30 m) | No | - | [306] | - |
| LU/LC (1) | Microphytobenthos | Sentinel-2 (10–20–60 m) | No | - | [208] | - |
| LU/LC (1) | Morphological evolution | HJ-1 CCD (30 m) | No | - | [294] | - |
| LU/LC (1) | Morphological evolution | Pléiades (0.5–2 m) | No | - | [371] | - |
| LU/LC (1) | Oil spill | - | Yes | [308] | - | - |
| LU/LC (1) | Plastic litter | - | Yes | - | - | [127] |
| LU/LC (1) | Plastic litter | PRISMA (30 m) (2) | No | - | [455] | - |
| LU/LC (1) | Plastic litter | Sentinel-2 (10–20–60 m) | No | - | [126] | - |
| LU/LC (1) | Primary production | Landsat (15–30 m) | No | [139] | - | - |
| LU/LC (1) | Sea level rise | - | Yes | [384,456] | - | - |
| LU/LC (1) | Seagrass | UAV | No | - | [207] | - |
| LU/LC (1) | Seagrass | WorldView 2–3 (~0.5–4 m) | No | [235] | [236] | |
| LU/LC (1) | Soil salinization | Landsat (15–30 m) | No | [457] | [458] | - |
| LU/LC (1) | Soil salinization | MODIS (0.5–1 km) | No | [459] | - | - |
| LU/LC (1) | Urban sprawl | ASD Portable (2) | No | - | - | [460] |
| LU/LC (1) | Urban sprawl | Hyperion (30 m) (2) | No | [115] | - | - |
| LU/LC (1) | Urban sprawl | Landsat (15–30 m) | No | [461,462] | [463,464,465] | [392] |
| LU/LC (1) | Urban sprawl | MIVIS airborne (2) | No | [466] | - | |
| LU/LC (1) | Urban sprawl | PRISMA (30 m) (2) | No | [115] | - | |
| LU/LC (1) | Water quality estimation | Landsat (15–30 m) | No | - | [323,324] | - |
| LU/LC (1) | Water quality estimation | Sentinel-2 (10–20–60 m) | No | - | [323,324] | - |
| LU/LC (1) | Water quality estimation | Landsat (15–30 m) | No | - | [306] | - |
| LU/LC | Wetland biodiversity estimation | ZiYhis1-02D-HSI (30 m) (2) | No | - | [467,468] | [193] |
| LU/LC | Wetland biodiversity estimation | ZiYuan1-02D-MSI (10 m) | No | - | [468] | - |
(1) This parameter was mapped and monitored together with other parameters; (2) hyperspectral data.
Table A17.
The eligible papers that mapped and/or monitored LAI.
| Parameter | Phenomena | Remote Data or Dataset | Available Products | References 2023 | References 2022 | References 2021 |
|---|---|---|---|---|---|---|
| LAI (1) | Habitat | Sentinel-2 (10–20–60 m) | No | - | [469] | - |
| LAI (1) | Mangrove ecosystems | MODIS | Yes | - | - | [470] |
| LAI (1) | Mangrove ecosystems | Landsat (15–30 m) | No | - | [365] | - |
| LAI (1) | Mangrove ecosystems | Sentinel-2 (10–20–60 m) | No | - | [365] | [123] |
| LAI (1) | Mangrove ecosystems | SPOT (~10–20 m) | No | - | [365] | - |
| LAI (1) | Mangrove ecosystems | WorldView-2 (~0.5–2 m) | No | - | - | [123] |
| LAI (1) | Mangrove ecosystems | UAV | No | - | - | [123] |
| LAI (1) | Seagrass | Landsat (15–30 m) | No | - | [233] | - |
(1) This parameter was mapped and monitored together with other parameters.
Table A18.
The eligible papers that mapped and/or monitored mangroves.
| Parameter | Phenomena | Remote Data or Dataset | Available Products | References 2023 | References 2022 | References 2021 |
|---|---|---|---|---|---|---|
| Mangroves | Aboveground biomass | Sentinel-1 (~10 m) | No | - | - | [471] |
| Mangroves (1) | Coastline change | Landsat (15–30 m) | No | - | - | [214] |
| Mangroves (1) | Coastal vulnerability assessment | Landsat (15–30 m) | No | [411] | - | - |
| Mangroves (1) | Influence of El-Nino | Landsat | No | - | - | [472] |
| Mangroves (1) | Invasive alien species | Sentinel-2 (10–20–60 m) | No | - | - | [473] |
| Mangroves (1) | LU/LC change | Landsat (15–30 m) | No | [440] | - | - |
| Mangroves (1) | LU/LC change | Sentinel-2 (10–20–60 m) | No | [440] | - | - |
| Mangroves (1) | Mangrove ecosystems | - | Yes | [474] | - | [475] |
| Mangroves (1) | Mangrove ecosystems | ALOS-2 | No | - | [365] | - |
| Mangroves (1) | Mangrove ecosystems | Corona | No | [121] | - | - |
| Mangroves (1) | Mangrove ecosystems | GaoFen-1 (2–8 m) | No | - | - | [367] |
| Mangroves (1) | Mangrove ecosystems | GaoFen-5-HIS (2) | No | - | [122] | - |
| Mangroves (1) | Mangrove ecosystems | Google Earth Image | No | [121,476] | - | - |
| Mangroves (1) | Mangrove ecosystems | Hyperion (30 m) (2) | No | - | [122] | - |
| Mangroves (1) | Mangrove ecosystems | Landsat (15–30 m) | No | [121,124] | [365,369,447,448,449] | [446,450,451,470,477,478,479] |
| Mangroves (1) | Mangrove ecosystems | MODIS (0.5–1 km) | No | - | [480] | [470] |
| Mangroves (1) | Mangrove ecosystems | SPOT (~10–20 m) | No | - | [365] | - |
| Mangroves (1) | Mangrove ecosystems | PRISMA (30 m) (2) | - | [122] | - | |
| Mangroves | Mangrove ecosystems | Sentinel-1 (~10 m) | No | [481] | - | - |
| Mangroves (1) | Mangrove ecosystems | Sentinel-1 (~10 m) | No | - | [452] | [368,446] |
| Mangroves | Mangrove ecosystems | Sentinel-2 (10–20–60 m) | No | [482] | - | |
| Mangroves (1) | Mangrove ecosystems | Sentinel-2 (10–20–60 m) | No | [476] | [122,365,366,369] | [123,368,446,454,470] |
| Mangroves | Mangrove ecosystems | Sentinel-3 (300 m) | No | - | [482] | - |
| Mangroves (1) | Mangrove ecosystems | HSI ZiYuan1-02D (30 m) (2) | No | - | [122] | - |
| Mangroves (1) | Mangrove ecosystems | MSI ZiYuan1–3 (2.1–8 m) | No | - | - | [367] |
| Mangroves (1) | Mangrove ecosystems | WorldView-2 (~0.5–2 m) | No | - | - | [123] |
| Mangroves (1) | Mangrove ecosystems | UAV | No | - | - | [123] |
| Mangroves (1) | Tidal flat | Sentinel-2 (10–20–60 m) | No | - | [453] | - |
(1) This parameter was mapped and monitored together with other parameters; (2) hyperspectral data.
Table A19.
The eligible papers that mapped and/or monitored marine litter.
| Parameter | Phenomena | Remote Data or Dataset | Available Products | References 2023 | References 2022 | References 2021 |
|---|---|---|---|---|---|---|
| Marine litter (1) | Litter | UAV | No | - | - | [362] |
| Marine litter (1) | Marine litter | Orthophoto | No | [370] | - | - |
| Marine litter (1) | Marine litter | UAV | No | - | - | [128] |
| Marine litter | Plastic litter | GNSS-R systems (lab) | No | [483] | - | - |
| Marine litter (1) | Plastic litter | PRISMA (30 m) (2) | No | - | [455] | - |
| Marine litter | Plastic litter | Sentinel-2 (10–20–60 m) | No | - | - | [54] |
| Marine litter (1) | Plastic litter | Sentinel-2 (10–20–60 m) | No | - | [126,484] | - |
| Marine litter | Plastic litter | UAV | No | - | [485] | [486,487,488] |
| Marine litter | Plastic litter | UAV Hyperspectral (2) | No | - | - | [489] |
| Marine litter (1) | Plastic litter | - | Yes | - | - | [127,486] |
(1) This parameter was mapped and monitored together with other parameters; (2) hyperspectral data.
Table A20.
The eligible papers that monitored “fires and thermal anomalies”, nightlight, and nighttime light intensity.
Table A20.
The eligible papers that monitored “fires and thermal anomalies”, nightlight, and nighttime light intensity.
| Parameter | Phenomena | Remote Data or Dataset | Available Products | References 2023 | References 2022 | References 2021 |
|---|---|---|---|---|---|---|
| Fires and thermal anomalies (1) | Methane plume | Visible Infrared Imaging Radiometer Suite (VIIRS) | Yes | - | [130] | - |
| Nightlight (1) | LU/LC change | - | Yes | [129] | - | - |
| Nightlight (1) | LU/LC change | Visible Infrared Imaging Radiometer Suite (VIIRS) | Yes | - | - | [444] |
| Nightlight (1) | Plastic litter | Visible Infrared Imaging Radiometer Suite (VIIRS) | Yes | - | - | [127] |
| Nightlight (1) | Urban sprawl | - | Yes | [113] | - | - |
(1) This parameter was mapped and monitored together with other parameters.
Table A21.
The eligible papers that mapped and/or monitored methane and oil.
| Parameter | Phenomena | Remote Data or Dataset | Available Products | References 2023 | References 2022 | References 2021 |
|---|---|---|---|---|---|---|
| Methane (1) | Methane plume | Landsat (15–30 m) | No | - | [130] | - |
| Methane (1) | Methane plume | Sentinel-2 (10–20–60 m) | No | - | [130] | - |
| Methane (1) | Methane plume | WorldView-3 (~0.5–4 m) | No | - | [130] | - |
| Oil (1) | Oil spill | - | No | [490] | - | - |
| Oil | Oil spill | Sentinel-1 (~10 m) | No | - | [491,492,493] | [131] |
| Oil (1) | Oil spill | Sentinel-1 (~10 m) | No | [308] | [307,334,335,494] | [92] |
| Oil | Oil spill | Sentinel-2 (10–20–60 m) | No | - | - | [131] |
| Oil (1) | Oil spill | Sentinel-2 (10–20–60 m) | No | - | [307,335] | - |
(1) This parameter was mapped and monitored together with other parameters.
Table A22.
The eligible papers that mapped and/or monitored POC.
| Parameter | Phenomena | Remote Data or Dataset | Available Products | References 2023 | References 2022 | References 2021 |
|---|---|---|---|---|---|---|
| POC (1) | Macroalgae | MODIS (0.5–1 km) | Yes | - | - | [204] |
| POC (1) | Oil spill | - | Yes | - | [307] | - |
| POC (1) | Particulate organic carbon | MODIS (0.5–1 km) | Yes | [98] | [309] | - |
| POC (1) | Particulate organic carbon | SeaWiFS (1.1–4.5 km) | Yes | [98] | - | - |
| POC (1) | Particulate organic carbon | VIIRS-SNPP | Yes | [98] | - | - |
| POC (1) | Primary production | MODIS (0.5–1 km) | Yes | [139] | - | - |
(1) This parameter was mapped and monitored together with other parameters.
Table A23.
The eligible papers that mapped and/or monitored PAR.
| Parameter | Phenomena | Remote Data or Dataset | Available Products | References 2023 | References 2022 | References 2021 |
|---|---|---|---|---|---|---|
| PAR (1) | Green tide | MODIS (1 km) | Yes | - | [199] | - |
| PAR (1) | Mangrove ecosystems | MODIS (1 km) | Yes | - | [133] | - |
| PAR (1) | Mangrove ecosystems | Sentinel-2 (10–20–60 m) | Yes | - | [133] | - |
| PAR (1) | Phytoplankton crops and taxonomic composition | SeaWiFS (1.1–4.5 km) | Yes | - | [96] | - |
| PAR (1) | Primary production | MODIS (0.5–1 km) | Yes | - | [157] | - |
| PAR (1) | Primary production | MODIS (0.5–1 km) | Yes | [139] | [289] | - |
(1) This parameter was mapped and monitored together with other parameters.
Table A24.
The eligible papers that mapped and/or monitored phycocyanin.
| Parameter | Phenomena | Remote Data or Dataset | Available Products | References 2023 | References 2022 | References 2021 |
|---|---|---|---|---|---|---|
| Phycocyanin (1) | Phycocyanin | HICO™ (~90 m) (2) | No | - | - | [134] |
| Phycocyanin (1) | Phycocyanin | PRISMA (30 m) (2) | No | - | - | [134] |
(1) This parameter was mapped and monitored together with other parameters; (2) hyperspectral data.
Table A25.
The eligible papers that mapped and/or monitored plumes.
| Parameter | Phenomena | Remote Data or Dataset | Available Products | References 2023 | References 2022 | References 2021 |
|---|---|---|---|---|---|---|
| Plumes (1) | Anthropogenic activities | Landsat (15–30 m) | No | - | [495] | - |
| Plumes (1) | Anthropogenic activities | MERIS (300 m) | No | - | [495] | - |
| Plumes (1) | Anthropogenic activities | MODIS (0.5–1 km) | No | - | [495] | - |
| Plumes (1) | Anthropogenic activities | SeaWIFs (1.1–4.5 km) | No | - | [495] | - |
| Plumes | Sediment plumes | UAV | No | - | [496] | - |
| Plumes (1) | Sediment plumes | MODIS (0.5–1 km) | No | - | [497] | - |
| Plumes (1) | Sediment plumes | Sentinel-2 (10–20–60 m) | No | - | [135] | - |
| Plumes (1) | Suspended sediments | Geostationary Ocean Color Imager (GOCI) | No | - | - | [337] |
| Plumes (1) | Suspended sediments | Landsat (15–30 m) | No | - | - | [337] |
| Plumes (1) | Suspended sediments | Sentinel-2 (10–20–60 m) | No | - | - | [337] |
| Plumes (1) | Suspended sediments | Landsat (15–30 m) | No | - | [292] | - |
| Plumes (1) | Suspended sediments | Sentinel-2 (10–20–60 m) | No | - | [292] | - |
| Plumes (1) | Suspended sediments | - | Yes | - | [336] | - |
| Plumes (1) | Water quality estimation | Sentinel-2 (10–20–60 m) | No | - | [498] | - |
(1) This parameter was mapped and monitored together with other parameters.
Table A26.
The eligible papers that mapped and/or monitored PP.
| Parameter | Phenomena | Remote Data or Dataset | Available Products | References 2023 | References 2022 | References 2021 |
|---|---|---|---|---|---|---|
| PP (1) | LU/LC change | - | Yes | [61] | - | - |
| PP (1) | LU/LC change | MODIS (0.5–1 km) | Yes | [389] | - | - |
| PP (1) | Macroalgae | MODIS (0.5–1 km) | Yes | - | - | [204] |
| PP (1) | Mangrove ecosystems | MODIS (0.5–1 km) | Yes | - | - | [470] |
| PP (1) | Primary production | - | Yes | [69] | [289] | - |
| PP (1) | Primary production | Landsat (15–30 m) | No | [139] | - | - |
| PP (1) | Primary production | MODIS (0.5–1 km) | No | [138,139] | - | - |
(1) This parameter was mapped and monitored together with other parameters.
Table A27.
The eligible papers that mapped and/or monitored salt marshes.
| Parameter | Phenomena | Remote Data or Dataset | Available Products | References 2023 | References 2022 | References 2021 |
|---|---|---|---|---|---|---|
| Salt marshes (1) | Aboveground biomass | ASD Portable (2) | No | - | [140] | - |
| Salt marshes (1) | Aboveground biomass | Sentinel-2 (10–20–60 m) | No | - | [140] | - |
| Salt marshes (1) | Coastal salt marshes | Sentinel-1 (~10 m) | No | [141] | - | [388] |
| Salt marshes (1) | Coastal salt marshes | Sentinel-2 (10–20–60 m) | No | [141] | - | - |
| Salt marshes (1) | Habitat | Landsat (15–30 m) | No | - | [119,422] | - |
| Salt marshes (1) | Habitat | Sentinel-2 (10–20–60 m) | No | - | - | [427,428] |
| Salt marshes (1) | Habitat | UAV-Lidar | No | - | [142] | - |
| Salt marshes (1) | Habitat | UAV-MSI | No | - | [142] | - |
| Salt marshes (1) | Leaf area index | Sentinel-2 (10–20–60 m) | No | - | [469] | - |
(1) This parameter was mapped and monitored together with other parameters; (2) hyperspectral data.
Table A28.
The eligible papers that mapped and/or monitored SLA and SLR.
| Parameter | Phenomena | Remote Data or Dataset | Available Products | References 2023 | References 2022 | References 2021 |
|---|---|---|---|---|---|---|
| SLA (1) | Bottom friction coefficients | - | Yes | - | - | [268] |
| SLA (1) | Climate change | - | Yes | - | - | [147] |
| SLA (1) | Climate change | NOAA | Yes | - | - | [396,397] |
| SLA (1) | Coastline change | - | Yes | [150,269] | [499,500] | - |
| SLA (1) | Coastal vulnerability assessment | - | Yes | [273] | - | - |
| SLA (1) | Coastal vulnerability assessment | ENVISAT | Yes | - | - | [145] |
| SLA (1) | Coastal vulnerability assessment | ERS | Yes | - | - | [145] |
| SLA (1) | Coastal vulnerability assessment | RADARSAT | Yes | - | - | [145] |
| SLA (1) | Coastal vulnerability assessment | Global Sea Level Observing (GLOSS) | Yes | - | [275] | - |
| SLA (1) | Effects of extreme events | - | Yes | [153] | - | [170,501] |
| SLA | Effects of extreme events | Global Navigation Satellite Systems interferometric reflectometry (GNSS-R) fixed station | No | - | - | [143] |
| SLA (1) | Fishing zones | - | Yes | [303] | - | - |
| SLA (1) | Flood extent | - | Yes | [62] | [354] | - |
| SLA (1) | Global tide | - | Yes | - | - | [502] |
| SLA (1) | Global tide | FES2014 | Yes | - | - | [503] |
| SLA (1) | LU/LC change | - | Yes | - | - | [443] |
| SLA (1) | Influence of El-Nino | - | Yes | - | - | [472] |
| SLA (1) | Plastic litter | - | Yes | - | - | [146] |
| SLA (1) | Sea level anomaly | - | Yes | [64] | - | [63,144,504,505,506,507] |
| SLA (1) | Sea level anomaly | Jason-3 altimeter | No | - | [290] | - |
| SLA | Sea level anomaly | GNSS-R fixed station | Yes | - | - | [508] |
| SLA | Sea level anomaly | GNSS-R Geo fixed station | No | - | [509] | |
| SLA (1) | Sea level anomaly | X-TRACK multisatellite | Yes | - | - | [144] |
| SLA (1) | SST | Yes | - | - | [510] | |
| SLA (1) | Subsidence | Sentinel-1 (~10 m) | No | - | [379] | - |
| SLA (1) | Tidal evolution | X-TRACK multisatellite | Yes | - | [511] | - |
| SLA (1) | Tidal flat | - | Yes | - | [375] | - |
| SLR (1) | Sea level rise | - | Yes | [384,456] | [381] | [512] |
| SLR (1) | Sea level rise | Global LiDAR lowland DTM (GLL_DTM) | Yes | - | - | [513] |
(1) This parameter was mapped and monitored together with other parameters.
Table A29.
The eligible papers that mapped and/or monitored SSS.
| Parameter | Phenomena | Remote Data or Dataset | Available Products | References 2023 | References 2022 | References 2021 |
|---|---|---|---|---|---|---|
| SSS (1) | Coastal salt marshes | - | Yes | - | - | [388] |
| SSS (1) | Effects of extreme events | - | Yes | [59] | - | - |
| SSS (1) | Harmful algal bloom | - | Yes | [304] | - | - |
| SSS (1) | Hydrographic structure | - | Yes | [280] | - | - |
| SSS (1) | Mangrove ecosystems | - | Yes | - | [133,480] | - |
| SSS (1) | Marine aquaculture | - | Yes | - | [514] | - |
| SSS (1) | Phytoplankton | - | Yes | - | [311,318] | - |
| SSS (1) | Red tide bloom | GNSS-R | No | - | [188] | - |
| SSS (1) | Seagrass | - | Yes | - | - | [321] |
| SSS (1) | SSS | - | Yes | - | - | [148] |
| SSS | SSS plumes | - | Yes | - | - | [515] |
| SSS (1) | SST and SSS fronts | - | Yes | [65] | - | - |
| SSS (1) | Water quality estimation | - | Yes | - | [327] | - |
(1) This parameter was mapped and monitored together with other parameters.
Table A30.
The eligible papers that mapped and/or monitored SST.
| Parameter | Phenomena | Remote Data or Dataset | Available Products | References 2023 | References 2022 | References 2021 |
|---|---|---|---|---|---|---|
| SST (1) | Anthropogenic activities | Landsat (15–30 m) | No | - | [167] | - |
| SST (1) | Biotoxin risk | - | Yes | - | - | [296] |
| SST (1) | Algal blooms | MODIS (0.5–1 km) | No | [72] | - | - |
| SST (1) | Algae distribution | - | Yes | - | [206] | - |
| SST (1) | Biosiliceous sedimentation flux | Landsat (15–30 m) | No | - | [267] | - |
| SST (1) | Cyanobacterial pigment concentrations | - | Yes | - | - | [89,182] |
| SST (1) | Discharge water temperature | Landsat (15–30 m) | No | - | [516] | - |
| SST (1) | Effects of COVID-19 lockdown | - | Yes | - | [169] | - |
| SST | Escherichia coli | UAV TIR | No | - | [517] | - |
| SST (1) | Effects of extreme events | - | Yes | [59,153] | - | - |
| SST (1) | Fishing zones | MODIS (0.5–1 km) | Yes | [303,382] | - | - |
| SST (1) | Giant kelp | NOAA | Yes | - | - | [228] |
| SST (1) | Green tide | AVHRR (5 km) | Yes | - | [199] | - |
| SST (1) | Green tide | Landsat (15–30 m) | No | - | - | [200] |
| SST (1) | Green tide | MODIS (0.5–1 km) | No | - | - | [200] |
| SST (1) | Harmful algal bloom | MODIS (0.5–1 km) | Yes | [304] | [305] | [76] |
| SST (1) | Harmful algal risk | - | Yes | - | - | [296] |
| SST | Habitat | NOAA | Yes | - | - | [518] |
| SST (1) | Hydrographic structure | - | Yes | [280] | - | - |
| SST (1) | Industrial warm drainage | TASI-600, airborne thermal infrared imaging spectral system | No | [519] | - | - |
| SST (1) | Influence of El-Nino | - | Yes | - | - | [472] |
| SST (1) | Invasive alien species | - | Yes | - | - | [520] |
| SST (1) | Macroalgae | - | Yes | - | [206] | - |
| SST (1) | Mangrove ecosystems | MODIS (0.5–1 km) | Yes | - | [133,480] | - |
| SST (1) | Marine aquaculture | - | Yes | - | [514] | [75] |
| SST | Marine heatwaves | - | Yes | - | - | [149] |
| SST (1) | Marine heatwaves | - | Yes | - | [282] | |
| SST (1) | Marine heatwaves | NOAA | Yes | - | [521] | - |
| SST (1) | Oil spill | - | Yes | - | [307] | - |
| SST (1) | Phytoplankton | - | Yes | - | [311,318] | - |
| SST (1) | Primary production | - | Yes | - | [289] | - |
| SST (1) | Primary production | Landsat (15–30 m) | Yes | [139] | ||
| SST (1) | Primary production | MERIS (300 m) | Yes | - | [157] | - |
| SST (1) | Primary production | MODIS (0.5–1 km) | Yes | [69,138] | [157] | - |
| SST (1) | Particulate organic carbon | MODIS (0.5–1 km) | Yes | - | [309] | - |
| SST (1) | Phytoplankton blooms | MODIS (0.5–1 km) | No | [184] | - | |
| SST (1) | Plastic litter | - | Yes | - | - | [146] |
| SST (1) | Red tide bloom | GNSS-R | No | - | [188] | - |
| SST (1) | Seagrass | MODIS (0.5–1 km) | Yes | - | - | [321] |
| SST (1) | Sea ice | - | Yes | - | - | [111] |
| SST (1) | SSS | - | Yes | - | - | [148] |
| SST (1) | SSS and SST fronts | - | Yes | [65] | - | - |
| SST (1) | SST front | MODIS (0.5–1 km) | Yes | - | - | [522,523] |
| SST | SST prediction capability | AATSR | Yes | [68] | - | - |
| SST | SST prediction capability | AVHRR | Yes | [68] | - | - |
| SST | SST prediction capability | MODIS (0.5–1 km) | Yes | [68] | - | - |
| SST | SST prediction capability | SEVIRI | Yes | [68] | - | - |
| SST (1) | SST | - | Yes | - | [291] | [510] |
| SST (1) | Water quality estimation | AVHRR | Yes | - | - | [322] |
(1) This parameter was mapped and monitored together with other parameters.
Table A31.
The eligible papers that mapped and/or monitored the shoreline.
| Parameter | Phenomena | Remote Data or Dataset | Available Products | References 2023 | References 2022 | References 2021 |
|---|---|---|---|---|---|---|
| Shoreline (1) | Anthropogenic activities | Landsat (15–30 m) | No | - | [167] | - |
| Shoreline (1) | Avulsion sites | Landsat (15–30 m) | No | - | [340] | - |
| Shoreline (1) | Bathymetry | Sentinel-2 (10–20–60 m) | No | [84] | - | [258] |
| Shoreline (1) | Climate Change | - | Yes | - | - | [396] |
| Shoreline | Coastline change | - | Yes | - | - | [524] |
| Shoreline | Coastline change | Aerial photos | No | [525,526] | [527,528] | [398,529] |
| Shoreline (1) | Coastline change | Aerial photos | No | [400,406] | [530,531] | [398,532] |
| Shoreline (1) | Coastline change | ALOS Palsar | Yes | - | - | [117] |
| Shoreline | Coastline change | ASAR | No | - | - | [151] |
| Shoreline (1) | Coastline change | ASAR | No | - | [344] | - |
| Shoreline | Coastline change | Canadian RadarSAT-2 spaceborne | No | - | - | [533] |
| Shoreline | Coastline change | GaoFen-1 (2–8 m) | No | - | - | [534] |
| Shoreline | Coastline change | GaoFen3-SAR (4.5–5 m) | No | - | - | [151] |
| Shoreline | Coastline change | Google Earth image | No | [525,526] | [528,535] | - |
| Shoreline (1) | Coastline change | Google Earth image | No | [150,269] | [345,404,531] | [398,532] |
| Shoreline | Coastline change | HSI ZiYuan1-02D (30 m) (2) | No | [409] | - | |
| Shoreline (1) | Coastline change | Landsat (15–30 m) | No | [150,269,293,342,399,400,406] | [213,344,345,401,402,403,404,499,500,530,536,537] | [117,171,214,271,332,347,532] |
| Shoreline | Coastline change | Landsat (15–30 m) | No | [525,526] | [538,539,540] | [70,151,152,154,541,542,543] |
| Shoreline | Coastline change | SPOT (~10–20 m) | No | - | [544] | - |
| Shoreline (1) | Coastline change | Sentinel-1 (~10 m) | No | [343] | [344] | [117] |
| Shoreline | Coastline change | Sentinel-1 (~10 m) | No | - | [538] | [151,545] |
| Shoreline (1) | Coastline change | Sentinel-2 (10–20–60 m) | No | [343,406,546] | [270,346,348,401,407,408,409,530,537] | [171,347] |
| Shoreline | Coastline change | Sentinel-2 (10–20–60 m) | No | [343,406] | [538] | [70,541] |
| Shoreline (1) | Coastline change | RapidEye (5 m) | No | [293] | [410] | - |
| Shoreline (1) | Coastline change | Planetscope (3 m) | No | [293] | [410] | - |
| Shoreline | Coastline change | Pleiades (0.5–2 m) | No | - | [527,547] | - |
| Shoreline (1) | Coastline change | Portable lidar | No | [410] | - | |
| Shoreline | Coastline change | UAV | no | - | [346,528] | - |
| Shoreline (1) | Coastline change | UAV | No | - | [270,346,348,531] | [398,529] |
| Shoreline | Coastline change | WorldView-2 (~0.5–2 m) | No | - | [527] | - |
| Shoreline (1) | Coastal aquaculture ponds | Sentinel-2 (10–20–60 m) | No | - | [77] | - |
| Shoreline (1) | Coastal vulnerability assessment | Aerial photos | No | [91] | [361] | - |
| Shoreline (1) | Coastal vulnerability assessment | Google Earth image | No | - | [361] | - |
| Shoreline | Coastal vulnerability assessment | Landsat (15–30 m) | No | - | - | [548] |
| Shoreline (1) | Coastal vulnerability assessment | Landsat (15–30 m) | No | [411] | [275] | [102,166,352,412] |
| Shoreline (1) | Coastal vulnerability assessment | Sentinel-2 (10–20–60 m) | No | - | - | [352] |
| Shoreline (1) | Coastal vulnerability assessment | Pleiades (0.5–2 m) | No | - | - | [352] |
| Shoreline (1) | Coastal vulnerability assessment | UAV | No | [91] | - | - |
| Shoreline (1) | Coastal vulnerability assessment | Video camera systems | No | [273] | - | - |
| Shoreline (1) | Coastal vulnerability assessment | WorldView-2 (~0.5–2 m) | No | [91] | - | - |
| Shoreline (1) | Deltaic estuarine transformations | Landsat (15–30 m) | No | [116] | - | - |
| Shoreline (1) | Effects of COVID-19 lockdown | GaoFen-1 WFV (16 m) | No | - | - | [549] |
| Shoreline (1) | Effects of COVID-19 lockdown | Landsat (15–30 m) | No | - | - | [549] |
| Shoreline | Effects of extreme events | Google Earth image | No | [550] | - | - |
| Shoreline | Effects of extreme events | Landsat (15–30 m) | No | [550] | - | - |
| Shoreline (1) | LU/LC change | - | Yes | - | - | [433] |
| Shoreline (1) | LU/LC change | Aerial photos | No | [364] | - | - |
| Shoreline (1) | LU/LC change | Landsat (15–30 m) | - | - | [217] | |
| Shoreline (1) | LU/LC change | Quickbird | - | - | [217] | |
| Shoreline (1) | LU/LC change | SPOT (~10–20 m) | - | - | [217] | |
| Shoreline (1) | LU/LC change | Pleiades (0.5–2 m) | No | [364] | - | - |
| Shoreline (1) | Habitat | GeoEye | No | - | [420] | - |
| Shoreline (1) | Habitat | Google Earth image | No | - | - | [164] |
| Shoreline (1) | Habitat | Sentinel-2 (10–20–60 m) | No | - | [551,552] | - |
| Shoreline (1) | Morphological evolution | Huanjing-1B (150–300 m) | No | - | [294] | - |
| Shoreline (1) | Mangrove ecosystems | Landsat (15–30 m) | No | - | [122] | [475,477,479] |
| Shoreline (1) | Morphological evolution | GaoFen-1 WFV (16 m) | No | - | [294] | - |
| Shoreline | Morphological evolution | Landsat (15–30 m) | No | [283] | - | - |
| Shoreline (1) | Morphological evolution | Landsat (15–30 m) | No | - | [285,294] | - |
| Shoreline (1) | Morphological evolution | Sentinel-2 (10–20–60 m) | No | - | [553] | - |
| Shoreline (1) | Morphological evolution | UAV | No | - | [285,287] | - |
| Shoreline (1) | Oil spill | - | Yes | [490] | [494] | - |
| Shoreline (1) | Oil spill | Sentinel-1 (~10 m) | No | - | [334] | - |
| Shoreline (1) | Sea level rise | Landsat (15–30 m) | No | - | [381] | [506] |
| Shoreline (1) | Sea level rise | WorldView-2 (~0.5–2 m) | No | - | [381] | [506] |
| Shoreline (1) | Suspended sediments | Landsat (15–30 m) | No | - | - | [337] |
| Shoreline (1) | Suspended sediments | Sentinel-2 (10–20–60 m) | No | - | - | [337] |
| Shoreline (1) | Tidal flat | Sentinel-2 (10–20–60 m) | No | - | - | [554] |
| Shoreline (1) | Water quality estimation | Landsat (15–30 m) | No | - | [323,324] | - |
| Shoreline (1) | Water quality estimation | Sentinel-2 (10–20–60 m) | No | - | [323,324] | - |
(1) This parameter was mapped and monitored together with other parameters; (2) hyperspectral data.
Table A32.
The eligible papers that mapped and/or monitored soil salinization and soil moisture.
| Parameter | Phenomena | Remote Data or Dataset | Available Products | References 2023 | References 2022 | References 2021 |
|---|---|---|---|---|---|---|
| Soil salinization (1) | LU/LC change | Landsat (15–30 m) | No | - | - | [434] |
| Soil salinization | Soil salinization | ASD Portable (2) | No | - | - | [555] |
| Soil salinization (1) | Soil salinization | Landsat (15–30 m) | No | [457,556] | [156,458] | [155] |
| Soil salinization (1) | Soil salinization | MODIS (0.5–1 km) | No | [459] | - | - |
| Soil salinization (1) | Soil salinization | Sentinel-2 (10–20–60 m) | No | - | - | [125] |
| Soil salinization (1) | Soil salinization | Portable SOC710VP | No | - | - | [125] |
| Soil salinization (1) | Soil salinization | UAV | No | - | - | [125] |
| Soil moisture (1) | Urban sprawl | MODIS (0.5–1 km) | No | [113] | - | - |
(1) This parameter was mapped and monitored together with other parameters; (2) hyperspectral data.
Table A33.
The eligible papers that mapped and/or monitored SPM, SSCs, and TSM.
| Parameter | Phenomena | Remote Data or Dataset | Available Products | References 2023 | References 2022 | References 2021 |
|---|---|---|---|---|---|---|
| SPM | Global suspended sediments | Visible Infrared Imaging Radiometer Suite (VIIRS) | No | - | - | [557] |
| SPM (1) | Suspended sediments | Geostationary Ocean Color Imager (GOCI) (500 m) | No | - | - | [337] |
| SPM | Suspended sediments | HY-1C/D (50 m) | No | [56] | - | - |
| SPM | Suspended sediments | Landsat (15–30 m) | No | [56] | - | - |
| SPM (1) | Suspended sediments | Landsat (15–30 m) | No | - | - | [337] |
| SPM (1) | Suspended sediments | Sentinel-2 (10–20–60 m) | No | - | - | [337] |
| SSCs (1) | Anthropogenic activities | Landsat (15–30 m) | No | - | [495] | - |
| SSCs (1) | Anthropogenic activities | MERIS (300 m) | No | - | [495] | - |
| SSCs (1) | Anthropogenic activities | MODIS (0.5–1 km) | No | - | [495] | - |
| SSCs (1) | Anthropogenic activities | SeaWIFs (1.1–4.5 km) | No | - | [495] | - |
| SSCs (1) | Coastal structures | GOCI (500 m) | No | - | - | [272] |
| SSCs (1) | Coastal structures | Landsat (15–30 m) | No | - | - | [272] |
| SSCs (1) | Climate change | Landsat (15–30 m) | No | - | [495] | - |
| SSCs (1) | Climate change | MERIS (300 m) | No | - | [495] | - |
| SSCs (1) | Climate change | MODIS (0.5–1 km) | No | - | [495] | - |
| SSCs (1) | Climate change | SeaWIFs (1.1–4.5 km) | No | - | [495] | - |
| SSCs (1) | Distribution of heavy metals | MODIS (0.5–1 km) | No | [276] | - | - |
| SSCs (1) | Effects of extreme events | GOCI (500 m) | No | - | - | [170] |
| SSCs (1) | Seaweed aquaculture | HY-1C (50 m) | No | - | [80] | - |
| SSCs (1) | Seaweed aquaculture | Sentinel-2 (10–20–60 m) | No | - | [80] | - |
| SSCs (1) | Sediment plumes | Sentinel-2 (10–20–60 m) | No | - | [135] | - |
| SSCs (1) | Suspended sediments | ASD Portable (2) | No | - | [292] | [558] |
| SSCs (1) | Suspended sediments | Landsat (15–30 m) | No | - | [292] | - |
| SSCs (1) | Suspended sediments | Sentinel-2 (10–20–60 m) | No | - | [292] | - |
| TSM (1) | Dissolved organic carbon | MODIS (0.5–1 km) | Yes | - | [297] | |
| TSM (1) | Effects of COVID-19 lockdown | GaoFen-1 WFV (16 m) | No | - | - | [549] |
| TSM (1) | Effects of COVID-19 lockdown | Landsat (15–30 m) | No | - | - | [549] |
| TSM (1) | Eutrophication | DJI M600Pro UAV (2) | No | [299] | - | - |
| TSM (1) | Eutrophication | hyperspectral imager Pika L (2) | No | [299] | - | - |
| TSM (1) | Harmful algal bloom | Sentinel-2 (10–20–60 m) | No | - | - | [183] |
| TSM (1) | Marine aquaculture | - | Yes | - | - | [75] |
| TSM (1) | Phenology and niche ecology of harmful species | METEOSAT | Yes | - | [159] | - |
| TSM (1) | Phytoplankton | Sentinel-2 (10–20–60 m) | No | - | - | [331] |
| TSM (1) | Seagrass | Landsat (15–30 m) | No | - | [232] | - |
| TSM (1) | Seagrass | MODIS (0.5–1 km) | Yes | - | - | [321] |
| TSM (1) | Suspended sediments | - | Yes | - | [336] | - |
| TSM (1) | Water hyacinth | Sentinel-2 (10–20–60 m) | No | - | [160] | - |
| TSM (1) | Water quality estimation | MODIS (0.5–1 km) | No | - | [88] | - |
| TSM (1) | Water quality estimation | Landsat (15–30 m) | No | - | [86,88,191] | - |
| TSM (1) | Water quality estimation | Sentinel-2 (10–20–60 m) | No | [326] | [86,88,160,191,327] | - |
| TSM (1) | Water quality estimation | Sentinel-3 (300 m) | No | - | [86,88] | [90] |
| TSM (1) | Water quality estimation | UAV | No | [326] | - | - |
(1) This parameter was mapped and monitored together with other parameters; (2) hyperspectral data.
Table A34.
The eligible papers that mapped and/or monitored tidal data.
| Parameter | Phenomena | Remote Data or Dataset | Available Products | References 2023 | References 2022 | References 2021 |
|---|---|---|---|---|---|---|
| Tidal data (1) | Bathymetry | Sentinel-2 (10–20–60 m) | No | [84] | - | - |
| Tidal data (1) | Bottom friction coefficients | - | Yes | - | - | [268] |
| Tidal data (1) | Bull and giant kelp | - | Yes | - | - | [226,229] |
| Tidal data (1) | Coastal structures | - | Yes | - | - | [272] |
| Tidal data (1) | Coastline change | - | Yes | [150,269,546] | [346,530,536] | [271,347,532] |
| Tidal data (1) | Coastal vulnerability assessment | - | Yes | - | - | [145] |
| Tidal data (1) | Coastal vulnerability assessment | WXTide | Yes | - | [275] | - |
| Tidal data (1) | Discharge water temperature | - | Yes | - | [516] | - |
| Tidal data (1) | Effects of extreme events | - | Yes | [501] | - | [170] |
| Tidal data (1) | Flood extent | - | Yes | [62] | - | - |
| Tidal data (1) | Global tide | - | Yes | - | - | [502] |
| Tidal data (1) | Global tide | FES2014 | Yes | - | - | [503] |
| Tidal data (1) | Industrial warm drainage | airborne | No | [519] | - | - |
| Tidal data (1) | Habitat | - | - | [164] | ||
| Tidal data (1) | Morphological evolution | - | Yes | - | [295] | - |
| Tidal data (1) | Oil spill | - | Yes | - | [335] | - |
| Tidal data (1) | Sea level | - | Yes | - | - | [504] |
| Tidal data (1) | Sea level anomaly | - | Yes | - | - | [63] |
| Tidal data (1) | Sea level anomaly | X-TRACK multisatellite | Yes | - | [511] | [144] |
| Tidal data (1) | Tidal evolution | X-TRACK multisatellite | Yes | - | [511] | - |
| Tidal data (1) | Tidal flat | - | Yes | - | - | [554] |
(1) This parameter was mapped and monitored together with other parameters.
Table A35.
The eligible papers that mapped and/or monitored vegetation cover.
| Parameter | Phenomena | Remote Data or Dataset | Available Products | References 2023 | References 2022 | References 2021 |
|---|---|---|---|---|---|---|
| Vegetation cover (1) | Aboveground biomass | Landsat (15–30 m) | No | - | - | [393] |
| Vegetation cover (1) | Aboveground biomass | Sentinel-2 (10–20–60 m) | No | - | [140] | - |
| Vegetation cover (1) | Aboveground biomass | UAV | No | - | - | [393] |
| Vegetation cover (1) | Agricultural nonpoint source pollution | Sentinel-2 (10–20–60 m) | No | - | [394] | - |
| Vegetation cover (1) | Anthropogenic activities | Landsat (15–30 m) | No | - | [167] | - |
| Vegetation cover (1) | Avulsion sites | Landsat (15–30 m) | No | - | [340] | - |
| Vegetation cover (1) | Coastal aquaculture ponds | Google Earth images | No | - | [78] | - |
| Vegetation cover (1) | Coastal aquaculture ponds | Landsat (15–30 m) | No | - | [78,79] | - |
| Vegetation cover (1) | Coastal aquaculture ponds | Sentinel-2 (10–20–60 m) | No | - | [78,79] | - |
| Vegetation cover (1) | Coastal forested wetland | UAV | No | - | [341] | - |
| Vegetation cover (1) | Coastline change | Landsat (15–30 m) | No | [163] | [403] | - |
| Vegetation cover (1) | Coastal vulnerability assessment | Landsat (15–30 m) | No | [411] | - | [412] |
| Vegetation cover (1) | Coastal vulnerability assessment | Sentinel-2 (10–20–60 m) | No | - | - | [166] |
| Vegetation cover (1) | Effects of extreme events | RapidEye (5 m) | No | - | - | [414] |
| Vegetation cover (1) | Giant kelp | Sentinel-2 (10–20–60 m) | No | - | - | [228] |
| Vegetation cover (1) | Green tide | Landsat (15–30 m) | No | - | [199] | [194] |
| Vegetation cover (1) | Green tide | Sentinel-2 (10–20–60 m) | No | - | [199] | - |
| Vegetation cover (1) | Habitat | GaoFen2 (0.8–3.2 m) | No | - | - | [559] |
| Vegetation cover (1) | Habitat | GaoFen3 | No | [416] | ||
| Vegetation cover (1) | Habitat | Landsat (15–30 m) | No | [165,438] | [420,421,551] | [424,559] |
| Vegetation cover (1) | Habitat | RapidEye (5 m) | No | - | - | [424] |
| Vegetation cover (1) | Habitat | Remotely piloted aircraft (RPAs) | No | - | - | [230] |
| Vegetation cover (1) | Habitat | Sentinel-1 (~10 m) | No | - | - | [560] |
| Vegetation cover (1) | Habitat | Sentinel-2 (10–20–60 m) | No | [215] | [420,552] | [428,560] |
| Vegetation cover (1) | Habitat | UAV-MSI | No | - | [142] | [279,355] |
| Vegetation cover (1) | Habitat | UAV- Lidar | No | - | [142] | - |
| Vegetation cover (1) | Influence of El-Nino | Landsat | No | - | - | [472] |
| Vegetation cover (1) | Intertidal polychaete reefs | UAV-MSI | No | - | [82] | - |
| Vegetation cover (1) | Invasive alien species | Landsat (15–30 m) | No | - | - | [520] |
| Vegetation cover (1) | Invasive alien species | Sentinel-2 (10–20–60 m) | No | - | - | [473,520] |
| Vegetation cover (1) | Invasive alien species | UAV-MSI | No | [161] | - | - |
| Vegetation cover (1) | LU/LC change | - | Yes | [129] | - | - |
| Vegetation cover (1) | LU/LC change | Landsat (15–30 m) | No | [389,439,440] | [114,358,441] | [155,390,434,443] |
| Vegetation cover (1) | LU/LC change | Sentinel-2 (10–20–60 m) | No | [440] | [114,441] | - |
| Vegetation cover (1) | LU/LC change | WorldView-2 (~0.5–2 m) | No | - | [430] | - |
| Vegetation cover (1) | Macroalgae | MODIS (0.5–1 km) | No | - | [203] | - |
| Vegetation cover (1) | Mangrove ecosystems | G-LiHT airborne image (2) | No | - | - | [162] |
| Vegetation cover (1) | Mangrove ecosystems | Google Earth images | No | [476] | - | - |
| Vegetation cover (1) | Mangrove ecosystems | Landsat (15–30 m) | No | [124] | [449] | [162,478,479] |
| Vegetation cover (1) | Mangrove ecosystems | MODIS (0.5–1 km) | Yes | - | [480] | - |
| Vegetation cover (1) | Mangrove ecosystems | Sentinel-2 (10–20–60 m) | No | [476] | [366] | [123] |
| Vegetation cover (1) | Mangrove ecosystems | WorldView-2 (~0.5–2 m) | No | - | - | [123] |
| Vegetation cover (1) | Mangrove ecosystems | UAV | No | - | - | [123] |
| Vegetation cover (1) | Microphytobenthos | Sentinel-2 (10–20–60 m) | No | - | [208] | - |
| Vegetation cover (1) | Morphological evolution | Landsat (15–30 m) | No | - | [285] | - |
| Vegetation cover (1) | Morphological evolution | Sentinel-2 (10–20–60 m) | No | - | [553] | - |
| Vegetation cover (1) | Morphological evolution | UAV-MSI | No | - | [285] | - |
| Vegetation cover (1) | Primary production | Landsat (15–30 m) | No | [139] | - | - |
| Vegetation cover (1) | Primary production | MODIS (0.5–1 km) | No | [139] | - | - |
| Vegetation cover (1) | Sea snots | Sentinel-2 (10–20–60 m) | No | - | [190] | - |
| Vegetation cover (1) | Seaweed aquaculture | HY-1C (50 m) | No | - | [80] | - |
| Vegetation cover (1) | Seaweed aquaculture | Sentinel-1 (~10 m) | No | - | [223] | - |
| Vegetation cover (1) | Seaweed aquaculture | Sentinel-2 (10–20–60 m) | No | - | [80] | - |
| Vegetation cover (1) | Soil salinization | Landsat (15–30 m) | No | [459,556] | [156,458] | [155] |
| Vegetation cover (1) | Soil salinization | MODIS (0.5–1 km) | No | [459] | - | - |
| Vegetation cover (1) | Soil salinization | Sentinel-2 (10–20–60 m) | No | - | - | [125] |
| Vegetation cover (1) | Soil salinization | SOC710VP portable | No | - | - | [125] |
| Vegetation cover (1) | Soil salinization | UAV | No | - | - | [125] |
| Vegetation cover (1) | Tidal flat | Sentinel-2 (10–20–60 m) | No | - | [453] | [554] |
| Vegetation cover (1) | Urban sprawl | Hyperion (30 m) (2) | No | [115] | - | - |
| Vegetation cover (1) | Urban sprawl | Landsat (15–30 m) | No | [461,462] | [463,464,465] | [392] |
| Vegetation cover (1) | Urban sprawl | MIVIS airborne (2) | No | [466] | - | - |
| Vegetation cover (1) | Urban sprawl | MODIS (0.5–1 km) | No | [113] | - | - |
| Vegetation cover (1) | Urban sprawl | PRISMA (30 m) (2) | No | [115] | - | - |
| Vegetation cover (1) | Water hyacinth | Sentinel-2 (10–20–60 m) | No | - | [160] | - |
| Vegetation cover (1) | Water quality estimation | Sentinel-2 (10–20–60 m) | No | - | [160] | - |
| Vegetation structure (1) | Mangrove ecosystems | G-LiHT airborne image (2) | No | - | - | [162] |
(1) This parameter was mapped and monitored together with other parameters; (2) hyperspectral data.
Table A36.
The eligible papers that mapped and/or monitored vegetation species.
| Parameter | Phenomena | Remote Data or Dataset | Available Products | References 2023 | References 2022 | References 2021 |
|---|---|---|---|---|---|---|
| Coastal vegetation (1) | Coastal vulnerability assessment | Sentinel-2 (10–20–60 m) | No | - | - | [166] |
| Coastal vegetation (1) | Habitat | GaoFen2 (0.8–3.2 m) | No | - | - | [559] |
| Coastal vegetation (1) | Habitat | Google Earth image | No | - | - | [164] |
| Coastal vegetation (1) | Habitat | Landsat (15–30 m) | No | - | - | [424,559] |
| Coastal vegetation (1) | Habitat | RapidEye (5 m) | No | - | - | [424] |
| Coastal vegetation (1) | Wetland Biodiversity Estimation | ZiYuan1-02D-HIS (30 m) (2) | No | - | [467] | - |
| Coastal vegetation (1) | Wetland Biodiversity Estimation | ZiYuan1-02D-MSI (10 m) | No | - | [467] | - |
| Invasive species (1) | Coastal vulnerability assessment | Landsat (15–30 m) | No | [55] | - | [413] |
| Invasive species (1) | Invasive alien species | Landsat (15–30 m) | No | - | - | [520] |
| Invasive species (1) | Invasive alien species | Sentinel-2 (10–20–60 m) | No | - | - | [473,520] |
| Invasive species (1) | Invasive alien species | UAV-MSI | No | [161] | - | - |
| Invasive species (1) | Invasive alien species | UAV | No | [161] | - | - |
| Invasive species (1) | LU/LC change | Google Earth image | No | - | - | [437] |
| Invasive species (1) | LU/LC change | Landsat (15–30 m) | No | - | - | [437] |
| Invasive species (1) | Mangrove ecosystems | ALOS-2 | No | - | [365] | - |
| Invasive species (1) | Mangrove ecosystems | Landsat (15–30 m) | No | - | [365] | - |
| Invasive species (1) | Mangrove ecosystems | SPOT (~10–20 m) | No | - | [365] | - |
| Invasive species (1) | Tidal flat | Sentinel-2 (10–20–60 m) | No | - | [453] | - |
| Riparian species (1) | Invasive alien species | Landsat (15–30 m) | No | - | [432] | - |
| Salt marsh species (1) | Habitat | Sentinel-1 (~10 m) | No | - | - | [560] |
| Salt marsh species (1) | Habitat | Sentinel-2 (10–20–60 m) | No | - | - | [428,560] |
| Salt marsh species (1) | Habitat | UAV-Lidar | No | - | [142] | - |
| Salt marsh species (1) | Habitat | UAV-MSI | No | - | [142] | - |
| Wetland species (1) | Habitat | Sentinel-1 (~10 m) | No | [165,215] | - | - |
| Wetland species (1) | Habitat | Sentinel-2 (10–20–60 m) | No | [215] | - | - |
| Wetland species (1) | Habitat | UAV-MSI | No | - | - | [279,355] |
(1) This parameter was mapped and monitored together with other parameters; (2) hyperspectral data.
Table A37.
The eligible papers that mapped and/or monitored the water turbidity.
| Parameter | Phenomena | Remote Data or Dataset | Available Products | References 2023 | References 2022 | References 2021 |
|---|---|---|---|---|---|---|
| Water turbidity (1) | Atmospheric correction | Sentinel-3 (300 m) | No | - | - | [53] |
| Water turbidity (1) | Anthropogenic activities | Landsat (15–30 m) | No | - | [167] | - |
| Water turbidity (1) | Biotoxin risk | - | Yes | - | - | [296] |
| Water turbidity (1) | Coastal vulnerability assessment | Landsat (15–30 m) | No | - | - | [412] |
| Water turbidity (1) | Effects of COVID-19 lockdown | Sentinel-3 (300 m) | No | - | [169] | - |
| Water turbidity (1) | Harmful algal bloom | MODIS (0.5–1 km) | No | - | - | [76] |
| Water turbidity (1) | Harmful algal risk | - | Yes | - | - | [296] |
| Water turbidity (1) | Marine aquaculture | - | Yes | - | [514] | - |
| Water turbidity (1) | Microbenthic invertebrate distribution | - | Yes | - | [306] | - |
| Water turbidity (1) | Water quality estimation | - | Yes | - | [306] | - |
| Water turbidity (1) | Water quality estimation | Landsat (15–30 m) | No | - | [323,324] | - |
| Water turbidity (1) | Water quality estimation | Sentinel-2 (10–20–60 m) | No | - | [323,324,327,328,498] | [168] |
| Water turbidity (1) | Water quality estimation | Sentinel-3 (300 m) | No | - | - | [168] |
| Rrs (645) (1) | Sediment plumes | MODIS (0.5–1 km) | No | - | [497] | - |
(1) This parameter was mapped and monitored together with other parameters.
Table A38.
The eligible papers that mapped and/or monitored the wave data.
| Parameter | Phenomena | Remote Data or Dataset | Available Products | References 2023 | References 2022 | References 2021 |
|---|---|---|---|---|---|---|
| Mean Significant Wave Height (1) | Coastal vulnerability assessment | INCOIS Wave Rider | Yes | - | [275] | - |
| Wave (1) | Coastal vulnerability assessment | - | Yes | [91] | - | - |
| Wave (1) | Coastline change | - | Yes | [546] | [346,531,537] | [171] |
| Wave (1) | Coastline change | Radar fix positions | No | - | [270] | - |
| Wave (1) | Effects of extreme events | - | Yes | - | - | [170] |
| Wave (1) | Wave heights | Jason | Yes | - | [561] | [562] |
(1) This parameter was mapped and monitored together with other parameters.
Table A39.
The eligible papers that mapped and/or monitored the wind data.
| Parameter | Phenomena | Remote Data or Dataset | Available Products | References 2023 | References 2022 | References 2021 |
|---|---|---|---|---|---|---|
| Wind (1) | Biotoxin risk | - | Yes | - | - | [296] |
| Wind (1) | Blue ice | - | Yes | - | [385] | - |
| Wind (1) | Coastline change | - | Yes | [537] | [332] | |
| Wind (1) | Coastal vulnerability assessment | - | Yes | - | - | [102,412] |
| Wind (1) | Coastal vulnerability assessment | Marine X-band radar (MR) system | Yes | - | [333] | - |
| Wind | Effects of extreme events | - | Yes | [59,153] | - | [170] |
| Wind (1) | Green tide | - | Yes | - | - | [200] |
| Wind (1) | Habitat | - | Yes | - | [552] | - |
| Wind (1) | Methane plume | - | Yes | - | [130] | - |
| Wind (1) | Morphological Evolution | - | Yes | [283] | - | - |
| Wind (1) | SST front | - | Yes | - | - | [522,523] |
| Wind (1) | Harmful algal bloom | WindSat satellite | Yes | - | [305] | - |
| Wind (1) | Harmful algal risk | - | Yes | - | - | [296] |
| Wind (1) | Marine aquaculture | - | Yes | - | [514] | [75] |
| Wind (1) | Marine heatwaves | - | Yes | - | [521] | |
| Wind (1) | Oil spill | - | Yes | - | [335] | [92] |
| Wind (1) | Phytoplankton | - | Yes | - | [318] | - |
| Wind (1) | Red tide bloom | Global Navigation Satellite System Reflectometry (GNSS-R) | Yes | - | [188] | - |
| Wind (1) | Sea ice | - | Yes | - | [386] | [111] |
| Wind (1) | Sea level anomaly | - | Yes | - | - | [507] |
| Wind (1) | Sea snots | - | Yes | - | [190] | - |
| Wind (1) | SST front | ERA | Yes | - | - | [523] |
| Wind (1) | Suspended sediments | - | Yes | - | [336] | - |
| Wind (1) | Water quality estimation | - | Yes | - | - | [322] |
| Wind (1) | Wave heights | Jason | Yes | - | [561] | [562] |
| Wind | Wind | Global Navigation Satellite System Reflectometry (GNSS-R) | Yes | - | - | [563] |
| Wind | Wind | - | Yes | [173] | [172] | |
| Wind | Wind | Sentinel-1 (~10 m) | No | - | [173] | [172] |
| Wind (1) | Wind | Sentinel-1 (~10 m) | No | - | [338] |
(1) This parameter was mapped and monitored together with other parameters.
References
- Martínez, M.L.; Intralawan, A.; Vázquez, G.; Pérez-Maqueo, O.; Sutton, P.; Landgrave, R. The Coasts of Our World: Ecological, Economic and Social Importance. Ecol. Econ. 2007, 63, 254–272. [Google Scholar] [CrossRef]
- Burke, L.; Kura, Y.; Kassem, K.; Revenga, C.; Spalding, M.; McAllister, D.; Caddy, J. Coastal Ecosystems; World Resources Institute: Washington, DC, USA, 2001. [Google Scholar]
- Avishek, K.; Xiubo, Y.; Jian, L. Ecosystem management in Asia Pacific: Bridging science–policy gap. Environ. Dev. 2012, 3, 77–90. [Google Scholar] [CrossRef]
- Hsiao, Y.-J. The Socioeconomic Impact of Coastal Environment Changes on Fishing Communities and Adaptation Strategies. Fishes 2022, 7, 243. [Google Scholar] [CrossRef]
- Konishi, H. Formation of Hub Cities: Transportation Cost Advantage and Population Agglomeration. J. Urban Econ. 2000, 48, 1–28. [Google Scholar] [CrossRef]
- Kullenberg, G. Contributions of Marine and Coastal Area Research and Observations towards Sustainable Development of Large Coastal Cities. Ocean Coast. Manag. 2001, 44, 283–291. [Google Scholar] [CrossRef]
- Intergovernmental Panel On Climate Change (IPCC). The Ocean and Cryosphere in a Changing Climate: Special Report of the Intergovernmental Panel on Climate Change, 1st ed.; Cambridge University Press: Cambridge, UK, 2022; ISBN 978-1-00-915796-4. [Google Scholar]
- Hewitt, J.E.; Ellis, J.I.; Thrush, S.F. Multiple Stressors, Nonlinear Effects and the Implications of Climate Change Impacts on Marine Coastal Ecosystems. Glob. Chang. Biol. 2016, 22, 2665–2675. [Google Scholar] [CrossRef]
- Oppenheimer, M.; Glavovic, B.; Hinkel, J.; van de Wal, R.; Magnan, A.K.; Abd-Elgawad, A.; Cai, R.; Cifuentes-Jara, M.; Deconto, R.M.; Ghosh, T.; et al. Sea Level Rise and Implications for Low Lying Islands, Coasts and Communities. In IPCC Special Report on the Ocean and Cryosphere in a Changing Climate; Cambridge University Press: Cambridge, UK, 2019. [Google Scholar]
- Thrush, S.F.; Hewitt, J.E.; Gladstone-Gallagher, R.V.; Savage, C.; Lundquist, C.; O’Meara, T.; Vieillard, A.; Hillman, J.R.; Mangan, S.; Douglas, E.J.; et al. Cumulative Stressors Reduce the Self-regulating Capacity of Coastal Ecosystems. Ecol. Appl. 2021, 31, e02223. [Google Scholar] [CrossRef] [PubMed]
- Crain, C.M.; Halpern, B.S.; Beck, M.W.; Kappel, C.V. Understanding and Managing Human Threats to the Coastal Marine Environment. Ann. N. Y. Acad. Sci. 2009, 1162, 39–62. [Google Scholar] [CrossRef]
- Adebisi, N.; Balogun, A.-L.; Min, T.H.; Tella, A. Advances in Estimating Sea Level Rise: A Review of Tide Gauge, Satellite Altimetry and Spatial Data Science Approaches. Ocean Coast. Manag. 2021, 208, 105632. [Google Scholar] [CrossRef]
- Minnett, P.; Alvera-Azcárate, A.; Chin, T.; Corlett, G.; Gentemann, C.; Karagali, I.; Li, X.; Marsouin, A.; Marullo, S.; Maturi, E.; et al. Half a Century of Satellite Remote Sensing of Sea-Surface Temperature. Remote Sens. Environ. 2019, 233, 111366. [Google Scholar] [CrossRef]
- Adade, R.; Aibinu, A.M.; Ekumah, B.; Asaana, J. Unmanned Aerial Vehicle (UAV) Applications in Coastal Zone Management—A Review. Environ. Monit Assess 2021, 193, 154. [Google Scholar] [CrossRef] [PubMed]
- Apostolopoulos, D.; Nikolakopoulos, K. A Review and Meta-Analysis of Remote Sensing Data, GIS Methods, Materials and Indices Used for Monitoring the Coastline Evolution over the Last Twenty Years. Eur. J. Remote Sens. 2021, 54, 240–265. [Google Scholar] [CrossRef]
- Ashphaq, M.; Srivastava, P.K.; Mitra, D. Review of Near-Shore Satellite Derived Bathymetry: Classification and Account of Five Decades of Coastal Bathymetry Research. J. Ocean Eng. Sci. 2021, 6, 340–359. [Google Scholar] [CrossRef]
- Bagheri-Gavkosh, M.; Hosseini, S.M.; Ataie-Ashtiani, B.; Sohani, Y.; Ebrahimian, H.; Morovat, F.; Ashrafi, S. Land Subsidence: A Global Challenge. Sci. Total Environ. 2021, 778, 146193. [Google Scholar] [CrossRef] [PubMed]
- Chaturvedi, S.K. Disaster Management: Tsunami and Remote Sensing Technology. Nat. Environ. Pollut. Technol. 2021, 20, 2125–2136. [Google Scholar] [CrossRef]
- Datta, A.; Maharaj, S.; Prabhu, G.N.; Bhowmik, D.; Marino, A.; Akbari, V.; Rupavatharam, S.; Sujeetha, J.A.R.P.; Anantrao, G.G.; Poduvattil, V.K.; et al. Monitoring the Spread of Water Hyacinth (Pontederia Crassipes): Challenges and Future Developments. Front. Ecol. Evol. 2021, 9, 631338. [Google Scholar] [CrossRef]
- Gijsman, R.; Horstman, E.M.; Van Der Wal, D.; Friess, D.A.; Swales, A.; Wijnberg, K.M. Nature-Based Engineering: A Review on Reducing Coastal Flood Risk with Mangroves. Front. Mar. Sci. 2021, 8, 702412. [Google Scholar] [CrossRef]
- Gupana, R.S.; Odermatt, D.; Cesana, I.; Giardino, C.; Nedbal, L.; Damm, A. Remote Sensing of Sun-Induced Chlorophyll-a Fluorescence in Inland and Coastal Waters: Current State and Future Prospects. Remote Sens. Environ. 2021, 262, 112482. [Google Scholar] [CrossRef]
- Kieu, H.T.; Law, A.W.-K. Remote Sensing of Coastal Hydro-Environment with Portable Unmanned Aerial Vehicles (pUAVs) a State-of-the-Art Review. J. Hydro-Environ. Res. 2021, 37, 32–45. [Google Scholar] [CrossRef]
- Murthy, M.V.R.; Usha, T.; Kankara, R.S. Three Decades of Indian Remote Sensing in Coastal Research. J. Indian Soc. Remote Sens. 2022, 50, 599–612. [Google Scholar] [CrossRef]
- Parthasarathy, K.S.S.; Deka, P.C. Remote Sensing and GIS Application in Assessment of Coastal Vulnerability and Shoreline Changes: A Review. ISH J. Hydraul. Eng. 2021, 27, 588–600. [Google Scholar] [CrossRef]
- Rossi, G.B.; Cannata, A.; Iengo, A.; Migliaccio, M.; Nardone, G.; Piscopo, V.; Zambianchi, E. Measurement of Sea Waves. Sensors 2021, 22, 78. [Google Scholar] [CrossRef] [PubMed]
- Thamaga, K.H.; Dube, T.; Shoko, C. Advances in Satellite Remote Sensing of the Wetland Ecosystems in Sub-Saharan Africa. Geocarto Int. 2022, 37, 5891–5913. [Google Scholar] [CrossRef]
- Topouzelis, K.; Papageorgiou, D.; Suaria, G.; Aliani, S. Floating Marine Litter Detection Algorithms and Techniques Using Optical Remote Sensing Data: A Review. Mar. Pollut. Bull. 2021, 170, 112675. [Google Scholar] [CrossRef] [PubMed]
- Wen, Z.; Shang, Y.; Lyu, L.; Li, S.; Tao, H.; Song, K. A Review of Quantifying pCO2 in Inland Waters with a Global Perspective: Challenges and Prospects of Implementing Remote Sensing Technology. Remote Sens. 2021, 13, 4916. [Google Scholar] [CrossRef]
- Al-Shehhi, M.R.; Abdul Samad, Y. Identifying Algal Bloom ‘Hotspots’ in Marginal Productive Seas: A Review and Geospatial Analysis. Remote Sens. 2022, 14, 2457. [Google Scholar] [CrossRef]
- Asif, Z.; Chen, Z.; An, C.; Dong, J. Environmental Impacts and Challenges Associated with Oil Spills on Shorelines. JMSE 2022, 10, 762. [Google Scholar] [CrossRef]
- Gonçalves, G.; Andriolo, U.; Gonçalves, L.M.S.; Sobral, P.; Bessa, F. Beach Litter Survey by Drones: Mini-Review and Discussion of a Potential Standardization. Environ. Pollut. 2022, 315, 120370. [Google Scholar] [CrossRef]
- Cazenave, A.; Moreira, L. Contemporary Sea-Level Changes from Global to Local Scales: A Review. Proc. R. Soc. A 2022, 478, 20220049. [Google Scholar] [CrossRef]
- Morgan, G.R.; Hodgson, M.E.; Wang, C.; Schill, S.R. Unmanned Aerial Remote Sensing of Coastal Vegetation: A Review. Ann. GIS 2022, 28, 385–399. [Google Scholar] [CrossRef]
- Tran, T.V.; Reef, R.; Zhu, X. A Review of Spectral Indices for Mangrove Remote Sensing. Remote Sens. 2022, 14, 4868. [Google Scholar] [CrossRef]
- Veettil, B.K.; Hong Quan, N.; Hauser, L.T.; Doan Van, D.; Quang, N.X. Coastal and Marine Plastic Litter Monitoring Using Remote Sensing: A Review. Estuar. Coast. Shelf Sci. 2022, 279, 108160. [Google Scholar] [CrossRef]
- Vigouroux, G.; Destouni, G. Gap Identification in Coastal Eutrophication Research—Scoping Review for the Baltic System Case. Sci. Total Environ. 2022, 839, 156240. [Google Scholar] [CrossRef] [PubMed]
- Adjovu, G.E.; Stephen, H.; James, D.; Ahmad, S. Overview of the Application of Remote Sensing in Effective Monitoring of Water Quality Parameters. Remote Sens. 2023, 15, 1938. [Google Scholar] [CrossRef]
- Ankrah, J.; Monteiro, A.; Madureira, H. Shoreline Change and Coastal Erosion in West Africa: A Systematic Review of Research Progress and Policy Recommendation. Geosciences 2023, 13, 59. [Google Scholar] [CrossRef]
- Boukhennaf, A.; Mezouar, K. Long and Short-Term Evolution of the Algerian Coastline Using Remote Sensing and GIS Technology. Reg. Stud. Mar. Sci. 2023, 61, 102893. [Google Scholar] [CrossRef]
- Hauser, D.; Abdalla, S.; Ardhuin, F.; Bidlot, J.-R.; Bourassa, M.; Cotton, D.; Gommenginger, C.; Evers-King, H.; Johnsen, H.; Knaff, J.; et al. Satellite Remote Sensing of Surface Winds, Waves, and Currents: Where Are We Now? Surv. Geophys. 2023, 44, 1357–1446. [Google Scholar] [CrossRef]
- Hu, C.; Qi, L.; Hu, L.; Cui, T.; Xing, Q.; He, M.; Wang, N.; Xiao, Y.; Sun, D.; Lu, Y.; et al. Mapping Ulva Prolifera Green Tides from Space: A Revisit on Algorithm Design and Data Products. Int. J. Appl. Earth Obs. Geoinf. 2023, 116, 103173. [Google Scholar] [CrossRef]
- Kim, Y.J.; Han, D.; Jang, E.; Im, J.; Sung, T. Remote Sensing of Sea Surface Salinity: Challenges and Research Directions. GIScience Remote Sens. 2023, 60, 2166377. [Google Scholar] [CrossRef]
- Rolim, S.B.A.; Veettil, B.K.; Vieiro, A.P.; Kessler, A.B.; Gonzatti, C. Remote Sensing for Mapping Algal Blooms in Freshwater Lakes: A Review. Environ. Sci. Pollut. Res. 2023, 30, 19602–19616. [Google Scholar] [CrossRef]
- Schwartz-Belkin, I.; Portman, M.E. A Review of Geospatial Technologies for Improving Marine Spatial Planning: Challenges and Opportunities. Ocean Coast. Manag. 2023, 231, 106280. [Google Scholar] [CrossRef]
- Tsiakos, C.-A.D.; Chalkias, C. Use of Machine Learning and Remote Sensing Techniques for Shoreline Monitoring: A Review of Recent Literature. Appl. Sci. 2023, 13, 3268. [Google Scholar] [CrossRef]
- Villalobos Perna, P.; Di Febbraro, M.; Carranza, M.L.; Marzialetti, F.; Innangi, M. Remote Sensing and Invasive Plants in Coastal Ecosystems: What We Know So Far and Future Prospects. Land 2023, 12, 341. [Google Scholar] [CrossRef]
- Yuan, S.; Li, Y.; Bao, F.; Xu, H.; Yang, Y.; Yan, Q.; Zhong, S.; Yin, H.; Xu, J.; Huang, Z.; et al. Marine Environmental Monitoring with Unmanned Vehicle Platforms: Present Applications and Future Prospects. Sci. Total Environ. 2023, 858, 159741. [Google Scholar] [CrossRef]
- Mueller, J.; Augustin, R.; Morel, A.; Fargion, G.; McClain, C. Ocean Optics Protocols for Satellite Ocean Color Sensor Validation, Revision 4: Introduction, Background and Conventions; Goddard Space Flight Center: Greenbelt, MD, USA, 2003; Volume 1. [Google Scholar]
- Page, M.J.; McKenzie, J.E.; Bossuyt, P.M.; Boutron, I.; Hoffmann, T.C.; Mulrow, C.D.; Shamseer, L.; Tetzlaff, J.M.; Akl, E.A.; Brennan, S.E.; et al. The PRISMA 2020 Statement: An Updated Guideline for Reporting Systematic Reviews. Int. J. Surg. 2021, 88, 105906. [Google Scholar] [CrossRef]
- Lillesand, T.; Kiefer, R.W.; Chipman, J. Remote Sensing and Image Interpretation; John Wiley & Sons: Hoboken, NJ, USA, 2015. [Google Scholar]
- Bassani, C.; Cavalli, R.M.; Antonelli, P. Influence of Aerosol and Surface Reflectance Variability on Hyperspectral Observed Radiance. Atmos. Meas. Tech. 2012, 5, 1193–1203. [Google Scholar] [CrossRef]
- Tavares, M.H.; Lins, R.C.; Harmel, T.; Fragoso, C.R., Jr.; Martínez, J.-M.; Motta-Marques, D. Atmospheric and Sunglint Correction for Retrieving Chlorophyll-a in a Productive Tropical Estuarine-Lagoon System Using Sentinel-2 MSI Imagery. ISPRS J. Photogramm. Remote Sens. 2021, 174, 215–236. [Google Scholar] [CrossRef]
- Vanhellemont, Q.; Ruddick, K. Atmospheric Correction of Sentinel-3/OLCI Data for Mapping of Suspended Particulate Matter and Chlorophyll-a Concentration in Belgian Turbid Coastal Waters. Remote Sens. Environ. 2021, 256, 112284. [Google Scholar] [CrossRef]
- Basu, B.; Sannigrahi, S.; Sarkar Basu, A.; Pilla, F. Development of Novel Classification Algorithms for Detection of Floating Plastic Debris in Coastal Waterbodies Using Multispectral Sentinel-2 Remote Sensing Imagery. Remote Sens. 2021, 13, 1598. [Google Scholar] [CrossRef]
- Zhang, M.; Schwarz, C.; Lin, W.; Naing, H.; Cai, H.; Zhu, Z. A New Perspective on the Impacts of Spartina Alterniflora Invasion on Chinese Wetlands in the Context of Climate Change: A Case Study of the Jiuduansha Shoals, Yangtze Estuary. Sci. Total Environ. 2023, 868, 161477. [Google Scholar] [CrossRef]
- Luo, W.; Li, R.; Shen, F.; Liu, J. HY-1C/D CZI Image Atmospheric Correction and Quantifying Suspended Particulate Matter. Remote Sens. 2023, 15, 386. [Google Scholar] [CrossRef]
- Detoni, A.M.S.; Navarro, G.; Garrido, J.L.; Rodríguez, F.; Hernández-Urcera, J.; Caballero, I. Mapping Dinoflagellate Blooms (Noctiluca and Alexandrium) in Aquaculture Production Areas in the NW Iberian Peninsula with the Sentinel-2/3 Satellites. Sci. Total Environ. 2023, 868, 161579. [Google Scholar] [CrossRef] [PubMed]
- Cavalli, R.M.; Pignatti, S.; Zappitelli, E. Correction of Sun Glint Effect on MIVIS Data of the Sicily Campaign in July 2000. 2006. Available online: http://hdl.handle.net/2122/1957 (accessed on 31 October 2023).
- Nadhairi, R.A.; Hassan, A.N.; Abdelsattar, A.; Bruss, G.; Akhazami, S.A. Ocean Responses to Shaheen, the First Cyclone to Hit the North Coast of Oman in 2021. Dyn. Atmos. Ocean. 2023, 102, 101358. [Google Scholar] [CrossRef]
- Xu, K.; Fang, J.; Fang, Y.; Sun, Q.; Wu, C.; Liu, M. The Importance of Digital Elevation Model Selection in Flood Simulation and a Proposed Method to Reduce DEM Errors: A Case Study in Shanghai. Int. J. Disaster Risk Sci. 2021, 12, 890–902. [Google Scholar] [CrossRef]
- Zanaty, N.; Mansour, K.; Fathi, H. Satellite-Based Assessment of the Anthropogenic Impacts on Environmental Sustainability in Jazan Region, Red Sea. Egypt. J. Remote Sens. Space Sci. 2023, 26, 117–127. [Google Scholar] [CrossRef]
- Brempong, E.K.; Almar, R.; Angnuureng, D.B.; Mattah, P.A.D.; Jayson-Quashigah, P.-N.; Antwi-Agyakwa, K.T.; Charuka, B. Coastal Flooding Caused by Extreme Coastal Water Level at the World Heritage Historic Keta City (Ghana, West Africa). JMSE 2023, 11, 1144. [Google Scholar] [CrossRef]
- Passaro, M.; Müller, F.L.; Oelsmann, J.; Rautiainen, L.; Dettmering, D.; Hart-Davis, M.G.; Abulaitijiang, A.; Andersen, O.B.; Høyer, J.L.; Madsen, K.S.; et al. Absolute Baltic Sea Level Trends in the Satellite Altimetry Era: A Revisit. Front. Mar. Sci. 2021, 8, 647607. [Google Scholar] [CrossRef]
- Pujol, M.-I.; Dupuy, S.; Vergara, O.; Sánchez Román, A.; Faugère, Y.; Prandi, P.; Dabat, M.-L.; Dagneaux, Q.; Lievin, M.; Cadier, E.; et al. Refining the Resolution of DUACS Along-Track Level-3 Sea Level Altimetry Products. Remote Sens. 2023, 15, 793. [Google Scholar] [CrossRef]
- Vazquez-Cuervo, J.; García-Reyes, M.; Gómez-Valdés, J. Identification of Sea Surface Temperature and Sea Surface Salinity Fronts along the California Coast: Application Using Saildrone and Satellite Derived Products. Remote Sens. 2023, 15, 484. [Google Scholar] [CrossRef]
- Cavalli, R. Retrieval of Sea Surface Temperature from MODIS Data in Coastal Waters. Sustainability 2017, 9, 2032. [Google Scholar] [CrossRef]
- Cavalli, R.M. Comparison of Split Window Algorithms for Retrieving Measurements of Sea Surface Temperature from MODIS Data in Near-Land Coastal Waters. ISPRS Int. J. Geo-Inf. 2018, 7, 30. [Google Scholar] [CrossRef]
- Kartal, S. Assessment of the Spatiotemporal Prediction Capabilities of Machine Learning Algorithms on Sea Surface Temperature Data: A Comprehensive Study. Eng. Appl. Artif. Intell. 2023, 118, 105675. [Google Scholar] [CrossRef]
- Tilstone, G.H.; Land, P.E.; Pardo, S.; Kerimoglu, O.; Van Der Zande, D. Threshold Indicators of Primary Production in the North-East Atlantic for Assessing Environmental Disturbances Using 21 Years of Satellite Ocean Colour. Sci. Total Environ. 2023, 854, 158757. [Google Scholar] [CrossRef] [PubMed]
- Almeida, L.P.; Efraim De Oliveira, I.; Lyra, R.; Scaranto Dazzi, R.L.; Martins, V.G.; Henrique Da Fontoura Klein, A. Coastal Analyst System from Space Imagery Engine (CASSIE): Shoreline Management Module. Environ. Model. Softw. 2021, 140, 105033. [Google Scholar] [CrossRef]
- Woods Hole Coastal and Marine Science Center of USGS Coastal and Marine Hazards and Resources Program Digital Shoreline Analysis System (DSAS). Available online: https://www.usgs.gov/centers/whcmsc/science/digital-shoreline-analysis-system-dsas (accessed on 31 August 2023).
- Alharbi, B. Remote Sensing Techniques for Monitoring Algal Blooms in the Area between Jeddah and Rabigh on the Red Sea Coast. Remote Sens. Appl. Soc. Environ. 2023, 30, 100935. [Google Scholar] [CrossRef]
- Hu, C.; Zhang, S.; Barnes, B.B.; Xie, Y.; Wang, M.; Cannizzaro, J.P.; English, D.C. Mapping and Quantifying Pelagic Sargassum in the Atlantic Ocean Using Multi-Band Medium-Resolution Satellite Data and Deep Learning. Remote Sens. Environ. 2023, 289, 113515. [Google Scholar] [CrossRef]
- An, D.; Yu, D.; Zheng, X.; Zhou, Y.; Meng, L.; Xing, Q. Monitoring the Dissipation of the Floating Green Macroalgae Blooms in the Yellow Sea (2007–2020) on the Basis of Satellite Remote Sensing. Remote Sens. 2021, 13, 3811. [Google Scholar] [CrossRef]
- Fernandes-Salvador, J.A.; Davidson, K.; Sourisseau, M.; Revilla, M.; Schmidt, W.; Clarke, D.; Miller, P.I.; Arce, P.; Fernández, R.; Maman, L.; et al. Current Status of Forecasting Toxic Harmful Algae for the North-East Atlantic Shellfish Aquaculture Industry. Front. Mar. Sci. 2021, 8, 666583. [Google Scholar] [CrossRef]
- Izadi, M.; Sultan, M.; Kadiri, R.E.; Ghannadi, A.; Abdelmohsen, K. A Remote Sensing and Machine Learning-Based Approach to Forecast the Onset of Harmful Algal Bloom. Remote Sens. 2021, 13, 3863. [Google Scholar] [CrossRef]
- Peng, Y.; Sengupta, D.; Duan, Y.; Chen, C.; Tian, B. Accurate Mapping of Chinese Coastal Aquaculture Ponds Using Biophysical Parameters Based on Sentinel-2 Time Series Images. Mar. Pollut. Bull. 2022, 181, 113901. [Google Scholar] [CrossRef]
- Luo, J.; Sun, Z.; Lu, L.; Xiong, Z.; Cui, L.; Mao, Z. Rapid Expansion of Coastal Aquaculture Ponds in Southeast Asia: Patterns, Drivers and Impacts. J. Environ. Manag. 2022, 315, 115100. [Google Scholar] [CrossRef] [PubMed]
- Hou, Y.; Zhao, G.; Chen, X.; Yu, X. Improving Satellite Retrieval of Coastal Aquaculture Pond by Adding Water Quality Parameters. Remote Sens. 2022, 14, 3306. [Google Scholar] [CrossRef]
- Cheng, Y.; Sun, Y.; Peng, L.; He, Y.; Zha, M. An Improved Retrieval Method for Porphyra Cultivation Area Based on Suspended Sediment Concentration. Remote Sens. 2022, 14, 4338. [Google Scholar] [CrossRef]
- Ade, C.; Khanna, S.; Lay, M.; Ustin, S.L.; Hestir, E.L. Genus-Level Mapping of Invasive Floating Aquatic Vegetation Using Sentinel-2 Satellite Remote Sensing. Remote Sens. 2022, 14, 3013. [Google Scholar] [CrossRef]
- Brunier, G.; Oiry, S.; Gruet, Y.; Dubois, S.F.; Barillé, L. Topographic Analysis of Intertidal Polychaete Reefs (Sabellaria Alveolata) at a Very High Spatial Resolution. Remote Sens. 2022, 14, 307. [Google Scholar] [CrossRef]
- Zhang, X.; Chen, Y.; Le, Y.; Zhang, D.; Yan, Q.; Dong, Y.; Han, W.; Wang, L. Nearshore Bathymetry Based on ICESat-2 and Multispectral Images: Comparison Between Sentinel-2, Landsat-8, and Testing Gaofen-2. IEEE J. Sel. Top. Appl. Earth Obs. Remote Sens. 2022, 15, 2449–2462. [Google Scholar] [CrossRef]
- Zhou, W.; Tang, Y.; Jing, W.; Li, Y.; Yang, J.; Deng, Y.; Zhang, Y. A Comparison of Machine Learning and Empirical Approaches for Deriving Bathymetry from Multispectral Imagery. Remote Sens. 2023, 15, 393. [Google Scholar] [CrossRef]
- Lebrec, U.; Paumard, V.; O’Leary, M.J.; Lang, S.C. Towards a Regional High-Resolution Bathymetry of the North West Shelf of Australia Based on Sentinel-2 Satellite Images, 3D Seismic Surveys, and Historical Datasets. Earth Syst. Sci. Data 2021, 13, 5191–5212. [Google Scholar] [CrossRef]
- Pahlevan, N.; Smith, B.; Alikas, K.; Anstee, J.; Barbosa, C.; Binding, C.; Bresciani, M.; Cremella, B.; Giardino, C.; Gurlin, D.; et al. Simultaneous Retrieval of Selected Optical Water Quality Indicators from Landsat-8, Sentinel-2, and Sentinel-3. Remote Sens. Environ. 2022, 270, 112860. [Google Scholar] [CrossRef]
- Pahlevan, N.; Smith, B.; Binding, C.; Gurlin, D.; Li, L.; Bresciani, M.; Giardino, C. Hyperspectral Retrievals of Phytoplankton Absorption and Chlorophyll-a in Inland and Nearshore Coastal Waters. Remote Sens. Environ. 2021, 253, 112200. [Google Scholar] [CrossRef]
- Masoud, A.A. On the Retrieval of the Water Quality Parameters from Sentinel-3/2 and Landsat-8 OLI in the Nile Delta’s Coastal and Inland Waters. Water 2022, 14, 593. [Google Scholar] [CrossRef]
- Vaičiūtė, D.; Bučas, M.; Bresciani, M.; Dabulevičienė, T.; Gintauskas, J.; Mėžinė, J.; Tiškus, E.; Umgiesser, G.; Morkūnas, J.; De Santi, F.; et al. Hot Moments and Hotspots of Cyanobacteria Hyperblooms in the Curonian Lagoon (SE Baltic Sea) Revealed via Remote Sensing-Based Retrospective Analysis. Sci. Total Environ. 2021, 769, 145053. [Google Scholar] [CrossRef]
- Giannini, F.; Hunt, B.P.V.; Jacoby, D.; Costa, M. Performance of OLCI Sentinel-3A Satellite in the Northeast Pacific Coastal Waters. Remote Sens. Environ. 2021, 256, 112317. [Google Scholar] [CrossRef]
- Depountis, N.; Apostolopoulos, D.; Boumpoulis, V.; Christodoulou, D.; Dimas, A.; Fakiris, E.; Leftheriotis, G.; Menegatos, A.; Nikolakopoulos, K.; Papatheodorou, G.; et al. Coastal Erosion Identification and Monitoring in the Patras Gulf (Greece) Using Multi-Discipline Approaches. J. Mar. Sci. Eng. 2023, 11, 654. [Google Scholar] [CrossRef]
- Gurumoorthi, K.; Suneel, V.; Trinadha Rao, V.; Thomas, A.P.; Alex, M.J. Fate of MV Wakashio Oil Spill off Mauritius Coast through Modelling and Remote Sensing Observations. Mar. Pollut. Bull. 2021, 172, 112892. [Google Scholar] [CrossRef]
- Alsahli, M.M.M.; Nazeer, M. Modeling Secchi Disk Depth Over the North Arabian Gulf Waters Using MODIS and MERIS Images. PFG–J. Photogramm. Remote Sens. Geoinf. Sci. 2022, 90, 177–189. [Google Scholar] [CrossRef]
- Qing, S.; Cui, T.; Lai, Q.; Bao, Y.; Diao, R.; Yue, Y.; Hao, Y. Improving Remote Sensing Retrieval of Water Clarity in Complex Coastal and Inland Waters with Modified Absorption Estimation and Optical Water Classification Using Sentinel-2 MSI. Int. J. Appl. Earth Obs. Geoinf. 2021, 102, 102377. [Google Scholar] [CrossRef]
- Yin, Z.; Li, J.; Liu, Y.; Xie, Y.; Zhang, F.; Wang, S.; Sun, X.; Zhang, B. Water Clarity Changes in Lake Taihu over 36 Years Based on Landsat TM and OLI Observations. Int. J. Appl. Earth Obs. Geoinf. 2021, 102, 102457. [Google Scholar] [CrossRef]
- Feng, Y.; Li, D.; Zhao, J.; Han, Z.; Pan, J.; Fan, G.; Zhang, H.; Hu, J.; Zhang, H.; Wu, J.; et al. Environmental Drivers of Phytoplankton Crops and Taxonomic Composition in Northeastern Antarctic Peninsula Adjacent Sea Area. Acta Oceanol. Sin. 2022, 41, 99–117. [Google Scholar] [CrossRef]
- Austin, R.; Petzold, T.J. The Determination of the Diffuse Attenuation Coefficient of Sea Water Using the Coastal Zone Color Scanner. In Oceanography from Space; Gower, J.F.R., Ed.; Springer: Boston, MA, USA, 1981; pp. 239–256. [Google Scholar]
- Joshi, I.D.; Stramski, D.; Reynolds, R.A.; Robinson, D.H. Performance Assessment and Validation of Ocean Color Sensor-Specific Algorithms for Estimating the Concentration of Particulate Organic Carbon in Oceanic Surface Waters from Satellite Observations. Remote Sens. Environ. 2023, 286, 113417. [Google Scholar] [CrossRef]
- Park, S.; Hong, S. Nonlinear Modeling of Subsidence From a Decade of InSAR Time Series. Geophys. Res. Lett. 2021, 48, e2020GL090970. [Google Scholar] [CrossRef]
- Grottoli, E.; Biausque, M.; Rogers, D.; Jackson, D.W.T.; Cooper, J.A.G. Structure-from-Motion-Derived Digital Surface Models from Historical Aerial Photographs: A New 3D Application for Coastal Dune Monitoring. Remote Sens. 2020, 13, 95. [Google Scholar] [CrossRef]
- Mavroulis, S.; Vassilakis, E.; Diakakis, M.; Konsolaki, A.; Kaviris, G.; Kotsi, E.; Kapetanidis, V.; Sakkas, V.; Alexopoulos, J.D.; Lekkas, E.; et al. The Use of Innovative Techniques for Management of High-Risk Coastal Areas, Mitigation of Earthquake-Triggered Landslide Risk and Responsible Coastal Development. Appl. Sci. 2022, 12, 2193. [Google Scholar] [CrossRef]
- Marzouk, M.; Attia, K.; Azab, S. Assessment of Coastal Vulnerability to Climate Change Impacts Using GIS and Remote Sensing: A Case Study of Al-Alamein New City. J. Clean. Prod. 2021, 290, 125723. [Google Scholar] [CrossRef]
- Cao, F.; Tzortziou, M. Capturing Dissolved Organic Carbon Dynamics with Landsat-8 and Sentinel-2 in Tidally Influenced Wetland–Estuarine Systems. Sci. Total Environ. 2021, 777, 145910. [Google Scholar] [CrossRef]
- Bertin, C.; Matsuoka, A.; Mangin, A.; Babin, M.; Le Fouest, V. Merging Satellite and in Situ Data to Assess the Flux of Terrestrial Dissolved Organic Carbon From the Mackenzie River to the Coastal Beaufort Sea. Front. Earth Sci. 2022, 10, 694062. [Google Scholar] [CrossRef]
- Liu, B.; D’Sa, E.J.; Messina, F.; Baustian, M.M.; Maiti, K.; Rivera-Monroy, V.H.; Huang, W.; Georgiou, I.Y. Dissolved Organic Carbon Dynamics and Fluxes in Mississippi-Atchafalaya Deltaic System Impacted by an Extreme Flood Event and Hurricanes: A Multi-Satellite Approach Using Sentinel-2/3 and Landsat-8/9 Data. Front. Mar. Sci. 2023, 10, 1159367. [Google Scholar] [CrossRef]
- Lê, T.T.; Froger, J.-L.; Ho Tong Minh, D. Multiscale Framework for Rapid Change Analysis from SAR Image Time Series: Case Study of Flood Monitoring in the Central Coast Regions of Vietnam. Remote Sens. Environ. 2022, 269, 112837. [Google Scholar] [CrossRef]
- Hamidi, E.; Peter, B.G.; Munoz, D.F.; Moftakhari, H.; Moradkhani, H. Fast Flood Extent Monitoring With SAR Change Detection Using Google Earth Engine. IEEE Trans. Geosci. Remote Sens. 2023, 61, 3240097. [Google Scholar] [CrossRef]
- Vu, H.T.D.; Tran, D.D.; Schenk, A.; Nguyen, C.P.; Vu, H.L.; Oberle, P.; Trinh, V.C.; Nestmann, F. Land Use Change in the Vietnamese Mekong Delta: New Evidence from Remote Sensing. Sci. Total Environ. 2022, 813, 151918. [Google Scholar] [CrossRef]
- Muñoz, D.F.; Muñoz, P.; Moftakhari, H.; Moradkhani, H. From Local to Regional Compound Flood Mapping with Deep Learning and Data Fusion Techniques. Sci. Total Environ. 2021, 782, 146927. [Google Scholar] [CrossRef]
- Nguyen, H.D.; Fox, D.; Dang, D.K.; Pham, L.T.; Viet Du, Q.V.; Nguyen, T.H.T.; Dang, T.N.; Tran, V.T.; Vu, P.L.; Nguyen, Q.-H.; et al. Predicting Future Urban Flood Risk Using Land Change and Hydraulic Modeling in a River Watershed in the Central Province of Vietnam. Remote Sens. 2021, 13, 262. [Google Scholar] [CrossRef]
- Kumar, A.; Yadav, J.; Mohan, R. Seasonal Sea-Ice Variability and Its Trend in the Weddell Sea Sector of West Antarctica. Environ. Res. Lett. 2021, 16, 024046. [Google Scholar] [CrossRef]
- Al-Ruzouq, R.; Shanableh, A.; Khalil, M.A.; Zeiada, W.; Hamad, K.; Abu Dabous, S.; Gibril, M.B.A.; Al-Khayyat, G.; Kaloush, K.E.; Al-Mansoori, S.; et al. Spatial and Temporal Inversion of Land Surface Temperature along Coastal Cities in Arid Regions. Remote Sens. 2022, 14, 1893. [Google Scholar] [CrossRef]
- Li, W.; An, M.; Wu, H.; An, H.; Huang, J.; Khanal, R. The Local Coupling and Telecoupling of Urbanization and Ecological Environment Quality Based on Multisource Remote Sensing Data. J. Environ. Manag. 2023, 327, 116921. [Google Scholar] [CrossRef] [PubMed]
- Gozdowski, D.; Žukovskis, J.; Razinkovas-Baziukas, A.; Wójcik-Gront, E. Land Cover Changes in Selected Areas Next to Lagoons Located on the Southern Coast of the Baltic Sea, 1984–2021. Sustainability 2022, 14, 2006. [Google Scholar] [CrossRef]
- Cavalli, R.M. The Weight of Hyperion and PRISMA Hyperspectral Sensor Characteristics on Image Capability to Retrieve Urban Surface Materials in the City of Venice. Sensors 2023, 23, 454. [Google Scholar] [CrossRef]
- Acharyya, R.; Mukhopadhyay, A.; Habel, M. Coupling of SWAT and DSAS Models for Assessment of Retrospective and Prospective Transformations of River Deltaic Estuaries. Remote Sens. 2023, 15, 958. [Google Scholar] [CrossRef]
- Arjasakusuma, S.; Kusuma, S.S.; Saringatin, S.; Wicaksono, P.; Mutaqin, B.W.; Rafif, R. Shoreline Dynamics in East Java Province, Indonesia, from 2000 to 2019 Using Multi-Sensor Remote Sensing Data. Land 2021, 10, 100. [Google Scholar] [CrossRef]
- Yan, G.; Hu, R.; Luo, J.; Weiss, M.; Jiang, H.; Mu, X.; Xie, D.; Zhang, W. Review of Indirect Optical Measurements of Leaf Area Index: Recent Advances, Challenges, and Perspectives. Agric. For. Meteorol. 2019, 265, 390–411. [Google Scholar] [CrossRef]
- Chen, X.; Zhang, M.; Zhang, W. Landscape Pattern Changes and Its Drivers Inferred from Salt Marsh Plant Variations in the Coastal Wetlands of the Liao River Estuary, China. Ecol. Indic. 2022, 145, 109719. [Google Scholar] [CrossRef]
- George, S.L.; Kantamaneni, K.; V, R.A.; Prasad, K.A.; Shekhar, S.; Panneer, S.; Rice, L.; Balasubramani, K. A Multi-Data Geospatial Approach for Understanding Flood Risk in the Coastal Plains of Tamil Nadu, India. Earth 2022, 3, 383–400. [Google Scholar] [CrossRef]
- Mahmood, R.; Zhang, L.; Li, G. Assessing Effectiveness of Nature-Based Solution with Big Earth Data: 60 Years Mangrove Plantation Program in Bangladesh Coast. Ecol Process 2023, 12, 11. [Google Scholar] [CrossRef]
- Yang, G.; Huang, K.; Sun, W.; Meng, X.; Mao, D.; Ge, Y. Enhanced Mangrove Vegetation Index Based on Hyperspectral Images for Mapping Mangrove. ISPRS J. Photogramm. Remote Sens. 2022, 189, 236–254. [Google Scholar] [CrossRef]
- Guo, X.; Wang, M.; Jia, M.; Wang, W. Estimating Mangrove Leaf Area Index Based on Red-Edge Vegetation Indices: A Comparison among UAV, WorldView-2 and Sentinel-2 Imagery. Int. J. Appl. Earth Obs. Geoinf. 2021, 103, 102493. [Google Scholar] [CrossRef]
- Gitau, P.N.; Duvail, S.; Verschuren, D. Evaluating the Combined Impacts of Hydrological Change, Coastal Dynamics and Human Activity on Mangrove Cover and Health in the Tana River Delta, Kenya. Reg. Stud. Mar. Sci. 2023, 61, 102898. [Google Scholar] [CrossRef]
- Qi, G.; Chang, C.; Yang, W.; Gao, P.; Zhao, G. Soil Salinity Inversion in Coastal Corn Planting Areas by the Satellite-UAV-Ground Integration Approach. Remote Sens. 2021, 13, 3100. [Google Scholar] [CrossRef]
- Shabaka, S.; Moawad, M.N.; Ibrahim, M.I.A.; El-Sayed, A.A.M.; Ghobashy, M.M.; Hamouda, A.Z.; El-Alfy, M.A.; Darwish, D.H.; Youssef, N.A.E. Prevalence and Risk Assessment of Microplastics in the Nile Delta Estuaries: “The Plastic Nile” Revisited. Sci. Total Environ. 2022, 852, 158446. [Google Scholar] [CrossRef]
- Sakti, A.D.; Rinasti, A.N.; Agustina, E.; Diastomo, H.; Muhammad, F.; Anna, Z.; Wikantika, K. Multi-Scenario Model of Plastic Waste Accumulation Potential in Indonesia Using Integrated Remote Sensing, Statistic and Socio-Demographic Data. ISPRS Int. J. Geo-Inf. 2021, 10, 481. [Google Scholar] [CrossRef]
- Merlino, S.; Paterni, M.; Locritani, M.; Andriolo, U.; Gonçalves, G.; Massetti, L. Citizen Science for Marine Litter Detection and Classification on Unmanned Aerial Vehicle Images. Water 2021, 13, 3349. [Google Scholar] [CrossRef]
- Li, L.; Huang, X.; Wu, D.; Yang, H. Construction of Ecological Security Pattern Adapting to Future Land Use Change in Pearl River Delta, China. Appl. Geogr. 2023, 154, 102946. [Google Scholar] [CrossRef]
- Irakulis-Loitxate, I.; Gorroño, J.; Zavala-Araiza, D.; Guanter, L. Satellites Detect a Methane Ultra-Emission Event from an Offshore Platform in the Gulf of Mexico. Environ. Sci. Technol. Lett. 2022, 9, 520–525. [Google Scholar] [CrossRef]
- Rajendran, S.; Vethamony, P.; Sadooni, F.N.; Al-Kuwari, H.A.-S.; Al-Khayat, J.A.; Seegobin, V.O.; Govil, H.; Nasir, S. Detection of Wakashio Oil Spill off Mauritius Using Sentinel-1 and 2 Data: Capability of Sensors, Image Transformation Methods and Mapping. Environ. Pollut. 2021, 274, 116618. [Google Scholar] [CrossRef] [PubMed]
- Alados, I.; Foyo-Moreno, I.; Alados-Arboledas, L. Photosynthetically Active Radiation: Measurements and Modelling. Agric. For. Meteorol. 1996, 78, 121–131. [Google Scholar] [CrossRef]
- Zheng, Y.; Takeuchi, W. Estimating Mangrove Forest Gross Primary Production by Quantifying Environmental Stressors in the Coastal Area. Sci. Rep. 2022, 12, 2238. [Google Scholar] [CrossRef]
- O’Shea, R.E.; Pahlevan, N.; Smith, B.; Bresciani, M.; Egerton, T.; Giardino, C.; Li, L.; Moore, T.; Ruiz-Verdu, A.; Ruberg, S.; et al. Advancing Cyanobacteria Biomass Estimation from Hyperspectral Observations: Demonstrations with HICO and PRISMA Imagery. Remote Sens. Environ. 2021, 266, 112693. [Google Scholar] [CrossRef]
- Kavan, J.; Wieczorek, I.; Tallentire, G.D.; Demidionov, M.; Uher, J.; Strzelecki, M.C. Estimating Suspended Sediment Fluxes from the Largest Glacial Lake in Svalbard to Fjord System Using Sentinel-2 Data: Trebrevatnet Case Study. Water 2022, 14, 1840. [Google Scholar] [CrossRef]
- Morel, A.; Berthon, J.-F. Surface Pigments, Algal Biomass Profiles, and Potential Production of the Euphotic Layer: Relationships Reinvestigated in View of Remote-Sensing Applications. Limnol. Oceanogr. 1989, 34, 1545–1562. [Google Scholar] [CrossRef]
- Morel, A.; André, J.-M. Pigment Distribution and Primary Production in the Western Mediterranean as Derived and Modeled from Coastal Zone Color Scanner Observations. J. Geophys. Res. 1991, 96, 12685. [Google Scholar] [CrossRef]
- Song, L.; Lee, Z.; Shang, S.; Huang, B.; Wu, J.; Wu, Z.; Lu, W.; Liu, X. On the Spatial and Temporal Variations of Primary Production in the South China Sea. IEEE Trans. Geosci. Remote Sens. 2023, 61, 3241209. [Google Scholar] [CrossRef]
- Yang, Z.; Huang, Y.; Duan, Z.; Tang, J. Capturing the Spatiotemporal Variations in the Gross Primary Productivity in Coastal Wetlands by Integrating Eddy Covariance, Landsat, and MODIS Satellite Data: A Case Study in the Yangtze Estuary, China. Ecol. Indic. 2023, 149, 110154. [Google Scholar] [CrossRef]
- Chen, C.; Ma, Y.; Ren, G.; Wang, J. Aboveground Biomass of Salt-Marsh Vegetation in Coastal Wetlands: Sample Expansion of in Situ Hyperspectral and Sentinel-2 Data Using a Generative Adversarial Network. Remote Sens. Environ. 2022, 270, 112885. [Google Scholar] [CrossRef]
- Zhao, C.; Jia, M.; Wang, Z.; Mao, D.; Wang, Y. Toward a Better Understanding of Coastal Salt Marsh Mapping: A Case from China Using Dual-Temporal Images. Remote Sens. Environ. 2023, 295, 113664. [Google Scholar] [CrossRef]
- Curcio, A.C.; Peralta, G.; Aranda, M.; Barbero, L. Evaluating the Performance of High Spatial Resolution UAV-Photogrammetry and UAV-LiDAR for Salt Marshes: The Cádiz Bay Study Case. Remote Sens. 2022, 14, 3582. [Google Scholar] [CrossRef]
- Larson, K.M.; Lay, T.; Yamazaki, Y.; Cheung, K.F.; Ye, L.; Williams, S.D.P.; Davis, J.L. Dynamic Sea Level Variation From GNSS: 2020 Shumagin Earthquake Tsunami Resonance and Hurricane Laura. Geophys. Res. Lett. 2021, 48, e2020GL091378. [Google Scholar] [CrossRef]
- Birol, F.; Léger, F.; Passaro, M.; Cazenave, A.; Niño, F.; Calafat, F.M.; Shaw, A.; Legeais, J.-F.; Gouzenes, Y.; Schwatke, C.; et al. The X-TRACK/ALES Multi-Mission Processing System: New Advances in Altimetry towards the Coast. Adv. Space Res. 2021, 67, 2398–2415. [Google Scholar] [CrossRef]
- Di Paola, G.; Rizzo, A.; Benassai, G.; Corrado, G.; Matano, F.; Aucelli, P.P.C. Sea-Level Rise Impact and Future Scenarios of Inundation Risk along the Coastal Plains in Campania (Italy). Environ. Earth Sci. 2021, 80, 608. [Google Scholar] [CrossRef]
- Tsiaras, K.; Hatzonikolakis, Y.; Kalaroni, S.; Pollani, A.; Triantafyllou, G. Modeling the Pathways and Accumulation Patterns of Micro- and Macro-Plastics in the Mediterranean. Front. Mar. Sci. 2021, 8, 743117. [Google Scholar] [CrossRef]
- Dang, A.T.N.; Kumar, L.; Reid, M.; Anh, L.N.T. Modelling the Susceptibility of Wetland Plant Species under Climate Change in the Mekong Delta, Vietnam. Ecol. Inform. 2021, 64, 101358. [Google Scholar] [CrossRef]
- Jang, E.; Kim, Y.J.; Im, J.; Park, Y.-G. Improvement of SMAP Sea Surface Salinity in River-Dominated Oceans Using Machine Learning Approaches. GIScience Remote Sens. 2021, 58, 138–160. [Google Scholar] [CrossRef]
- Marin, M.; Feng, M.; Phillips, H.E.; Bindoff, N.L. A Global, Multiproduct Analysis of Coastal Marine Heatwaves: Distribution, Characteristics, and Long-Term Trends. J. Geophys. Res. Ocean. 2021, 126, e2020JC016708. [Google Scholar] [CrossRef]
- Mishra, M.; Kar, P.K.; Chand, P.; Mohanty, P.K.; Acharyya, T.; Santos, C.A.G.; Gonçalves, R.M.; Silva, R.M.D.; Bhattacharyya, D.; Beja, S.K.; et al. Deciphering the Impact of Anthropogenic Coastal Infrastructure on Shoreline Dynamicity along Gopalpur Coast of Odisha (India): An Integrated Assessment with Geospatial and Field-Based Approaches. Sci. Total Environ. 2023, 858, 159625. [Google Scholar] [CrossRef] [PubMed]
- Zhu, Q.; Li, P.; Li, Z.; Pu, S.; Wu, X.; Bi, N.; Wang, H. Spatiotemporal Changes of Coastline over the Yellow River Delta in the Previous 40 Years with Optical and SAR Remote Sensing. Remote Sens. 2021, 13, 1940. [Google Scholar] [CrossRef]
- Erdem, F.; Bayram, B.; Bakirman, T.; Bayrak, O.C.; Akpinar, B. An Ensemble Deep Learning Based Shoreline Segmentation Approach (WaterNet) from Landsat 8 OLI Images. Adv. Space Res. 2021, 67, 964–974. [Google Scholar] [CrossRef]
- Androulidakis, Y.; Makris, C.; Mallios, Z.; Pytharoulis, I.; Baltikas, V.; Krestenitis, Y. Storm Surges and Coastal Inundation during Extreme Events in the Mediterranean Sea: The IANOS Medicane. Nat. Hazards 2023, 117, 939–978. [Google Scholar] [CrossRef]
- Natarajan, L.; Sivagnanam, N.; Usha, T.; Chokkalingam, L.; Sundar, S.; Gowrappan, M.; Roy, P.D. Shoreline Changes over Last Five Decades and Predictions for 2030 and 2040: A Case Study from Cuddalore, Southeast Coast of India. Earth Sci. Inform. 2021, 14, 1315–1325. [Google Scholar] [CrossRef]
- Bian, L.; Wang, J.; Liu, J.; Han, B. Spatiotemporal Changes of Soil Salinization in the Yellow River Delta of China from 2015 to 2019. Sustainability 2021, 13, 822. [Google Scholar] [CrossRef]
- Cheng, T.; Zhang, J.; Zhang, S.; Bai, Y.; Wang, J.; Li, S.; Javid, T.; Meng, X.; Sharma, T.P.P. Monitoring Soil Salinization and Its Spatiotemporal Variation at Different Depths across the Yellow River Delta Based on Remote Sensing Data with Multi-Parameter Optimization. Environ. Sci. Pollut. Res. 2022, 29, 24269–24285. [Google Scholar] [CrossRef] [PubMed]
- Li, Z.; Yang, W.; Matsushita, B.; Kondoh, A. Remote Estimation of Phytoplankton Primary Production in Clear to Turbid Waters by Integrating a Semi-Analytical Model with a Machine Learning Algorithm. Remote Sens. Environ. 2022, 275, 113027. [Google Scholar] [CrossRef]
- Almar, R.; Bergsma, E.W.J.; Brodie, K.L.; Bak, A.S.; Artigues, S.; Lemai-Chenevier, S.; Cesbron, G.; Delvit, J.-M. Coastal Topo-Bathymetry from a Single-Pass Satellite Video: Insights in Space-Videos for Coastal Monitoring at Duck Beach (NC, USA). Remote Sens. 2022, 14, 1529. [Google Scholar] [CrossRef]
- Karasiewicz, S.; Lefebvre, A. Environmental Impact on Harmful Species Pseudo-nitzschia spp. and Phaeocystis globosa Phenology and Niche. J. Mar. Sci. Eng. 2022, 10, 174. [Google Scholar] [CrossRef]
- Mucheye, T.; Haro, S.; Papaspyrou, S.; Caballero, I. Water Quality and Water Hyacinth Monitoring with the Sentinel-2A/B Satellites in Lake Tana (Ethiopia). Remote Sens. 2022, 14, 4921. [Google Scholar] [CrossRef]
- Innangi, M.; Marzialetti, F.; Di Febbraro, M.; Acosta, A.T.R.; De Simone, W.; Frate, L.; Finizio, M.; Villalobos Perna, P.; Carranza, M.L. Coastal Dune Invaders: Integrative Mapping of Carpobrotus Sp. Pl. (Aizoaceae) Using UAVs. Remote Sens. 2023, 15, 503. [Google Scholar] [CrossRef]
- Lagomasino, D.; Fatoyinbo, T.; Castañeda-Moya, E.; Cook, B.D.; Montesano, P.M.; Neigh, C.S.R.; Corp, L.A.; Ott, L.E.; Chavez, S.; Morton, D.C. Storm Surge and Ponding Explain Mangrove Dieback in Southwest Florida Following Hurricane Irma. Nat. Commun. 2021, 12, 4003. [Google Scholar] [CrossRef] [PubMed]
- Giang, T.L.; Bui, Q.T.; Nguyen, T.D.L.; Dang, V.B.; Truong, Q.H.; Phan, T.T.; Nguyen, H.; Ngo, V.L.; Tran, V.T.; Yasir, M.; et al. Coastal Landscape Classification Using Convolutional Neural Network and Remote Sensing Data in Vietnam. J. Environ. Manag. 2023, 335, 117537. [Google Scholar] [CrossRef]
- Jackson, M.V.; Fuller, R.A.; Gan, X.; Li, J.; Mao, D.; Melville, D.S.; Murray, N.J.; Wang, Z.; Choi, C.-Y. Dual Threat of Tidal Flat Loss and Invasive Spartina Alterniflora Endanger Important Shorebird Habitat in Coastal Mainland China. J. Environ. Manag. 2021, 278, 111549. [Google Scholar] [CrossRef]
- Zhang, X.; Liu, L.; Zhao, T.; Chen, X.; Lin, S.; Wang, J.; Mi, J.; Liu, W. GWL_FCS30: A Global 30 m Wetland Map with a Fine Classification System Using Multi-Sourced and Time-Series Remote Sensing Imagery in 2020. Earth Syst. Sci. Data 2023, 15, 265–293. [Google Scholar] [CrossRef]
- Ahmed, N.; Howlader, N.; Hoque, M.A.-A.; Pradhan, B. Coastal Erosion Vulnerability Assessment along the Eastern Coast of Bangladesh Using Geospatial Techniques. Ocean Coast. Manag. 2021, 199, 105408. [Google Scholar] [CrossRef]
- Mansourmoghaddam, M.; Ghafarian Malamiri, H.R.; Rousta, I.; Olafsson, H.; Zhang, H. Assessment of Palm Jumeirah Island’s Construction Effects on the Surrounding Water Quality and Surface Temperatures during 2001–2020. Water 2022, 14, 634. [Google Scholar] [CrossRef]
- Warren, M.A.; Simis, S.G.H.; Selmes, N. Complementary Water Quality Observations from High and Medium Resolution Sentinel Sensors by Aligning Chlorophyll-a and Turbidity Algorithms. Remote Sens. Environ. 2021, 265, 112651. [Google Scholar] [CrossRef]
- Braga, F.; Ciani, D.; Colella, S.; Organelli, E.; Pitarch, J.; Brando, V.E.; Bresciani, M.; Concha, J.A.; Giardino, C.; Scarpa, G.M.; et al. COVID-19 Lockdown Effects on a Coastal Marine Environment: Disentangling Perception versus Reality. Sci. Total Environ. 2022, 817, 153002. [Google Scholar] [CrossRef] [PubMed]
- Tang, R.; Shen, F.; Ge, J.; Yang, S.; Gao, W. Investigating Typhoon Impact on SSC through Hourly Satellite and Real-Time Field Observations: A Case Study of the Yangtze Estuary. Cont. Shelf Res. 2021, 224, 104475. [Google Scholar] [CrossRef]
- Quang, D.N.; Ngan, V.H.; Tam, H.S.; Viet, N.T.; Tinh, N.X.; Tanaka, H. Long-Term Shoreline Evolution Using DSAS Technique: A Case Study of Quang Nam Province, Vietnam. J. Mar. Sci. Eng. 2021, 9, 1124. [Google Scholar] [CrossRef]
- Zanchetta, A.; Zecchetto, S. Wind Direction Retrieval from Sentinel-1 SAR Images Using ResNet. Remote Sens. Environ. 2021, 253, 112178. [Google Scholar] [CrossRef]
- De Montera, L.; Berger, H.; Husson, R.; Appelghem, P.; Guerlou, L.; Fragoso, M. High-Resolution Offshore Wind Resource Assessment at Turbine Hub Height with Sentinel-1 Synthetic Aperture Radar (SAR) Data and Machine Learning. Wind Energ. Sci. 2022, 7, 1441–1453. [Google Scholar] [CrossRef]
- CEOS Working Group on Calibration & Validation (WGCV). Available online: https://ceos.org/ourwork/workinggroups/wgcv/ (accessed on 22 March 2023).
- Cavalli, R.M. Spatial Validation of Spectral Unmixing Results: A Systematic Review. Remote Sens. 2023, 15, 2822. [Google Scholar] [CrossRef]
- Barreto, J.; Cajaíba, L.; Teixeira, J.B.; Nascimento, L.; Giacomo, A.; Barcelos, N.; Fettermann, T.; Martins, A. Drone-Monitoring: Improving the Detectability of Threatened Marine Megafauna. Drones 2021, 5, 14. [Google Scholar] [CrossRef]
- Bera, A.; Meraj, G.; Kanga, S.; Farooq, M.; Singh, S.K.; Sahu, N.; Kumar, P. Vulnerability and Risk Assessment to Climate Change in Sagar Island, India. Water 2022, 14, 823. [Google Scholar] [CrossRef]
- Shimada, T.; Duarte, C.M.; Al-Suwailem, A.M.; Tanabe, L.K.; Meekan, M.G. Satellite Tracking Reveals Nesting Patterns, Site Fidelity, and Potential Impacts of Warming on Major Green Turtle Rookeries in the Red Sea. Front. Mar. Sci. 2021, 8, 633814. [Google Scholar] [CrossRef]
- Vázquez-Delfín, E.; Freile-Pelegrín, Y.; Salazar-Garibay, A.; Serviere-Zaragoza, E.; Méndez-Rodríguez, L.C.; Robledo, D. Species Composition and Chemical Characterization of Sargassum Influx at Six Different Locations along the Mexican Caribbean Coast. Sci. Total Environ. 2021, 795, 148852. [Google Scholar] [CrossRef]
- Dev, P.J.; Sukenik, A.; Mishra, D.R.; Ostrovsky, I. Cyanobacterial Pigment Concentrations in Inland Waters: Novel Semi-Analytical Algorithms for Multi- and Hyperspectral Remote Sensing Data. Sci. Total Environ. 2022, 805, 150423. [Google Scholar] [CrossRef] [PubMed]
- Mishra, S.; Stumpf, R.P.; Schaeffer, B.; Werdell, P.J.; Loftin, K.A.; Meredith, A. Evaluation of a Satellite-Based Cyanobacteria Bloom Detection Algorithm Using Field-Measured Microcystin Data. Sci. Total Environ. 2021, 774, 145462. [Google Scholar] [CrossRef] [PubMed]
- Kruk, C.; Martínez, A.; Martínez De La Escalera, G.; Trinchin, R.; Manta, G.; Segura, A.M.; Piccini, C.; Brena, B.; Yannicelli, B.; Fabiano, G.; et al. Rapid Freshwater Discharge on the Coastal Ocean as a Mean of Long Distance Spreading of an Unprecedented Toxic Cyanobacteria Bloom. Sci. Total Environ. 2021, 754, 142362. [Google Scholar] [CrossRef] [PubMed]
- Caballero, I.; Navarro, G. Monitoring cyanoHABs and Water Quality in Laguna Lake (Philippines) with Sentinel-2 Satellites during the 2020 Pacific Typhoon Season. Sci. Total Environ. 2021, 788, 147700. [Google Scholar] [CrossRef] [PubMed]
- Dai, Y.; Yang, S.; Zhao, D.; Hu, C.; Xu, W.; Anderson, D.M.; Li, Y.; Song, X.-P.; Boyce, D.G.; Gibson, L.; et al. Coastal Phytoplankton Blooms Expand and Intensify in the 21st Century. Nature 2023, 615, 280–284. [Google Scholar] [CrossRef]
- Kuroda, H.; Taniuchi, Y.; Watanabe, T.; Azumaya, T.; Hasegawa, N. Distribution of Harmful Algae (Karenia Spp.) in October 2021 off Southeast Hokkaido, Japan. Front. Mar. Sci. 2022, 9, 841364. [Google Scholar] [CrossRef]
- Liu, R.; Xiao, Y.; Ma, Y.; Cui, T.; An, J. Red Tide Detection Based on High Spatial Resolution Broad Band Optical Satellite Data. ISPRS J. Photogramm. Remote Sens. 2022, 184, 131–147. [Google Scholar] [CrossRef]
- Zhao, X.; Liu, R.; Ma, Y.; Xiao, Y.; Ding, J.; Liu, J.; Wang, Q. Red Tide Detection Method for HY−1D Coastal Zone Imager Based on U−Net Convolutional Neural Network. Remote Sens. 2021, 14, 88. [Google Scholar] [CrossRef]
- Ban, W.; Zhang, K.; Yu, K.; Zheng, N.; Chen, S. Detection of Red Tide Over Sea Surface Using GNSS-R Spaceborne Observations. IEEE Trans. Geosci. Remote Sens. 2022, 60, 3144289. [Google Scholar] [CrossRef]
- Hu, C.; Qi, L.; Xie, Y.; Zhang, S.; Barnes, B.B. Spectral Characteristics of Sea Snot Reflectance Observed from Satellites: Implications for Remote Sensing of Marine Debris. Remote Sens. Environ. 2022, 269, 112842. [Google Scholar] [CrossRef]
- Kavzoglu, T.; Goral, M. Google Earth Engine for Monitoring Marine Mucilage: Izmit Bay in Spring 2021. Hydrology 2022, 9, 135. [Google Scholar] [CrossRef]
- Hafeez, S.; Wong, M.S.; Abbas, S.; Asim, M. Evaluating Landsat-8 and Sentinel-2 Data Consistency for High Spatiotemporal Inland and Coastal Water Quality Monitoring. Remote Sens. 2022, 14, 3155. [Google Scholar] [CrossRef]
- Pompêo, M.; Moschini-Carlos, V.; Bitencourt, M.D.; Sòria-Perpinyà, X.; Vicente, E.; Delegido, J. Water Quality Assessment Using Sentinel-2 Imagery with Estimates of Chlorophyll a, Secchi Disk Depth, and Cyanobacteria Cell Number: The Cantareira System Reservoirs (São Paulo, Brazil). Environ. Sci. Pollut. Res. 2021, 28, 34990–35011. [Google Scholar] [CrossRef] [PubMed]
- Sun, W.; Liu, K.; Ren, G.; Liu, W.; Yang, G.; Meng, X.; Peng, J. A Simple and Effective Spectral-Spatial Method for Mapping Large-Scale Coastal Wetlands Using China ZY1-02D Satellite Hyperspectral Images. Int. J. Appl. Earth Obs. Geoinf. 2021, 104, 102572. [Google Scholar] [CrossRef]
- Schreyers, L.; Van Emmerik, T.; Biermann, L.; Le Lay, Y.-F. Spotting Green Tides over Brittany from Space: Three Decades of Monitoring with Landsat Imagery. Remote Sens. 2021, 13, 1408. [Google Scholar] [CrossRef]
- Wang, X.; Xing, Q.; An, D.; Meng, L.; Zheng, X.; Jiang, B.; Liu, H. Effects of Spatial Resolution on the Satellite Observation of Floating Macroalgae Blooms. Water 2021, 13, 1761. [Google Scholar] [CrossRef]
- Wan, X.; Wan, J.; Xu, M.; Liu, S.; Sheng, H.; Chen, Y.; Zhang, X. Enteromorpha Coverage Information Extraction by 1D-CNN and Bi-LSTM Networks Considering Sample Balance From GOCI Images. IEEE J. Sel. Top. Appl. Earth Obs. Remote Sens. 2021, 14, 9306–9317. [Google Scholar] [CrossRef]
- Zhang, H.; Yuan, Y.; Xu, Y.; Shen, X.; Sun, D.; Qiu, Z.; Wang, S.; He, Y. Remote Sensing Method for Detecting Green Tide Using HJ-CCD Top-of-Atmosphere Reflectance. Int. J. Appl. Earth Obs. Geoinf. 2021, 102, 102371. [Google Scholar] [CrossRef]
- Sun, D.; Chen, Y.; Wang, S.; Zhang, H.; Qiu, Z.; Mao, Z.; He, Y. Using Landsat 8 OLI Data to Differentiate Sargassum and Ulva Prolifera Blooms in the South Yellow Sea. Int. J. Appl. Earth Obs. Geoinf. 2021, 98, 102302. [Google Scholar] [CrossRef]
- Zheng, L.; Wu, M.; Cui, Y.; Tian, L.; Yang, P.; Zhao, L.; Xue, M.; Liu, J. What Causes the Great Green Tide Disaster in the South Yellow Sea of China in 2021? Ecol. Indic. 2022, 140, 108988. [Google Scholar] [CrossRef]
- Li, D.; Gao, Z.; Xu, F. Research on the Dissipation of Green Tide and Its Influencing Factors in the Yellow Sea Based on Google Earth Engine. Mar. Pollut. Bull. 2021, 172, 112801. [Google Scholar] [CrossRef] [PubMed]
- Balado, J.; Olabarria, C.; Martínez-Sánchez, J.; Rodríguez-Pérez, J.R.; Pedro, A. Semantic Segmentation of Major Macroalgae in Coastal Environments Using High-Resolution Ground Imagery and Deep Learning. Int. J. Remote Sens. 2021, 42, 1785–1800. [Google Scholar] [CrossRef]
- Trinanes, J.; Putman, N.F.; Goni, G.; Hu, C.; Wang, M. Monitoring Pelagic Sargassum Inundation Potential for Coastal Communities. J. Oper. Oceanogr. 2023, 16, 48–59. [Google Scholar] [CrossRef]
- Ma, Y.; Wong, K.; Tsou, J.Y.; Zhang, Y. Investigating Spatial Distribution of Green-Tide in the Yellow Sea in 2021 Using Combined Optical and SAR Images. J. Mar. Sci. Eng. 2022, 10, 127. [Google Scholar] [CrossRef]
- Hu, C.; Wang, M.; Lapointe, B.E.; Brewton, R.A.; Hernandez, F.J. On the Atlantic Pelagic Sargassum’s Role in Carbon Fixation and Sequestration. Sci. Total Environ. 2021, 781, 146801. [Google Scholar] [CrossRef]
- Kwan, V.; Fong, J.; Ng, C.S.L.; Huang, D. Temporal and Spatial Dynamics of Tropical Macroalgal Contributions to Blue Carbon. Sci. Total Environ. 2022, 828, 154369. [Google Scholar] [CrossRef] [PubMed]
- Song, M.; Kong, F.; Li, Y.; Zhao, J.; Yu, R.; Zhou, M.; Jiang, P.; Yan, T. A Massive Green Tide in the Yellow Sea in 2021: Field Investigation and Analysis. Int. J. Environ. Res. Public Health 2022, 19, 11753. [Google Scholar] [CrossRef]
- Svane, N.; Lange, T.; Egemose, S.; Dalby, O.; Thomasberger, A.; Flindt, M.R. Unoccupied Aerial Vehicle-Assisted Monitoring of Benthic Vegetation in the Coastal Zone Enhances the Quality of Ecological Data. Prog. Phys. Geogr. Earth Environ. 2022, 46, 232–249. [Google Scholar] [CrossRef]
- Haro, S.; Jesus, B.; Oiry, S.; Papaspyrou, S.; Lara, M.; González, C.J.; Corzo, A. Microphytobenthos Spatio-Temporal Dynamics across an Intertidal Gradient Using Random Forest Classification and Sentinel-2 Imagery. Sci. Total Environ. 2022, 804, 149983. [Google Scholar] [CrossRef]
- Zou, Z.; Chen, C.; Liu, Z.; Zhang, Z.; Liang, J.; Chen, H.; Wang, L. Extraction of Aquaculture Ponds along Coastal Region Using U2-Net Deep Learning Model from Remote Sensing Images. Remote Sens. 2022, 14, 4001. [Google Scholar] [CrossRef]
- Duan, Y.; Tian, B.; Li, X.; Liu, D.; Sengupta, D.; Wang, Y.; Peng, Y. Tracking Changes in Aquaculture Ponds on the China Coast Using 30 Years of Landsat Images. Int. J. Appl. Earth Obs. Geoinf. 2021, 102, 102383. [Google Scholar] [CrossRef]
- Ottinger, M.; Bachofer, F.; Huth, J.; Kuenzer, C. Mapping Aquaculture Ponds for the Coastal Zone of Asia with Sentinel-1 and Sentinel-2 Time Series. Remote Sens. 2021, 14, 153. [Google Scholar] [CrossRef]
- Wang, M.; Mao, D.; Xiao, X.; Song, K.; Jia, M.; Ren, C.; Wang, Z. Interannual Changes of Coastal Aquaculture Ponds in China at 10-m Spatial Resolution during 2016–2021. Remote Sens. Environ. 2023, 284, 113347. [Google Scholar] [CrossRef]
- Xu, N.; Wang, Y.; Huang, C.; Jiang, S.; Jia, M.; Ma, Y. Monitoring Coastal Reclamation Changes across Jiangsu Province during 1984–2019 Using Landsat Data. Mar. Policy 2022, 136, 104887. [Google Scholar] [CrossRef]
- Wang, X.; Yan, F.; Su, F. Changes in Coastline and Coastal Reclamation in the Three Most Developed Areas of China, 1980–2018. Ocean Coast. Manag. 2021, 204, 105542. [Google Scholar] [CrossRef]
- Xing, H.; Niu, J.; Feng, Y.; Hou, D.; Wang, Y.; Wang, Z. A Coastal Wetlands Mapping Approach of Yellow River Delta with a Hierarchical Classification and Optimal Feature Selection Framework. CATENA 2023, 223, 106897. [Google Scholar] [CrossRef]
- Wang, L.; Chen, C.; Xie, F.; Hu, Z.; Zhang, Z.; Chen, H.; He, X.; Chu, Y. Estimation of the Value of Regional Ecosystem Services of an Archipelago Using Satellite Remote Sensing Technology: A Case Study of Zhoushan Archipelago, China. Int. J. Appl. Earth Obs. Geoinf. 2021, 105, 102616. [Google Scholar] [CrossRef]
- Qiu, L.; Zhang, M.; Zhou, B.; Cui, Y.; Yu, Z.; Liu, T.; Wu, S. Economic and Ecological Trade-Offs of Coastal Reclamation in the Hangzhou Bay, China. Ecol. Indic. 2021, 125, 107477. [Google Scholar] [CrossRef]
- Chen, C.; Feng, J.; Wang, C.; Mao, L.; Zhang, Y. Satellite-Based Monitoring of Coastal Wetlands in Yancheng, Jiangsu Province, China. J. Mar. Sci. Eng. 2022, 10, 829. [Google Scholar] [CrossRef]
- Han, Z.; Gao, Y.; Jiang, X.; Wang, J.; Li, W. Multisource Remote Sensing Classification for Coastal Wetland Using Feature Intersecting Learning. IEEE Geosci. Remote Sens. Lett. 2022, 19, 3161578. [Google Scholar] [CrossRef]
- Ai, B.; Huang, K.; Zhao, J.; Sun, S.; Jian, Z.; Liu, X. Comparison of Classification Algorithms for Detecting Typical Coastal Reclamation in Guangdong Province with Landsat 8 and Sentinel 2 Images. Remote Sens. 2022, 14, 385. [Google Scholar] [CrossRef]
- Fu, Y.; Deng, J.; Wang, H.; Comber, A.; Yang, W.; Wu, W.; You, S.; Lin, Y.; Wang, K. A New Satellite-Derived Dataset for Marine Aquaculture Areas in China’s Coastal Region. Earth Syst. Sci. Data 2021, 13, 1829–1842. [Google Scholar] [CrossRef]
- Hou, T.; Sun, W.; Chen, C.; Yang, G.; Meng, X.; Peng, J. Marine Floating Raft Aquaculture Extraction of Hyperspectral Remote Sensing Images Based Decision Tree Algorithm. Int. J. Appl. Earth Obs. Geoinf. 2022, 111, 102846. [Google Scholar] [CrossRef]
- Cheng, J.; Jia, N.; Chen, R.; Guo, X.; Ge, J.; Zhou, F. High-Resolution Mapping of Seaweed Aquaculture along the Jiangsu Coast of China Using Google Earth Engine (2016–2022). Remote Sens. 2022, 14, 6202. [Google Scholar] [CrossRef]
- Huber, S.; Hansen, L.B.; Nielsen, L.T.; Rasmussen, M.L.; Sølvsteen, J.; Berglund, J.; Paz Von Friesen, C.; Danbolt, M.; Envall, M.; Infantes, E.; et al. Novel Approach to Large-scale Monitoring of Submerged Aquatic Vegetation: A Nationwide Example from Sweden. Integr. Environ. Assess. Manag. 2022, 18, 909–920. [Google Scholar] [CrossRef] [PubMed]
- Asner, G.P.; Vaughn, N.R.; Martin, R.E.; Foo, S.A.; Heckler, J.; Neilson, B.J.; Gove, J.M. Mapped Coral Mortality and Refugia in an Archipelago-Scale Marine Heat Wave. Proc. Natl. Acad. Sci. USA 2022, 119, e2123331119. [Google Scholar] [CrossRef] [PubMed]
- Finger, D.J.I.; McPherson, M.L.; Houskeeper, H.F.; Kudela, R.M. Mapping Bull Kelp Canopy in Northern California Using Landsat to Enable Long-Term Monitoring. Remote Sens. Environ. 2021, 254, 112243. [Google Scholar] [CrossRef]
- Houskeeper, H.F.; Rosenthal, I.S.; Cavanaugh, K.C.; Pawlak, C.; Trouille, L.; Byrnes, J.E.K.; Bell, T.W.; Cavanaugh, K.C. Automated Satellite Remote Sensing of Giant Kelp at the Falkland Islands (Islas Malvinas). PLoS ONE 2022, 17, e0257933. [Google Scholar] [CrossRef]
- Tait, L.W.; Thoral, F.; Pinkerton, M.H.; Thomsen, M.S.; Schiel, D.R. Loss of Giant Kelp, Macrocystis Pyrifera, Driven by Marine Heatwaves and Exacerbated by Poor Water Clarity in New Zealand. Front. Mar. Sci. 2021, 8, 721087. [Google Scholar] [CrossRef]
- Cavanaugh, K.C.; Cavanaugh, K.C.; Bell, T.W.; Hockridge, E.G. An Automated Method for Mapping Giant Kelp Canopy Dynamics from UAV. Front. Environ. Sci. 2021, 8, 587354. [Google Scholar] [CrossRef]
- Hobley, B.; Arosio, R.; French, G.; Bremner, J.; Dolphin, T.; Mackiewicz, M. Semi-Supervised Segmentation for Coastal Monitoring Seagrass Using RPA Imagery. Remote Sens. 2021, 13, 1741. [Google Scholar] [CrossRef]
- Janowski, L.; Wroblewski, R.; Rucinska, M.; Kubowicz-Grajewska, A.; Tysiac, P. Automatic Classification and Mapping of the Seabed Using Airborne LiDAR Bathymetry. Eng. Geol. 2022, 301, 106615. [Google Scholar] [CrossRef]
- Fernandes, M.B.; Hennessy, A.; Law, W.B.; Daly, R.; Gaylard, S.; Lewis, M.; Clarke, K. Landsat Historical Records Reveal Large-Scale Dynamics and Enduring Recovery of Seagrasses in an Impacted Seascape. Sci. Total Environ. 2022, 813, 152646. [Google Scholar] [CrossRef] [PubMed]
- Lebrasse, M.C.; Schaeffer, B.A.; Coffer, M.M.; Whitman, P.J.; Zimmerman, R.C.; Hill, V.J.; Islam, K.A.; Li, J.; Osburn, C.L. Temporal Stability of Seagrass Extent, Leaf Area, and Carbon Storage in St. Joseph Bay, Florida: A Semi-Automated Remote Sensing Analysis. Estuaries Coasts 2022, 45, 2082–2101. [Google Scholar] [CrossRef] [PubMed]
- Traganos, D.; Lee, C.B.; Blume, A.; Poursanidis, D.; Čižmek, H.; Deter, J.; Mačić, V.; Montefalcone, M.; Pergent, G.; Pergent-Martini, C.; et al. Spatially Explicit Seagrass Extent Mapping Across the Entire Mediterranean. Front. Mar. Sci. 2022, 9, 871799. [Google Scholar] [CrossRef]
- Coffer, M.M.; Graybill, D.D.; Whitman, P.J.; Schaeffer, B.A.; Salls, W.B.; Zimmerman, R.C.; Hill, V.; Lebrasse, M.C.; Li, J.; Keith, D.J.; et al. Providing a Framework for Seagrass Mapping in United States Coastal Ecosystems Using High Spatial Resolution Satellite Imagery. J. Environ. Manag. 2023, 337, 117669. [Google Scholar] [CrossRef] [PubMed]
- Mederos-Barrera, A.; Marcello, J.; Eugenio, F.; Hernández, E. Seagrass Mapping Using High Resolution Multispectral Satellite Imagery: A Comparison of Water Column Correction Models. Int. J. Appl. Earth Obs. Geoinf. 2022, 113, 102990. [Google Scholar] [CrossRef]
- Caballero, I.; Stumpf, R.P. Confronting Turbidity, the Major Challenge for Satellite-Derived Coastal Bathymetry. Sci. Total Environ. 2023, 870, 161898. [Google Scholar] [CrossRef]
- Guo, K.; Li, Q.; Wang, C.; Mao, Q.; Liu, Y.; Zhu, J.; Wu, A. Development of a Single-Wavelength Airborne Bathymetric LiDAR: System Design and Data Processing. ISPRS J. Photogramm. Remote Sens. 2022, 185, 62–84. [Google Scholar] [CrossRef]
- Mudiyanselage, S.S.J.D.; Abd-Elrahman, A.; Wilkinson, B.; Lecours, V. Satellite-Derived Bathymetry Using Machine Learning and Optimal Sentinel-2 Imagery in South-West Florida Coastal Waters. GIScience Remote Sens. 2022, 59, 1143–1158. [Google Scholar] [CrossRef]
- Wang, D.; Xing, S.; He, Y.; Yu, J.; Xu, Q.; Li, P. Evaluation of a New Lightweight UAV-Borne Topo-Bathymetric LiDAR for Shallow Water Bathymetry and Object Detection. Sensors 2022, 22, 1379. [Google Scholar] [CrossRef] [PubMed]
- Zhao, X.; Xia, H.; Zhao, J.; Zhou, F. Adaptive Wavelet Threshold Denoising for Bathymetric Laser Full-Waveforms With Weak Bottom Returns. IEEE Geosci. Remote Sens. Lett. 2022, 19, 3141057. [Google Scholar] [CrossRef]
- Xu, N.; Ma, X.; Ma, Y.; Zhao, P.; Yang, J.; Wang, X.H. Deriving Highly Accurate Shallow Water Bathymetry From Sentinel-2 and ICESat-2 Datasets by a Multitemporal Stacking Method. IEEE J. Sel. Top. Appl. Earth Obs. Remote Sens. 2021, 14, 6677–6685. [Google Scholar] [CrossRef]
- Caballero, I.; Stumpf, R.P. On the Use of Sentinel-2 Satellites and Lidar Surveys for the Change Detection of Shallow Bathymetry: The Case Study of North Carolina Inlets. Coast. Eng. 2021, 169, 103936. [Google Scholar] [CrossRef]
- Mandlburger, G.; Kölle, M.; Nübel, H.; Soergel, U. BathyNet: A Deep Neural Network for Water Depth Mapping from Multispectral Aerial Images. PFG–J. Photogramm. Remote Sens. Geoinf. Sci. 2021, 89, 71–89. [Google Scholar] [CrossRef]
- Ashphaq, M.; Srivastava, P.; Mitra, D. Evaluation and Performance of Satellite-Derived Bathymetry Algorithms in Turbid Coastal Water: A Case Study of Vengurla Rocks. Indian J. Geo-Mar. Sci. 2022, 51, 310–321. [Google Scholar] [CrossRef]
- Alevizos, E.; Oikonomou, D.; Argyriou, A.V.; Alexakis, D.D. Fusion of Drone-Based RGB and Multi-Spectral Imagery for Shallow Water Bathymetry Inversion. Remote Sens. 2022, 14, 1127. [Google Scholar] [CrossRef]
- Xu, N.; Ma, Y.; Zhou, H.; Zhang, W.; Zhang, Z.; Wang, X.H. A Method to Derive Bathymetry for Dynamic Water Bodies Using ICESat-2 and GSWD Data Sets. IEEE Geosci. Remote Sens. Lett. 2022, 19, 3019396. [Google Scholar] [CrossRef]
- Thomas, N.; Pertiwi, A.P.; Traganos, D.; Lagomasino, D.; Poursanidis, D.; Moreno, S.; Fatoyinbo, L. Space-Borne Cloud-Native Satellite-Derived Bathymetry (SDB) Models Using ICESat-2 and Sentinel-2. Geophys. Res. Lett. 2021, 48, e2020GL092170. [Google Scholar] [CrossRef]
- Albright, A.; Glennie, C. Nearshore Bathymetry From Fusion of Sentinel-2 and ICESat-2 Observations. IEEE Geosci. Remote Sens. Lett. 2021, 18, 900–904. [Google Scholar] [CrossRef]
- Babbel, B.J.; Parrish, C.E.; Magruder, L.A. ICESat-2 Elevation Retrievals in Support of Satellite-Derived Bathymetry for Global Science Applications. Geophys. Res. Lett. 2021, 48, e2020GL090629. [Google Scholar] [CrossRef] [PubMed]
- Hsu, H.-J.; Huang, C.-Y.; Jasinski, M.; Li, Y.; Gao, H.; Yamanokuchi, T.; Wang, C.-G.; Chang, T.-M.; Ren, H.; Kuo, C.-Y.; et al. A Semi-Empirical Scheme for Bathymetric Mapping in Shallow Water by ICESat-2 and Sentinel-2: A Case Study in the South China Sea. ISPRS J. Photogramm. Remote Sens. 2021, 178, 1–19. [Google Scholar] [CrossRef]
- Zhang, W.; Xu, N.; Ma, Y.; Yang, B.; Zhang, Z.; Wang, X.H.; Li, S. A Maximum Bathymetric Depth Model to Simulate Satellite Photon-Counting Lidar Performance. ISPRS J. Photogramm. Remote Sens. 2021, 174, 182–197. [Google Scholar] [CrossRef]
- Xie, C.; Chen, P.; Pan, D.; Zhong, C.; Zhang, Z. Improved Filtering of ICESat-2 Lidar Data for Nearshore Bathymetry Estimation Using Sentinel-2 Imagery. Remote Sens. 2021, 13, 4303. [Google Scholar] [CrossRef]
- Al Najar, M.; Thoumyre, G.; Bergsma, E.W.J.; Almar, R.; Benshila, R.; Wilson, D.G. Satellite Derived Bathymetry Using Deep Learning. Mach. Learn. 2023, 112, 1107–1130. [Google Scholar] [CrossRef]
- Lubac, B.; Burvingt, O.; Nicolae Lerma, A.; Sénéchal, N. Performance and Uncertainty of Satellite-Derived Bathymetry Empirical Approaches in an Energetic Coastal Environment. Remote Sens. 2022, 14, 2350. [Google Scholar] [CrossRef]
- Apicella, L.; De Martino, M.; Ferrando, I.; Quarati, A.; Federici, B. Deriving Coastal Shallow Bathymetry from Sentinel 2-, Aircraft- and UAV-Derived Orthophotos: A Case Study in Ligurian Marinas. J. Mar. Sci. Eng. 2023, 11, 671. [Google Scholar] [CrossRef]
- Niroumand-Jadidi, M.; Legleiter, C.J.; Bovolo, F. Bathymetry Retrieval from CubeSat Image Sequences with Short Time Lags. Int. J. Appl. Earth Obs. Geoinf. 2022, 112, 102958. [Google Scholar] [CrossRef]
- Li, J.; Knapp, D.E.; Lyons, M.; Roelfsema, C.; Phinn, S.; Schill, S.R.; Asner, G.P. Automated Global Shallow Water Bathymetry Mapping Using Google Earth Engine. Remote Sens. 2021, 13, 1469. [Google Scholar] [CrossRef]
- Al Najar, M.A.; Benshila, R.; Bennioui, Y.E.; Thoumyre, G.; Almar, R.; Bergsma, E.W.J.; Delvit, J.-M.; Wilson, D.G. Coastal Bathymetry Estimation from Sentinel-2 Satellite Imagery: Comparing Deep Learning and Physics-Based Approaches. Remote Sens. 2022, 14, 1196. [Google Scholar] [CrossRef]
- Daly, C.; Baba, W.; Bergsma, E.; Thoumyre, G.; Almar, R.; Garlan, T. The New Era of Regional Coastal Bathymetry from Space: A Showcase for West Africa Using Optical Sentinel-2 Imagery. Remote Sens. Environ. 2022, 278, 113084. [Google Scholar] [CrossRef]
- Le, Y.; Hu, M.; Chen, Y.; Yan, Q.; Zhang, D.; Li, S.; Zhang, X.; Wang, L. Investigating the Shallow-Water Bathymetric Capability of Zhuhai-1 Spaceborne Hyperspectral Images Based on ICESat-2 Data and Empirical Approaches: A Case Study in the South China Sea. Remote Sens. 2022, 14, 3406. [Google Scholar] [CrossRef]
- Kaloop, M.R.; El-Diasty, M.; Hu, J.W.; Zarzoura, F. Hybrid Artificial Neural Networks for Modeling Shallow-Water Bathymetry via Satellite Imagery. IEEE Trans. Geosci. Remote Sens. 2022, 60, 3107839. [Google Scholar] [CrossRef]
- David, C.G.; Kohl, N.; Casella, E.; Rovere, A.; Ballesteros, P.; Schlurmann, T. Structure-from-Motion on Shallow Reefs and Beaches: Potential and Limitations of Consumer-Grade Drones to Reconstruct Topography and Bathymetry. Coral Reefs 2021, 40, 835–851. [Google Scholar] [CrossRef]
- Specht, M.; Wiśniewska, M.; Stateczny, A.; Specht, C.; Szostak, B.; Lewicka, O.; Stateczny, M.; Widźgowski, S.; Halicki, A. Analysis of Methods for Determining Shallow Waterbody Depths Based on Images Taken by Unmanned Aerial Vehicles. Sensors 2022, 22, 1844. [Google Scholar] [CrossRef]
- McCarthy, M.J.; Otis, D.B.; Hughes, D.; Muller-Karger, F.E. Automated High-Resolution Satellite-Derived Coastal Bathymetry Mapping. Int. J. Appl. Earth Obs. Geoinf. 2022, 107, 102693. [Google Scholar] [CrossRef]
- Eugenio, F.; Marcello, J.; Mederos-Barrera, A.; Marques, F. High-Resolution Satellite Bathymetry Mapping: Regression and Machine Learning-Based Approaches. IEEE Trans. Geosci. Remote Sens. 2022, 60, 3135462. [Google Scholar] [CrossRef]
- Zhong, R.; Yang, D.; Zhao, L.; Yin, X. First Estimate Biosiliceous Sedimentation Flux in the Pearl River Estuary from 2000–2020 by Satellite Remote Sensing. Remote Sens. 2022, 15, 58. [Google Scholar] [CrossRef]
- Qian, S.; Wang, D.; Zhang, J.; Li, C. Adjoint Estimation and Interpretation of Spatially Varying Bottom Friction Coefficients of the M 2 Tide for a Tidal Model in the Bohai, Yellow and East China Seas with Multi-Mission Satellite Observations. Ocean Model. 2021, 161, 101783. [Google Scholar] [CrossRef]
- Mishra, M.; Chand, P.; Beja, S.K.; Santos, C.A.G.; Silva, R.M.D.; Ahmed, I.; Kamal, A.H.M. Quantitative Assessment of Present and the Future Potential Threat of Coastal Erosion along the Odisha Coast Using Geospatial Tools and Statistical Techniques. Sci. Total Environ. 2023, 875, 162488. [Google Scholar] [CrossRef]
- Alberico, I.; Casalbore, D.; Pelosi, N.; Tonielli, R.; Calidonna, C.; Dominici, R.; De Rosa, R. Remote Sensing and Field Survey Data Integration to Investigate on the Evolution of the Coastal Area: The Case Study of Bagnara Calabra (Southern Italy). Remote Sens. 2022, 14, 2459. [Google Scholar] [CrossRef]
- Guo, L.; Xie, W.; Xu, F.; Wang, X.; Zhu, C.; Meng, Y.; Zhang, W.; He, Q. A Historical Review of Sediment Export–Import Shift in the North Branch of Changjiang Estuary. Earth Surf. Process. Landf. 2022, 47, 5–16. [Google Scholar] [CrossRef]
- Luo, W.; Shen, F.; He, Q.; Cao, F.; Zhao, H.; Li, M. Changes in Suspended Sediments in the Yangtze River Estuary from 1984 to 2020: Responses to Basin and Estuarine Engineering Constructions. Sci. Total Environ. 2022, 805, 150381. [Google Scholar] [CrossRef] [PubMed]
- Abessolo, G.O.; Almar, R.; Angnuureng, D.B.; Bonou, F.; Sohou, Z.; Camara, I.; Diouf, A.; Alory, G.; Onguéné, R.; Mama, A.C.; et al. African Coastal Camera Network Efforts at Monitoring Ocean, Climate, and Human Impacts. Sci. Rep. 2023, 13, 1514. [Google Scholar] [CrossRef] [PubMed]
- Bergsma, E.W.J.; Almar, R.; Rolland, A.; Binet, R.; Brodie, K.L.; Bak, A.S. Coastal Morphology from Space: A Showcase of Monitoring the Topography-Bathymetry Continuum. Remote Sens. Environ. 2021, 261, 112469. [Google Scholar] [CrossRef]
- Hossain, S.A.; Mondal, I.; Thakur, S.; Fadhil Al-Quraishi, A.M. Coastal Vulnerability Assessment of India’s Purba Medinipur-Balasore Coastal Stretch: A Comparative Study Using Empirical Models. Int. J. Disaster Risk Reduct. 2022, 77, 103065. [Google Scholar] [CrossRef]
- Liu, T.; Zhu, L.; Bao, R.; Hu, R.; Jiang, S.; Zhu, Y.; Song, Y. Hydrodynamically–Driven Distribution and Remobilization of Heavy Metals in Surface Sediments around the Coastal Area of Shandong Peninsula, China. Sci. Total Environ. 2023, 857, 159286. [Google Scholar] [CrossRef]
- Letard, M.; Collin, A.; Corpetti, T.; Lague, D.; Pastol, Y.; Ekelund, A. Classification of Land-Water Continuum Habitats Using Exclusively Airborne Topobathymetric Lidar Green Waveforms and Infrared Intensity Point Clouds. Remote Sens. 2022, 14, 341. [Google Scholar] [CrossRef]
- Monteiro, J.G.; Jiménez, J.L.; Gizzi, F.; Přikryl, P.; Lefcheck, J.S.; Santos, R.S.; Canning-Clode, J. Novel Approach to Enhance Coastal Habitat and Biotope Mapping with Drone Aerial Imagery Analysis. Sci. Rep. 2021, 11, 574. [Google Scholar] [CrossRef]
- Villoslada Peciña, M.; Bergamo, T.F.; Ward, R.D.; Joyce, C.B.; Sepp, K. A Novel UAV-Based Approach for Biomass Prediction and Grassland Structure Assessment in Coastal Meadows. Ecol. Indic. 2021, 122, 107227. [Google Scholar] [CrossRef]
- Dottori, M.; Sasaki, D.K.; Silva, D.A.; Del–Giovannino, S.R.; Pinto, A.P.; Gnamah, M.; Santos, A.D.; Silveira, I.C.A.D.; Belo, W.C.; Martins, R.P.; et al. Hydrographic Structure of the Continental Shelf in Santos Basin and Its Causes: The SANAGU and SANSED Campaigns (2019). Ocean Coast. Res. 2023, 71, e23013. [Google Scholar] [CrossRef]
- Fraser, A.D.; Massom, R.A.; Handcock, M.S.; Reid, P.; Ohshima, K.I.; Raphael, M.N.; Cartwright, J.; Klekociuk, A.R.; Wang, Z.; Porter-Smith, R. Eighteen-Year Record of Circum-Antarctic Landfast-Sea-Ice Distribution Allows Detailed Baseline Characterisation and Reveals Trends and Variability. Cryosphere 2021, 15, 5061–5077. [Google Scholar] [CrossRef]
- Androulidakis, Y.S.; Krestenitis, Y.N. Sea Surface Temperature Variability and Marine Heat Waves over the Aegean, Ionian, and Cretan Seas from 2008–2021. J. Mar. Sci. Eng. 2022, 10, 42. [Google Scholar] [CrossRef]
- Quang, N.H.; Thang, H.N.; An, N.V.; Luan, N.T. Delta Lobe Development in Response to Changing Fluvial Sediment Supply by the Second Largest River in Vietnam. Catena 2023, 231, 107314. [Google Scholar] [CrossRef]
- Casalbore, D.; Di Traglia, F.; Romagnoli, C.; Favalli, M.; Gracchi, T.; Tacconi Stefanelli, C.; Nolesini, T.; Rossi, G.; Del Soldato, M.; Manzella, I.; et al. Integration of Remote Sensing and Offshore Geophysical Data for Monitoring the Short-Term Morphological Evolution of an Active Volcanic Flank: A Case Study from Stromboli Island. Remote Sens. 2022, 14, 4605. [Google Scholar] [CrossRef]
- Dohner, S.M.; Pilegard, T.C.; Trembanis, A.C. Coupling Traditional and Emergent Technologies for Improved Coastal Zone Mapping. Estuaries Coasts 2022, 45, 938–960. [Google Scholar] [CrossRef]
- Di Traglia, F.; Fornaciai, A.; Casalbore, D.; Favalli, M.; Manzella, I.; Romagnoli, C.; Chiocci, F.L.; Cole, P.; Nolesini, T.; Casagli, N. Subaerial-Submarine Morphological Changes at Stromboli Volcano (Italy) Induced by the 2019–2020 Eruptive Activity. Geomorphology 2022, 400, 108093. [Google Scholar] [CrossRef]
- Chapapría, V.E.; Peris, J.S.; González-Escrivá, J.A. Coastal Monitoring Using Unmanned Aerial Vehicles (UAVs) for the Management of the Spanish Mediterranean Coast: The Case of Almenara-Sagunto. Int. J. Environ. Res. Public Health 2022, 19, 5457. [Google Scholar] [CrossRef]
- Chen, C.; Zhang, C.; Schwarz, C.; Tian, B.; Jiang, W.; Wu, W.; Garg, R.; Garg, P.; Aleksandr, C.; Mikhail, S.; et al. Mapping Three-Dimensional Morphological Characteristics of Tidal Salt-Marsh Channels Using UAV Structure-from-Motion Photogrammetry. Geomorphology 2022, 407, 108235. [Google Scholar] [CrossRef]
- Salgado-Hernanz, P.M.; Regaudie-de-Gioux, A.; Antoine, D.; Basterretxea, G. Pelagic Primary Production in the Coastal Mediterranean Sea: Variability, Trends, and Contribution to Basin-Scale Budgets. Biogeosciences 2022, 19, 47–69. [Google Scholar] [CrossRef]
- Agarwal, N.; Sharma, R.; Kumar, R. Impact of Along-Track Altimeter Sea Surface Height Anomaly Assimilation on Surface and Sub-Surface Currents in the Bay of Bengal. Ocean Model. 2022, 169, 101931. [Google Scholar] [CrossRef]
- Sanchez-Cabeza, J.-A.; Herrera-Becerril, C.A.; Carballo, J.L.; Yáñez, B.; Álvarez-Sánchez, L.F.; Cardoso-Mohedano, J.-G.; Ruiz-Fernández, A.C. Rapid Surface Water Warming and Impact of the Recent (2013–2016) Temperature Anomaly in Shallow Coastal Waters at the Eastern Entrance of the Gulf of California. Prog. Oceanogr. 2022, 202, 102746. [Google Scholar] [CrossRef]
- Cao, B.; Qiu, J.; Zhang, W.; Xie, X.; Lu, X.; Yang, X.; Li, H. Retrieval of Suspended Sediment Concentrations in the Pearl River Estuary Using Multi-Source Satellite Imagery. Remote Sens. 2022, 14, 3896. [Google Scholar] [CrossRef]
- Janušaitė, R.; Jarmalavičius, D.; Pupienis, D.; Žilinskas, G.; Jukna, L. Nearshore Sandbar Switching Episodes and Their Relationship with Coastal Erosion at the Curonian Spit, Baltic Sea. Oceanologia 2023, 65, 71–85. [Google Scholar] [CrossRef]
- Kang, Y.; He, J.; Wang, B.; Lei, J.; Wang, Z.; Ding, X. Geomorphic Evolution of Radial Sand Ridges in the South Yellow Sea Observed from Satellites. Remote Sens. 2022, 14, 287. [Google Scholar] [CrossRef]
- Zhao, B.; Liu, Y.; Wang, L.; Liu, Y.; Sun, C.; Fagherazzi, S. Stability Evaluation of Tidal Flats Based on Time-Series Satellite Images: A Case Study of the Jiangsu Central Coast, China. Estuar. Coast. Shelf Sci. 2022, 264, 107697. [Google Scholar] [CrossRef]
- Davidson, K.; Whyte, C.; Aleynik, D.; Dale, A.; Gontarek, S.; Kurekin, A.A.; McNeill, S.; Miller, P.I.; Porter, M.; Saxon, R.; et al. HABreports: Online Early Warning of Harmful Algal and Biotoxin Risk for the Scottish Shellfish and Finfish Aquaculture Industries. Front. Mar. Sci. 2021, 8, 631732. [Google Scholar] [CrossRef]
- Sanwlani, N.; Evans, C.D.; Müller, M.; Cherukuru, N.; Martin, P. Rising Dissolved Organic Carbon Concentrations in Coastal Waters of Northwestern Borneo Related to Tropical Peatland Conversion. Sci. Adv. 2022, 8, eabi5688. [Google Scholar] [CrossRef]
- Ormaza-Gonzaìlez, F.I.; Castro-Rodas, D.; Statham, P.J. COVID-19 Impacts on Beaches and Coastal Water Pollution at Selected Sites in Ecuador, and Management Proposals Post-Pandemic. Front. Mar. Sci. 2021, 8, 669374. [Google Scholar] [CrossRef]
- Pan, X.; Wang, Z.; Ullah, H.; Chen, C.; Wang, X.; Li, X.; Li, H.; Zhuang, Q.; Xue, B.; Yu, Y. Evaluation of Eutrophication in Jiaozhou Bay via Water Color Parameters Determination with UAV-Borne Hyperspectral Imagery. Atmosphere 2023, 14, 387. [Google Scholar] [CrossRef]
- Mozafari, Z.; Noori, R.; Siadatmousavi, S.M.; Afzalimehr, H.; Azizpour, J. Satellite-Based Monitoring of Eutrophication in the Earth’s Largest Transboundary Lake. GeoHealth 2023, 7, e2022GH000770. [Google Scholar] [CrossRef] [PubMed]
- Maúre, E.D.R.; Terauchi, G.; Ishizaka, J.; Clinton, N.; DeWitt, M. Globally Consistent Assessment of Coastal Eutrophication. Nat. Commun. 2021, 12, 6142. [Google Scholar] [CrossRef] [PubMed]
- Li, S.; Song, K.; Wang, S.; Liu, G.; Wen, Z.; Shang, Y.; Lyu, L.; Chen, F.; Xu, S.; Tao, H.; et al. Quantification of Chlorophyll-a in Typical Lakes across China Using Sentinel-2 MSI Imagery with Machine Learning Algorithm. Sci. Total Environ. 2021, 778, 146271. [Google Scholar] [CrossRef] [PubMed]
- Tan, M.K.; Mustapha, M.A. Application of the Random Forest Algorithm for Mapping Potential Fishing Zones of Rastrelliger Kanagurta off the East Coast of Peninsular Malaysia. Reg. Stud. Mar. Sci. 2023, 60, 102881. [Google Scholar] [CrossRef]
- Chen, C.; Liang, J.; Yang, G.; Sun, W. Spatio-Temporal Distribution of Harmful Algal Blooms and Their Correlations with Marine Hydrological Elements in Offshore Areas, China. Ocean Coast. Manag. 2023, 238, 106554. [Google Scholar] [CrossRef]
- Orlova, T.Y.; Aleksanin, A.I.; Lepskaya, E.V.; Efimova, K.V.; Selina, M.S.; Morozova, T.V.; Stonik, I.V.; Kachur, V.A.; Karpenko, A.A.; Vinnikov, K.A.; et al. A Massive Bloom of Karenia Species (Dinophyceae) off the Kamchatka Coast, Russia, in the Fall of 2020. Harmful Algae 2022, 120, 102337. [Google Scholar] [CrossRef] [PubMed]
- El-Naggar, H.A.; Salem, E.S.; El-Kafrawy, S.B.; Bashar, M.A.; Shaban, W.M.; El-Gayar, E.E.; Ahmed, H.O.; Ashour, M.; Abou-Mahmoud, M.E. An Integrated Field Data and Remote Sensing Approach for Impact Assessment of Human Activities on Epifauna Macrobenthos Biodiversity along the Western Coast of Aqaba Gulf. Ecohydrology 2022, 15, e2400. [Google Scholar] [CrossRef]
- Abou Samra, R.M.; Ali, R.R. Monitoring of Oil Spill in the Offshore Zone of the Nile Delta Using Sentinel Data. Mar. Pollut. Bull. 2022, 179, 113718. [Google Scholar] [CrossRef]
- Ma, X.; Xu, J.; Pan, J.; Yang, J.; Wu, P.; Meng, X. Detection of Marine Oil Spills from Radar Satellite Images for the Coastal Ecological Risk Assessment. J. Environ. Manag. 2023, 325, 116637. [Google Scholar] [CrossRef]
- Chen, D.; Zeng, L.; Boot, K.; Liu, Q. Satellite Observed Spatial and Temporal Variabilities of Particulate Organic Carbon in the East China Sea. Remote Sens. 2022, 14, 1799. [Google Scholar] [CrossRef]
- Cen, H.; Jiang, J.; Han, G.; Lin, X.; Liu, Y.; Jia, X.; Ji, Q.; Li, B. Applying Deep Learning in the Prediction of Chlorophyll-a in the East China Sea. Remote Sens. 2022, 14, 5461. [Google Scholar] [CrossRef]
- Dang, X.; Bai, Y.; Gong, F.; Chen, X.; Zhu, Q.; Huang, H.; He, X. Different Responses of Phytoplankton to the ENSO in Two Upwelling Systems of the South China Sea. Estuaries Coasts 2022, 45, 485–500. [Google Scholar] [CrossRef]
- Demetriou, M.; Raitsos, D.E.; Kournopoulou, A.; Mandalakis, M.; Sfenthourakis, S.; Psarra, S. Phytoplankton Phenology in the Coastal Zone of Cyprus, Based on Remote Sensing and In Situ Observations. Remote Sens. 2021, 14, 12. [Google Scholar] [CrossRef]
- Oziel, L.; Massicotte, P.; Babin, M.; Devred, E. Decadal Changes in Arctic Ocean Chlorophyll a: Bridging Ocean Color Observations from the 1980s to Present Time. Remote Sens. Environ. 2022, 275, 113020. [Google Scholar] [CrossRef]
- Ali, K.A.; Moses, W.J. Application of a PLS-Augmented ANN Model for Retrieving Chlorophyll-a from Hyperspectral Data in Case 2 Waters of the Western Basin of Lake Erie. Remote Sens. 2022, 14, 3729. [Google Scholar] [CrossRef]
- Lavigne, H.; Van Der Zande, D.; Ruddick, K.; Cardoso Dos Santos, J.F.; Gohin, F.; Brotas, V.; Kratzer, S. Quality-Control Tests for OC4, OC5 and NIR-Red Satellite Chlorophyll-a Algorithms Applied to Coastal Waters. Remote Sens. Environ. 2021, 255, 112237. [Google Scholar] [CrossRef]
- Harid, R.; Demarcq, H.; Keraghel, M.-A.; Ait-Kaci, M.; Zerrouki, M.; Bachari, N.-E.-I.; Houma, F. Spatio-Temporal Variability of a Chlorophyll-a Based Biomass Index and Influence of Coastal Sources of Enrichment in the Algerian Basin. Cont. Shelf Res. 2022, 232, 104629. [Google Scholar] [CrossRef]
- Park, K.-A.; Park, J.-E.; Kang, C.-K. Satellite-Observed Chlorophyll-a Concentration Variability in the East Sea (Japan Sea): Seasonal Cycle, Long-Term Trend, and Response to Climate Index. Front. Mar. Sci. 2022, 9, 807570. [Google Scholar] [CrossRef]
- Shi, W.; Wang, M. Phytoplankton Biomass Dynamics in the Arabian Sea from VIIRS Observations. J. Mar. Syst. 2022, 227, 103670. [Google Scholar] [CrossRef]
- Maciel, F.P.; Haakonsson, S.; Ponce De León, L.; Bonilla, S.; Pedocchi, F. Challenges for Chlorophyll-a Remote Sensing in a Highly Variable Turbidity Estuary, an Implementation with Sentinel-2. Geocarto Int. 2023, 38, 2160017. [Google Scholar] [CrossRef]
- Woo Kim, Y.; Kim, T.; Shin, J.; Lee, D.-S.; Park, Y.-S.; Kim, Y.; Cha, Y. Validity Evaluation of a Machine-Learning Model for Chlorophyll a Retrieval Using Sentinel-2 from Inland and Coastal Waters. Ecol. Indic. 2022, 137, 108737. [Google Scholar] [CrossRef]
- Hu, W.; Zhang, D.; Chen, B.; Liu, X.; Ye, X.; Jiang, Q.; Zheng, X.; Du, J.; Chen, S. Mapping the Seagrass Conservation and Restoration Priorities: Coupling Habitat Suitability and Anthropogenic Pressures. Ecol. Indic. 2021, 129, 107960. [Google Scholar] [CrossRef]
- Zhai, F.; Wu, W.; Gu, Y.; Li, P.; Song, X.; Liu, P.; Liu, Z.; Chen, Y.; He, J. Interannual-Decadal Variation in Satellite-Derived Surface Chlorophyll-a Concentration in the Bohai Sea over the Past 16 Years. J. Mar. Syst. 2021, 215, 103496. [Google Scholar] [CrossRef]
- Caballero, I.; Roca, M.; Santos-Echeandía, J.; Bernárdez, P.; Navarro, G. Use of the Sentinel-2 and Landsat-8 Satellites for Water Quality Monitoring: An Early Warning Tool in the Mar Menor Coastal Lagoon. Remote Sens. 2022, 14, 2744. [Google Scholar] [CrossRef]
- Caballero, I.; Román, A.; Tovar-Sánchez, A.; Navarro, G. Water Quality Monitoring with Sentinel-2 and Landsat-8 Satellites during the 2021 Volcanic Eruption in La Palma (Canary Islands). Sci. Total Environ. 2022, 822, 153433. [Google Scholar] [CrossRef]
- Cavalli, R.M. Local, Daily, and Total Bio-Optical Models of Coastal Waters of Manfredonia Gulf Applied to Simulated Data of CHRIS, Landsat TM, MIVIS, MODIS, and PRISMA Sensors for Evaluating the Error. Remote Sens. 2020, 12, 1428. [Google Scholar] [CrossRef]
- Román, A.; Tovar-Sánchez, A.; Gauci, A.; Deidun, A.; Caballero, I.; Colica, E.; D’Amico, S.; Navarro, G. Water-Quality Monitoring with a UAV-Mounted Multispectral Camera in Coastal Waters. Remote Sens. 2022, 15, 237. [Google Scholar] [CrossRef]
- Kwong, I.H.Y.; Wong, F.K.K.; Fung, T. Automatic Mapping and Monitoring of Marine Water Quality Parameters in Hong Kong Using Sentinel-2 Image Time-Series and Google Earth Engine Cloud Computing. Front. Mar. Sci. 2022, 9, 871470. [Google Scholar] [CrossRef]
- Zhu, X.; Guo, H.; Huang, J.J.; Tian, S.; Xu, W.; Mai, Y. An Ensemble Machine Learning Model for Water Quality Estimation in Coastal Area Based on Remote Sensing Imagery. J. Environ. Manag. 2022, 323, 116187. [Google Scholar] [CrossRef]
- Gómez, D.; Salvador, P.; Sanz, J.; Casanova, J.L. A New Approach to Monitor Water Quality in the Menor Sea (Spain) Using Satellite Data and Machine Learning Methods. Environ. Pollut. 2021, 286, 117489. [Google Scholar] [CrossRef]
- Juhls, B.; Matsuoka, A.; Lizotte, M.; Bécu, G.; Overduin, P.P.; El Kassar, J.; Devred, E.; Doxaran, D.; Ferland, J.; Forget, M.H.; et al. Seasonal Dynamics of Dissolved Organic Matter in the Mackenzie Delta, Canadian Arctic Waters: Implications for Ocean Colour Remote Sensing. Remote Sens. Environ. 2022, 283, 113327. [Google Scholar] [CrossRef]
- Niroumand-Jadidi, M.; Bovolo, F.; Bruzzone, L.; Gege, P. Inter-Comparison of Methods for Chlorophyll-a Retrieval: Sentinel-2 Time-Series Analysis in Italian Lakes. Remote Sens. 2021, 13, 2381. [Google Scholar] [CrossRef]
- Santos, C.A.G.; Nascimento, T.V.M.D.; Mishra, M.; Silva, R.M.D. Analysis of Long- and Short-Term Shoreline Change Dynamics: A Study Case of João Pessoa City in Brazil. Sci. Total Environ. 2021, 769, 144889. [Google Scholar] [CrossRef] [PubMed]
- Haus, B.K.; Ortiz-Suslow, D.G.; Doyle, J.D.; Flagg, D.D.; Graber, H.C.; MacMahan, J.; Shen, L.; Wang, Q.; Willams, N.J.; Yardim, C. CLASI: Coordinating Innovative Observations and Modeling to Improve Coastal Environmental Prediction Systems. Bull. Am. Meteorol. Soc. 2022, 103, E889–E898. [Google Scholar] [CrossRef]
- Dearden, C.; Culmer, T.; Brooke, R. Performance Measures for Validation of Oil Spill Dispersion Models Based on Satellite and Coastal Data. IEEE J. Ocean. Eng. 2022, 47, 126–140. [Google Scholar] [CrossRef]
- Rajendran, S.; Aboobacker, V.M.; Seegobin, V.O.; Al Khayat, J.A.; Rangel-Buitrago, N.; Al-Kuwari, H.A.-S.; Sadooni, F.N.; Vethamony, P. History of a Disaster: A Baseline Assessment of the Wakashio Oil Spill on the Coast of Mauritius, Indian Ocean. Mar. Pollut. Bull. 2022, 175, 113330. [Google Scholar] [CrossRef] [PubMed]
- Azidane, H.; Haddout, S.; Alawad, K.A.; Boko, M.; Bouhaddioui, M.E.; Magrane, B. Mapping Total Suspended Matter along Moroccan Coast Using Satellite Data Series. Model. Earth Syst. Environ. 2022, 8, 1683–1692. [Google Scholar] [CrossRef]
- Li, P.; Ke, Y.; Wang, D.; Ji, H.; Chen, S.; Chen, M.; Lyu, M.; Zhou, D. Human Impact on Suspended Particulate Matter in the Yellow River Estuary, China: Evidence from Remote Sensing Data Fusion Using an Improved Spatiotemporal Fusion Method. Sci. Total Environ. 2021, 750, 141612. [Google Scholar] [CrossRef]
- Martin, A.C.H.; Gommenginger, C.P.; Jacob, B.; Staneva, J. First Multi-Year Assessment of Sentinel-1 Radial Velocity Products Using HF Radar Currents in a Coastal Environment. Remote Sens. Environ. 2022, 268, 112758. [Google Scholar] [CrossRef]
- Zhou, Y.; Yu, D.; Cheng, W.; Gai, Y.; Yao, H.; Yang, L.; Pan, S. Monitoring Multi-Temporal and Spatial Variations of Water Transparency in the Jiaozhou Bay Using GOCI Data. Mar. Pollut. Bull. 2022, 180, 113815. [Google Scholar] [CrossRef]
- Li, J.; Ganti, V.; Li, C.; Wei, H. Upstream Migration of Avulsion Sites on Lowland Deltas with River-Mouth Retreat. Earth Planet. Sci. Lett. 2022, 577, 117270. [Google Scholar] [CrossRef]
- Conroy, B.M.; Hamylton, S.M.; Kumbier, K.; Kelleway, J.J. Assessing the Structure of Coastal Forested Wetland Using Field and Remote Sensing Data. Estuar. Coast. Shelf Sci. 2022, 271, 107861. [Google Scholar] [CrossRef]
- Hossen, M.F.; Sultana, N. Shoreline Change Detection Using DSAS Technique: Case of Saint Martin Island, Bangladesh. Remote Sens. Appl. Soc. Environ. 2023, 30, 100943. [Google Scholar] [CrossRef]
- Zollini, S.; Dominici, D.; Alicandro, M.; Cuevas-González, M.; Angelats, E.; Ribas, F.; Simarro, G. New Methodology for Shoreline Extraction Using Optical and Radar (SAR) Satellite Imagery. J. Mar. Sci. Eng. 2023, 11, 627. [Google Scholar] [CrossRef]
- Kanwal, S.; Ding, X.; Wu, S.; Sajjad, M. Vertical Ground Displacements and Its Impact on Erosion along the Karachi Coastline, Pakistan. Remote Sens. 2022, 14, 2054. [Google Scholar] [CrossRef]
- Daramola, S.; Li, H.; Omonigbehin, O.; Faruwa, A.; Gong, Z. Recent Retreat and Flood Dominant Areas along the Muddy Mahin Coastline of Ilaje, Nigeria. Reg. Stud. Mar. Sci. 2022, 52, 102272. [Google Scholar] [CrossRef]
- Pucino, N.; Kennedy, D.M.; Young, M.; Ierodiaconou, D. Assessing the Accuracy of Sentinel-2 Instantaneous Subpixel Shorelines Using Synchronous UAV Ground Truth Surveys. Remote Sens. Environ. 2022, 282, 113293. [Google Scholar] [CrossRef]
- Mao, Y.; Harris, D.L.; Xie, Z.; Phinn, S. Efficient Measurement of Large-Scale Decadal Shoreline Change with Increased Accuracy in Tide-Dominated Coastal Environments with Google Earth Engine. ISPRS J. Photogramm. Remote Sens. 2021, 181, 385–399. [Google Scholar] [CrossRef]
- Angnuureng, D.B.; Brempong, K.E.; Jayson-Quashigah, P.N.; Dada, O.A.; Akuoko, S.G.I.; Frimpomaa, J.; Mattah, P.A.; Almar, R. Satellite, Drone and Video Camera Multi-Platform Monitoring of Coastal Erosion at an Engineered Pocket Beach: A Showcase for Coastal Management at Elmina Bay, Ghana (West Africa). Reg. Stud. Mar. Sci. 2022, 53, 102437. [Google Scholar] [CrossRef]
- Gonçalves, D.; Gonçalves, G.; Pérez-Alvávez, J.A.; Andriolo, U. On the 3D Reconstruction of Coastal Structures by Unmanned Aerial Systems with Onboard Global Navigation Satellite System and Real-Time Kinematics and Terrestrial Laser Scanning. Remote Sens. 2022, 14, 1485. [Google Scholar] [CrossRef]
- Gonçalves, G.; Gonçalves, D.; Gómez-Gutiérrez, Á.; Andriolo, U.; Pérez-Alvárez, J.A. 3D Reconstruction of Coastal Cliffs from Fixed-Wing and Multi-Rotor UAS: Impact of SfM-MVS Processing Parameters, Image Redundancy and Acquisition Geometry. Remote Sens. 2021, 13, 1222. [Google Scholar] [CrossRef]
- De Feudis, M.; Falsone, G.; Gherardi, M.; Speranza, M.; Vianello, G.; Vittori Antisari, L. GIS-Based Soil Maps as Tools to Evaluate Land Capability and Suitability in a Coastal Reclaimed Area (Ravenna, Northern Italy). Int. Soil Water Conserv. Res. 2021, 9, 167–179. [Google Scholar] [CrossRef]
- Taveneau, A.; Almar, R.; Bergsma, E.W.J.; Sy, B.A.; Ndour, A.; Sadio, M.; Garlan, T. Observing and Predicting Coastal Erosion at the Langue de Barbarie Sand Spit around Saint Louis (Senegal, West Africa) through Satellite-Derived Digital Elevation Model and Shoreline. Remote Sens. 2021, 13, 2454. [Google Scholar] [CrossRef]
- Jamali, A.; Mahdianpari, M. Swin Transformer and Deep Convolutional Neural Networks for Coastal Wetland Classification Using Sentinel-1, Sentinel-2, and LiDAR Data. Remote Sens. 2022, 14, 359. [Google Scholar] [CrossRef]
- Narron, C.R.; O’Connell, J.L.; Mishra, D.R.; Cotten, D.L.; Hawman, P.A.; Mao, L. Flooding in Landsat across Tidal Systems (FLATS): An Index for Intermittent Tidal Filtering and Frequency Detection in Salt Marsh Environments. Ecol. Indic. 2022, 141, 109045. [Google Scholar] [CrossRef]
- Martínez Prentice, R.; Villoslada Peciña, M.; Ward, R.D.; Bergamo, T.F.; Joyce, C.B.; Sepp, K. Machine Learning Classification and Accuracy Assessment from High-Resolution Images of Coastal Wetlands. Remote Sens. 2021, 13, 3669. [Google Scholar] [CrossRef]
- Espriella, M.C.; Lecours, V. Optimizing the Scale of Observation for Intertidal Habitat Classification through Multiscale Analysis. Drones 2022, 6, 140. [Google Scholar] [CrossRef]
- Yan, D.; Li, J.; Yao, X.; Luan, Z. Integrating UAV Data for Assessing the Ecological Response of Spartina Alterniflora towards Inundation and Salinity Gradients in Coastal Wetland. Sci. Total Environ. 2022, 814, 152631. [Google Scholar] [CrossRef]
- Yang, X.; Zhu, Z.; Qiu, S.; Kroeger, K.D.; Zhu, Z.; Covington, S. Detection and Characterization of Coastal Tidal Wetland Change in the Northeastern US Using Landsat Time Series. Remote Sens. Environ. 2022, 276, 113047. [Google Scholar] [CrossRef]
- Pucino, N.; Kennedy, D.M.; Carvalho, R.C.; Allan, B.; Ierodiaconou, D. Citizen Science for Monitoring Seasonal-Scale Beach Erosion and Behaviour with Aerial Drones. Sci. Rep. 2021, 11, 3935. [Google Scholar] [CrossRef]
- Fabbri, S.; Grottoli, E.; Armaroli, C.; Ciavola, P. Using High-Spatial Resolution UAV-Derived Data to Evaluate Vegetation and Geomorphological Changes on a Dune Field Involved in a Restoration Endeavour. Remote Sens. 2021, 13, 1987. [Google Scholar] [CrossRef]
- Minervino Amodio, A.; Di Paola, G.; Rosskopf, C.M. Monitoring Coastal Vulnerability by Using DEMs Based on UAV Spatial Data. ISPRS Int. J. Geo-Inf. 2022, 11, 155. [Google Scholar] [CrossRef]
- Andriolo, U.; Gonçalves, G.; Rangel-Buitrago, N.; Paterni, M.; Bessa, F.; Gonçalves, L.M.S.; Sobral, P.; Bini, M.; Duarte, D.; Fontán-Bouzas, Á.; et al. Drones for Litter Mapping: An Inter-Operator Concordance Test in Marking Beached Items on Aerial Images. Mar. Pollut. Bull. 2021, 169, 112542. [Google Scholar] [CrossRef] [PubMed]
- Curra-Sánchez, E.D.; Lara, C.; Cornejo-D’Ottone, M.; Nimptsch, J.; Aguayo, M.; Broitman, B.R.; Saldías, G.S.; Vargas, C.A. Contrasting Land-Uses in Two Small River Basins Impact the Colored Dissolved Organic Matter Concentration and Carbonate System along a River-Coastal Ocean Continuum. Sci. Total Environ. 2022, 806, 150435. [Google Scholar] [CrossRef] [PubMed]
- Tanguy, R.; Whalen, D.; Prates, G.; Vieira, G. Shoreline Change Rates and Land to Sea Sediment and Soil Organic Carbon Transfer in Eastern Parry Peninsula from 1965 to 2020 (Amundsen Gulf, Canada). Arct. Sci. 2023, 9, 506–525. [Google Scholar] [CrossRef]
- Quang, N.H.; Quinn, C.H.; Carrie, R.; Stringer, L.C.; Hue, L.T.V.; Hackney, C.R.; Tan, D.V. Comparisons of Regression and Machine Learning Methods for Estimating Mangrove Above-Ground Biomass Using Multiple Remote Sensing Data in the Red River Estuaries of Vietnam. Remote Sens. Appl. Soc. Environ. 2022, 26, 100725. [Google Scholar] [CrossRef]
- Meng, Y.; Gou, R.; Bai, J.; Moreno-Mateos, D.; Davis, C.C.; Wan, L.; Song, S.; Zhang, H.; Zhu, X.; Lin, G. Spatial Patterns and Driving Factors of Carbon Stocks in Mangrove Forests on Hainan Island, China. Glob. Ecol. Biogeogr. 2022, 31, 1692–1706. [Google Scholar] [CrossRef]
- Zhang, T.; Hu, S.; He, Y.; You, S.; Yang, X.; Gan, Y.; Liu, A. A Fine-Scale Mangrove Map of China Derived from 2-Meter Resolution Satellite Observations and Field Data. ISPRS Int. J. Geo-Inf. 2021, 10, 92. [Google Scholar] [CrossRef]
- Liu, X.; Fatoyinbo, T.E.; Thomas, N.M.; Guan, W.W.; Zhan, Y.; Mondal, P.; Lagomasino, D.; Simard, M.; Trettin, C.C.; Deo, R.; et al. Large-Scale High-Resolution Coastal Mangrove Forests Mapping Across West Africa With Machine Learning Ensemble and Satellite Big Data. Front. Earth Sci. 2021, 8, 560933. [Google Scholar] [CrossRef]
- Cardenas, S.M.M.; Cohen, M.C.L.; Ruiz, D.P.C.; Souza, A.V.; Gomez-Neita, J.S.; Pessenda, L.C.R.; Culligan, N. Death and Regeneration of an Amazonian Mangrove Forest by Anthropic and Natural Forces. Remote Sens. 2022, 14, 6197. [Google Scholar] [CrossRef]
- Corbau, C.; Buoninsegni, J.; Olivo, E.; Vaccaro, C.; Nardin, W.; Simeoni, U. Understanding through Drone Image Analysis the Interactions between Geomorphology, Vegetation and Marine Debris along a Sandy Spit. Mar. Pollut. Bull. 2023, 187, 114515. [Google Scholar] [CrossRef] [PubMed]
- James, D.; Collin, A.; Mury, A.; Qin, R. Satellite–Derived Topography and Morphometry for VHR Coastal Habitat Mapping: The Pleiades–1 Tri–Stereo Enhancement. Remote Sens. 2022, 14, 219. [Google Scholar] [CrossRef]
- Luetzenburg, G.; Kroon, A.; Bjørk, A.A. Evaluation of the Apple iPhone 12 Pro LiDAR for an Application in Geosciences. Sci. Rep. 2021, 11, 22221. [Google Scholar] [CrossRef]
- Anders, K.; Winiwarter, L.; Mara, H.; Lindenbergh, R.; Vos, S.E.; Höfle, B. Fully Automatic Spatiotemporal Segmentation of 3D LiDAR Time Series for the Extraction of Natural Surface Changes. ISPRS J. Photogramm. Remote Sens. 2021, 173, 297–308. [Google Scholar] [CrossRef]
- Contreras-de-Villar, F.; García, F.J.; Muñoz-Perez, J.J.; Contreras-de-Villar, A.; Ruiz-Ortiz, V.; Lopez, P.; Garcia-López, S.; Jigena, B. Beach Leveling Using a Remotely Piloted Aircraft System (RPAS): Problems and Solutions. J. Mar. Sci. Eng. 2021, 9, 19. [Google Scholar] [CrossRef]
- Zainuri, M.; Helmi, M.; Novita, M.G.A.; Pancasakti Kusumaningrum, H.; Koch, M. An Improve Performance of Geospatial Model to Access the Tidal Flood Impact on Land Use by Evaluating Sea Level Rise and Land Subsidence Parameters. J. Ecol. Eng. 2022, 23, 1–11. [Google Scholar] [CrossRef]
- Fabris, M.; Battaglia, M.; Chen, X.; Menin, A.; Monego, M.; Floris, M. An Integrated InSAR and GNSS Approach to Monitor Land Subsidence in the Po River Delta (Italy). Remote Sens. 2022, 14, 5578. [Google Scholar] [CrossRef]
- Haley, M.; Ahmed, M.; Gebremichael, E.; Murgulet, D.; Starek, M. Land Subsidence in the Texas Coastal Bend: Locations, Rates, Triggers, and Consequences. Remote Sens. 2022, 14, 192. [Google Scholar] [CrossRef]
- Hussain, M.A.; Chen, Z.; Shoaib, M.; Shah, S.U.; Khan, J.; Ying, Z. Sentinel-1A for Monitoring Land Subsidence of Coastal City of Pakistan Using Persistent Scatterers In-SAR Technique. Sci. Rep. 2022, 12, 5294. [Google Scholar] [CrossRef]
- Wu, P.; Wei, M.; D’Hondt, S. Subsidence in Coastal Cities Throughout the World Observed by InSAR. Geophys. Res. Lett. 2022, 49, e2022GL098477. [Google Scholar] [CrossRef]
- Cigna, F.; Tapete, D. Sentinel-1 Big Data Processing with P-SBAS InSAR in the Geohazards Exploitation Platform: An Experiment on Coastal Land Subsidence and Landslides in Italy. Remote Sens. 2021, 13, 885. [Google Scholar] [CrossRef]
- Scardino, G.; Anzidei, M.; Petio, P.; Serpelloni, E.; De Santis, V.; Rizzo, A.; Liso, S.I.; Zingaro, M.; Capolongo, D.; Vecchio, A.; et al. The Impact of Future Sea-Level Rise on Low-Lying Subsiding Coasts: A Case Study of Tavoliere Delle Puglie (Southern Italy). Remote Sens. 2022, 14, 4936. [Google Scholar] [CrossRef]
- Tomasetti, S.J.; Hallinan, B.D.; Tettelbach, S.T.; Volkenborn, N.; Doherty, O.W.; Allam, B.; Gobler, C.J. Warming and Hypoxia Reduce the Performance and Survival of Northern Bay Scallops (Argopecten Irradians Irradians) amid a Fishery Collapse. Glob. Chang. Biol. 2023, 29, 2092–2107. [Google Scholar] [CrossRef] [PubMed]
- Behera, M.D.; Prakash, J.; Paramanik, S.; Mudi, S.; Dash, J.; Varghese, R.; Roy, P.S.; Abhilash, P.C.; Gupta, A.K.; Srivastava, P.K. Assessment of Tropical Cyclone Amphan Affected Inundation Areas Using Sentinel-1 Satellite Data. Trop. Ecol. 2022, 63, 9–19. [Google Scholar] [CrossRef]
- Hermans, T.H.J.; Malagón-Santos, V.; Katsman, C.A.; Jane, R.A.; Rasmussen, D.J.; Haasnoot, M.; Garner, G.G.; Kopp, R.E.; Oppenheimer, M.; Slangen, A.B.A. The Timing of Decreasing Coastal Flood Protection Due to Sea-Level Rise. Nat. Clim. Chang. 2023, 13, 359–366. [Google Scholar] [CrossRef]
- Hu, Z.; Kuipers Munneke, P.; Lhermitte, S.; Dirscherl, M.; Ji, C.; van den Broeke, M. FABIAN: A Daily Product of Fractional Austral-Summer Blue Ice over ANtarctica during 2000–2021 Based on MODIS Imagery Using Google Earth Engine. Remote Sens. Environ. 2022, 280, 113202. [Google Scholar] [CrossRef]
- Turner, J.; Holmes, C.; Caton Harrison, T.; Phillips, T.; Jena, B.; Reeves-Francois, T.; Fogt, R.; Thomas, E.R.; Bajish, C.C. Record Low Antarctic Sea Ice Cover in February 2022. Geophys. Res. Lett. 2022, 49, e2022GL098904. [Google Scholar] [CrossRef]
- Wang, F.; Yang, D.; Niu, M.; Yang, L.; Zhang, B. Sea Ice Detection and Measurement Using Coastal GNSS Reflectometry: Analysis and Demonstration. IEEE J. Sel. Top. Appl. Earth Obs. Remote Sens. 2022, 15, 136–149. [Google Scholar] [CrossRef]
- Hu, Y.; Tian, B.; Yuan, L.; Li, X.; Huang, Y.; Shi, R.; Jiang, X.; Wang, L.; Sun, C. Mapping Coastal Salt Marshes in China Using Time Series of Sentinel-1 SAR. ISPRS J. Photogramm. Remote Sens. 2021, 173, 122–134. [Google Scholar] [CrossRef]
- Ma, D.; Huang, Q.; Liu, B.; Zhang, Q. Analysis and Dynamic Evaluation of Eco-Environmental Quality in the Yellow River Delta from 2000 to 2020. Sustainability 2023, 15, 7835. [Google Scholar] [CrossRef]
- Thakur, S.; Maity, D.; Mondal, I.; Basumatary, G.; Ghosh, P.B.; Das, P.; De, T.K. Assessment of Changes in Land Use, Land Cover, and Land Surface Temperature in the Mangrove Forest of Sundarbans, Northeast Coast of India. Environ. Dev. Sustain. 2021, 23, 1917–1943. [Google Scholar] [CrossRef]
- Sam, S.C.; Balasubramanian, G. Spatiotemporal Detection of Land Use/Land Cover Changes and Land Surface Temperature Using Landsat and MODIS Data across the Coastal Kanyakumari District, India. Geod. Geodyn. 2023, 14, 172–181. [Google Scholar] [CrossRef]
- Shahfahad; Rihan, M.; Naikoo, M.W.; Ali, M.A.; Usmani, T.M.; Rahman, A. Urban Heat Island Dynamics in Response to Land-Use/Land-Cover Change in the Coastal City of Mumbai. J. Indian Soc. Remote Sens. 2021, 49, 2227–2247. [Google Scholar] [CrossRef]
- Doughty, C.L.; Ambrose, R.F.; Okin, G.S.; Cavanaugh, K.C. Characterizing Spatial Variability in Coastal Wetland Biomass across Multiple Scales Using UAV and Satellite Imagery. Remote Sens. Ecol. Conserv. 2021, 7, 411–429. [Google Scholar] [CrossRef]
- Huang, C.; Hou, X.; Li, H. An Improved Minimum Cumulative Resistance Model for Risk Assessment of Agricultural Non-Point Source Pollution in the Coastal Zone. Environ. Pollut. 2022, 312, 120036. [Google Scholar] [CrossRef] [PubMed]
- Islam, I.; Cui, S.; Hoque, M.Z.; Abdullah, H.M.; Tonny, K.F.; Ahmed, M.; Ferdush, J.; Xu, L.; Ding, S. Dynamics of Tree Outside Forest Land Cover Development and Ecosystem Carbon Storage Change in Eastern Coastal Zone, Bangladesh. Land 2022, 11, 76. [Google Scholar] [CrossRef]
- Dube, K.; Nhamo, G.; Chikodzi, D. Rising Sea Level and Its Implications on Coastal Tourism Development in Cape Town, South Africa. J. Outdoor Recreat. Tour. 2021, 33, 100346. [Google Scholar] [CrossRef]
- White, E.E.; Ury, E.A.; Bernhardt, E.S.; Yang, X. Climate Change Driving Widespread Loss of Coastal Forested Wetlands Throughout the North American Coastal Plain. Ecosystems 2022, 25, 812–827. [Google Scholar] [CrossRef]
- Foti, G.; Barbaro, G.; Barillà, G.C.; Frega, F. Effects of Anthropogenic Pressures on Dune Systems—Case Study: Calabria (Italy). J. Mar. Sci. Eng. 2022, 10, 10. [Google Scholar] [CrossRef]
- Liu, Y.; Li, J.; Sun, C.; Wang, X.; Tian, P.; Chen, L.; Zhang, H.; Yang, X.; He, G. Thirty-Year Changes of the Coastlines, Wetlands, and Ecosystem Services in the Asia Major Deltas. J. Environ. Manag. 2023, 326, 116675. [Google Scholar] [CrossRef]
- Abd-Elhamid, H.F.; Zeleňáková, M.; Barańczuk, J.; Gergelova, M.B.; Mahdy, M. Historical Trend Analysis and Forecasting of Shoreline Change at the Nile Delta Using RS Data and GIS with the DSAS Tool. Remote Sens. 2023, 15, 1737. [Google Scholar] [CrossRef]
- Castelle, B.; Ritz, A.; Marieu, V.; Nicolae Lerma, A.; Vandenhove, M. Primary Drivers of Multidecadal Spatial and Temporal Patterns of Shoreline Change Derived from Optical Satellite Imagery. Geomorphology 2022, 413, 108360. [Google Scholar] [CrossRef]
- Chen, C.; Liang, J.; Xie, F.; Hu, Z.; Sun, W.; Yang, G.; Yu, J.; Chen, L.; Wang, L.; Wang, L.; et al. Temporal and Spatial Variation of Coastline Using Remote Sensing Images for Zhoushan Archipelago, China. Int. J. Appl. Earth Obs. Geoinf. 2022, 107, 102711. [Google Scholar] [CrossRef]
- Halder, B.; Ameen, A.M.S.; Bandyopadhyay, J.; Khedher, K.M.; Yaseen, Z.M. The Impact of Climate Change on Land Degradation along with Shoreline Migration in Ghoramara Island, India. Phys. Chem. Earth Parts A/B/C 2022, 126, 103135. [Google Scholar] [CrossRef]
- Hossain, S.A.; Mondal, I.; Thakur, S.; Linh, N.T.T.; Anh, D.T. Assessing the Multi-Decadal Shoreline Dynamics along the Purba Medinipur-Balasore Coastal Stretch, India by Integrating Remote Sensing and Statistical Methods. Acta Geophys. 2022, 70, 1701–1715. [Google Scholar] [CrossRef]
- Weerasingha, W.A.D.B.; Ratnayake, A.S. Coastal Landform Changes on the East Coast of Sri Lanka Using Remote Sensing and Geographic Information System (GIS) Techniques. Remote Sens. Appl. Soc. Environ. 2022, 26, 100763. [Google Scholar] [CrossRef]
- Andria, G.; Scarpetta, M.; Spadavecchia, M.; Affuso, P.; Giaquinto, N. SNOWED: Automatically Constructed Dataset of Satellite Imagery for Water Edge Measurements. Sensors 2023, 23, 4491. [Google Scholar] [CrossRef]
- Çelik, O.İ.; Gazioğlu, C. Coast Type Based Accuracy Assessment for Coastline Extraction from Satellite Image with Machine Learning Classifiers. Egypt. J. Remote Sens. Space Sci. 2022, 25, 289–299. [Google Scholar] [CrossRef]
- Seale, C.; Redfern, T.; Chatfield, P.; Luo, C.; Dempsey, K. Coastline Detection in Satellite Imagery: A Deep Learning Approach on New Benchmark Data. Remote Sens. Environ. 2022, 278, 113044. [Google Scholar] [CrossRef]
- Yang, Z.; Wang, L.; Sun, W.; Xu, W.; Tian, B.; Zhou, Y.; Yang, G.; Chen, C. A New Adaptive Remote Sensing Extraction Algorithm for Complex Muddy Coast Waterline. Remote Sens. 2022, 14, 861. [Google Scholar] [CrossRef]
- Abdelhady, H.U.; Troy, C.D.; Habib, A.; Manish, R. A Simple, Fully Automated Shoreline Detection Algorithm for High-Resolution Multi-Spectral Imagery. Remote Sens. 2022, 14, 557. [Google Scholar] [CrossRef]
- Miah, M.G.; Islam, M.R.; Roy, J.; Rahman, M.M.; Abdullah, H.M. A Changing Coastal Ecosystem: Cox’s Bazar in Southeastern Coastal Region of Bangladesh. Environ. Dev. Sustain. 2023, 25, 6141–6165. [Google Scholar] [CrossRef]
- Zhou, Q.; Wang, J.; Tian, L.; Feng, L.; Li, J.; Xing, Q. Remotely Sensed Water Turbidity Dynamics and Its Potential Driving Factors in Wuhan, an Urbanizing City of China. J. Hydrol. 2021, 593, 125893. [Google Scholar] [CrossRef]
- Cui, L.; Li, G.; Chen, Y.; Li, L. Response of Landscape Evolution to Human Disturbances in the Coastal Wetlands in Northern Jiangsu Province, China. Remote Sens. 2021, 13, 2030. [Google Scholar] [CrossRef]
- Hoque, M.A.-A.; Pradhan, B.; Ahmed, N.; Ahmed, B.; Alamri, A.M. Cyclone Vulnerability Assessment of the Western Coast of Bangladesh. Geomat. Nat. Hazards Risk 2021, 12, 198–221. [Google Scholar] [CrossRef]
- Chen, Q.; Huang, M.; Wang, H. A Feature Discretization Method for Classification of High-Resolution Remote Sensing Images in Coastal Areas. IEEE Trans. Geosci. Remote Sens. 2021, 59, 8584–8598. [Google Scholar] [CrossRef]
- Zhang, X.; Xu, J.; Chen, Y.; Xu, K.; Wang, D. Coastal Wetland Classification with GF-3 Polarimetric SAR Imagery by Using Object-Oriented Random Forest Algorithm. Sensors 2021, 21, 3395. [Google Scholar] [CrossRef]
- Su, H.; Yao, W.; Wu, Z.; Zheng, P.; Du, Q. Kernel Low-Rank Representation with Elastic Net for China Coastal Wetland Land Cover Classification Using GF-5 Hyperspectral Imagery. ISPRS J. Photogramm. Remote Sens. 2021, 171, 238–252. [Google Scholar] [CrossRef]
- Liu, C.; Tao, R.; Li, W.; Zhang, M.; Sun, W.; Du, Q. Joint Classification of Hyperspectral and Multispectral Images for Mapping Coastal Wetlands. IEEE J. Sel. Top. Appl. Earth Obs. Remote Sens. 2021, 14, 982–996. [Google Scholar] [CrossRef]
- Liu, K.; Sun, W.; Shao, Y.; Liu, W.; Yang, G.; Meng, X.; Peng, J.; Mao, D.; Ren, K. Mapping Coastal Wetlands Using Transformer in Transformer Deep Network on China ZY1-02D Hyperspectral Satellite Images. IEEE J. Sel. Top. Appl. Earth Obs. Remote Sens. 2022, 15, 3891–3903. [Google Scholar] [CrossRef]
- Curoy, J.; Ward, R.D.; Barlow, J.; Moses, C.; Nakhapakorn, K. Coastal Dynamism in Southern Thailand: An Application of the CoastSat Toolkit. PLoS ONE 2022, 17, e0272977. [Google Scholar] [CrossRef] [PubMed]
- He, K.; Zhang, Y.; Li, W.; Sun, G.; McNulty, S. Detecting Coastal Wetland Degradation by Combining Remote Sensing and Hydrologic Modeling. Forests 2022, 13, 411. [Google Scholar] [CrossRef]
- Cao, C.; Su, F.; Song, F.; Yan, H.; Pang, Q. Distribution and Disturbance Dynamics of Habitats Suitable for Suaeda Salsa. Ecol. Indic. 2022, 140, 108984. [Google Scholar] [CrossRef]
- Ury, E.A.; Yang, X.; Wright, J.P.; Bernhardt, E.S. Rapid Deforestation of a Coastal Landscape Driven by Sea-Level Rise and Extreme Events. Ecol. Appl. 2021, 31, e02339. [Google Scholar] [CrossRef] [PubMed]
- Dronova, I.; Taddeo, S.; Hemes, K.S.; Knox, S.H.; Valach, A.; Oikawa, P.Y.; Kasak, K.; Baldocchi, D.D. Remotely Sensed Phenological Heterogeneity of Restored Wetlands: Linking Vegetation Structure and Function. Agric. For. Meteorol. 2021, 296, 108215. [Google Scholar] [CrossRef]
- Jiang, S.; Xu, N.; Li, Z.; Huang, C. Satellite Derived Coastal Reclamation Expansion in China since the 21st Century. Glob. Ecol. Conserv. 2021, 30, e01797. [Google Scholar] [CrossRef]
- Randazzo, G.; Cascio, M.; Fontana, M.; Gregorio, F.; Lanza, S.; Muzirafuti, A. Mapping of Sicilian Pocket Beaches Land Use/Land Cover with Sentinel-2 Imagery: A Case Study of Messina Province. Land 2021, 10, 678. [Google Scholar] [CrossRef]
- Gu, J.; Jin, R.; Chen, G.; Ye, Z.; Li, Q.; Wang, H.; Li, D.; Christakos, G.; Agusti, S.; Duarte, C.M.; et al. Areal Extent, Species Composition, and Spatial Distribution of Coastal Saltmarshes in China. IEEE J. Sel. Top. Appl. Earth Obs. Remote Sens. 2021, 14, 7085–7094. [Google Scholar] [CrossRef]
- Li, H.; Wang, C.; Cui, Y.; Hodgson, M. Mapping Salt Marsh along Coastal South Carolina Using U-Net. ISPRS J. Photogramm. Remote Sens. 2021, 179, 121–132. [Google Scholar] [CrossRef]
- Gonzalez-Perez, A.; Abd-Elrahman, A.; Wilkinson, B.; Johnson, D.J.; Carthy, R.R. Deep and Machine Learning Image Classification of Coastal Wetlands Using Unpiloted Aircraft System Multispectral Images and Lidar Datasets. Remote Sens. 2022, 14, 3937. [Google Scholar] [CrossRef]
- Garzon, J.L.; Costas, S.; Ferreira, O. Biotic and Abiotic Factors Governing Dune Response to Storm Events. Earth Surf. Process. Landf 2022, 47, 1013–1031. [Google Scholar] [CrossRef]
- Zhu, W.; Ren, G.; Wang, J.; Wang, J.; Hu, Y.; Lin, Z.; Li, W.; Zhao, Y.; Li, S.; Wang, N. Monitoring the Invasive Plant Spartina Alterniflora in Jiangsu Coastal Wetland Using MRCNN and Long-Time Series Landsat Data. Remote Sens. 2022, 14, 2630. [Google Scholar] [CrossRef]
- Li, H.; Mao, D.; Wang, Z.; Huang, X.; Li, L.; Jia, M. Invasion of Spartina Alterniflora in the Coastal Zone of Mainland China: Control Achievements from 2015 to 2020 towards the Sustainable Development Goals. J. Environ. Manag. 2022, 323, 116242. [Google Scholar] [CrossRef] [PubMed]
- Paprotny, D.; Terefenko, P.; Giza, A.; Czapliński, P.; Vousdoukas, M.I. Future Losses of Ecosystem Services Due to Coastal Erosion in Europe. Sci. Total Environ. 2021, 760, 144310. [Google Scholar] [CrossRef] [PubMed]
- Bian, H.; Gao, J.; Wu, J.; Sun, X.; Du, Y. Hierarchical Analysis of Landscape Urbanization and Its Impacts on Regional Sustainability: A Case Study of the Yangtze River Economic Belt of China. J. Clean. Prod. 2021, 279, 123267. [Google Scholar] [CrossRef]
- Chen, J.; Sun, B.; Wang, L.; Fang, B.; Chang, Y.; Li, Y.; Zhang, J.; Lyu, X.; Chen, G. Semi-Supervised Semantic Segmentation Framework with Pseudo Supervisions for Land-Use/Land-Cover Mapping in Coastal Areas. Int. J. Appl. Earth Obs. Geoinf. 2022, 112, 102881. [Google Scholar] [CrossRef]
- Morgan, G.R.; Wang, C.; Li, Z.; Schill, S.R.; Morgan, D.R. Deep Learning of High-Resolution Aerial Imagery for Coastal Marsh Change Detection: A Comparative Study. ISPRS Int. J. Geo-Inf. 2022, 11, 100. [Google Scholar] [CrossRef]
- Peng, J.; Liu, S.; Lu, W.; Liu, M.; Feng, S.; Cong, P. Continuous Change Mapping to Understand Wetland Quantity and Quality Evolution and Driving Forces: A Case Study in the Liao River Estuary from 1986 to 2018. Remote Sens. 2021, 13, 4900. [Google Scholar] [CrossRef]
- Zhang, M.; Zhang, H.; Yao, B.; Lin, H.; An, X.; Liu, Y. Spatiotemporal Changes of Wetlands in China during 2000–2015 Using Landsat Imagery. J. Hydrol. 2023, 621, 129590. [Google Scholar] [CrossRef]
- White, J.R.; Couvillion, B.; Day, J.W. Coastal Wetland Area Change for Two Freshwater Diversions in the Mississippi River Delta. Ecol. Eng. 2023, 186, 106819. [Google Scholar] [CrossRef]
- Chopade, M.R.; Mahajan, S.; Chaube, N. Assessment of Land Use, Land Cover Change in the Mangrove Forest of Ghogha Area, Gulf of Khambhat, Gujarat. Expert Syst. Appl. 2023, 212, 118839. [Google Scholar] [CrossRef]
- Abd El-Sadek, E.; Elbeih, S.; Negm, A. Coastal and Landuse Changes of Burullus Lake, Egypt: A Comparison Using Landsat and Sentinel-2 Satellite Images. Egypt. J. Remote Sens. Space Sci. 2022, 25, 815–829. [Google Scholar] [CrossRef]
- Keshta, A.E.; Riter, J.C.A.; Shaltout, K.H.; Baldwin, A.H.; Kearney, M.; Sharaf El-Din, A.; Eid, E.M. Loss of Coastal Wetlands in Lake Burullus, Egypt: A GIS and Remote-Sensing Study. Sustainability 2022, 14, 4980. [Google Scholar] [CrossRef]
- Dang, A.T.N.; Kumar, L.; Reid, M.; Nguyen, H. Remote Sensing Approach for Monitoring Coastal Wetland in the Mekong Delta, Vietnam: Change Trends and Their Driving Forces. Remote Sens. 2021, 13, 3359. [Google Scholar] [CrossRef]
- He, Y.; Kuang, Y.; Zhao, Y.; Ruan, Z. Spatial Correlation between Ecosystem Services and Human Disturbances: A Case Study of the Guangdong–Hong Kong–Macao Greater Bay Area, China. Remote Sens. 2021, 13, 1174. [Google Scholar] [CrossRef]
- Aitali, R.; Snoussi, M.; Kolker, A.S.; Oujidi, B.; Mhammdi, N. Effects of Land Use/Land Cover Changes on Carbon Storage in North African Coastal Wetlands. J. Mar. Sci. Eng. 2022, 10, 364. [Google Scholar] [CrossRef]
- Zhu, B.; Liao, J.; Shen, G. Combining Time Series and Land Cover Data for Analyzing Spatio-Temporal Changes in Mangrove Forests: A Case Study of Qinglangang Nature Reserve, Hainan, China. Ecol. Indic. 2021, 131, 108135. [Google Scholar] [CrossRef]
- Azeez, A.; Gnanappazham, L.; Muraleedharan, K.R.; Revichandran, C.; John, S.; Seena, G.; Thomas, J. Multi-Decadal Changes of Mangrove Forest and Its Response to the Tidal Dynamics of Thane Creek, Mumbai. J. Sea Res. 2022, 180, 102162. [Google Scholar] [CrossRef]
- Campbell, A.D.; Fatoyinbo, L.; Goldberg, L.; Lagomasino, D. Global Hotspots of Salt Marsh Change and Carbon Emissions. Nature 2022, 612, 701–706. [Google Scholar] [CrossRef]
- Phan, M.H.; Stive, M.J.F. Managing Mangroves and Coastal Land Cover in the Mekong Delta. Ocean Coast. Manag. 2022, 219, 106013. [Google Scholar] [CrossRef]
- Eddy, S.; Milantara, N.; Sasmito, S.D.; Kajita, T.; Basyuni, M. Anthropogenic Drivers of Mangrove Loss and Associated Carbon Emissions in South Sumatra, Indonesia. Forests 2021, 12, 187. [Google Scholar] [CrossRef]
- Moschetto, F.A.; Ribeiro, R.B.; De Freitas, D.M. Urban Expansion, Regeneration and Socioenvironmental Vulnerability in a Mangrove Ecosystem at the Southeast Coastal of São Paulo, Brazil. Ocean Coast. Manag. 2021, 200, 105418. [Google Scholar] [CrossRef]
- Ghorbanian, A.; Ahmadi, S.A.; Amani, M.; Mohammadzadeh, A.; Jamali, S. Application of Artificial Neural Networks for Mangrove Mapping Using Multi-Temporal and Multi-Source Remote Sensing Imagery. Water 2022, 14, 244. [Google Scholar] [CrossRef]
- Zhang, Z.; Xu, N.; Li, Y.; Li, Y. Sub-Continental-Scale Mapping of Tidal Wetland Composition for East Asia: A Novel Algorithm Integrating Satellite Tide-Level and Phenological Features. Remote Sens. Environ. 2022, 269, 112799. [Google Scholar] [CrossRef]
- Valderrama-Landeros, L.; Flores-Verdugo, F.; Rodríguez-Sobreyra, R.; Kovacs, J.M.; Flores-de-Santiago, F. Extrapolating Canopy Phenology Information Using Sentinel-2 Data and the Google Earth Engine Platform to Identify the Optimal Dates for Remotely Sensed Image Acquisition of Semiarid Mangroves. J. Environ. Manag. 2021, 279, 111617. [Google Scholar] [CrossRef] [PubMed]
- Taggio, N.; Aiello, A.; Ceriola, G.; Kremezi, M.; Kristollari, V.; Kolokoussis, P.; Karathanassi, V.; Barbone, E. A Combination of Machine Learning Algorithms for Marine Plastic Litter Detection Exploiting Hyperspectral PRISMA Data. Remote Sens. 2022, 14, 3606. [Google Scholar] [CrossRef]
- Hirschfeld, D.; Behar, D.; Nicholls, R.J.; Cahill, N.; James, T.; Horton, B.P.; Portman, M.E.; Bell, R.; Campo, M.; Esteban, M.; et al. Global Survey Shows Planners Use Widely Varying Sea-Level Rise Projections for Coastal Adaptation. Commun. Earth Environ. 2023, 4, 102. [Google Scholar] [CrossRef]
- Zhang, Z.; Fan, Y.; Zhang, A.; Jiao, Z. Baseline-Based Soil Salinity Index (BSSI): A Novel Remote Sensing Monitoring Method of Soil Salinization. IEEE J. Sel. Top. Appl. Earth Obs. Remote Sens. 2023, 16, 202–214. [Google Scholar] [CrossRef]
- Li, Y.; Chang, C.; Wang, Z.; Zhao, G. Remote Sensing Prediction and Characteristic Analysis of Cultivated Land Salinization in Different Seasons and Multiple Soil Layers in the Coastal Area. Int. J. Appl. Earth Obs. Geoinf. 2022, 111, 102838. [Google Scholar] [CrossRef]
- Li, Y.; Chang, C.; Wang, Z.; Zhao, G. Upscaling Remote Sensing Inversion and Dynamic Monitoring of Soil Salinization in the Yellow River Delta, China. Ecol. Indic. 2023, 148, 110087. [Google Scholar] [CrossRef]
- Cavalli, R.M. Capability of Remote Sensing Images to Distinguish the Urban Surface Materials: A Case Study of Venice City. Remote Sens. 2021, 13, 3959. [Google Scholar] [CrossRef]
- Mansour, S.; Ghoneim, E.; El-Kersh, A.; Said, S.; Abdelnaby, S. Spatiotemporal Monitoring of Urban Sprawl in a Coastal City Using GIS-Based Markov Chain and Artificial Neural Network (ANN). Remote Sens. 2023, 15, 601. [Google Scholar] [CrossRef]
- Zhou, T.; Chen, W.; Wang, Q.; Li, Y. Urbanisation and Ecosystem Services in the Taiwan Strait West Coast Urban Agglomeration, China, from the Perspective of an Interactive Coercive Relationship. Ecol. Indic. 2023, 146, 109861. [Google Scholar] [CrossRef]
- Lu, L.; Qureshi, S.; Li, Q.; Chen, F.; Shu, L. Monitoring and Projecting Sustainable Transitions in Urban Land Use Using Remote Sensing and Scenario-Based Modelling in a Coastal Megacity. Ocean Coast. Manag. 2022, 224, 106201. [Google Scholar] [CrossRef]
- Gandharum, L.; Hartono, D.M.; Karsidi, A.; Ahmad, M. Monitoring Urban Expansion and Loss of Agriculture on the North Coast of West Java Province, Indonesia, Using Google Earth Engine and Intensity Analysis. Sci. World J. 2022, 2022, 3123788. [Google Scholar] [CrossRef] [PubMed]
- He, F.; Yang, J.; Zhang, Y.; Sun, D.; Wang, L.; Xiao, X.; Xia, J. (Cecilia) Offshore Island Connection Line: A New Perspective of Coastal Urban Development Boundary Simulation and Multi-Scenario Prediction. GIScience Remote Sens. 2022, 59, 801–821. [Google Scholar] [CrossRef]
- Cavalli, R.M. Spatial Validation of Spectral Unmixing Results: A Case Study of Venice City. Remote Sens. 2022, 14, 5165. [Google Scholar] [CrossRef]
- Gao, Y.; Song, X.; Li, W.; Wang, J.; He, J.; Jiang, X.; Feng, Y. Fusion Classification of HSI and MSI Using a Spatial-Spectral Vision Transformer for Wetland Biodiversity Estimation. Remote Sens. 2022, 14, 850. [Google Scholar] [CrossRef]
- Gao, Y.; Li, W.; Zhang, M.; Wang, J.; Sun, W.; Tao, R.; Du, Q. Hyperspectral and Multispectral Classification for Coastal Wetland Using Depthwise Feature Interaction Network. IEEE Trans. Geosci. Remote Sens. 2022, 60, 3097093. [Google Scholar] [CrossRef]
- Figueroa-Alfaro, R.W.; Van Rooijen, A.; Garzon, J.L.; Evans, M.; Harris, A. Modelling Wave Attenuation by Saltmarsh Using Satellite-Derived Vegetation Properties. Ecol. Eng. 2022, 176, 106528. [Google Scholar] [CrossRef]
- Kanniah, K.D.; Kang, C.S.; Sharma, S.; Amir, A.A. Remote Sensing to Study Mangrove Fragmentation and Its Impacts on Leaf Area Index and Gross Primary Productivity in the South of Peninsular Malaysia. Remote Sens. 2021, 13, 1427. [Google Scholar] [CrossRef]
- Ghosh, S.M.; Behera, M.D. Aboveground Biomass Estimates of Tropical Mangrove Forest Using Sentinel-1 SAR Coherence Data—The Superiority of Deep Learning over a Semi-Empirical Model. Comput. Geosci. 2021, 150, 104737. [Google Scholar] [CrossRef]
- Abhik, S.; Hope, P.; Hendon, H.H.; Hutley, L.B.; Johnson, S.; Drosdowsky, W.; Brown, J.R.; Duke, N.C. Influence of the 2015–2016 El Niño on the Record-Breaking Mangrove Dieback along Northern Australia Coast. Sci. Rep. 2021, 11, 20411. [Google Scholar] [CrossRef] [PubMed]
- Xu, R.; Zhao, S.; Ke, Y. A Simple Phenology-Based Vegetation Index for Mapping Invasive Spartina Alterniflora Using Google Earth Engine. IEEE J. Sel. Top. Appl. Earth Obs. Remote Sens. 2021, 14, 190–201. [Google Scholar] [CrossRef]
- Ximenes, A.C.; Cavanaugh, K.C.; Arvor, D.; Murdiyarso, D.; Thomas, N.; Arcoverde, G.F.B.; Bispo, P.D.C.; Van Der Stocken, T. A Comparison of Global Mangrove Maps: Assessing Spatial and Bioclimatic Discrepancies at Poleward Range Limits. Sci. Total Environ. 2023, 860, 160380. [Google Scholar] [CrossRef] [PubMed]
- Bhargava, R.; Sarkar, D.; Friess, D.A. A Cloud Computing-Based Approach to Mapping Mangrove Erosion and Progradation: Case Studies from the Sundarbans and French Guiana. Estuar. Coast. Shelf Sci. 2021, 248, 106798. [Google Scholar] [CrossRef]
- Jia, M.; Wang, Z.; Mao, D.; Ren, C.; Song, K.; Zhao, C.; Wang, C.; Xiao, X.; Wang, Y. Mapping Global Distribution of Mangrove Forests at 10-m Resolution. Sci. Bull. 2023, 68, 1306–1316. [Google Scholar] [CrossRef] [PubMed]
- De Jong, S.M.; Shen, Y.; De Vries, J.; Bijnaar, G.; Van Maanen, B.; Augustinus, P.; Verweij, P. Mapping Mangrove Dynamics and Colonization Patterns at the Suriname Coast Using Historic Satellite Data and the LandTrendr Algorithm. Int. J. Appl. Earth Obs. Geoinf. 2021, 97, 102293. [Google Scholar] [CrossRef]
- Gilani, H.; Naz, H.I.; Arshad, M.; Nazim, K.; Akram, U.; Abrar, A.; Asif, M. Evaluating Mangrove Conservation and Sustainability through Spatiotemporal (1990–2020) Mangrove Cover Change Analysis in Pakistan. Estuar. Coast. Shelf Sci. 2021, 249, 107128. [Google Scholar] [CrossRef]
- Thakur, S.; Mondal, I.; Bar, S.; Nandi, S.; Ghosh, P.B.; Das, P.; De, T.K. Shoreline Changes and Its Impact on the Mangrove Ecosystems of Some Islands of Indian Sundarbans, North-East Coast of India. J. Clean. Prod. 2021, 284, 124764. [Google Scholar] [CrossRef]
- Ruan, L.; Yan, M.; Zhang, L.; Fan, X.; Yang, H. Spatial-Temporal NDVI Pattern of Global Mangroves: A Growing Trend during 2000–2018. Sci. Total Environ. 2022, 844, 157075. [Google Scholar] [CrossRef] [PubMed]
- Moreno, G.M.D.S.; De Carvalho Júnior, O.A.; De Carvalho, O.L.F.; Andrade, T.C. Deep Semantic Segmentation of Mangroves in Brazil Combining Spatial, Temporal, and Polarization Data from Sentinel-1 Time Series. Ocean Coast. Manag. 2023, 231, 106381. [Google Scholar] [CrossRef]
- Bernardino, A.F.; Mazzuco, A.C.A.; Souza, F.M.; Santos, T.M.T.; Sanders, C.J.; Massone, C.G.; Costa, R.F.; Silva, A.E.B.; Ferreira, T.O.; Nóbrega, G.N.; et al. The Novel Mangrove Environment and Composition of the Amazon Delta. Curr. Biol. 2022, 32, 3636–3640.e2. [Google Scholar] [CrossRef] [PubMed]
- Gonga, A.; Pérez-Portero, A.; Camps, A.; Pascual, D.; De Fockert, A.; De Maagt, P. GNSS-R Observations of Marine Plastic Litter in a Water Flume: An Experimental Study. Remote Sens. 2023, 15, 637. [Google Scholar] [CrossRef]
- Dasgupta, S.; Sarraf, M.; Wheeler, D. Plastic Waste Cleanup Priorities to Reduce Marine Pollution: A Spatiotemporal Analysis for Accra and Lagos with Satellite Data. Sci. Total Environ. 2022, 839, 156319. [Google Scholar] [CrossRef] [PubMed]
- Andriolo, U.; Garcia-Garin, O.; Vighi, M.; Borrell, A.; Gonçalves, G. Beached and Floating Litter Surveys by Unmanned Aerial Vehicles: Operational Analogies and Differences. Remote Sens. 2022, 14, 1336. [Google Scholar] [CrossRef]
- Pinto, L.; Andriolo, U.; Gonçalves, G. Detecting Stranded Macro-Litter Categories on Drone Orthophoto by a Multi-Class Neural Network. Mar. Pollut. Bull. 2021, 169, 112594. [Google Scholar] [CrossRef]
- Andriolo, U.; Gonçalves, G.; Sobral, P.; Bessa, F. Spatial and Size Distribution of Macro-Litter on Coastal Dunes from Drone Images: A Case Study on the Atlantic Coast. Mar. Pollut. Bull. 2021, 169, 112490. [Google Scholar] [CrossRef]
- Martin, C.; Zhang, Q.; Zhai, D.; Zhang, X.; Duarte, C.M. Enabling a Large-Scale Assessment of Litter along Saudi Arabian Red Sea Shores by Combining Drones and Machine Learning. Environ. Pollut. 2021, 277, 116730. [Google Scholar] [CrossRef]
- Balsi, M.; Moroni, M.; Chiarabini, V.; Tanda, G. High-Resolution Aerial Detection of Marine Plastic Litter by Hyperspectral Sensing. Remote Sens. 2021, 13, 1557. [Google Scholar] [CrossRef]
- McClenachan, G.; Turner, R.E. Disturbance Legacies and Shifting Trajectories: Marsh Soil Strength and Shoreline Erosion a Decade after the Deepwater Horizon Oil Spill. Environ. Pollut. 2023, 322, 121151. [Google Scholar] [CrossRef] [PubMed]
- Basit, A.; Siddique, M.A.; Bhatti, M.K.; Sarfraz, M.S. Comparison of CNNs and Vision Transformers-Based Hybrid Models Using Gradient Profile Loss for Classification of Oil Spills in SAR Images. Remote Sens. 2022, 14, 2085. [Google Scholar] [CrossRef]
- De Moura, N.V.A.; De Carvalho, O.L.F.; Gomes, R.A.T.; Guimarães, R.F.; De Carvalho Júnior, O.A. Deep-Water Oil-Spill Monitoring and Recurrence Analysis in the Brazilian Territory Using Sentinel-1 Time Series and Deep Learning. Int. J. Appl. Earth Obs. Geoinf. 2022, 107, 102695. [Google Scholar] [CrossRef]
- Rousso, R.; Katz, N.; Sharon, G.; Glizerin, Y.; Kosman, E.; Shuster, A. Automatic Recognition of Oil Spills Using Neural Networks and Classic Image Processing. Water 2022, 14, 1127. [Google Scholar] [CrossRef]
- Dasari, K.; Anjaneyulu, L.; Nadimikeri, J. Application of C-Band Sentinel-1A SAR Data as Proxies for Detecting Oil Spills of Chennai, East Coast of India. Mar. Pollut. Bull. 2022, 174, 113182. [Google Scholar] [CrossRef] [PubMed]
- Yunus, A.P.; Masago, Y.; Boulange, J.; Hijioka, Y. Natural and Anthropogenic Forces on Suspended Sediment Dynamics in Asian Estuaries. Sci. Total Environ. 2022, 836, 155569. [Google Scholar] [CrossRef] [PubMed]
- Johansen, K.; Dunne, A.F.; Tu, Y.-H.; Almashharawi, S.; Jones, B.H.; McCabe, M.F. Dye Tracing and Concentration Mapping in Coastal Waters Using Unmanned Aerial Vehicles. Sci. Rep. 2022, 12, 1141. [Google Scholar] [CrossRef]
- Flores, R.P.; Lara, C.; Saldías, G.S.; Vásquez, S.I.; Roco, A. Spatio-Temporal Variability of Turbid Freshwater Plumes in the Inner Sea of Chiloé, Northern Patagonia. J. Mar. Syst. 2022, 228, 103709. [Google Scholar] [CrossRef]
- Cira, M.; Bafna, A.; Lee, C.M.; Kong, Y.; Holt, B.; Ginger, L.; Cawse-Nicholson, K.; Rieves, L.; Jay, J.A. Turbidity and Fecal Indicator Bacteria in Recreational Marine Waters Increase Following the 2018 Woolsey Fire. Sci. Rep. 2022, 12, 2428. [Google Scholar] [CrossRef]
- Anwar, M.S.; Rahman, K.; Bhuiyan, M.A.E.; Saha, R. Assessment of Sea Level and Morphological Changes along the Eastern Coast of Bangladesh. J. Mar. Sci. Eng. 2022, 10, 527. [Google Scholar] [CrossRef]
- Basheer Ahammed, K.K.; Pandey, A.C. Assessment and Prediction of Shoreline Change Using Multi-Temporal Satellite Data and Geostatistics: A Case Study on the Eastern Coast of India. J. Water Clim. Chang. 2022, 13, 1477–1493. [Google Scholar] [CrossRef]
- Lowe, R.J.; Cuttler, M.V.W.; Hansen, J.E. Climatic Drivers of Extreme Sea Level Events Along the Coastline of Western Australia. Earth’s Future 2021, 9, e2020EF001620. [Google Scholar] [CrossRef]
- Hart-Davis, M.G.; Piccioni, G.; Dettmering, D.; Schwatke, C.; Passaro, M.; Seitz, F. EOT20: A Global Ocean Tide Model from Multi-Mission Satellite Altimetry. Earth Syst. Sci. Data 2021, 13, 3869–3884. [Google Scholar] [CrossRef]
- Lyard, F.H.; Allain, D.J.; Cancet, M.; Carrère, L.; Picot, N. FES2014 Global Ocean Tide Atlas: Design and Performance. Ocean Sci. 2021, 17, 615–649. [Google Scholar] [CrossRef]
- Marti, F.; Cazenave, A.; Birol, F.; Passaro, M.; Léger, F.; Niño, F.; Almar, R.; Benveniste, J.; Legeais, J.F. Altimetry-Based Sea Level Trends along the Coasts of Western Africa. Adv. Space Res. 2021, 68, 504–522. [Google Scholar] [CrossRef]
- Pegliasco, C.; Chaigneau, A.; Morrow, R.; Dumas, F. Detection and Tracking of Mesoscale Eddies in the Mediterranean Sea: A Comparison between the Sea Level Anomaly and the Absolute Dynamic Topography Fields. Adv. Space Res. 2021, 68, 401–419. [Google Scholar] [CrossRef]
- Anzidei, M.; Scicchitano, G.; Scardino, G.; Bignami, C.; Tolomei, C.; Vecchio, A.; Serpelloni, E.; De Santis, V.; Monaco, C.; Milella, M.; et al. Relative Sea-Level Rise Scenario for 2100 along the Coast of South Eastern Sicily (Italy) by InSAR Data, Satellite Images and High-Resolution Topography. Remote Sens. 2021, 13, 1108. [Google Scholar] [CrossRef]
- Nagura, M.; McPhaden, M.J. Interannual Variability in Sea Surface Height at Southern Midlatitudes of the Indian Ocean. J. Phys. Oceanogr. 2021, 51, 1595–1609. [Google Scholar] [CrossRef]
- Fagundes, M.A.R.; Mendonça-Tinti, I.; Iescheck, A.L.; Akos, D.M.; Geremia-Nievinski, F. An Open-Source Low-Cost Sensor for SNR-Based GNSS Reflectometry: Design and Long-Term Validation towards Sea-Level Altimetry. GPS Solut. 2021, 25, 73. [Google Scholar] [CrossRef]
- He, Y.; Gao, F.; Xu, T.; Meng, X.; Wang, N. Coastal Altimetry Using Interferometric Phase From GEO Satellite in Quasi-Zenith Satellite System. IEEE Geosci. Remote Sens. Lett. 2022, 19, 3068376. [Google Scholar] [CrossRef]
- Malan, N.; Roughan, M.; Kerry, C. The Rate of Coastal Temperature Rise Adjacent to a Warming Western Boundary Current Is Nonuniform with Latitude. Geophys. Res. Lett. 2021, 48, e2020GL090751. [Google Scholar] [CrossRef]
- Pan, H.; Jiao, S.; Xu, T.; Lv, X.; Wei, Z. Investigation of Tidal Evolution in the Bohai Sea Using the Combination of Satellite Altimeter Records and Numerical Models. Estuar. Coast. Shelf Sci. 2022, 279, 108140. [Google Scholar] [CrossRef]
- Sadat-Noori, M.; Rankin, C.; Rayner, D.; Heimhuber, V.; Gaston, T.; Drummond, C.; Chalmers, A.; Khojasteh, D.; Glamore, W. Coastal Wetlands Can Be Saved from Sea Level Rise by Recreating Past Tidal Regimes. Sci. Rep. 2021, 11, 1196. [Google Scholar] [CrossRef] [PubMed]
- Hooijer, A.; Vernimmen, R. Global LiDAR Land Elevation Data Reveal Greatest Sea-Level Rise Vulnerability in the Tropics. Nat. Commun. 2021, 12, 3592. [Google Scholar] [CrossRef] [PubMed]
- Calleja, F.; Chacón Guzmán, J.; Alfaro Chavarría, H. Marine Aquaculture in the Pacific Coast of Costa Rica: Identifying the Optimum Areas for a Sustainable Development. Ocean Coast. Manag. 2022, 219, 106033. [Google Scholar] [CrossRef]
- Fournier, S.; Lee, T. Seasonal and Interannual Variability of Sea Surface Salinity Near Major River Mouths of the World Ocean Inferred from Gridded Satellite and In-Situ Salinity Products. Remote Sens. 2021, 13, 728. [Google Scholar] [CrossRef]
- Roy, P.; Rao, I.N.; Martha, T.R.; Kumar, K.V. Discharge Water Temperature Assessment of Thermal Power Plant Using Remote Sensing Techniques. Energy Geosci. 2022, 3, 172–181. [Google Scholar] [CrossRef]
- Cheng, K.H.; Jiao, J.J.; Luo, X.; Yu, S. Effective Coastal Escherichia Coli Monitoring by Unmanned Aerial Vehicles (UAV) Thermal Infrared Images. Water Res. 2022, 222, 118900. [Google Scholar] [CrossRef]
- Verdura, J.; Santamaría, J.; Ballesteros, E.; Smale, D.A.; Cefalì, M.E.; Golo, R.; Caralt, S.; Vergés, A.; Cebrian, E. Local-scale Climatic Refugia Offer Sanctuary for a Habitat-forming Species during a Marine Heatwave. J. Ecol. 2021, 109, 1758–1773. [Google Scholar] [CrossRef]
- Zhang, D.; Zhu, Z.; Zhang, L.; Sun, X.; Zhang, Z.; Zhang, W.; Li, X.; Zhu, Q. Response of Industrial Warm Drainage to Tide Revealed by Airborne and Sea Surface Observations. Remote Sens. 2022, 15, 205. [Google Scholar] [CrossRef]
- Zhang, X.; Xiao, X.; Qiu, S.; Xu, X.; Wang, X.; Chang, Q.; Wu, J.; Li, B. Quantifying Latitudinal Variation in Land Surface Phenology of Spartina Alterniflora Saltmarshes across Coastal Wetlands in China by Landsat 7/8 and Sentinel-2 Images. Remote Sens. Environ. 2022, 269, 112810. [Google Scholar] [CrossRef]
- Chatterjee, A.; Anil, G.; Shenoy, L.R. Marine Heatwaves in the Arabian Sea. Ocean Sci. 2022, 18, 639–657. [Google Scholar] [CrossRef]
- Wang, Y.; Liu, J.; Liu, H.; Lin, P.; Yuan, Y.; Chai, F. Seasonal and Interannual Variability in the Sea Surface Temperature Front in the Eastern Pacific Ocean. JGR Ocean. 2021, 126, e2020JC016356. [Google Scholar] [CrossRef]
- Cao, L.; Tang, R.; Huang, W.; Wang, Y. Seasonal Variability and Dynamics of Coastal Sea Surface Temperature Fronts in the East China Sea. Ocean Dyn. 2021, 71, 237–249. [Google Scholar] [CrossRef]
- Calkoen, F.; Luijendijk, A.; Rivero, C.R.; Kras, E.; Baart, F. Traditional vs. Machine-Learning Methods for Forecasting Sandy Shoreline Evolution Using Historic Satellite-Derived Shorelines. Remote Sens. 2021, 13, 934. [Google Scholar] [CrossRef]
- Murray, J.; Adam, E.; Woodborne, S.; Miller, D.; Xulu, S.; Evans, M. Monitoring Shoreline Changes along the Southwestern Coast of South Africa from 1937 to 2020 Using Varied Remote Sensing Data and Approaches. Remote Sens. 2023, 15, 317. [Google Scholar] [CrossRef]
- Shamsuzzoha, M.; Ahamed, T. Shoreline Change Assessment in the Coastal Region of Bangladesh Delta Using Tasseled Cap Transformation from Satellite Remote Sensing Dataset. Remote Sens. 2023, 15, 295. [Google Scholar] [CrossRef]
- Apostolopoulos, D.N.; Avramidis, P.; Nikolakopoulos, K.G. Estimating Quantitative Morphometric Parameters and Spatiotemporal Evolution of the Prokopos Lagoon Using Remote Sensing Techniques. J. Mar. Sci. Eng. 2022, 10, 931. [Google Scholar] [CrossRef]
- Foti, G.; Barbaro, G.; Barillà, G.C.; Mancuso, P.; Puntorieri, P. Shoreline Evolutionary Trends Along Calabrian Coasts: Causes and Classification. Front. Mar. Sci. 2022, 9, 846914. [Google Scholar] [CrossRef]
- Lawrence, P.J.; Evans, A.J.; Jackson-Bué, T.; Brooks, P.R.; Crowe, T.P.; Dozier, A.E.; Jenkins, S.R.; Moore, P.J.; Williams, G.J.; Davies, A.J. Artificial Shorelines Lack Natural Structural Complexity across Scales. Proc. R. Soc. B 2021, 288, 20210329. [Google Scholar] [CrossRef]
- Chapkanski, S.; Brocard, G.; Lavigne, F.; Tricot, C.; Meilianda, E.; Ismail, N.; Majewski, J.; Goiran, J.; Alfian, D.; Daly, P.; et al. Fluvial and Coastal Landform Changes in the Aceh River Delta (Northern Sumatra) during the Century Leading to the 2004 Indian Ocean Tsunami. Earth Surf. Process. Landf. 2022, 47, 1127–1146. [Google Scholar] [CrossRef]
- Di Paola, G.; Minervino Amodio, A.; Dilauro, G.; Rodriguez, G.; Rosskopf, C.M. Shoreline Evolution and Erosion Vulnerability Assessment along the Central Adriatic Coast with the Contribution of UAV Beach Monitoring. Geosciences 2022, 12, 353. [Google Scholar] [CrossRef]
- Bishop-Taylor, R.; Nanson, R.; Sagar, S.; Lymburner, L. Mapping Australia’s Dynamic Coastline at Mean Sea Level Using Three Decades of Landsat Imagery. Remote Sens. Environ. 2021, 267, 112734. [Google Scholar] [CrossRef]
- Ferrentino, E.; Buono, A.; Nunziata, F.; Marino, A.; Migliaccio, M. On the Use of Multipolarization Satellite SAR Data for Coastline Extraction in Harsh Coastal Environments: The Case of Solway Firth. IEEE J. Sel. Top. Appl. Earth Obs. Remote Sens. 2021, 14, 249–257. [Google Scholar] [CrossRef]
- Cui, B.; Jing, W.; Huang, L.; Li, Z.; Lu, Y. SANet: A Sea–Land Segmentation Network Via Adaptive Multiscale Feature Learning. IEEE J. Sel. Top. Appl. Earth Obs. Remote Sens. 2021, 14, 116–126. [Google Scholar] [CrossRef]
- Dang, K.B.; Dang, V.B.; Ngo, V.L.; Vu, K.C.; Nguyen, H.; Nguyen, D.A.; Nguyen, T.D.L.; Pham, T.P.N.; Giang, T.L.; Nguyen, H.D.; et al. Application of Deep Learning Models to Detect Coastlines and Shorelines. J. Environ. Manag. 2022, 320, 115732. [Google Scholar] [CrossRef] [PubMed]
- Tsai, Y.-L.S. Monitoring 23-Year of Shoreline Changes of the Zengwun Estuary in Southern Taiwan Using Time-Series Landsat Data and Edge Detection Techniques. Sci. Total Environ. 2022, 839, 156310. [Google Scholar] [CrossRef]
- Aladwani, N.S. Shoreline Change Rate Dynamics Analysis and Prediction of Future Positions Using Satellite Imagery for the Southern Coast of Kuwait: A Case Study. Oceanologia 2022, 64, 417–432. [Google Scholar] [CrossRef]
- Dervisoglu, A. Investigation of Long and Short-Term Water Surface Area Changes in Coastal Ramsar Sites in Turkey with Google Earth Engine. ISPRS Int. J. Geo-Inf. 2022, 11, 46. [Google Scholar] [CrossRef]
- Siyal, A.A.; Solangi, G.S.; Siyal, Z.-A.; Siyal, P.; Babar, M.M.; Ansari, K. Shoreline Change Assessment of Indus Delta Using GIS-DSAS and Satellite Data. Reg. Stud. Mar. Sci. 2022, 53, 102405. [Google Scholar] [CrossRef]
- Aghdami-Nia, M.; Shah-Hosseini, R.; Rostami, A.; Homayouni, S. Automatic Coastline Extraction through Enhanced Sea-Land Segmentation by Modifying Standard U-Net. Int. J. Appl. Earth Obs. Geoinf. 2022, 109, 102785. [Google Scholar] [CrossRef]
- Apostolopoulos, D.N.; Nikolakopoulos, K.G. Statistical Methods to Estimate the Accuracy of Diachronic Low-Resolution Satellite Instruments for Shoreline Monitoring. J. Appl. Rem. Sens. 2021, 16, 012007. [Google Scholar] [CrossRef]
- Matin, N.; Hasan, G.M.J. A Quantitative Analysis of Shoreline Changes along the Coast of Bangladesh Using Remote Sensing and GIS Techniques. CATENA 2021, 201, 105185. [Google Scholar] [CrossRef]
- Elkafrawy, S.B.; Basheer, M.A.; Mohamed, H.M.; Naguib, D.M. Applications of Remote Sensing and GIS Techniques to Evaluate the Effectiveness of Coastal Structures along Burullus Headland-Eastern Nile Delta, Egypt. Egypt. J. Remote Sens. Space Sci. 2021, 24, 247–254. [Google Scholar] [CrossRef]
- Abdul Maulud, K.N.; Selamat, S.N.; Mohd, F.A.; Md Noor, N.; Wan Mohd Jaafar, W.S.; Kamarudin, M.K.A.; Ariffin, E.H.; Adnan, N.A.; Ahmad, A. Assessment of Shoreline Changes for the Selangor Coast, Malaysia, Using the Digital Shoreline Analysis System Technique. Urban Sci. 2022, 6, 71. [Google Scholar] [CrossRef]
- Verma, U.; Chauhan, A.; Manohara Pai, M.M.; Pai, R. DeepRivWidth: Deep Learning Based Semantic Segmentation Approach for River Identification and Width Measurement in SAR Images of Coastal Karnataka. Comput. Geosci. 2021, 154, 104805. [Google Scholar] [CrossRef]
- Fogarin, S.; Zanetti, M.; Dal Barco, M.K.; Zennaro, F.; Furlan, E.; Torresan, S.; Pham, H.V.; Critto, A. Combining Remote Sensing Analysis with Machine Learning to Evaluate Short-Term Coastal Evolution Trend in the Shoreline of Venice. Sci. Total Environ. 2023, 859, 160293. [Google Scholar] [CrossRef]
- Alcaras, E.; Falchi, U.; Parente, C.; Vallario, A. Accuracy Evaluation for Coastline Extraction from Pléiades Imagery Based on NDWI and IHS Pan-Sharpening Application. Appl. Geomat. 2022, 15, 595–605. [Google Scholar] [CrossRef]
- Bera, A.; Taloor, A.K.; Meraj, G.; Kanga, S.; Singh, S.K.; Đurin, B.; Anand, S. Climate Vulnerability and Economic Determinants: Linkages and Risk Reduction in Sagar Island, India; A Geospatial Approach. Quat. Sci. Adv. 2021, 4, 100038. [Google Scholar] [CrossRef]
- Xu, H.; Xu, G.; Wen, X.; Hu, X.; Wang, Y. Lockdown Effects on Total Suspended Solids Concentrations in the Lower Min River (China) during COVID-19 Using Time-Series Remote Sensing Images. Int. J. Appl. Earth Obs. Geoinf. 2021, 98, 102301. [Google Scholar] [CrossRef]
- Singh, S.; Singh, S.K.; Prajapat, D.K.; Pandey, V.; Kanga, S.; Kumar, P.; Meraj, G. Assessing the Impact of the 2004 Indian Ocean Tsunami on South Andaman’s Coastal Shoreline: A Geospatial Analysis of Erosion and Accretion Patterns. J. Mar. Sci. Eng. 2023, 11, 1134. [Google Scholar] [CrossRef]
- Ganju, N.K.; Couvillion, B.R.; Defne, Z.; Ackerman, K.V. Development and Application of Landsat-Based Wetland Vegetation Cover and UnVegetated-Vegetated Marsh Ratio (UVVR) for the Conterminous United States. Estuaries Coasts 2022, 45, 1861–1878. [Google Scholar] [CrossRef]
- Casal, G. Assessment of Sentinel-2 to Monitor Highly Dynamic Small Water Bodies: The Case of Louro Lagoon (Galicia, NW Spain). Oceanologia 2022, 64, 88–102. [Google Scholar] [CrossRef]
- Roca, M.; Navarro, G.; García-Sanabria, J.; Caballero, I. Monitoring Sand Spit Variability Using Sentinel-2 and Google Earth Engine in a Mediterranean Estuary. Remote Sens. 2022, 14, 2345. [Google Scholar] [CrossRef]
- Jia, M.; Wang, Z.; Mao, D.; Ren, C.; Wang, C.; Wang, Y. Rapid, Robust, and Automated Mapping of Tidal Flats in China Using Time Series Sentinel-2 Images and Google Earth Engine. Remote Sens. Environ. 2021, 255, 112285. [Google Scholar] [CrossRef]
- Mahajan, G.R.; Das, B.; Gaikwad, B.; Murgaonkar, D.; Desai, A.; Morajkar, S.; Patel, K.P.; Kulkarni, R.M. Monitoring Properties of the Salt-Affected Soils by Multivariate Analysis of the Visible and near-Infrared Hyperspectral Data. CATENA 2021, 198, 105041. [Google Scholar] [CrossRef]
- Guo, B.; Lu, M.; Fan, Y.; Wu, H.; Yang, Y.; Wang, C. A Novel Remote Sensing Monitoring Index of Salinization Based on Three-Dimensional Feature Space Model and Its Application in the Yellow River Delta of China. Geomat. Nat. Hazards Risk 2023, 14, 95–116. [Google Scholar] [CrossRef]
- Wei, J.; Wang, M.; Jiang, L.; Yu, X.; Mikelsons, K.; Shen, F. Global Estimation of Suspended Particulate Matter From Satellite Ocean Color Imagery. JGR Ocean. 2021, 126, e2021JC017303. [Google Scholar] [CrossRef]
- Cavalli, R.; Betti, M.; Campanelli, A.; Cicco, A.; Guglietta, D.; Penna, P.; Piermattei, V. A Methodology to Assess the Accuracy with Which Remote Data Characterize a Specific Surface, as a Function of Full Width at Half Maximum (FWHM): Application to Three Italian Coastal Waters. Sensors 2014, 14, 1155–1183. [Google Scholar] [CrossRef]
- Wu, N.; Shi, R.; Zhuo, W.; Zhang, C.; Zhou, B.; Xia, Z.; Tao, Z.; Gao, W.; Tian, B. A Classification of Tidal Flat Wetland Vegetation Combining Phenological Features with Google Earth Engine. Remote Sens. 2021, 13, 443. [Google Scholar] [CrossRef]
- Zhang, C.; Gong, Z.; Qiu, H.; Zhang, Y.; Zhou, D. Mapping Typical Salt-Marsh Species in the Yellow River Delta Wetland Supported by Temporal-Spatial-Spectral Multidimensional Features. Sci. Total Environ. 2021, 783, 147061. [Google Scholar] [CrossRef] [PubMed]
- Lama, G.F.C.; Sadeghifar, T.; Azad, M.T.; Sihag, P.; Kisi, O. On the Indirect Estimation of Wind Wave Heights over the Southern Coasts of Caspian Sea: A Comparative Analysis. Water 2022, 14, 843. [Google Scholar] [CrossRef]
- Passaro, M.; Hemer, M.A.; Quartly, G.D.; Schwatke, C.; Dettmering, D.; Seitz, F. Global Coastal Attenuation of Wind-Waves Observed with Radar Altimetry. Nat. Commun. 2021, 12, 3812. [Google Scholar] [CrossRef] [PubMed]
- Li, X.; Yang, D.; Yang, J.; Zheng, G.; Han, G.; Nan, Y.; Li, W. Analysis of Coastal Wind Speed Retrieval from CYGNSS Mission Using Artificial Neural Network. Remote Sens. Environ. 2021, 260, 112454. [Google Scholar] [CrossRef]
Figure 1.
PRISMA flow chart showing the different steps of dataset creation, where ntot is the total number of papers.
Figure 1.
PRISMA flow chart showing the different steps of dataset creation, where ntot is the total number of papers.

Figure 2.
The parameters mapped or monitored (columns) to examine the phenomena (rows). The red cells highlight the parameter used to map or monitor the phenomena, whereas the white cells highlight the parameter not used to map or monitor the phenomena.
Figure 2.
The parameters mapped or monitored (columns) to examine the phenomena (rows). The red cells highlight the parameter used to map or monitor the phenomena, whereas the white cells highlight the parameter not used to map or monitor the phenomena.


Figure 3.
The parameters versus the number of phenomena.

Figure 4.
The phenomena versus the number of parameters.

Table 1.
Reviews on remote sensing for mapping and monitoring coastal phenomena and parameters.
| Paper | Publication Year | Publication Title | Number of References Cited in the Review | Citations in WoS 1 | Citations in Scopus 1 |
|---|---|---|---|---|---|
| Adade et al. [14] | 2021 | Unmanned aerial vehicle (UAV) applications in coastal zone management—A review | 41 | 30 | 36 |
| Adebisi et al. [12] | 2021 | Advances in estimating sea level rise: A review of tide gauge, satellite altimetry and spatial data science approaches | 126 | 22 | 26 |
| Apostolopoulos and Nikolakopoulos [15] | 2021 | A review and meta-analysis of remote sensing data, GIS methods, materials and indices used for monitoring the coastline evolution over the last twenty years | 171 | 35 | 42 |
| Ashphaq et al. [16] | 2021 | Review of near-shore satellite derived bathymetry: Classification and account of five decades of coastal bathymetry research | 99 | 39 | 46 |
| Bagheri-Gavkosh et al. [17] | 2021 | Land subsidence: A global challenge | 91 | 66 | 74 |
| Chaturvedi [18] | 2021 | Disaster management: Tsunami and remote sensing technology | 31 | 0 | 0 |
| Datta et al. [19] | 2021 | Monitoring the spread of water hyacinth (Pontederia crassipes): Challenges and future developments | 74 | 23 | 33 |
| Gijsman et al. [20] | 2021 | Nature-based engineering: A review on reducing coastal flood risk with mangroves | 215 | 31 | 36 |
| Gupana et al. [21] | 2021 | Remote sensing of sun-induced chlorophyll-a fluorescence in inland and coastal waters: Current state and future prospects | 129 | 23 | 26 |
| Kieu and Law [22] | 2021 | Remote sensing of coastal hydro-environment with portable unmanned aerial vehicles (pUAVs) a state-of-the-art review | 111 | 9 | 10 |
| Murthy et al. [23] | 2021 | Three decades of Indian remote sensing in coastal research | 52 | 2 | 2 |
| Parthasarathy and Deka [24] | 2021 | Remote sensing and GIS application in assessment of coastal vulnerability and shoreline changes: A review | 112 | - | 31 |
| Rossi et al. [25] | 2021 | Measurement of sea waves | 220 | 15 | 15 |
| Thamaga et al. [26] | 2021 | Advances in satellite remote sensing of the wetland ecosystems in Sub-Saharan Africa | 152 | 19 | 18 |
| Topouzelis et al. [27] | 2021 | Floating marine litter detection algorithms and techniques using optical remote sensing data: A review | 46 | 33 | 38 |
| Wen et al. [28] | 2021 | A review of quantifying pCO2 in inland waters with a global perspective: Challenges and prospects of implementing remote sensing technology | 111 | 4 | 8 |
| Al-Shehhi and Abdul [29] | 2022 | Identifying algal bloom ‘hotspots’ in marginal productive seas: A review and geospatial analysis | 125 | 0 | 2 |
| Asif et al. [30] | 2022 | Environmental impacts and challenges associated with oil spills on shorelines | 111 | 31 | 38 |
| Gonçalves et al. [31] | 2022 | Beach litter survey by drones: Mini-review and discussion of a potential standardization | 71 | 7 | 15 |
| Cazenave and Moreira [32] | 2022 | Contemporary sea-level changes from global to local scales: a review | 185 | 11 | 15 |
| Morgan et al. [33] | 2022 | Unmanned aerial remote sensing of coastal vegetation: A review | 47 | 13 | 9 |
| Tran et al. [34] | 2022 | A review of spectral indices for mangrove remote sensing | 282 | 17 | 17 |
| Veettil et al. [35] | 2022 | Coastal and marine plastic litter monitoring using remote sensing: A review | 108 | 13 | 14 |
| Vigouroux and Destouni [36] | 2022 | Gap identification in coastal eutrophication research—Scoping review for the Baltic system case | 82 | 5 | 5 |
| Adjovu et al. [37] | 2023 | Overview of the application of remote sensing in effective monitoring of water quality parameters | 213 | 9 | 11 |
| Ankrah et al. [38] | 2023 | Shoreline change and coastal erosion in West Africa: A systematic review of research progress and policy recommendation | 102 | 6 | 6 |
| Boukhennaf and Mezouar [39] | 2023 | Long and short-term evolution of the Algerian coastline using remote sensing and GIS technology | 108 | 0 | 0 |
| Hauser et al. [40] | 2023 | Satellite remote sensing of surface winds, waves, and currents: Where are we now? | 381 | 3 | 4 |
| Hu et al. [41] | 2023 | Mapping Ulva prolifera green tides from space: A revisit on algorithm design and data products | 81 | 13 | 14 |
| Kim et al. [42] | 2023 | Remote sensing of sea surface salinity: Challenges and research directions | 143 | 3 | 4 |
| Rolim et al. [43] | 2023 | Remote sensing for mapping algal blooms in freshwater lakes: A review | 112 | 7 | 7 |
| Schwartz-Belkin and Portman [44] | 2023 | A review of geospatial technologies for improving Marine spatial planning: Challenges and opportunities | 285 | 4 | 5 |
| Tsiakos and Chalkias [45] | 2023 | Use of machine learning and remote sensing techniques for shoreline monitoring: A review of recent literature | 111 | 7 | 8 |
| Villalobos Perna et al. [46] | 2023 | Remote sensing and invasive plants in coastal ecosystems: What we know so far and future prospects | 95 | 2 | 2 |
| Yuan et al. [47] | 2023 | Marine environmental monitoring with unmanned vehicle platforms: Present applications and future prospects | 176 | 10 | 11 |
1 accessed on 8 January 2024.
Table 2.
The analyzed reviews according to the phenomena and/or parameters examined, the study area analyzed, and type of sensor or methodology employed.
Table 2.
The analyzed reviews according to the phenomena and/or parameters examined, the study area analyzed, and type of sensor or methodology employed.
| One Phenomenon and/or Parameter Examined | One Study Area Analyzed | One Type of Sensor or Methodology Employed | Number of Reviews |
|---|---|---|---|
| Algal blooms [43], bathymetry [16], carbon dioxide [28], chlorophyll-a [21], coastlines [15,24], floating marine litter [27], invasive alien plants [46], mangroves [20], oil spills [30], sea level [12,32], sea surface salinity [42], subsidence [17], surface wave [25], wind and current [40], tsunami [18], Ulva (green algae) [41], water hyacinth [19], water quality [37] | No | No | 20 |
| Algal blooms [29], coastlines [38,39], eutrophication research [36], vegetation [26] | Algerian coast [39], Arabian gulf and sea [29], Baltic sea [36], Sea of Oman [29], Sub-Saharan Africa [26], Red Sea [29], West Africa [38] | No | 5 |
| Coastlines [45], mangroves [34], marine spatial planning [44], floating marine litter [31,35], vegetation [33] | No | Geospatial technology [44], high spatial resolution images [35], machine learning [45], spectral indices [34], unmanned aerial vehicles [31,33] | 6 |
| No | No | Indian remote sensing satellites [23], unmanned aerial vehicles [14,22,47] | 4 |
Table 3.
The parameters mapped or monitored by the authors of eligible papers.
| Parameter | Number of Papers that Analyzed the Parameter | Number of Papers that Mapped Only the Parameter | Number of Papers that Mapped the Parameter Together with Other Parameters |
|---|---|---|---|
| Algae and macroalgae | 40 | 13 | 27 |
| Aquaculture systems | 22 | 3 | 19 |
| Aquatic vegetation and coral | 18 | 0 | 18 |
| Bathymetry, seabed, and tidal creeks | 84 | 27 | 57 |
| Chlorophyll-a | 71 | 12 | 59 |
| Colored dissolved organic matter | 14 | 0 | 14 |
| Current data | 20 | 0 | 20 |
| Depths of Secchi disk and euphotic layer | 9 | 1 | 8 |
| Diffuse attenuation coefficient at 490 nm | 14 | 0 | 14 |
| Digital surface model | 84 | 18 | 66 |
| Dissolved organic carbon | 5 | 0 | 5 |
| Dissolved iron and dissolved oxygen | 4 | 0 | 4 |
| Flood extent | 10 | 1 | 9 |
| Ice | 7 | 1 | 6 |
| Land surface temperature | 11 | 1 | 10 |
| Land use and land cover | 152 | 8 | 144 |
| Leaf area index | 5 | 0 | 5 |
| Mangroves | 35 | 4 | 31 |
| Marine litter | 14 | 6 | 8 |
| Nightlight and nighttime light intensity | 5 | 0 | 5 |
| Methane and oil | 10 | 4 | 6 |
| Particulate organic carbon | 5 | 0 | 5 |
| Photosynthetically active radiation | 6 | 0 | 6 |
| Phycocyanin | 1 | 0 | 1 |
| Plumes | 9 | 1 | 8 |
| Primary production | 9 | 0 | 9 |
| Salt marshes | 9 | 0 | 9 |
| Sea level anomaly and sea level rise | 46 | 3 | 43 |
| Sea surface salinity | 17 | 1 | 16 |
| Sea surface temperature | 59 | 4 | 55 |
| Shoreline | 113 | 24 | 89 |
| Soil salinization and soil moisture | 10 | 1 | 9 |
| Suspended sediments | 30 | 1 | 29 |
| Tidal data | 28 | 0 | 28 |
| Vegetation cover | 98 | 0 | 98 |
| Vegetation species | 19 | 0 | 19 |
| Water turbidity | 17 | 0 | 17 |
| Wave data | 9 | 0 | 9 |
| Wind data | 39 | 4 | 35 |
Disclaimer/Publisher’s Note: The statements, opinions and data contained in all publications are solely those of the individual author(s) and contributor(s) and not of MDPI and/or the editor(s). MDPI and/or the editor(s) disclaim responsibility for any injury to people or property resulting from any ideas, methods, instructions or products referred to in the content. |
© 2024 by the author. Licensee MDPI, Basel, Switzerland. This article is an open access article distributed under the terms and conditions of the Creative Commons Attribution (CC BY) license (https://creativecommons.org/licenses/by/4.0/).
Share and Cite
MDPI and ACS Style
Cavalli, R.M. Remote Data for Mapping and Monitoring Coastal Phenomena and Parameters: A Systematic Review. Remote Sens. 2024, 16, 446. https://doi.org/10.3390/rs16030446
AMA Style
Cavalli RM. Remote Data for Mapping and Monitoring Coastal Phenomena and Parameters: A Systematic Review. Remote Sensing. 2024; 16(3):446. https://doi.org/10.3390/rs16030446
Chicago/Turabian StyleCavalli, Rosa Maria. 2024. "Remote Data for Mapping and Monitoring Coastal Phenomena and Parameters: A Systematic Review" Remote Sensing 16, no. 3: 446. https://doi.org/10.3390/rs16030446
Note that from the first issue of 2016, this journal uses article numbers instead of page numbers. See further details here.