


Spatial Heterogeneity and the Increasing Trend of Vegetation and Their Driving Mechanisms in the Mountainous Area of Haihe River Basin

1
Key Laboratory of Agricultural Water Resources, Hebei Laboratory of Agricultural Water-Saving, Center for Agricultural Resources Research, Institute of Genetics and Developmental Biology, Chinese Academy of Sciences, Shijiazhuang 050022, China
2
University of Chinese Academy of Sciences, Beijing 100049, China
3
College of Geographical Sciences, Hebei Normal University, Shijiazhuang 050024, China
*
Author to whom correspondence should be addressed.
Remote Sens. 2024, 16(3), 587; https://doi.org/10.3390/rs16030587
Submission received: 24 December 2023
/
Revised: 29 January 2024
/
Accepted: 31 January 2024
/
Published: 4 February 2024
(This article belongs to the Special Issue Remote Sensing of Mountain and Plateau Vegetation)
Abstract
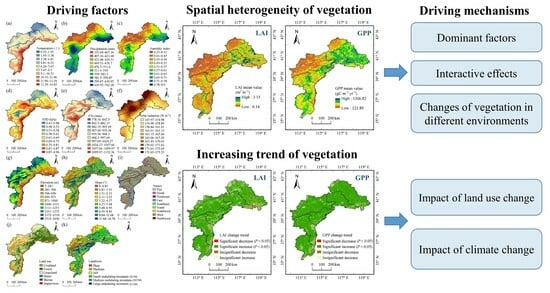
:In addition to serving as North China’s water supply and ecological barrier, the mountainous area of the Haihe River basin (MHRB) is a crucial location for the application of ecological engineering. Vegetation is an important component in the ecological conservation and eco-hydrological progress of the MHRB. A better understanding of regional vegetation growth can be achieved by a thorough investigation of vegetation indicators. In this research, the leaf area index (LAI) and gross primary productivity (GPP) were chosen as vegetation indicators. The characteristics and driving forces of the spatiotemporal variations of LAI and GPP in the MHRB were explored through Sen’s slope, the Mann–Kendall test, the optimal parameter-based geographical detector model, and correlation analysis. From 2001 to 2018, the annual LAI and GPP increased significantly on the regional scale. The areas with significantly increased vegetation accounted for more than 81% of the MHRB. Land use was the most influential element for the spatial heterogeneity of LAI and GPP, and the humidity index was the most crucial one among climate indicators. Non-linear enhancement or bivariate enhancement was discovered between any two factors, and the strongest interaction was from land use and humidity index. The lowest vegetation cover was found in dry regions with annual precipitation below 407 mm and the humidity index under 0.41; while in both forests and large undulating mountains, higher LAI and GPP were observed. About 87% of the significantly increased vegetation was found in areas with unaltered land use. The increase in vegetation in the MHRB from 2001 to 2018 was promoted by the increased precipitation and humidity index and the reduced vapor pressure deficit. The sensitivity of GPP to climate change was stronger than that of LAI. These findings can serve as a theoretical guide for the application of ecological engineering and ecological preservation in the MHRB.
1. Introduction
Vegetation is a crucial driver in global water and energy cycles, carbon balance, and climate stability [1]. Vegetation indexes, such as the normalized difference vegetation index (NDVI), the leaf area index (LAI), and gross primary productivity (GPP), are the main indicators for remote sensing monitoring of vegetation [2,3]. In many parts of the global vegetated areas, vegetation coverage has dramatically risen since the 1980s [1]. In addition, some areas of the world have seen vegetation degradation [3,4]. A thorough investigation of several vegetation indicators is conducive to clearer identification of the distribution and variations in vegetation.
The function and structure of vegetation ecosystems could be greatly affected by climate. In dry and warm areas, ecosystems are more sensitive to changes in humidity, while cold ecosystems are more vulnerable to changes in temperature [5]. One of the important areas of inquiry into global change is how the warming of the environment affects the development of vegetation. According to earlier research, from 1981 to 1991, global warming lengthened the growing season of plants and encouraged vegetation development in high-latitude areas of the Northern Hemisphere [6]. However, there was a weakening of the association between temperature and vegetation change in the region north of 30°N from 1982 to 2011 [7].
More water supply is needed to encourage vegetation activity when the temperature limitation on vegetation photosynthesis weakens [8]. Vegetation greenness in arid areas became more sensitive to precipitation between 1981 and 2015 [9]. The Northern Hemisphere’s temperate vegetation has endured a large increase in water limitation from 1982 to 2015, and the vegetation areas with water deficiency grew dramatically [10]. Additionally, a rise in atmospheric vapor pressure deficit (VPD) may cause plants to close their stomatal in an effort to decrease water loss, which would impede photosynthesis and lower productivity [11]. Interannual fluctuations in VPD have a considerable impact on vegetation growth on a worldwide scale [12]. What is more, the rapid increase in VPD in the late 1990s led to a decrease in the terrestrial gross primary productivity [13]. As vegetation becomes more sensitive to moisture, vegetation growth will face more severe constraints of water scarcity in the future [14]. Thus, it is critical to completely comprehend the impact of moisture factors on vegetation development.
Compared with the impact of climatic elements, land use tends to have a more immediate impact on vegetation. For instance, irrigation, fertilization, and afforestation frequently result in considerable increases in vegetation cover, whereas deforestation could reduce the vegetation cover. The management of farmland and afforestation initiatives have a direct impact on China’s vegetation greening [15]. Landform type and topography are also important factors for vegetation distribution [16,17].
In addition to change trends, significant spatial heterogeneity exists in the vegetation, and various settings have varied vegetation features [18,19]. Meanwhile, it is not always the case that one factor has an independent effect on vegetation development [20,21]. Geographical detectors can effectively identify the influencing factors of spatial differences in vegetation, as well as the importance of each factor and how those factors interact with one another [17,22]. Geographical detectors have been successfully applied to identify the influencing factors of vegetation [23,24]. Some studies based on geographical detectors focused on analyzing the causes of spatial heterogeneity of vegetation, but ignored the causes of vegetation change trends. A comprehensive analysis of the driving forces of vegetation growth from the aspects of spatial heterogeneity and change trends is conducive to obtaining more reliable results.
The mountainous area of the Haihe River basin (MHRB) is an important ecological barrier and water source in North China. Vegetation increase in the MHRB is good for wind prevention, sand fixation, and the reduction of soil erosion. Additionally, vegetation is crucial for increasing carbon sinks in the MHRB and for enhancing the quality of the air, water, and soil. The Three-North Shelterbelt Development Program, the Greening Project of Taihang Mountain, and the Grain for Green Program have all been implemented in the MHRB to safeguard the ecological environment. One of the primary goals of ecological engineering implementation is to increase forests and vegetation coverage. A requirement for the successful use of ecological engineering is an understanding of the trend and underlying causes of vegetation fluctuations. A reference point for agricultural production in the MHRB can also be found in the identification of elements that impact vegetation, as changes in vegetation on cultivated land reflect the growing status of crops. The increasing trends of NDVI have been demonstrated during the periods of 2000–2013 and 2002–2018 in the Haihe River basin (HRB) [25,26]. The increased net primary productivity of the MHRB has also been revealed from 2000 to 2020 [27]. Precipitation and NDVI correlate more strongly than temperature in the HRB [25]. Reforestation is a clear cause of NDVI change in the MHRB [26]. Runoff in the MHRB has declined over the past few decades [28,29], while vegetation plays a crucial role in the eco-hydrological process [30,31]. An adequate understanding of vegetation change is also a prerequisite for eco-hydrological research and water conservation in the MHRB.
Most of the previous studies in the MHRB relied on a single vegetation indicator. Analysis based on different indicators is helpful to further understand the vegetation changes in the MHRB. LAI is a key index of vegetation greenness, as well as a basic variable for many ecological and hydrological models [1,15]. GPP is an important indicator of terrestrial carbon sink [12]. The combined use of LAI and GPP can reliably reflect vegetation growth. In addition, the responses of LAI and GPP to climate change may be different [2]. Therefore, comparative analyses of LAI and GPP can obtain more comprehensive results. Temperature, precipitation, and solar radiation were employed to explore the relations between climatic elements and vegetation in the MHRB, while humidity index and VPD are infrequently taken into account. In addition, the interaction between various factors and the growth patterns of vegetation in different environments still needs to be further explored in the MHRB. The goals of this study are the following: (1) to clarify the spatial distribution and the spatiotemporal variation characteristics of LAI and GPP in the MHRB; (2) to analyze the driving forces and their interactive effects for the spatial heterogeneity of vegetation distribution; (3) to analyze the distribution of vegetation in different environments; and (4) to explore the driving forces for vegetation change trends.
2. Materials and Methods
2.1. Study Area
The MHRB (35°03′N–42°44′N, 111°57′E–119°35′E) is located in North China (Figure 1). It covers around 187,000 km2, accounting for about 59% of the entire HRB. The mountainous areas of the Luanhe River basin (MLHRB), Beisanhe River basin (MBSHRB), Daqinghe River basin (MDQHRB), Yongdinghe River basin (MYDHRB), Ziyahe River basin (MZYHRB), and Zhangweihe River basin (MZWHRB) are the six components that make up the MHRB. The MHRB is dominated by a temperate monsoon climate. The elevation of the MHRB ranges from 7 to 3056 m above sea level (asl).
2.2. Data Acquisition and Preprocessing
Daily precipitation, temperature, downward shortwave radiation, wind speed, specific humidity, and pressure data from 2001 to 2018 were obtained from the China Meteorological Forcing Dataset (CMFD, http://data.tpdc.ac.cn, accessed on 29 October 2022), with a spatial resolution of 0.1° × 0.1° [32]. Temperature data with 3 h resolution were also used. CMFD has been widely used in recent research for its higher accuracy [33,34,35]. Downward shortwave radiation has been used in this investigation to approximate solar radiation [36]. Weather stations in the MHRB are sparse, which can affect the accuracy of data analysis. CMFD has 1962 grid points in the MHRB, which is dense and beneficial to improve the accuracy of interpolation. Since CMFD is not available after 2018, our study was also up to 2018.
LAI (MOD15A2H, temporal resolution of 8 days) and yearly GPP (MOD17A3HGF) data from 2001 to 2018 were downloaded from USGS (https://e4ftl01.cr.usgs.gov/, accessed on 20 September 2022), with a spatial resolution of 500 m. Savitzky–Golay filtering method was applied to smooth the original LAI data to reduce invalid values. The LAI data were synthesized to the monthly scale by the maximum synthesis method, and the annual LAI was the average of all the monthly data within the year.
The DEM data (ASTER GDEM V3, spatial resolution of 30 m) were obtained from the National Aeronautics and Space Administration (https://cmr.earthdata.nasa.gov/, accessed on 20 June 2020). The landform data with a spatial resolution of 1000 m were acquired from the Resource and Environment Science and Data Center (https://www.resdc.cn/, accessed on 9 October 2021). The China land cover dataset (CLCD, https://doi.org/10.5281/zenodo.5816591, accessed on 9 September 2022) was employed to analyze the land use change from 2001 to 2018, whose accuracy is comparatively good in China [37]. The original statistics in the MHRB primarily consist of eight land use types. Due to the small areas of shrub and wetland, they were merged with forest and water, respectively. Ultimately, land use consisted of six categories: cropland, grassland, forest, water, barren, and impervious. In order to reduce the impact of land use changes, unchanged land use data from 2001 to 2018 were utilized for the geographical detector model. Table 1 lists the four kinds of driving factors that were taken into consideration, including climate, topography, land use, and geomorphology. Climate factors include temperature (X1), precipitation (X2), humidity index (X3), VPD (X4), reference evapotranspiration (ETo, X5), and solar radiation (X6). The topography factors include elevation (X7), slope (X8), and aspect (X9).
2.3. Methods
2.3.1. VPD
VPD (kPa) can be calculated by the following equation:
is saturation vapor pressure at the air temperature T (kPa), and are the daily maximum air temperature and daily minimum air temperature, respectively.
q is specific humidity (g g−1), p is air pressure (hPa).
2.3.2. Humidity Index
The FAO Penman–Monteith method was applied to calculate ETo (mm) [38]. The equation for the humidity index can be expressed as follows [40]:
In the formula, P is precipitation (mm).
2.3.3. Optimal Parameters-Based Geographical Detector (OPGD)
The geographical detector is an excellent model for the analysis of spatial heterogeneity and its underlying driving forces [41,42]. The discretization of continuous variables in the traditional geographical detector is determined by personal experience, which is subjective and lacks accurate quantitative evaluation [43,44]. The discretization scheme with the strongest explanatory power can be determined in OPGD, and the results are more reliable and accurate [43]. The “GD” package in R was applied to perform the OPGD model [43]. For geographical detection, pixels from 2001 to 2018 without land use change were employed. More than 665,000 pixels took part in the simulation. Mean values for LAI, GPP, and climate factors from 2001 to 2018 were used in the OPGD. The climate data were interpolated to 500 m through the kriging method so as to unify the spatial resolution with LAI and GPP. Data of DEM, landform, and land use were resampled to 500 m before simulation. In our investigation, we employed factor, interaction, and risk detectors.
(1) The factor detector can quantify the impact of each factor (X) on the spatial heterogeneity of the variable (Y). The explanatory power (q) of X can be calculated as follows [42]:
In the formula, q represents the explanatory power of X on Y. The higher q value indicates a higher impact of X on Y. L is the stratification of X or Y. Nh and N are the numbers of units of layer h and the whole region, respectively. and are the numbers of variance of layer h and the whole region, respectively.
(2) The interaction detector can be applied to evaluate the q values after the interaction of two factors (X). When q (X1∩X2) > Max (q(X1), q(X2)), it is bivariate enhancement; when q (X1∩X2) > q (X1) + q (X2), it is non-linear enhancement [41].
(3) The risk detector can be applied to determine whether there is an obvious variation in variables between different attributes of each factor. It can be utilized to ascertain how the variable (Y)’s attribute changes as the driving factor (X)’s subregions change.
(4) Spatial data discretization: geographical detectors require the discretization of continuous variables into categorical variables known as spatial data discretization. Climatic elements, elevation, and slope are continuous variables that need to be discretized. Equal interval, natural breaks, quantile, and geometrical interval are the four different forms of discretization methods. The number of discretization categories was set to 4–10. The optimal combination of category numbers and discretization methods was utilized.
The factors for LAI after ideal discretization are displayed in Figure 2. The climate elements were annual averages from 2001 to 2018. The temperature in the MHRB was higher in the eastern and southern regions and gradually decreased in the northern regions (Figure 2a). Similar patterns could be seen in the distribution of precipitation and humidity index, with greater values in the south of the MLHRB, MBSHRB, and MDQHRB, as well as the east of MZYHRB and the MZWHRB (Figure 2b,c). However, the northern portion of the MLHRB and MBSHRB and the MYDHRB had less precipitation and a drier climate. The value of VPD was higher in the MYDHRB and the east of the MHRB (Figure 2d). ETo was higher in the MYDHRB and MZYHRB, and the south of the MDQHRB, but lower in the MLHRB and MBSHRB (Figure 2e). In contrast to the distribution characteristics of precipitation, solar radiation was lower in the eastern and southern parts and higher in the northern part of the MHRB (Figure 2f). The MHRB’s elevation was higher in the northern and western regions (Figure 2g). The slope was lower in the cropland of the MHRB, and the northern part of the MLHRB (Figure 2h). Forests were more widespread in the central and southern portions of the MLHRB, the MBSHRB, the northern region of the MDQHRB, and the central regions of the MZYHRB and MZWHRB (Figure 2j). The MYDHRB and the northern region of the MLHRB had more grassland. The plains and platforms had a greater concentration of cropland. The majority of the MHRB was composed of small to medium-sized undulating mountains (Figure 2k).
2.3.4. Exploratory Analysis
The trends of LAI and GPP at the regional scale were obtained through linear regression. Linear regression can directly reflect the fluctuation and trend of data in figures. The trends and significance of LAI and GPP variations at pixel scale were calculated using Sen’s slope and Mann–Kendall test [45,46,47]. The links between climate variables and vegetation were investigated by correlation analysis. Before doing the correlation analysis, the data were detrended by removing linear trends [48,49].
3. Results
3.1. Spatial and Temporal Variations of Vegetation in the MHRB
In the MHRB, the mean annual LAI from 2001 to 2018 ranged from 0.14 and 3.15 m2 m−2, and its mean annual GPP ranged from 121.89 and 1306.82 gC m−2 yr−1 (Figure 3). Higher values of LAI and GPP were concentrated in the central and southern portions of the MLHRB, the MBSHRB, the north of MDQHRB, the central regions of the MZYHRB, and the northern and southern regions of the MZWHRB. At a regional level, the MHRB’s mean annual LAI and GPP were 0.88 m2 m−2 and 666.61 gC m−2 yr−1 from 2001 to 2018, respectively (Table 2). Sub-basins could be graded in accordance with the mean annual values of LAI and GPP as follows: MBSHRB > MLHRB > MZWHRB > MDQHRB > MZYHRB > MYDHRB. The MBSHRB had the maximum vegetation coverage, with mean annual LAI and GPP values of 1.17 m2 m−2 and 791.41 gC m−2 yr−1, respectively. Mean annual LAI and GPP values in the MYDHRB were the lowest, which were 0.57 m2 m−2 and 490.7 gC m−2 yr−1, respectively.
Annual LAI values in the MHRB showed a significantly upward trend with the rate of 0.017 m2 m−2 yr−1 (p < 0.01), increased from 0.7 m2 m−2 to 1.02 m2 m−2 (Figure 4a). Annual GPP values in the MHRB increased with a rate of 12.95 gC m−2 yr−2, going from 501.21 gC m−2 yr−1 in 2001 to 782.46 gC m−2 yr−1 in 2018 (p < 0.01) (Figure 4b). From 2001 to 2018, 95.17% of the regions in the MHRB showed increasing trends in LAI, while 81.4% of the regions exhibited significantly growing trends (p < 0.05), and 98.27% of the areas exhibited increasing trends in GPP, while 91.5% of the areas showed significantly upward trends (p < 0.05) (Table 3; Figure 5). The change rates for LAI and GPP varied in different regions, ranging from −0.07 to 0.14 m2 m−2 yr−1 and −51.16 to 47.04 gC m−2 yr−2, respectively (Figure 6). The increase rates of LAI and GPP were higher in the MBSHRB, the central part of the MLHRB, the north of the MDQHRB, the central part of the MZYHRB, and the central and western portions of the MZWHRB. The areas with lower change rates were mainly distributed in the north and south of the MLHRB, the northwest of the MYDHRB, and the east of the MZYHRB and MZWHRB.
3.2. Ranking of the Factors Influencing the Spatial Heterogeneity of Vegetation
The importance of different factors for the spatial heterogeneity of LAI and GPP in the MHRB can be revealed by the q values from the factor detector. All driving forces had extremely significant effects on the spatial heterogeneity of LAI and GPP (p < 0.01). The ranking of driving factors for LAI was as follows: land use type (X10) > landform type (X11) > humidity index (X3) > slope (X8) > solar radiation (X6) > precipitation (X2) > ETo (X5) > VPD (X4) > elevation (X7) > temperature (X1) > aspect (X9) (Figure 7a). For GPP, the ranking of driving factors according to their q values was as follows: land use type (X10) > humidity index (X3) > landform type (X11) > solar radiation (X6) > precipitation (X2) > slope (X8) > ETo (X5) > elevation (X7) > temperature (X1) > VPD (X4) > aspect (X9) (Figure 7b). LAI and GPP were most significantly influenced by land use, with q values of 0.411 and 0.446, respectively. Humidity index was the most significant climate indicator, with q values of 0.227 and 0.331 for LAI and GPP, respectively. The influences of VPD, temperature, elevation, and aspect on the spatial heterogeneity of LAI and GPP were weak, with q values below 0.1. For LAI and GPP, the rankings of driving factors were similar. However, climatic factors besides ETo had higher explanatory powers for GPP.
3.3. Interactions between Driving Forces for Spatial Heterogeneity of Vegetation
The results from the interaction detector indicated that any interaction between two factors in the MHRB displayed non-linear enhancement or bivariate enhancement (Figure 8). The interactive q values between land use (X10) and other factors on LAI were over 0.42 (Figure 8a). With an explanatory power of 0.48 for LAI in the MHRB, the interactive effect between humidity index (X3) and land use (X10) was the most powerful. The interactive q values between land use (X10) and other factors on GPP were over 0.45 (Figure 8b). For GPP in the MHRB, the interactive effect between humidity index (X3) and land use (X10) provided the highest q value of 0.58. The interactive q values between land use and other factors on GPP were over 0.5, with the exception of VPD, ETo, slope, and aspect.
3.4. Vegetation Growth in Different Environments
The fluctuations of LAI and GPP under various environmental conditions can be provided by the risk detector. Only factors with q values greater than 0.1 were further analyzed here. For LAI and GPP, the results of optimal discretization for some factors, such as humidity index and ETo, were different and presented separately. The values of LAI and GPP rose when precipitation increased from 355.04 to 511.4 mm (Figure 9a). When the precipitation ranged from 511.4 to 742.28 mm, the values of LAI and GPP remained stable. LAI values increased continuously as the humidity index rose from 0.35 to 0.53 (Figure 9b), and LAI values remained constant at 0.9 m2 m−2 when the humidity index was between 0.53 and 0.61. LAI continued to rise as the humidity index rose from 0.61 to 0.78, and it peaked at 1.42 m2 m−2 when the humidity index was in the range of 0.71 to 0.78. The values of GPP continued to rise as the humidity index rose from 0.35 to 0.53 (Figure 9c). The GPP remained stable when the humidity index was between 0.53 and 0.58. The GPP increased considerably once more as the humidity index rose from 0.58 to 0.9, and it peaked at 832.36 gC m−2 yr−1 when the humidity index was between 0.67 and 0.9. The dry areas with annual precipitation below 407 mm and a humidity index under 0.41 had the lowest values of LAI and GPP (Figure 9a–c). LAI steadily dropped from 1.3 to 0.72 m2 m−2 when ETo rose from 842.5 to 1099.97 mm (Figure 9d). The GPP values also decreased as ETo increased from 840.87 to 1060.17 mm (Figure 9e). The values of LAI and GPP were stable and higher when the solar radiation was between 145.97 and 167.45 W m−2 (Figure 9f). When the solar radiation value exceeded 167.45 W m−2, the values of LAI and GPP steadily dropped as the solar radiation level rose.
The values of LAI and GPP increased continuously as the slope increased from 0.81° to 36.78° (Figure 9g). Forests had higher LAI and GPP values than other land use types, while barren had the lowest LAI and GPP values (Figure 9h). Regardless of LAI or GPP, the values of croplands and grasslands were very similar. Mountains had greater LAI and GPP values than other landform types (Figure 9i). Among all landform categories, the large undulating mountains had the highest LAI and GPP values, while the platform’s LAI and GPP values were lower.
3.5. Driving Factors for the Significant Increase in Vegetation
Table 4 lists the proportions of various land use changes in places with significantly increased vegetation. Here, land use data with a spatial resolution of 30 m were used. The six main types of land use change included unchanged cropland, unchanged forest, unchanged grassland, other types to cropland, other types to forest, and other types to grassland. These six main types of land use change accounted for 97.21% and 96.79% in the areas with significantly increased LAI and GPP, respectively. The areas with unchanged land use accounted for 86.78% of the locations with significantly increased LAI. The proportions of different land use changes in the areas with significantly increased LAI can be sorted as follows: unchanged forest (34.27%), unchanged grassland (27.51%), unchanged cropland (23.07%), other types to forest (5.15%), other types to grassland (4.13%), and other types to cropland (3.08%). The areas with unchanged land use made up 86.89% of the areas with significantly increased GPP. In the regions with significantly increased GPP, the proportions of various land use changes can be ranked as follows: unchanged forest (33.85%), unchanged grassland (27.1%), unchanged cropland (23.8%), other types to forest (4.93%), other types to grassland (4.10%), and other types to cropland (3.01%).
Table 5 illustrates the correlation coefficients between vegetation and different climatic indicators in the MHRB from 2001 to 2018. In contrast to other climate factors, vegetation had positive correlations with precipitation and humidity index in all sub-basins. There was a substantial association between precipitation and vegetation. The correlation coefficients between precipitation and LAI were significant in the MLHRB, the MBSHRB, and the MYDHRB (p < 0.05). The correlation coefficients of GPP with precipitation and humidity index were above 0.42 in all sub-basins and were significant in the sub-basins except for the MLHRB and the MZWHRB. The adverse impact of VPD on vegetation was the most obvious. LAI and GPP had negative correlations with VPD in all sub-basins. In all the sub-basins except for the MDQHRB and the MZYHRB, the climate factors with the lowest correlation coefficients with vegetation were VPD. The sensitivity of GPP to climate change was stronger than that of LAI. In all the sub-basins except for the MLHRB, the positive effects of precipitation and humidity index on GPP were stronger than those on LAI. In all sub-basins, VPD had stronger negative effects on GPP than those on LAI. From 2001 to 2018, precipitation increased in all sub-basins, and the humidity index increased in the sub-basins except for the MLHRB (Table 6). VPD decreased in the sub-basins except for the MZWHRB. The increased precipitation and humidity index and the reduced VPD promoted the increase in vegetation in the MHRB from 2001 to 2018.
4. Discussion
4.1. Driving Factors for the Spatial Heterogeneity of Vegetation in the MHRB
The driving forces for the spatial heterogeneity of vegetation vary significantly across different regions [17,23]. The explanatory power of land use was the greatest for the spatial heterogeneity of the vegetation in the MHRB. In the MHRB, forests had much higher LAI and GPP values than other land use types (Figure 9h). The values of LAI and GPP were lower in water, barren, and impervious surfaces. The mean annual LAI value of forest was about twice that of grassland and cropland. Therefore, the expansion of forests is beneficial to increase vegetation cover in the MHRB. The most important climate indicator in explaining the spatial differences of vegetation distribution in the MHRB was the humidity index. In most areas of north China, moisture is thought to be a major factor influencing the changes in vegetation [50,51]. The lowest LAI and GPP values were found in dry areas with annual precipitation below 407 mm and a humidity index under 0.41 (Figure 9a–c). Limited by water availability, vegetation in these drier areas has lower coverage and is susceptible to the adverse effects of drought [52,53]. In these arid regions, ecological engineering implementation should prioritize projecting or enhancing vegetation with lower biomass and coverage. The distribution of forests corresponded to the areas with higher values of precipitation and humidity index (Figure 2), and forest growth often requires more water consumption. For afforestation, areas with precipitation above 407 mm and a humidity index above 0.41 can be given priority.
In the MHRB, the correlation coefficients between humidity index and ETo were significantly negative in all sub-basins (Table 7). As ETo increased from 842.5 mm to 1099.97 mm, LAI constantly declined (Figure 9d), mostly because the humidity index would fall as ETo increased. With an increase in ETo, the climate tends to become drier [54], thus adversely affecting vegetation growth in water-scarce areas. The decline of ETo is also thought to be beneficial for vegetation growth in semi-arid grassland [55]. When the solar radiation was more than 167.45 W m−2, values of LAI and GPP continued to decrease with the increase in solar radiation (Figure 9f), which was mainly due to the drier climate in these areas and the fact that higher solar radiation frequently correlated with less precipitation.
Additionally, significant determinants of vegetation heterogeneity in the MHRB were landform type and slope. Higher LAI and GPP values were seen in the mountainous areas with higher slopes due to the widespread distribution of forests and a larger amount of precipitation. The essential locations for the execution of the Grain for Green project are likewise those with higher slopes [56].
According to a new study, the driving forces of vegetation productivity in China have changed from being dominated by a single factor to being influenced by the interactive effects of multiple factors [21]. In some regions, the interactive effects of driving forces behind vegetation variations were seen, but the dominant factors and the types of interactions varied between regions [17,23]. In the MHRB, the strongest impact for the spatial differences of vegetation distribution was provided by the interactive effect between land use and humidity index. Studies of vegetation in other regions can also take the humidity index into account for its high impact.
4.2. The Significant Increase in Vegetation and Its Driving Forces
Annual LAI and GPP in the MHRB increased significantly from 2001 to 2018. Other studies similarly showed rising trends of vegetation in the MHRB after the year 2000 [25,26,27]. In the MHRB, around 5% of the areas with significantly increased vegetation between 2001 and 2018 underwent the transformation of other land use types to forest. One of the primary strategies for implementing ecological engineering in the MHRB is afforestation. In comparison to other land use types, forests had much greater LAI and GPP, and their expansion encouraged a rise in vegetation cover in the MHRB. Afforestation is regarded as one of the main causes of the greening trend of vegetation in China [56,57]. Additionally, we discovered that about 87% of the MHRB’s region with considerably enhanced vegetation had not undergone a change in land use.
For areas with unchanged land use, the significant increase in vegetation may be promoted by both climate change and anthropogenic measures. Vegetation’s spatial heterogeneity and temporal variation both exhibited stronger relationships with moisture-related factors. The humidity index was the most significant climate indicator for the spatial heterogeneity of vegetation (Figure 7). Humidity index and precipitation were more strongly correlated with vegetation in the MHRB from 2000 to 2018 when compared with other climatic factors (Table 5). During this period, the precipitation and humidity index increased in the MHRB (Table 6), which aided in the growth of the vegetation. Other large-scale studies have also revealed that the sensitivity of vegetation changes to moisture is growing [9,10]. The driving forces of vegetation temporal variation and spatial heterogeneity were not entirely equal. VPD had a limited ability to explain spatial heterogeneity, while the strongest negative correlation between VPD and vegetation change in the MHRB suggested that a reduction in VPD would promote the increase in vegetation. The detrimental effect of VPD on vegetation growth has been confirmed on a global scale [12]. Despite a large rise in VPD globally after the late 1990s was revealed [13], a decreasing trend of VPD was found in the MHRB from 2001 to 2018. The increased precipitation and humidity index and the reduced VPD facilitated vegetation growth in the MHRB from 2000 to 2018. According to studies conducted in the MHRB and its neighboring regions, the wetter climate that began to prevail after 2000 encouraged the increase in vegetation [25,51]. In the MHRB, temperature and vegetation change were negatively and insignificantly correlated (Table 5). A previous study also found that vegetation change in most areas of the HRB was negatively correlated with temperature [25]. The increase in temperature can increase ETo [58], which tends to make the climate drier. Increasing temperature is prone to increase VPD, which would negatively affect vegetation growth [59]. The correlation between temporal changes in vegetation and solar radiation was weak (Table 5). A study in northern China also showed that the impact of solar radiation on vegetation was weaker during the period 1990–2015, while the impact of precipitation increased [60].
The spatiotemporal changes and corresponding dominant influencing factors of LAI and GPP were similar. However, we also found that GPP was more sensitive than LAI to climate change both in terms of spatial heterogeneity and temporal variation. Previous studies also revealed that GPP was more sensitive to drought than LAI in China [61,62]. The changes in GPP reflect the changes in photosynthesis, which can be influenced by vegetation greenness, light use efficiency, and canopy conductance [2,62]. Climate change can affect the influencing factors of GPP, and greenness is only one of the influencing factors for GPP; therefore, GPP is more sensitive to climate change than LAI [61,62].
There are other anthropogenic activities besides afforestation that might favor the growth of plants. For cropland, the improvement of agricultural technology, fertilization, and irrigation can increase the productivity of vegetation [56]. The MHRB is a crucial location for the application of ecological engineering since it serves as North China’s ecological barrier. In order to protect pastures and improve grassland vegetation, grazing exclusion practices are crucial components of ecological projects [63,64]. Forest conservation policies may also encourage an increase in the amount of forest vegetation [65].
4.3. Limitations and Future Directions
Due to the challenges in precisely quantifying some human activities, such as fertilization, irrigation, and grazing exclusion practices, not all the related factors were taken into account in this study. Future research should consider more influence factors. More studies are still needed to obtain reliable soil moisture data in the MHRB and to further analyze the influence of soil moisture on vegetation. In order to further explain the driving mechanism of each factor on vegetation growth, field observations, and other technologies need to be combined in the future. In addition, the MHRB serves as an important water supply in North China, the increase in vegetation may make water shortages worse in this water-deficient area [66], and deep studies are still needed to investigate how the water resources and vegetation interact in the MHRB.
5. Conclusions
We examined the driving factors for the spatial heterogeneity and change trends of vegetation in the MHRB. The following are the primary conclusions. (1) Annual LAI and GPP increased significantly from 2001 to 2018 at the regional scale (p < 0.05). The areas with significantly increased (p < 0.05) LAI and GPP accounted for 81.4% and 91.5% of the MHRB, respectively. (2) Land use was the most influential element for the spatial heterogeneity of LAI and GPP, and the humidity index was the most crucial among climate indicators. (3) Non-linear enhancement or bivariate enhancement was discovered between any two factors, and the strongest interaction was from land use and humidity index. (4) The dry areas with annual precipitation below 407 mm and a humidity index under 0.41 had the lowest values of LAI and GPP. With an increase in slope, LAI and GPP values rose. LUM and forests both had higher LAI and GPP values. (5) The areas with unaltered land use accounted for about 87% of the areas with significantly increased vegetation. The increased precipitation and humidity index and the reduced VPD facilitated vegetation growth in the MHRB from 2001 to 2018. (6) The sensitivity of GPP to climate change was stronger than that of LAI. Even though more factors need to be taken into account, our study provides a comprehensive overview of the vegetation distribution, variations, and their driving forces in the MHRB. The methodology and results are distinctly important for ecological conservation and eco-hydrological research in the MHRB or other vegetated areas.
Author Contributions
Conceptualization, B.C. and Y.-J.S.; Data Curation, B.C.; Formal Analysis, B.C.; Funding Acquisition, Y.-J.S.; Methodology, B.C. and Y.W.; Supervision, X.Z. and Y.-J.S.; Validation, B.C. and Y.-J.S.; Visualization, B.C. and X.Z.; Writing—Original Draft, B.C.; Writing—Review and Editing, B.C., Y.W. and Y.-J.S. All authors have read and agreed to the published version of the manuscript.
Funding
This research was funded by the National Key Research and Development Program of China (2021YFD1700500), the Natural Science Foundation of Hebei Province (D2021503001), and the Hebei Provincial Key R&D Programme (22377001D).
Data Availability Statement
The data presented in this study are available on request from the corresponding author. The data are not publicly available due to permissions issues.
Conflicts of Interest
The authors declare no conflicts of interest.
References
- Piao, S.; Wang, X.; Park, T.; Chen, C.; Lian, X.; He, Y.; Bjerke, J.W.; Chen, A.; Ciais, P.; Tømmervik, H. Characteristics, drivers and feedbacks of global greening. Nat. Rev. Earth Environ. 2020, 1, 14–27. [Google Scholar] [CrossRef]
- Bai, Y.; Liu, M.; Guo, Q.; Wu, G.; Wang, W.; Li, S. Diverse responses of gross primary production and leaf area index to drought on the Mongolian Plateau. Sci. Total Environ. 2023, 902, 166507. [Google Scholar] [CrossRef]
- Li, Y.; Chen, Y.; Sun, F.; Li, Z. Recent vegetation browning and its drivers on Tianshan Mountain, Central Asia. Ecol. Indic. 2021, 129, 107912. [Google Scholar] [CrossRef]
- Pan, N.; Feng, X.; Fu, B.; Wang, S.; Ji, F.; Pan, S. Increasing global vegetation browning hidden in overall vegetation greening: Insights from time-varying trends. Remote Sens. Environ. 2018, 214, 59–72. [Google Scholar] [CrossRef]
- Higgins, S.I.; Conradi, T.; Muhoko, E. Shifts in vegetation activity of terrestrial ecosystems attributable to climate trends. Nat. Geosci. 2023, 16, 147–153. [Google Scholar] [CrossRef]
- Myneni, R.B.; Keeling, C.; Tucker, C.J.; Asrar, G.; Nemani, R.R. Increased plant growth in the northern high latitudes from 1981 to 1991. Nature 1997, 386, 698–702. [Google Scholar] [CrossRef]
- Piao, S.; Nan, H.; Huntingford, C.; Ciais, P.; Friedlingstein, P.; Sitch, S.; Peng, S.; Ahlström, A.; Canadell, J.G.; Cong, N. Evidence for a weakening relationship between interannual temperature variability and northern vegetation activity. Nat. Commun. 2014, 5, 5018. [Google Scholar] [CrossRef] [PubMed]
- Zhang, Y.; Parazoo, N.C.; Williams, A.P.; Zhou, S.; Gentine, P. Large and projected strengthening moisture limitation on end-of-season photosynthesis. Proc. Natl. Acad. Sci. USA 2020, 117, 9216–9222. [Google Scholar] [CrossRef] [PubMed]
- Zhang, Y.; Gentine, P.; Luo, X.; Lian, X.; Liu, Y.; Zhou, S.; Michalak, A.M.; Sun, W.; Fisher, J.B.; Piao, S. Increasing sensitivity of dryland vegetation greenness to precipitation due to rising atmospheric CO2. Nat. Commun. 2022, 13, 4875. [Google Scholar] [CrossRef] [PubMed]
- Jiao, W.; Wang, L.; Smith, W.K.; Chang, Q.; Wang, H.; D’Odorico, P. Observed increasing water constraint on vegetation growth over the last three decades. Nat. Commun. 2021, 12, 3777. [Google Scholar] [CrossRef] [PubMed]
- López, J.; Way, D.A.; Sadok, W. Systemic effects of rising atmospheric vapor pressure deficit on plant physiology and productivity. Glob. Chang. Biol. 2021, 27, 1704–1720. [Google Scholar] [CrossRef]
- He, B.; Chen, C.; Lin, S.; Yuan, W.; Chen, H.W.; Chen, D.; Zhang, Y.; Guo, L.; Zhao, X.; Liu, X. Worldwide impacts of atmospheric vapor pressure deficit on the interannual variability of terrestrial carbon sinks. Natl. Sci. Rev. 2022, 9, nwab150. [Google Scholar] [CrossRef]
- Yuan, W.; Zheng, Y.; Piao, S.; Ciais, P.; Lombardozzi, D.; Wang, Y.; Ryu, Y.; Chen, G.; Dong, W.; Hu, Z.; et al. Increased atmospheric vapor pressure deficit reduces global vegetation growth. Sci. Adv. 2019, 5, eaax1396. [Google Scholar] [CrossRef]
- Denissen, J.M.; Teuling, A.J.; Pitman, A.J.; Koirala, S.; Migliavacca, M.; Li, W.; Reichstein, M.; Winkler, A.J.; Zhan, C.; Orth, R. Widespread shift from ecosystem energy to water limitation with climate change. Nat. Clim. Chang. 2022, 12, 677–684. [Google Scholar] [CrossRef]
- Chen, C.; Park, T.; Wang, X.; Piao, S.; Xu, B.; Chaturvedi, R.K.; Fuchs, R.; Brovkin, V.; Ciais, P.; Fensholt, R. China and India lead in greening of the world through land-use management. Nat. Sustain. 2019, 2, 122–129. [Google Scholar] [CrossRef]
- Wang, Z.; Liu, X.; Wang, H.; Zheng, K.; Li, H.; Wang, G.; An, Z. Monitoring vegetation greenness in response to climate variation along the elevation gradient in the three-river source region of China. ISPRS Int. J. Geo-Inf. 2021, 10, 193. [Google Scholar] [CrossRef]
- Liu, C.; Li, W.; Wang, W.; Zhou, H.; Liang, T.; Hou, F.; Xu, J.; Xue, P. Quantitative spatial analysis of vegetation dynamics and potential driving factors in a typical alpine region on the northeastern Tibetan Plateau using the Google Earth Engine. Catena 2021, 206, 105500. [Google Scholar] [CrossRef]
- Bunting, E.L.; Munson, S.M.; Bradford, J.B. Assessing plant production responses to climate across water-limited regions using Google Earth Engine. Remote Sens. Environ. 2019, 233, 111379. [Google Scholar] [CrossRef]
- Liu, Y.; Xu, M.; Guo, B.; Yang, G.; Li, J.; Yu, Y. Changes in the Vegetation NPP of Mainland China under the Combined Actions of Climatic-Socioeconomic Factors. Forests 2023, 14, 2341. [Google Scholar] [CrossRef]
- Zhang, S.; Zhou, Y.; Yu, Y.; Li, F.; Zhang, R.; Li, W. Using the Geodetector Method to Characterize the Spatiotemporal Dynamics of Vegetation and Its Interaction with Environmental Factors in the Qinba Mountains, China. Remote Sens. 2022, 14, 5794. [Google Scholar] [CrossRef]
- Lian, X.; Jiao, L.; Liu, Z. Saturation response of enhanced vegetation productivity attributes to intricate interactions. Glob. Chang. Biol. 2023, 29, 1080–1095. [Google Scholar] [CrossRef]
- Chen, T.; Xia, J.; Zou, L.; Hong, S. Quantifying the influences of natural factors and human activities on NDVI changes in the Hanjiang River Basin, China. Remote Sens. 2020, 12, 3780. [Google Scholar] [CrossRef]
- Nie, T.; Dong, G.; Jiang, X.; Lei, Y. Spatio-temporal changes and driving forces of vegetation coverage on the loess plateau of Northern Shaanxi. Remote Sens. 2021, 13, 613. [Google Scholar] [CrossRef]
- Peng, W.; Kuang, T.; Tao, S. Quantifying influences of natural factors on vegetation NDVI changes based on geographical detector in Sichuan, western China. J. Clean. Prod. 2019, 233, 353–367. [Google Scholar] [CrossRef]
- Sun, Y.-L.; Shan, M.; Pei, X.-R.; Zhang, X.-K.; Yang, Y.-L. Assessment of the impacts of climate change and human activities on vegetation cover change in the Haihe River basin, China. Phys. Chem. Earth Parts A/B/C 2020, 115, 102834. [Google Scholar] [CrossRef]
- Yang, W.; Zhao, Y.; Wang, Q.; Guan, B. Climate, CO2, and anthropogenic drivers of accelerated vegetation greening in the Haihe River Basin. Remote Sens. 2022, 14, 268. [Google Scholar] [CrossRef]
- Wang, D.; Qin, W.; Xu, H.; Shan, Z.; Yu, X. Assessing the response of water use efficiency to climate variability and land-use changes in the mountainous area of North China. For. Ecol. Manag. 2023, 530, 120780. [Google Scholar] [CrossRef]
- Yang, Y.; Tian, F. Abrupt change of runoff and its major driving factors in Haihe River Catchment, China. J. Hydrol. 2009, 374, 373–383. [Google Scholar] [CrossRef]
- Wang, W.; Shao, Q.; Yang, T.; Peng, S.; Xing, W.; Sun, F.; Luo, Y. Quantitative assessment of the impact of climate variability and human activities on runoff changes: A case study in four catchments of the Haihe River basin, China. Hydrol. Process. 2013, 27, 1158–1174. [Google Scholar] [CrossRef]
- Wang, Q.; Jiang, S.; Zhai, J.; He, G.; Zhao, Y.; Zhu, Y.; He, X.; Li, H.; Wang, L.; He, F.; et al. Effects of vegetation restoration on evapotranspiration water consumption in mountainous areas and assessment of its remaining restoration space. J. Hydrol. 2022, 605, 127259. [Google Scholar] [CrossRef]
- Lei, H.; Yang, D.; Huang, M. Impacts of climate change and vegetation dynamics on runoff in the mountainous region of the Haihe River basin in the past five decades. J. Hydrol. 2014, 511, 786–799. [Google Scholar] [CrossRef]
- Yang, K.; He, J.; Tang, W.; Lu, H.; Qin, J.; Chen, Y.; Li, X. China Meteorological Forcing Dataset (1979–2018); National Tibetan Plateau, Third Pole Environment Data Center [Data Set]: Beijing, China, 2019. [Google Scholar] [CrossRef]
- He, J.; Yang, K.; Tang, W.; Lu, H.; Qin, J.; Chen, Y.; Li, X. The first high-resolution meteorological forcing dataset for land process studies over China. Sci. Data 2020, 7, 25. [Google Scholar] [CrossRef] [PubMed]
- Yang, K.; He, J.; Tang, W.; Qin, J.; Cheng, C.C. On downward shortwave and longwave radiations over high altitude regions: Observation and modeling in the Tibetan Plateau. Agric. For. Meteorol. 2010, 150, 38–46. [Google Scholar] [CrossRef]
- Zhang, X.; Han, S.; Wang, Y.; Kong, X.; Guo, Y.; Shen, Y.; Zhang, Y.; Shen, Y.-J. Trade-offs between spatial and temporal accuracy of complementary relationship models for evaporation in an ungauged basin. Water Resour. Res. 2023, 59, e2022WR034222. [Google Scholar] [CrossRef]
- Yang, L.; Feng, Q.; Wen, X.; Barzegar, R.; Adamowski, J.F.; Zhu, M.; Yin, Z. Contributions of climate, elevated atmospheric CO2 concentration and land surface changes to variation in water use efficiency in Northwest China. Catena 2022, 213, 106220. [Google Scholar] [CrossRef]
- Yang, J.; Huang, X. The 30 m annual land cover dataset and its dynamics in China from 1990 to 2019. Earth Syst. Sci. Data 2021, 13, 3907–3925. [Google Scholar] [CrossRef]
- Allen, R.G.; Pereira, L.S.; Raes, D.; Smith, M. Crop Evapotranspiration-Guidelines for Computing Crop Water Requirements; FAO Irrigation and Drainage Paper 56; FAO: Rome, Italy, 1998; Volume 300, pp. 15–28. [Google Scholar]
- Ding, J.; Yang, T.; Zhao, Y.; Liu, D.; Wang, X.; Yao, Y.; Peng, S.; Wang, T.; Piao, S. Increasingly important role of atmospheric aridity on Tibetan alpine grasslands. Geophys. Res. Lett. 2018, 45, 2852–2859. [Google Scholar] [CrossRef]
- Hulme, M.; Marsh, R.; Jones, P. Global changes in a humidity index between 1931–1960 and 1961–1990. Clim. Res. 1992, 2, 1–22. Available online: https://www.jstor.org/stable/24863281 (accessed on 9 September 2023). [CrossRef]
- Wang, J.F.; Li, X.H.; Christakos, G.; Liao, Y.L.; Zhang, T.; Gu, X.; Zheng, X.Y. Geographical detectors-based health risk assessment and its application in the neural tube defects study of the Heshun Region, China. Int. J. Geogr. Inf. Sci. 2010, 24, 107–127. [Google Scholar] [CrossRef]
- Wang, J.-F.; Zhang, T.-L.; Fu, B.-J. A measure of spatial stratified heterogeneity. Ecol. Indic. 2016, 67, 250–256. [Google Scholar] [CrossRef]
- Song, Y.; Wang, J.; Ge, Y.; Xu, C. An optimal parameters-based geographical detector model enhances geographic characteristics of explanatory variables for spatial heterogeneity analysis: Cases with different types of spatial data. GISci. Remote Sens. 2020, 57, 593–610. [Google Scholar] [CrossRef]
- Cao, F.; Ge, Y.; Wang, J.-F. Optimal discretization for geographical detectors-based risk assessment. GISci. Remote Sens. 2013, 50, 78–92. [Google Scholar] [CrossRef]
- Mann, H.B. Nonparametric tests against trend. Econometrica 1945, 13, 245–259. [Google Scholar] [CrossRef]
- Kendall, M.G. Rank Correlation Methods; Charles Griffin: London, UK, 1975. [Google Scholar]
- Sen, P.K. Estimates of the regression coefficient based on Kendall’s tau. J. Am. Stat. Assoc. 1968, 63, 1379–1389. [Google Scholar] [CrossRef]
- Wang, G.; You, L. Delayed impact of the North Atlantic Oscillation on biosphere productivity in Asia. Geophys. Res. Lett. 2004, 31, L12210. [Google Scholar] [CrossRef]
- Liu, Y.; Xiao, J.; Ju, W.; Xu, K.; Zhou, Y.; Zhao, Y. Recent trends in vegetation greenness in China significantly altered annual evapotranspiration and water yield. Environ. Res. Lett. 2016, 11, 094010. [Google Scholar] [CrossRef]
- Ge, W.; Deng, L.; Wang, F.; Han, J. Quantifying the contributions of human activities and climate change to vegetation net primary productivity dynamics in China from 2001 to 2016. Sci. Total Environ. 2021, 773, 145648. [Google Scholar] [CrossRef] [PubMed]
- Cao, B.; Kong, X.; Wang, Y.; Liu, H.; Pei, H.; Shen, Y.-J. Response of vegetation cover change to drought at different time-scales in the Beijing-Tianjin Sandstorm Source Region, China. Chin. Geogr. Sci. 2021, 31, 491–505. [Google Scholar] [CrossRef]
- Xu, H.-j.; Wang, X.-p.; Zhao, C.-y.; Yang, X.-m. Diverse responses of vegetation growth to meteorological drought across climate zones and land biomes in northern China from 1981 to 2014. Agric. For. Meteorol. 2018, 262, 1–13. [Google Scholar] [CrossRef]
- Bai, X.; Fan, Z.; Yue, T. Dynamic pattern-effect relationships between precipitation and vegetation in the semi-arid and semi-humid area of China. Catena 2023, 232, 107425. [Google Scholar] [CrossRef]
- Wang, Y.; Wang, S.; Zhao, W.; Liu, Y. The increasing contribution of potential evapotranspiration to severe droughts in the Yellow River basin. J. Hydrol. 2022, 605, 127310. [Google Scholar] [CrossRef]
- Han, D.; Wang, G.; Xue, B.; Liu, T.; Yinglan, A.; Xu, X. Evaluation of semiarid grassland degradation in North China from multiple perspectives. Ecol. Eng. 2018, 112, 41–50. [Google Scholar] [CrossRef]
- Feng, D.; Fu, M.; Sun, Y.; Bao, W.; Zhang, M.; Zhang, Y.; Wu, J. How large-scale anthropogenic activities influence vegetation cover change in China? A review. Forests 2021, 12, 320. [Google Scholar] [CrossRef]
- Pei, H.; Liu, M.; Jia, Y.; Zhang, H.; Li, Y.; Xiao, Y. The trend of vegetation greening and its drivers in the Agro-pastoral ecotone of northern China, 2000–2020. Ecol. Indic. 2021, 129, 108004. [Google Scholar] [CrossRef]
- Han, J.; Wang, J.; Zhao, Y.; Wang, Q.; Zhang, B.; Li, H.; Zhai, J. Spatio-temporal variation of potential evapotranspiration and climatic drivers in the Jing-Jin-Ji region, North China. Agric. For. Meteorol. 2018, 256, 75–83. [Google Scholar] [CrossRef]
- Grossiord, C.; Buckley, T.N.; Cernusak, L.A.; Novick, K.A.; Poulter, B.; Siegwolf, R.T.; Sperry, J.S.; McDowell, N.G. Plant responses to rising vapor pressure deficit. New Phytol. 2020, 226, 1550–1566. [Google Scholar] [CrossRef]
- Sun, R.; Chen, S.; Su, H. Climate dynamics of the spatiotemporal changes of vegetation NDVI in northern China from 1982 to 2015. Remote Sens. 2021, 13, 187. [Google Scholar] [CrossRef]
- Zhang, M.; Yuan, X.; Otkin, J.A. Remote sensing of the impact of flash drought events on terrestrial carbon dynamics over China. Carbon Balanc. Manag. 2020, 15, 1–11. [Google Scholar] [CrossRef] [PubMed]
- Deng, Y.; Wang, X.; Wang, K.; Ciais, P.; Tang, S.; Jin, L.; Li, L.; Piao, S. Responses of vegetation greenness and carbon cycle to extreme droughts in China. Agric. For. Meteorol. 2021, 298, 108307. [Google Scholar] [CrossRef]
- Wang, X.; Ge, Q.; Geng, X.; Wang, Z.; Gao, L.; Bryan, B.A.; Chen, S.; Su, Y.; Cai, D.; Ye, J.; et al. Unintended consequences of combating desertification in China. Nat. Commun. 2023, 14, 1139. [Google Scholar] [CrossRef] [PubMed]
- Wang, X.; Zhang, X.; Li, W.; Cheng, X.; Zhou, Z.; Liu, Y.; Wu, X.; Hao, J.; Ling, Q.; Deng, L.; et al. Quantitative Analysis of Climate Variability and Human Activities on Vegetation Variations in the Qilian Mountain National Nature Reserve from 1986 to 2021. Forests 2023, 14, 2042. [Google Scholar] [CrossRef]
- Viña, A.; McConnell, W.J.; Yang, H.; Xu, Z.; Liu, J. Effects of conservation policy on China’s forest recovery. Sci. Adv. 2016, 2, e1500965. [Google Scholar] [CrossRef] [PubMed]
- Bai, P.; Liu, X.; Zhang, Y.; Liu, C. Assessing the impacts of vegetation greenness change on evapotranspiration and water yield in China. Water Resour. Res. 2020, 56, e2019WR027019. [Google Scholar] [CrossRef]
Figure 1.
Overview of the location, elevation, and sub-basins of the MHRB.

Figure 2.
The spatial distribution of underlying driving factors in the MHRB. Temperature (a), precipitation (b), humidity index (c), VPD (d), ETo (e), solar radiation (f), elevation (g), slope (h), aspect (i), land use (j), landform (k).
Figure 2.
The spatial distribution of underlying driving factors in the MHRB. Temperature (a), precipitation (b), humidity index (c), VPD (d), ETo (e), solar radiation (f), elevation (g), slope (h), aspect (i), land use (j), landform (k).

Figure 3.
Spatial distribution of mean annual LAI (a) and GPP (b) in the MHRB from 2001 to 2018.

Figure 4.
Change trends for LAI (a) and GPP (b) in the MHRB from 2001 to 2018.

Figure 5.
Spatial distribution of vegetation change trends for LAI (a) and GPP (b) in the MHRB from 2001 to 2018.
Figure 5.
Spatial distribution of vegetation change trends for LAI (a) and GPP (b) in the MHRB from 2001 to 2018.

Figure 6.
Spatial distribution of vegetation change rates for LAI (a) and GPP (b) in the MHRB from 2001 to 2018.
Figure 6.
Spatial distribution of vegetation change rates for LAI (a) and GPP (b) in the MHRB from 2001 to 2018.

Figure 7.
The q values of factors with significant (p < 0.01) impacts on the spatial heterogeneity of LAI (a) and GPP (b).
Figure 7.
The q values of factors with significant (p < 0.01) impacts on the spatial heterogeneity of LAI (a) and GPP (b).

Figure 8.
Interaction between pairs of influence factors for LAI (a) and GPP (b). “#” indicates non-linear enhancement, and “*” indicates bivariate enhancement.
Figure 8.
Interaction between pairs of influence factors for LAI (a) and GPP (b). “#” indicates non-linear enhancement, and “*” indicates bivariate enhancement.

Figure 9.
Changes in the LAI and GPP values under different factor grades. Precipitation (a), humidity index for LAI (b), humidity index for GPP (c), ETo for LAI (d), ETo for GPP (e), solar radiation (f), slope (g), land use type (h), landform type (i). For landform type, “SUM”, “MUM”, and “LUM” indicate small, medium, and large undulating mountains, respectively.


Table 1.
Potential driving factors for the changes of LAI and GPP in the MHRB.
| Type | Code | Factors | Unit |
|---|---|---|---|
| Climate | X1 | Temperature | °C |
| X2 | Precipitation | mm | |
| X3 | Humidity index | / | |
| X4 | Vapor pressure deficit (VPD) | kPa | |
| X5 | Reference evapotranspiration (ETo) | mm | |
| X6 | Solar radiation | W m−2 | |
| Topography | X7 | Elevation | m |
| X8 | Slope | ° | |
| X9 | Aspect | / | |
| Land use | X10 | Land use type | / |
| Geomorphology | X11 | Landform type | / |
Table 2.
Mean annual LAI and GPP values in the MHRB from 2001 to 2018.
| Region | LAI (m2 m−2) | GPP (gC m−2 yr−1) |
|---|---|---|
| MHRB | 0.88 | 666.61 |
| MLHRB | 1.06 | 740.64 |
| MBSHRB | 1.17 | 791.41 |
| MYDHRB | 0.57 | 490.7 |
| MDQHRB | 0.89 | 707.48 |
| MZYHRB | 0.8 | 654.27 |
| MZWHRB | 0.91 | 720.77 |
Table 3.
Proportion of areas with different vegetation change trends in the MHRB from 2001 to 2018 (%).
Table 3.
Proportion of areas with different vegetation change trends in the MHRB from 2001 to 2018 (%).
| Change Trends | LAI | GPP |
|---|---|---|
| Insignificant decrease | 3.59 | 1.35 |
| Significant decrease (p < 0.05) | 1.24 | 0.39 |
| Decrease | 4.83 | 1.73 |
| Insignificant increase | 13.77 | 6.76 |
| Significant increase (p < 0.05) | 81.4 | 91.5 |
| Increase | 95.17 | 98.27 |
Table 4.
Proportions of various land use changes between 2001 and 2018 in places with significantly increased vegetation (%).
Table 4.
Proportions of various land use changes between 2001 and 2018 in places with significantly increased vegetation (%).
| Land Use Change | LAI | GPP |
|---|---|---|
| Unchanged cropland | 23.07 | 23.80 |
| Unchanged forest | 34.27 | 33.85 |
| Unchanged grassland | 27.51 | 27.10 |
| Other types to cropland | 3.08 | 3.01 |
| Other types to forest | 5.15 | 4.93 |
| Other types to grassland | 4.13 | 4.10 |
| Six main types | 97.21 | 96.79 |
| Unchanged land use | 86.78 | 86.89 |
Table 5.
The correlation coefficients between vegetation and climatic indicators in the MHRB from 2001 to 2018.
Table 5.
The correlation coefficients between vegetation and climatic indicators in the MHRB from 2001 to 2018.
| Vegetation Indexes | Climatic Indicators | MLHRB | MBSHRB | MYDHRB | MDQHRB | MZYHRB | MZWHRB |
|---|---|---|---|---|---|---|---|
| LAI | Temperature | −0.17 | −0.08 | −0.2 | −0.43 | −0.27 | −0.05 |
| Precipitation | 0.52 * | 0.58 * | 0.51 * | 0.29 | 0.19 | 0.08 | |
| Humidity index | 0.43 | 0.49 * | 0.48 * | 0.23 | 0.24 | 0.11 | |
| VPD | −0.44 | −0.25 | −0.47 * | −0.16 | −0.08 | −0.22 | |
| ETo | −0.01 | −0.01 | −0.31 | 0.01 | −0.27 | −0.17 | |
| Solar radiation | 0.19 | 0.3 | −0.05 | 0.18 | −0.04 | −0.03 | |
| GPP | Temperature | −0.31 | −0.35 | −0.32 | −0.33 | −0.32 | −0.28 |
| Precipitation | 0.44 | 0.59 * | 0.57 * | 0.52 * | 0.48 * | 0.46 | |
| Humidity index | 0.43 | 0.58 * | 0.55 * | 0.48 * | 0.51 * | 0.45 | |
| VPD | −0.49 * | −0.4 | −0.54 * | −0.23 | −0.26 | −0.48 * | |
| ETo | −0.25 | −0.24 | −0.37 | −0.15 | −0.34 | −0.22 | |
| Solar radiation | 0.09 | 0.25 | −0.07 | 0.02 | −0.13 | −0.01 |
Note: “*” denotes that the correlation coefficient is significant (p < 0.05).
Table 6.
Climate change (Sen’s slope) in the MHRB from 2001 to 2018.
| Climatic Indicators | MLHRB | MBSHRB | MYDHRB | MDQHRB | MZYHRB | MZWHRB |
|---|---|---|---|---|---|---|
| Temperature (°C yr−1) | 0.3 | 0.15 | 0 | 0.23 | 0 | 2.42 * |
| Precipitation (mm yr−1) | 0.83 | 1.52 | 2.05 * | 1.67 | 2.42 * | 0.61 |
| Humidity index (yr−1) | −0.08 | 0.91 | 1.36 | 1.52 | 1.44 | 0.68 |
| VPD (kPa yr−1) | −0.15 | −0.91 | −1.06 | −1.74 | −1.52 | 1.36 |
| ETo (mm yr−1) | 2.58 * | 1.67 | 0.38 | −2.5 * | 1.21 | 0.45 |
| Solar radiation (W m−2 yr−1) | −0.38 | 0.23 | 0 | −2.35 * | −1.29 | −1.89 |
Note: “*” indicates that the sen’s slope is significant (p < 0.05).
Table 7.
The correlation coefficient between humidity index and ETo in the MHRB from 2001 to 2018.
| MLHRB | MBSHRB | MYDHRB | MDQHRB | MZYHRB | MZWHRB |
|---|---|---|---|---|---|
| −0.65 * | −0.65 * | −0.8 * | −0.61 * | −0.59 * | −0.65 * |
Note: “*” denotes that the correlation coefficient is significant (p < 0.05).
Disclaimer/Publisher’s Note: The statements, opinions and data contained in all publications are solely those of the individual author(s) and contributor(s) and not of MDPI and/or the editor(s). MDPI and/or the editor(s) disclaim responsibility for any injury to people or property resulting from any ideas, methods, instructions or products referred to in the content. |
© 2024 by the authors. Licensee MDPI, Basel, Switzerland. This article is an open access article distributed under the terms and conditions of the Creative Commons Attribution (CC BY) license (https://creativecommons.org/licenses/by/4.0/).
Share and Cite
MDPI and ACS Style
Cao, B.; Wang, Y.; Zhang, X.; Shen, Y.-J. Spatial Heterogeneity and the Increasing Trend of Vegetation and Their Driving Mechanisms in the Mountainous Area of Haihe River Basin. Remote Sens. 2024, 16, 587. https://doi.org/10.3390/rs16030587
AMA Style
Cao B, Wang Y, Zhang X, Shen Y-J. Spatial Heterogeneity and the Increasing Trend of Vegetation and Their Driving Mechanisms in the Mountainous Area of Haihe River Basin. Remote Sensing. 2024; 16(3):587. https://doi.org/10.3390/rs16030587
Chicago/Turabian StyleCao, Bo, Yan Wang, Xiaolong Zhang, and Yan-Jun Shen. 2024. "Spatial Heterogeneity and the Increasing Trend of Vegetation and Their Driving Mechanisms in the Mountainous Area of Haihe River Basin" Remote Sensing 16, no. 3: 587. https://doi.org/10.3390/rs16030587
Note that from the first issue of 2016, this journal uses article numbers instead of page numbers. See further details here.