
Challenges and Limitations of Remote Sensing Applications in Northern Peatlands: Present and Future Prospects

Laboratory of Bioclimatology, Department of Ecology and Environmental Protection, Faculty of Environmental and Mechanical Engineering, Poznan University of Life Sciences, Piątkowska 94, 60-649 Poznań, Poland
*
Author to whom correspondence should be addressed.
Remote Sens. 2024, 16(3), 591; https://doi.org/10.3390/rs16030591
Submission received: 27 December 2023
/
Revised: 30 January 2024
/
Accepted: 1 February 2024
/
Published: 4 February 2024
(This article belongs to the Section Biogeosciences Remote Sensing)
Abstract
:This systematic literature review (SLR) provides a comprehensive overview of remote sensing (RS) applications in northern peatlands from 2017 to 2022, utilising various platforms, including in situ, UAV, airborne, and satellite technologies. It addresses the challenges and limitations presented by the sophisticated nature of northern peatland ecosystems. This SLR reveals an in-creased focus on mapping, monitoring, and hydrology but identifies noticeable gaps in peatland degradation research. Despite the benefits of remote sensing, such as extensive spatial coverage and consistent monitoring, challenges persist, including high costs, underexplored areas, and limitations in hyperspectral data application. Fusing remote sensing data with on-site research offers new insights for regional peatland studies. However, challenges arise from issues like the cost of high-resolution data, coverage limitations, and inadequate field validation data in remote areas. This review suggests refining methodologies, validating with high-resolution data, and addressing these limitations for future research.

1. Introduction
Peatlands are unique and diverse ecosystems that cover only around 3% of the global land surface [1,2,3]. The distinction between peatlands lies in the type of hydrology, nutrients, plants, and geography of the area. Peatlands are wetlands with an accumulation of decaying organic material that creates layers of peat and are divided into bogs and fens. Bogs are low in nutrients and only receive water from the atmosphere, while fens have a higher nutrient content and are nourished by water from both the atmosphere and the ground. Bogs are generally populated by Sphagnum mosses, sedges, and ericaceous shrubs, whereas fens are characterised by brown mosses, sedges, grasses, and shrubs [4,5]. In the global carbon cycle, peatlands serve as a sink for atmospheric carbon dioxide (CO2) and store approximately 550 billion metric tons of carbon [1,6]. They also provide various ecosystem services, including water purification, flood control, and habitats for various plant and animal species [7].
Peatlands have recently become increasingly important for climate change mitigation and adaptation [8,9]. This is because peatlands are the most significant terrestrial carbon sinks, and their destruction and degradation can result in the release of large amounts of CO2 into the atmosphere [10]. Therefore, peatland restoration and management have become critical priorities for many governments and conservation organisations worldwide [11,12].
Despite their importance, various human activities threaten peatlands, including drainage, agriculture, forestry, and mining [2,13]. For example, the drainage of peatlands for agriculture or forestry can lead to the oxidation of peat soil, which releases the stored carbon into the atmosphere as CO2 [1,14,15]. Peat extraction for use as fuel or horticultural material can also lead to the degradation of peatlands [16,17]. In addition, peatlands are highly susceptible to climate change because warmer temperatures and shifting precipitation patterns can alter peatland hydrology and vegetation [3,18,19].
Therefore, the conservation and management of peatlands are critical issues for global efforts to mitigate climate change and protect biodiversity [11,20]. It should be noted that restoration efforts are being undertaken to mitigate these issues; however, using traditional field-based methods to monitor the success of these restoration strategies can be difficult and expensive. For instance, remote sensing techniques have emerged as a promising alternative for assessing peatland conditions, estimating gaseous carbon fluxes at various scales, and uncovering hidden complexities.
Remote sensing is a powerful tool for mapping and monitoring the characteristics and dynamics of peatlands. It involves acquiring data on the Earth’s surface from a distance using sensors on satellites, aircraft, unmanned aerial vehicles (UAVs), and ground-based platforms [21]. Various types of remote sensing data, including visible and infrared imagery, radar [15,22], and LiDAR [23,24,25,26], can be used to extract information about the physical, chemical, and biological properties of peatlands [27].
Remote sensing has been widely applied in peatland research and management in recent years, and there is a growing body of literature on this topic. For example, remote sensing technology has been employed to map peatland vegetation cover [28,29,30,31], assess peatland hydrology [12,32,33], and estimate carbon storage [10,34]. However, much of the existing research has focused on specific remote sensing platforms, and there have been few attempts to synthesise and compare findings across studies.
Satellite-based remote sensing is one of the most widely used platforms in peatland research and management, as it has revolutionised our understanding of peatland ecosystems by providing large-scale coverage and long-term monitoring capabilities. Satellites orbit the earth from a distance of several hundred kilometres and are equipped with sensors that detect different wavelengths of electromagnetic radiation, such as visible light, infrared, and radar [34,35,36]. They offer several advantages for peatland applications, including global coverage, repeatability, and relatively high spatial and temporal resolution [37]. Studies such as Metzger et al. (2017) have delved into the impact of land-use intensity on vegetation indices, photosynthesis, and biomass within intensively and extensively managed grassland fens [38]. The analysis of satellite imagery has allowed for the assessment of vegetation dynamics and ecosystem exchange, as Kalacska et al. (2018) demonstrated in their comparison between satellite and airborne imagery for estimating peatland water table depth and net ecosystem exchange [18]. However, satellites also have limitations, such as the need for cloud-free conditions and limited ability to penetrate vegetation canopies [39,40].
Meanwhile, airborne remote sensing platforms, such as aircraft-mounted sensors, offer several advantages for peatland applications, including high spatial and spectral resolution, the ability to acquire data under a wide range of atmospheric conditions, and the ability to cover large areas quickly [25,41,42]. These advancements in technology have facilitated the mapping of peatland attributes, as exemplified by Arroyo-Mora et al. (2018) in their implementation of an airborne–hyperspectral system for the evaluation of maximum gross photosynthesis and uptake efficiency of CO2 in ombrotrophic peatland [43]. However, airborne remote sensing can be costly, time-consuming, and requires specialised aircraft and trained personnel [44,45].
UAV-based remote sensing involves sensors on small, unmanned aircraft (drones). It has emerged as a versatile tool for peatland research, enabling ultra-high-resolution mapping and monitoring [46]. UAVs offer several benefits for peatland applications, including low cost, ultra-high spatial and temporal resolution, and access to difficult-to-reach areas. Rahman et al. (2017) introduced a new method to map groundwater tables in peatlands using UAVs, highlighting the potential of this platform in hydrological investigations [47]. A study by Lovitt et al. (2018) showcased the utilisation of UAVs to uncover the effects of low-impact seismic lines on surface morphology, hydrology, and methane release within a boreal treed bog [32]. UAVs have also been employed in mapping peatland vegetation and quantifying carbon stocks, as Diaz-Varela and his team demonstrated in their 2018 examination of bog–heathland mosaics employing exceptionally detailed imagery [48]. However, UAVs also have limitations, requiring skilled operators and having limited payload capacity [23].
In situ-based remote sensing complements remote sensing data by providing ground truth measurements and detailed characterisation of peatlands. Lees et al. (2020) utilised spectral indices for the estimation of gross primary productivity (GPP) and water content, mainly in Sphagnum moss and other plant species in peatland, bridging the gap between field measurements and remote sensing [49]. McPartland et al. (2019) used in situ observations to examine how boreal peatland community composition and Normalized Difference Vegetation Index (NDVI) responded to alterations in hydrology, warming, and elevated carbon dioxide levels. However, in situ- and ground-based remote sensing can be labour-intensive, time-consuming, and is typically limited to small areas [50].
Furthermore, integrating multiple remote sensing platforms, such as satellites and UAVs, has shown promise in enhancing peatland monitoring, such as combining high spatial resolution with global coverage or accessing difficult-to-reach areas with high temporal resolution [51]. Räsänen et al. (2020, 2019) delved into exploring ultra-high spatial resolution remote sensing techniques and their practical applications in mapping vegetation patterns while assessing the necessary data and resolution criteria [30,51]. These approaches allow for a comprehensive understanding of peatland dynamics, emphasised in their research, which involved modelling and scaling up ecosystem respiration and using thermal cameras and UAVs.
Remote sensing techniques and platforms have many applications in peatland research. However, the choice of platform depends on the specific objectives and constraints of the study, as each platform has advantages and limitations. Therefore, in the following sections of this systematic literature review (SLR), we examine the use of different remote sensing platforms for peatland applications in more detail.
The systematic literature review is organised into several sections. The Introduction (Section 1) overviews the study’s objectives and summarises previous reviews. Section 2 details the methodology of the review, including the criteria for study inclusion and exclusion. The included studies are highlighted in Section 3, with a categorisation ranging from satellite-based to ground-based measurements and multiple platforms. Section 4 explores utilising remote sensing platforms and their applications in peatlands. Section 5 compares remote sensing platforms and their applications in northern peatlands. Finally, Section 6, titled “Conclusion”, encapsulates general conclusions and offers insights for future research.
1.1. Aim and Scope of This Systematic Literature Review
In this systematic literature review, an exploration is undertaken to investigate the applications of remote sensing techniques in peatland research. This examination considers the diverse array of remote sensing platforms, encompassing satellites, airborne platforms, UAVs, in situ- or ground-based measurements, and the integration of multiple platforms. This review includes only peer-reviewed research articles published in English in the past six years and is limited to studies conducted on peatlands located in the northern hemisphere, typically at latitudes higher than 23°N, referred to here as northern peatlands.
The objectives of this systematic literature review are as follows:
- Present an overview of the current knowledge on using remote sensing for mapping and assessing peatland characteristics such as vegetation cover, hydrology, and carbon storage;
- Evaluate the capabilities and limitations of different remote sensing platforms for peatland applications, including satellite, airborne, UAV, in situ ground-based, and multiple platforms;
- Identifying the key challenges and opportunities for remote sensing monitoring and management of peatland dynamics, such as land cover/land use change, hydrological fluctuations, and greenhouse gas emissions;
- Synthesise this review’s findings and provide recommendations for future research and remote sensing applications in peatland research.
1.2. Current Literature Reviews
This SLR identified six review articles (Table 1). Czapiewski and Szumińska (2022) assessed remote sensing techniques in research involving peatlands and the external factors affecting their development. The study was a state-of-the-art review and found that there had been a surge in the utilisation of RS approaches in peatland research over the past ten years, likely due to the augmented access to a variety of RS data sets and the quick progress of open-source software [52].
Dronova et al. (2021) conducted a scoping review to evaluate UAVs’ current and potential wetland applications. The authors found that UAVs could reduce the logistical demands of field surveys and optimise UAV-based workflows for monitoring wetland environments and management strategies. In addition, they identified significant trends in applications, technology, and data, and provided recommendations for future research [53].
Mirmazloumi et al. (2021) assessed the use of remote sensing (RS) technology in wetland studies in Canada. The study was a bibliographic analysis, and the authors found that most wetland classification studies were conducted within the province of Ontario, with a preference for pixel-based supervised classifiers as the primary classification algorithm [54].
Minasny et al. (2019) conducted a state-of-the-art review of the current digital mapping techniques used to measure and monitor carbon stocks in peatlands and the potential opportunities and challenges to accurately assessing the world’s peatlands. The authors found that interest in utilising satellite imagery and other digital mapping technologies to map peatlands was increasing. However, they noted that assessing the accuracy or uncertainty of the prediction was rarely performed [3].
Lees et al. (2018) conducted a literature review to assess the current understanding of estimating carbon dioxide fluxes in peatland utilising remote sensing technology and identified areas for future research. The authors found that there was potential for remote sensing to be utilised in models of carbon fluxes over northern peatlands. However, further development was necessary to create more comprehensive carbon cycle models and ensure their longevity, notably on peatlands subject to restoration [34].
Guo et al. (2017) conducted a literature review to provide an overview of wetland remote sensing, including selected approaches, findings, and types of remote sensors. The review concluded that early research into wetland mapping utilised aerial photography as the primary data source, though hyperspectral imaging had become more prevalent in recent years. They also noted that radar data are often used to detect wetland areas, and LiDAR data can generate three-dimensional topographical maps [4].
This SLR distinguishes itself by offering a specialised and detailed exploration of the applications, challenges, and future directions of RS in northern peatland research. Unlike previous overviews that broadly discuss RS adoption, our focus extends to specific applications such as the integration and the sensor fusion of hyperspectral and LiDAR data for precise vegetation mapping. We address challenges rigorously, emphasising the importance of calibration, validation practices, and interdisciplinary approaches, setting our review apart from general recommendations provided in prior works. Additionally, our comprehensive exploration covers various applications, including vegetation mapping, hydrology monitoring, and carbon stock assessment, providing a more holistic perspective compared to reviews that primarily focus on carbon flux estimation. This SLR goes beyond emphasising the significance of interdisciplinary approaches, stressing the need for data integration and advanced modelling techniques to enhance our understanding of peatland ecosystems, making it a forward-looking contribution to the field.
2. Materials and Methods
The majority of systematic reviews follow an extensively used methodology known as “Preferred Reporting Items for Systematic Reviews and Meta-Analyses” (PRISMA) [55]. Nevertheless, our systematic literature review was performed by adapting and combining a technique based on the PRISMA statement and published procedures [56]. The methodologies utilised in the current review enabled the authors to obtain a holistic vision, strengthening the research’s validity through accurate evaluations of the present research by wisely finding and categorising the relevant literature.
Pickering and Byrne (2014) used this technique for finding, selecting, and categorising articles, extracting data, and synthesising their results; it involves 15 steps explicitly described in advance, minimising any biases that might emerge in some narrative and traditional reviews [56].
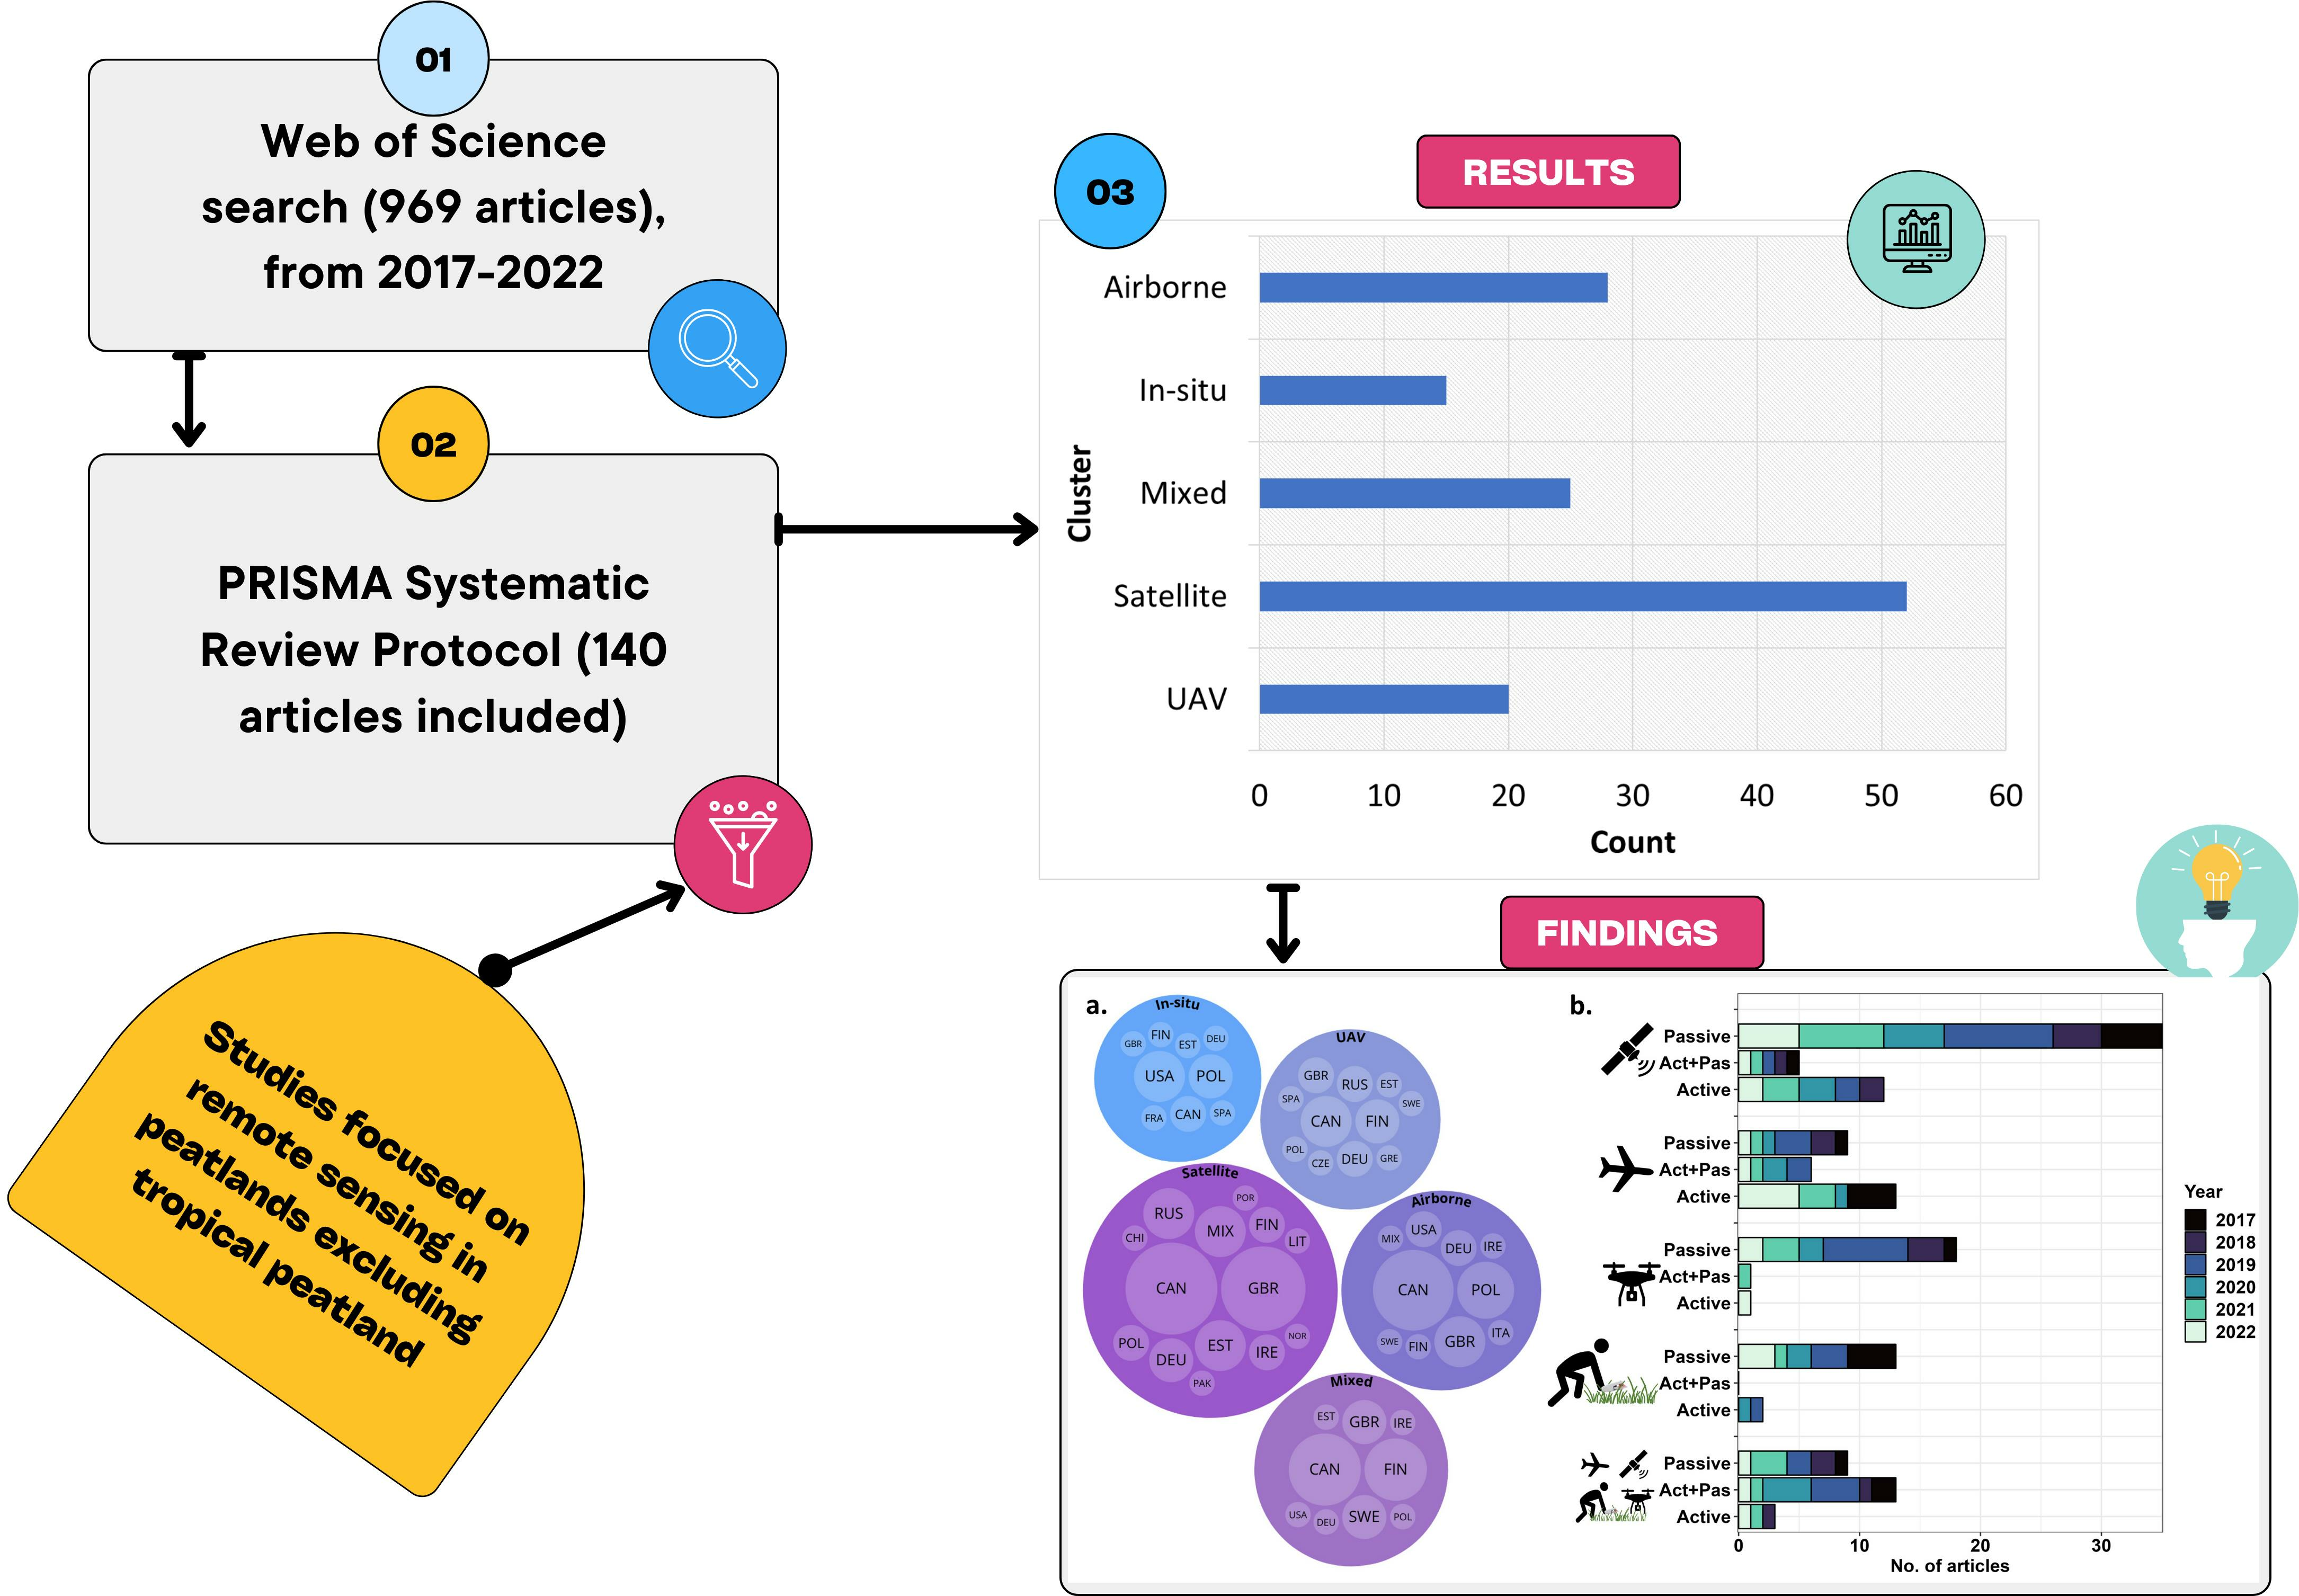
Additionally, the PRISMA statement augmented our work by guiding the implementation of a four-phase flow diagram (Figure 1) covering record identification and screening, study eligibility, and finally, studies included.
2.1. Identification of Relevant Literature
A systematic approach was taken in all review processes, beginning with selecting the period for the search criteria on the electronic database. As a result, the Web of Science database was chosen for its comprehensiveness, breadth, and high quality. Furthermore, the Science Citation Index Expanded (SCI-Expanded) database within the Web of Science platform is frequently utilised for bibliometric research across various multidisciplinary scientific domains. It includes over 21,000 journals in 254 Web of Science subject areas [57].
The methodology employed for this search involved setting the default beginning for the database time range from 1988 to 2022 to determine the year in which publications on remote sensing in peatland research increased more rapidly. Figure 2 illustrates a significant escalation in the quantity of records during the 2017–2022 period. The annual publication rate within this interval surged from approximately 5 to nearly 18 articles, as evidenced in Figure 2. This trend underscores the relevance of this time frame in encapsulating the most recent advancements in the field. Consequently, articles published from January 2017 to December 2022 were considered in our study to implement the selection criteria.
2.2. The Database and Search Criteria
The literature search was initially carried out on the Web of Science database as of 30 December 2022, employing the search strategy outlined in Table 2.
The methodology involved exporting all results from the database as BibTex to Mendeley Desktop and as an Excel spreadsheet for subsequent processing.
2.3. Screening the Literature
The articles had to adhere to the following criteria to be included: (1) they had to be original, English-language research papers published in peer-reviewed scientific journals, and (2) they had to include any application of any remote sensing platforms on peatlands. Books, abstracts, theses/dissertations, “grey literature”, and any documents dealing with tropical peatlands were excluded to ensure that only original research and peer-reviewed articles focused on remote sensing applications in northern peatlands were included. Review articles were included only if they presented original research but were not included in the subsequent data analysis. It is worth noting that the authors searched the bibliography for eligible articles to verify that all relevant articles were identified. This likely ensured that the final list of studies was relevant and that the review was extensive, consistent, and effective. The PRISMA flow chart (Figure 1) shows the workflow of identifying, screening, and including final articles. The concluding dataset contained 137 full-text articles published between 2017 and 2022.
2.4. Extracting Data and Synthesising Results
The remaining peer-reviewed studies (137) were found to be highly pertinent to remote sensing in peatlands. After filtering and evaluating them, possible effective scaling options were revealed. Subsequently, we identified five primary clusters—papers that relied on (1) satellite-, (2) airborne-, (3) UAV-, or (4) in situ/ground-based remote sensing measurements in peatlands, and papers that used (5) multiple remote sensing platforms in peatland studies.
The classification of the five primary clusters was further refined by their corresponding subclusters, which follow the electromagnetic spectrum in ascending order of frequency. The subclusters commence with passive remote sensing—specifically, optical remote sensing—and continue with active remote sensing techniques, including Light Detection and Ranging (LiDAR). Finally, the subclusters culminate with Radio Detection and Ranging (Radar) remote sensing. It should be emphasised that this classification scheme is predicated on frequency, with lower-frequency domains being represented earlier in the sequence. For the synthesising of results, the following elements of information were extracted from each original research publication that met the inclusion criteria: (1) the author(s), (2) the year of publication, (3) the journal, (4) the country of study site, (5) the peatland type, (6) the dominant vegetation, (7) remote sensing platforms, (8) sensors used, (9) study focus and concern, (10) the study result, and (11) future work and limitations.
3. Current Remote Sensing Data
Remote sensing data employed in peatlands can be broadly categorised into passive and active sensors. Passive sensors detect radiation naturally emitted or reflected by a target, while active sensors emit energy and then measure how much of it is reflected or scattered back by the target. Passive sensors are sensitive to the electromagnetic spectrum’s visible, near-infrared, and thermal infrared regions and help collect information regarding the target’s reflectance properties and surface temperature. Active sensors like LiDAR and radar capture terrain information and subsurface characteristics. The choice of sensor type depends on the specific application and required information. For example, passive sensors are typically used for collecting spectral information, e.g., multispectral and hyperspectral imagery, which provide valuable insights into vegetation dynamics and environmental variables, while active sensors are used to determine structural and height information. Combining both sensor types can provide a more comprehensive view of the target.
Figure 3 presents a comprehensive overview, encapsulating research studies focusing on remote sensing applications in peatlands. This SLR is thoughtfully organised based on the chosen platform for remote sensing, including satellite, airborne, unmanned aerial vehicle (UAV), in situ, and mixed (a fusion of platforms). Furthermore, the studies are systematically categorised by the sensing they employ, which can be active (active remote sensing), passive (passive remote sensing), or “Act+Pas” (a combination of active and passive sensing methods).
These included studies cover a spectrum of years from 2017 to 2022, with Figure 3b revealing the number of articles or studies related to each category. These valuable insights shed light on the distribution of research efforts within the remote sensing applications in peatlands. This resource equips researchers and practitioners with a profound understanding of evolving trends and focal points across different platforms and sensing types over the years.
The trends highlighted in Figure 3 indicate technology’s adaptability in addressing the unique challenges posed by peatland environments. These include the transition from active to passive sensing and its dominance in satellite applications, the increasing prevalence of active airborne sensing, and the growing adoption of the fusion of sensors in “Act+Pas” multiplatform applications. Moreover, they underscore the global relevance of peatland research, with many countries such as Canada, Finland, Great Britain, and Poland contributing to this dynamic field (Figure 3a). This insight is a critical resource for anyone interested in the advancements and shifts in remote sensing methodologies applied to peatlands, allowing for more informed research and decision-making in this vital environmental domain.
4. Remote Sensing Platforms Used in Peatland Research
4.1. Satellite-Based Remote Sensing
The literature reveals that satellite-based remote sensing techniques have been widely used for peatland research. It has emerged as a valuable tool for monitoring and studying peatland ecosystems [58]. In recent years, the application of satellite data has emerged as a promising approach to assessing the condition of peatlands [11,59,60,61], estimating carbon fluxes [37,62,63], and monitoring the effectiveness of restoration initiatives [64]. In this section, we evaluate the effectiveness and limitations of satellite-based remote sensing applications in peatland research (Table 3), focusing on their contribution to peatland mapping, vegetation monitoring, and carbon stock estimation.
4.1.1. Peatland Mapping
Satellite-based remote sensing has significantly advanced peatland mapping [11]. Several studies have developed methodologies to classify wetlands from multiple satellite remote-sensing data sources using advanced classification algorithms [39,65,66]. These methodologies effectively discriminate between different wetland classes, such as bog, fen, marsh, swamp, and shallow water [39,66], demonstrating the capability of high-resolution satellite imagery to identify and delineate different peatland types.
Multispectral sensors have allowed for detecting subtle variations in vegetation and soil properties [40,67]. However, despite these advancements, challenges exist, particularly in areas with dense vegetation cover or mixed land use, such as peatlands [68]. Additionally, the accuracy of peatland classification algorithms can be affected by the presence of shadows, cloud cover, and atmospheric interference in the case of utilising passive-based remotely sensed data [65]; thus, utilising Synthetic Aperture Radar (SAR) data is helpful for overcoming the challenges of cloud cover and shadows. Various SAR sensors are operational, offering multiple options between and within a single sensor. When selecting a SAR sensor for peatland mapping, considerations such as wavelength (e.g., L-band, X-band, and C-band), polarization options (with fully polarimetric sensors providing more information than dual- or single- polarisation sensors), and spatial resolution are crucial. L-band has demonstrated the ability to provide distinctive information about peatland surfaces and is relatively insensitive to vegetation variability [69]. Nonetheless, given the intricate nature of peatland ecosystems, acquiring sub-metre resolution data is imperative for accurately mapping the sporadic patterns of peatland vegetation. It is important to note that such high-resolution data acquisition is associated with associated costs [28].
4.1.2. Vegetation Dynamics and Productivity Monitoring
Several studies have explored using satellite data to analyse peatland vegetation dynamics and productivity [66,70]. The utilisation of NDVI derived from satellite data has become a prevalent method for evaluating the health and productivity of vegetation [64,71]. Moreover, integrating high-resolution optical and radar imagery enables the detection and monitoring of vegetation changes associated with peatland degradation and restoration efforts [11,60].
Pang et al. (2021) examined remotely sensed vegetation phenological parameters in Chinese bogs using MOD13Q1-EVI data, highlighting the potential of satellite imagery in monitoring long-term phenological changes [70].
Räsänen et al. (2019) explored mapping above-ground biomass using very high spatial resolution (VHSR) satellite imagery from platforms like QuickBird, WorldView-2, and WorldView-3. They underscored the significance of integrating precise in situ data to enhance the precision of biomass estimation [71].
However, limitations arise when analysing dense and tall vegetation in peatland areas, as the penetration of radar signals is reduced. Consequently, satellite-based SAR/LiDAR remote sensing may underestimate vegetation biomass and structure. Moreover, as NDVI is mainly used not only in peatland research but in remote sensing in general, such an index is relatively stable; for instance, in peatland vegetation, NDVI is well-correlated with the vascular plants’ phenology, but the correlation with Sphagnum spp. is not well determined.
4.1.3. Carbon Stock Estimation
Quantifying carbon stocks in peatlands is crucial for understanding their role in the global carbon cycle. Satellites provide a means for estimating carbon stocks over large areas. Several studies have utilised satellite data to map and estimate peatland carbon content [62,63,72,73]. However, obtaining accurate carbon estimation through satellites requires ground validation and considering site-specific factors, such as vegetation type, peat depth, peat thickness, or direct traditional carbon content estimation in the laboratory. By combining spectral indices with field measurements, these studies have demonstrated the potential of remote sensing in capturing spatial variations in peatland carbon stocks.
4.1.4. Monitoring Restoration Efforts and Success
Monitoring the success of peatland restoration initiatives is crucial for assessing the effectiveness of these schemes. Hence, accurate above-ground biomass estimation is essential for understanding peatland carbon storage. Medvedeva et al. (2017) assessed the capabilities of multispectral satellite data, such as Landsat-7 ETM+, Spot-6 HRG, and Spot-5 HRG, in identifying the condition of peatlands impacted by peat extraction and abandoned deposits [74]. They demonstrated the potential of remote sensing for monitoring biomass changes and evaluating the effectiveness of restoration measures. Pang et al. (2021) investigated remotely sensed vegetation phenological parameters in bogs, emphasising the potential of satellite data in monitoring long-term vegetation phenology and its implications for ecological processes and carbon dynamics [70]. In their respective investigations, Lees et al. (2019) and Artz et al. (2019) employed Moderate Resolution Imaging Spectroradiometer (MODIS) datasets to develop models for estimating gross primary productivity (GPP) in peatland ecosystems undergoing restoration [59], comparing the results with field measurements and introducing a Temperature and Greenness model for more accurate local-scale assessments [64].
Peatlands store large amounts of carbon, the release of which depends strongly on water table depth (WTD) [75]. Hence, the peatland’s water table must be monitored to ensure restoration success [75,76].
Synthetic Aperture Radar stands out due to its unique ability to penetrate beneath the Earth’s surface, reaching the uppermost soil layers. This unique characteristic offers invaluable insights that optical data alone cannot provide. In our pursuit to assess the feasibility of employing remote sensing-derived information for monitoring below-ground ecosystem resilience, we embark on an exploration. A noteworthy aspect is SAR backscatter’s capability to estimate soil surface moisture, which has been shown to establish a correlation with the time series of WTD in peatlands and wetlands in general [76,77].
The potential of the Sentinel-1 SAR sensor for tracking the dynamic shifts in soil moisture is substantial. This potential is attributed to its frequent return interval and high spatial resolution, capable of reaching as low as 10 metres. These attributes are precious in high-latitude regions where numerous peatlands are situated. Nonetheless, the capabilities of the Sentinel-1 SAR have not been fully explored due to the recent launch of the satellite pair in April 2014 and April 2016, resulting in a constrained time series of accessible satellite images [78].
It is crucial to highlight that SAR cannot currently be directly utilised for comparing soil moisture across different sites. This limitation stems from the inconsistent relationship between SAR backscatter and soil moisture, which is influenced by factors including vegetation structure and surface topography [76,77].
4.1.5. Monitoring Peatland Fire Dynamics
Peatland fires have severe environmental and socio-economic impacts. Satellite-based fire monitoring systems have been developed to understand fire dynamics and mitigate their effects. Millard et al. (2022) investigated seasonally decomposed Sentinel-1 backscatter time series in Canada’s boreal forest as indicators of wildfire vulnerability in peatland [79]. They emphasise the potential of SAR backscatter data as a nearly real-time tool for predicting fire vulnerability over extensive geographic areas. However, they also acknowledge certain limitations [79]. The method’s effectiveness relies on the continuous acquisition of SAR data, making it susceptible to disruptions resulting in an incomplete time series dataset. Moreover, implementing this method necessitates substantial computing resources for generating spatial estimates. Nevertheless, the study highlights the potential of using seasonally decomposed Sentinel-1 backscatter time series to indicate peatland wildfire vulnerability, contributing to peatland fire occurrence [79].
4.1.6. Challenges and Limitations
Satellite-based remote sensing has revolutionised peatland research by providing a comprehensive view of these complex ecosystems. It has proven effective in peatland mapping, vegetation monitoring, and carbon stock estimation due to large-scale coverage, cost-effectiveness, and the ability to capture seasonal dynamics and spatial variations. However, several limitations and challenges need to be addressed. These include improved calibration and validation of satellite products, considering local-scale factors and site-specific characteristics, and incorporating detailed in situ data for accurate assessments. Furthermore, utilising satellite data for peatland monitoring requires careful selection of appropriate vegetation indices, spectral bands, and processing techniques to capture these ecosystems’ complex dynamics and heterogeneity.
Moreover, challenges related to classification accuracy, vegetation penetration, and quantifying below-ground carbon stocks persist. Continued technological advancements, multi-sensor data integration, and improved algorithms are necessary to overcome these limitations. Furthermore, ground validation and site-specific considerations remain crucial to ensure accurate and reliable results in satellite-based remote sensing applications on peatlands.
Although the emergence of hyperspectral satellite data made possible by upcoming missions such as EnMAP, PRISMA, and CHIME presents an exciting leading edge in peatland vegetation monitoring, there is a lack of hyperspectral satellite data studies, which is crucial to be included in future research as these new datasets, characterised by their extensive spectral coverage, hold the potential to delve into species-level analysis. The complexity lies in harnessing the full spectral extent of these novel hyperspectral satellite data sets, which calls for accurate measurements of the spectral properties specific to key plant species. Understanding and exploring these spectral characteristics are indispensable to unlocking the immense possibilities.

Table 3.
Commonly used satellites and their applications found in the literature.
| References | Peatland Type * | Peatland Status | Dominant Vegetation | Platform | Sensor/Product | Indices | Sensing Type | Multi/Hyper | Application |
|---|---|---|---|---|---|---|---|---|---|
| [14] | Peatland | Disturbed | No vegetation (bare peat) | Landsat | TM, OLI | NDVI | Passive | Multi | Change Detection |
| [60] | Bog | Disturbed | Sphagnum spp., other mosses, lichen, Ericaceous shrubs, sedges, grasses | Sentinel-1 | C-band SAR | NA | Active | NA | Condition assessment |
| [11] | Bog | Restored | NA | ERS1, ERS2, Sentinel-1 | C-band SAR | NA | Active | NA | |
| [9] | Peatland | Natural | Sphagnum spp., Juniperus brevifolia | Sentinel-2, Rapideye | NA | NA | Passive | NA | Hydrologic services estimation |
| [80] | Bog | Natural | Sphagnum spp., Pinus sylvestris, Calluna vulgaris, Eriophorum vaginatum, Chamaedaphne calyculata, Andromeda polifolia, Rhynchospora alba, Ledum palustre, Oxycoccus microcarpus, Oxycoccus palustris | Landsat, Terra | TM/MOD11A1 | NDVI, SMI, Albedo | Passive | Multi | Monitoring WTD dynamics |
| [81] | Peatland | Natural | Mosses, sedges, shrubs, sparse dwarf pines, shrubs, black spruce, mosses, downy willows, and dwarf birch, Alder, willow | Landsat, Terra | MOD09GA | NA | Passive | Multi | |
| [76] | Peatland | Restored | NA | ENVISAT | ASAR C-Band | NA | Active | NA | |
| [78] | Fen | Disturbed | Grass | Sentinel-1 | C-band SAR | NA | Active | NA | |
| [82] | Peatland | Restored | NA | Sentinel-1, Sentinel-2 | C-Band GRD/MSI | NDWI, MNDWI | Mixed | Multi | |
| [39] | Peatland | NA | NA | RADARSAT-2, Sentinel-1, ALOS-2 | C-band, L-band SAR | NA | Active | NA | Peatland classification |
| [65] | Peatland | NA | NA | Landsat, RADARSAT-2, Sentinel-1 | MSI/C-band, L-band SAR | NDVI, NDWI, Albedo, LST | Mixed | Multi | |
| [68] | Peatland | NA | NA | RapidEye | NA | RENDVI, RVI, GNDVI | Passive | Multi | |
| [66] | Peatland | NA | NA | Sentinel-1, Sentinel-2 | Ground Range Detected (GRD) | NDVI, EVI, DVI, RENDVI, NDWI | Mixed | Multi | |
| [83] | Peatland | Disturbed | NA | Radarsat-2, Landsat | SAR/OLI | NA | Mixed | Multi | |
| [37] | Mire | Disturbed | Molinia caerulea, Potentilla erecta | Terra | MOD9A1, MOD13Q1, MOD15A2, MOD17A2 | NDVI, EVI, LAI, fPAR, | Passive | Multi | Peatland CO2 gas fluxes |
| [72] | Peatland | Natural | Sphagnum fuscum, Chamaedaphne calyculata, Picea mariana, Eriophorum vaginatum, Dicranum fuscescens Turner, Tomentypnum nitens, Larix laricina, Betula pumila, Menyanthes trifoliata, Carex lasiocarpa | Landsat | OLI | EVI | Passive | Multi | |
| [63] | Peatland | Natural | Carex rostrata, Betula nana, Eriophorium angustifolium, Sphanum fuscum, S. angustifolium, S. riparium, S. fallax, S. balticum, S. Lindbergii, S. majus, Empetrum hermaphroditum, Menyanthes trifoliata, Eriophorum vaginatum, Vaccinium oxycoccos, Andromeda polifolia, Trichophorum caespitosum, Carex chordorrhiza, Salix phylicifolia. Betula nana, Salix lapponum, | Terra, Sentinel-2 | MOD11A1, MYD11A1/MSI | EVI, NDWI | Passive | Multi | |
| [62] | Bog | Disturbed | Molinia caerulea, Potentilla erecta | Terra | MODIS9A1 | NDVI | Passive | Multi | |
| [84] | Bog | Disturbed | Scirpus cespitosus, Eriophorum vaginatum, Molinia caerulea, Narthecium ossifragum, Sphagnum spp. | Terra | MOD15A2, MODIS9A1 | NDVI, fPAR | Passive | Multi | |
| [85] | Peatland | Disturbed | Picea mariana, Salix spp., Alnus alnobetula | Landsat | TM&ETM+&OLI | NDVI | Passive | Multi | Peatland degradation |
| [86] | Bog | Natural | Sphagnum spp., Pinus sylvestris | Sentinel-1 | C-band SAR | NA | Active | NA | |
| [87] | Bog | Disturbed | NA | Geoeye-1 | NA | NA | Passive | Multi | |
| [12] | Bog | Natural | Sphagnum spp., Pinus sylvestris | Terra | MOD09Q1 | NDVI | Passive | Multi | Peatland degradation and hydroclimatic conditions |
| [88] | Peatland | Natural | Sphagnum spp, Carex spp., Pleuorzium schreberi, Hylocomium splendens, | ALOS PALSAR, ERS-1 or 2, Landsat 5 TM | SAR L-band, C-band, ETM+ | NA | Mixed | Multi | Peatland mapping |
| [31] | Peatland | Natural | Sphagnum spp., Carex spp., | Sentinel-2 | MSI | NDVI, EVI, NDWI | Passive | Multi | |
| [69] | Bog | Disturbed | NA | Sentinel-1, RADARSAT-2 | C-band | NA | Active | NA | |
| [89] | Peatland | NA | NA | Landsat | OLI | NA | Passive | Multi | |
| [90] | Peatland | NA | NA | Sentinel-1 | C-band SAR | Coherence Assessment | Active | NA | |
| [91] | Peatland | NA | NA | RapidEye | NA | RENDVI, NDVI, GNDVI, Red Edge, | Passive | Multi | |
| [61] | Bog | Disturbed | Sphagnum spp., shrub, grass, rushes | Sentinel-1 | C-Band SAR | NA | Active | NA | |
| [74] | Bog | Disturbed | Willow herb, small reed, and small birch reed communities | Spot-5, Spot-6, Landsat-7 ETM+ | HRG/ETM+ | NA | Passive | Multi | Peatland monitoring |
| [33] | Bog | Disturbed | Eriophorum vaginatum, Sphagnum spp., Molinia spp. dominated, dwarf shrubs | Sentinal-1 | NA | NA | Active | NA | |
| [92] | Bog | Natural | Pinus sylvestris ‘Nana’, Ledum palustre, Vaccinium uliginosum, Calluna vulgaris, Empetrum nigrum, Sphagnum spp. | Terra | MODIS LST, MOD11A1 | NA | Passive | Multi | |
| [93] | Bog | Disturbed | NA | Sentinel-1 | C-band SAR | NA | Active | NA | |
| [70] | Bog | Natural | Sphagnum spp., | Terra | MOD13Q1 | EVI | Passive | Multi | Vegetation phenology |
| [71] | Peatland | Natural | Mosses, sedges, shrubs | QuickBird, WorldView-2 and WorldView-3 | NA | NDVI, NDVI, RGI, EVI, EVI, SAVI, MSAVI | Passive | Multi | Peatland productivity |
| [67] | Bog | Natural | Sphagnum spp., | Terra | MOD13Q1 | NDVI | Passive | Multi | |
| [73] | Bog | NA | Calluna vulgaris, Empetrum nigrum, Vaccinium uliginosum, Rubus chamaemorus, Dicranum scoparium, Hylocomium splendens, Pleurozium schreberi, Racomitrium lanuginosum, Sphagnum spp., Cladonia spp., Carex rariflora | Terra | MODIS NDVI | NDVI | Passive | Multi | |
| [94] | Peatland | Disturbed | Sedge, sedge–moss, reed, grass | Sentinel 2, Sentinel 3, Terra | MSI/OLCI, SLSTR/LST/MOD09GQ, MOD11A1 | NDVI, NDII, APAR, LAI | Passive | Multi | |
| [19] | Peatland | Natural | Moss, grass, vascular plants, shrub | Landsat | NA | NDVI | Passive | Multi | |
| [95] | Fen | Natural | Sphagnum teres, Drosera rotundifolia, Carex limosa, Oxycoccus palustris | Terra and Aqua | MOD13Q1/MYD13Q1 | NDVI | Passive | Multi | |
| [96] | Bog | Restored | NA | Terra | MOD11-C2, MODIS LST, MCD43A3 | NA | Passive | Multi | Peatland restoration |
| [20] | Bog | Restored | Bare peat, scrub, grass, sedge, Calluna Vulgaris, Pteridinium spp. | Terra | MOD13A2, MCD43A3 | NDVI, EVI | Passive | Multi | |
| [59] | Peatland | NA | NA | Terra | NA | EVI, SAVI, NDWI, LST | Passive | Multi | Restoration monitoring |
| [64] | Bog | Restored | Eriophorum angustifolium, Sphagnum capillifolium, Cladonia portentosa, Calluna vulgaris, Erica tetralix, Trichophorum germanicum, Molinia caerulea, Polytrichum commune, Dicranum scoparium, Pleurozium schreberi | Terra | MOD17A2H, MOD09A1 | NDWI, NDVI, EVI | Passive | Multi | |
| [97] | Bog | Disturbed | Sphagnum spp., Pinus contorta, Betula papyrifera, Betula pendula | Terra | MOD13Q1, MOD16A2 ET | NDVI | Passive | Multi | |
| [58] | Peatland | Restored | Pine, willow–birch, bare peat | Landsat, Sentinel-2, Spot-5 | ETM+, MSI, HRG | RED–NIR, NIR–SWIR, SWIR2–SWIR | Passive | Multi | Fire risk reduction and restoration monitoring |
| [40] | Mire | Disturbed | Molinia caerulea, Potentilla erecta | Landsat, Sentinel-2, Spot-5, Spot-6 | ETM+, OLI, MSI, HRG | RED–NIR, NIR–SWIR2, SWIR2–SWIR | Passive | Multi | |
| [79] | Peatland | NA | NA | Sentinel-1, Sentinel-2 | C-Band SAR/MSI | NDVI, NDII | Mixed | Multi | Wildfire dynamics |
* Note: in this table, the term “peatland” is used comprehensively to refer to all peatlands considered in the study unless otherwise specified.
4.2. Airborne-Based Remote Sensing
Among the various remote sensing platforms available, airborne-based remote sensing has gained considerable attention due to its ability to provide high-resolution data over large areas. This section evaluates the strengths and limitations of airborne-based remote sensing applications on peatlands, focusing on the field’s key studies. However, at the study level, Table 4 shows the application and sensor used in all the airborne studies.
4.2.1. Peatland Classification and Mapping
Airborne-based remote sensing has proven effective in classifying and mapping peatland vegetation types. Studies by Szporak-Wasilewska et al. (2021) and Carless et al. (2019) demonstrated the ability to distinguish between different peatland vegetation communities using airborne hyperspectral and LiDAR data for the mapping and continuous monitoring of wetland ecosystems [42,44]. Both studies demonstrate the effectiveness of integrating remote sensing products, such as hyperspectral bands, spectral indices, and topographic information, for accurate classification and mapping of wetland habitats. The research by Szporak-Wasilewska et al. (2021) emphasises the potential of combining hyperspectral and LiDAR data to improve classification accuracy [42], while Carless et al. (2019) highlights the advantages of remote sensing over traditional ground surveys for mapping peatland degradation [44]. Furthermore, a study by Langlois et al. (2017) used LiDAR data for boundary delineation in peatland complexes [24].
The studies by Exler and Moore (2022) and Zhang et al. (2018) focus on assessing vegetation traits and water balance in peatland vegetation communities [45,98]. Exler and Moore (2022) quantify throughfall, interception loss, and streamflow across various vegetation communities within a maritime raised bog, highlighting the importance of shrub vegetation in quantifying net precipitation [98]. Zhang et al. (2018) developed a methodology using airborne hyperspectral data to calculate the fractional coverage of various plant functional types within peatland ecosystems, showcasing the effectiveness of the multiple endmember spectral mixture analysis (MESMA) approach [45].
These studies highlight the potential of airborne sensors to provide detailed information on vegetation composition and structure, facilitating peatland management and conservation efforts.
4.2.2. Monitoring Peatland Dynamics, Degradation, and Hydrological Changes
Monitoring peatland hydrological dynamics is crucial for understanding carbon fluxes and ecosystem health. Airborne-based remote sensing techniques like LiDAR have been utilised to estimate water table levels and monitor peatland moisture content. The research by Chasmer and Hopkinson (2017) and Mirosław-Świątek et al. (2017) focus on monitoring peatland dynamics, degradation, and hydrological changes [99,100]. Chasmer and Hopkinson (2017) investigate the connections between the El Niño/Southern Oscillation (ENSO) index and permafrost loss in a watershed, highlighting the accelerated permafrost loss and associated hydrological changes [100]. Mirosław-Świątek et al. (2017) explore the uncertainties in digital elevation models (DEMs) and their impact on water level assessments in riparian and mire ecosystems [99]. They emphasise the need to address the quality of DEMs and the associated uncertainties to ensure accurate and reliable DEM uncertainty in model-based water level assessments for wetland management and ecological assessments.
4.2.3. Peatland Carbon Stock Assessment
Accurate estimation of carbon stocks is essential for assessing peatlands’ climate change mitigation potential [41,101,102]. Airborne-based remote sensing, combined with LiDAR technology, has been employed to estimate above-ground biomass and carbon stocks in peatland ecosystems. Studies by O’Leary et al. (2022) presented methods that rely on high-quality airborne radiometric data and prior knowledge of peatland extent, which offer a valuable approach for international peatland mapping projects, enabling the identification of previously unrecognised peat areas and updates to boundary locations [41]. This has significant implications for carbon stock assessment, land management decisions, and rehabilitation projects. It is more suitable for large areas with comprehensive datasets exhibiting clear statistical relationships. The findings can serve as a basis for conducting more targeted, region-specific investigations or integrating them into broader peatland mapping initiatives.
4.2.4. Challenges and Limitations
While airborne-based remote sensing offers significant potential for peatland research, several challenges and limitations must be acknowledged. First, the cost and logistical requirements associated with airborne campaigns can be substantial, limiting the extent and frequency of data acquisition. Weather conditions and cloud cover can impede data collection and affect image quality regarding passive remote sensing data acquisitions. Furthermore, interpreting remote sensing data often requires ground validation, which can be challenging in remote and inaccessible peatland areas. Nevertheless, future research is required, similar to the study by Soffer et al. (2019), which focuses on advancements in the calibration and validation of airborne hyperspectral imagery in Arctic peatland regions [103]. The research demonstrates the importance of rigorous calibration and validation practices in improving the quality and reliability of hyperspectral imagery analysis. Soffer et al. (2019) highlight the implications of their methodology for satellite image analysis, emphasising the need for accurate calibration and validation in peatland ecosystems. This study contributes to the refinement and reliability of airborne remote sensing data analysis in peatland studies [103].
Table 4.
Airborne studies, the sensor used, and applications.
| Reference | Peatland Type * | Peatland Status | Dominant Vegetation | Active/Passive | Data Type | Application |
|---|---|---|---|---|---|---|
| [42] | Fen | Disturbed | Campylium stellatum, Hamatocaulis vernicosus, Limprichtia cossonii, Fissidens adianthoides, Scorpidium scorpioides, Carex spp., Comarum palustre., Menyanthes trifoliata., Thelypteris palustris. | Mixed | Hyperspectral & LiDAR | Classification and mapping |
| [24] | Peatland | Disturbed | Sphagnum spp., Alnus incana, Ilex (Nemopanthus) mucronatus, Rhododendron canadense, Viburnum nudum. | Active | LiDAR | |
| [25] | Bog | NA | Empetrum nigrum, Calluna vulgaris, Betula nana, Sphagnum spp., Andromeda polifolia, Eriophorum vaginatum. | Mixed | RGB & LiDAR | |
| [45] | Bog | NA | Calluna vulgaris, Erica tetralix, Myrica gale, Vaccinium myrtillus, Rhyncospera alba, Eriophorum spp., Sphagnum spp., Andromeda polifolia. | Passive | Hyperspectral | |
| [41] | Peatland | NA | NA | Passive | NA | |
| [17] | Bog | Disturbed | Pinus mugo, Sphagnum spp. | Mixed | LiDAR & CIR & RGB | |
| [102] | Peatland | NA | NA | Active | LiDAR | |
| [44] | Bog | Disturbed | NA | Mixed | Multispectral & LiDAR | |
| [104] | Bog | Disturbed | NA | Mixed | Gamma-ray & Radar | |
| [29] | Bog | Natural | NA | Mixed | Gamma-ray & LiDAR | |
| [43] | Bog | NA | Sphagnum spp., Typha angustifolia, Chamaedaphne calyculata, Rhododendron groenlandicum, Kalmia angustifolia, Vaccinium myrtilloides, Eriophorum vaginatum, Picea mariana, Betula populifolia, Larix laricina. | Passive | Hyperspectral | CO2 fluxes |
| [105] | Peatland | NA | NA | Active | NA | |
| [106] | Bog | NA | Sphagnum spp., | Active | LiDAR | Peatland hydrology and vegetation dynamics |
| [107] | Fen | NA | Sphagnum spp., brown moss, feathermoss, herb, graminoid, horsetail, shrub. | Active | LiDAR | |
| [108] | Peatland | NA | Sphagnum spp., shrub. | Active | NIR & Thermal & LiDAR | |
| [109] | Bog | Disturbed | Erica tetralix, Calluna vulgaris, Ericaceae spp., Eriophorum vaginatum, Trichophorum cespitosum, Cyperaceae spp., Sphagnum spp. | Passive | RGB | |
| [99] | Peatland | Natural | Caricetum appropinquatae, Caricetum gracilis, Glycerietum maximae, Phragmitetum australis, alder, willow encroachments., | Active | LiDAR | |
| [98] | Bog | Disturbed | Gaultheria shallon, Pinus contorta, Tsuga heterophylla, Rhododendron groenlandicum, Sphagnum spp. | Active | LiDAR | |
| [101] | NA | Disturbed | Phragmites australis | Active | NA | |
| [110] | Peatland | Disturbed | NA | Active | LiDAR | Peat estimation |
| [109] | Bog | Disturbed | Erica tetralix, Calluna vulgaris, Ericaceae spp., Eriophorum vaginatum, Trichophorum cespitosum, Cyperaceae spp., Sphagnum spp. | Passive | RGB | |
| [100] | Peatland | NA | Sphagnum spp., shrub. | Active | LiDAR | Peatland restoration |
| [111] | Peatland | Disturbed | Populus tremuloides, Populus balsamifera, Betula papyrifera, Picea mariana, Pinus banksiana, Prunus virginiana, Alnus crispa, Amelanchier alnifolia, Symphoricarpos albus, Ledum groenlandicum Oeder, Betula pumila, Salix spp. | Active | LiDAR | Peatland wildfire vulnerability and monitoring |
| [26] | Peatland | Disturbed | Populus tremuloides, Populus balsamifera, Picea glauca, P. mariana, Betula glandulosa, Rhododendron groenlandicum, Sphagnum spp. | Active | LiDAR | |
| [103] | Peatland | NA | Sphagnum spp., Typha angustifolia, Chamaedaphne calyculata, Rhododendron groenlandicum, Kalmia angustifolia, Vaccinium myrtilloides, Eriophorum vaginatum, Picea mariana, Betula populifolia, Larix laricina. | Passive | Hyperspectral | |
| [112] | Bog | Natural | Sphagnum spp., vascular plants. | Passive | Hyperspectral | Hyperspectral validation/RS techniques and data analysis |
| [113] | Fen | Natural | Sphagnum spp., Eriophorum angustifolium, Carex spp., Oxycoccus palustris, Typha latifilia, | Passive | Hyperspectral | |
| [114] | Fen | Natural | Sphagnum spp., Eriophorum angustifolium, Carex spp., Oxycoccus palustris, Typha latifilia, | Passive | Hyperspectral | Vegetation analysis and modelling |
| [115] | Peatland | NA | Eriophorum vaginatum | Passive | Hyperspectral |
* Note: In this table, the term “peatland” is used comprehensively to refer to all peatlands considered in the study unless otherwise specified.
4.3. UAV-Based Remote Sensing
Remote sensing technologies, such as unmanned aerial vehicles (UAVs), have revolutionised environmental monitoring and management. In recent years, UAV-based remote sensing has gained prominence in peatland research due to its ability to provide high-resolution data for mapping and monitoring purposes (Table 5).
4.3.1. Mapping Carbon Fluxes and Stocks
An article by Ivanov et al. (2021) demonstrates the potential of UAV remote sensing for mapping CO2 fluxes and carbon (C) stocks in peatland ecosystems. Their findings highlight the potential of UAV remote sensing for accurately assessing microform groups and estimating CO2 fluxes [116]. Those findings are consistent with previous research by Beyer et al. (2019), who successfully mapped vegetation communities in rewetted fen sites using UAV-based multisensory data [117]. By exploring the potential use of aboveground vegetation characteristics as indicators for mapping below-ground C stocks in peatlands, they demonstrate that UAV remote sensing combined with structural equation modelling can improve the estimation of below-ground C stocks and our understanding of C dynamics in peatland ecosystems.
4.3.2. Monitoring of Peatland Hydrology
UAVs with thermal and multispectral sensors have shown promise in monitoring peatland hydrological dynamics [117]. By capturing images at different wavelengths, these sensors can detect fluctuations in soil moisture content and the levels of the water table. Such information is crucial for assessing peatland health, understanding hydrological processes, and informing land management decisions.
Hydrological processes in peatlands influence carbon cycling and overall ecosystem health. Studies by Lampert et al. (2020) and Ikkala et al. (2022) focus on monitoring hydrological impacts in peatland ecosystems using UAV remote sensing [118,119]. Lampert et al. (2020) investigated vertical mixing processes and boundary layer methane isotopy using UAV-based sampling to study spatial variability [119]. Ikkala et al. (2022) analysed elevation changes and flow paths in peatland restoration, highlighting the ability of UAV mapping to assess wetness and hydrological impacts. Therefore, they reveal the effectiveness of UAV remote sensing in studying spatial variability and capturing methane emissions [118].
Additionally, Scheller et al. (2022) studied UAV-based methane emission mapping in Arctic terrestrial ecosystems and demonstrated the potential of UAVs in capturing spatial variability and enhancing the research on methane dynamics in peatlands [120]. Ikkala et al. (2022) focus on monitoring the hydrological impacts of peatland restoration using UAV and LiDAR data. They demonstrate that UAV mapping can assess elevation changes, flow paths, and wetness, providing valuable insights into hydrological processes [118].
4.3.3. Assessing Vegetation Structure and Disturbance Impacts
Understanding vegetation structure and the impacts of disturbances is crucial for effective peatland management and conservation. Díaz-Varela et al. (2018) present a methodology for analysing vegetation structure in bog-heathland mosaics using UAV-based imagery [48]. Similarly, the study by Harris and Baird (2019) uses UAV-derived digital surface models to assist in understanding vegetation patterning in recovering blanket peatlands. Their study highlights the value of UAV remote sensing in characterizing complex wetland habitats [121]. Lovitt et al. (2018) evaluate the impacts of low-impact seismic lines on hydrology, methane emissions, and surface morphology in boreal treed bogs. They emphasise the significant impacts of disturbances on peatland ecosystems [32].
4.3.4. Limitations and Challenges
UAV-based remote sensing on peatlands has limitations—for instance, limited spatial and temporal coverage of UAV surveys. The study by Beyer et al. (2019) acknowledges that the extent of UAV mapping is limited compared to satellite-based systems, which can cover larger areas [117]. Similarly, Lendzioch et al. (2021) point out that their study focused on specific locations within a montane peat bog, limiting the generalizability of their findings [122]. The small footprint of UAV surveys and their reliance on favourable weather conditions also restrict the temporal coverage of data collection, as mentioned by Lampert et al. (2020) in [119].
The cost associated with UAV remote sensing can be a significant challenge. Scheller et al. (2022) highlight the cost and technical challenges of using high-precision trace gas analysers in UAV-based methane emission mapping [120]. Moreover, accessing remote and challenging peatland sites for data collection can be difficult, as Díaz-Varela et al. (2018) mentioned in their study on bog-heathland mosaics [48]. These limitations may hinder the widespread application of UAV remote sensing in peatland research.
The processing and analysis of large volumes of remote sensing data can be complex and time-consuming. The study by Ivanov et al. (2021) involves advanced data processing techniques, such as orthophoto plan compilation and structural equation modelling, which require expertise and computational resources [116]. Additionally, Díaz-Varela et al. (2018) mention the need for accurate georeferencing, image overlap, and external control data to ensure data quality and precise analysis [48].
The selection and integration of appropriate sensors and instruments pose technical challenges in UAV remote sensing. Arroyo-Mora et al. (2019) discuss the implementation of a UAV equipped with a hyperspectral system, highlighting the limitations of airborne hyperspectral remote sensing due to its relatively high cost and low temporal resolution compared to satellite platforms [13]. Furthermore, Ikkala et al. (2022) highlight the need for precise georeferencing and control data to ensure accurate elevation measurements using UAV Structure-From-Motion (SfM) [118].
Interpreting and validating UAV remote sensing data can be challenging. Harris and Baird (2019) discuss the importance of ground truth data and the limitations of vertical accuracy in their study on vegetation patterning in recovering blanket peatlands [121]. The authors emphasise the need for continued monitoring and validation of topography and morphology in self-restoring peatlands to enhance the understanding of revegetation processes. Lovitt et al. (2018) also mention the site-specific nature of relationships between vegetation proxies and below-ground C stocks, emphasising the need for further research to assess the generalizability of findings [32].
The relationships between vegetation attributes and C stocks are likely site-specific, depending on geographic location, species composition, and peatland status [123]. Generalising the findings across different landscapes requires further investigation and validation. Furthermore, due to the intricate nature of peatland ecosystems, it is imperative to employ advanced modelling techniques like support vector machines (SVMs) and random forests (RFs) [117,121,124] to effectively capture the complex interplay among canopy reflectance, vegetation attributes, and C gradient variations.
Table 5.
UAV studies, instruments utilised and applications.
| Reference | Peatland Type * | Peatland Status | Dominant Vegetation | UAV | Sensors | Spectral Range | Spatial Resolution | Indices/Products | Applications |
|---|---|---|---|---|---|---|---|---|---|
| [125] | Mire | Disturbed | Betula nana, Empetrum hermaphroditum, Sphagnum spp., Carex spp. | Robota fixed wing | Panasonic Lumix-GM1 | RGB | >1 cm | RGB image | Cover classification map |
| [13] | Peatland | NA | Phragmites australis | Matrice 600 Pro | micro–Compact Airborne Spectrographic Imager (µCASI) | 401–996 | 5 cm | Digital Elevation Model (DEM) | Ecological monitoring |
| [124] | Bog | Disturbed | Eriophorum spp., Calluna vulgaris, Sphagnum spp. | Wingspan Fixed-Wing | Panasonic Lumix DMC-LX7 | RGB | 4.5 cm | RGB image | Mapping and ecological classification |
| [32] | Bog | Disturbed | Picea mariana, Rhododendron groelandicum, Oxycoccus microcarpus, Salix spp., Sphagnum spp. | Aeryon Skyranger | HDZoom30 RGB | RGB | 2 cm | Digital Terrain Model (DTM) | Mapping microtopography and WTD |
| [122] | Bog | NA | Sphagnum spp., Vaccinium myrtillus, Pinus mungo Turra | Mavic Pro, MikroKopter ARF XL | FLIR DUO R dual-sensor RGB/thermal, Tetracam µ-MCA Snap 6 | 750–1350, 550–900 | 3 cm | RGB indices: RGI, VVI, VDVI, VARI, TGI, SI, SHP, SCI, SAT, NGRDI, NDTI, NDI, HI, GRVI, GLI, GLAI, ExG, ERGBVE, CI, BI, RI, HUE, Multispectral: NDVI | Mapping WTD |
| [47] | Bog | Disturbed | Sphagnum spp. | Aeryon Skyranger | Aeryon HDZoom30 | RGB | 2 cm | NA | |
| [120] | Fen | Natural | Dupontia psilosantha, Eriophorum scheuchzeri | Phantom 4 Pro | LI-COR LI-7810 | NA | NA | NA | Methane emission mapping |
| [126] | Peatland | Disturbed | Mosses, sedges, birch, spruce, pine | Fixed-Wing | Canon Powershot SX260, Canon Powershot S100, FLIR Tau 2 TC324 TIR | RGB | 5 cm | BNDVI, NIRGB, TIR | Monitoring the functioning of a treatment peatland purifying mine process effluent water |
| [48] | Bog | NA | Carex spp., Eriophorum angustifolium, Molinia caerulea, Sphagnum spp., Trichophorum cespitosum, Drosera rotundifolia, Juncus squarrosus, Potamogeton polygonifolius, Hypericum helodes, Parnassia palustris | Microdrone MD4-1000 | Olympus E-P1 | RGB | 2.53 cm | Band ratios: Blue/(Red+Blue+Green), Red/(Red+Blue brightness+Green), Green/(Red+Blue+Green), Mean difference to neighbors: Green Layer, DSM | Peatland classification |
| [23] | Bog | Disturbed | Sphagnum spp., Chamaedaphne calyculata, Rhododendron groenlandicum, Kalmia angustifolia, Vaccinium myrtilloides, Picea mariana, Betula populifolia, Larix laricina | Matrice 600 Pro | Canon DSLR (RGB), LiAIR S220 (LiDAR) | ±2 cm | Point Cloud | Peatland mapping | |
| [116] | Bog | Disturbed | Sphagnum cuspidatum, Odontoschisma fluitans, Drosera rotundifolia, Rhynchospora alba, Eriophorum vaginatum, Chamaedaphne calyculata, Andromeda polifolia, Rhododendron tomentosum Harmaja, Vaccinium oxycoccos | Mavic 2 Pro | L1D-20c | RGB | 2.4 cm | NA | |
| [46] | Peatland | Disturbed | bushes, trees | Mavic Pro | RGB Built-in | RGB | 1–3 cm | DSM | |
| [127] | Peatland | Disturbed | tussocky microrelief | NA | NA | NA | NA | NA | Peatland monitoring |
| [128] | Peatland | Natural | NA | Matrice 210 v2 | Zenmuse XT2 | Thermal | NA | NA | |
| [119] | Peatland | Restored | NA | Quadrocopter ALICE | AMSYS 5812-0150-B, TSYS01, Humicap HMP110 | NA | NA | NA | |
| [123] | Bog | Restored | Sphagnum spp., Polytrichum strictum, Calluna vulgaris, Eriophorum vaginatum | eBee SQ | Parrot Sequoia | 440–850 | 4 cm | NDVI | Restoration Monitoring |
| [121] | Bog | Disturbed | Calluna vulgaris, Eriophorum vaginatum, Eriophorum angustifolium, Sphagnum spp. | SenseFly swingletCam | Canon IXUS 220 HS | RGB | Orhtophoto: 2.46 cm, DSM: 20 cm | DSM, Elevation Slope (ELEV SLP), Profile curvature (VCU), Plan curvature (HCU) | |
| [117] | Fen | Restored | Carex spp., Epilobium hirsutum, Juncus effusus, Glyceria maxima, Agrostis stolonifera, Typha latifolia | eBee Plus | RGB senseFly S.O.D.A., Sequoia multispectral, FLIR TAU 2 thermal | Multispectral: 550–790 | RGB: 1.7–1.5, Multispectral: 7.6–7.9, Thermal: 15.1 cm | GI, NDVI, reNDVI, gNDVI | |
| [118] | Fen | Restored | Papillosum, Sphagnum spp. | Phantom 4 Pro/Phantom 4 RTK | RGB Built-in | RGB | 1.2–3.33 cm | DTM |
* Note: In this table, the term “peatland” is used comprehensively to refer to all peatlands considered in the study unless otherwise specified.
4.4. In Situ-Based Remote Sensing
In situ remote sensing techniques have become increasingly valuable in peatland research, providing insights into various aspects of these ecosystems and mainly being used to validate the other measurements using different platforms. Regarding the commonly used sensors or instruments, the acquisition of canopy spectral reflectance in the field has primarily relied on proximal sensing using field spectrometers. This approach has been employed in approximately 75% of all conducted studies. Among the instruments utilised, the Analytical Spectral Devices (ASD, USA) series has emerged as the most used. These instruments operate within the spectral range of 350 to 2500 nm, as exemplified in various instances [129,130] (Table 6).
The potential of utilising the spectral data to distinguish between different Sphagnum species has been a subject of speculation in previous literature. Noted that they differ dramatically in laboratory and field measurements [131]. However, our understanding of intraspecific variation in the spectra of Sphagnum species remains limited. This knowledge gap is due to the relatively small sample sizes employed in prior studies, which often included only a single sample per species or a limited number of species under investigation. Additionally, it is worth noting that the bulk of recent studies investigating the spectral characteristics of Sphagnum, as conducted by Lees et al. (2020), have primarily focused on temperate peatlands [49]. This differs significantly from boreal peatlands, where growing conditions are markedly distinct due to factors such as the duration of the snow-free season and seasonal fluctuations in temperature and solar irradiance when compared to the temperate zone. Furthermore, many in situ peatland vegetation studies have employed sensors that solely capture data within the visible (VIS) and near-infrared (NIR) spectral regions [131,132,133]. Consequently, insights related to species identification and moisture content obtained through shortwave infrared (SWIR) wavelength data have not yet been thoroughly investigated in the context of boreal peatland vegetation.
Several studies [27,129,134] highlight the usefulness of in situ measurements in capturing plot-scale changes in peatland ecosystems. These techniques enable the detection of vegetation productivity, biodiversity, and degradation caused by human activities [135,136,137]. However, it is essential to note that remote sensing data may have limitations in accurately capturing fine-scale details and species-level information, which could be critical for understanding specific ecological dynamics within peatlands.
The assessment of peatland hydrology using remote sensing has been investigated by several researchers [130,133,135]. These studies demonstrate the potential of remote sensing in detecting changes in water table levels and hydrological patterns. Nevertheless, challenges exist in accurately capturing the complexities of peatland hydrology due to the presence of variable water levels and the influence of vegetation on the water regime. Moreover, it was noted that there was a lack of studies focusing on drought investigations despite the availability of the hyperspectral in situ data.
Several studies have focused on the relationship between spectral indices and peatland characteristics [27,50,137,138,139]. These investigations use spectral indices to estimate carbon content, vegetation cover, or ecosystem productivity. However, caution must be exercised in interpreting spectral indices, as multiple factors can influence them, including vegetation composition, atmospheric conditions, and sensor characteristics. Moreover, the transferability and generalizability of spectral indices across different peatland types and regions require further exploration.
Climate change impacts on peatland ecosystems have been examined in several studies [49,131,132,136]. These investigations shed light on shifts in vegetation communities, carbon and methane flux alterations, and peatland structure changes due to climate warming. However, it is essential to consider the complexities of climate-peatland interactions, including feedback mechanisms and the interplay of multiple environmental drivers, which may not be fully captured by remote sensing techniques alone.
Table 6.
In situ studies, instruments utilised and applications.
| Reference | Peatland Type * | Peatland Status | Dominant Vegetation | Instrument | Spectral Range | Indices | Applications |
|---|---|---|---|---|---|---|---|
| [49] | Bog | Near natural, restored | Sphagnum spp. | SVC HR-1024 spectroradiometer | 350–2500 | NDWI, NDVI, EVI, PRI, fWBI, Cim | Estimate water content and GPP |
| [139] | Fen | Natural | Sphagnum spp. | SKR1860 | 531-1240 | NDVI, PRI, WBI, Cigreen | Assess the impact of manipulated environmental conditions on Sphagnum |
| [132] | Peatland | Disturbed | Sphagnum spp. | Decagon Inc, ASD | 630 and 800 | NDVI | Response of boreal peatland community composition and NDVI |
| [136] | Bog | Restored | White beak rush | AMSPEC-III | 522–809 | PRI | Seasonal changes in Light Use Efficiency (LUE) |
| [129] | Fen | NA | Sphagnum spp. | ASD Fieldspec | 350–2500 | WI, FWBI | Subsurface moisture and WTD monitoring |
| [130] | Bog | NA | NA | ASD Fieldspec | 350–2500 | NA | Classifying peatland vegetation |
| [140] | Bog | NA | Sphagnum spp. | “Spectra Vista Corporation (SVC) DC-R/T Integrating Sphere fitted to an HR-1024i spectroradiometer” | 400–2400 | NA | Investigation of nitrogen deposition |
| [27] | Bog | NA | NA | Riegl VZ-1000 | NA | NA | Characterising peatland microtopography |
| [134] | Bog | Disturbed | NA | FARO Focus3D X330 | NA | NA | Assessment of surface change in blanket bogs |
| [138] | Fen | Natural | NA | CM3 pyranometers, Quantum sensors | NA | NDVI | Net Ecosystem Productivity of peatland |
| [135] | Bog | Disturbed | Sphagnum spp. | Canon EOS 5D | RGB | NA | Tracking the plant phenology |
| [137] | Fen | Natural | Carex acutiformis | Spectral Reflectance Sensors | NA | NA | Above- and belowground phenology |
| [50] | Fen | Natural | Sphagnum spp. | Piccolo Doppio | 400–1000 | NDVI, EVI, NIRv | Observing peatland vegetation dynamic |
| [131] | Peatland | Natural | Sphagnum spp. | ASD Fieldspec | 350–2500 | WI, FWBI, CI, NDVI | Explores the relationship between spectral indices and greenhouse gas emissions in northern peatland ecosystems |
| [133] | Fen | Natural | Sphagnum spp., wet brown mosses | ASD Fieldspec | 325–1075 | NA | Detect vegetation characteristics |
* Note: in this table, the term “peatland” is used comprehensively to refer to all peatlands considered in the study unless otherwise specified.
4.5. Multiple Platforms
Incorporating ground-based measurements, field surveys, and integrating multiple data sources can enhance the accuracy and reliability of remote sensing-based assessments. Furthermore, interdisciplinary approaches that combine remote sensing with ecological modelling, biogeochemical analyses, and on-the-ground observations are essential to advance our understanding of peatland ecosystems and their responses to environmental changes. Table 7 includes the studies which combined multiple remote sensing platforms.
4.5.1. Vegetation Dynamics and Phenology
Several studies have explored using combined remote sensing platforms, data or measuring techniques to assess vegetation dynamics and phenology in peatland ecosystems [38,141,142]. Bhatnagar et al. (2021) present an innovative approach to monitoring wetlands, specifically emphasising ombrotrophic peatlands [143]. Their methodology combines machine learning algorithms, satellite data analysis and drone-RGB image processing to generate seasonality maps of vegetation communities across wetland areas [143]. Notably, the authors successfully demonstrate how a limited number of drone images can enhance satellite imagery, improving classification accuracy [143]. This proposed approach stands out as a robust, efficient, and cost-effective method for mapping wetland habitats [143]. However, it is worth noting that while the study offers valuable insights into wetland monitoring, its primary focus is on a particular type of peatland, potentially not accounting for the full range of peatland conditions [143].
Building upon the work of Bhatnagar et al. (2021) in [143], Räsänen et al. (2019, 2020) emphasised the importance of high-resolution imagery in mapping peatland vegetation [30,144]. They compared multiple optical remote-sensing data from satellite imagery, airborne and UAV, for mapping and detecting spatial patterns of vegetation properties in three northern peatland areas. The article highlights the rarity of a universal approach suitable for grouping and mapping peatland vegetation, as the diversity within peatland ecosystems often necessitates tailored methodologies. Therefore, the authors recommended some guidelines for mapping vegetation patterns in peatlands. They suggest that different methods and data sources should be tried and compared to find the best fit for each case and purpose. They also advise that various maps should show different vegetation features and their interactions. They emphasise that each map’s strengths, weaknesses and uncertainties should be clearly stated [30,51].
Moreover, Arroyo-Mora et al. (2018) explored the potential of Sentinel-2A imagery for monitoring phenospectral dynamics, providing valuable insights into the phenological changes of peatland vegetation [141]. However, validation approaches using higher spatial and spectral resolution data, such as airborne hyperspectral imagery (HSI) and in situ measurements, are necessary to improve the accuracy of these satellite-based land products. That is what was concluded by the researchers who utilised three datasets: Sentinel-2A imagery, airborne hyperspectral imagery (HSI), and field spectra [141].
Millard and Richardson (2018) and Räsänen et al. (2020) also focus on vegetation phenology and biomass estimation in peatlands. These studies demonstrate the use of remote sensing data, including hyperspectral drone data and satellite imagery, to estimate vegetation indices, leaf-area index (LAI), and biomass. They emphasise the importance of considering vegetation heterogeneity and microtopographic features when modelling and upscaling peatland characteristics [51,77].
4.5.2. Biomass Estimation
Räsänen et al. (2020) demonstrated the potential of ultra-high-resolution remote sensing data, including hyperspectral drone data, in detecting peatland LAI and biomass patterns. They emphasised the importance of considering multiple remote sensing data sources and combining spectral, topographic, and structural information for accurate vegetation mapping [144]. Although hyperspectral imagery provided only slight benefits in analysing LAI and above-ground biomass patterns, combining spectral data with topographic and structural information is crucial for accurately mapping vegetation patterns in spatially heterogeneous landscapes like northern peatlands [144]. Metzger et al. (2017) highlighted the challenges and limitations of using vegetation indices as proxies for vegetation characteristics in temperate grassland fens, particularly in the context of varying management intensities. LAI was observed to have limited predictive capability for photosynthesis potential (PP) and biomass, as its estimation from NDVI proved inaccurate [38].
While NDVI was found to be a more reliable predictor of PP than LAI, applying NDVI as a proxy for LAI in photosynthesis models should be considered cautiously due to its high uncertainty. Further research and validation studies are needed to improve the understanding and modelling of carbon balance in peatlands [38].
4.5.3. Restoration Monitoring
Monitoring the success of peatland restoration projects is crucial for evaluating ecosystem recovery and carbon assimilation. Lees et al. (2021) modelled GPP through MODIS data and used a handheld spectrometer to obtain small-scale spectral data. They evaluated the models’ reliability for estimating ecosystem photosynthesis in peatlands at different scales. The study aimed to identify the factors influencing GPP in peatland ecosystems and determine if large-scale models utilising satellite data can accurately estimate GPP at smaller scales by comparing the results with field measurements. Their findings showed that the model successfully estimated GPP from remotely sensed data at both small and large scales, and the estimates correlated well with the GPP measured using chamber and Eddy Covariance (EC) techniques.
Additionally, DeLancey et al. (2019) assessed the long-term monitoring capabilities of RADARSAT-2 and UAV imagery for tracking peatland restoration success over time [145]. Likewise, White et al. (2020) studied the potential use of RADARSAT-2 satellite and high-resolution UAV imagery for monitoring the restoration of peatlands. They suggested that RADARSAT-2 data with UAV imagery could be valuable for monitoring peatland restoration success over time despite acknowledging limitations in the study design [15].
4.5.4. Challenges and Future Directions
Validation of remote sensing-based estimations remains a challenge in peatland research. Arroyo-Mora et al. (2018) highlight the need for validation using higher-resolution data, such as airborne hyperspectral imagery (HSI), and in situ measurements to improve accuracy. This is crucial for ensuring reliable and precise estimation of peatland properties [141].
Metzger et al. (2017) emphasise the significance of interdisciplinary collaboration and knowledge integration for comprehensive peatland analysis. They emphasise incorporating ecological and hydrological knowledge with remote sensing technologies. Future research should focus on integrating multiple data sources, including environmental covariates and machine learning algorithms, to enhance the understanding and modelling of peatland ecosystems [38].
Additionally, future research should focus on refining multiple approaches and methodologies, improving calibration techniques, and integrating multi-sensor data to enhance our understanding of peatland ecosystems and their response to global environmental changes. We found that just a few studies have investigated the benefits of hyperspectral drone data compared to other datasets for analysing vegetation patterns in peatlands. Future studies should explore the potential benefits of hyperspectral UAV data in high-resolution estimation of vegetation features and patterns on peatlands. This exploration may enhance not only mapping of vegetation but also the monitoring of peatland restoration efforts.
Table 7.
A summary of the multiple remote sensing platforms.
| Reference | Peatland Type * | Peatland Status | Dominant Vegetation | Active/Passive | Spaceborne | Airborne | UAV | In Situ | Applications |
|---|---|---|---|---|---|---|---|---|---|
| [146] | Bog | Disturbed | Graminoid, Ericeae spp., Sphagnum spp. | Active | ● | ● | Carbon stocks estimation | ||
| [147] | Peatland | Disturbed | Sphagnum spp., Carex spp., shrub | Passive | ● | ● | Characterising peatland plant composition | ||
| [148] | Fen | Natural | Eriophorum vaginatum, Calluna vulgaris and Erica tetralix, Sphagnum spp., Rhyncospora alba. | Passive | ● | ● | Ecosystem respiration modelling and upscaling | ||
| [16] | Bog | Disturbed | Epilobietea angustifolia, Caricetum limosae, Molinio-Arrhenatheretea, Nardo-Callunetea | Mixed | ● | ● | Evaluation of peat extraction | ||
| [141] | Bog | Natural | Sphagnum spp., Typha latifolia | Passive | ● | ● | ● | Evaluation of phenospectral dynamics | |
| [149] | Bog | Natural | Sphagnum spp., Carex spp., Typha latifolia | Passive | ● | ● | Measuring land surface albedo | ||
| [150] | Bog | Disturbed | Picea abies, Pinus sylvestris, Betula pubescens | Mixed | ● | ● | Methane flux measurements | ||
| [151] | Bog | Natural | Sphagnum spp. | Mixed | ● | ● | ● | Peatland mapping | |
| [51] | Fen | Natural | Sphagnum spp., evergreen shrubs | Mixed | ● | ● | ● | ||
| [152] | Peatland | Natural | Betula pubescens, forb and shrub species | Mixed | ● | ● | |||
| [145] | Peatland | Natural | Sphagnum spp. | Mixed | ● | ● | |||
| [18] | Bog | Natural | Sphagnum spp., Typha angustifolia | Passive | ● | ● | Peatland monitoring | ||
| [143] | Bog | Natural | Sphagnum spp. | Passive | ● | ● | |||
| [22] | Bog | Natural | Sphagnum spp., Pleurozium schreberi, Eriophorum sp., Trichophorum germanicum | Active | ● | ● | |||
| [153] | Fen | Disturbed | Sphagnum fuscum, Empetrum nigrum, Andromeda polyfolia, Betula nana, Rubus chamaemorus, Carex spp. | Mixed | ● | ● | |||
| [38] | Fen | Natural | Carex panicea, Anthoxanthum odoratum, Carex vesicaria, Poa trivialis, Alopecurus pratensis | Passive | ● | ● | Peatland management monitoring | ||
| [15] | Bog | Restored | Sphagnum spp. | Mixed | ● | ● | Restoration monitoring | ||
| [154] | Peatland | Disturbed | Sphagnum spp., Picea mariana | Mixed | ● | ● | Soil, moisture monitoring | ||
| [77] | Peatland | Disturbed | Sphagnum spp., Picea mariana | Active | ● | ● | |||
| [155] | Bog | Disturbed | Sphagnum spp. | Mixed | ● | ● | WTD monitoring | ||
| [156] | Bog | Restored | Calluna vulgaris, Eriophorum angustifolium, Cladonia portentosa, Sphagnum capillifolium, Pleurozium schreberi, Trichiophorum germanicum | Passive | ● | ● | Upscaling peatland productivity | ||
| [144] | Fen | Natural | Sphagnum spp. | Mixed | ● | ● | ● | Vegetation mapping | |
| [30] | Fen | Natural | Dwarf shrub, brown moss | Mixed | ● | ● | ● | ||
| [28] | Fen | Natural | Dwarf shrub, brown moss | Mixed | ● | ● | ● | ||
| [142] | Peatland | Natural | Carex spp., Menyanthes trifoliata, Andromeda polifolia, Betula nana, Vaccinium oxycoccos, Sphagnum spp., B. pubescens, Pinus sylvestris | Passive | ● | ● | Vegetation phenology monitoring |
* Note: In this table, the term “peatland” is used comprehensively to refer to all peatlands considered in the study unless otherwise specified. Remote sensing platform differences in northern peatlands. The symbol ● in this table is used to signify the Remote Sensing platforms employed in the study.
5. Comparison of Remote Sensing Platforms applications in Northern Peatlands
It has been perceived as a remarkable remote sensing platform usage shift over the past six years. Table 8 details the proportion of studies and applications of different remote sensing platforms applied in northern peatlands. Satellites, the traditional core of peatland remote sensing, continue to dominate, accounting for 36.5% of studies. This prevalence is attributed to the widespread availability of satellite imagery with high spatial and temporal resolution, enabling efficient mapping and monitoring of extensive peatland areas. Satellites offer cost-effective, large-scale data acquisition, making them ideal for large-scale peatland assessments and monitoring programs.
Nevertheless, their dominance has been challenged by the ascendancy of airborne sensors, which provide higher-resolution imagery, accounting for 20.4% of studies. This utilisation stems from their ability to capture finer details of peatland landscapes, enabling more detailed assessments of vegetation characteristics, land cover, and hydrological patterns. However, the higher operational costs of airborne sensors limit their widespread adoption compared to satellites. Speaking of ultra-high-resolution UAVs, despite their relatively recent development, they have experienced a remarkable rise in popularity, their usage increasing since 2017, accounting for 13.9%. In contrast, in situ sensors, while offering the finest resolution data, remain a niche technology employed in just 11% of studies. Mixed platforms offer a more comprehensive understanding of peatland features by fusing data from disparate sensors, e.g., satellite, airborne, UAV, and in situ, representing a promising approach enabling researchers to gain previously inaccessible insights. They account for 18% of studies. In situ and mixed remote sensing platforms have been used less than satellite and airborne platforms. This is primarily due to their higher cost and logistical complexity. In situ sensors require direct contact with the peatland surface, limiting their applicability to large-scale assessments (raw data extracted from the included articles for this section is in Supplementary Tables S2 and S3).
Figure 4 provides valuable insights into the evolution of research trends from 2017 to 2022 and can guide future research directions. Showing up the trend analysis of the applications over the years, the most common applications of remote sensing for northern peatlands are mapping and monitoring peatland in satellite, mixed and UAV, where it is increasing since 2017, while in airborne and in situ the increasing application is hydrology and vegetation, respectively, notably that UAVs are emerging as a popular tool for restoration and management monitoring purposes. There is an observable gap in studies concentrating on peatland degradation. This area remains underexplored across all platforms, with no studies conducted utilising the airborne, UAV and in situ platforms. Fire dynamics monitoring is another underexplored area, with no studies conducted using the UAV and mixed platforms. There has been a growing interest in using remote sensing to assess carbon fluxes in peatlands, but this is still a relatively unexplored area of research utilising most of the platforms rather than satellites (raw data extracted from the included articles for this section is in the Supplementary Tables S4–S8).
6. Conclusions
Remote sensing approaches hold immense potential to contribute to northern peatlands by providing objective, continuous, and up-to-date information over different scales, from small to large spatial extents (ground-based, UAV, airborne, and satellite remote sensing data from optical, laser, and radar sensors). This paper reviews past and current remote sensing platforms utilised in peatland management. Moreover, it is highlighted that remote sensing has benefits as well as drawbacks, and we endorse a combined approach that employs multiple platforms and techniques to investigate the complexities of peatlands.
The following are the benefits of using remote sensing platforms in peatlands:
- Remote sensing, especially satellite, allows coverage of inaccessible terrain, providing a means to explore and monitor peatland areas that are difficult to access on foot or by traditional field measurements;
- It enables measurements and observations without direct contact with the studied object. This ensures that the physical properties of the peatland are not altered during data collection;
- Remote sensing facilitates upscaling from point scale measurements to larger scales, such as slopes, basins, valleys, or even entire mountain ranges. This capability allows a broader understanding of peatland dynamics and patterns across different spatial extents;
- Radar data, commonly used in remote sensing, provides weather independence. Data acquisition can continue regardless of weather conditions, allowing for consistent monitoring and analysis;
- Remote sensing enables the collection of complete and continuous data records over time from specific locations. This longitudinal data can reveal temporal patterns, changes, and trends in peatland characteristics and dynamics;
- Different sensors can be utilised in remote sensing, each capable of measuring specific physical properties of peatlands. This multi-sensor approach comprehensively explains various aspects, such as vegetation dynamics, hydrological conditions, and subsurface characteristics;
- Remote sensing data archives offer the opportunity to access historical data, allowing researchers to analyse peatland changes over time. By utilising these archives, valuable insights can be gained into long-term trends and transformations.
- The limitations associated with remote sensing in peatland research are as follows:
- Mapping peatland ecological conditions at the appropriate scale is challenging, as peatlands can appear visually homogeneous at moderate spatial resolutions, e.g., in satellite imageries such as MODIS, but display high complexity at finer resolutions, e.g., in drone and airborne imageries;
- The reflectance spectra of peatland vegetation, particularly Sphagnum mosses, can change when the mosses are desiccated, making it challenging to identify species and moisture content accurately using spectral satellite data;
- A comparably small number of studies have proven the concept of using hyperspectral satellite and UAV hyperspectral remote sensing data for peatland research. This indicates a need for further research to establish the effectiveness of remote sensing in this context;
- Acquiring very high spatial resolution remote sensing data can be expensive. The costs of obtaining such data may limit its accessibility and utilisation in peatland research and management applications;
- Remote sensing data with very high spatial resolution typically covers a small swath, resulting in limited coverage of peatland areas. This constraint can hinder the comprehensive assessment and monitoring of more significant peatland regions;
- The temporal resolution of most sensor systems is currently insufficient for practical peatland analysis. The frequency at which data is collected may not adequately capture the temporal dynamics and changes occurring within peatlands;
- In an operational context, where large volumes of data are involved, automated algorithms for peatland analysis become necessary. However, the existing algorithms are primarily designed for optical data, and there is a scarcity of studies focusing on radar data for peatland analysis;
- There is limited availability of field validation data, particularly in inaccessible areas. This limitation hampers the validation and verification of remote sensing-based peatland analysis methods, impeding the reliability of the results;
- Another limitation is the lack of quantitative error assessment methods for manual and automated peatland analysis using remote sensing. Establishing robust measures to assess the accuracy and uncertainty of remote sensing data-derived peatland information is crucial for ensuring the reliability and validity of the findings.
Perspectives for Future Research
Future directions for remote sensing in peatland research and management involve refining approaches and methodologies, improving calibration techniques, and integrating multi-sensor data. The review highlights the need for validation using higher-resolution data, such as satellite and airborne hyperspectral imagery, and in situ measurements to improve the accuracy of remote sensing-based estimations. Incorporating environmental covariates and machine learning algorithms and considering the complexities of peatland ecosystems are crucial for advancing our understanding and modelling of these unique environments. Additionally, further research is needed to address the limitations identified in the review, such as limited spatial and temporal coverage, cost constraints, data processing complexity, sensor selection, interpretation, and validation challenges. Finally, the review underscores the need to explore underutilised applications like peatland degradation and fire dynamics monitoring further to strengthen our understanding of northern peatland dynamics during environmental changes.
Supplementary Materials
The following supporting information can be downloaded at: https://www.mdpi.com/2072-4292/16/3/591/s1, Supplementary Table S1: List of the applications and grouping themes in the systematic literature search for review (for Figure 4); Supplementary Table S2: The total number and percentage of studies that used different remote sensing platforms (such as satellites, airborne, in situ, or mixed sensors) in northern peatlands over the years 2017–2022; Supplementary Table S3: The total number and percentage of studies that applied remote sensing-based applications in northern peatlands over the years 2017–2022; Supplementary Table S4: The total number and percentage of studies that used satellite included in the SLR over the years 2017–2022; Supplementary Table S5: The total number and percentage of studies that used airborne included in the SLR over the years 2017–2022; Supplementary Table S6: The total number and percentage of studies that used UAV included in the SLR over the years 2017–2022; Supplementary Table S7: The total number and percentage of studies that used in situ included in the SLR over the years 2017–2022; Supplementary Table S8: The total number and percentage of studies that used mixed or multiple platforms included in the SLR over the years 2017–2022.
Author Contributions
Conceptualization, data curation, methodology, formal analysis, writing—original draft preparation, A.Y.A.A.; Conceptualization, writing—review and editing, funding acquisition, supervision, R.J. All authors have read and agreed to the published version of the manuscript.
Funding
National Science Centre of Poland: 2020/39/O/ST10/00775.
Acknowledgments
We thank the National Science Centre of Poland (NCN) for funding this research. We sincerely thank the reviewers who provided valuable comments and feedback on our systematic literature review. Their insights and suggestions were instrumental in improving the quality of our work.
Conflicts of Interest
The authors declare no conflicts of interest.
Correction Statement
This article has been republished with a minor correction to resolve spelling and grammatical errors. This change does not affect the scientific content of the article.
References
- Gorham, E. Northern Peatlands: Role in the Carbon Cycle and Probable Responses to Climatic Warming. Ecol. Appl. 1991, 1, 182–195. [Google Scholar] [CrossRef] [PubMed]
- Xu, J.; Morris, P.J.; Liu, J.; Holden, J. PEATMAP: Refining Estimates of Global Peatland Distribution Based on a Meta-Analysis. Catena 2018, 160, 134–140. [Google Scholar] [CrossRef]
- Minasny, B.; Berglund, Ö.; Connolly, J.; Hedley, C.; de Vries, F.; Gimona, A.; Kempen, B.; Kidd, D.; Lilja, H.; Malone, B.; et al. Digital Mapping of Peatlands—A Critical Review. Earth-Sci. Rev. 2019, 196, 102870. [Google Scholar] [CrossRef]
- Guo, M.; Li, J.; Sheng, C.; Xu, J.; Wu, L. A Review of Wetland Remote Sensing. Sensors 2017, 17, 777. [Google Scholar] [CrossRef] [PubMed]
- Mahdianpari, M.; Jafarzadeh, H.; Granger, J.E.; Mohammadimanesh, F.; Brisco, B.; Salehi, B.; Homayouni, S.; Weng, Q. A Large-Scale Change Monitoring of Wetlands Using Time Series Landsat Imagery on Google Earth Engine: A Case Study in Newfoundland. GISci. Remote Sens. 2020, 57, 1102–1124. [Google Scholar] [CrossRef]
- Yu, Z.; Loisel, J.; Brosseau, D.P.; Beilman, D.W.; Hunt, S.J. Global Peatland Dynamics since the Last Glacial Maximum. Geophys. Res. Lett. 2010, 37, L13402. [Google Scholar] [CrossRef]
- Kimmel, K.; Mander, Ü. Ecosystem Services of Peatlands: Implications for Restoration. Prog. Phys. Geogr. 2010, 34, 491–514. [Google Scholar] [CrossRef]
- Antala, M.; Juszczak, R.; van der Tol, C.; Rastogi, A. Impact of Climate Change-Induced Alterations in Peatland Vegetation Phenology and Composition on Carbon Balance. Sci. Total Environ. 2022, 827, 154294. [Google Scholar] [CrossRef]
- Pereira, D.; Mendes, C.; Dias, E. The Potential of Peatlands in Global Climate Change Mitigation: A Case Study of Terceira and Flores Islands (Azores, Portugal) Hydrologic Services. SN Appl. Sci. 2022, 4, 184. [Google Scholar] [CrossRef]
- Belyea, L.R.; Malmer, N. Carbon Sequestration in Peatland: Patterns and Mechanisms of Response to Climate Change. Glob. Change Biol. 2004, 10, 1043–1052. [Google Scholar] [CrossRef]
- Alshammari, L.; Large, D.J.; Boyd, D.S.; Sowter, A.; Anderson, R.; Andersen, R.; Marsh, S. Long-Term Peatland Condition Assessment via Surface Motion Monitoring Using the ISBAS DInSAR Technique over the Flow Country, Scotland. Remote Sens. 2018, 10, 1103. [Google Scholar] [CrossRef]
- Šimanauskienė, R.; Linkevičienė, R.; Bartold, M.; Dąbrowska-Zielińska, K.; Slavinskienė, G.; Veteikis, D.; Taminskas, J. Peatland Degradation: The Relationship between Raised Bog Hydrology and Normalized Difference Vegetation Index. Ecohydrology 2019, 12, e2159. [Google Scholar] [CrossRef]
- Pablo Arroyo-Mora, J.; Kalacska, M.; Inamdar, D.; Soffer, R.; Lucanus, O.; Gorman, J.; Naprstek, T.; Schaaf, E.S.; Ifimov, G.; Elmer, K.; et al. Implementation of a UAV–Hyperspectral Pushbroom Imager for Ecological Monitoring. Drones 2019, 3, 12. [Google Scholar] [CrossRef]
- Torabi Haghighi, A.; Menberu, M.W.; Darabi, H.; Akanegbu, J.; Kløve, B. Use of Remote Sensing to Analyse Peatland Changes after Drainage for Peat Extraction. Land Degrad. Dev. 2018, 29, 3479–3488. [Google Scholar] [CrossRef]
- White, L.; McGovern, M.; Hayne, S.; Touzi, R.; Pasher, J.; Duffe, J. Investigating the Potential Use of RADARSAT-2 and UAS Imagery for Monitoring the Restoration of Peatlands. Remote Sens. 2020, 12, 2383. [Google Scholar] [CrossRef]
- Jucha, W.; Mareczka, P.; Okupny, D. Using Remote Sensing Materials to Assess the Effects of Peat Extraction on the Morphology and Vegetation Cover of a Raised Bog (Ludźmierz near Nowy Targ, Southern Poland). Mires Peat 2020, 26, 1–19. [Google Scholar] [CrossRef]
- Jucha, W.; Mareczka, P.; Okupny, D. Assessment of Peat Extraction Range and Vegetation Succession on the Baligówka Degraded Peat Bog (Central Europe) Using the ALS Data and Orthophotomap. Remote Sens. 2022, 14, 2817. [Google Scholar] [CrossRef]
- Kalacska, M.; Arroyo-Mora, J.P.; Soffer, R.J.; Roulet, N.T.; Moore, T.R.; Humphreys, E.; Leblanc, G.; Lucanus, O.; Inamdar, D. Estimating Peatland Water Table Depth and Net Ecosystem Exchange: A Comparison between Satellite and Airborne Imagery. Remote Sens. 2018, 10, 687. [Google Scholar] [CrossRef]
- Crichton, K.A.; Anderson, K.; Charman, D.J.; Gallego-Sala, A. Seasonal Climate Drivers of Peak NDVI in a Series of Arctic Peatlands. Sci. Total Environ. 2022, 838, 156419. [Google Scholar] [CrossRef]
- Worrall, F.; Howden, N.J.K.; Burt, T.P.; Rico-Ramirez, M.A.; Kohler, T. Local Climate Impacts from Ongoing Restoration of a Peatland. Hydrol. Process. 2022, 36, e14496. [Google Scholar] [CrossRef]
- Bandopadhyay, S.; Rastogi, A.; Juszczak, R. Review of Top-of-Canopy Sun-Induced Fluorescence (Sif) Studies from Ground, Uav, Airborne to Spaceborne Observations. Sensors 2020, 20, 1144. [Google Scholar] [CrossRef]
- Marshall, C.; Sterk, H.P.; Gilbert, P.J.; Andersen, R.; Bradley, A.V.; Sowter, A.; Marsh, S.; Large, D.J. Multiscale Variability and the Comparison of Ground and Satellite Radar Based Measures of Peatland Surface Motion for Peatland Monitoring. Remote Sens. 2022, 14, 336. [Google Scholar] [CrossRef]
- Kalacska, M.; Arroyo-Mora, J.P.; Lucanus, O. Comparing Uas Lidar and Structure-from-Motion Photogrammetry for Peatland Mapping and Virtual Reality (Vr) Visualization. Drones 2021, 5, 36. [Google Scholar] [CrossRef]
- Langlois, M.N.; Richardson, M.C.; Price, J.S. Delineation of Peatland Lagg Boundaries from Airborne LiDAR. J. Geophys. Res. Biogeosci. 2017, 122, 2191–2205. [Google Scholar] [CrossRef]
- Korpela, I.; Haapanen, R.; Korrensalo, A.; Tuittila, E.S.; Vesala, T. Fine-Resolution Mapping of Microforms of a Boreal Bog Using Aerial Images and Waveform-Recording LiDAR. Mires Peat 2020, 26, 3. [Google Scholar] [CrossRef]
- Jones, E.; Chasmer, L.; Devito, K.; Rood, S.; Hopkinson, C. Ecological Impacts of Shortening Fire Return Intervals on Boreal Peatlands and Transition Zones Using Integrated in Situ Field Sampling and Lidar Approaches. Ecohydrology 2022, 15, e2403. [Google Scholar] [CrossRef]
- Graham, J.D.; Glenn, N.F.; Spaete, L.P.; Hanson, P.J. Characterizing Peatland Microtopography Using Gradient and Microform-Based Approaches. Ecosystems 2020, 23, 1464–1480. [Google Scholar] [CrossRef]
- Räsänen, A.; Virtanen, T. Data and Resolution Requirements in Mapping Vegetation in Spatially Heterogeneous Landscapes. Remote Sens. Environ. 2019, 230, 111207. [Google Scholar] [CrossRef]
- Gatis, N.; Luscombe, D.J.; Carless, D.; Parry, L.E.; Fyfe, R.M.; Harrod, T.R.; Brazier, R.E.; Anderson, K. Mapping Upland Peat Depth Using Airborne Radiometric and Lidar Survey Data. Geoderma 2019, 335, 78–87. [Google Scholar] [CrossRef]
- Räsänen, A.; Juutinen, S.; Tuittila, E.S.; Aurela, M.; Virtanen, T. Comparing Ultra-High Spatial Resolution Remote-Sensing Methods in Mapping Peatland Vegetation. J. Veg. Sci. 2019, 30, 1016–1026. [Google Scholar] [CrossRef]
- Bhatnagar, S.; Gill, L.; Regan, S.; Naughton, O.; Johnston, P.; Waldren, S.; Ghosh, B. Mapping Vegetation Communities Inside Wetlands Using Sentinel-2 Imagery in Ireland. Int. J. Appl. Earth Obs. Geoinf. 2020, 88, 102083. [Google Scholar] [CrossRef]
- Lovitt, J.; Rahman, M.M.; Saraswati, S.; McDermid, G.J.; Strack, M.; Xu, B. UAV Remote Sensing Can Reveal the Effects of Low-Impact Seismic Lines on Surface Morphology, Hydrology, and Methane (CH4) Release in a Boreal Treed Bog. J. Geophys. Res. Biogeosciences 2018, 123, 1117–1129. [Google Scholar] [CrossRef]
- Lees, K.J.; Artz, R.R.E.; Chandler, D.; Aspinall, T.; Boulton, C.A.; Buxton, J.; Cowie, N.R.; Lenton, T.M. Using Remote Sensing to Assess Peatland Resilience by Estimating Soil Surface Moisture and Drought Recovery. Sci. Total Environ. 2021, 761, 143312. [Google Scholar] [CrossRef] [PubMed]
- Lees, K.J.; Quaife, T.; Artz, R.R.E.; Khomik, M.; Clark, J.M. Potential for Using Remote Sensing to Estimate Carbon Fluxes across Northern Peatlands—A Review. Sci. Total Environ. 2018, 615, 857–874. [Google Scholar] [CrossRef] [PubMed]
- Toth, C.; Jóźków, G. Remote Sensing Platforms and Sensors: A Survey. ISPRS J. Photogramm. Remote Sens. 2016, 115, 22–36. [Google Scholar] [CrossRef]
- Hemati, M.; Hasanlou, M.; Mahdianpari, M.; Mohammadimanesh, F. A Systematic Review of Landsat Data for Change Detection Applications: 50 Years of Monitoring the Earth. Remote Sens. 2021, 13, 2869. [Google Scholar] [CrossRef]
- Gatis, N.; Anderson, K.; Grand-Clement, E.; Luscombe, D.J.; Hartley, I.P.; Smith, D.; Brazier, R.E. Evaluating MODIS Vegetation Products Using Digital Images for Quantifying Local Peatland CO2 Gas Fluxes. Remote Sens. Ecol. Conserv. 2017, 3, 217–231. [Google Scholar] [CrossRef]
- Metzger, C.M.H.; Heinichen, J.; Eickenscheidt, T.; Drösler, M. Impact of Land-Use Intensity on the Relationships between Vegetation Indices, Photosynthesis and Biomass of Intensively and Extensively Managed Grassland Fens. Grass Forage Sci. 2017, 72, 50–63. [Google Scholar] [CrossRef]
- Amani, M.; Salehi, B.; Mahdavi, S.; Brisco, B. Separability Analysis of Wetlands in Canada Using Multi-Source SAR Data. GISci. Remote Sens. 2019, 56, 1233–1260. [Google Scholar] [CrossRef]
- Sirin, A.; Medvedeva, M.; Maslov, A.; Vozbrannaya, A. Assessing the Land and Vegetation Cover of Abandoned Fire Hazardous and Rewetted Peatlands: Comparing Different Multispectral Satellite Data. Land 2018, 7, 71. [Google Scholar] [CrossRef]
- O’Leary, D.; Brown, C.; Daly, E. Digital Soil Mapping of Peatland Using Airborne Radiometric Data and Supervised Machine Learning—Implication for the Assessment of Carbon Stock. Geoderma 2022, 428, 116086. [Google Scholar] [CrossRef]
- Szporak-Wasilewska, S.; Piórkowski, H.; Ciężkowski, W.; Jarzombkowski, F.; Sławik, Ł.; Kopeć, D. Mapping Alkaline Fens, Transition Mires and Quaking Bogs Using Airborne Hyperspectral and Laser Scanning Data. Remote Sens. 2021, 13, 1504. [Google Scholar] [CrossRef]
- Arroyo-Mora, J.P.; Kalacska, M.; Soffer, R.J.; Moore, T.R.; Roulet, N.T.; Juutinen, S.; Ifimov, G.; Leblanc, G.; Inamdar, D. Airborne Hyperspectral Evaluation of Maximum Gross Photosynthesis, Gravimetricwater Content, and CO2 Uptake Efficiency of the Mer Bleue Ombrotrophic Peatland. Remote Sens. 2018, 10, 565. [Google Scholar] [CrossRef]
- Carless, D.; Luscombe, D.J.; Gatis, N.; Anderson, K.; Brazier, R.E. Mapping Landscape-Scale Peatland Degradation Using Airborne Lidar and Multispectral Data. Landsc. Ecol. 2019, 34, 1329–1345. [Google Scholar] [CrossRef]
- Zhang, Y.; Odeh, I.O.A.; Liu, B.; Wang, X. Subpixel Mapping and Confusion Matrix Analysis of Plant Functional Types in Peatlands Using MESMA Applied to AISA Eagle Imagery. J. Appl. Remote Sens. 2018, 12, 1. [Google Scholar] [CrossRef]
- Czapiewski, S. Assessment of the Applicability of UAV for the Creation of Digital Surface Model of a Small Peatland. Front. Earth Sci. 2022, 10, 834923. [Google Scholar] [CrossRef]
- Rahman, M.M.; McDermid, G.J.; Strack, M.; Lovitt, J. A New Method to Map Groundwater Table in Peatlands Using Unmanned Aerial Vehicles. Remote Sens. 2017, 9, 1057. [Google Scholar] [CrossRef]
- Díaz-Varela, R.A.; Calvo Iglesias, S.; Cillero Castro, C.; Díaz Varela, E.R. Sub-Metric Analisis of Vegetation Structure in Bog-Heathland Mosaics Using Very High Resolution Rpas Imagery. Ecol. Indic. 2018, 89, 861–873. [Google Scholar] [CrossRef]
- Lees, K.J.; Lees, K.J.; Artz, R.R.E.; Khomik, M.; Clark, J.M.; Ritson, J.; Hancock, M.H.; Cowie, N.R.; Quaife, T. Using Spectral Indices to Estimate Water Content and GPP in Sphagnum Moss and Other Peatland Vegetation. IEEE Trans. Geosci. Remote Sens. 2020, 58, 4547–4557. [Google Scholar] [CrossRef]
- Rastogi, A.; Antala, M.; Prikaziuk, E.; Yang, P.; van der Tol, C.; Juszczak, R. Exploring the Potential of SCOPE Model for Detection of Leaf Area Index and Sun-Induced Fluorescence of Peatland Canopy. Remote Sens. 2022, 14, 4010. [Google Scholar] [CrossRef]
- Räsänen, A.; Aurela, M.; Juutinen, S.; Kumpula, T.; Lohila, A.; Penttilä, T.; Virtanen, T. Detecting Northern Peatland Vegetation Patterns at Ultra-High Spatial Resolution. Remote Sens. Ecol. Conserv. 2020, 6, 457–471. [Google Scholar] [CrossRef]
- Czapiewski, S.; Szumińska, D. An Overview of Remote Sensing Data Applications in Peatland Research Based on Works from the Period 2010–2021. Land 2022, 11, 24. [Google Scholar] [CrossRef]
- Dronova, I.; Kislik, C.; Dinh, Z.; Kelly, M. A Review of Unoccupied Aerial Vehicle Use in Wetland Applications: Emerging Opportunities in Approach, Technology, and Data. Drones 2021, 5, 45. [Google Scholar] [CrossRef]
- Mirmazloumi, S.M.; Moghimi, A.; Ranjgar, B.; Mohseni, F.; Ghorbanian, A.; Ahmadi, S.A.; Amani, M.; Brisco, B. Status and Trends of Wetland Studies in Canada Using Remote Sensing Technology with a Focus on Wetland Classification: A Bibliographic Analysis. Remote Sens. 2021, 13, 4025. [Google Scholar] [CrossRef]
- Moher, D.; Liberati, A.; Tetzlaff, J.; Altman, D.G.; Antes, G.; Atkins, D.; Barbour, V.; Barrowman, N.; Berlin, J.A.; Clark, J.; et al. Preferred Reporting Items for Systematic Reviews and Meta-Analyses: The PRISMA Statement. PLoS Med. 2009, 6, e1000097. [Google Scholar] [CrossRef] [PubMed]
- Pickering, C.; Byrne, J. The Benefits of Publishing Systematic Quantitative Literature Reviews for PhD Candidates and Other Early-Career Researchers. High. Educ. Res. Dev. 2014, 33, 534–548. [Google Scholar] [CrossRef]
- Clarivate Journal Citation Reports: Reference Guide. J. Cit. Rep. 2023, 10–23.
- Sirin, A.A.; Medvedeva, M.A.; Makarov, D.A.; Maslov, A.A.; Joosten, H. Multispectral Satellite Based Monitoring of Land Cover Change and Associated Fire Reduction after Large-Scale Peatland Rewetting Following the 2010 Peat Fires in Moscow Region (Russia). Ecol. Eng. 2020, 158, 106044. [Google Scholar] [CrossRef]
- Artz, R.R.E.; Johnson, S.; Bruneau, P.; Britton, A.J.; Mitchell, R.J.; Ross, L.; Donaldson-Selby, G.; Donnelly, D.; Aitkenhead, M.J.; Gimona, A.; et al. The Potential for Modelling Peatland Habitat Condition in Scotland Using Long-Term MODIS Data. Sci. Total Environ. 2019, 660, 429–442. [Google Scholar] [CrossRef]
- Alshammari, L.; Boyd, D.S.; Sowter, A.; Marshall, C.; Andersen, R.; Gilbert, P.; Marsh, S.; Large, D.J. Use of Surface Motion Characteristics Determined by InSAR to Assess Peatland Condition. J. Geophys. Res. Biogeosci. 2020, 125, e2018JG004953. [Google Scholar] [CrossRef]
- Bradley, A.V.; Andersen, R.; Marshall, C.; Sowter, A.; Large, D.J. Identification of Typical Ecohydrological Behaviours Using InSAR Allows Landscape-Scale Mapping of Peatland Condition. Earth Surf. Dyn. 2022, 10, 261–277. [Google Scholar] [CrossRef]
- Gatis, N.; Grand-Clement, E.; Luscombe, D.J.; Hartley, I.P.; Anderson, K.; Brazier, R.E. Growing Season CO2 Fluxes from a Drained Peatland Dominated by Molinia Caerulea. Mires Peat 2019, 24, 1–16. [Google Scholar] [CrossRef]
- Junttila, S.; Kelly, J.; Kljun, N.; Aurela, M.; Klemedtsson, L.; Lohila, A.; Nilsson, M.B.; Rinne, J.; Tuittila, E.S.; Vestin, P.; et al. Upscaling Northern Peatland Co2 Fluxes Using Satellite Remote Sensing Data. Remote Sens. 2021, 13, 818. [Google Scholar] [CrossRef]
- Lees, K.J.; Quaife, T.; Artz, R.R.E.; Khomik, M.; Sottocornola, M.; Kiely, G.; Hambley, G.; Hill, T.; Saunders, M.; Cowie, N.R.; et al. A Model of Gross Primary Productivity Based on Satellite Data Suggests Formerly Afforested Peatlands Undergoing Restoration Regain Full Photosynthesis Capacity after Five to Ten Years. J. Environ. Manag. 2019, 246, 594–604. [Google Scholar] [CrossRef] [PubMed]
- Judah, A.; Hu, B. The Integration of Multi-Source Remotely-Sensed Data in Support of the Classification of Wetlands. Remote Sens. 2019, 11, 1537. [Google Scholar] [CrossRef]
- Jamali, A.; Mahdianpari, M.; Mohammadimanesh, F.; Brisco, B.; Salehi, B. A Synergic Use of Sentinel-1 and Sentinel-2 Imagery for Complex Wetland Classification Using Generative Adversarial Network (Gan) Scheme. Water 2021, 13, 3601. [Google Scholar] [CrossRef]
- Dyukarev, E.A.; Alekseeva, M.N.; Golovatskaya, E.A. Study of Wetland Ecosystem Vegetation Using Satellite Data. Izv.-Atmos. Ocean. Phys. 2017, 53, 1029–1041. [Google Scholar] [CrossRef]
- Jamali, A.; Mahdianpari, M.; Brisco, B.; Granger, J.; Mohammadimanesh, F.; Salehi, B. Comparing Solo versus Ensemble Convolutional Neural Networks for Wetland Classification Using Multi-Spectral Satellite Imagery. Remote Sens. 2021, 13, 2046. [Google Scholar] [CrossRef]
- Millard, K.; Kirby, P.; Nandlall, S.; Behnamian, A.; Banks, S.; Pacini, F. Using Growing-Season Time Series Coherence for Improved Peatland Mapping: Comparing the Contributions of Sentinel-1 and RADARSAT-2 Coherence in Full and Partial Time Series. Remote Sens. 2020, 12, 2465. [Google Scholar] [CrossRef]
- Pang, Y.; Huang, Y.; He, L.; Zhou, Y.; Sui, J.; Xu, J. Remote Sensing Phenology of Two Chinese Northern Sphagnum Bogs under Climate Drivers during 2001 and 2018. Ecol. Indic. 2021, 129, 107968. [Google Scholar] [CrossRef]
- Räsänen, A.; Juutinen, S.; Aurela, M.; Virtanen, T. Predicting Aboveground Biomass in Arctic Landscapes Using Very High Spatial Resolution Satellite Imagery and Field Sampling. Int. J. Remote Sens. 2019, 40, 1175–1199. [Google Scholar] [CrossRef]
- Helbig, M.; Humphreys, E.R.; Todd, A. Contrasting Temperature Sensitivity of CO2 Exchange in Peatlands of the Hudson Bay Lowlands, Canada. J. Geophys. Res. Biogeosci. 2019, 124, 2126–2143. [Google Scholar] [CrossRef]
- Parmentier, F.J.W.; Rasse, D.P.; Lund, M.; Bjerke, J.W.; Drake, B.G.; Weldon, S.; Tømmervik, H.; Hansen, G.H. Vulnerability and Resilience of the Carbon Exchange of a Subarctic Peatland to an Extreme Winter Event. Environ. Res. Lett. 2018, 13, 065009. [Google Scholar] [CrossRef]
- Medvedeva, M.A.; Vozbrannaya, A.E.; Sirin, A.A.; Maslov, A.A. Capabilities of Multispectral Satellite Data in an Assessment of the Status of Abandoned Fire Hazardous and Rewetting Peat Extraction Lands. Izv.-Atmos. Ocean. Phys. 2017, 53, 1072–1080. [Google Scholar] [CrossRef]
- Räsänen, A.; Tolvanen, A.; Kareksela, S. Monitoring Peatland Water Table Depth with Optical and Radar Satellite Imagery. Int. J. Appl. Earth Obs. Geoinf. 2022, 112, 102866. [Google Scholar] [CrossRef]
- Bechtold, M.; Schlaffer, S.; Tiemeyer, B.; De Lannoy, G. Inferring Water Table Depth Dynamics from ENVISAT-ASAR C-Band Backscatter over a Range of Peatlands from Deeply-Drained to Natural Conditions. Remote Sens. 2018, 10, 536. [Google Scholar] [CrossRef]
- Millard, K.; Richardson, M. Quantifying the Relative Contributions of Vegetation and Soil Moisture Conditions to Polarimetric C-Band SAR Response in a Temperate Peatland. Remote Sens. Environ. 2018, 206, 123–138. [Google Scholar] [CrossRef]
- Asmuß, T.; Bechtold, M.; Tiemeyer, B. On the Potential of Sentinel-1 for High Resolution Monitoring of Water Table Dynamics in Grasslands on Organic Soils. Remote Sens. 2019, 11, 1659. [Google Scholar] [CrossRef]
- Millard, K.; Darling, S.; Pelletier, N.; Schultz, S. Seasonally-Decomposed Sentinel-1 Backscatter Time-Series Are Useful Indicators of Peatland Wildfire Vulnerability. Remote Sens. Environ. 2022, 283, 113329. [Google Scholar] [CrossRef]
- Burdun, I.; Bechtold, M.; Sagris, V.; Komisarenko, V.; De Lannoy, G.; Mander, Ü. A Comparison of Three Trapezoid Models Using Optical and Thermal Satellite Imagery for Water Table Depth Monitoring in Estonian Bogs. Remote Sens. 2020, 12, 1980. [Google Scholar] [CrossRef]
- Burdun, I.; Bechtold, M.; Sagris, V.; Lohila, A.; Humphreys, E.; Desai, A.R.; Nilsson, M.B.; De Lannoy, G.; Mander, Ü. Satellite Determination of Peatland Water Table Temporal Dynamics by Localizing Representative Pixels of A SWIR-Based Moisture Index. Remote Sens. 2020, 12, 2936. [Google Scholar] [CrossRef]
- Krzepek, K.; Schmidt, J.; Iwaszczuk, D. Fusion of SAR and Multi-Spectral Time Series for Determination of Water Table Depth and Lake Area in Peatlands. PFG-J. Photogramm. Remote Sens. Geoinf. Sci. 2022, 90, 561–575. [Google Scholar] [CrossRef]
- Franklin, S.E.; Skeries, E.M.; Stefanuk, M.A.; Ahmed, O.S. Wetland Classification Using Radarsat-2 SAR Quad-Polarization and Landsat-8 OLI Spectral Response Data: A Case Study in the Hudson Bay Lowlands Ecoregion. Int. J. Remote Sens. 2018, 39, 1615–1627. [Google Scholar] [CrossRef]
- Gatis, N.; Benaud, P.; Ashe, J.; Luscombe, D.J.; Grand-Clement, E.; Hartley, I.P.; Anderson, K.; Brazier, R.E. Assessing the Impact of Peat Erosion on Growing Season CO2 Fluxes by Comparing Erosional Peat Pans and Surrounding Vegetated Haggs. Wetl. Ecol. Manag. 2019, 27, 187–205. [Google Scholar] [CrossRef]
- Dearborn, K.D.; Baltzer, J.L. Unexpected Greening in a Boreal Permafrost Peatland Undergoing Forest Loss Is Partially Attributable to Tree Species Turnover. Glob. Change Biol. 2021, 27, 2867–2882. [Google Scholar] [CrossRef] [PubMed]
- Tampuu, T.; Praks, J.; Uiboupin, R.; Kull, A. Long Term Interferometric Temporal Coherence and DInSAR Phase in Northern Peatlands. Remote Sens. 2020, 12, 1566. [Google Scholar] [CrossRef]
- Connolly, J.; Holden, N.M. Detecting Peatland Drains with Object Based Image Analysis and Geoeye-1 Imagery. Carbon Balance Manag. 2017, 12, 7. [Google Scholar] [CrossRef] [PubMed]
- Bourgeau-Chavez, L.L.; Endres, S.; Powell, R.; Battaglia, M.J.; Benscoter, B.; Turetsky, M.; Kasischke, E.S.; Banda, E. Mapping Boreal Peatland Ecosystem Types from Multitemporal Radar and Optical Satellite Imagery. Can. J. For. Res. 2017, 47, 545–559. [Google Scholar] [CrossRef]
- Khan, A.; Said, A.; Ullah, I. Landsat Based Distribution Mapping of High-Altitude Peatlands in Hindu Kush Himalayas—A Case Study of Broghil Valley, Pakistan. J. Mt. Sci. 2020, 17, 42–49. [Google Scholar] [CrossRef]
- Amani, M.; Poncos, V.; Brisco, B.; Foroughnia, F.; Delancey, E.R.; Ranjbar, S. Insar Coherence Analysis for Wetlands in Alberta, Canada Using Time-Series Sentinel-1 Data. Remote Sens. 2021, 13, 3315. [Google Scholar] [CrossRef]
- Jamali, A.; Mahdianpari, M.; Brisco, B.; Granger, J.; Mohammadimanesh, F.; Salehi, B. Wetland Mapping Using Multi-Spectral Satellite Imagery and Deep Convolutional Neural Networks: A Case Study in Newfoundland and Labrador, Canada. Can. J. Remote Sens. 2021, 47, 243–260. [Google Scholar] [CrossRef]
- Burdun, I.; Sagris, V.; Mander, Ü. Relationships between Field-Measured Hydrometeorological Variables and Satellite-Based Land Surface Temperature in a Hemiboreal Raised Bog. Int. J. Appl. Earth Obs. Geoinf. 2019, 74, 295–301. [Google Scholar] [CrossRef]
- Tampuu, T.; Praks, J.; Kull, A.; Uiboupin, R.; Tamm, T.; Voormansik, K. Detecting Peat Extraction Related Activity with Multi-Temporal Sentinel-1 InSAR Coherence Time Series. Int. J. Appl. Earth Obs. Geoinf. 2021, 98, 102309. [Google Scholar] [CrossRef]
- Dąbrowska-Zielińska, K.; Misiura, K.; Malińska, A.; Gurdak, R.; Grzybowski, P.; Bartold, M.; Kluczek, M. Spatiotemporal Estimation of Gross Primary Production for Terrestrial Wetlands Using Satellite and Field Data. Remote Sens. Appl. Soc. Environ. 2022, 27. [Google Scholar] [CrossRef]
- Harenda, K.M.; Markowicz, K.M.; Poczta, P.; Stachlewska, I.S.; Bojanowski, J.S.; Czernecki, B.; McArthur, A.; Schütemeyer, D.; Chojnicki, B.H. Estimation of the Effects of Aerosol Optical Properties on Peatland Production in Rzecin, Poland. Agric. For. Meteorol. 2022, 316, 108861. [Google Scholar] [CrossRef]
- Worrall, F.; Boothroyd, I.M.; Gardner, R.L.; Howden, N.J.K.; Burt, T.P.; Smith, R.; Mitchell, L.; Kohler, T.; Gregg, R. The Impact of Peatland Restoration on Local Climate: Restoration of a Cool Humid Island. J. Geophys. Res. Biogeosci. 2019, 124, 1696–1713. [Google Scholar] [CrossRef]
- D’Acunha, B.; Lee, S.C.; Johnson, M.S. Ecohydrological Responses to Rewetting of a Highly Impacted Raised Bog Ecosystem. Ecohydrology 2018, 11, e1922. [Google Scholar] [CrossRef]
- Exler, J.L.; Moore, R.D. Quantifying Throughfall, Stemflow and Interception Loss in Five Vegetation Communities in a Maritime Raised Bog. Agric. For. Meteorol. 2022, 327, 109202. [Google Scholar] [CrossRef]
- Mirosław-Świątek, D.; Kiczko, A.; Szporak-Wasilewska, S.; Grygoruk, M. Too Wet and Too Dry? Uncertainty of DEM as a Potential Source of Significant Errors in a Model-Based Water Level Assessment in Riparian and Mire Ecosystems. Wetl. Ecol. Manag. 2017, 25, 547–562. [Google Scholar] [CrossRef]
- Chasmer, L.; Hopkinson, C. Threshold Loss of Discontinuous Permafrost and Landscape Evolution. Glob. Change Biol. 2017, 23, 2672–2686. [Google Scholar] [CrossRef]
- Boaga, J.; Viezzoli, A.; Cassiani, G.; Deidda, G.P.; Tosi, L.; Silvestri, S. Resolving the Thickness of Peat Deposits with Contact-Less Electromagnetic Methods: A Case Study in the Venice Coastland. Sci. Total Environ. 2020, 737, 139361. [Google Scholar] [CrossRef] [PubMed]
- Ågren, A.M.; Hasselquist, E.M.; Stendahl, J.; Nilsson, M.B.; Paul, S.S. Delineating the Distribution of Mineral and Peat Soils at the Landscape Scale in Northern Boreal Regions. Soil 2022, 8, 733–749. [Google Scholar] [CrossRef]
- Soffer, R.J.; Ifimov, G.; Arroyo-Mora, J.P.; Kalacska, M. Validation of Airborne Hyperspectral Imagery from Laboratory Panel Characterization to Image Quality Assessment: Implications for an Arctic Peatland Surrogate Simulation Site. Can. J. Remote Sens. 2019, 45, 476–508. [Google Scholar] [CrossRef]
- Siemon, B.; Ibs-von Seht, M.; Frank, S. Airborne Electromagnetic and Radiometric Peat Thickness Mapping of a Bog in Northwest Germany (Ahlen-Falkenberger Moor). Remote Sens. 2020, 12, 203. [Google Scholar] [CrossRef]
- Barker, P.A.; Allen, G.; Pitt, J.R.; Bauguitte, S.J.B.; Pasternak, D.; Cliff, S.; France, J.L.; Fisher, R.E.; Lee, J.D.; Bower, K.N.; et al. Airborne Quantification of Net Methane and Carbon Dioxide Fluxes from European Arctic Wetlands in Summer 2019. Philos. Trans. R. Soc. A Math. Phys. Eng. Sci. 2022, 380. [Google Scholar] [CrossRef] [PubMed]
- Rocchio, F.J.; Gage, E.; Ramm-Granberg, T.; Borkenhagen, A.K.; Cooper, D.J. Ecohydrological Characteristics of a Newly Identified Coastal Raised Bog on the Western Olympic Peninsula, Washington State, USA. Ecohydrology 2021, 14, e2287. [Google Scholar] [CrossRef]
- Elmes, M.C.; Davidson, S.J.; Price, J.S. Ecohydrological Interactions in a Boreal Fen–Swamp Complex, Alberta, Canada. Ecohydrology 2021, 14, e2335. [Google Scholar] [CrossRef]
- Chasmer, L.E.; Hopkinson, C.D.; Petrone, R.M.; Sitar, M. Using Multitemporal and Multispectral Airborne Lidar to Assess Depth of Peat Loss and Correspondence With a New Active Normalized Burn Ratio for Wildfires. Geophys. Res. Lett. 2017, 44, 11851–11859. [Google Scholar] [CrossRef]
- Hancock, M.H.; England, B.; Cowie, N.R. Knockfin Heights: A High-Altitude Flow Country Peatland Showing Extensive Erosion of Uncertain Origin. Mires Peat 2018, 23, 1–20. [Google Scholar] [CrossRef]
- Krause, L.; McCullough, K.J.; Kane, E.S.; Kolka, R.K.; Chimner, R.A.; Lilleskov, E.A. Impacts of Historical Ditching on Peat Volume and Carbon in Northern Minnesota USA Peatlands. J. Environ. Manag. 2021, 296, 113090. [Google Scholar] [CrossRef]
- Enayetullah, H.; Chasmer, L.; Hopkinson, C.; Thompson, D.; Cobbaert, D. Identifying Conifer Tree vs. Deciduous Shrub and Tree Regeneration Trajectories in a Space-for-Time Boreal Peatland Fire Chronosequence Using Multispectral Lidar. Atmosphere 2022, 13, 112. [Google Scholar] [CrossRef]
- Inamdar, D.; Kalacska, M.; Leblanc, G.; Arroyo-Mora, J.P. Characterizing and Mitigating Sensor Generated Spatial Correlations in Airborne Hyperspectral Imaging Data. Remote Sens. 2020, 12, 641. [Google Scholar] [CrossRef]
- Bandopadhyay, S.; Rastogi, A.; Rascher, U.; Rademske, P.; Schickling, A.; Cogliati, S.; Julitta, T.; Mac Arthur, A.; Hueni, A.; Tomelleri, E.; et al. Hyplant-Derived Sun-Induced Fluorescence-A New Opportunity to Disentangle Complex Vegetation Signals from Diverse Vegetation Types. Remote Sens. 2019, 11, 1691. [Google Scholar] [CrossRef]
- Bandopadhyay, S.; Rastogi, A.; Cogliati, S.; Rascher, U.; Gąbka, M.; Juszczak, R. Can Vegetation Indices Serve as Proxies for Potential Sun-Induced Fluorescence (SIF)? A Fuzzy Simulation Approach on Airborne Imaging Spectroscopy Data. Remote Sens. 2021, 13, 2545. [Google Scholar] [CrossRef]
- Kattenborn, T.; Fassnacht, F.E.; Pierce, S.; Lopatin, J.; Grime, J.P.; Schmidtlein, S. Linking Plant Strategies and Plant Traits Derived by Radiative Transfer Modelling. J. Veg. Sci. 2017, 28, 717–727. [Google Scholar] [CrossRef]
- Ivanov, D.G.; Kotlov, I.P.; Minayeva, T.Y.; Kurbatova, J.A. Estimation of Carbon Dioxide Fluxes on a Ridge-Hollow Bog Complex Using a High Resolution Orthophotoplan. Nat. Conserv. Res. 2021, 6, 16–28. [Google Scholar] [CrossRef]
- Beyer, F.; Jurasinski, G.; Couwenberg, J.; Grenzdörffer, G. Multisensor Data to Derive Peatland Vegetation Communities Using a Fixed-Wing Unmanned Aerial Vehicle. Int. J. Remote Sens. 2019, 40, 9103–9125. [Google Scholar] [CrossRef]
- Ikkala, L.; Ronkanen, A.K.; Ilmonen, J.; Similä, M.; Rehell, S.; Kumpula, T.; Päkkilä, L.; Klöve, B.; Marttila, H. Unmanned Aircraft System (UAS) Structure-From-Motion (SfM) for Monitoring the Changed Flow Paths and Wetness in Minerotrophic Peatland Restoration. Remote Sens. 2022, 14, 3169. [Google Scholar] [CrossRef]
- Lampert, A.; Pätzold, F.; Asmussen, M.O.; Lobitz, L.; Krüger, T.; Rausch, T.; Sachs, T.; Wille, C.; Sotomayor Zakharov, D.; Gaus, D.; et al. Studying Boundary Layer Methane Isotopy and Vertical Mixing Processes at a Rewetted Peatland Site Using an Unmanned Aircraft System. Atmos. Meas. Tech. 2020, 13, 1937–1952. [Google Scholar] [CrossRef]
- Scheller, J.H.; Mastepanov, M.; Christensen, T.R. Toward UAV-Based Methane Emission Mapping of Arctic Terrestrial Ecosystems. Sci. Total Environ. 2022, 819, 153161. [Google Scholar] [CrossRef]
- Harris, A.; Baird, A.J. Microtopographic Drivers of Vegetation Patterning in Blanket Peatlands Recovering from Erosion. Ecosystems 2019, 22, 1035–1054. [Google Scholar] [CrossRef]
- Lendzioch, T.; Langhammer, J.; Vlček, L.; Minařík, R. Mapping the Groundwater Level and Soil Moisture of a Montane Peat Bog Using Uav Monitoring and Machine Learning. Remote Sens. 2021, 13, 907. [Google Scholar] [CrossRef]
- Purre, A.H.; Pajula, R.; Ilomets, M. Carbon Dioxide Sink Function in Restored Milled Peatlands—The Significance of Weather and Vegetation. Geoderma 2019, 346, 30–42. [Google Scholar] [CrossRef]
- Scholefield, P.; Morton, D.; McShane, G.; Carrasco, L.; Whitfield, M.G.; Rowland, C.; Rose, R.; Wood, C.; Tebbs, E.; Dodd, B.; et al. Estimating Habitat Extent and Carbon Loss from an Eroded Northern Blanket Bog Using UAV Derived Imagery and Topography. Prog. Phys. Geogr. 2019, 43, 282–298. [Google Scholar] [CrossRef]
- Palace, M.; Herrick, C.; DelGreco, J.; Finnell, D.; Garnello, A.J.; McCalley, C.; McArthur, K.; Sullivan, F.; Varner, R.K. Determining Subarctic Peatland Vegetation Using an Unmanned Aerial System (UAS). Remote Sens. 2018, 10, 1498. [Google Scholar] [CrossRef]
- Isokangas, E.; Davids, C.; Kujala, K.; Rauhala, A.; Ronkanen, A.K.; Rossi, P.M. Combining Unmanned Aerial Vehicle-Based Remote Sensing and Stable Water Isotope Analysis to Monitor Treatment Peatlands of Mining Areas. Ecol. Eng. 2019, 133, 137–147. [Google Scholar] [CrossRef]
- Koroleva, E.S.; Khairullin, R.R.; Babkina, E.A.; Slagoda, E.A.; Khomutov, A.V.; Melnikov, V.P.; Babkin, E.M.; Tikhonravova, Y.V. Seasonal Thawing Local Changes Indicators for UAV-Based Cryolithozone Mapping. Dokl. Earth Sci. 2020, 491, 179–182. [Google Scholar] [CrossRef]
- Alekseychik, P.; Katul, G.; Korpela, I.; Launiainen, S. Eddies in Motion: Visualizing Boundary-Layer Turbulence above an Open Boreal Peatland Using UAS Thermal Videos. Atmos. Meas. Tech. 2021, 14, 3501–3521. [Google Scholar] [CrossRef]
- Banskota, A.; Falkowski, M.J.; Smith, A.M.S.; Kane, E.S.; Meingast, K.M.; Bourgeau-Chavez, L.L.; Miller, M.E.; French, N.H. Continuous Wavelet Analysis for Spectroscopic Determination of Subsurface Moisture and Water-Table Height in Northern Peatland Ecosystems. IEEE Trans. Geosci. Remote Sens. 2017, 55, 1526–1536. [Google Scholar] [CrossRef]
- Erudel, T.; Fabre, S.; Houet, T.; Mazier, F.; Briottet, X. Criteria Comparison for Classifying Peatland Vegetation Types Using In Situ Hyperspectral Measurements. Remote Sens. 2017, 9, 748. [Google Scholar] [CrossRef]
- Tucker, C.; O’Neill, A.; Meingast, K.; Bourgeau-Chavez, L.; Lilleskov, E.; Kane, E.S. Spectral Indices of Vegetation Condition and Soil Water Content Reflect Controls on CH4 and CO2 Exchange in Sphagnum-Dominated Northern Peatlands. J. Geophys. Res. Biogeosci. 2022, 127. [Google Scholar] [CrossRef]
- McPartland, M.Y.; Kane, E.S.; Falkowski, M.J.; Kolka, R.; Turetsky, M.R.; Palik, B.; Montgomery, R.A. The Response of Boreal Peatland Community Composition and NDVI to Hydrologic Change, Warming, and Elevated Carbon Dioxide. Glob. Change Biol. 2019, 25, 93–107. [Google Scholar] [CrossRef] [PubMed]
- Pang, Y.; Räsänen, A.; Lindholm, V.; Aurela, M.; Virtanen, T. Detecting Peatland Vegetation Patterns with Multi-Temporal Field Spectroscopy. GISci. Remote Sens. 2022, 59, 2111–2126. [Google Scholar] [CrossRef]
- Chico, G.; Clutterbuck, B.; Midgley, N.G.; Labadz, J. Application of Terrestrial Laser Scanning to Quantify Surface Changes in Restored and Degraded Blanket Bogs. Mires Peat 2019, 24, 1–24. [Google Scholar] [CrossRef]
- Lang, M.; Nilson, T.; Kuusk, A.; Pisek, J.; Korhonen, L.; Uri, V. Digital Photography for Tracking the Phenology of an Evergreen Conifer Stand. Agric. For. Meteorol. 2017, 246, 15–21. [Google Scholar] [CrossRef]
- Tortini, R.; Coops, N.C.; Nesic, Z.; Christen, A.; Lee, S.C.; Hilker, T. Remote Sensing of Seasonal Light Use Efficiency in Temperate Bog Ecosystems. Sci. Rep. 2017, 7, 8563. [Google Scholar] [CrossRef] [PubMed]
- Schwieger, S.; Blume-Werry, G.; Peters, B.; Smiljanić, M.; Kreyling, J. Patterns and Drivers in Spring and Autumn Phenology Differ Above- and Belowground in Four Ecosystems under the Same Macroclimatic Conditions. Plant Soil 2019, 445, 217–229. [Google Scholar] [CrossRef]
- Harenda, K.M.; Samson, M.; Juszczak, R.; Markowicz, K.M.; Stachlewska, I.S.; Kleniewska, M.; Macarthur, A.; Schüttemeyer, D.; Chojnicki, B.H. Impact of Atmospheric Optical Properties on Net Ecosystem Productivity of Peatland in Poland. Remote Sens. 2021, 13, 2124. [Google Scholar] [CrossRef]
- Rastogi, A.; Stróżecki, M.; Kalaji, H.M.; Łuców, D.; Lamentowicz, M.; Juszczak, R. Impact of Warming and Reduced Precipitation on Photosynthetic and Remote Sensing Properties of Peatland Vegetation. Environ. Exp. Bot. 2019, 160, 71–80. [Google Scholar] [CrossRef]
- Girard, A.; Schweiger, A.K.; Carteron, A.; Kalacska, M.; Laliberté, E. Foliar Spectra and Traits of Bog Plants across Nitrogen Deposition Gradients. Remote Sens. 2020, 12, 2448. [Google Scholar] [CrossRef]
- Arroyo-Mora, J.P.; Kalacska, M.; Soffer, R.; Ifimov, G.; Leblanc, G.; Schaaf, E.S.; Lucanus, O. Evaluation of Phenospectral Dynamics with Sentinel-2A Using a Bottom-up Approach in a Northern Ombrotrophic Peatland. Remote Sens. Environ. 2018, 216, 544–560. [Google Scholar] [CrossRef]
- Linkosalmi, M.; Tuovinen, J.P.; Nevalainen, O.; Peltoniemi, M.; Taniş, C.M.; Arslan, A.N.; Rainne, J.; Lohila, A.; Laurila, T.; Aurela, M. Tracking Vegetation Phenology of Pristine Northern Boreal Peatlands by Combining Digital Photography with CO2 flux and Remote Sensing Data. Biogeosciences 2022, 19, 4747–4765. [Google Scholar] [CrossRef]
- Bhatnagar, S.; Gill, L.; Regan, S.; Waldren, S.; Ghosh, B. A Nested Drone-Satellite Approach to Monitoring the Ecological Conditions of Wetlands. ISPRS J. Photogramm. Remote Sens. 2021, 174, 151–165. [Google Scholar] [CrossRef]
- Räsänen, A.; Juutinen, S.; Kalacska, M.; Aurela, M.; Heikkinen, P.; Mäenpää, K.; Rimali, A.; Virtanen, T. Peatland Leaf-Area Index and Biomass Estimation with Ultra-High Resolution Remote Sensing. GISci. Remote Sens. 2020, 57, 943–964. [Google Scholar] [CrossRef]
- DeLancey, E.R.; Kariyeva, J.; Bried, J.T.; Hird, J.N. Large-Scale Probabilistic Identification of Boreal Peatlands Using Google Earth Engine, Open-Access Satellite Data, and Machine Learning. PLoS ONE 2019, 14, e0218165. [Google Scholar] [CrossRef] [PubMed]
- Carless, D.; Kulessa, B.; Booth, A.D.; Drocourt, Y.; Sinnadurai, P.; Street-Perrott, F.A.; Jansson, P. An Integrated Geophysical and GIS Based Approach Improves Estimation of Peatland Carbon Stocks. Geoderma 2021, 402, 115176. [Google Scholar] [CrossRef]
- McPartland, M.Y.; Falkowski, M.J.; Reinhardt, J.R.; Kane, E.S.; Kolka, R.; Turetsky, M.R.; Douglas, T.A.; Anderson, J.; Edwards, J.D.; Palik, B.; et al. Characterizing Boreal Peatland Plant Composition and Species Diversity with Hyperspectral Remote Sensing. Remote Sens. 2019, 11, 1685. [Google Scholar] [CrossRef]
- Kelly, J.; Kljun, N.; Eklundh, L.; Klemedtsson, L.; Liljebladh, B.; Olsson, P.O.; Weslien, P.; Xie, X. Modelling and Upscaling Ecosystem Respiration Using Thermal Cameras and UAVs: Application to a Peatland during and after a Hot Drought. Agric. For. Meteorol. 2021, 300, 108330. [Google Scholar] [CrossRef]
- Canisius, F.; Wang, S.; Croft, H.; Leblanc, S.G.; Russell, H.A.J.; Chen, J.; Wang, R. A UAV-Based Sensor System for Measuring Land Surface Albedo: Tested over a Boreal Peatland Ecosystem. Drones 2019, 3, 27. [Google Scholar] [CrossRef]
- Räsänen, A.; Manninen, T.; Korkiakoski, M.; Lohila, A.; Virtanen, T. Predicting Catchment-Scale Methane Fluxes with Multi-Source Remote Sensing. Landsc. Ecol. 2021, 36, 1177–1195. [Google Scholar] [CrossRef]
- Lovitt, J.; Rahman, M.M.; McDermid, G.J. Assessing the Value of UAV Photogrammetry for Characterizing Terrain in Complex Peatlands. Remote Sens. 2017, 9, 715. [Google Scholar] [CrossRef]
- Karlson, M.; Gålfalk, M.; Crill, P.; Bousquet, P.; Saunois, M.; Bastviken, D. Delineating Northern Peatlands Using Sentinel-1 Time Series and Terrain Indices from Local and Regional Digital Elevation Models. Remote Sens. Environ. 2019, 231, 111252. [Google Scholar] [CrossRef]
- de la Barreda-Bautista, B.; Boyd, D.S.; Ledger, M.; Siewert, M.B.; Chandler, C.; Bradley, A.V.; Gee, D.; Large, D.J.; Olofsson, J.; Sowter, A.; et al. Towards a Monitoring Approach for Understanding Permafrost Degradation and Linked Subsidence in Arctic Peatlands. Remote Sens. 2022, 14, 444. [Google Scholar] [CrossRef]
- Millard, K.; Thompson, D.K.; Parisien, M.A.; Richardson, M. Soil Moisture Monitoring in a Temperate Peatland Using Multi-Sensor Remote Sensing and Linear Mixed Effects. Remote Sens. 2018, 10, 903. [Google Scholar] [CrossRef]
- Kohv, M.; Sepp, E.; Vammus, L. Assessing Multitemporal Water-Level Changes with Uav-Based Photogrammetry. Photogramm. Rec. 2017, 32, 424–442. [Google Scholar] [CrossRef]
- Lees, K.J.; Khomik, M.; Quaife, T.; Clark, J.M.; Hill, T.; Klein, D.; Ritson, J.; Artz, R.R.E. Assessing the Reliability of Peatland GPP Measurements by Remote Sensing: From Plot to Landscape Scale. Sci. Total Environ. 2021, 766, 142613. [Google Scholar] [CrossRef] [PubMed]
Figure 1.
PRISMA chart summarising the database search, screening, and inclusion workflow.

Figure 2.
The publications on peatland and remote sensing from 1988 to 2022. APY—articles per year.

Figure 3.
Number of articles distributed by type of platform and country of study; (a) the code of the country of study based on ISO 3166-1 alpha-3 codes (MIX stands for several countries in one study), where the size is controlled by the number of articles in each category, the distribution of articles per remote sensing data source (satellite, airborne, UAV, in situ and mixed plus active, passive, or Act+Pas, which stands for mixed or sensor fusion), and the year of study (b).

Figure 4.
Year-to-year comparison between the applications of various remote sensing platforms in northern peatlands from 2017 to 2022 (the applications were aggregated based on the grouping themes in Supplementary Table S1).
Figure 4.
Year-to-year comparison between the applications of various remote sensing platforms in northern peatlands from 2017 to 2022 (the applications were aggregated based on the grouping themes in Supplementary Table S1).

Table 1.
A summary of previous reviews on the use of remote sensing in wetlands and peatlands.
| References | Scope | Protocol | Databases Searched | Number of Articles | Timespan | Key Findings |
|---|---|---|---|---|---|---|
| [52] | This research delivers a comprehensive assessment of the use of remote sensing (RS) techniques in peatland research and the external factors that can influence the way they evolve. | State-of-the-art review (1) | Web of Science and Scopus | 59 | 2010–2021 | There has been a conspicuous rise in adopting RS methodologies within peatland research in the past decade. This surge can largely be attributed to enhanced accessibility to a diverse range of RS datasets, including Sentinel 1 and 2, Landsat 8, and SPOT 6 and 7, alongside the rapid progress of open-source software tools such as ESA SNAP, QGIS, and SAGA GIS. |
| [53] | The aim of this study was to examine the present and prospective capabilities of unmanned aerial vehicles (UAVs) in wetlands to enhance ecosystem management practices. It investigates the status of UAV applications in wetlands and identifies several research, technological, and data prerequisites for optimising their effectiveness. | Scoping review (2) | Web of Science, ProQuest, and Google Scholar | 122 | Before 6 March 2021 | This review examines the potential of UAVs to reduce the logistical demands of field surveys and to optimise UAV-based workflows for monitoring wetland environments and management strategies. Additionally, it identifies significant trends in applications, technology, and data, and provides recommendations for future research. |
| [54] | This research article employs meta-data analysis to assess the contemporary status and evolution of wetland studies in Canada through RS technology. | Bibliographic analysis (3) | Web of Science and Elsevier Scopus | 300 | 1976–2020 | Many wetland classification studies were conducted within the province of Ontario, with a preference for pixel-based supervised classifiers as the primary classification algorithm. |
| [3] | This article delivers an overview of the present digital mapping techniques for measuring and monitoring carbon stocks in peatlands and potential opportunities and challenges for accurately assessing the world’s peatlands. | Critical review (4) | Not mentioned | 90 | Not mentioned | This study shows a growing interest in using satellite imagery and other digital mapping technologies to map peatlands. Previous studies used RS, ecology, and environmental field studies to determine peat extent but rarely assessed the accuracy or calculated the prediction’s uncertainty. Enhancing the accuracy of peatland mapping can be achieved by incorporating multiple covariates, including optical and radar products, alongside implementing nonlinear machine learning algorithms. |
| [34] | This review paper assesses the current understanding of estimating carbon dioxide fluxes in peatland utilising remote sensing technology and identifies areas for future research. | Narrative Review (5) | Not mentioned | Not mentioned | Not mentioned | The study demonstrated the potential of RS in modelling carbon fluxes across northern peatlands. Nonetheless, further research is imperative to develop more comprehensive carbon cycle models, with particular emphasis on peatlands undergoing restoration, to ensure the sustainability and durability of these models. |
| [4] | This paper provides an in-depth examination of wetland remote sensing, which involves an overview of selected approaches, findings, and remote sensor types. It also offers recommendations for future wetland research. | Narrative Review (5) | Science Citation Index Extended (SCIE) | 250 | till 11 May 2016 | Aerial photography was used as the primary data source in early wetland mapping research. This data was typically of medium resolution, though some studies did use higher-resolution imagery. Hyperspectral imaging has grown in popularity in recent years. Furthermore, radar data are frequently used to detect wetland areas, and LiDAR data can be used to generate three-dimensional topographical maps. |
(1) State-of-the-art review: a specialised literature review that provides an up-to-date overview of the latest advancements and research findings in a specific field or topic. (2) Scoping review: Used to map the existing literature on a broad topic, identify gaps in knowledge, and clarify key concepts. It does not typically assess individual studies’ quality but provides a broad overview of the field. (3) Bibliographic analysis: this research method systematically examines and evaluates bibliographic data to understand trends, relationships, and patterns within a body of literature on a specific topic. (4) Critical review: This type of review emphasises a critical assessment of the quality, relevance, and limitations of existing literature. It aims to identify strengths and weaknesses in the research and may involve a detailed critique of methodology and findings. (5) Narrative review: A comprehensive literature overview on a particular topic. It summarises key findings, concepts, and theories without a specific methodological approach and is often used to establish the background and context for a research study.
Table 2.
Literature search keywords and strategy.
| Component | Attributes |
|---|---|
| Search keyword sets | Set 1 (peatland): (TS a = (peatland OR mire OR fen OR bog) Set 2 (remote sensing): TS a = (“remote sensing” OR UAV OR NDVI OR “Normalised Difference Vegetation Index” OR “Unmanned Aerial Vehicle” OR SIF OR “Solar-Induced Chlorophyll Fluorescence” OR airborne OR LiDAR OR satellite OR “Sun-Induced Chlorophyll Fluorescence” OR “reflectance” OR EVI OR “Enhanced Vegetation Index” OR PRI OR “Photochemical Reflectance Index” OR indices OR indexes OR spectra* OR multispectral OR hyperspectral OR “VI” OR “vegetation indices”))) |
| Search strategy | Utilise keywords from both Set 1 and Set 2. Conduct searches using titles, abstracts, and keywords. Focus on publications in the English language. Select “Article” document types exclusively, excluding review papers, conference proceedings, grey literature, or book chapters. Limit the timeframe of consideration to the period from 1 January 2017 to 30 December 2022. |
a TS = topic. The asterisk (*) was used to broaden the search and retrieve variations of the term with different suffixes, e.g., spectra* consider spectral and spectra.
Table 8.
Proportion of studies on each remote sensing platform and their applications areas in northern peatlands.
Table 8.
Proportion of studies on each remote sensing platform and their applications areas in northern peatlands.
| Platform | Proportion of Studies | Applications |
|---|---|---|
| Satellite | 36.5% | Carbon and methane flux estimation (14%), fire dynamics monitoring (6%), hydrology (14%), mapping and monitoring peatland extent (42%), peatland degradation (4%), restoration and management monitoring (10%), vegetation assessment (10%) |
| Airborne | 20.4% | Carbon and methane flux estimation (14%), fire dynamics monitoring (14%), hydrology (14%), mapping and monitoring peatland extent (36%), Other (7%), peatland degradation (0%), restoration and management monitoring (4%), vegetation assessment (11%) |
| UAV | 13.9% | Carbon and methane flux estimation (11%), fire dynamics monitoring (0%), hydrology (11%), mapping and monitoring peatland extent (37%), peatland degradation (0%), restoration and management monitoring (37%), vegetation assessment (5%) |
| In situ | 10.9% | Carbon and methane flux estimation (20%), fire dynamics monitoring (0%), hydrology (7%), mapping and monitoring peatland extent (13%), peatland degradation (0%), restoration and management monitoring (0%), vegetation assessment (60%) |
| Mixed | 18.2% | Carbon and methane flux estimation (12%), fire dynamics monitoring (0%), hydrology (12%), mapping and monitoring peatland extent (40%), other (4%), peatland degradation (4%), restoration and management monitoring (8%), vegetation assessment (20%) |
Disclaimer/Publisher’s Note: The statements, opinions and data contained in all publications are solely those of the individual author(s) and contributor(s) and not of MDPI and/or the editor(s). MDPI and/or the editor(s) disclaim responsibility for any injury to people or property resulting from any ideas, methods, instructions or products referred to in the content. |
© 2024 by the authors. Licensee MDPI, Basel, Switzerland. This article is an open access article distributed under the terms and conditions of the Creative Commons Attribution (CC BY) license (https://creativecommons.org/licenses/by/4.0/).
Share and Cite
MDPI and ACS Style
Abdelmajeed, A.Y.A.; Juszczak, R. Challenges and Limitations of Remote Sensing Applications in Northern Peatlands: Present and Future Prospects. Remote Sens. 2024, 16, 591. https://doi.org/10.3390/rs16030591
AMA Style
Abdelmajeed AYA, Juszczak R. Challenges and Limitations of Remote Sensing Applications in Northern Peatlands: Present and Future Prospects. Remote Sensing. 2024; 16(3):591. https://doi.org/10.3390/rs16030591
Chicago/Turabian StyleAbdelmajeed, Abdallah Yussuf Ali, and Radosław Juszczak. 2024. "Challenges and Limitations of Remote Sensing Applications in Northern Peatlands: Present and Future Prospects" Remote Sensing 16, no. 3: 591. https://doi.org/10.3390/rs16030591
Note that from the first issue of 2016, this journal uses article numbers instead of page numbers. See further details here.