
A Satellite View of the Wetland Transformation Path and Associated Drivers in the Greater Bay Area of China during the Past Four Decades

1
Key Laboratory of Marine Ecological Conservation and Restoration, Ministry of Natural Resources/Fujian Provincial Key Laboratory of Marine Ecological Conservation and Restoration, Xiamen 361000, China
2
Key Laboratory of Ecosystem Network Observation and Modeling, Institute of Geographic Sciences and Natural Resources Research, Chinese Academy of Sciences, Beijing 100101, China
3
Third Institute of Oceanography, Ministry of Natural Resources, Xiamen 361005, China
*
Author to whom correspondence should be addressed.
Remote Sens. 2024, 16(6), 1047; https://doi.org/10.3390/rs16061047
Submission received: 12 January 2024
/
Revised: 13 March 2024
/
Accepted: 14 March 2024
/
Published: 15 March 2024
(This article belongs to the Special Issue Remote Sensing of Coastal Environment and Evolution: Progress, Challenges and Opportunities)
Abstract
:As a highly productive and biologically diverse ecosystem, wetlands provide unique habitat for a wide array of plant and animal species. Owing to the strong disturbance by human activities and climate change, wetland degradation and fragmentation have become a common phenomenon across the globe. The Guangdong–Hong Kong–Macao Greater Bay Area (GBA) is a typical case. The GBA has experienced explosive growth in the population and economy since the early 1980s, which has resulted in complicated transitions between wetlands and non-wetlands. However, our knowledge about the transformation paths, associated drivers, and ecological influence of the GBA’s wetlands is still very limited. Taking advantage of the land use maps generated from Landsat observations over the period of 1980–2020, here, we quantified the spatiotemporal transformation paths of the GBA’s wetlands and analyzed the associated drivers and ecological influence. We found that the dominant transformation path between wetland and non-wetland was from wetland to built-up land, which accounted for 98.4% of total wetland loss. The primary transformation path among different wetland types was from coastal shallow water and paddy land to reservoir/pond, with the strongest transformation intensity in the 1980s. The driving forces behind the wetland change were found to vary by region. Anthropogenic factors (i.e., population growth and urbanization) dominated in highly developed cities, while climate factors and aquaculture had a greater influence in underdeveloped cities. The findings presented in this study will provide a reference for wetland management and planning in the GBA.
1. Introduction
As an important ecosystem located in the marine–terrestrial interlaced zone, coastal wetlands comprise abundant ecosystem elements including marshes, tidal flats, mangroves, coral reefs, estuaries, etc., and play an important role in biodiversity support, climate regulation, carbon sequestration, soil conservation, water purification, and flood control [1,2,3]. Although coasts only account for 10% of Earth’s land area, nearly half of the global population lives within 100 km of the coastline [4,5,6]. Coastal areas are hot spots of global development; meanwhile, they are subjected to unprecedented direct stressors from human activities (e.g., urban expansion, land reclamation) and indirect stressors from natural processes (e.g., coastal erosion, sea level rise, extreme climate) [7,8]. Coastal wetland degradation has become a common phenomenon worldwide [9]. Over 13,000 km2 of Earth’s coastal tidal wetlands have been lost during the past two decades [10,11]. There would be 46–59% of global coastal wetlands lost under a sea level rise of 50 cm by 2100 [7]. In this context, coastal wetland landscape change and its driving mechanisms have been a focal issue in the academic community [12,13].
Satellite remote sensing is able to capture the land use/land cover (LULC) dynamics of the land surface at a large scale, long-term, and high accuracy; thus, it can be used to explore the spatiotemporal pattern of coastal wetlands at the global and regional scale [14,15]. The most commonly used satellite data in wetland monitoring are from a series of Landsat sensors (e.g., TM, ETM, OLI), which could provide an uninterrupted record of the Earth’s land surface at high spatiotemporal resolution (spatial resolution: 30 m; revisiting period: 16 d) over the past five decades [16,17]. Landsat data have been used to generate global and regional maps of typical coastal wetland categories including mangrove forests, tidal flats, salt marshes, and aquaculture ponds [11,13,18,19,20,21]. Satellite observation has confirmed the enormous losses and gains of global coastal wetlands over the past few decades [9,10]. Nevertheless, wetland-oriented maps generally exclude the non-wetland categories in the classification, which makes it difficult to track the spatiotemporal transformation path between the wetland and non-wetland categories. Despite many global-scale LULC datasets including both the wetland and non-wetland categories, generally the wetland category has not been further subdivided, which makes us unable to analyze the spatiotemporal transformation among different wetland types [22,23]. Therefore, the transformation paths of coastal wetlands remain to an open problem and need to be further quantified.
The coastal zone of China has experienced an explosive increase in the population and economy since the implementation of the reform and opening-up policy in 1978, especially in the Guangdong–Hong Kong–Macao Greater Bay Area (GBA). The GBA has achieved a 4-fold increase in the permanent population and a 76-fold increase in the gross domestic product (GDP) during the past four decades [24]. With the rapid development of urbanization and industrialization, the land use pattern in the GBA has also experienced significant and complicated changes, including a massive increase of the built-up area [25], a rapid expansion before 2000 and a slow decline after 2000 for aquaculture ponds [20], a relatively stable variation in saltmarsh area, and a significantly increasing trend between 2000 and 2018 in mangrove forest area [21]. Dramatic land use change results in complicated transformation paths between different land use types, associated with diverse driving forces. The spatiotemporal transformation paths and associated drivers for the wetlands in the GBA remain as a knowledge gap in the scientific community.
To fill this knowledge gap, this study attempted to generate a series of LULC maps in the GBA with high confidence and complete land use types using Landsat observations over the past four decades. Based on the LULC maps, this study aimed to: (1) clarify the spatiotemporal transformation paths between wetland and non-wetland types; (2) clarify the spatiotemporal transformation paths between different wetland types; (3) determine the anthropogenic and climate drivers of different land use transformation paths.
2. Materials and Methods
2.1. Study Area
The GBA, known as one of the world’s top four bay areas, is located in southern China (111°21′–114°53′E, 21°28′–24°29′N) and composed of nine cities in Guangdong province (Zhaoqing, Foshan, Jiangmen, Zhongshan, Zhuhai, Guangzhou, Dongguan, Shenzhen, and Huizhou) and two special administrative regions of China (Hong Kong and Macao), with a total area of 56,098 km and a permanent population of nearly 86 million (up to 2020) (Figure 1). Situated in a subtropical monsoon climate and unique land–sea interaction zone, the GBA has abundant rainfall and is densely covered by waterways and estuaries, which has bred a complicated wetland ecosystem with multitudinous categories and wide distributions. The primary wetland resources in the GBA include mangroves, mudflats, coral reefs, saltmarshes, estuaries, etc.
2.2. Satellite Datasets
The LULC maps in the GBA were derived from Landsat TM/ETM+/OLI images at a spatial resolution of 30 m and temporal interval of ten years from 1980 to 2020 [26].
A total of 32 cloudless Landsat level-2 scenes from clean days over the GBA were collected. All Landsat images were geometrically and atmospherically corrected before classification.
The LUCC maps were produced with the integration of automatic classification and human–computer interactive interpretation [27]. In terms of the entire Chinese mainland, the LUCC maps were divided into six classes (built-up land, cropland, grassland, water body, woodland, and unused land) and 25 sub-classes. Validation with nationwide field survey samples showed that the overall accuracy of the 6 classes was up to 94.3% and the overall accuracy of the 25 sub-classes was above 91.2% [28]. In the GBA, the Landsat-derived LULC dataset had 12 sub-classes in total. Finally, we re-classified the LULC dataset into nine classes, and they were cultivated land, forest, grassland, built-up land, paddy land, reservoir/pond, river/lake, tidal flat, and coastal shallow water, respectively. The last five classes were identified in the scope of wetlands following a wetland classification system for remote sensing [29]. Among the five wetland types, paddy land and reservoir/pond were treated as artificial wetlands and river/lake, tidal flat, and coastal shallow water were treated as natural wetlands. The coastal shallow water was defined as offshore waters with a depth of no more than six meters. The extent of coastal shallow water in the GBA was obtained and integrated from a national wetland dataset [29].
2.3. Social–Economy and Climate Data
Social–economy and climate data were used to analyze the influence of human activities and climate change on wetland change. The social–economy statistical yearbook data included the total permanent population and the gross output value of the fishery and construction industries, which can be freely accessed from the Survey Office of the National Bureau of Statistics in Guangdong (https://gdzd.stats.gov.cn/dcsj/gdsnjsj/201902/t20190201_154503.html (accessed on 25 February 2024)). Land use statistical data in Guandong province during 2010 and 2020 can be publicly obtained from the Department of Natural Resource of Guangdong Province (DNRGP) (http://nr.gd.gov.cn/ (accessed on 25 February 2024)). Land utilization data in Hong Kong can be freely obtained from the Planning Department of Hong Kong (https://www.pland.gov.hk/pland_en/ (accessed on 25 February 2024)). Climate data included air temperature, precipitation, and sea level. The annual mean air temperature and precipitation data in the GBA were obtained from Guangdong Meteorological Service (http://gd.cma.gov.cn/ (accessed on 10 December 2023)). The annual mean sea level data at ZHAPO station (21.58°N; 111.82°E) during 1980–2020 were downloaded from the Permanent Service for Mean Sea Level (PSMSL, https://psmsl.org/ (accessed on 10 December 2023)).
2.4. Field Survey Data
To validate the accuracy of the LULC dataset in the GBA, we carried out a field survey on the typical wetland types of the GBA during 29 November to 6 December 2020. A total of 70 wetland samples were obtained with the support of an unmanned aerial vehicle. The geographical distribution of the wetland samples is shown in Figure 1. The investigated targets included natural and artificial wetland parks, agricultural and aquacultural reclamation areas, mangroves, and mudflats, covering most of the wetland types in the GBA (Figure 2). The on-the-spot investigation data were used to evaluate the performance of the LULC dataset.
2.5. Analysis of Wetland Change and Its Driving Forces
The spatial and temporal transformation paths of wetlands in the GBA during the past four decades were determined by a transition-matrix-based methodology. The land use transition matrix is a two-dimensional matrix that can be used to determine the transfer direction and quantify transfer rate of different land use types within a given period [30]. It was calculated based on the multi-temporal GBA LULC maps using the ENVI software (version 5.3). To resolve the landscape patterns of different land use types, four frequently used indicators, including the number of patches (NP), patch density (PD), landscape shape index (LSI), and aggregation index (AI), were calculated using Fragstats v4.2 [31]. The NP and PD were used to indicate the extent of the subdivision of the patch type. The LSI was used to measure the edge density, which adjusts for the size of the landscape. The AI was used to measure the aggregation level of the spatial patterns within the landscape.
We took advantage of correlation analysis and principal component analysis (PCA) to explore the natural and anthropogenic driving forces of wetland change in the GBA. Correlation analysis was used to determine the degree of relevance between wetland change and the explanatory variables. PCA is a multivariate statistical method for reducing a cases-by-variables data table to its essential features, called principal components (PCs) [32]. PCA looks for a linear combination of the variables that has the maximum variance and allows for straightforward data exploration to understand the key variables in the data and spot outliers. PCA was used to identify the dominant driving forces of wetland change across different cities of the GBA in this research. The flowchart of the research methodology used in this study can be seen in Figure 3.
3. Results
3.1. Spatiotemporal Pattern of Land Use Maps in the GBA
The Landsat-derived LULC maps in the GBA from 1980 to 2020 are shown in Figure 4. Generally, forest and wetland were the dominant land cover types, accounting for 41.6~44.7% and 33.8~43.4% of the total land area in the GBA, respectively. A significant increase of built-up lands and a decrease of wetlands were the remarkable features in the LULC of the GBA during the past four decades. The built-up area increased from 1170 km2 in the 1980s to 8175 km2 in the 2020s (+600%), while the wetland area decreased from 21,680 km2 to 16,921 km2 in the same period (−22%) (Figure 5a). The greatest changes in the built-up and wetland area occurred between 2000 and 2010. Such a huge wetland loss was largely attributed to the sharp decline in the paddy land area, which has decreased from 11,774 km2 in the 1980s to 7583 km2 in the 2020s (−35.6%) (Figure 5b). Furthermore, the coastal shallow water extent has also shown an obvious decline during the past four decades (−10.1%). The total area of reservoirs/ponds, rivers/lakes, and tidal flats presented a much smaller fluctuation during the past four decades, with an average value of 2736 (±169), 1218 (±20), and 112 (±30) km2, respectively.
The landscape patterns of different land use types in the GBA also presented tremendous changes during the past four decades. Generally, built-up land, wetlands, and forests showed a significant increasing trend in the NP, PD, and LSI, indicating that landscapes of these land use types experienced reinforcing fragmentation (Figure 6). However, built-up land showed an inverse trend in the AI when compared with cultivated land and wetlands. Increasing the AI in the built-up land indicated that edge-expansion and infilling-expansion enhanced the urban agglomeration level. The decreasing AI in cultivated land and wetlands indicated the spatially discrete expansion pattern of cultivated land and wetland patches. In terms of different wetland types, paddy land presented a significant increasing trend in the NP, PD, and LSI and a significant decreasing trend in the AI, while other wetland types kept in a relatively stable state (Figure 7). This indicated that paddy land dominated the changes in the wetland landscape pattern.
3.2. Spatiotemporal Transformation Path between Wetland and Non-Wetland Types
The primary transformation path between wetland and non-wetland was the change of wetlands to other land use types (Figure 8). Spatially, the disappearing wetlands were mainly distributed in the coastal area of the Pearl River Estuary, including the cities of Zhuhai, Zhongshan, Foshan, Guangzhou, Dongguan, and Shenzhen. Temporally, sharp wetland declines mainly occurred during the 1980s and 2000s. In addition, new wetlands were also found in the eastern region of Huizhou in the 1980s and the southwest coastal region of Zhuhai in the 1990s.
Areal statistical analysis of the transformed wetlands during different periods showed that the wetland loss was mainly sourced from paddy land, which generally accounted for 98.4% of wetland loss during the past four decades (Figure 9a). The residual wetland loss could be attributed to reservoirs/ponds and coastal shallow waters, which generally contributed 6.7% and 7.6% of the wetland loss in the GBA. The contribution ratio of reservoirs/ponds to total wetland loss increased from 4~7% during 1980–2000 to 11~30% during 2000–2020, indicating that the loss of the reservoir/pond was significant after the year 2000, while the contribution ratio of coastal shallow waters to total wetland loss (3~8%) was relatively stable during the past four decades. Most of the disappearing wetland (>98%) transformed to built-up land (Figure 9b). Especially in the 2000s, the land area transformed from wetlands to built-up land was up to 2292 km2, which accounted for nearly half of the total disappearing wetlands during the past four decades.
3.3. Spatiotemporal Transformation Path between Different Wetland Types
Apart from the transformation between wetland and non-wetland land types, the interconversion between different wetland types was also considerable. As shown in Figure 10, the primary transformation paths of wetlands in the 1980s were conversion from paddy land and coastal shallow waters to reservoirs/ponds, with a transformed area of 185.4 and 139.3 km2, respectively. This indicated that there may have been an explosion in aquaculture during this period. In the 1990s and 2000s, the dominant transformation direction was also the conversion from other wetland types to reservoirs/ponds. However, the transformation intensity in the 1990s and 2000s was much weaker than that in the 1980s. The interconversion area between different wetland types was the smallest in the 2010s. Overall, wetlands in the GBA have experienced dramatic internal transformation during the past four decades. Of the transformation paths, the most prominent was the expansion of reservoirs/ponds. The total area of reservoirs/ponds has increased by 300 km2, which was mainly transferred from coastal shallow waters (201 km2) and paddy land (136.8 km2).
4. Discussion
4.1. Driving Forces of Wetland Change
Human activities and climate change are the dominant drivers of land change [33]. Globally, 60% of land changes are associated with human activities and 40% are associated with climate change [34]. In terms of wetland change, global wetlands were estimated to have a loss rate of 10,625 km2 yr−1 (confidence interval 9062~11,875 km2 yr−1) since the year 1700 [9]. The global drivers of wetland loss include urbanization, cropland and rice cultivation, peat extraction, pasture, and aquaculture [9]. In the GBA, we observed a loss rate of 119 km2 yr−1 during 1980–2020 (Figure 5a). Transformation path analysis showed that most of the reduced wetlands (>98%) transformed to built-up land. The transformation reached the peak during 2000–2010, when wetland area decreased by 11.7% and urban area increased by 76.2%. Furthermore, reservoirs/ponds were the only wetland type with a significantly increasing trend in the total area during 1980–2000 (Figure 5b). The annual growth rate of the aquaculture area in the GBA was reported to be more than 150 km2 yr−1 during 1980–2000 [35]; meanwhile, the gross output value of the fishery industry had a 35-fold increase. Both demonstrated the rapid expansion of the aquaculture industry within this period. Corresponding to the significant downward trend of reservoir/pond area during 2000–2020, the growth rate of aquaculture area and the fishery industry output value both had a sharp decrease in this period.
Allowing for the appreciable impact of urbanization and aquaculture on wetland change, permanent population, and the gross output value of the fishery and construction industries were chosen as the proxies of the anthropogenic driving forces for the wetland change in the GBA. In addition, climate change indicators such as sea level, temperature, and precipitation were also demonstrated to have a significant influence on the coastal wetland change [7,36]; these three indicators were chosen as the climatic driving forces of wetland change in the GBA. With the rapid development of urbanization and industrialization, the permanent population and the gross output value of the fishery and construction industries in the GBA have increased by about 3, 349, and 366 times, respectively, during the past decades (Figure 11a–c). Sea level and temperature have also increased by 4.7% and 1.8% under the impact of climate change (Figure 11d,e). Three anthropogenic factors and two climatic factors (sea level and temperature) generally showed a significant negative correlation with wetland area in the GBA’s cities. The climatic factor precipitation was generally positively correlated with wetland area, but not significant (Figure 12a). PCA identified two major PCs (PC1 and PC2), which could explain 79% of the variance of the GBA’s wetland area (Figure 12b). The primary drivers of wetland area change varied with different cities. The wetland change in Guangzhou, Shenzhen, and Dongguan was mainly driven by population growth and urban expansion, while temperature, precipitation, and aquaculture generally had a greater impact on the wetland change in the cities of Jiangmen, Zhuhai, Huizhou, and Zhongshan.
4.2. Ecological Influence of Wetland Change
Considering that the wetland ecosystem plays a vital role in biodiversity, carbon fixation, habitat provision, climate regulation, and flood control, the great areal and classificatory changes of wetlands during the past four decades have a significant influence on the ecological environment in the GBA. The habitat quality in the GBA has undergone an overall decline during the past few decades [37]. The wetland ecosystem service value has decreased by 54% from 1990 to 2015, which is much greater than other land use types (1~17%) [38]. Sixty-four percent of the total area presented a significant decline in the ecosystem vulnerability index during 1990–2010, and this was mainly caused by the loss of wetlands and similar low-vulnerability land types [39]. Wetland carbon storage also decreased from 33.38 Tg C to 16.64 Tg C during 1995–2020, which was largely attributed to the loss of paddy land [40]. Moreover, a 40% decrease in coral reef diversity and a 60% decrease in waterbird diversity have been demonstrated in the wetland degradation process [41,42]. Overall, the widespread wetland loss in the GBA has given rise to a significant decline in the function and capacity of wetland ecosystem services.
With the implementation of several large-scale wetland protection and restoration projects in recent years, such as the Action Plan for Biodiversity Protection in China (1994), the National Wetland Protection Plan (2004), and the National Marine Function Zoning (2011–2020), individual wetland types (e.g., mangrove forests) have been continuously recovered since the 1990s [21]. In addition, a larger number of wetland parks and wetland nature reserves have also been established by the government [43]. However, our field investigation on the wetland park in the GBA suggested a generally fragmentized landscape pattern and weak biodiversity connectivity (Figure 2), which are in line with the wetland landscape pattern derived from the satellite observations. Therefore, the ecological effects of wetland parks need to be further examined.
4.3. Uncertainties and Limitations
To determine the uncertainty of the satellite-derived wetland dataset used in this study, we compared the GBA LULC dataset with concurrent ground truth data. Generally, the GBA LULC dataset achieved a high classification accuracy in the wetland category, with an overall accuracy of 83.6% and a kappa coefficient of 0.77 (Table 1). The producer’s accuracies of all five wetland types fell in between 76.7 and 100%, while the user’s accuracies ranged from 73.9% to 95.8%. The classification accuracy was comparable to current Landsat-derived wetland datasets at the national and regional scale [21,29,35,44]. Figure 13 presents typical wetland change patterns as observed from Landsat images and aerial photographs, which indicates that the Landsat-derived wetland classification dataset was able to capture the long-term wetland dynamics in the GBA.
The GBA wetland maps presented in this study were also compared with several publicly available wetland datasets, including GlobeLand30 [45], CAS_Wetlands [29], CIFOR_Wetlands [46], GLWD-3 [47], and GWL_FCS30 [48] (shown in Figure 14). Generally, the total GBA wetland area estimated in this study was significantly greater than that estimated by other wetland datasets. The discrepancy can be attributed to multiple reasons. Firstly, the wetland classification system was not consistent in the current wetland datasets. Paddy land and coastal shallow waters were regarded as important wetland types in this study, while they were not included in the wetland category in the other wetland datasets. This could largely explain the lower wetland area estimates in these datasets. Secondly, there were significant differences in the classification method among these wetland datasets. Thirdly, the classification accuracy varied with different wetland types, ranging from 60% to 96% in GWL_FCS3 [48] and 85% to 100% in CAS_Wetlands [29]. The classification accuracy difference between different wetland types may also lead to remarkable inconsistency in the wetland area estimates.
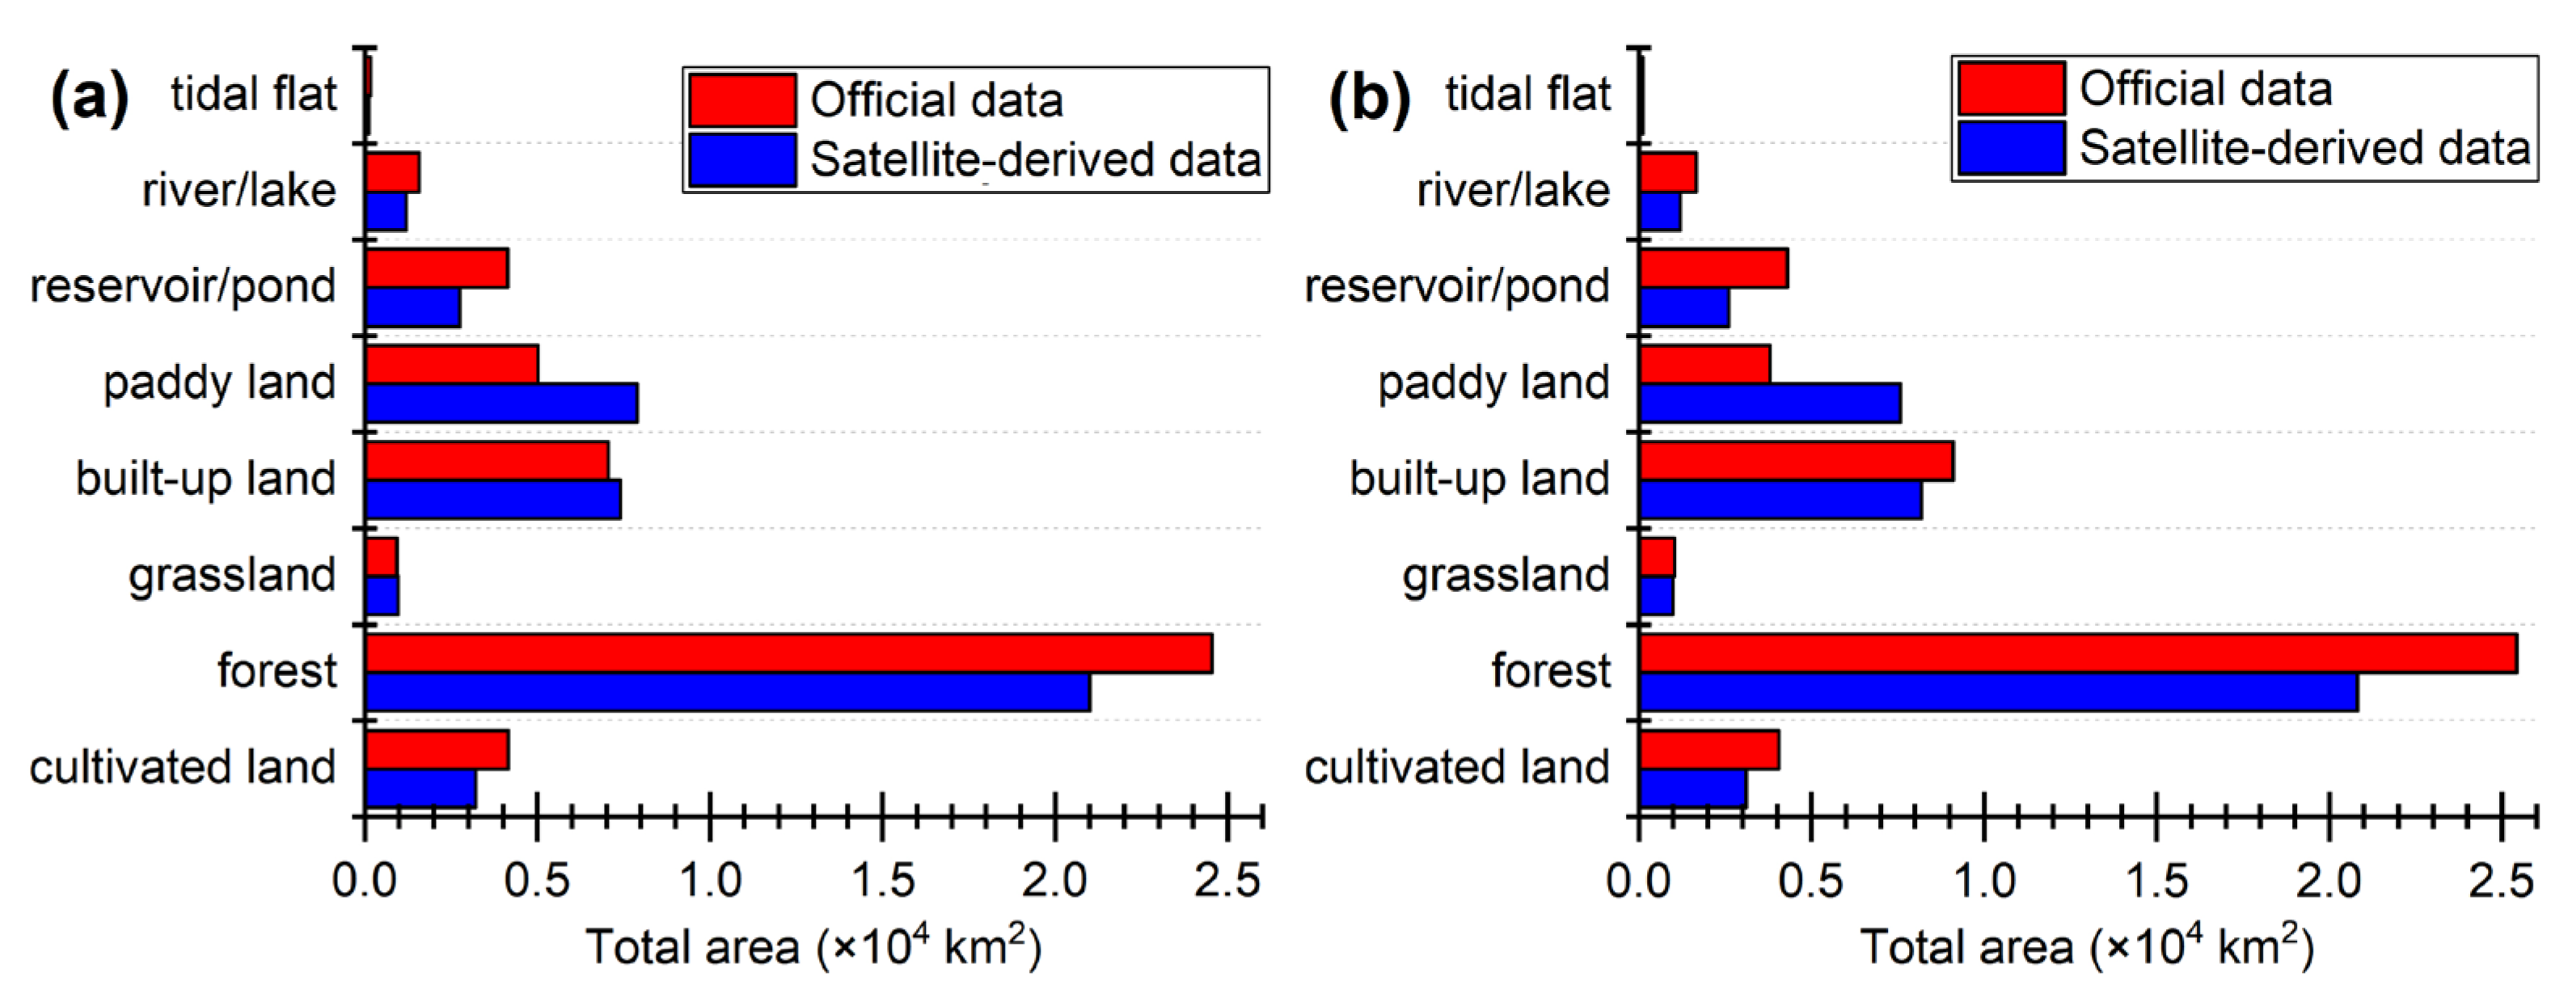
The satellite-derived data were also compared with the statistical data released by the DNRGP (marked as official data in Figure 14 and Figure 15). The total wetland area derived from the satellite data generally showed high consistency with official data during different periods (Figure 14). Although there were some areal differences in certain land use types such as paddy land and forest, a high consistency was found in most of the land use types including wetland and non-wetland (Figure 15). This further demonstrated the validity of the satellite-based wetland maps used in this study.
5. Conclusions
The wetlands in the GBA have experienced dramatic and complicated changes with the rapid development of urbanization and industrialization during the past four decades. Understanding the spatiotemporal patterns, transformation paths, and driving forces of wetland change is of great importance to wetland protection and restoration policy planning in this region. This study explored the spatiotemporal patterns and transformation paths of wetlands in the GBA using Landsat-derived LULC maps over the past four decades. Satellite observation demonstrated a 6-fold increase in the built-up land area and a 22% decrease in wetland area. The primary transformation path between wetland and non-wetland was from wetland to built-up land, while the major transformation path between different wetlands was from coastal shallow water and paddy land to reservoir/pond. Wetland change in highly developed cities (e.g., Guangzhou, Shenzhen, and Dongguan) was driven by the anthropogenic factors of population growth and urban expansion, while climate factors and aquaculture presented a stronger influence on the wetland change of underdeveloped cities (e.g., Jiangmen, Zhuhai, Huizhou, and Zhongshan).
There exists a significant difference when comparing the Landsat derived GBA wetland maps with other publicly available datasets. The discrepancy can be largely attributed to the difference in the classification accuracy among different wetland types. Some recently launched Earth-observing satellites’ sensors (i.e., Gaofen-1/2/4/6 WFI, Sentinel-2A/B MSI) generally have a higher spatial resolution and a shorter revisit period compared with the sensors on board Landsat. It is believed that the application of these satellite data would improve the wetland classification accuracy and promote the understanding of wetland change at the global and regional scale.
Author Contributions
K.S. designed the study, performed the experiments, and wrote the original manuscript. W.Y. contributed to the interpretation and discussion of the results. All authors have read and agreed to the published version of the manuscript.
Funding
This research was financially funded by the Key Laboratory of Marine Ecological Conservation and Restoration, the Ministry of Natural Resources/Fujian Provincial Key Laboratory of Marine Ecological Conservation and Restoration (Grant No. EPR2021005), and the National Key R&D Program of China (Grant No. 2022YFF0802203).
Data Availability Statement
The data presented in this study are available upon reasonable request from the corresponding author.
Conflicts of Interest
The authors declare no conflicts of interest.
References
- Ma, Z.; Melville, D.S.; Liu, J.; Chen, Y.; Yang, H.; Ren, W.; Zhang, Z.; Piersma, T.; Li, B. Rethinking China’s new great wall. Science 2014, 346, 912–914. [Google Scholar] [CrossRef] [PubMed]
- Schuerch, M.; Spencer, T.; Temmerman, S.; Kirwan, M.L.; Wolff, C.; Lincke, D.; McOwen, C.J.; Pickering, M.D.; Reef, R.; Vafeidis, A.T.; et al. Future response of global coastal wetlands to sea-level rise. Nature 2018, 561, 231–234. [Google Scholar] [CrossRef] [PubMed]
- Brown, C.J.; Adame, M.F.; Buelow, C.A.; Frassl, M.A.; Lee, S.Y.; Mackey, B.; McClure, E.C.; Pearson, R.M.; Rajkaran, A.; Rayner, T.S.; et al. Opportunities for improving recognition of coastal wetlands in global ecosystem assessment frameworks. Ecol. Indic. 2021, 126, 107694. [Google Scholar] [CrossRef]
- Vitousek, P.M.; Mooney, H.A.; Lubchenco, J.; Melillo, J.M. Human Domination of Earth’s Ecosystems. Science 1997, 277, 494–499. [Google Scholar] [CrossRef]
- Allan, H.; Levin, N.; Kark, S. Quantifying and mapping the human footprint across Earth’s coastal areas. Ocean. Coast. Manag. 2023, 236, 106476. [Google Scholar] [CrossRef]
- Jin, X.; Luan, W.; Yang, J.; Yue, W.; Wan, S.; Yang, D.; Xiao, X.; Xue, B.; Dou, Y.; Lyu, F.; et al. From the coast to the interior: Global economic evolution patterns and mechanisms. Humanit. Soc. Sci. Commun. 2023, 10, 723. [Google Scholar] [CrossRef]
- Spencer, T.; Schuerch, M.; Nicholls, R.J.; Hinkel, J.; Lincke, D.; Vafeidis, A.T.; Reef, R.; McFadden, L.; Brown, S. Global coastal wetland change under sea-level rise and related stresses: The DIVA Wetland Change Model. Glob. Planet. Chang. 2016, 139, 15–30. [Google Scholar] [CrossRef]
- Salimi, S.; Almuktar, S.A.A.A.N.; Scholz, M. Impact of climate change on wetland ecosystems: A critical review of experimental wetlands. J. Environ. Manag. 2021, 286, 112160. [Google Scholar] [CrossRef]
- Fluet-Chouinard, E.; Stocker, B.D.; Zhang, Z.; Malhotra, A.; Melton, J.R.; Poulter, B.; Kaplan, J.O.; Goldewijk, K.K.; Siebert, S.; Minayeva, T.; et al. Extensive global wetland loss over the past three centuries. Nature 2023, 614, 281–286. [Google Scholar] [CrossRef]
- Murray, N.J.; Worthington, T.A.; Bunting, P.; Duce, S.; Hagger, V.; Lovelock, C.E.; Lucas, R.; Saunders, M.I.; Sheaves, M.; Spalding, M.; et al. High-resolution mapping of losses and gains of Earth’s tidal wetlands. Science 2022, 376, 744–749. [Google Scholar] [CrossRef]
- Murray, N.J.; Phinn, S.P.; Fuller, R.A.; DeWitt, M.; Ferrari, R.; Johnston, R.; Clinton, N.; Lyons, M.B. High-resolution global maps of tidal flat ecosystems from 1984 to 2019. Sci. Data 2022, 9, 542. [Google Scholar] [CrossRef]
- Hagger, V.; Worthington, T.A.; Lovelock, C.E.; Adame, M.F.; Amano, T.; Brown, B.M.; Friess, D.A.; Landis, E.; Mumby, P.J.; Morrison, T.H.; et al. Drivers of global mangrove loss and gain in social-ecological systems. Nat. Commun. 2022, 13, 6373. [Google Scholar] [CrossRef]
- Campbell, A.D.; Fatoyinbo, L.; Goldberg, L.; Lagomasino, D. Global hotspots of salt marsh change and carbon emissions. Nature 2022, 612, 701–706. [Google Scholar] [CrossRef] [PubMed]
- Ban, Y.; Gong, P.; Giri, C. Global land cover mapping using Earth observation satellite data: Recent progresses and challenges. ISPRS J. Photogramm. Remote Sens. 2015, 103, 1–6. [Google Scholar] [CrossRef]
- Hu, S.; Niu, Z.; Chen, Y.; Li, L.; Zhang, H. Global wetlands: Potential distribution, wetland loss, and status. Sci. Total Environ. 2017, 586, 319–327. [Google Scholar] [CrossRef] [PubMed]
- Hansen, M.C.; Loveland, T.R. A review of large area monitoring of land cover change using Landsat data. Remote Sens. Environ. 2012, 122, 66–74. [Google Scholar] [CrossRef]
- Zhu, Z. Change detection using landsat time series: A review of frequencies, preprocessing, algorithms, and applications. ISPRS J. Photogramm. Remote Sens. 2017, 130, 370–384. [Google Scholar] [CrossRef]
- Giri, C.; Ochieng, E.; Tieszen, L.L.; Zhu, Z.; Singh, A.; Loveland, T.; Masek, J.; Duke, N. Status and distribution of mangrove forests of the world using earth observation satellite data. Glob. Ecol. Biogeogr. 2011, 20, 154–159. [Google Scholar] [CrossRef]
- Wang, Z.; Zhang, J.; Yang, X.; Huang, C.; Su, F.; Liu, X.; Liu, Y.; Zhang, Y. Global mapping of the landside clustering of aquaculture ponds from dense time-series 10 m Sentinel-2 images on Google Earth Engine. Int. J. Appl. Earth Obs. Geoinf. 2022, 115, 103100. [Google Scholar] [CrossRef]
- Duan, Y.; Tian, B.; Li, X.; Liu, D.; Sengupta, D.; Wang, Y.; Peng, Y. Tracking changes in aquaculture ponds on the China coast using 30 years of Landsat images. Int. J. Appl. Earth Obs. Geoinf. 2021, 102, 102383. [Google Scholar] [CrossRef]
- Wang, X.; Xiao, X.; Xu, X.; Zou, Z.; Chen, B.; Qin, Y.; Zhang, X.; Dong, J.; Liu, D.; Pan, L.; et al. Rebound in China’s coastal wetlands following conservation and restoration. Nat. Sustain. 2021, 4, 1076–1083. [Google Scholar] [CrossRef]
- Brown, C.F.; Brumby, S.P.; Guzder-Williams, B.; Birch, T.; Hyde, S.B.; Mazzariello, J.; Czerwinski, W.; Pasquarella, V.J.; Haertel, R.; Ilyushchenko, S.; et al. Dynamic World, Near real-time global 10 m land use land cover mapping. Sci. Data 2022, 9, 251. [Google Scholar] [CrossRef]
- Jokar Arsanjani, J.; Tayyebi, A.; Vaz, E. GlobeLand30 as an alternative fine-scale global land cover map: Challenges, possibilities, and implications for developing countries. Habitat Int. 2016, 55, 25–31. [Google Scholar] [CrossRef]
- Fu, Y.; Lin, Q.; Grifoll, M.; Lam, J.S.L.; Feng, H. Investigating the evolution of the Guangdong-Hong Kong-Macao Greater Bay Area (GBA) multi-port system: The multi-faced perspectives. Ocean Coast. Manag. 2023, 233, 106450. [Google Scholar] [CrossRef]
- Ding, Q.; Shao, Z.; Huang, X.; Altan, O.; Hu, B. Time-series land cover mapping and urban expansion analysis using OpenStreetMap data and remote sensing big data: A case study of Guangdong-Hong Kong-Macao Greater Bay Area, China. Int. J. Appl. Earth Obs. Geoinf. 2022, 113, 103001. [Google Scholar] [CrossRef]
- Liu, J.; Zhang, Z.; Xu, X.; Kuang, W.; Zhou, W.; Zhang, S.; Li, R.; Yan, C.; Yu, D.; Wu, S.; et al. Spatial patterns and driving forces of land use change in China during the early 21st century. J. Geogr. Sci. 2010, 20, 483–494. [Google Scholar] [CrossRef]
- Liu, J.; Liu, M.; Zhuang, D.; Zhang, Z.; Deng, X. Study on spatial pattern of land-use change in China during 1995–2000. Sci. China Ser. D Earth Sci. 2003, 46, 373–384. [Google Scholar] [CrossRef]
- Liu, J.; Kuang, W.; Zhang, Z.; Xu, X.; Qin, Y.; Ning, J.; Zhou, W.; Zhang, S.; Li, R.; Yan, C.; et al. Spatiotemporal characteristics, patterns, and causes of land-use changes in China since the late 1980s. J. Geogr. Sci. 2014, 24, 195–210. [Google Scholar] [CrossRef]
- Mao, D.; Wang, Z.; Du, B.; Li, L.; Tian, Y.; Jia, M.; Zeng, Y.; Song, K.; Jiang, M.; Wang, Y. National wetland mapping in China: A new product resulting from object-based and hierarchical classification of Landsat 8 OLI images. ISPRS J. Photogramm. Remote Sens. 2020, 164, 11–25. [Google Scholar] [CrossRef]
- Long, H.; Qu, Y. Land use transitions and land management: A mutual feedback perspective. Land Use Policy 2018, 74, 111–120. [Google Scholar] [CrossRef]
- Lamine, S.; Petropoulos, G.P.; Singh, S.K.; Szabó, S.; Bachari, N.E.I.; Srivastava, P.K.; Suman, S. Quantifying land use/land cover spatio-temporal landscape pattern dynamics from Hyperion using SVMs classifier and FRAGSTATS®. Geocarto Int. 2018, 33, 862–878. [Google Scholar] [CrossRef]
- Lever, J.; Krzywinski, M.; Altman, N. Principal component analysis. Nat. Methods 2017, 14, 641–642. [Google Scholar] [CrossRef]
- Winkler, K.; Fuchs, R.; Rounsevell, M.; Herold, M. Global land use changes are four times greater than previously estimated. Nat. Commun. 2021, 12, 2501. [Google Scholar] [CrossRef] [PubMed]
- Song, X.-P.; Hansen, M.C.; Stehman, S.V.; Potapov, P.V.; Tyukavina, A.; Vermote, E.F.; Townshend, J.R. Global land change from 1982 to 2016. Nature 2018, 560, 639–643. [Google Scholar] [CrossRef]
- Ren, C.; Wang, Z.; Zhang, Y.; Zhang, B.; Chen, L.; Xi, Y.; Xiao, X.; Doughty, R.B.; Liu, M.; Jia, M.; et al. Rapid expansion of coastal aquaculture ponds in China from Landsat observations during 1984–2016. Int. J. Appl. Earth Obs. Geoinf. 2019, 82, 101902. [Google Scholar] [CrossRef]
- Osland, M.J.; Chivoiu, B.; Enwright, N.M.; Thorne, K.M.; Guntenspergen, G.R.; Grace, J.B.; Dale, L.L.; Brooks, W.; Herold, N.; Day, J.W.; et al. Migration and transformation of coastal wetlands in response to rising seas. Sci. Adv. 2022, 8, eabo5174. [Google Scholar] [CrossRef] [PubMed]
- Wu, L.; Sun, C.; Fan, F. Estimating the Characteristic Spatiotemporal Variation in Habitat Quality Using the InVEST Model—A Case Study from Guangdong–Hong Kong–Macao Greater Bay Area. Remote Sens. 2021, 13, 1008. [Google Scholar] [CrossRef]
- Zhang, J.; Li, X.; Zhang, C.; Yu, L.; Wang, J.; Wu, X.; Hu, Z.; Zhai, Z.; Li, Q.; Wu, G.; et al. Assessing spatiotemporal variations and predicting changes in ecosystem service values in the Guangdong–Hong Kong–Macao Greater Bay Area. GISci. Remote Sens. 2022, 59, 184–199. [Google Scholar] [CrossRef]
- Zhang, R.; Chen, S.; Gao, L.; Hu, J. Spatiotemporal evolution and impact mechanism of ecological vulnerability in the Guangdong–Hong Kong–Macao Greater Bay Area. Ecol. Indic. 2023, 157, 111214. [Google Scholar] [CrossRef]
- Deng, Y.; Jiang, W.; Wu, Z.; Peng, K.; Ling, Z.; Li, Z.; Wang, X. Assessing and Characterizing Carbon Storage in Wetlands of the Guangdong–Hong Kong–Macau Greater Bay Area, China, During 1995–2020. IEEE J. Sel. Top. Appl. Earth Obs. Remote Sens. 2022, 15, 6110–6120. [Google Scholar] [CrossRef]
- Cybulski, J.D.; Husa, S.M.; Duprey, N.N.; Mamo, B.L.; Tsang, T.P.N.; Yasuhara, M.; Xie, J.Y.; Qiu, J.-W.; Yokoyama, Y.; Baker, D.M. Coral reef diversity losses in China’s Greater Bay Area were driven by regional stressors. Sci. Adv. 2020, 6, eabb1046. [Google Scholar] [CrossRef] [PubMed]
- Zhang, M.; Hong, Y.; Zou, F.; Zhang, Q.; Fan, H.; Chan, S.; Cheong, K.-t.; Leong, K.-F. Response of shorebird habitat selection to coastal reclamation and urbanization in an extensively developed delta: A case study in Macao, China. Ocean Coast. Manag. 2019, 179, 104871. [Google Scholar] [CrossRef]
- Sun, Z.; Sun, W.; Tong, C.; Zeng, C.; Yu, X.; Mou, X. China’s coastal wetlands: Conservation history, implementation efforts, existing issues and strategies for future improvement. Environ. Int. 2015, 79, 25–41. [Google Scholar] [CrossRef]
- Guo, H.; Cai, Y.; Yang, Z.; Zhu, Z.; Ouyang, Y. Dynamic simulation of coastal wetlands for Guangdong-Hong Kong-Macao Greater Bay area based on multi-temporal Landsat images and FLUS model. Ecol. Indic. 2021, 125, 107559. [Google Scholar] [CrossRef]
- Chen, J.; Chen, J.; Liao, A.; Cao, X.; Chen, L.; Chen, X.; He, C.; Han, G.; Peng, S.; Lu, M.; et al. Global land cover mapping at 30m resolution: A POK-based operational approach. ISPRS J. Photogramm. Remote Sens. 2015, 103, 7–27. [Google Scholar] [CrossRef]
- Gumbricht, T.; Roman-Cuesta, R.M.; Verchot, L.; Herold, M.; Wittmann, F.; Householder, E.; Herold, N.; Murdiyarso, D. An expert system model for mapping tropical wetlands and peatlands reveals South America as the largest contributor. Glob. Chang. Biol. 2017, 23, 3581–3599. [Google Scholar] [CrossRef]
- Lehner, B.; Döll, P. Development and validation of a global database of lakes, reservoirs and wetlands. J. Hydrol. 2004, 296, 1–22. [Google Scholar] [CrossRef]
- Zhang, X.; Liu, L.; Zhao, T.; Chen, X.; Lin, S.; Wang, J.; Mi, J.; Liu, W. GWL_FCS30: A global 30m wetland map with a fine classification system using multi-sourced and time-series remote sensing imagery in 2020. Earth Syst. Sci. Data 2023, 15, 265–293. [Google Scholar] [CrossRef]
Figure 1.
Geographical location of the Greater Bay Area in China.
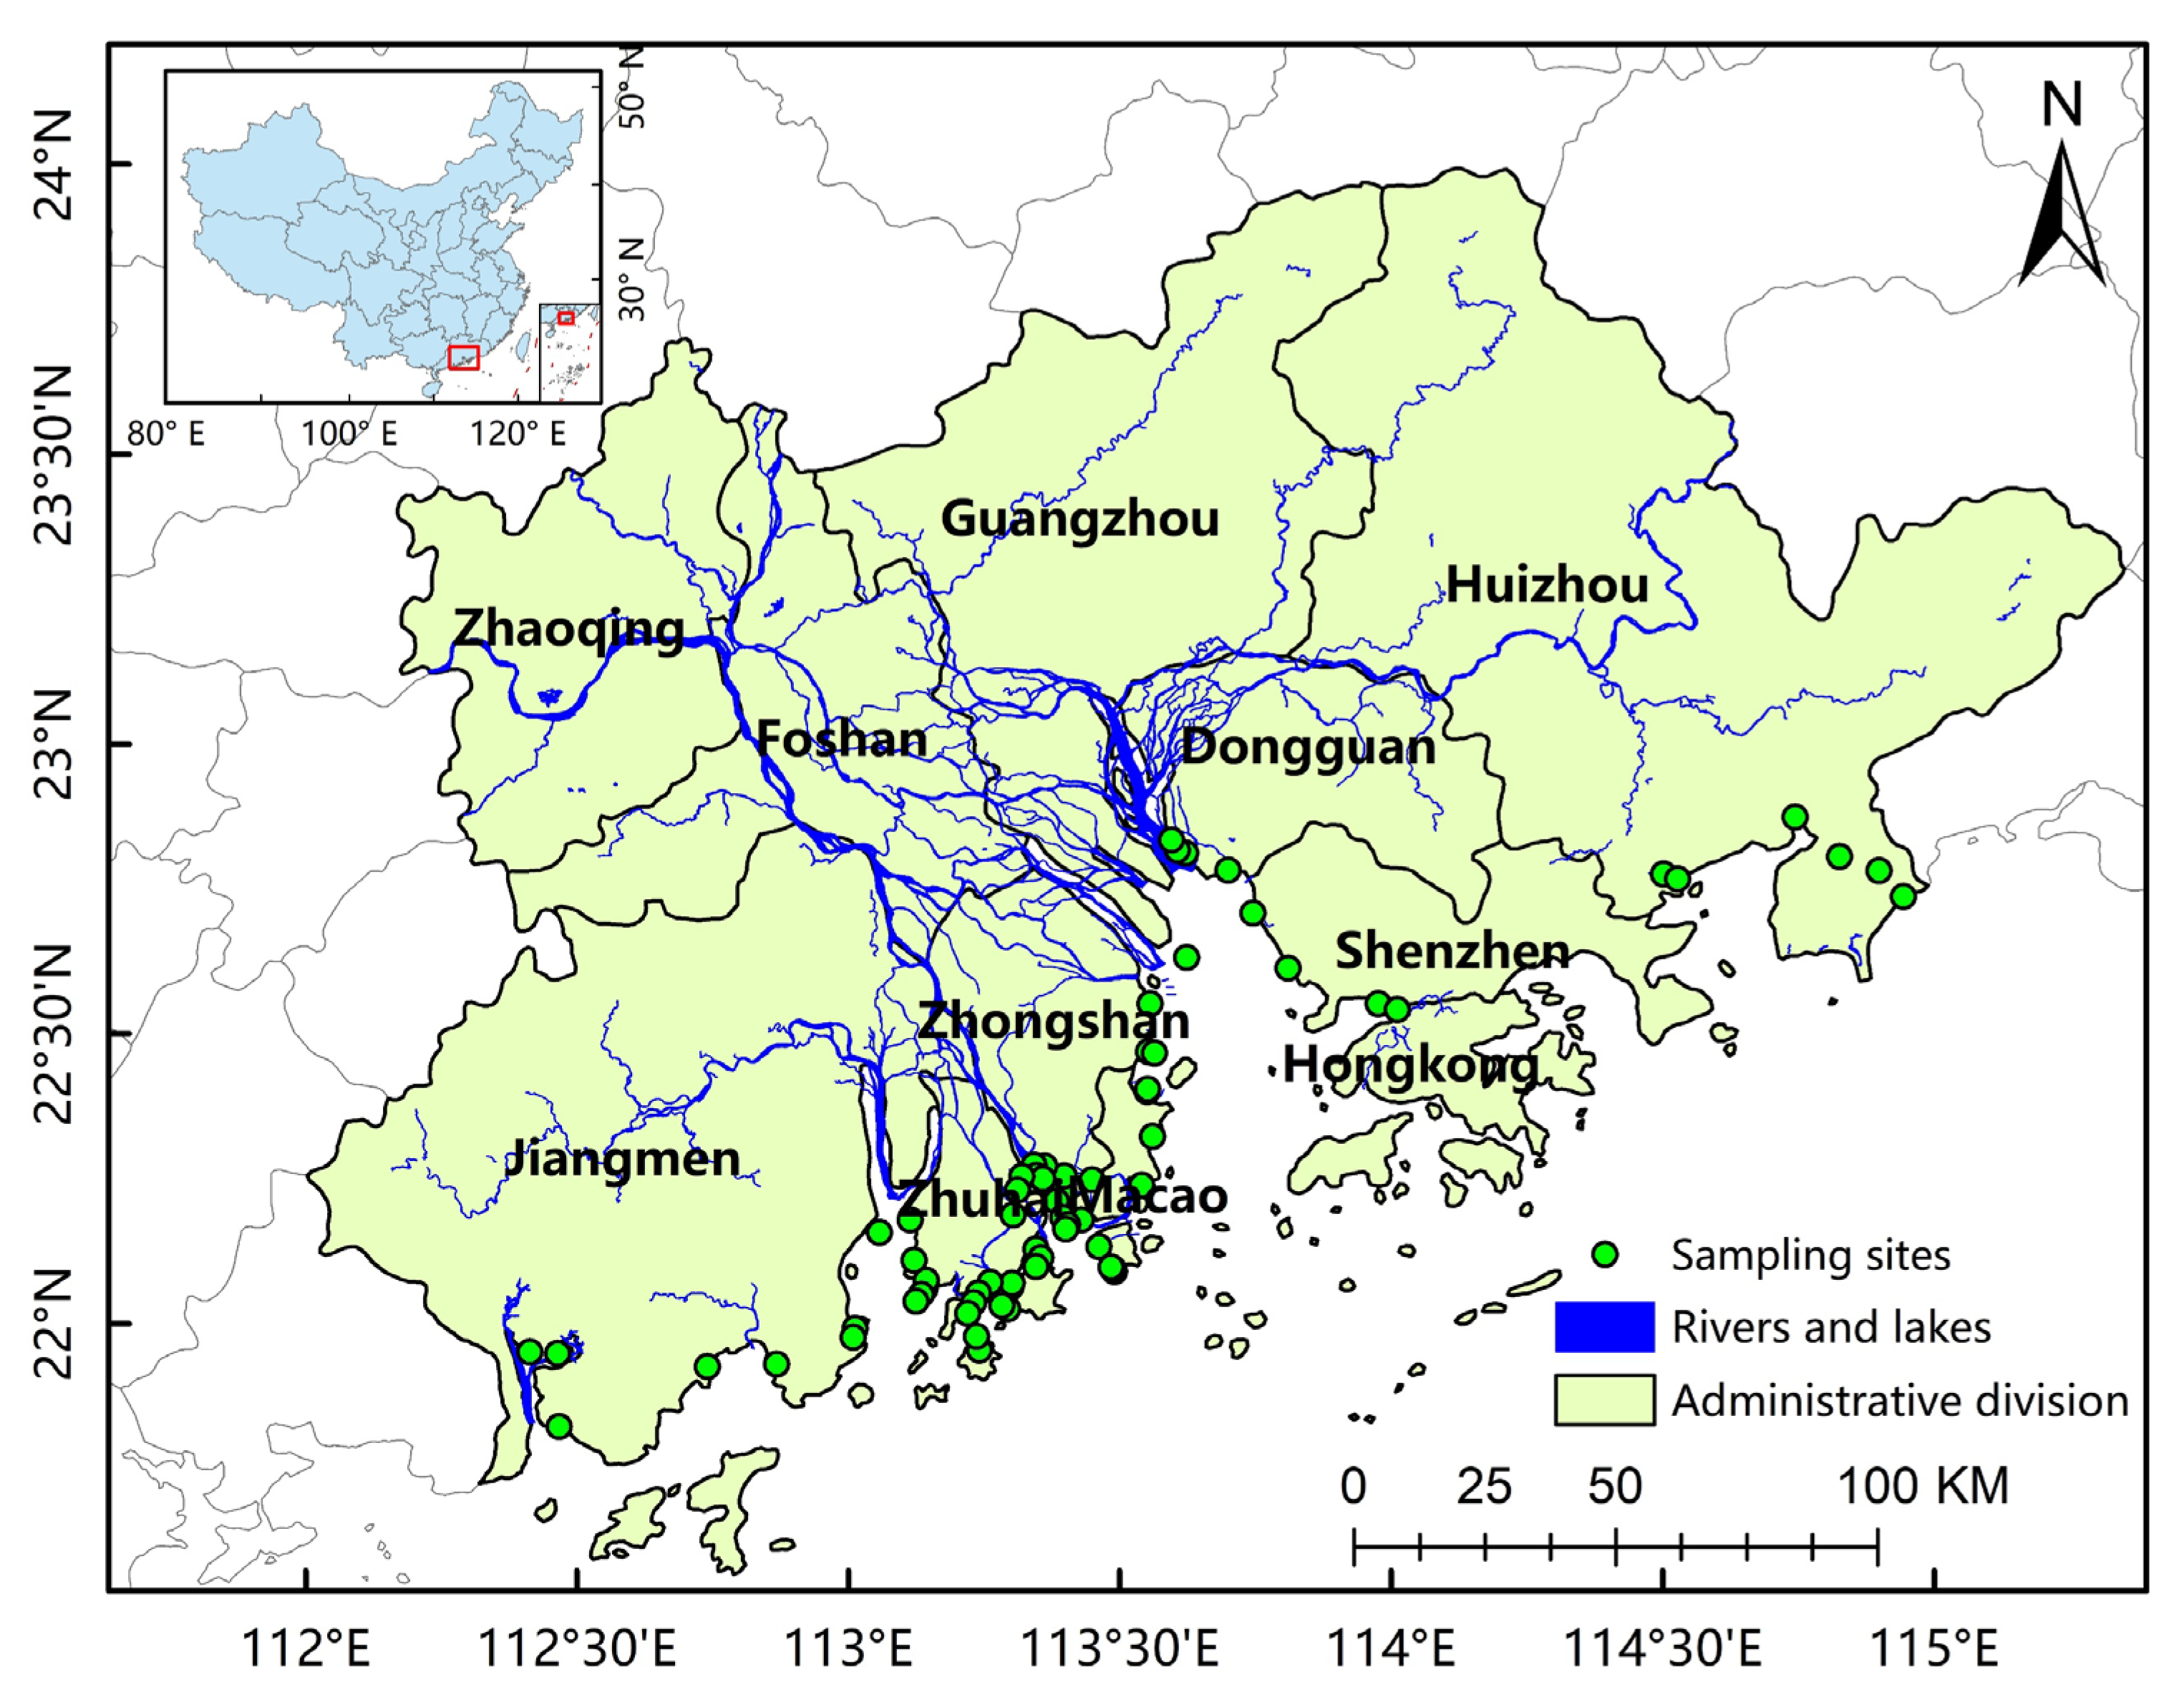
Figure 2.
Aerial photographs of typical wetland types in the GBA. (a) Ecological wetland park; (b) mangrove forest; (c) coastal natural wetland; (d) aquaculture pond; (e) agricultural reclamation area; (f) tidal flat.
Figure 2.
Aerial photographs of typical wetland types in the GBA. (a) Ecological wetland park; (b) mangrove forest; (c) coastal natural wetland; (d) aquaculture pond; (e) agricultural reclamation area; (f) tidal flat.
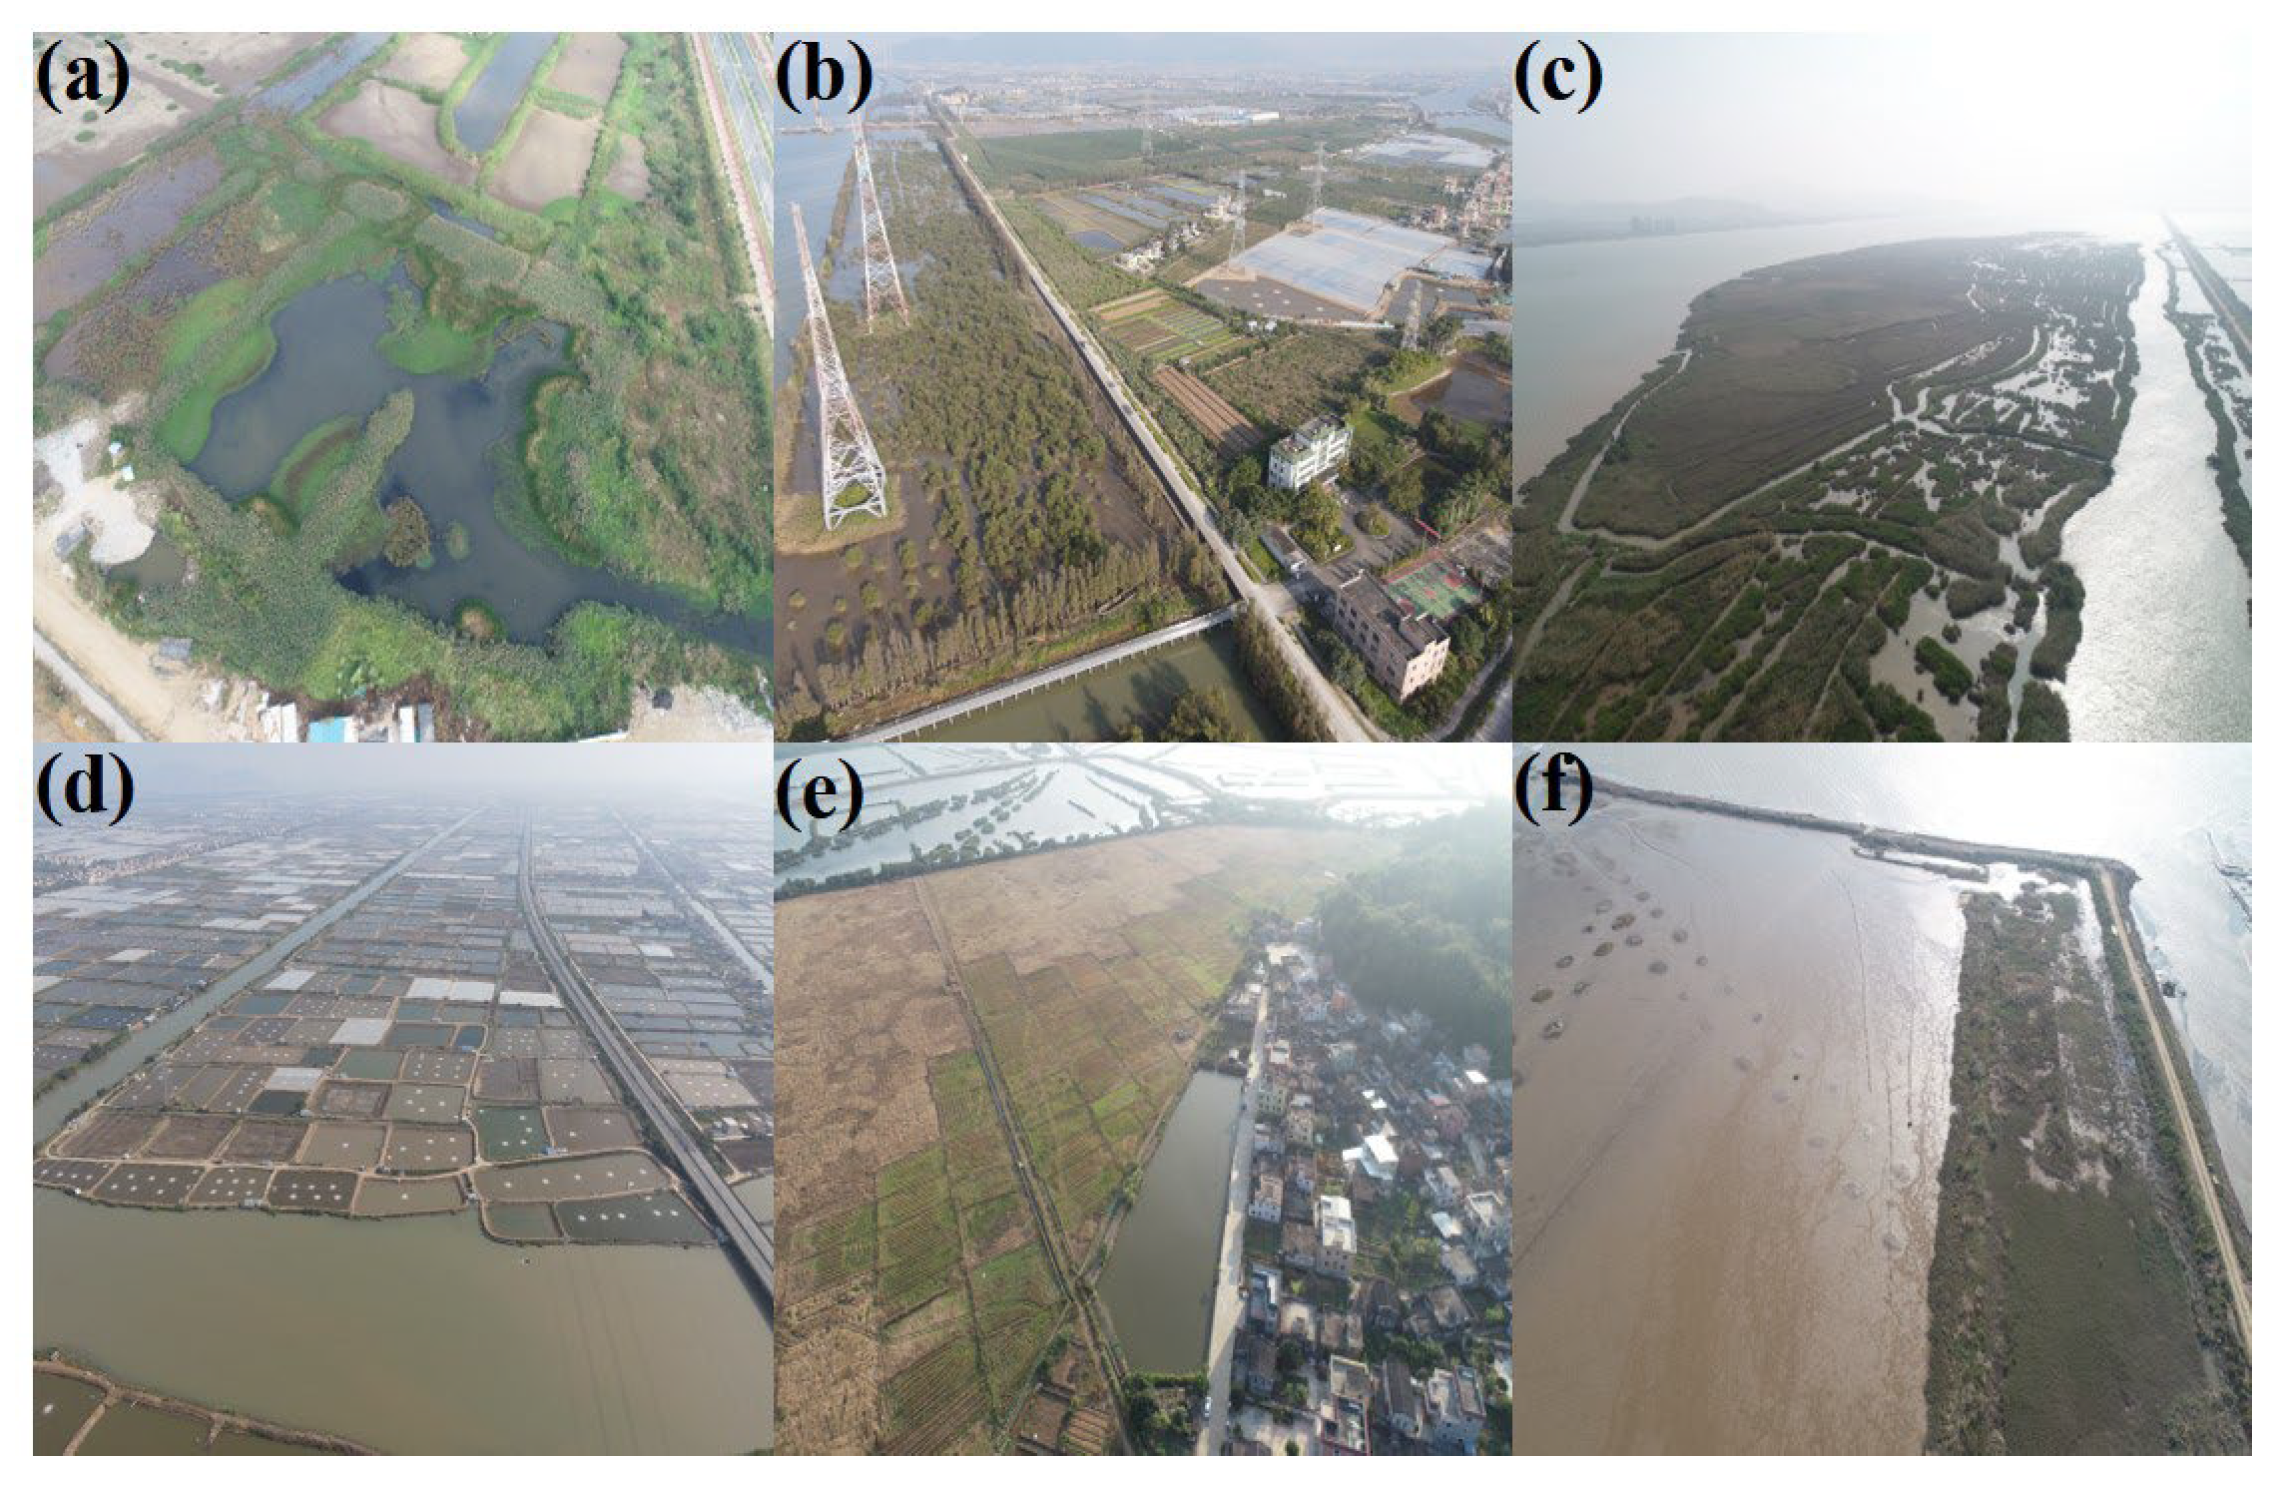
Figure 3.
Flowchart of research methodology.
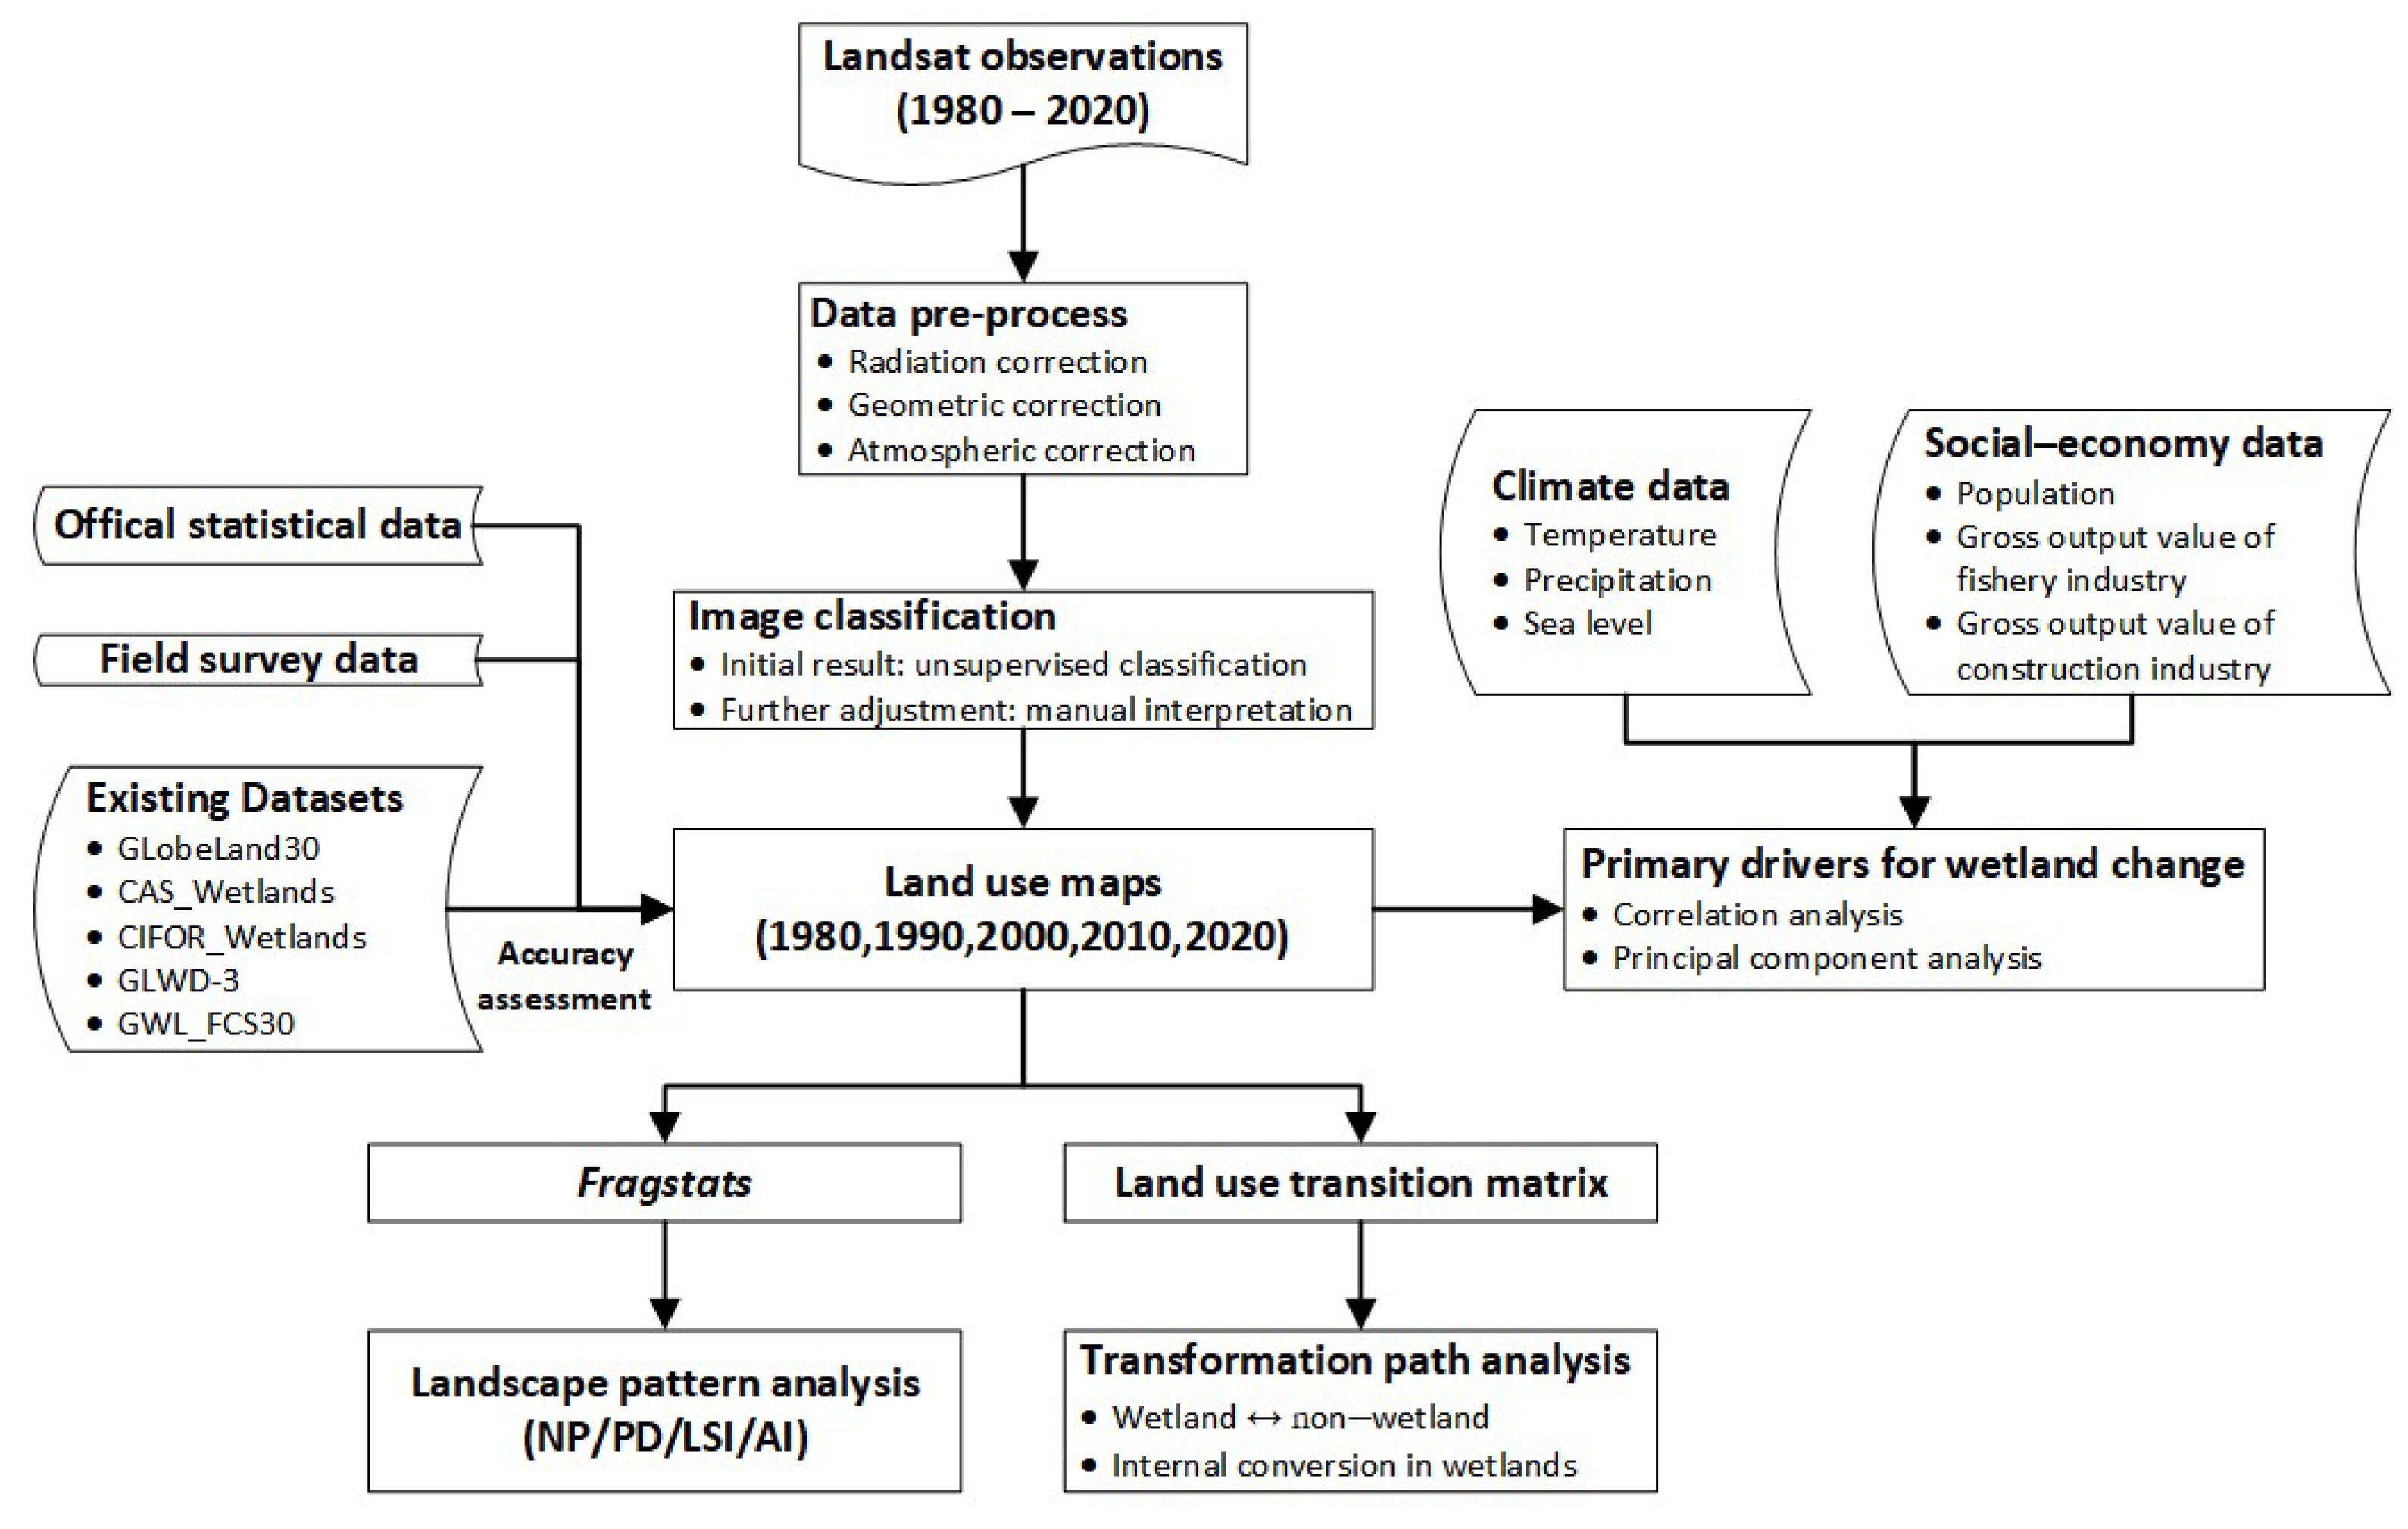
Figure 4.
LULC maps in the GBA from 1980 to 2020 at an interval of ten years.
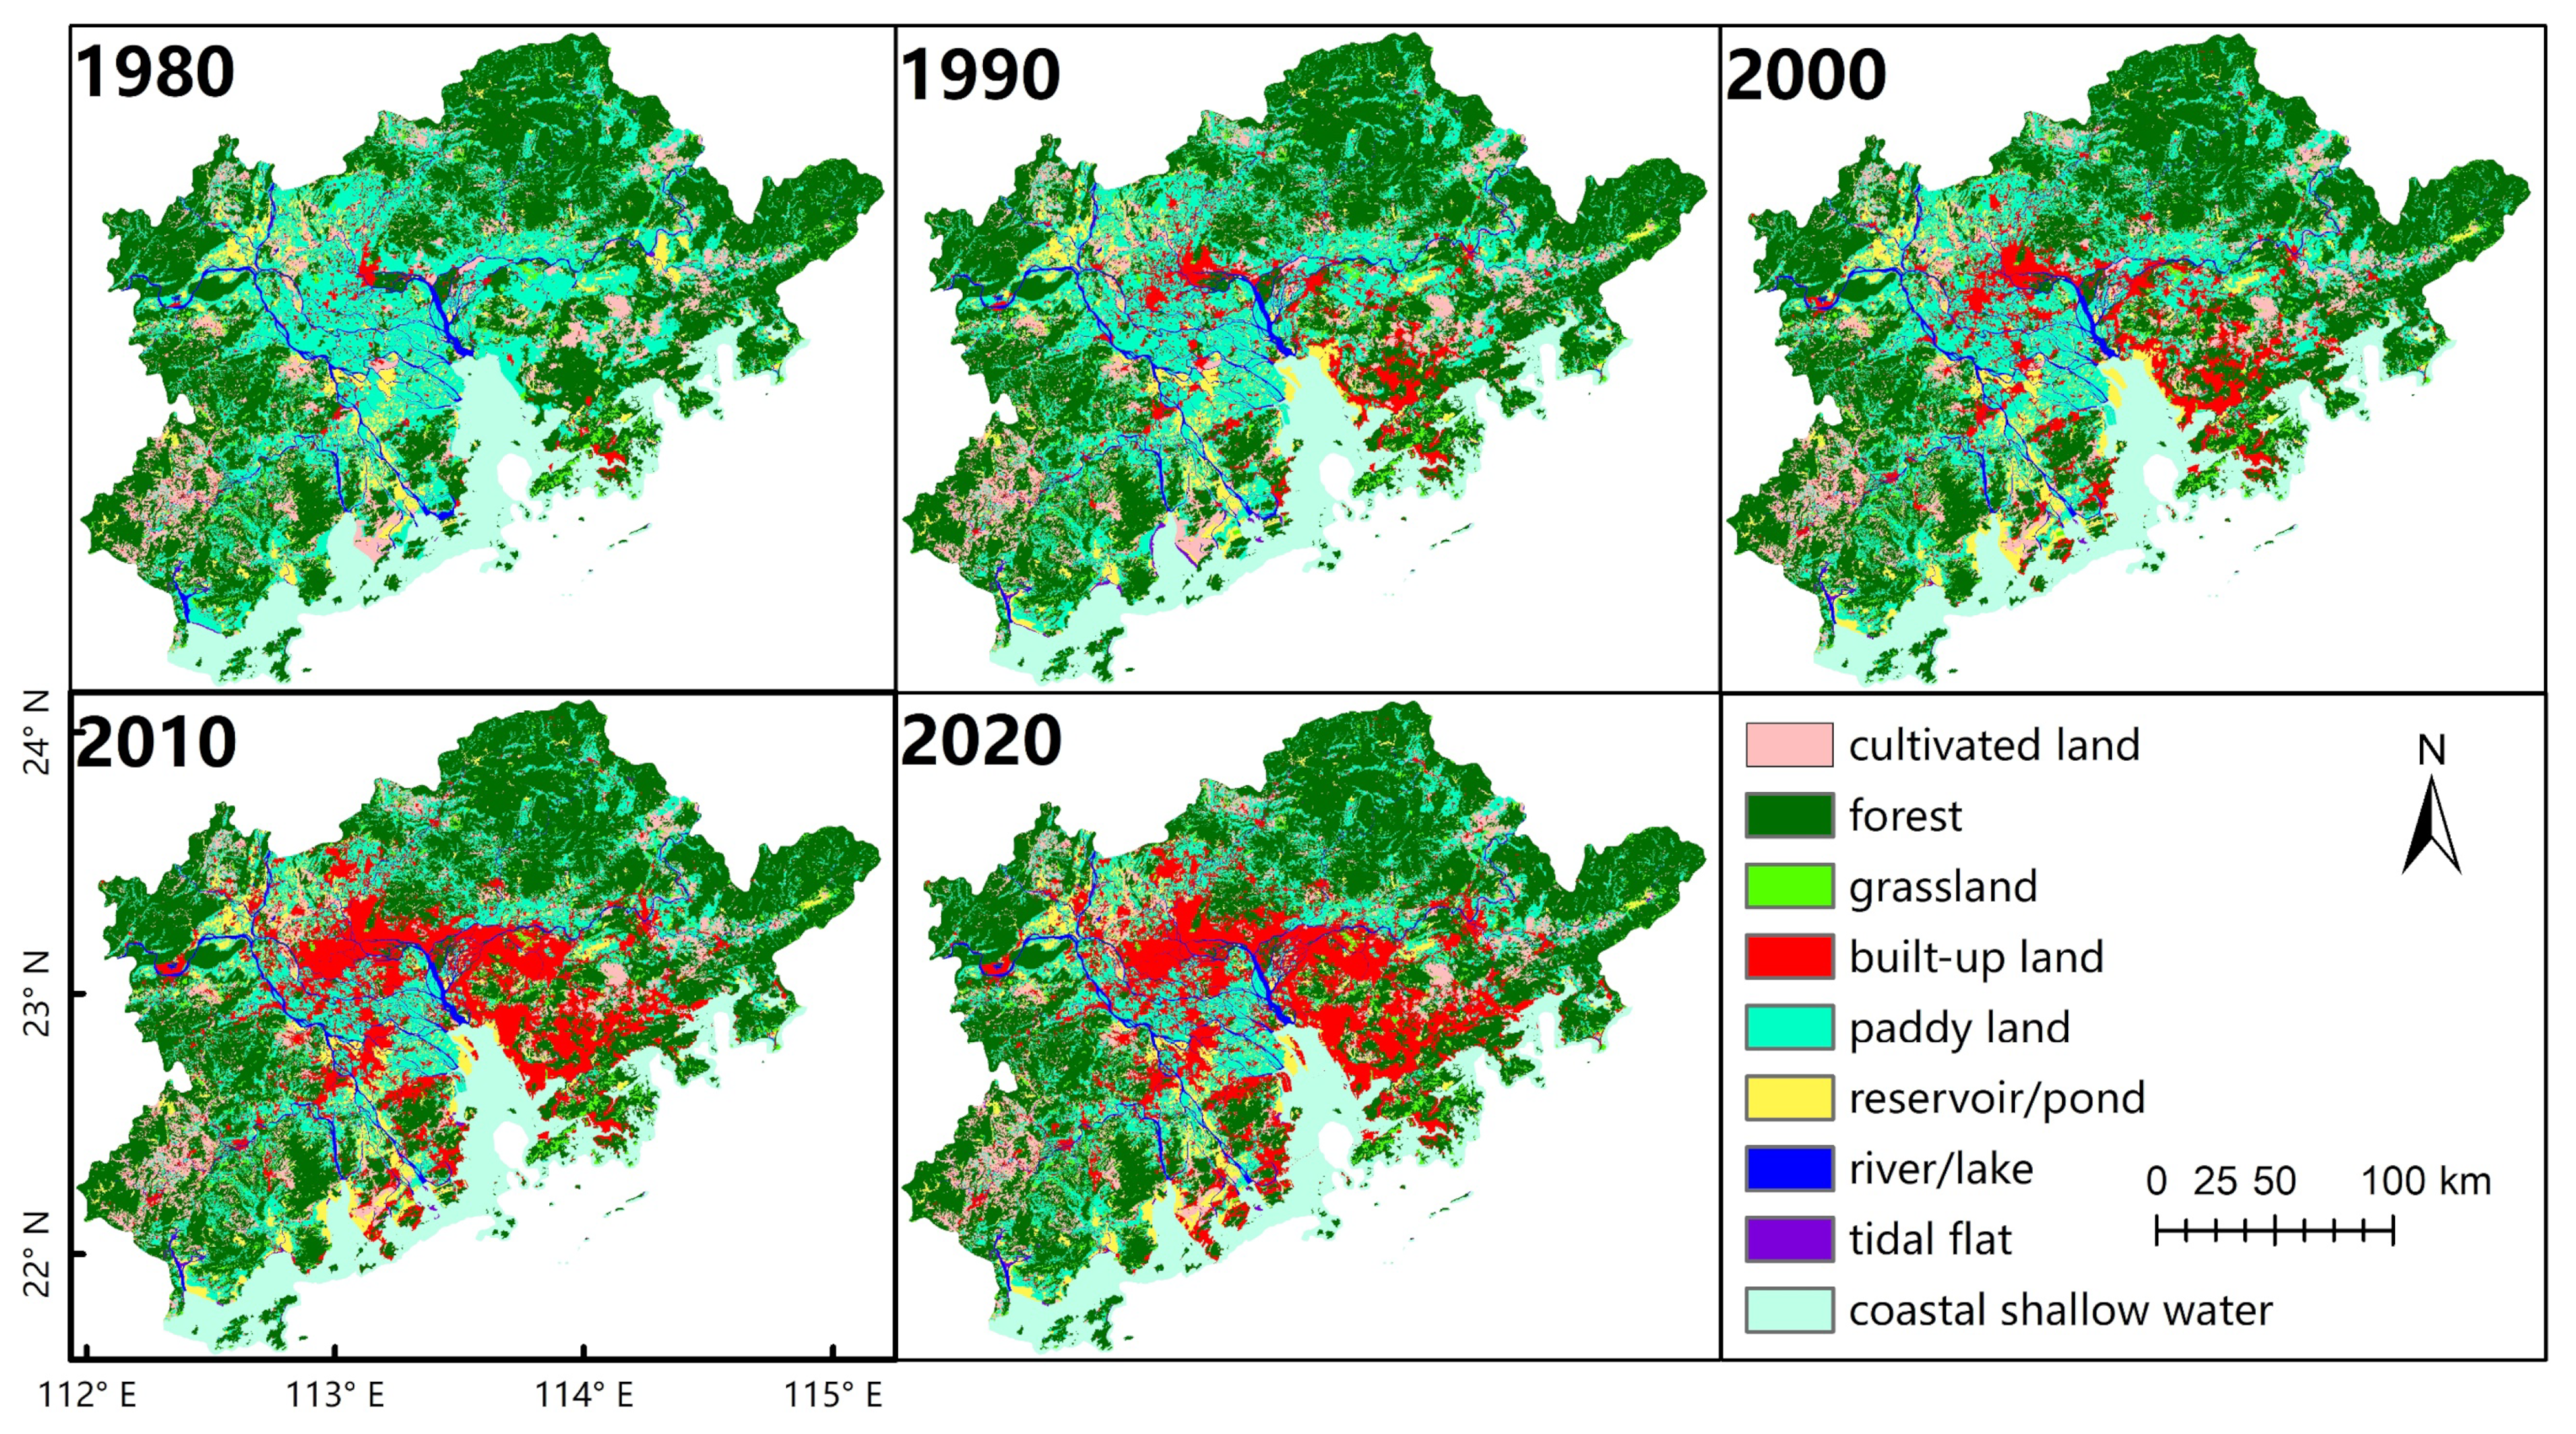
Figure 5.
Areal changes of different land use types during 1980–2020. (a) Five major land use types; (b) five major wetland types.
Figure 5.
Areal changes of different land use types during 1980–2020. (a) Five major land use types; (b) five major wetland types.
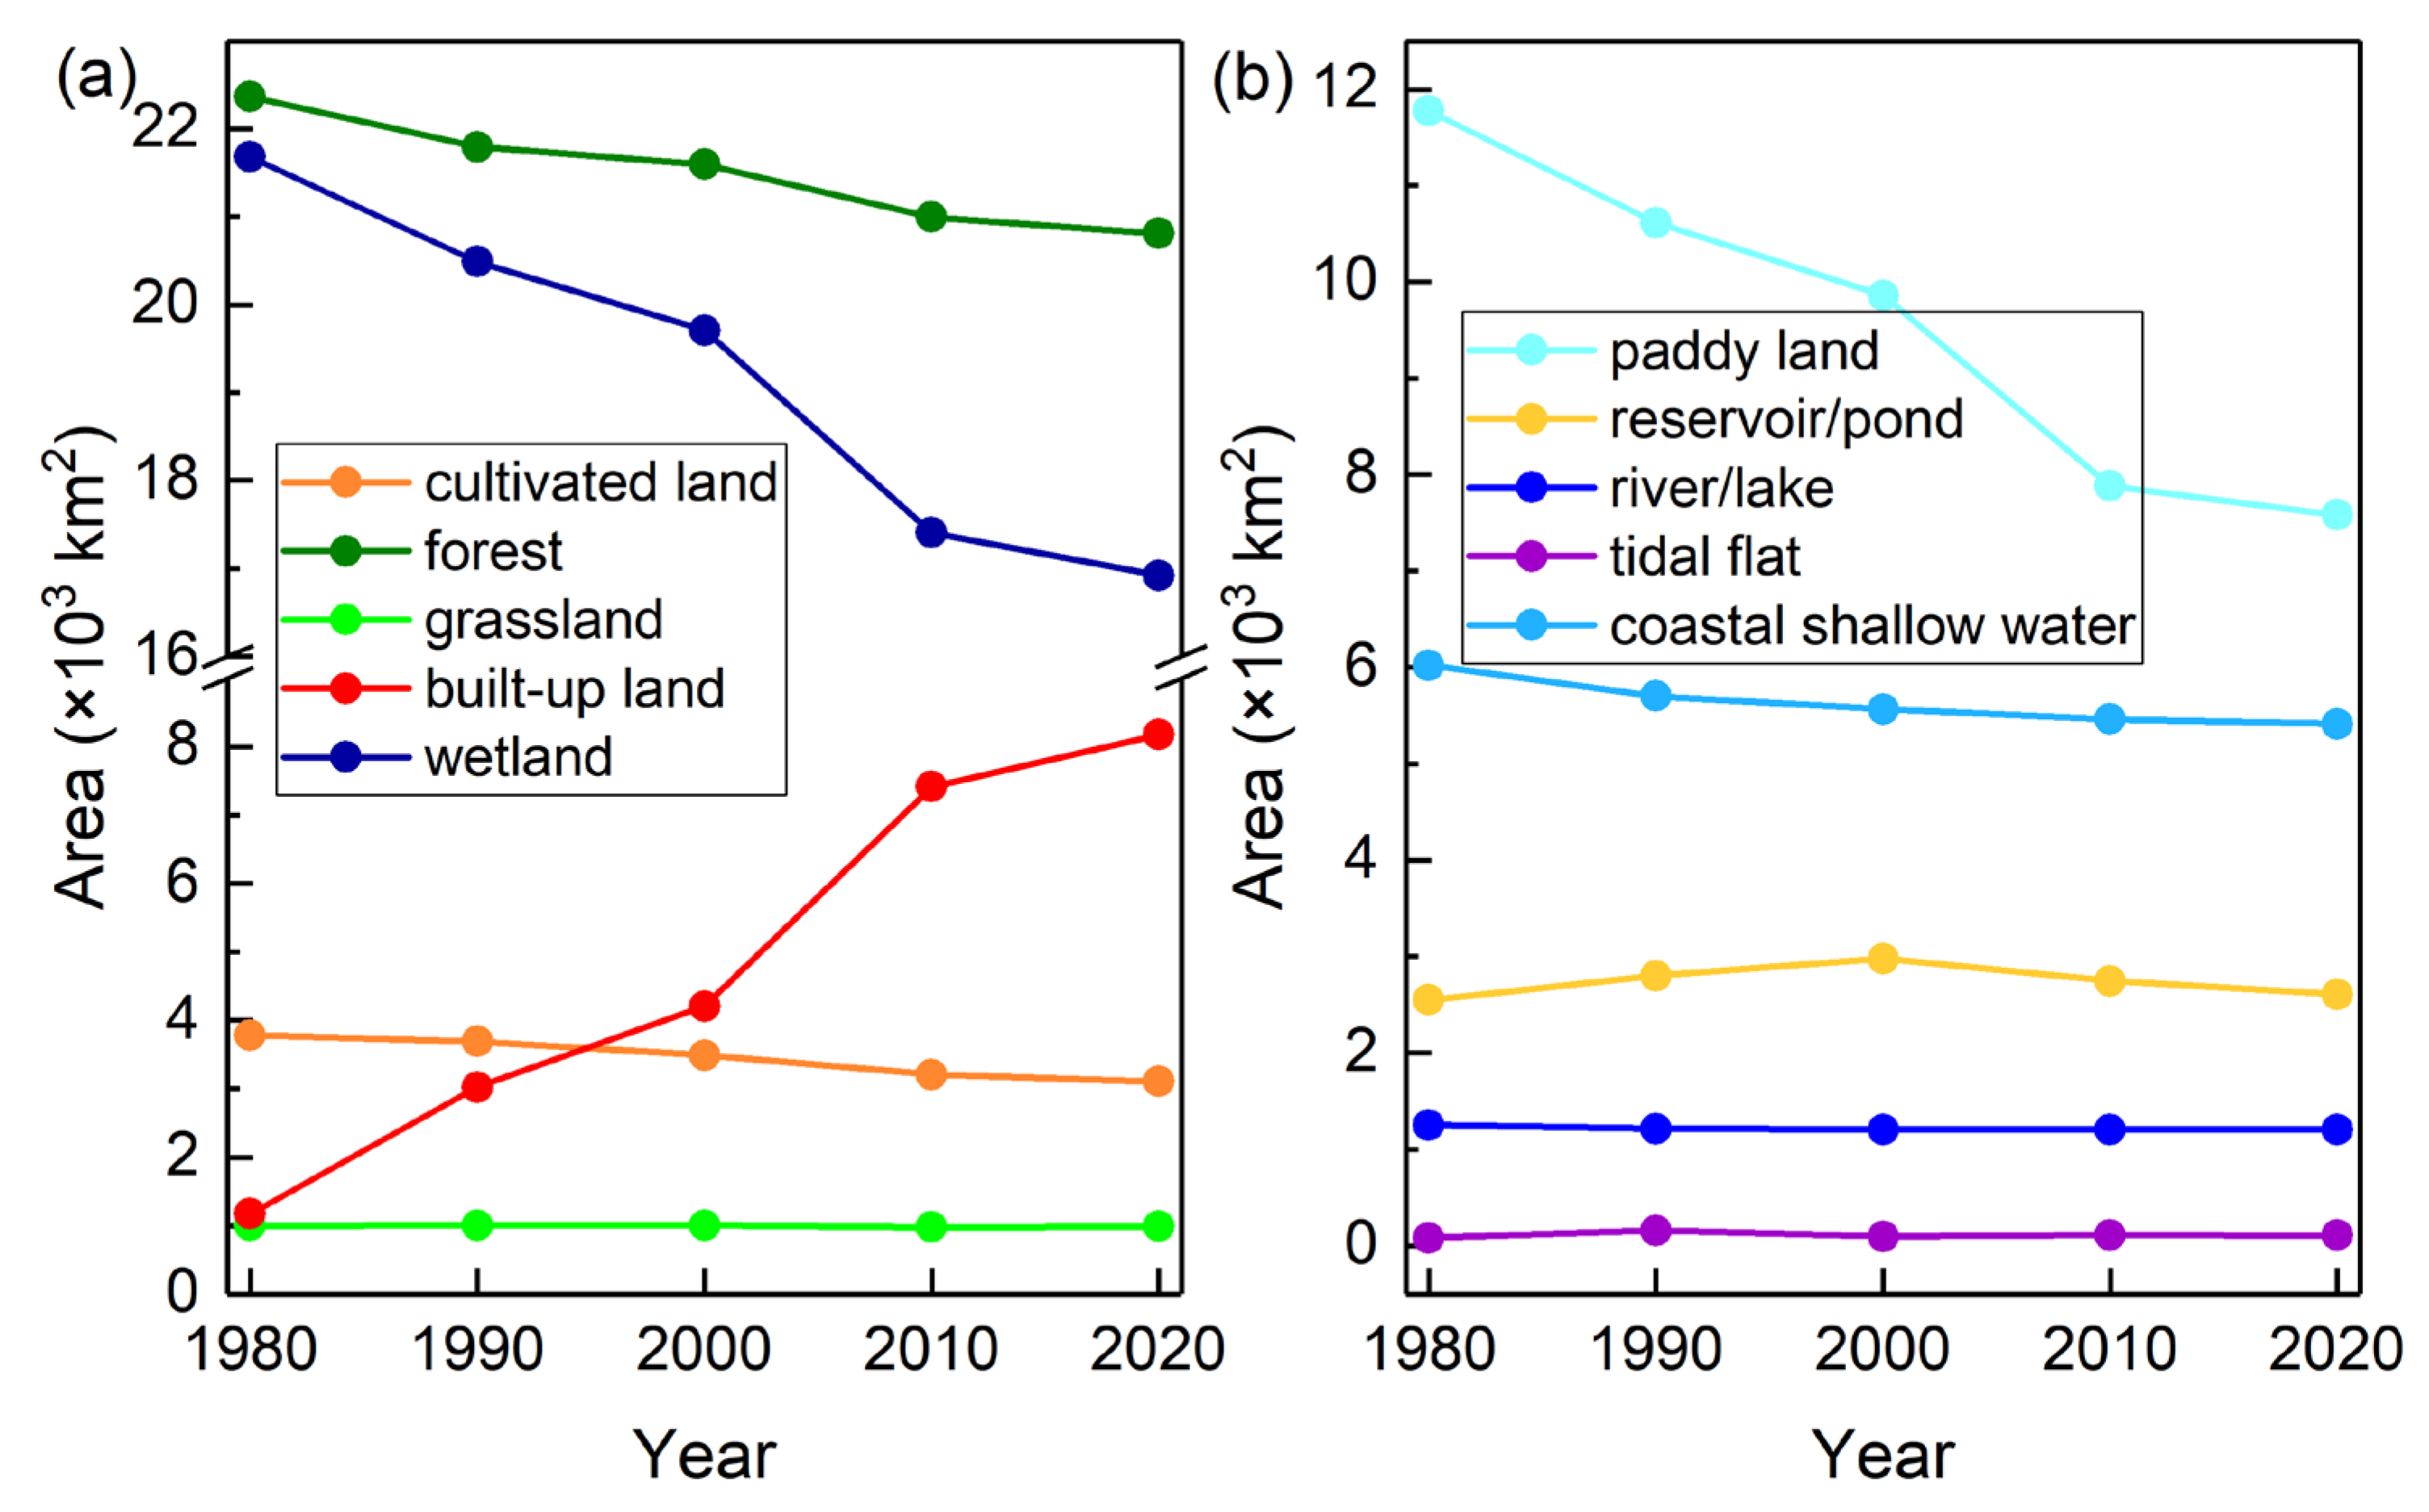
Figure 6.
Variation of landscape pattern indexes for five major land use types in the GBA during 1980–2020. (a) NP; (b) PD; (c) AI; (d) LSI.
Figure 6.
Variation of landscape pattern indexes for five major land use types in the GBA during 1980–2020. (a) NP; (b) PD; (c) AI; (d) LSI.

Figure 7.
Variation of landscape pattern indexes for different wetland types in the GBA during 1980–2020. (a) NP; (b) PD; (c) AI; (d) LSI.
Figure 7.
Variation of landscape pattern indexes for different wetland types in the GBA during 1980–2020. (a) NP; (b) PD; (c) AI; (d) LSI.
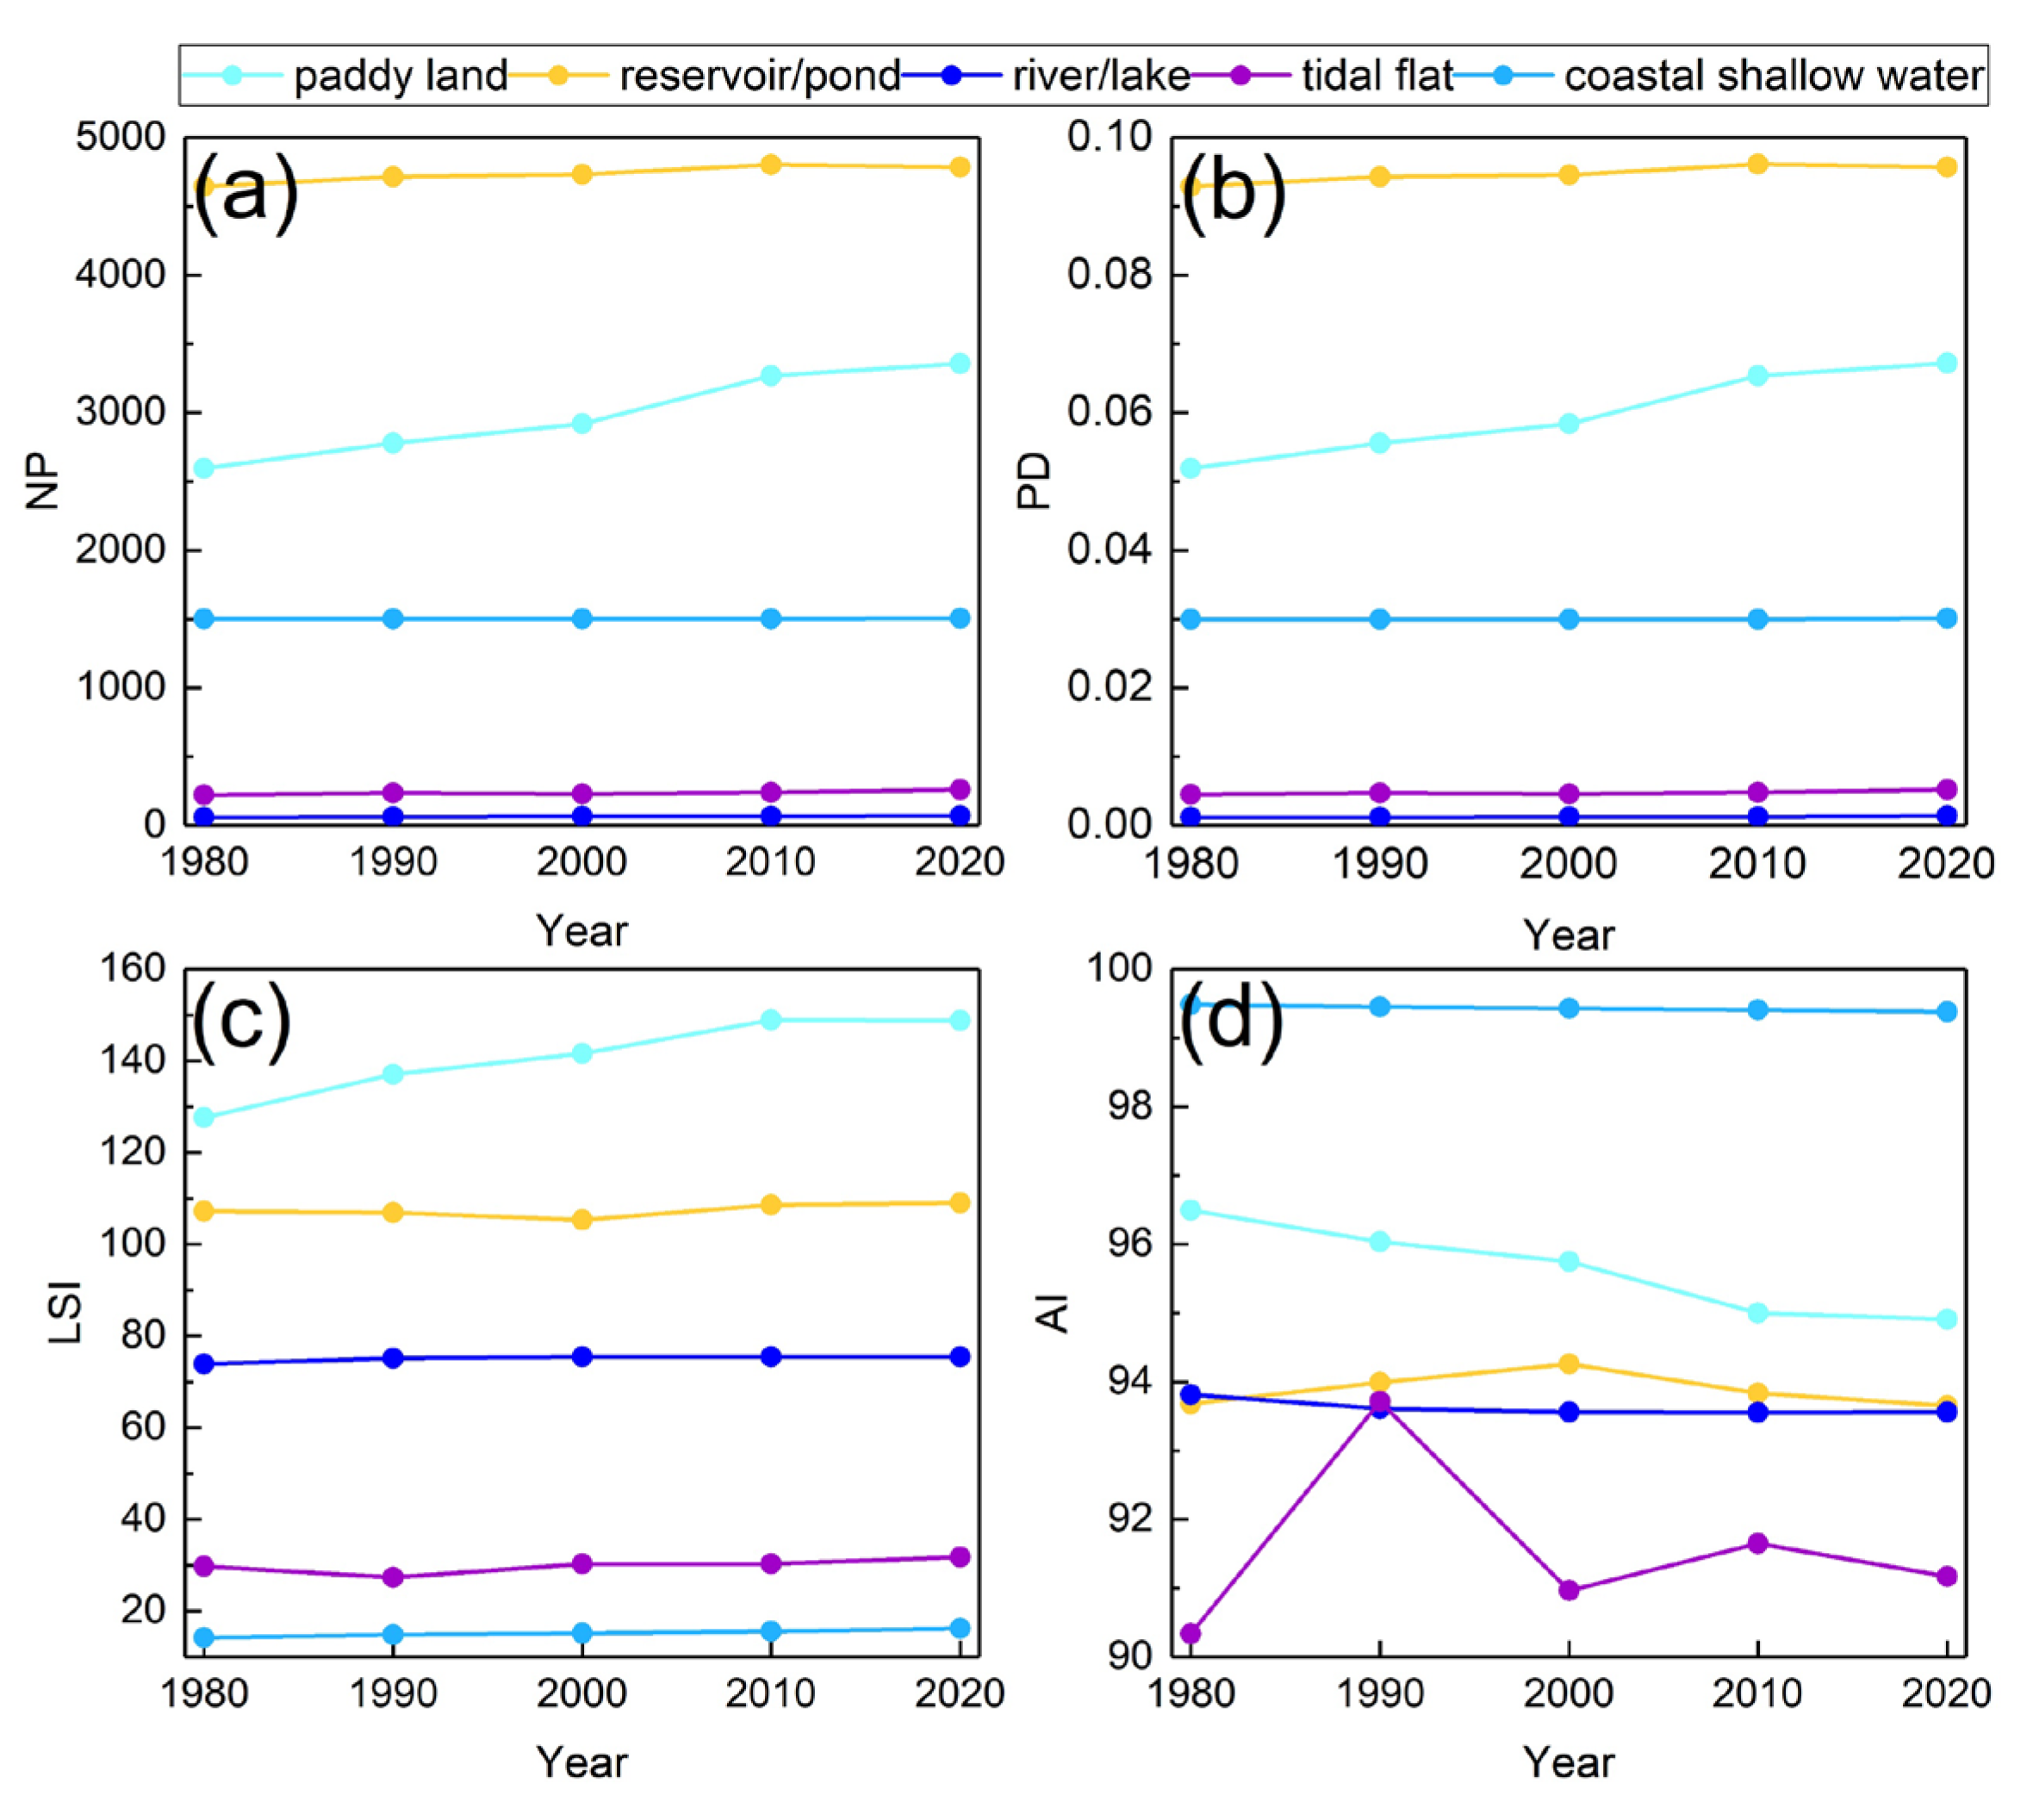
Figure 8.
Spatial distribution maps of wetland change during 1980–2020.
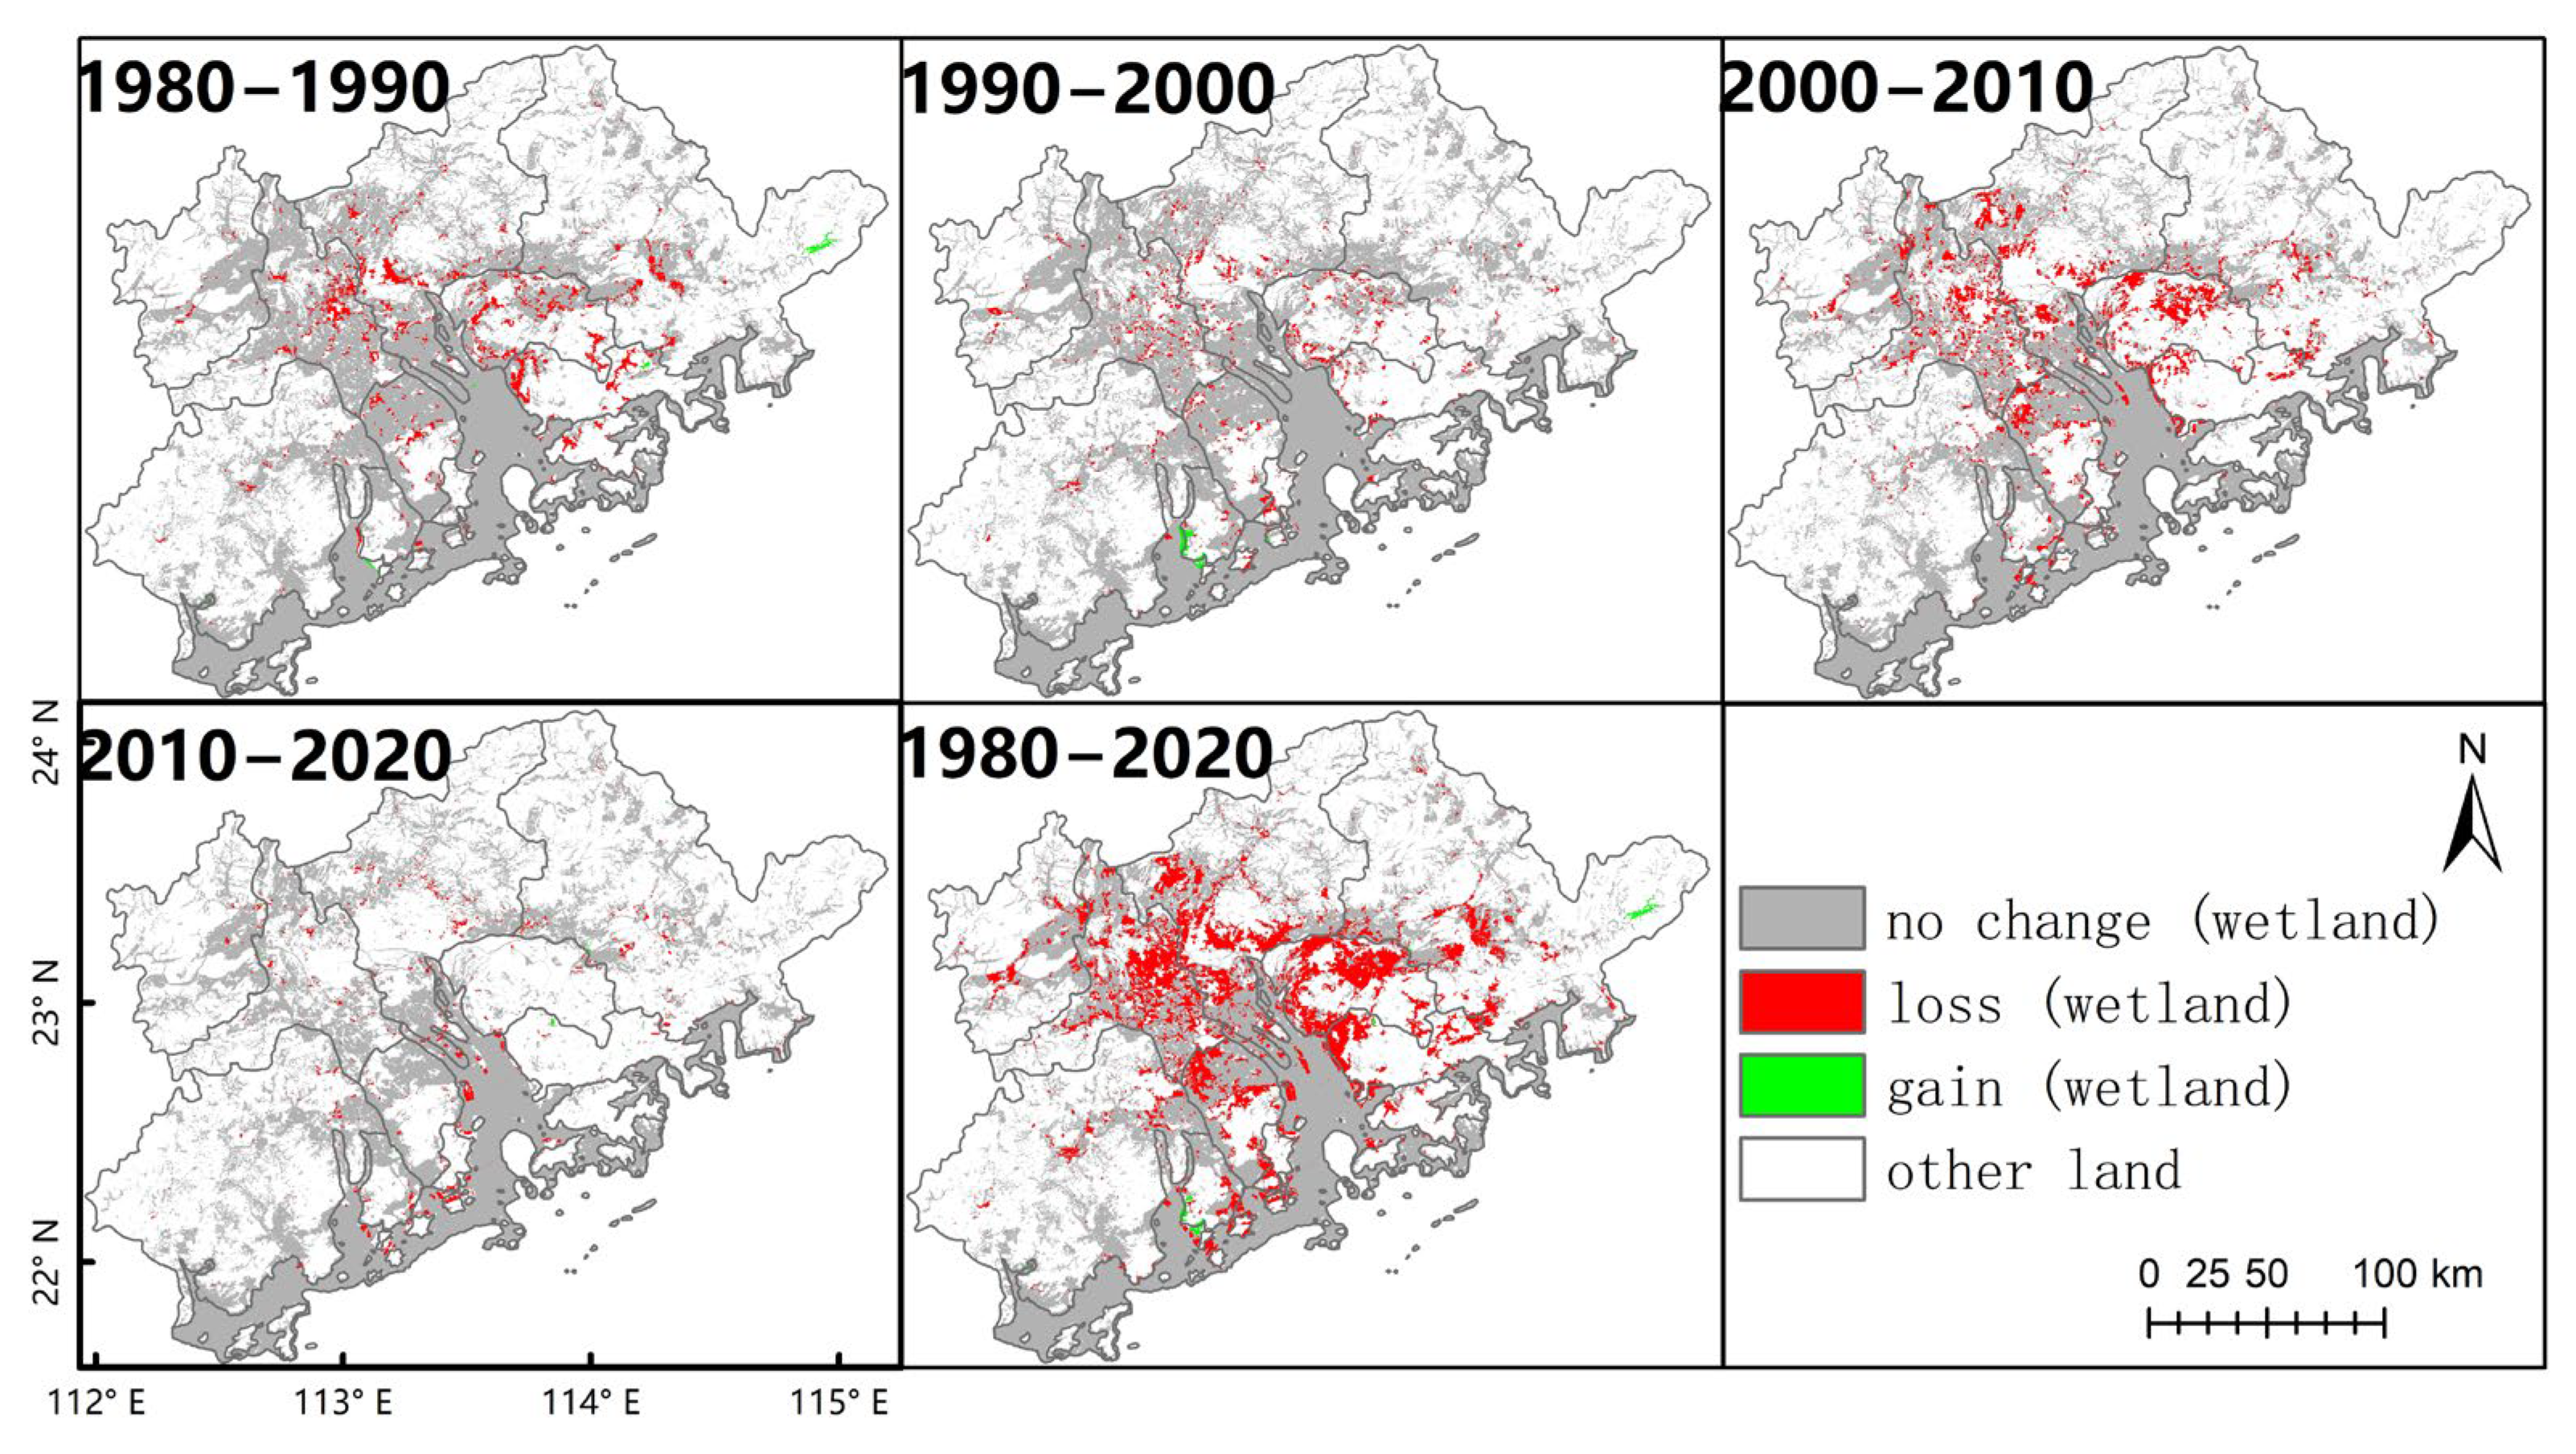
Figure 9.
Change from (a) and change to (b) of lost wetlands in the GBA.
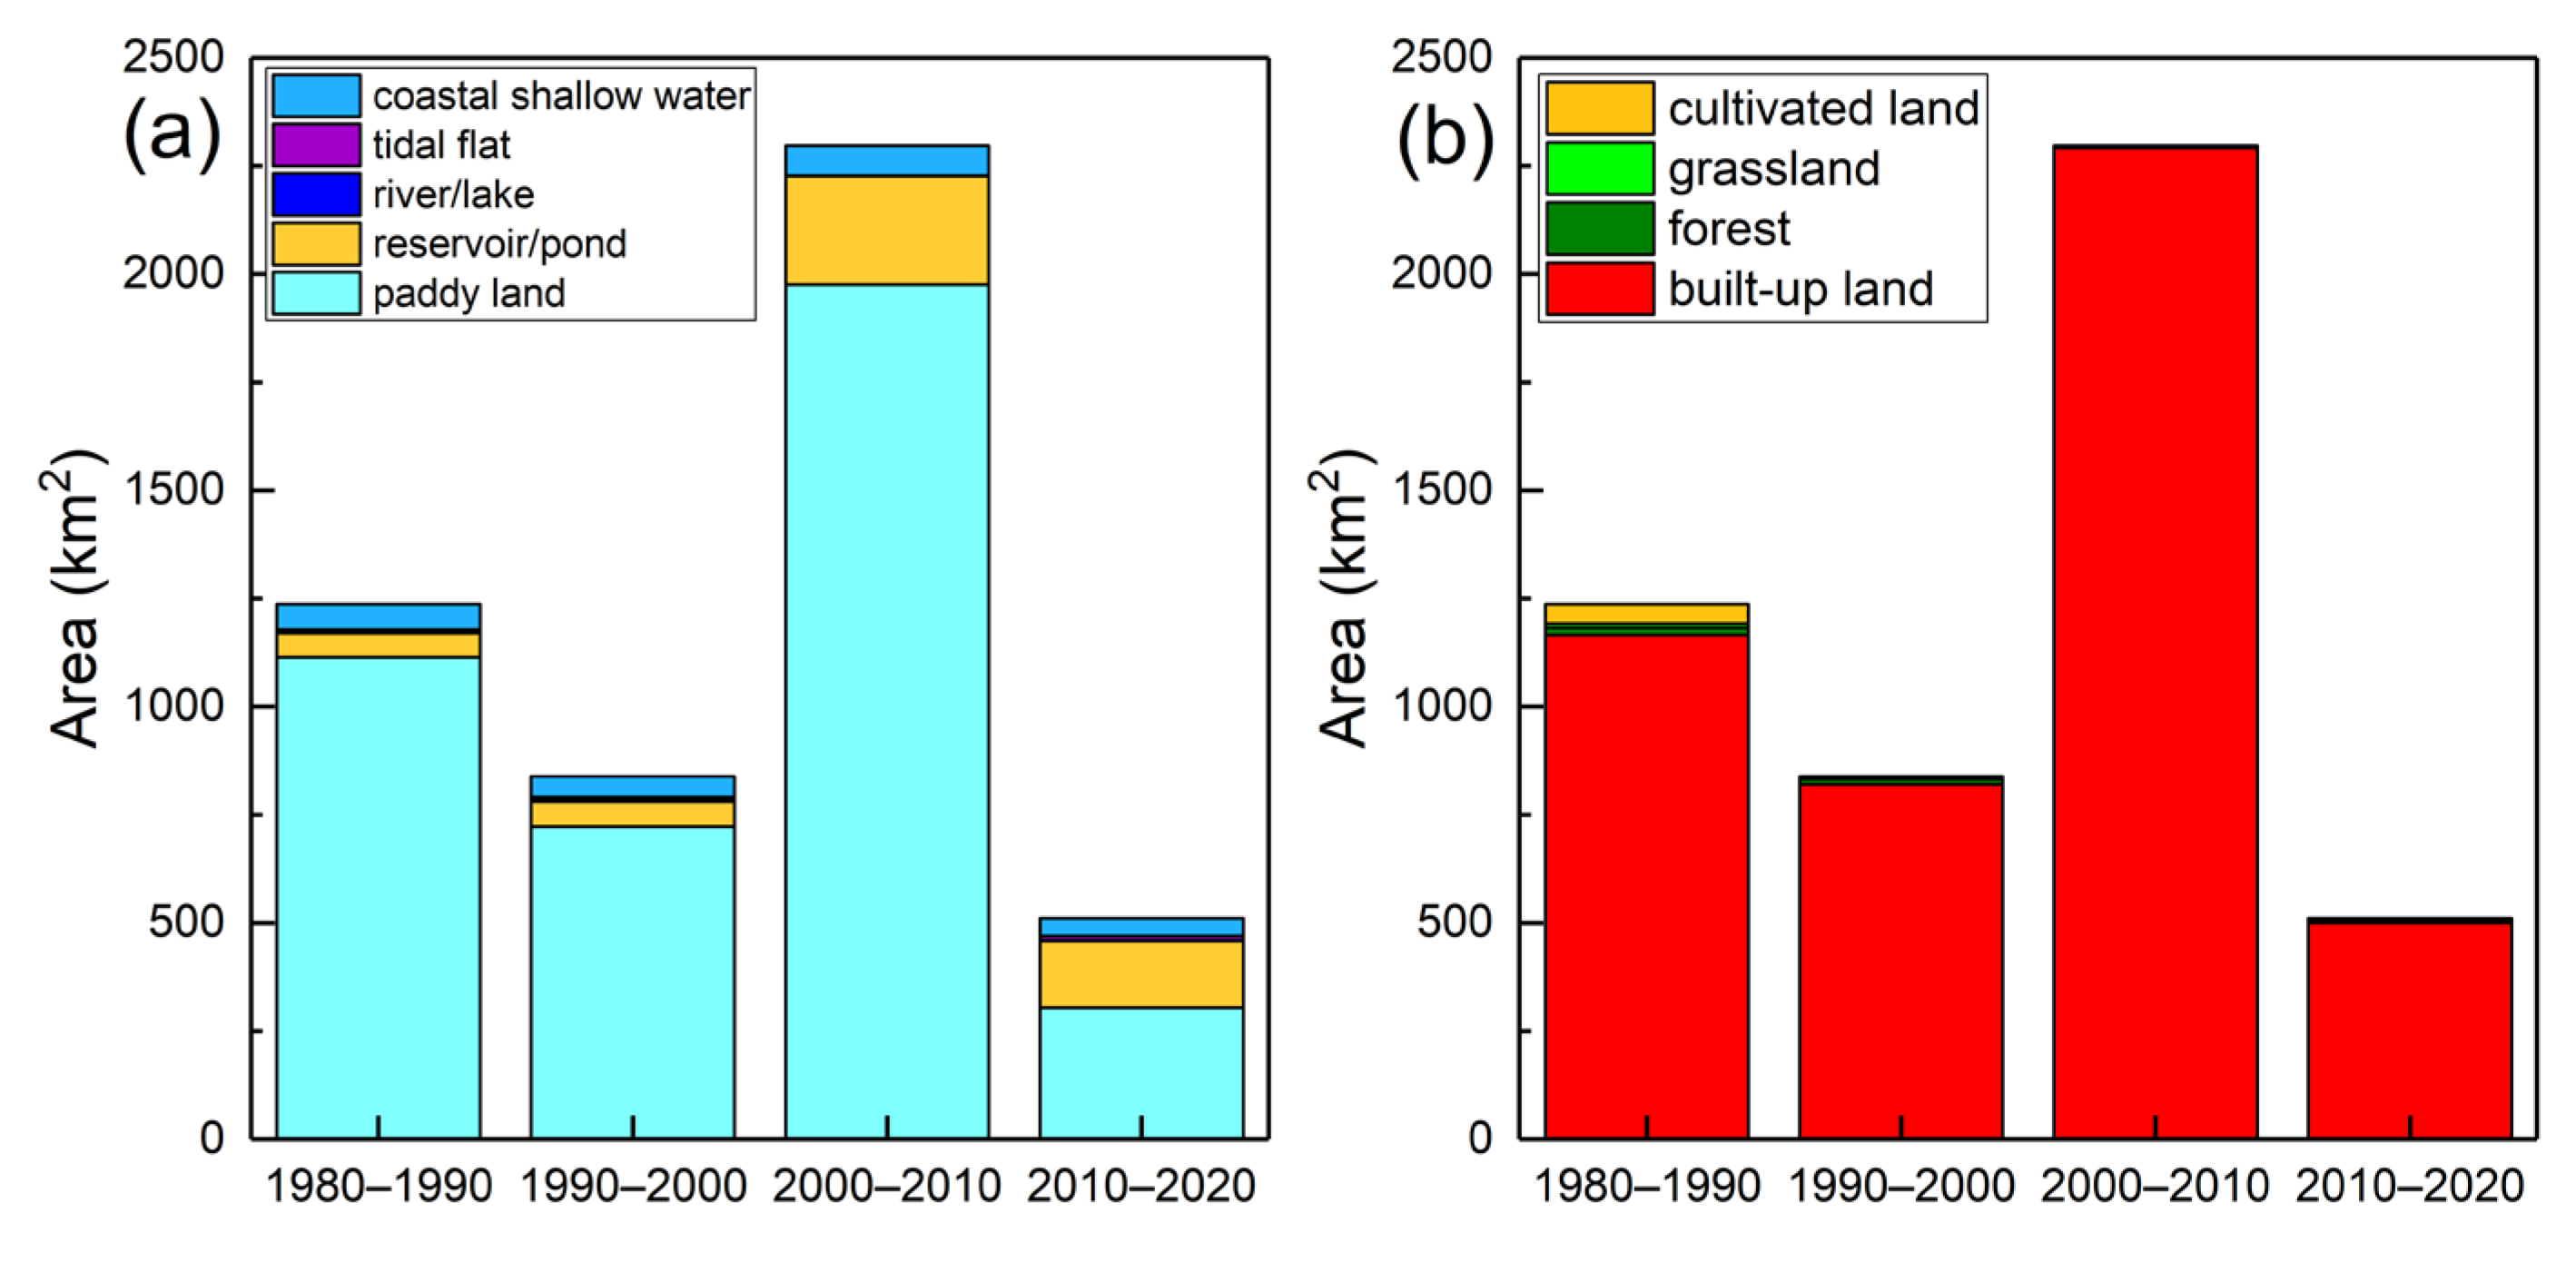
Figure 10.
Transformation path between different wetland types.
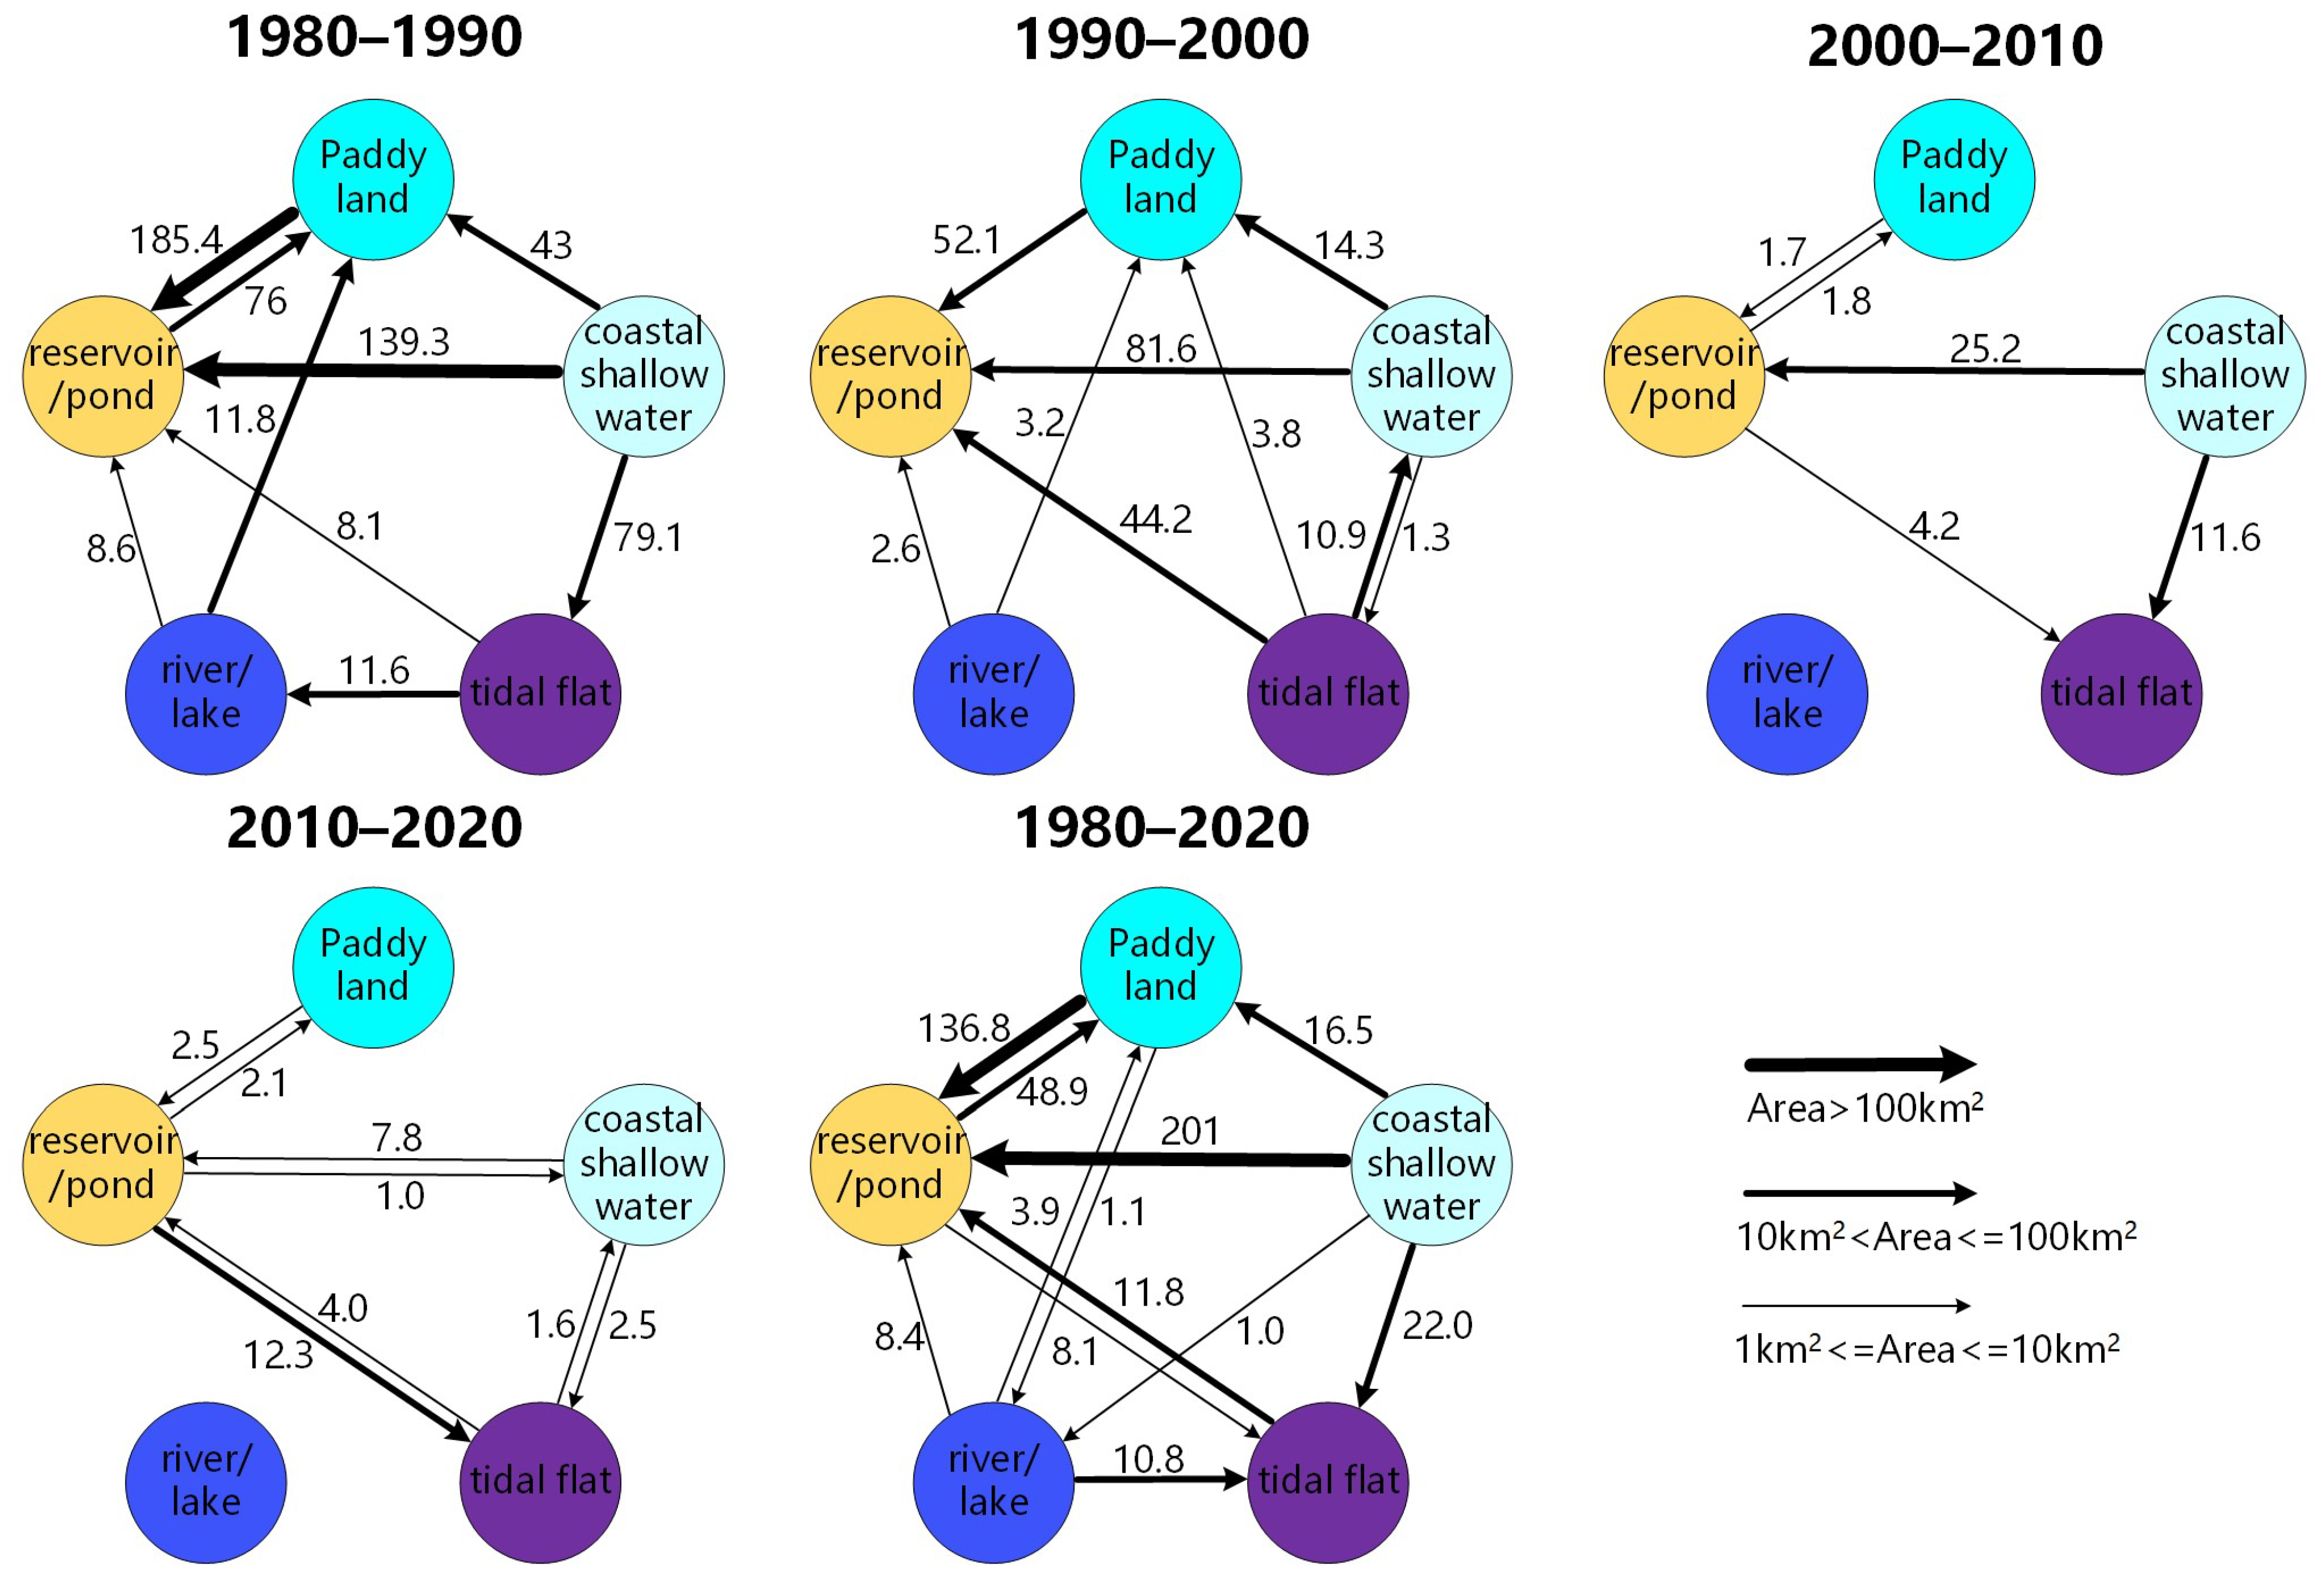
Figure 11.
Long-term change of socio-economic and climatic indicators in the GBA. (a) Permanent resident population; (b) gross output value of fishery industry; (c) gross output value of construction industry; (d) sea level; (e) temperature; (f) precipitation. The abbreviations of the cities in the GBA are Guangzhou (GZ), Shenzhen (SZ), Zhuhai (ZH), Huizhou (HZ), Dongguan (DG), Zhongshan (ZS), Jiangmen (JM), Zhaoqing (ZQ), Foshan (FS), Hong Kong (HK), and Macao (MO).
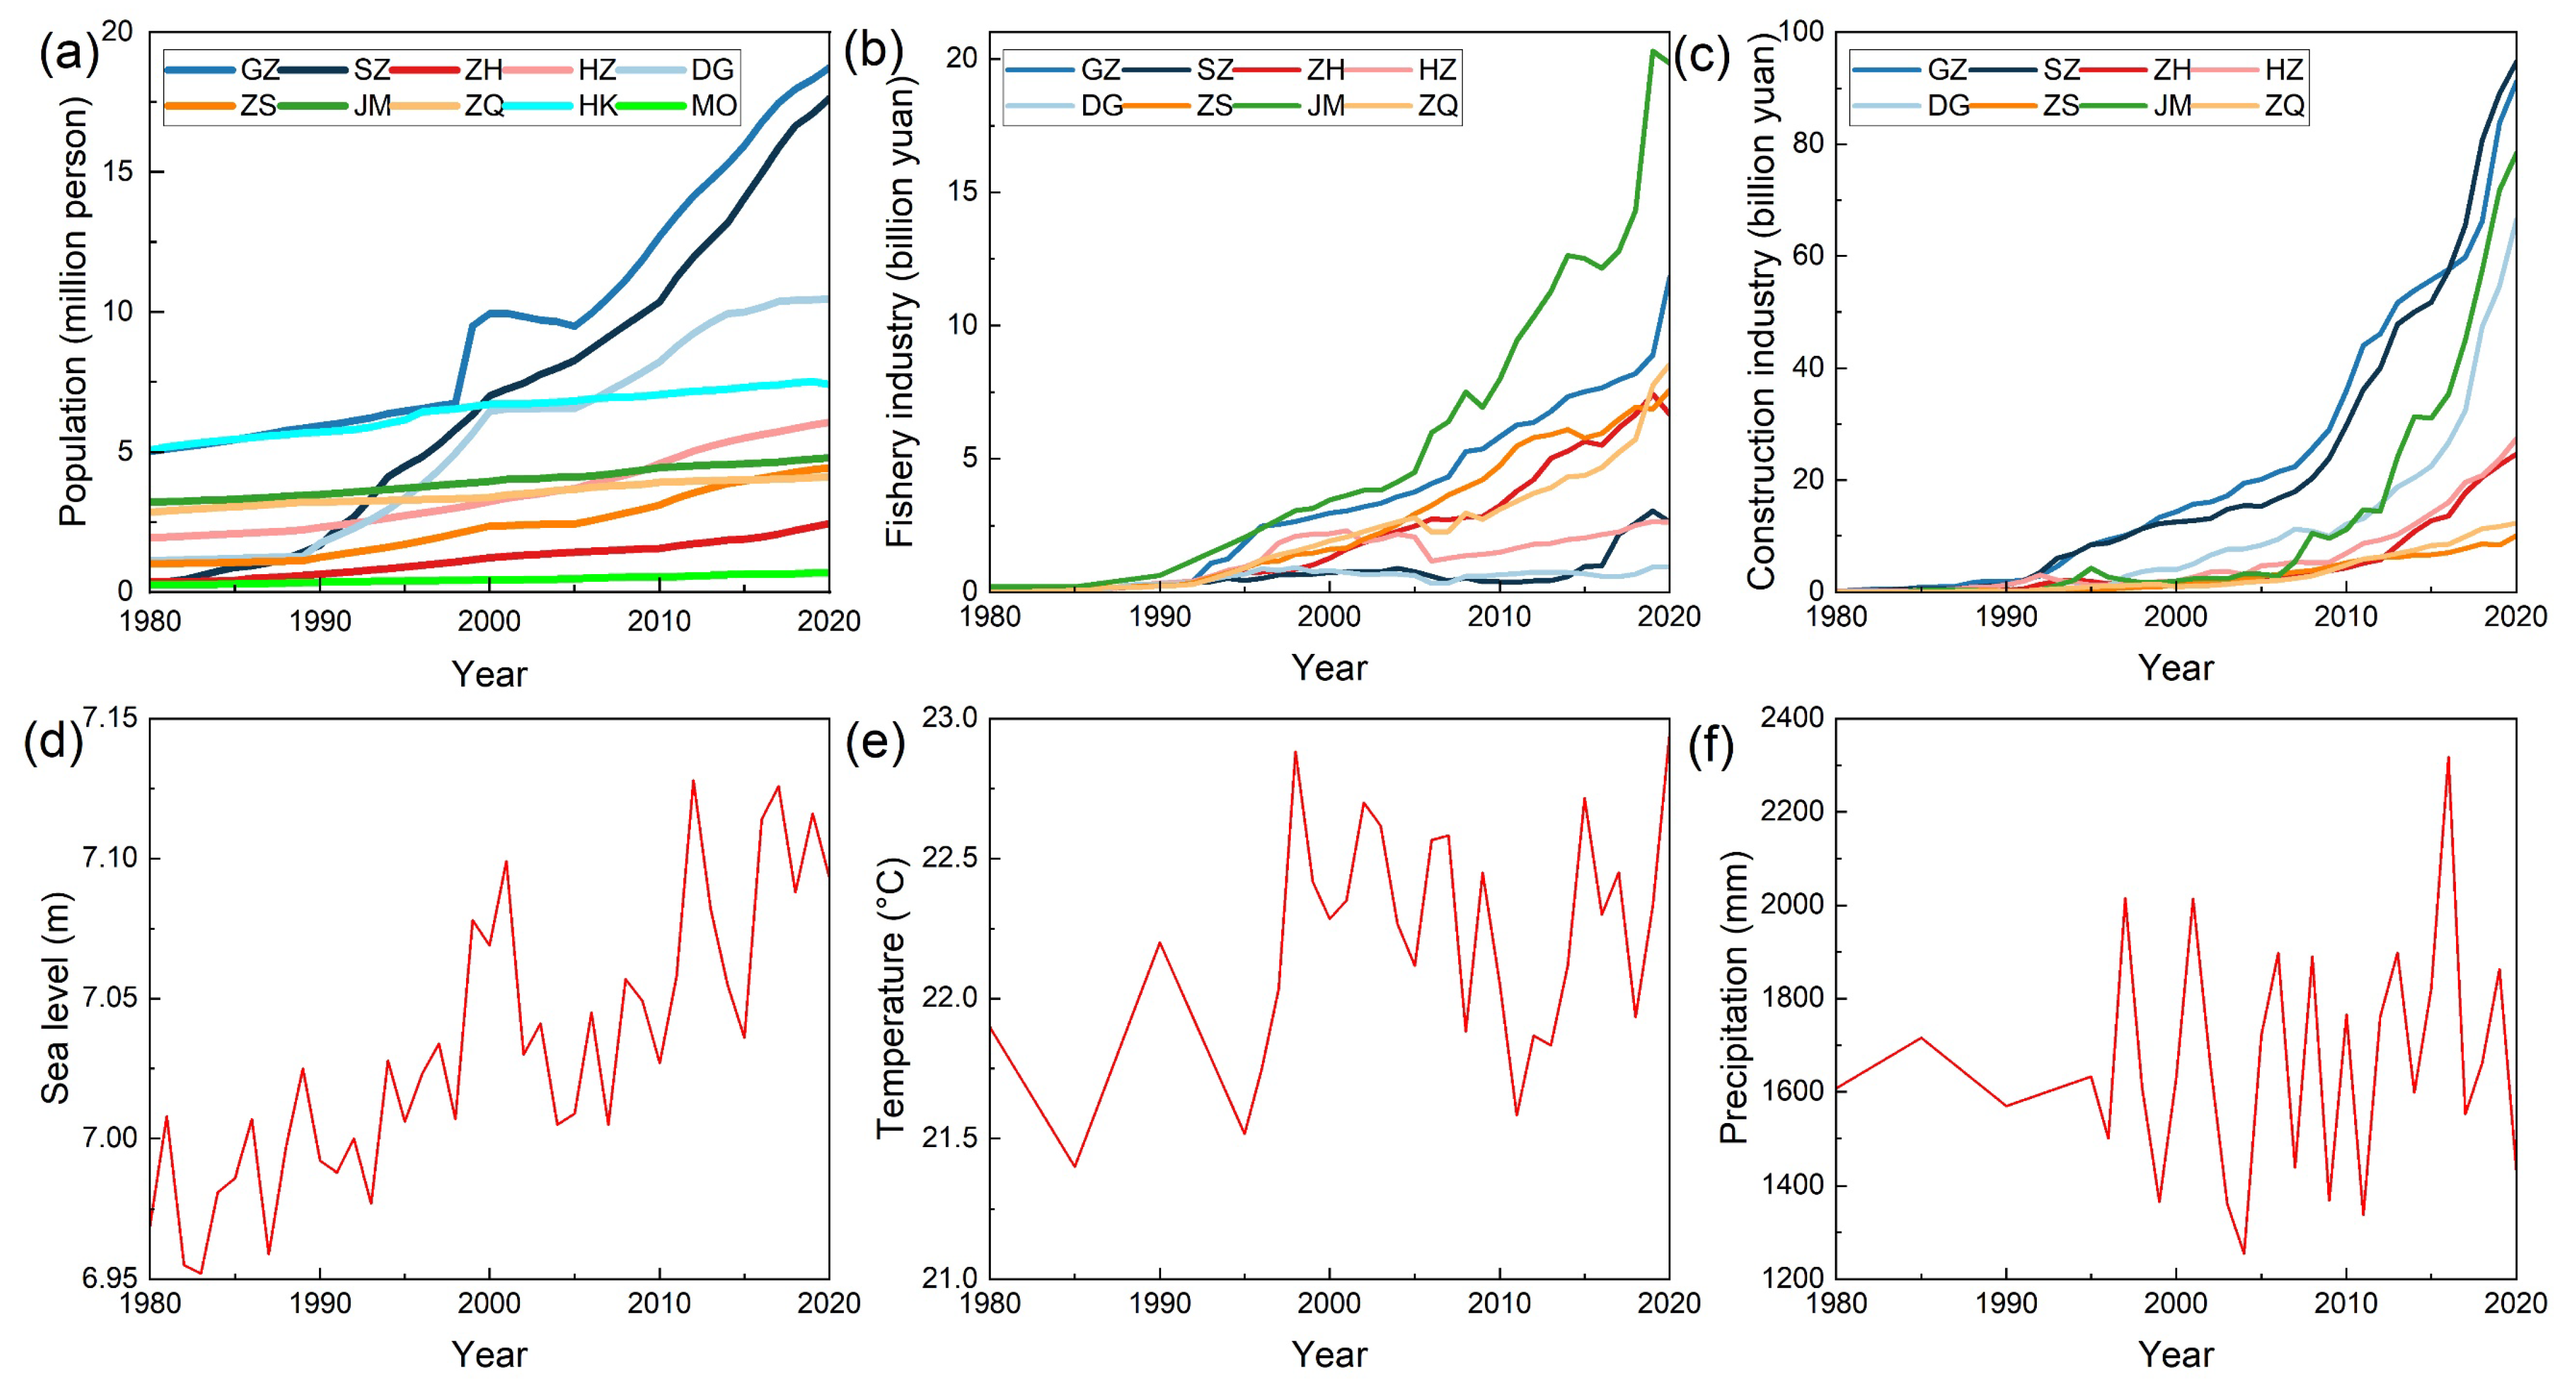
Figure 12.
Correlation analysis (a) and principal component analysis (b) between wetland area and explanatory variables. The abbreviations of the cities in the GBA are Guangzhou (GZ), Shenzhen (SZ), Zhuhai (ZH), Huizhou (HZ), Dongguan (DG), Zhongshan (ZS), Jiangmen (JM), Zhaoqing (ZQ), Foshan (FS), Hong Kong (HK), and Macao (MO).
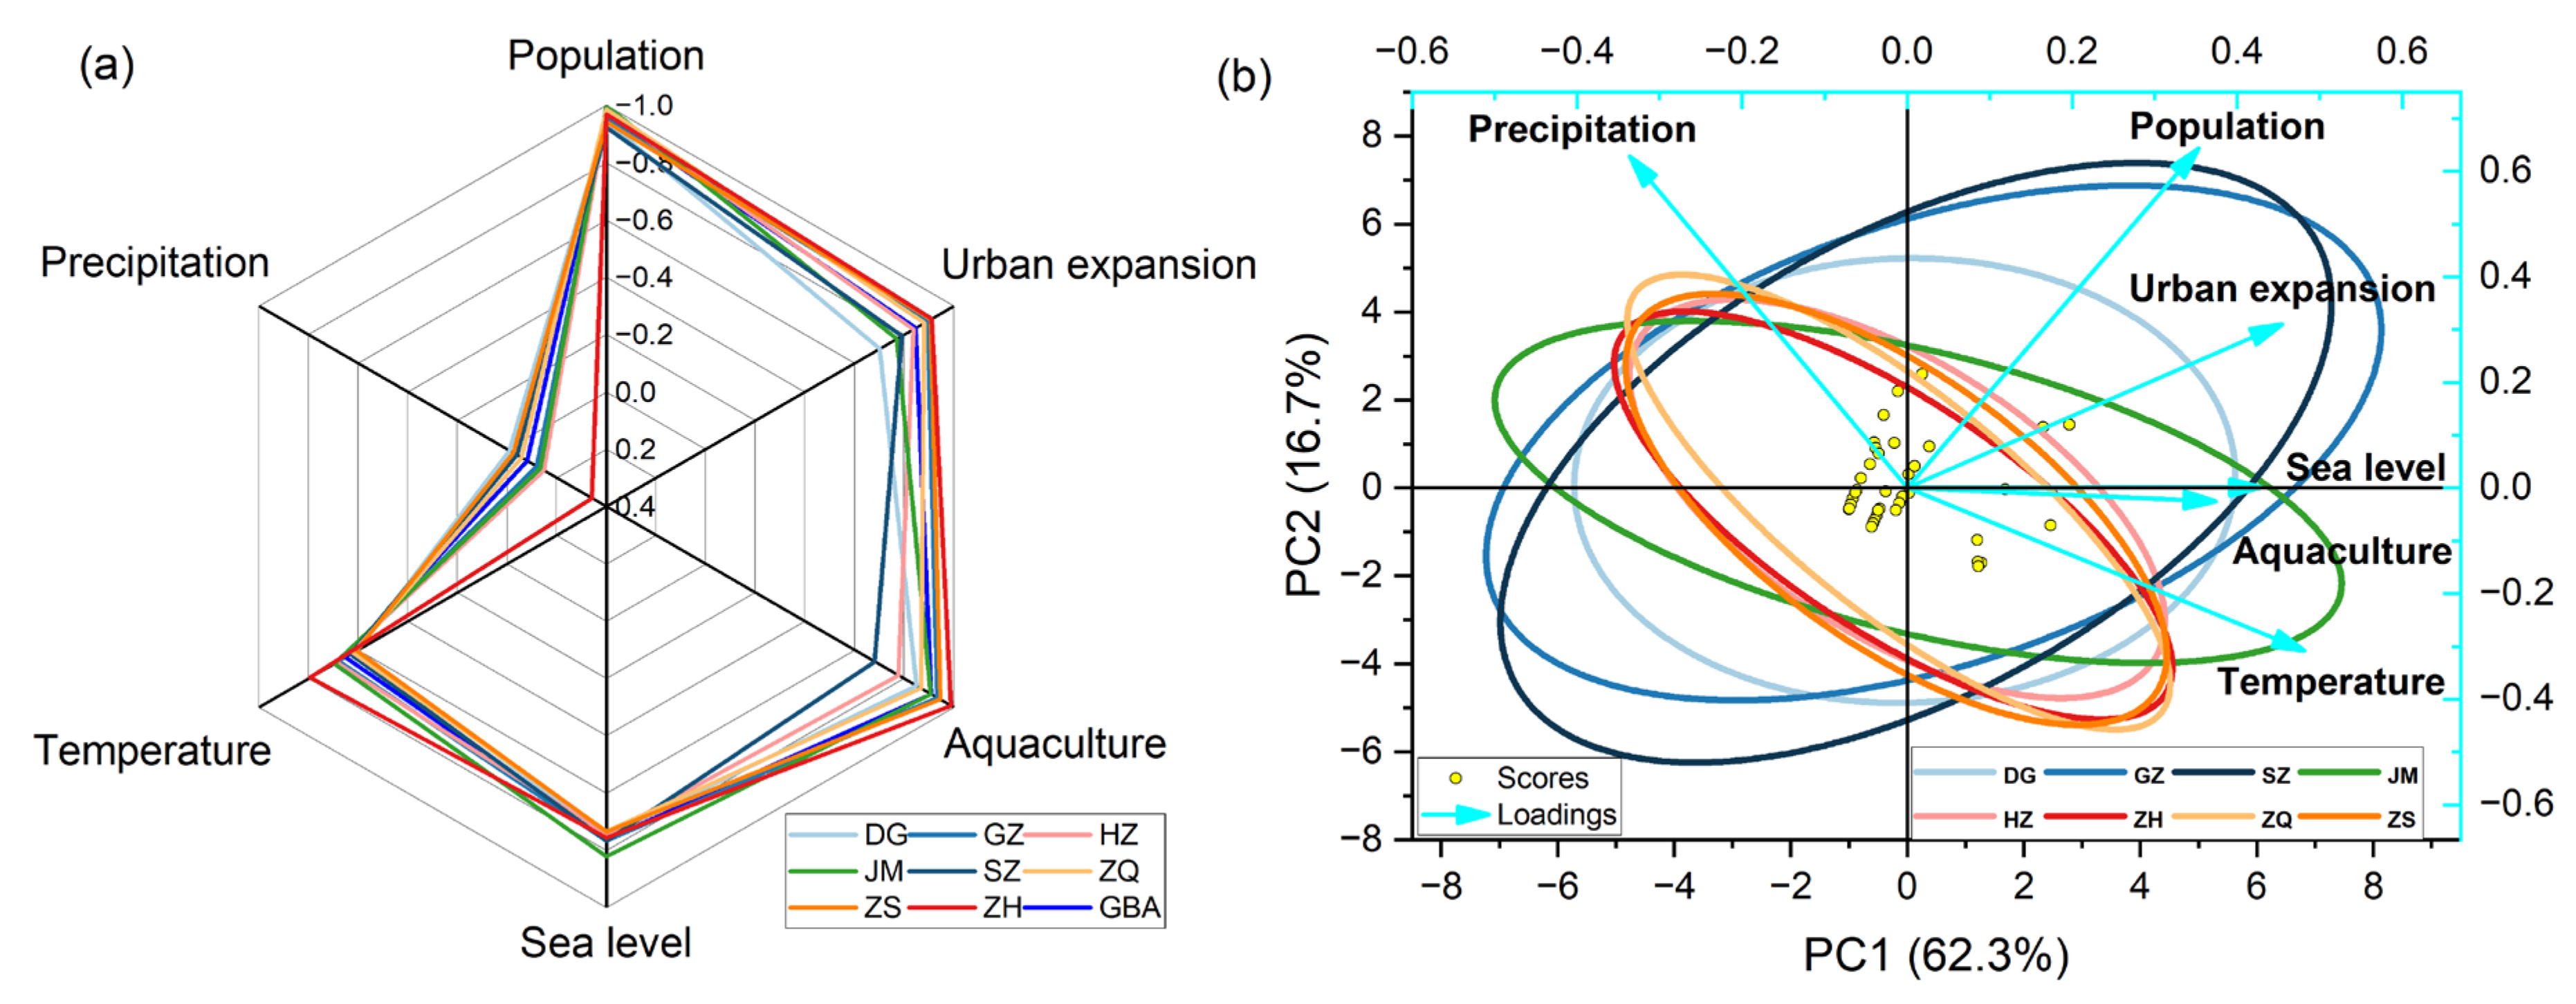
Figure 13.
Typical wetland change patterns observed from Landsat images and aerial photographs. (a) Conversion from natural wetlands to constructed wetlands; (b) conversion from cultivated land to aquaculture ponds; (c) conversion from coastal shallow water bodies to constructed wetlands. The marked position in the satellite images corresponds to the position recorded by the aerial photographs.

Figure 14.
Comparison of total wetland area in the GBA estimated by different studies.
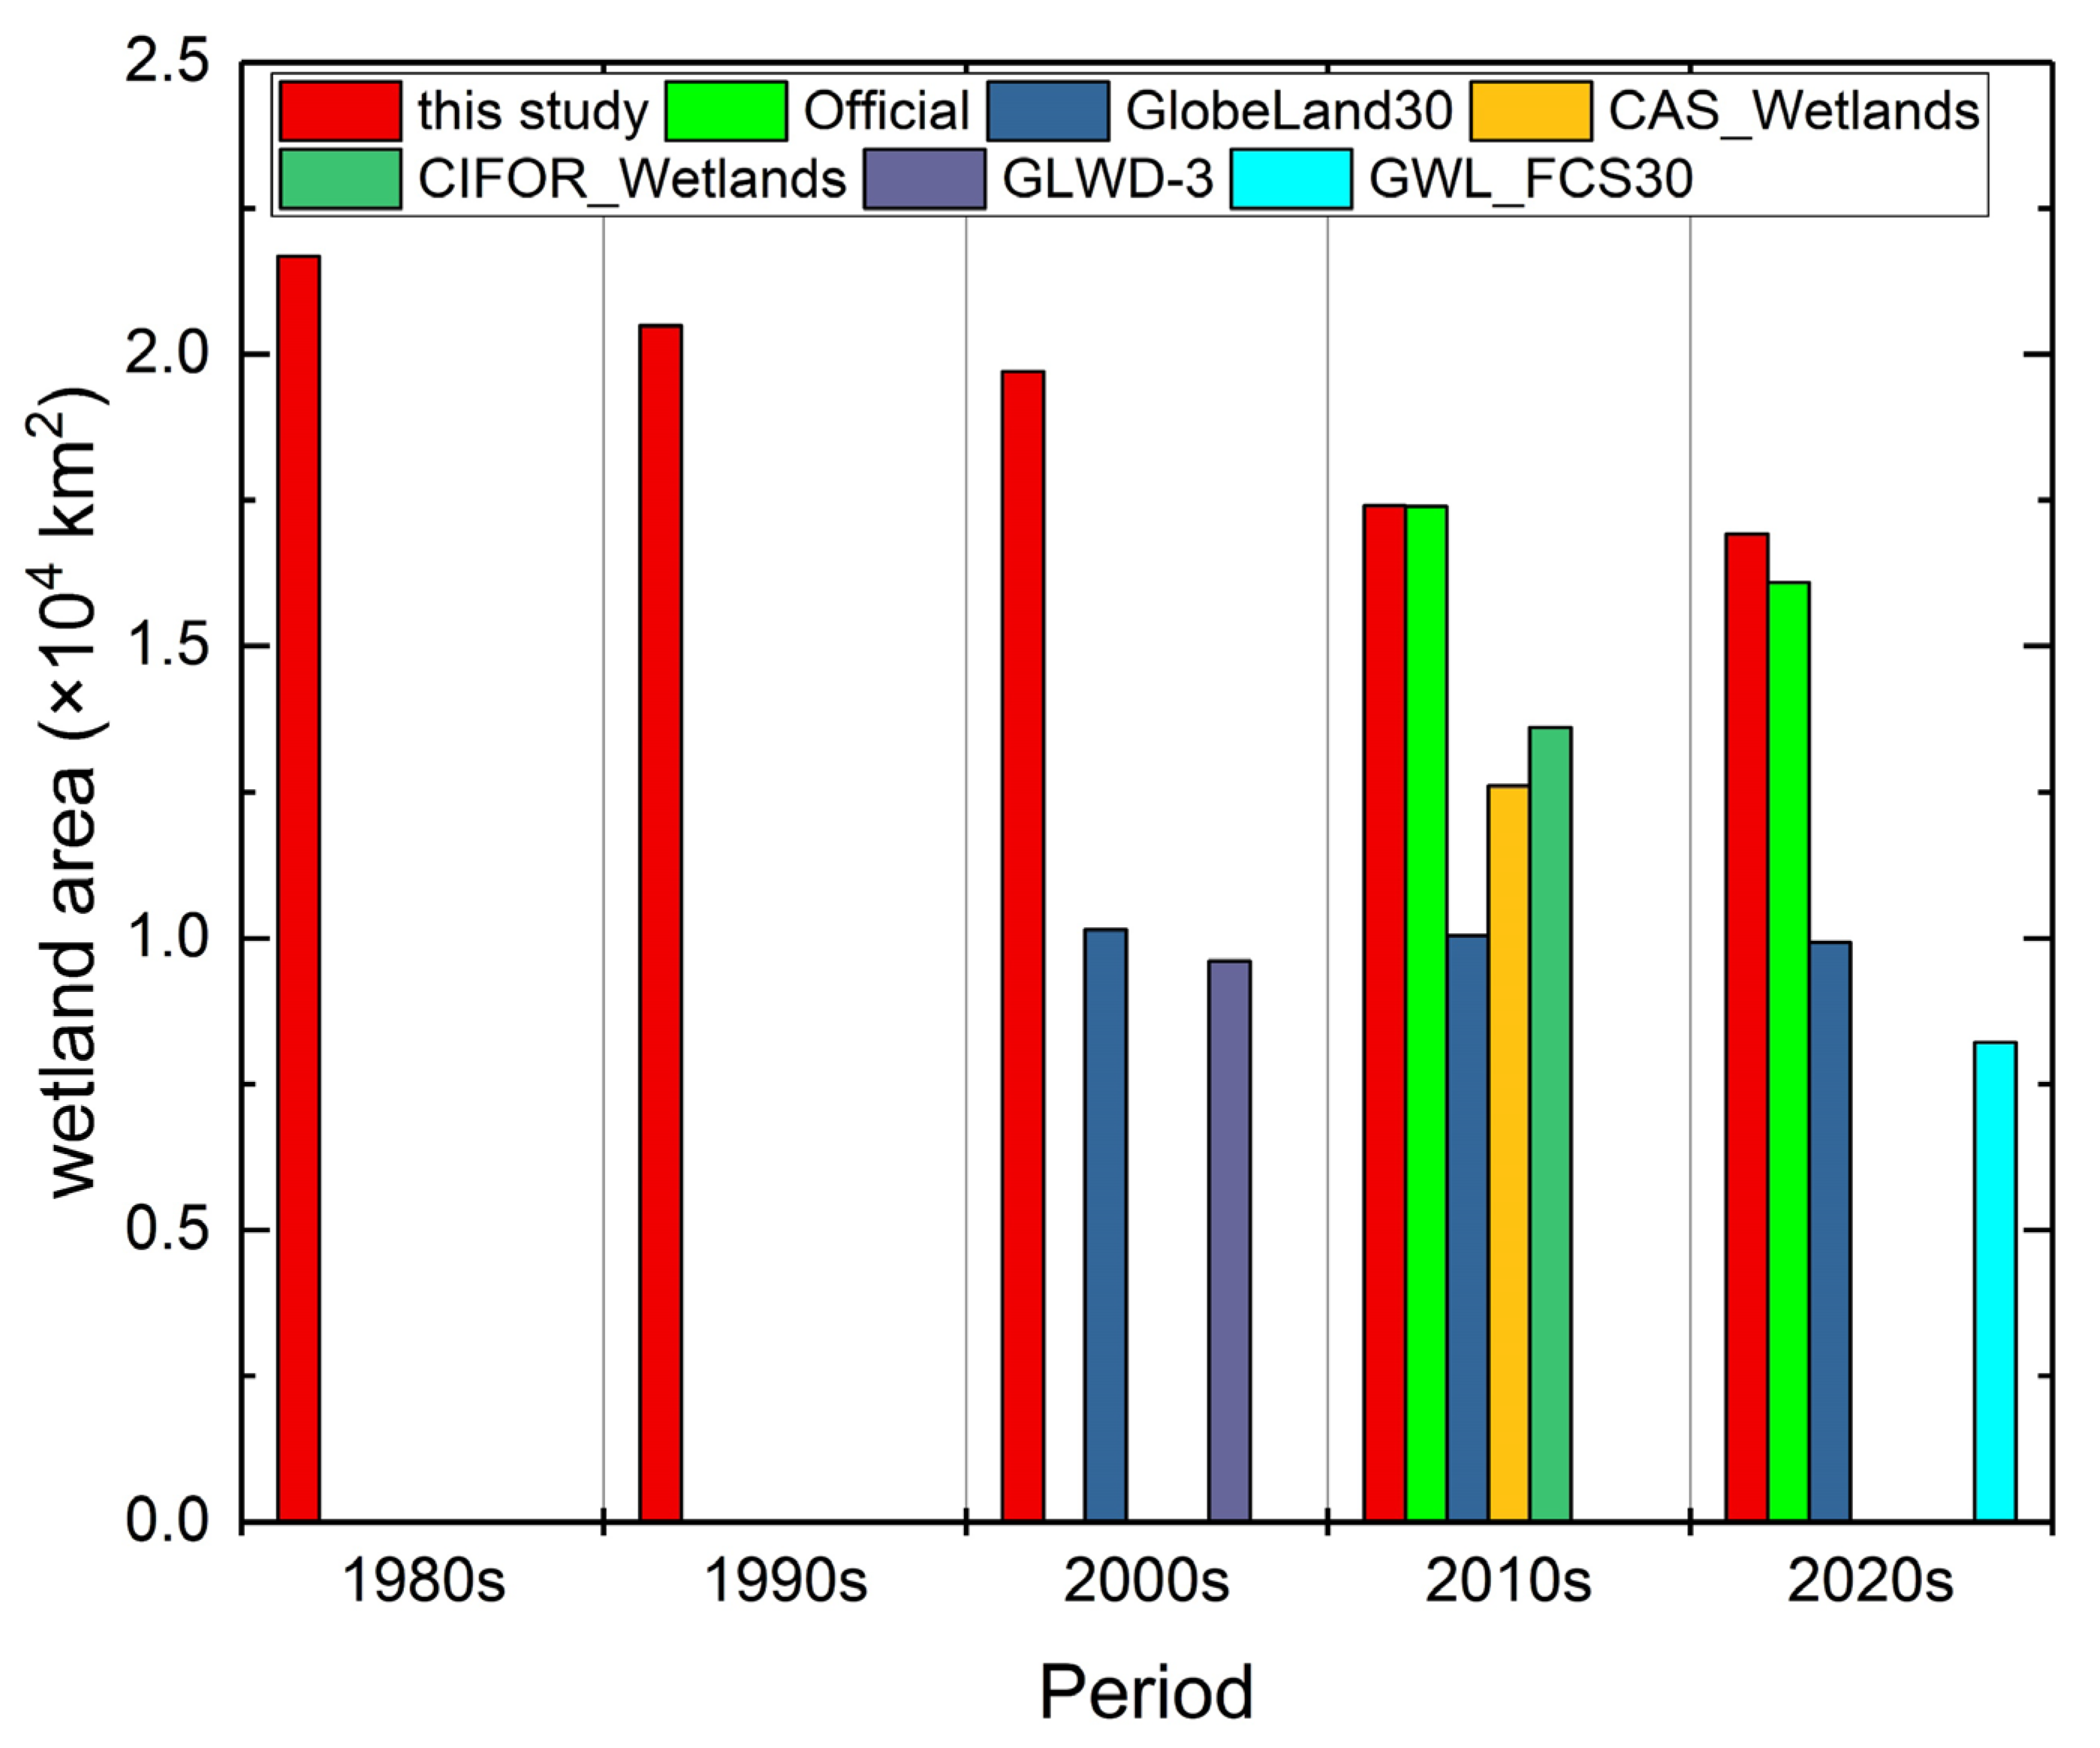
Figure 15.
Comparison of total area of major land use types derived from official and satellite data: (a) 2010; (b) 2020.
Figure 15.
Comparison of total area of major land use types derived from official and satellite data: (a) 2010; (b) 2020.

Table 1.
Accuracy assessment on the wetland categories of the GBA LULC maps.
| Wetland Type | Producer’s Accuracy | User’s Accuracy | Summary |
|---|---|---|---|
| paddy land | 85.7% | 75.0% | Overall accuracy = 83.6% kappa = 0.77 |
| reservoir/pond | 89.5% | 73.9% | |
| river/lake | 83.3% | 83.3% | |
| tidal flat | 76.7% | 95.8% | |
| coastal shallow water | 100.0% | 83.3% |
Disclaimer/Publisher’s Note: The statements, opinions and data contained in all publications are solely those of the individual author(s) and contributor(s) and not of MDPI and/or the editor(s). MDPI and/or the editor(s) disclaim responsibility for any injury to people or property resulting from any ideas, methods, instructions or products referred to in the content. |
© 2024 by the authors. Licensee MDPI, Basel, Switzerland. This article is an open access article distributed under the terms and conditions of the Creative Commons Attribution (CC BY) license (https://creativecommons.org/licenses/by/4.0/).
Share and Cite
MDPI and ACS Style
Sun, K.; Yu, W. A Satellite View of the Wetland Transformation Path and Associated Drivers in the Greater Bay Area of China during the Past Four Decades. Remote Sens. 2024, 16, 1047. https://doi.org/10.3390/rs16061047
AMA Style
Sun K, Yu W. A Satellite View of the Wetland Transformation Path and Associated Drivers in the Greater Bay Area of China during the Past Four Decades. Remote Sensing. 2024; 16(6):1047. https://doi.org/10.3390/rs16061047
Chicago/Turabian StyleSun, Kun, and Weiwei Yu. 2024. "A Satellite View of the Wetland Transformation Path and Associated Drivers in the Greater Bay Area of China during the Past Four Decades" Remote Sensing 16, no. 6: 1047. https://doi.org/10.3390/rs16061047
Note that from the first issue of 2016, this journal uses article numbers instead of page numbers. See further details here.