Article

Mapping the Spatiotemporal Dynamics of Cropland Abandonment and Recultivation across the Yangtze River Basin

1
State Key Laboratory of Efficient Utilization of Arid and Semi-Arid Arable Land in Northern China, Institute of Agricultural Resources and Regional Planning, Chinese Academy of Agricultural Sciences, Beijing 100081, China
2
TERRA Teaching and Research Centre, Gembloux Agro-Bio Tech, University of Liège, 5030 Gembloux, Belgium
*
Author to whom correspondence should be addressed.
Remote Sens. 2024, 16(6), 1052; https://doi.org/10.3390/rs16061052
Submission received: 1 January 2024 / Revised: 6 March 2024 / Accepted: 12 March 2024 / Published: 15 March 2024
(This article belongs to the Special Issue Cropland Phenology Monitoring Based on Cloud-Computing Platforms)

Abstract

:
Whether China can achieve the United Nations’ Sustainable Development Goals (SDGs) largely depends on the ability of main food-producing areas to cope with multiple land use change challenges. Despite the fact that the Yangtze River basin is one of the key regions for China’s food security, the spatiotemporal dynamics of cropland abandonment and recultivation remain largely unexplored in this region. The present study assesses the evolution of the agricultural system within the Yangtze River basin between 2000 and 2020 by mapping cropland abandonment and recultivation using MODIS time series and multiple land cover products. The results highlight a widespread cropland abandonment process (i.e., 10.5% of the total study area between 2000 and 2020), predominantly in Western Sichuan, Eastern Yunnan, and Central Jiangxi. Although 70% of abandoned cropland is situated in areas with slopes less than 5°, the highest rates of abandonment are in mountainous regions. However, by 2020, 74% of this abandoned cropland had been recultivated at least once, whereas half of the abandoned croplands got recultivated within three years of their initial abandonment. Hence, as this is one of the first studies that unravels the complex interaction between cropland abandonment and recultivation in a spatiotemporal explicit context, it offers (i) scientists a novel methodological framework to assess agricultural land use issues across large geographical entities, and (ii) policy-makers new insights to support the sustainable transition of the agricultural sector.

Graphical Abstract

1. Introduction

Scientific interest in cropland abandonment and recultivation has increased due to concerns about food, feed, fiber, biofuel security, and environmental sustainability [1,2]. Since the 1950s, a substantial expanse, encompassing hundreds of millions of hectares worldwide, has undergone this transition. For example, satellite imagery revealed that approximately 78.5 ± 16.4 million hectares (Mha) of cropland was abandoned between 2003 and 2019, either permanently or temporarily (of which 18.5 ± 3.9 Mha, or 24%, is now forested) [3,4,5,6]. This trend is particularly pronounced in regions such as Europe, North America, East Asia, and Latin America [7,8,9,10,11], and can be linked to drivers like urbanization and environmental degradation [12,13,14,15]. Furthermore, local and distant socio–economic factors (e.g., migration and rural labor dynamics) are important drivers of land abandonment, even in areas with sustainable agriculture [16].
Cropland abandonment impacts both the environment and society, notably by affecting the delivery of multiple ecosystem services, including biodiversity, climate regulation, and food security [17,18,19,20]. Despite it posing challenges for food security, it also offers an opportunity to restore natural ecosystems [3,21]. However, the benefits, particularly carbon sequestration, depend on the abandonment duration, with long-term duration offering greater climate regulation potential [22]. It has been recently reported that abandonment can be ephemeral [23], particularly in cropland-scarce regions. Hence, obtaining an improved understanding of the dynamics of cropland abandonment and recultivation is crucial in order to assess its impact on the delivery of multiple ecosystem services and support policy-makers in developing sustainable solutions for the future [24,25].
The definition of cropland abandonment is broad, not only considering the temporal aspect of it, but also from a of land use type/intensity point of view. Generally, cropland abandonment can be defined as the cessation of the use of existing cropland by farmers on their own initiative. However, there is no consensus as regards the duration [26]. For example, the Food and Agriculture Organization (FAO) considers a duration of two to five years, whereas, in some studies conducted in China, cropland abandonment could be defined as “cropland left idle for a year or even a season” [27]. In recent years, geographers have developed a new definition of cropland abandonment from the perspective of land use type/intensity of use, focusing on the ecological evolution of abandonment. They analyzed the dynamics of cropland in Europe and pointed out that cropland abandonment is “the replacement of anthropogenic farmland by early successional natural vegetation” [28,29]. As such, complex land use activities and long-term monitoring methods are needed to identify cropland abandonment over time at the regional scale.
Spatial data covering vast geographical entities are essential for in-depth analyses of the spatial and temporal dynamics of pattern as well as for assessing the associated interaction between cropland abandonment and recultivation. The latter will facilitate the identification of driving forces and environmental impacts of agricultural land dynamics. Although this research is of great societal importance, collecting accurate spatiotemporal explicit data remains one of the main challenges. Statistical data from traditional land use surveys, such as from the China Household Finance Survey (CHFS) from the Southwestern University of Finance and Economics [30], do not provide us with the required quality due to the lack of spatial detail (typically providing average values at regional, provincial, or municipal level), hindering the detection of the rather complex spatiotemporal trends determining the interplay between cropland abandonment and recultivation.
Over the last two decades, important advances have been made in the context of cropland abandonment monitoring by using a variety of new satellite-derived data [31,32,33]. For instance, the fusion of Sentinel-1 (synthetic aperture radar sensors) and Sentinel-2 (optical sensors) imagery helped in cropland abandonment monitoring in tropical areas [34]. However, due to the first launch of the Sentinel satellite being in 2014, it is impossible to achieve long time series monitoring. As such, Landsat is considered to be an important data source for long-term cropland abandonment detection [35,36]. For example, Xiao, et al. [37] monitored cropland abandonment between 1990 and 2017 in counties of the Shandong Province using Landsat and HJ1A imagery. However, obtaining accurate data over brief intervals using Landsat poses challenges, mainly due to cloud interference [38]. As such, previous efforts to map cropland abandonment indicated the complexity of Landsat-based analyses due to difficulty in extracting reliable and sufficient data when considering relatively short periods of time across large areas [39]. Moreover, the varying definitions of “abandonment” hinder its identification and mapping. Cropland abandonment is commonly defined as agricultural land that remains unused for at least two to five years [40,41]. However, the prevalence of short cultivation periods introduces challenges in differentiating abandoned cropland from fallow cropland [36]. In contrast to other land use/land cover classifications, considering crop rotation cycles and/or farming practices is crucial to distinguish cropland abandonment from fallow cropland [38]. Given that cropland abandonment entails a longer cessation period than when land is lying fallow, ascertaining whether the land use transition duration exceeds a crop rotation cycle is essential. Consequently, intervals between temporal snapshots exceeding a typical crop rotation cycle may lead to the misidentification of many fallow areas as abandoned croplands. Therefore, assessing multiple consecutive years is critical to accurately determine whether a field has indeed been abandoned [7,42,43]. Using regular, consecutive time series data, like those provided by The Moderate Resolution Imaging Spectroradiometer (MODIS), will be key to minimizing the risk of misclassification of temporarily fallow land within a crop rotation as being abandoned cropland.
MODIS offers comprehensive observations for assessing regional cropland change as it effectively minimizes the impacts of viewing geometry, cloud cover, and aerosol loading while maintaining a suitable temporal resolution for consistent large-scale abandoned cropland monitoring [44]. A study utilized MODIS normalized difference vegetation index (NDVI) products to map abandoned agricultural land across Eastern Europe, achieving an overall classification accuracy of 65% [38]. A similar study identified active and fallow land in Europe using MODIS-NDVI time series to subsequently map the extent of abandoned croplands [7]. A recent study in China combined MODIS data with phenological metrics to map land use change dynamics between 2001 and 2015, which enabled the identification of a remarkable cropland abandonment process across the mountainous region of Southwest China [45]. The results of the study highlighted that the mapping accuracy of abandoned cropland is significantly influenced by the quality of the data retrieved from the selected samples. The current methods of sample collection may not keep pace with the rapidly evolving requirements of monitoring, and this especially becomes an issue when considering large areas [46]. This challenge underscores the need for more diversified and rapid sample collection strategies to enhance monitoring efficiency and accuracy.
Indeed, collecting reliable sample points, especially across vast regions, is labor intensive [47]. Although the quality of spectral reflectance data obtained from the remote sensing imagery is vital to set-up a thorough land use classification, this reflectance, and its relation to various land uses, may change yearly depending on, for example, inter-annual variation in meteorological conditions. This is particularly true for cropland dominated areas. As such, annual training, linking spectral information to a set of given land use classes, is essential. Furthermore, automating reference data generation, accounting for spatial and field attributes, is a key methodological procedure [48]. A pragmatic solution combines established land use classification products, such as MCD12Q1 and GlobeLand30. This approach allows for the extraction of pixels from identical positions across two or more products that have been classified under the same land cover categories, thereby enabling the accumulation of sufficient samples. Using this methodological approach for annual land cover mapping based on Landsat has proven to be effective [49], suggesting its potential efficacy for annual cropland mapping. The latter highlights the importance of setting up a robust land use classification approach using a variety of reliable public datasets in order to facilitate an efficient sample collection procedure and obtain reliable cropland abandonment maps covering vast geographical entities.
The Yangtze River basin is important in global food production, and food production is highly sensitive to changes in cropland area. However, since 2000, the region has seen dramatic changes in cropland area and a significant decline in cropping intensity [50]. The Yangtze River basin in China is a focal point for the nation’s strategic development, as was highlighted in the “Guiding Opinions on Promoting the Development of the Yangtze River Economic Belt Relying on the Golden Waterway” released by the China State Council in 2014 (http://www.gov.cn/, accessed on 1 December 2022). Since 2003, the basin has experienced increasing migrant wages and rural outmigration, resulting in a widespread agricultural abandonment [51]. The “Yangtze River Economic Belt Development Plan” (https://cjjjd.ndrc.gov.cn/, accessed on 1 December 2022) predicts increased urbanization in the next two decades, possibly exacerbating cropland abandonment [52,53]. As this cropland abandonment process poses threats to food security, recent studies and land management projects in China have underlined the potential for recultivating abandoned croplands to support food production in dominant crop production regions such as the Yangtze River plain [54,55,56]. The region’s total nature-based carbon sequestration potential is 15 million tons, and, therefore, may make a significant contribution to climate mitigation efforts at the national scale [57,58]. Quantifying cropland abandonment impacts on climate mitigation and food security is important to assess the trade-off between these two vital ecosystem services. As such, accurate data on abandonment and recultivation patterns are crucial to conduct this research. Currently, the remote sensing based studies for monitoring of cropland in the Yangtze River basin are diverse and cover various aspects of land use and environmental monitoring, including urbanization [59], water and soil monitoring [60], and crop patterns [61]. However, studies focusing on the spatiotemporal dynamics of the interaction between cropland abandonment and recultivation in this region are lacking.
In this study, we define ”cropland abandonment” as the conversion of agricultural land from cropland to natural vegetation after two consecutive years of non-cultivation. This definition facilitates the distinction between short-term fallowing and long-term abandonment, which is crucial when examining crop rotation cycles and/or farming practices. This definition is in line with previous studies of cropland abandonment monitoring carried out across the Yangtze River basin [45,62,63]. Our aim is to map the extent and timing of abandoned and recultivated cropland at the watershed scale using MODIS time series data, and to reveal the spatial and temporal interactions between these processes in order to obtain a more comprehensive understanding of the complex land use dynamics across this study area. To do so, we proceeded as follows:
(1)
We used a strategy to quickly generate classifier sample data based on existing land use products, and created annual land cover maps suitable for a large scale area.
(2)
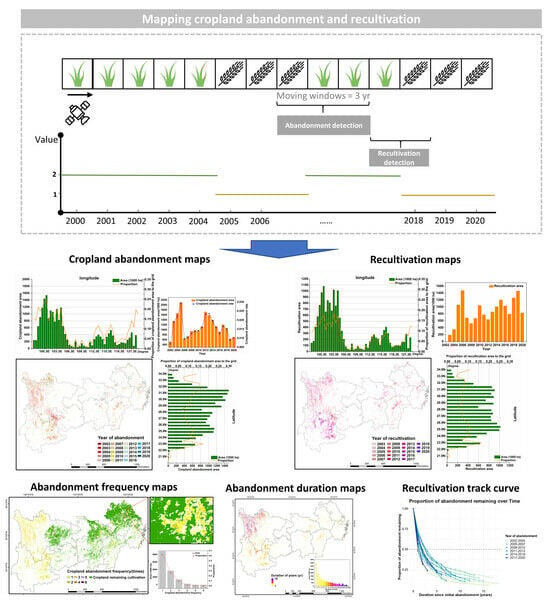
We mapped the extent and timing of cropland abandonment and recultivation based on continuous time series land cover data.
(3)
We analyzed the cropland abandonment intensity (i.e., frequency and duration) and the spatial and temporal interaction with recultivation.

2. Materials and Methods

2.1. Study Areas

The Yangtze River basin is located in Southern China, and includes nine provinces and two municipalities (Figure 1). Covering 21.3% of China’s territory, it houses 599 million people. The basin is a major grain producer, accounting for 36.2% of China’s grain output in 2019 (China statistical yearbook, 2019, http://www.stats.gov.cn/sj/ndsj/2019, accessed on 1 November 2022). Economic activities within the basin have shown remarkable growth, contributing 46.3% to China’s GDP in 2018 (China statistical yearbook, 2019). However, this growth has long-term negative environmental consequences, as the region faces habitat loss, biodiversity decline, pollution, and severe soil erosion issues. Consequently, notable reductions in cropland area have been observed in some parts of the region [64], threatening food security at the national level.
Given the extended growing seasons resulting from the warm and wet climate in the study region, crop rotation and continuous monocropping emerge as the two predominant cropping systems. Dryland crops such as wheat, oilseed rape, and maize often yield two harvests per year, illustrated by common rotations like “fallow–wheat–wheat”, “rice–rice”, “cole–corn”, “wheat–corn”, “wheat–corn–sweet potato”, and “rice–winter crop”. These crop rotation schemes are frequently modified to improve the sustainability of agricultural systems; as such a fallow period of one to two years is common.

2.2. Definition of Cropland Abandonment and Recultivation

Taking into account the FAO definition, cropland abandonment is a result of a lack of management for at least two to five years [41,65]. We characterized cropland as being abandoned if it had not been cultivated for at least two consecutive years. However, when these abandoned croplands were converted back into cropland, we identify this process as “recultivation” (Figure 2).

2.3. Data Preprocessing for Classification

Figure 3 outlines our five-step methodological framework. Step A, NDVI (Normalized Difference Vegetation Index) maps were produced from MODIS imagery. NDVI, calculated as (NIR − Red)/(NIR + Red), where NIR is near-infrared band reflectance and Red is red band reflectance, serves as a crucial tool for differentiating land covers and assessing cropland productivity. Step B, sample data were collected from locations consistently classified across multiple products. To ensure accuracy, at least 10% of these samples were manually verified using high-resolution images. These samples were then divided into training datasets and datasets for accuracy qualification. Employing the Random Forest algorithm (RF) with annual training data, we produced annual land cover maps, whose accuracy was evaluated using overall accuracy, kappa, and F1 metrics [66,67]. Steps C and D, spatiotemporal patterns of cropland abandonment and its intensity (i.e., frequency and duration) were mapped by considering the trajectory of change in this land cover class. Step E, annual recultivation maps were produced based on abandoned cropland and annual land use data. All data analyses were conducted by using Google Earth Engine (GEE) cloud computing platforms and ArcGIS 10.2 ESRI (Environmental Systems Research Institute, 2013).
In this study, a smoothing function was applied to the NDVI time series to counteract noise from clouds, soil, and snow in order to better characterize the growth curve. Initially, pixels labeled as poor quality, snow/ice, or cloud in the QA layer were filtered out from the original NDVI time series. Subsequently, the NDVI profiles were reconstructed for each year of the time series using a weighted Whittaker smoothing algorithm [68,69].

2.4. Annual Land Cover Mapping and Accuracy Assessment

We obtained an extensive dataset covering our entire study area to collect classification samples. Our sample data were produced based on two data sources: (1) Dense time series land cover products for sample collection, including GlobeLand30 (http://www.globallandcover.com, accessed on 1 November 2022), China’s National Land Use and Cover Change (CNLUCC) dataset (http://www.resdc.cn, accessed on 1 November 2022), MCD12Q1 global land cover maps (https://lpdaac.usgs.gov/products/mcd12q1v006/, accessed on 1 November 2022), ESA-CCI (https://www.esa-landcover-cci.org/, accessed on 1 November 2022), and GlobCover maps (http://due.esrin.esa.int/page_globcover.php, accessed on 1 November 2022) (Table 1). (2) Dense time series of high-resolution images, like Google Earth Pro© and CLCD for sample correction (Supplementary Information S1.2). Initially, a nearest neighbor resampling technique was applied to MCD12Q1, GlobCover, CNLUCC, and ESA-CCI, and a majority filtering technique was applied to GlobeLand30 so that the resolution of all datasets was consistent with the 250 m resolution of the MODIS-NDVI dataset. We generated random points to obtain land cover from at least 3 out of 5 of these land cover products each year (the distance between all random points generated was set to 500 m to avoid saturation sampling). Random points with high feature consistency are considered to be consensus samples. As a minimum threshold, there should have been an agreement on at least two-thirds of the land cover products each year. These consensus samples, exceeding 10,000 in number, demonstrated stable land cover types and high consistency across various maps, especially in mountainous regions (Tables S2 and S3).
Subsequently, we selected random points with high feature consistency and manually corrected a 10% random sample for each land cover class. For less represented classes like shrubs and wetlands, we increased the random sampling to 15%. Sampling ratios were based on established methodologies [10], with random screening conducted through ArcGIS 10.2. The correction consisted of two methods using Google Earth and CLCD. (1) Visual interpretation using historical Google Earth imagery was performed as a minimum if the corresponding data existed. If these data were not available, (2) the correction was based on the CLCD land cover product. First, the relative surface cover of each land cover class was calculated within a 250 m resolution grid consistent with our MODIS-NDVI pixel, and classes with more than 50% cover within the grid cell were designated as correction land cover (Figure S1). However, if no land cover category had 50% coverage, the point was discarded from the analysis.
Finally, approximately 70% of the total consensus sample points were allocated to the random forest classifier for training, and the remaining 30% were used for quantifying the accuracies. This allocation ratio has been demonstrated to enhance classification robustness [70,71,72].
Table 1. Auxiliary dataset used for collecting annual samples. Our selected datasets have been shown to have high accuracy in terms of land cover classification across China [73].
YearGlobeLand30CNLUCCMCD12Q1ESA-CCIGlobCover
20002000200020012000
20012000200020012001
20022000200020022002
2003 2005200320032005
2004 2005200420042005
2005 2005200520052005
2006 2005200620062005
2007 2005200720072005
200820102010200820082009
200920102010200920092009
20102010201020102010
20112010201020112011
20122010201020122012
2013 201520132013
2014 201520142014
2015 201520152015
2016 201520162015
2017 201820172015
2018202020182018
2019202020182019
2020202020202019
We used the RF in GEE for annual land cover classification. RF implementation in GEE enables large-scale classification at the pixel level. Similar to many other models, RF’s effectiveness is sensitive to the selection of hyperparameters and the training data employed [74]. To date, RF is considered to be the most widely used algorithm for land cover classification using remotely sensed data [75], due to the fact that only two parameters (number of trees: ntree and maximum number of features to try: mtry) need to be optimized. In GEE, mature RF algorithms have been included for direct use.
We included three key parameters in our random forest model: the smoothed MODIS-NDVI dataset (46 images per year), the number of filtered sample points, and the random forest parameters (ntree and mtry). Based on the recommendations of previous studies [76] and our large sample data, we first select 120 trees (ntree = 120) while setting mtry as the default value. We will adjust the number of trees several times according to the classification results in order to achieve the best classification results.
For classification accuracy qualification, we generated annual confusion matrices, calculating overall accuracy (OA), producer’s accuracy (PA), user’s accuracy (UA), and the kappa index. We also used the F1 score for each class accuracy assessment.
O A = N u m b e r   o f   c o r r e c t l y   c l a s s i f i e d   s a m p l e s T o t a l   n u m b e r   o f   s a m p l e s
P A = N u m b e r   o f   c o r r e c t l y   c l a s s i f i e d   s a m p l e s   o f   t h e   c a t e g o r y T o t a l   a c t u a l   s a m p l e s   o f   t h e   c a t e g o r y
U A = N u m b e r   o f   c o r r e c t l y   c l a s s i f i e d   s a m p l e s   o f   t h e   c a t e g o r y T o t a l   s a m p l e s   c l a s s i f i e d   i n t o   t h e   c a t e g o r y
F 1 = 2 × U A × P A   /   ( U A + P A )
where F1 score, a harmonic mean of user’s and producer’s accuracy, is advantageous when learning from imbalanced data. F1 score ranges from 0 to 1 with higher score indicating better classification performance.

2.5. Annual Cropland Abandonment and Recultivation Mapping

We conservatively classified a cropland pixel as abandoned only if it changed into natural cover (Figure 3). We excluded lands converted into wetlands, impervious surfaces, or water bodies. Additionally, forested areas were omitted from our analysis, as two years is insufficient for abandoned cropland to change into mature forest ecosystems.
There have been concerns about the overestimation of abandoned croplands in some parts of the world, e.g., due to the large-scale intentional afforestation, such as “Grain for Green” program in China (known as “GGP”, which converted croplands located on slopes of more than 25° into grassland/forest [77]). Such overestimation may result in wrong projections of the amount of land available for carbon sequestration, nature restoration, or afforestation projects through cropland abandonment, as intentional afforestation already represents the shift in land use [14,78]. To distinguish our cropland abandonment from GGP, we used a Digital Elevation Model (DEM, 250 m resolution based on SRTM 90 m, https://www.resdc.cn, accessed on 1 November 2022) to restrict our study area to slopes under 25°.
Upon detecting cropland abandonment, we created annual maps covering the period from 2002 to 2020. This enabled the computation of annual relative cropland abandonment area proportion to cropland area (RCAP), frequency, and duration. Frequency indicates how often a specific area was identified as abandoned from 2002 to 2020, while duration measures the time span from a site’s initial abandonment identification to either recultivation or 2020.
R C A P T + 2 = A r e a C A T + 2 / A r e a C T
where R C A P T + 2 denotes relative cropland abandonment area proportion in the given region, A r e a C A T + 2 (103 ha) is the cropland abandonment area which included cropland identified in year (T) that is considered abandoned after two years ( T + 2 ) in the given region, and A r e a C T (103 ha) represents the total cropland area in the given region in year (T). In this study, T ranges between 2000 and 2018 when considering cropland.
A pixel reverted from abandoned to cropland was classified as recultivated. This method helped track the change in the proportion of abandoned land over time, offering more precise insights than average abandonment duration.

3. Results

3.1. Land Cover Maps and Accuracy

Throughout all our land cover maps of the Yangtze River basin (from 2000 up to 2020), cropland, forest, and grassland are covering c. 35%, c. 40%, and c. 20% of the total area, respectively (Figure 4). More precisely, cropland is mainly found in the agriculturally favorable flat terrains of Eastern Sichuan, Anhui, and Jiangsu. Forests, on the other hand, are mainly found in the western areas, especially in Yunnan and Guizhou. Meanwhile, grasslands are chiefly located in the northwestern part of Sichuan and Yunnan.
The sequence of land use change maps from 2000 to 2020 revealed a significant decrease in cropland. For instance, certain regions of Yunnan changed from cropland to grassland over these two decades (Figure 5), in addition to the encroachment on cropland by the development of the Yangtze River urban agglomeration.
Our validation of the 2000–2020 classifications (Figure 6 and Figure 7) revealed an OA ranging between 0.82 and 0.85. The years 2018–2020 had the lowest average OA at 0.82 ± 0.02 (95% confidence interval), while 2009–2011 had the highest OA at 0.85 ± 0.002. The kappa index follows this trend in accuracy. Land cover specific F1 scores were highest for forest (0.90 ± 0.01), followed by water (0.89 ± 0.02), cropland (0.84 ± 0.01), grassland (0.84 ± 0.01), and impervious surface (0.83 ± 0.03). Significantly lower F1 scores were observed for wetland (0.41 ± 0.1) and shrubs (0.47 ± 0.03).
We compared our cropland classification results with the CLCD [79] classification for each individual province. Although this has been performed annually, in Figure 8, we presented the results for the years 2000, 2005, 2010, 2015, and 2020 as examples. Our analysis revealed a strong correlation between our maps and the CLCDcropland layer for the majority of provinces.

3.2. Spatiotemporal Analysis of Cropland Abandonment

The annual cropland abandonment map illustrates widespread abandonment throughout the entire study region (Figure 9). However, the high-altitude agricultural zones in Sichuan and Yunnan as well as some distinct areas in Jiangxi and Zhejiang experienced the highest rate of abandonment. About 60% of these abandonments lie between longitudes 99° and 104°E, and another 25% between 113° and 117°E (Figure 9b). When considering latitudinal spread, 88% of abandoned croplands are positioned between latitudes 25° and 33°N, as depicted in Figure 9d.
Analyzing the annual rate and magnitude of abandonment reveals a fluctuating trend from 2002 to 2020 (Figure 9c). An increasing trend was observed from 2002 to 2005, followed by a sharp decrease in 2006. Then, a gradual rise from 2006 to 2012 was seen, ending with a remarkable decline post-2012. Throughout this period, an estimated 21,490 × 10³ ha of cropland were abandoned. The annual figures varied between 526 × 10³ ha and 2104 × 10³ ha, with the relative cropland abandonment area proportion (RCAP) fluctuating between 0.68% and 3%. Notably, 2005 has been characterized by the highest abandonment rate, while 2002 had the lowest.
The abandonment frequency map in Figure 10 shows varied patterns of abandonment across the region. The abandonment was categorized into three frequency types: low (1–2 times), moderate (3–4 times), and high (5–6 times). The low-frequency abandonment is widespread, especially in Western Sichuan and Yunnan as well as Eastern Jiangxi and Zhejiang. Conversely, the moderate frequency follows a similar distribution, albeit less pronounced in areas such as Sichuan and Eastern Yunnan. High-frequency abandonment is chiefly found in the mountainous regions of Sichuan and Yunnan, accounting for a mere 0.4% (or 82 × 10³ ha) of the total abandonment over the study period. A remarkable 76% (or 16,310 × 10³ ha) of the total area experienced low-frequency abandonment, as highlighted in Figure 10c.
Our analysis determined how long a specific pixel of abandoned cropland remained abandoned before being changed into another form of land cover (Figure 11). The abandonment durations ranged from 1 to 19 years. Although the region’s average abandonment duration is relatively short, i.e., averaging around 5.5 years, in regions like Sichuan and Yunnan, the abandonment often surpassed 15 years. The central provinces like Hubei and Hunan typically saw abandonment durations between 5 and 13 years. In terms of the overall landscape, about 25% of the abandoned land reverted after a year, and only 1% remained abandoned for 19 years. Furthermore, there was a 61% probability of the cessation of cropland abandonment if it lasted for five years. Conversely, areas abandoned for over 13 years saw a sharp decline in recultivation likelihood, with only 10% undergoing this process.
Figure 12 shows the proportion of abandoned cropland remaining abandoned depending on the initial abandonment date (i.e., considering periods of three years). This figure illustrates a general trend of fairly rapid recultivation of abandoned cropland. More precisely, over half of the abandoned croplands got recultivated within just three years. This curve indicates that the loss pace tends to slow down as the abandonment duration extends. Yet, a more detailed look highlights an increasing trend in recultivation rates, with the most recently abandoned croplands (e.g., initial abandonment period 2017–2019) being recultivated faster compared to croplands that was abandoned in the early 2000s.

3.3. Spatiotemporal Analysis of Recultivation

Our study indicates that the spatial patterns of cropland recultivation mirror those of cropland abandonment, with both being predominantly concentrated in the western part of the study area (Figure 13). The process of recultivation predominantly occurred between the longitudes of 99°E to 105°E and the latitudes of 25°N to 33°N (Figure 13b,d). By 2020’s end, 15,857 × 103 ha of abandoned cropland had been recultivated, accounting for 74% of the total abandoned area. In 2006, recultivation peaked with 1475 × 103 ha of land, while 2003 saw the least at about 190 × 103 ha (Figure 13c).

4. Discussion

This study mapped the spatiotemporal dynamics of cropland abandonment and recultivation across the Yangtze River basin. Compared to previous macro-analyses with a particular focused on China, this study offers an in-depth understanding of the spatiotemporal interplay between abandonment and recultivation. The outcomes provide policymakers with new insights that can be used to develop a balanced policy-making strategy which aims at optimizing the balance between agricultural productivity on the one hand and ecological conservation on the other hand. As such, it offers a scientific basis to improve the management of abandoned croplands considering the unique environmental land socio–economical context of the Yangtze River basin. Additionally, the novel methodology and insights from this study may serve as a model for analogous research in other regions, contributing to the development of sustainable land management strategies.

4.1. Comparison with Other Studies

Due to the significant interannual variability in the cropland spectrum, mapping abandoned land via cropland dynamic maps is challenging [80]. An overall land use classification accuracy of 0.82–0.85 was achieved through the rapid collection of high-precision samples. Recent studies on mapping abandoned cropland in China achieved a land use classification accuracy exceeding 0.75, with classification accuracies of more than 86% for some large-scale areas [10,81], which is similar to our results, and as such the efficacy of our classification method and its suitability for cropland abandonment detection is comparable. However, the average F1 score for our cropland classification was 0.84 (Figure 7), slightly lower than that in the study by [70], potentially due to the lower resolution of data used in our study compared to theirs.
The comparative analysis reveals both similarities and differences in the definitions of abandonment in these studies. A consensus is the cessation of agricultural activities and management, which is recognized in all studies. This definition leads to different potential outcomes, ranging from ecological impacts [82] to land use changes [83], which reflects a different research focus concerning the process of land abandonment, i.e., considering either (i) the transitional nature and potential outcomes or (ii) the associated policy implications and opportunities. However, some studies consider both, recognizing the complex and multifaceted nature of abandonment [84,85]. Our research adds a specific, measurable definition to this spectrum, enriching the understanding of land abandonment from a temporal and ecological perspective.
Notably, the current study found that at least 19% of cropland in China has been abandoned at least once (ranging from 19% to 28%) [45,81,86]. Compared to our study, this proportion is slightly lower, i.e., 30%. This difference may be related to the length of the study and the methodology. For instance, Li, et al. [87] estimated the extent of abandoned cropland across mountain areas based on household survey data. Their results showed that the abandonment rate of cropland in mountainous areas was about 28% during 2000–2010, including during the Grain for Green Program. This value is notably higher than our findings (i.e., 13%), which is not a surprise as Li, Li, Sun, Cao, Fischer, and Tramberend [87] also included afforestation, which is not the case in the present study. Similarly, Xu, Deng, Guo, and Liu [30] used data from the China Household Finance Survey (CHFS) to conduct household surveys across 29 out of 34 provinces of China, finding that the abandonment rate of cropland in 2011 and 2013 was 13% and 15%, respectively, which is similar to our findings. In a global context, the abandonment proportion in the Yangtze River basin aligns with figures from Eastern Europe, the former Soviet Union, and Chile (16% to 42%) [11,80,88], but is higher than those reported for Central Asia (approximately 13%) [43].
Our abandonment durations were much shorter than those found in a global average (=14 years [89]), but our abandonment duration was similar to Song [90] (3.5 years). At the same time, studies in the tropics have shown that the duration of secondary forest recultivation is usually short [91,92,93,94]. In the Brazilian Amazon, secondary forests are cleared and recultivated much more rapidly (50% within 5 to 8 years), resulting in 80% of secondary forests being ≤20 years old. In contrast, across the tropics, only 33% of forests that had been regenerated on recently cleared sites were ≥10 years old.
However, it is important to emphasize that caution is needed when directly comparing these regions. Variations in the definitions of “cropland abandonment” across studies can impact the comparability of these rates. For instance, one study in China estimated that the area of cropland abandonment for five years accounted for 19% of China’s total cropland [86]. However, this definition ignores different farming systems across different regions, and, therefore, may result in a misclassification of short-term cropland abandonment (i.e., non-fallow), and as such underestimate the area of abandonment. Another study in Central Asia, which defined abandonment as three consecutive years of non-use of cropland, estimated that abandonment in northern Kazakhstan is equal to 40.5% [88], a figure which is higher than that presented by our results. However, one study used the same definition, but found the proportion of abandoned areas in the Guizhou–Guangxi karst mountain area of China to be around 16%, which is lower than our findings [45].

4.2. Cropland Abandonment and Recultivation Drivers

Cropland abandonment across the Yangtze River basin became progressively more apparent at the beginning of this century, although there were annual and regional variations. The implementation of the Rural Land Contracting Law and the abolition of agricultural taxes in 2006 might lead to restricted areas of abandonment across our study area (Figure 9c) [95]. The shift away from agriculture, induced by increasing farming costs and the appeal of non-agricultural sectors, was especially noticeable near urban areas in the Yangtze River delta region (Figure 9a,b). Similar trends have been observed in parts of Western Europe and America [63,96,97,98].
Our research has identified a notable increase in recultivation, a trend that has become increasingly prominent over time (Figure S4). This phenomenon potentially elucidates the observed, albeit statistically non-significant, decline in both the extent of cropland abandonment and its corresponding rate (Figure S3). Concurrently, this trend underlines the extensive adoption of recultivation policies strategically aimed at diminishing potential food security threats. As the decade progressed into the mid-2000s, a transition towards the recultivation of previously abandoned croplands began to emerge. This shift was mainly influenced by policy adjustments, particularly the reduction in GGP subsidies, motivating farmers, especially those enrolled before 2007, to reengage with their initial agricultural activities, and, therefore, recultivate their lands [99]. Governmental directives in 2004 and 2014, focusing on food security (e.g., Emergency Circular on Restoring Abandoned Cropland Production), further fueled the recultivation momentum in our area. In addition, The policy National Land Consolidation and Rehabilitation Plan (2011–2015) aimed to counteract abandonment by consolidating fragmented cropland and modernizing infrastructure in mountainous areas [100], which resulted in a noticeable decrease in the abandonment rate.
Concurrent socio–economic upheavals, like the economic crises of 2008, resulting in urban unemployment, prompted a rural return [101,102], aligning with the observed increase in recultivation area during this period (Figure 13c). Additionally, region-specific agricultural strategies, such as the minimum purchase price for grain products in provinces like Jiangxi, Anhui, and Jiangsu, contributed to the post-2009 surge in recultivation [103,104].
When looking to the absolute total cropland abandonment areas, slopes less than 5° have been characterized by the largest abandonment area (Figure 14a), e.g., ranging between 192 × 10³ ha and 852 × 10³ ha from 2002 to 2020. However, when considering RCAP (Figure 14b), this increases with increasing slope steepness, reaching a maximum value of 11% for slopes of 20–25° in the year 2005. Soil degradation processes on these steeper slopes, mainly due to soil erosion, leads to higher management costs and reduced crop yields [105]. Furthermore, in mountainous areas, greater distances between homes and croplands increases the likelihood of abandonment, particularly on steeper terrains [106,107]. While GGP was not the focus of this study, the increased wildlife crop raiding associated with forest expansion due to GGP could raise production costs [108]. This may be another major reason for cropland abandonment in mountainous areas.

4.3. Policy Implications

Accurate assessment of the spatial and temporal distribution of abandoned cropland is essential for assessing the ecological and environmental effects of land use in mountainous areas. As mountainous croplands are often abandoned due to a variety of reasons and conditions, this land may provide valuable environmental benefits to society. For example, when considering the international literature, an extensive body of research has investigated the carbon storage potential from this kind of cropland abandonment across China [109,110,111]. However, our study highlights the importance of incorporating time series data for accurate estimations of abandoned croplands, because without accurate annual land use maps we may miss out the process of recultivation leading to a considerable over-estimation of the associated total soil organic carbon (TOC) sequestration potential [89]. Indeed, understanding the precise duration of cropland abandonment is essential, especially when assessing the associated impact on the delivery of ecosystem services.
In comparison to other regional studies in China, this study highlights the relatively short duration of cropland abandonment in the Yangtze River basin. The majority of abandoned land is typically recultivated within three years, indicating intense utilization of cropland and that increased food production based on cropland area growth can significantly alleviate the food shortage. However, prioritizing ecological benefits is imperative: overlooking the transient nature of agricultural abandonment risks can lead to sacrificing considerable ecological gains. For example, recultivation could inadvertently impact biodiversity and carbon sequestration adversely [112]. Additionally, large-scale cropland recultivation projects, designed to benefit local communities’ livelihoods, may be unsuccessful due to inefficient use of new croplands [113,114], especially when local socio–economic contexts are disregarded [115]. Hence, crafting policies with local communities is crucial to balance biodiversity, carbon storage, and livelihoods. Nevertheless, this nexus requires further research.

4.4. Limitations and Future Perspectives

In this study, we explored the spatiotemporal variation in cropland abandonment and recultivation. Our research provided spatiotemporal explicit information regarding cropland abandonment and recultivation and the associated trade-off between both. As such, our study makes an important contribution to the understanding of the complex system of rapidly changing agricultural landscapes in one of the key areas of China. However, there are some limitations to this study, and, hence, interesting perspectives for future research.
Firstly, defining cropland abandonment remains a challenge. In our methodology, croplands left uncultivated for two years were classified as abandoned. We acknowledge that large-scale studies of cropland abandonment, including ours, do not provide insights into seasonal abandonment and fallow patterns. Despite these methodological differences between our study and that of Li, Pan, Zheng, and Liu [27], both studied identified the same regions, i.e., Sichuan mountains and the plains of the middle and lower reaches of the Yangtze River, as important land abandonment areas. Nevertheless, our findings suggest that the duration of abandonment in these areas is shorter, indicating a dynamic cropland abandonment process, which partly could be the seasonal lying fallow. We recognize that our methodology may underestimate to some extent cropland abandonment because some areas identified as cropland in the annual land use data may contain seasonal abandonment. This indicates the need for methodological improvements in future studies in order to capture the spatiotemporal dynamic of both long-term and seasonal cropland abandonment across large study areas. Although it inherently lacks the level of detail to identify seasonally fallow land, our method effectively captures long-term cropland abandonment trends across a vast area, contributing valuable knowledge to the fields of agricultural sustainability and environmental management.
Differentiating between “permanently abandoned cropland” and temporarily fallow land is challenging due to their similar spectral characteristics in the initial stages. However, fallowed land is characterized by continuous herbaceous vegetation cover, which increases in density as the fallowing period extends [116,117], yet these areas still exhibit clear signs of human management to facilitate rapid resumption of agricultural production. In contrast, abandoned land shares similar spectral characteristics with fallowed land, especially in its initial stages of fallowing. To more precisely differentiate between these two types of land use, future studies will need to integrate time series multispectral remote sensing imagery with high-resolution images to analyze surface texture features.
Given the differences between farming systems, the usage of the same threshold duration value may result in a non-detection of abandonment within farming systems characterized by relatively short abandonment periods across vast areas. Similarly, our study used the same definition of recultivation across the entire study area, which may overestimate the extent of recultivation of abandoned cropland. Although future research could improve this particular element of assessing the spatiotemporal dynamics within vast agricultural landscapes, we are convinced that the definitions of abandonment and recultivation used in this study are meaningful across the Yangtze River basin. Our research focuses on the inter-annual spatial and temporal patterns of cropland abandonment, which are critical for understanding wider issues related to food and ecological security (e.g., impacts on carbon sinks and water resources).
Secondly, we combined several public land cover datasets to obtain classification samples. However, differences in dataset classification schemes may introduce errors [73,118]. As such, the land cover classes from different datasets were unified to meet our requirements, and land cover with the same class exceeding two-thirds was defined as the dominant one. This approach is considered to be an effective method for obtaining classification samples, and, therefore, can be considered as a promising sampling method for future studies.
Thirdly, although the random forest algorithm is the most commonly used land use classification algorithm, the most challenging task remains to distinguish between cropland and natural vegetation. Our classification results similarly show poor accuracy in classifying shrubs (Figure 7), for example. Our analysis revealed that the area of shrubs constitutes only about 0.5–0.7% of the total land cover in our results (Figure 4), with slight variations across different years. In comparison, shrub cover accounts for around 1% in the CLCDand 1.5% in the GlobeLand30 datasets. Given this relatively low proportion of shrub cover in the Yangtze River basin, we assert that the lower precision in shrub identification has a minimal impact on the overall accuracy of our analysis regarding land abandonment. Overall, the results of our study mainly reflect the general trend of land use change, and the impact of shrubland misclassification is relatively minor. Additionally, the use of MODIS-NDVI data in combination with vegetation phenology metrics can improve land cover classification in coarse resolution satellite imagery.
Fourthly, MODIS satellite data were chosen as the primary source for mapping cropland abandonment at large scale due to its coverage of extensive areas and more frequent data observations. The abundant spectral information and high temporal resolution of MODIS enable better distinction between cropland and natural vegetation. However, the usage of 250m resolution MODIS imagery could be challenging to map cropland in the southern region of China, as the fragmentation of land patches tends to bring significant “mixed pixels” [119], potentially leading to an underestimation of cropland abandonment. Consequently, we believe that articulating our rationale for selecting MODIS, combining MODIS with other high-resolution satellite data (e.g., Landsat and Sentinel) in order to create series of satellite data with higher spatial and/or temporal resolution, and/or developing sub-pixel land classification methods will be an interesting methodological approach to enhance the effective monitoring of cropland abandonment in highly heterogeneous landscapes [120,121]. As such, the freely available Sentinel-2 optic data at a resolution of 10 m could be an interesting future database to perform this kind of analyses. However, as Sentinel-2 has only been available since 2015, it is currently unable to cover the time span required to detect long-term temporal changes (e.g., 20 years, as being considered in this study). Furthermore, our previous analyses, which focused only on abandoned cropland with slopes below 25°, showed that the majority of abandoned land was concentrated in areas with slopes below 5°, and was less affected by topographic errors than expected. Therefore, given the temporal coverage (20 years) and large-scale applicability, MODIS data remain the most suitable available data for our study.

5. Conclusions

Cropland abandonment is of wide concern in China as it may endanger the nation’s food security. Using MODIS data on the GEE platform, we employed the RF algorithm to map LULC across the Yangtze River basin from 2000 to 2020. Additionally, we undertook spatial–temporal analyses to assess spatiotemporal interactions between cropland abandonment and recultivation.
Our LULC maps achieved an accuracy ranging between 0.82 and 0.85 throughout the study period. We observed widespread cropland abandonment, particularly in areas with slopes under 5°, but overall rates remained low. Abandonment was most notable in Sichuan, Yunnan, and specific urbanized areas in the East. The total abandoned cropland covered an area of 21,490 × 10³ ha, with yearly fluctuations (e.g., a maximum of 2104 × 10³ ha in 2005 and a minimum value of 526 × 10³ ha in 2002). By 2020, 15,857 × 10³ ha (or 74% of total abandoned area) had been recultivated, reflecting that cropland abandonment in the basin occurs less frequently and for shorter durations (about 5.5 years on average). Changing agricultural policies, economic dynamics, and increased urbanization and food needs led to more than half of the abandoned cropland being recultivated within the timespan of three years.
This study highlights the dynamic nature of land use within agriculture landscapes and the urgent need for long-term high-resolution regular monitoring. The present methodology and the resulting maps of cropland abandonment provide the basis for a balanced policy considering both ecological conservation and food security. Abandoned cropland can be a promising avenue for unlocking additional land resources in a world where land scarcity remains a major hindrance to sustainable development. The potential benefits of strategically recultivating abandoned cropland and/or reforesting it are in line with global initiatives such as the Paris Agreement and the United Nations’ Sustainable Development Goals (SDGs), particularly Zero Hunger (SDG 2) and Life on Land (SDG 15), which focus on restoring degraded land and increasing afforestation. Therefore, we identified a future research direction that explores the trade-offs and potential benefits between different uses of abandoned cropland. This direction is particularly important for understanding the synergistic effects of land use decisions on climate goals and sustainable development.

Supplementary Materials

The following supporting information can be downloaded at: https://www.mdpi.com/article/10.3390/rs16061052/s1, Figure S1: Sample point correction based on CLCD. The black grid in the figure has a resolution of 250 m, which reflects the resolution of the MODIS. The random points come from samples that we need to manually correct; Figure S2: Cumulative cropland abandonment area. The solid black line represents the total cumulative reality area of abandoned cropland, and the dashed black line represents the cumulative scenario area of abandoned cropland, assuming a scenario without recultivation; Figure S3: Trends in (a) cropland abandonment area and (b) rate (2002–2020). The blue and green lines respectively depict the trends in cropland abandonment area and rate over time. The gray shaded areas represent the 95% confidence intervals; Figure S4: Trends in recultivation area (2003–2020). The blue line depicts the trends in recultivation area over time. The gray shaded areas represent the 95% confidence intervals; Table S1: Descriptions of land use/land cover classes used in our time-series maps; Table S2: The number of training samples for each land cover; Table S3: The number of validation samples for each land cover. References [14,79,122,123,124,125,126] are cited in Supplementary Materials.

Author Contributions

Conceptualization, Y.L.; Methodology, Y.L. and J.S.; Software, Y.L.; Writing—original draft, Y.L.; Writing—review & editing, J.M. and J.S.; Visualization, Y.L.; Supervision, J.S., J.W., G.C., W.W. and J.M.; Project administration, W.W. All authors have read and agreed to the published version of the manuscript.

Funding

This research was supported by National Key Technologies Research and Development Program of China (2019YFA0607400), National Natural Science Foundation of China (grant No. 42271276).

Data Availability Statement

Data are contained within the article.

Acknowledgments

The authors acknowledge the Chinese Academy of Agricultural Sciences—Uliège, Gembloux Agro-Bio Tech, jointed PhD program. The authors also acknowledge four anonymous reviewers and editors for their comments.

Conflicts of Interest

The authors declare no conflict of interest.

References

  1. Foley, J.A.; Ramankutty, N.; Brauman, K.A.; Cassidy, E.S.; Gerber, J.S.; Johnston, M.; Mueller, N.D.; O’Connell, C.; Ray, D.K.; West, P.C.; et al. Solutions for a cultivated planet. Nature 2011, 478, 337–342. [Google Scholar] [CrossRef]
  2. Lambin, E.F.; Meyfroidt, P. Global land use change, economic globalization, and the looming land scarcity. Proc. Natl. Acad. Sci. USA 2011, 108, 3465–3472. [Google Scholar] [CrossRef]
  3. Chazdon, R.L.; Lindenmayer, D.; Guariguata, M.R.; Crouzeilles, R.; Rey Benayas, J.M.; Lazos Chavero, E. Fostering natural forest regeneration on former agricultural land through economic and policy interventions. Environ. Res. Lett. 2020, 15, 043002. [Google Scholar] [CrossRef]
  4. Winkler, K.; Fuchs, R.; Rounsevell, M.; Herold, M. Global land use changes are four times greater than previously estimated. Nat. Commun. 2021, 12, 2501. [Google Scholar] [CrossRef]
  5. Ramankutty, N.; Mehrabi, Z.; Waha, K.; Jarvis, L.; Kremen, C.; Herrero, M.; Rieseberg, L.H. Trends in Global Agricultural Land Use: Implications for Environmental Health and Food Security. Annu. Rev. Plant Biol. 2018, 69, 789–815. [Google Scholar] [CrossRef]
  6. Potapov, P.; Turubanova, S.; Hansen, M.C.; Tyukavina, A.; Zalles, V.; Khan, A.; Song, X.P.; Pickens, A.; Shen, Q.; Cortez, J. Global maps of cropland extent and change show accelerated cropland expansion in the twenty-first century. Nature Food 2022, 3, 19–28. [Google Scholar] [CrossRef]
  7. Estel, S.; Kuemmerle, T.; Alcántara, C.; Levers, C.; Prishchepov, A.; Hostert, P. Mapping farmland abandonment and recultivation across Europe using MODIS NDVI time series. Remote Sens. Environ. 2015, 163, 312–325. [Google Scholar] [CrossRef]
  8. Yu, Z.; Lu, C. Historical cropland expansion and abandonment in the continental U.S. during 1850 to 2016. Glob. Ecol. Biogeogr. 2018, 27, 322–333. [Google Scholar] [CrossRef]
  9. Yoon, H.; Kim, S. Detecting abandoned farmland using harmonic analysis and machine learning. ISPRS J. Photogramm. Remote Sens. 2020, 166, 201–212. [Google Scholar] [CrossRef]
  10. Zhu, X.; Xiao, G.; Zhang, D.; Guo, L. Mapping abandoned farmland in China using time series MODIS NDVI. Sci. Total Environ. 2021, 755, 142651. [Google Scholar] [CrossRef]
  11. Díaz, G.I.; Nahuelhual, L.; Echeverría, C.; Marín, S. Drivers of land abandonment in Southern Chile and implications for landscape planning. Landsc. Urban Plan. 2011, 99, 207–217. [Google Scholar] [CrossRef]
  12. Rey Benayas, J.M.; Martins, A.; Nicolau, J.M.; Schulz, J.J. Abandonment of agricultural land: An overview of drivers and consequences. CABI Rev. 2007, 2007, 1–14. [Google Scholar] [CrossRef]
  13. Gellrich, M.; Baur, P.; Koch, B.; Zimmermann, N.E. Agricultural land abandonment and natural forest re-growth in the Swiss mountains: A spatially explicit economic analysis. Agricult. Ecosyst. Environ. 2007, 118, 93–108. [Google Scholar] [CrossRef]
  14. Næss, J.S.; Cavalett, O.; Cherubini, F. The land–energy–water nexus of global bioenergy potentials from abandoned cropland. Nat. Sustain. 2021, 4, 525–536. [Google Scholar] [CrossRef]
  15. Prishchepov, A.V.; Schierhorn, F.; Löw, F. Unraveling the Diversity of Trajectories and Drivers of Global Agricultural Land Abandonment. Land 2021, 10, 97. [Google Scholar] [CrossRef]
  16. Mottet, A.; Ladet, S.; Coqué, N.; Gibon, A. Agricultural land-use change and its drivers in mountain landscapes: A case study in the Pyrenees. Agricult. Ecosyst. Environ. 2006, 114, 296–310. [Google Scholar] [CrossRef]
  17. Feng, Z.; Yang, Y.; Zhang, Y.; Zhang, P.; Li, Y. Grain-for-green policy and its impacts on grain supply in West China. Land Use Policy 2005, 22, 301–312. [Google Scholar] [CrossRef]
  18. Fischer, J.; Hartel, T.; Kuemmerle, T. Conservation policy in traditional farming landscapes. Conserv. Lett. 2012, 5, 167–175. [Google Scholar] [CrossRef]
  19. Raj Khanal, N.; Watanabe, T. Abandonment of Agricultural Land and Its Consequences. Mt. Res. Dev. 2006, 26, 32–40. [Google Scholar] [CrossRef]
  20. Kuemmerle, T.; Olofsson, P.; Chaskovskyy, O.; Baumann, M.; Ostapowicz, K.; Woodcock, C.E.; Houghton, R.A.; Hostert, P.; Keeton, W.S.; Radeloff, V.C. Post-Soviet farmland abandonment, forest recovery, and carbon sequestration in western Ukraine. Glob. Chang. Biol. 2011, 17, 1335–1349. [Google Scholar] [CrossRef]
  21. Xie, Z.; Game, E.T.; Hobbs, R.J.; Pannell, D.J.; Phinn, S.R.; McDonald-Madden, E. Conservation opportunities on uncontested lands. Nat. Sustain. 2019, 3, 9–15. [Google Scholar] [CrossRef]
  22. Wertebach, T.M.; Holzel, N.; Kampf, I.; Yurtaev, A.; Tupitsin, S.; Kiehl, K.; Kamp, J.; Kleinebecker, T. Soil carbon sequestration due to post-Soviet cropland abandonment: Estimates from a large-scale soil organic carbon field inventory. Glob. Chang. Biol. 2017, 23, 3729–3741. [Google Scholar] [CrossRef]
  23. Zheng, Q.; Ha, T.; Prishchepov, A.V.; Zeng, Y.; Yin, H.; Koh, L.P. The neglected role of abandoned cropland in supporting both food security and climate change mitigation. Nat. Commun. 2023, 14, 6083. [Google Scholar] [CrossRef] [PubMed]
  24. Du, Z.; Yang, J.; Ou, C.; Zhang, T. Agricultural Land Abandonment and Retirement Mapping in the Northern China Crop-Pasture Band Using Temporal Consistency Check and Trajectory-Based Change Detection Approach. IEEE Trans. Geosci. Remote Sens. 2022, 60, 1–12. [Google Scholar] [CrossRef]
  25. Kolecka, N. Height of Successional Vegetation Indicates Moment of Agricultural Land Abandonment. Remote Sens. 2018, 10, 1568. [Google Scholar] [CrossRef]
  26. Bell, S.M.; Raymond, S.J.; Yin, H.; Jiao, W.; Goll, D.S.; Ciais, P.; Olivetti, E.; Leshyk, V.O.; Terrer, C. Quantifying the recarbonization of post-agricultural landscapes. Nat. Commun. 2023, 14, 2139. [Google Scholar] [CrossRef]
  27. Li, L.; Pan, Y.; Zheng, R.; Liu, X. Understanding the spatiotemporal patterns of seasonal, annual, and consecutive farmland abandonment in China with time-series MODIS images during the period 2005–2019. Land Degrad. Dev. 2022, 33, 1608–1625. [Google Scholar] [CrossRef]
  28. Prishchepov, A.V.; Ponkina, E.V.; Sun, Z.; Bavorova, M.; Yekimovskaja, O.A. Revealing the intentions of farmers to recultivate abandoned farmland: A case study of the Buryat Republic in Russia. Land Use Policy 2021, 107, 105513. [Google Scholar] [CrossRef]
  29. Alix-Garcia, J.; Kuemmerle, T.; Radeloff, V.C. Prices, land tenure institutions, and geography: A matching analysis of farmland abandonment in post-socialist Eastern Europe. Land Econ. 2012, 88, 425–443. [Google Scholar] [CrossRef]
  30. Xu, D.; Deng, X.; Guo, S.; Liu, S. Labor migration and farmland abandonment in rural China: Empirical results and policy implications. J. Environ. Manag. 2019, 232, 738–750. [Google Scholar] [CrossRef]
  31. Goga, T.; Feranec, J.; Bucha, T.; Rusnák, M.; Sačkov, I.; Barka, I.; Kopecká, M.; Papčo, J.; Oťaheľ, J.; Szatmári, D. A review of the application of Remote Sens. data for abandoned agricultural land identification with focus on Central and Eastern Europe. Remote Sens. 2019, 11, 2759. [Google Scholar] [CrossRef]
  32. Oliphant, A.J.; Thenkabail, P.S.; Teluguntla, P.; Xiong, J.; Gumma, M.K.; Congalton, R.G.; Yadav, K. Mapping cropland extent of Southeast and Northeast Asia using multi-year time-series Landsat 30-m data using a random forest classifier on the Google Earth Engine Cloud. Int. J. Appl. Earth Observ. Geoinform. 2019, 81, 110–124. [Google Scholar] [CrossRef]
  33. Estacio, I.; Sianipar, C.P.; Onitsuka, K.; Basu, M.; Hoshino, S. A statistical model of land use/cover change integrating logistic and linear models: An application to agricultural abandonment. Int. J. Appl. Earth Observ. Geoinform. 2023, 120, 103339. [Google Scholar] [CrossRef]
  34. Huang, X.; Ziniti, B.; Torbick, N. Assessing conflict driven food security in Rakhine, Myanmar with multisource imagery. Land 2019, 8, 95. [Google Scholar] [CrossRef]
  35. Prishchepov, A.V.; Radeloff, V.C.; Dubinin, M.; Alcantara, C. The effect of Landsat ETM/ETM + image acquisition dates on the detection of agricultural land abandonment in Eastern Europe. Remote Sens. Environ. 2012, 126, 195–209. [Google Scholar] [CrossRef]
  36. Yin, H.; Brandão, A.; Buchner, J.; Helmers, D.; Iuliano, B.G.; Kimambo, N.E.; Lewińska, K.E.; Razenkova, E.; Rizayeva, A.; Rogova, N.; et al. Monitoring cropland abandonment with Landsat time series. Remote Sens. Environ. 2020, 246, 111873. [Google Scholar] [CrossRef]
  37. Xiao, G.; Zhu, X.; Hou, C.; Xia, X. Extraction and analysis of abandoned farmland: A case study of Qingyun and Wudi counties in Shandong Province. J. Geogr. Sci. 2019, 29, 581–597. [Google Scholar] [CrossRef]
  38. Alcantara, C.; Kuemmerle, T.; Prishchepov, A.V.; Radeloff, V.C. Mapping abandoned agriculture with multi-temporal MODIS satellite data. Remote Sens. Environ. 2012, 124, 334–347. [Google Scholar] [CrossRef]
  39. Cao, R.; Chen, Y.; Chen, J.; Zhu, X.; Shen, M. Thick cloud removal in Landsat images based on autoregression of Landsat time-series data. Remote Sens. Environ. 2020, 249, 112001. [Google Scholar] [CrossRef]
  40. Pointereau, P.; Coulon, F.; Girard, P.; Lambotte, M.; Rio, A.D. Analysis of Farmland Abandonment and the Extent and Location of Agricultural Areas that are Actually Abandoned or are in Risk to be Abandoned; Dictus Publishing: Riga, Latvia, 2008. [Google Scholar]
  41. FAO. Available online: http://www.fao.org/ag/agn/nutrition/Indicatorsfiles/Agriculture.pdf (accessed on 10 November 2022).
  42. Löw, F.; Fliemann, E.; Abdullaev, I.; Conrad, C.; Lamers, J.P.A. Mapping abandoned agricultural land in Kyzyl-Orda, Kazakhstan using satellite Remote Sensing. Appl. Geogr. 2015, 62, 377–390. [Google Scholar] [CrossRef]
  43. Löw, F.; Prishchepov, A.; Waldner, F.; Dubovyk, O.; Akramkhanov, A.; Biradar, C.; Lamers, J. Mapping Cropland Abandonment in the Aral Sea Basin with MODIS Time Series. Remote Sens. 2018, 10, 159. [Google Scholar] [CrossRef]
  44. Fensholt, R.; Horion, S.; Tagesson, T.; Ehammer, A.; Grogan, K.; Tian, F.; Huber, S.; Verbesselt, J.; Prince, S.D.; Tucker, C.J. Assessment of vegetation trends in drylands from time series of earth observation data. In Remote Sensing Time Series. Remote Sensing and Digital Image Processing; Springer: Cham, Switzerland, 2015; pp. 159–182. [Google Scholar] [CrossRef]
  45. Han, Z.; Song, W. Spatiotemporal variations in cropland abandonment in the Guizhou–Guangxi karst mountain area, China. J. Clean. Prod. 2019, 238, 117888. [Google Scholar] [CrossRef]
  46. Luo, K.; Moiwo, J.P. Rapid monitoring of abandoned farmland and information on regulation achievements of government based on Remote Sens. technology. Environ. Sci. Policy 2022, 132, 91–100. [Google Scholar] [CrossRef]
  47. Fritz, S.; McCallum, I.; Schill, C.; Perger, C.; See, L.; Schepaschenko, D.; van der Velde, M.; Kraxner, F.; Obersteiner, M. Geo-Wiki: An online platform for improving global land cover. Environ. Model. Softw. 2012, 31, 110–123. [Google Scholar] [CrossRef]
  48. Tong, X.; Brandt, M.; Hiernaux, P.; Herrmann, S.; Rasmussen, L.V.; Rasmussen, K.; Tian, F.; Tagesson, T.; Zhang, W.; Fensholt, R. The forgotten land use class: Mapping of fallow fields across the Sahel using Sentinel-2. Remote Sens. Environ. 2020, 239, 111598. [Google Scholar] [CrossRef]
  49. Li, C.; Xian, G.; Zhou, Q.; Pengra, B.W. A novel automatic phenology learning (APL) method of training sample selection using multiple datasets for time-series land cover mapping. Remote Sens. Environ. 2021, 266, 112670. [Google Scholar] [CrossRef]
  50. Yan, H.; Liu, F.; Qin, Y.; Doughty, R.; Xiao, X. Tracking the spatio-temporal change of cropping intensity in China during 2000–2015. Environ. Res. Lett. 2019, 14, 035008. [Google Scholar] [CrossRef]
  51. Zhang, X.; Zhao, C.; Dong, J.; Ge, Q. Spatio-temporal pattern of cropland abandonment in China from 1992 to 2017: A Meta-analysis. Acta Geogr. Sin. 2019, 74, 411–420, (In Chinese with English abstract). [Google Scholar] [CrossRef]
  52. Chen, W.; Zhao, H.; Li, J.; Zhu, L.; Wang, Z.; Zeng, J. Land use transitions and the associated impacts on ecosystem services in the Middle Reaches of the Yangtze River Economic Belt in China based on the geo-informatic Tupu method. Sci. Total Environ. 2020, 701, 134690. [Google Scholar] [CrossRef]
  53. Li, B.; Chen, D.; Wu, S.; Zhou, S.; Wang, T.; Chen, H. Spatio-temporal assessment of urbanization impacts on ecosystem services: Case study of Nanjing City, China. Ecol. Indic. 2016, 71, 416–427. [Google Scholar] [CrossRef]
  54. Chen, H.; Tan, Y.; Xiao, W.; He, T.; Xu, S.; Meng, F.; Li, X.; Xiong, W. Assessment of continuity and efficiency of complemented cropland use in China for the past 20 years: A perspective of cropland abandonment. J. Clean. Prod. 2023, 388, 135987. [Google Scholar] [CrossRef]
  55. Schulte, L.A.; Dale, B.E.; Bozzetto, S.; Liebman, M.; Souza, G.M.; Haddad, N.; Richard, T.L.; Basso, B.; Brown, R.C.; Hilbert, J.A. Meeting global challenges with regenerative agriculture producing food and energy. Nat. Sustain. 2022, 5, 384–388. [Google Scholar] [CrossRef]
  56. Liang, X.; Jin, X.; Han, B.; Sun, R.; Xu, W.; Li, H.; He, J.; Li, J. China’s food security situation and key questions in the new era: A perspective of farmland protection. J. Geogr. Sci. 2022, 32, 1001–1019. [Google Scholar] [CrossRef]
  57. Gu, F.; Zhang, Y.; Huang, M.; Yu, L.; Yan, H.; Guo, R.; Zhang, L.; Zhong, X.; Yan, C. Climate-induced increase in terrestrial carbon storage in the Yangtze River Economic Belt. Ecol. Evol. 2021, 11, 7211–7225. [Google Scholar] [CrossRef]
  58. Quan, Y.; Hutjes, R.W.; Biemans, H.; Zhang, F.; Chen, X.; Chen, X. Patterns and drivers of carbon stock change in ecological restoration regions: A case study of upper Yangtze River Basin, China. J. Environ. Manag. 2023, 348, 119376. [Google Scholar] [CrossRef]
  59. Liu, D.; Chen, N.; Zhang, X.; Wang, C.; Du, W. Annual large-scale urban land mapping based on Landsat time series in Google Earth Engine and OpenStreetMap data: A case study in the middle Yangtze River basin. ISPRS J. Photogramm. Remote Sens. 2020, 159, 337–351. [Google Scholar] [CrossRef]
  60. Li, C.; Yao, J.; Li, R.; Zhu, Y.; Yao, H.; Zhang, P.; Wei, D.; Zhao, S.; Li, Y.; Wu, Y. “3S” Technologies and Application for Dynamic Monitoring Soil and Water Loss in the Yangtze River Basin, China. Int. Arch. Photogramm. Remote Sens. Spat. Inf. Sci. 2020, 43, 1563–1567. [Google Scholar] [CrossRef]
  61. Jiang, L.; Wu, S.; Liu, Y. Change analysis on the spatio-temporal patterns of main crop planting in the middle yangtze plain. Remote Sens. 2022, 14, 1141. [Google Scholar] [CrossRef]
  62. Dong, S.; Xin, L.; Li, S.; Xie, H.; Zhao, Y.; Wang, X.; Li, X.; Song, H.; Lu, Y. Extent and spatial distribution of terrace abandonment in China. J. Geogr. Sci. 2023, 33, 1361–1376. [Google Scholar] [CrossRef]
  63. Hou, D.; Meng, F.; Prishchepov, A.V. How is urbanization shaping agricultural land-use? Unraveling the nexus between farmland abandonment and urbanization in China. Landsc. Urban Plan. 2021, 214, 104170. [Google Scholar] [CrossRef]
  64. Zhou, Y.; Li, X.; Liu, Y. Land use change and driving factors in rural China during the period 1995-2015. Land Use Policy 2020, 99, 105048. [Google Scholar] [CrossRef]
  65. GrĂDinaru, S.R.; IojĂ, C.I.; VÂNĂU, G.O.; Onose, D.A. Multi-Dimensionality of Land Transformations: From Definition to Perspectives on Land Abandonment. Carpathian J. Earth Environ. Sci. 2020, 15, 167–177. [Google Scholar] [CrossRef]
  66. He, H.; Ma, Y. Imbalanced Learning; The Institute of Electrical and Electronics Engineers, Inc.: Piscataway, NJ, USA, 2013. [Google Scholar]
  67. Powers, D. Evaluation, from precision, recall and F-measure to ROC, informedness, markedness and correlation. J. Mach. Learn. Tech. 2011, 2, 37–63. [Google Scholar] [CrossRef]
  68. Atzberger, C.; Eilers, P.H.C. Evaluating the effectiveness of smoothing algorithms in the absence of ground reference measurements. Int. J. Remote Sens. 2011, 32, 3689–3709. [Google Scholar] [CrossRef]
  69. Kong, D.; Zhang, Y.; Gu, X.; Wang, D. A robust method for reconstructing global MODIS EVI time series on the Google Earth Engine. ISPRS J. Photogramm. Remote Sens. 2019, 155, 13–24. [Google Scholar] [CrossRef]
  70. He, S.; Shao, H.; Xian, W.; Yin, Z.; You, M.; Zhong, J.; Qi, J. Monitoring cropland abandonment in hilly areas with Sentinel-1 and Sentinel-2 timeseries. Remote Sens. 2022, 14, 3806. [Google Scholar] [CrossRef]
  71. Mao, W.; Lu, D.; Hou, L.; Liu, X.; Yue, W. Comparison of Machine-Learning Methods for Urban Land-Use Mapping in Hangzhou City, China. Remote Sens. 2020, 12, 2817. [Google Scholar] [CrossRef]
  72. Zhao, Y.; Zhu, W.; Wei, P.; Fang, P.; Zhang, X.; Yan, N.; Liu, W.; Zhao, H.; Wu, Q. Classification of Zambian grasslands using random forest feature importance selection during the optimal phenological period. Ecol. Indic. 2022, 135, 108529. [Google Scholar] [CrossRef]
  73. Yang, Y.; Xiao, P.; Feng, X.; Li, H. Accuracy assessment of seven global land cover datasets over China. ISPRS J. Photogramm. Remote Sens. 2017, 125, 156–173. [Google Scholar] [CrossRef]
  74. Jin, Z.; Azzari, G.; You, C.; Di Tommaso, S.; Aston, S.; Burke, M.; Lobell, D.B. Smallholder maize area and yield mapping at national scales with Google Earth Engine. Remote Sens. Environ. 2019, 228, 115–128. [Google Scholar] [CrossRef]
  75. Tamiminia, H.; Salehi, B.; Mahdianpari, M.; Quackenbush, L.; Adeli, S.; Brisco, B. Google Earth Engine for geo-big data applications: A meta-analysis and systematic review. ISPRS J. Photogramm. Remote Sens. 2020, 164, 152–170. [Google Scholar] [CrossRef]
  76. Ghimire, B.; Rogan, J.; Galiano, V.R.; Panday, P.; Neeti, N. An evaluation of bagging, boosting, and random forests for land-cover classification in Cape Cod, Massachusetts, USA. GIScience Remote Sens. 2012, 49, 623–643. [Google Scholar] [CrossRef]
  77. Long, H.L.; Heilig, G.K.; Wang, J.; Li, X.B.; Luo, M.; Wu, X.Q.; Zhang, M. Land use and soil erosion in the upper reaches of the Yangtze River: Some socio-economic considerations on China’s Grain-for-Green Programme. Land Degrad. Dev. 2006, 17, 589–603. [Google Scholar] [CrossRef]
  78. Hong, C.; Prishchepov, A.V.; Jin, X.; Zhou, Y. Mapping cropland abandonment and distinguishing from intentional afforestation with Landsat time series. Int. J. Appl. Earth Observ. Geoinform. 2024, 127, 103693. [Google Scholar] [CrossRef]
  79. Yang, J.; Huang, X. The 30 m annual land cover dataset and its dynamics in China from 1990 to 2019. Earth System Sci. Data 2021, 13, 3907–3925. [Google Scholar] [CrossRef]
  80. Prishchepov, A.V.; Radeloff, V.C.; Baumann, M.; Kuemmerle, T.; Müller, D. Effects of institutional changes on land use: Agricultural land abandonment during the transition from state-command to market-driven economies in post-Soviet Eastern Europe. Environ. Res. Lett. 2012, 7, 024021. [Google Scholar] [CrossRef]
  81. Jiang, Y.; He, X.; Yin, X.; Chen, F. The pattern of abandoned cropland and its productivity potential in China: A four-years continuous study. Sci. Total Environ. 2023, 870, 161928. [Google Scholar] [CrossRef]
  82. Rodrigo-Comino, J.; Martínez-Hernández, C.; Iserloh, T.; Cerda, A. Contrasted impact of land abandonment on soil erosion in Mediterranean agriculture fields. Pedosphere 2018, 28, 617–631. [Google Scholar] [CrossRef]
  83. Ustaoglu, E.; Collier, M.J. Farmland abandonment in Europe: An overview of drivers, consequences, and assessment of the sustainability implications. Environ. Rev. 2018, 26, 396–416. [Google Scholar] [CrossRef]
  84. Fayet, C.M.; Reilly, K.H.; Van Ham, C.; Verburg, P.H. What is the future of abandoned agricultural lands? A systematic review of alternative trajectories in Europe. Land Use Policy 2022, 112, 105833. [Google Scholar] [CrossRef]
  85. Fayet, C.M.; Reilly, K.H.; Van Ham, C.; Verburg, P.H. The potential of European abandoned agricultural lands to contribute to the Green Deal objectives: Policy perspectives. Environ. Sci. Policy 2022, 133, 44–53. [Google Scholar] [CrossRef]
  86. Zhang, M.; Li, G.; He, T.; Zhai, G.; Guo, A.; Chen, H.; Wu, C. Reveal the severe spatial and temporal patterns of abandoned cropland in China over the past 30 years. Sci. Total Environ. 2023, 857, 159591. [Google Scholar] [CrossRef]
  87. Li, S.; Li, X.; Sun, L.; Cao, G.; Fischer, G.; Tramberend, S. An estimation of the extent of cropland abandonment in mountainous regions of China. Land Degrad. Dev. 2018, 29, 1327–1342. [Google Scholar] [CrossRef]
  88. Dara, A.; Baumann, M.; Kuemmerle, T.; Pflugmacher, D.; Rabe, A.; Griffiths, P.; Hölzel, N.; Kamp, J.; Freitag, M.; Hostert, P. Mapping the timing of cropland abandonment and recultivation in northern Kazakhstan using annual Landsat time series. Remote Sens. Environ. 2018, 213, 49–60. [Google Scholar] [CrossRef]
  89. Crawford, C.L.; Yin, H.; Radeloff, V.C.; Wilcove, D.S. Rural land abandonment is too ephemeral to provide major benefits for biodiversity and climate. Sci. Adv. 2022, 8, eabm8999. [Google Scholar] [CrossRef] [PubMed]
  90. Song, W. Mapping cropland abandonment in mountainous areas using an annual land-use trajectory approach. Sustainability 2019, 11, 5951. [Google Scholar] [CrossRef]
  91. Chazdon, R.L.; Broadbent, E.N.; Rozendaal, D.M.; Bongers, F.; Zambrano, A.M.A.; Aide, T.M.; Balvanera, P.; Becknell, J.M.; Boukili, V.; Brancalion, P.H. Carbon sequestration potential of second-growth forest regeneration in the Latin American tropics. Sci. Adv. 2016, 2, e1501639. [Google Scholar] [CrossRef] [PubMed]
  92. Schwartz, N.B.; Aide, T.M.; Graesser, J.; Grau, H.R.; Uriarte, M. Reversals of reforestation across Latin America limit climate mitigation potential of tropical forests. Front. For. Glob. Chang. 2020, 3, 85. [Google Scholar] [CrossRef]
  93. Nunes, S.; Oliveira, L.; Siqueira, J.; Morton, D.C.; Souza, C.M. Unmasking secondary vegetation dynamics in the Brazilian Amazon. Environ. Res. Lett. 2020, 15, 034057. [Google Scholar] [CrossRef]
  94. Smith, C.C.; Espírito-Santo, F.D.; Healey, J.R.; Young, P.J.; Lennox, G.D.; Ferreira, J.; Barlow, J. Secondary forests offset less than 10% of deforestation-mediated carbon emissions in the Brazilian Amazon. Glob. Chang. Biol. 2020, 26, 7006–7020. [Google Scholar] [CrossRef] [PubMed]
  95. Wang, X.; Shen, Y. The effect of China’s agricultural tax abolition on rural families’ incomes and production. China Econ. Rev. 2014, 29, 185–199. [Google Scholar] [CrossRef]
  96. Levers, C.; Schneider, M.; Prishchepov, A.V.; Estel, S.; Kuemmerle, T. Spatial variation in determinants of agricultural land abandonment in Europe. Sci. Total Environ. 2018, 644, 95–111. [Google Scholar] [CrossRef] [PubMed]
  97. Rigg, J.; Salamanca, A.; Phongsiri, M.; Sripun, M. More farmers, less farming? Understanding the truncated agrarian transition in Thailand. World Dev. 2018, 107, 327–337. [Google Scholar] [CrossRef]
  98. Long, Y.; Wu, W.; Hu, Q.; Chen, D.; Xiang, M.; Lu, M.; Yu, Q. Spatio-temporal changes in America’s cropland over 2000–2010. Sci. Agric. Sin. 2018, 51, 1134–1143, (In Chinese with English abstract). [Google Scholar] [CrossRef]
  99. Zhang, Z.; Zinda, J.A.; Li, W. Forest transitions in Chinese villages: Explaining community-level variation under the returning forest to farmland program. Land Use Policy 2017, 64, 245–257. [Google Scholar] [CrossRef]
  100. Long, Y.; Wu, W.; Wellens, J.; Colinet, G.; Meersmans, J. An In-Depth Assessment of the Drivers Changing China’s Crop Production Using an LMDI Decomposition Approach. Remote Sens. 2022, 14, 6399. [Google Scholar] [CrossRef]
  101. Cai, F.; Chan, K.W. The Global Economic Crisis and Unemployment in China. Eurasian Geogr. Econ. 2013, 50, 513–531. [Google Scholar] [CrossRef]
  102. Huang, J.; Zhi, H.; Huang, Z.; Rozelle, S.; Giles, J. The Impact of the Global Financial Crisis on Off-farm Employment and Earnings in Rural China. World Dev. 2011, 39, 797–807. [Google Scholar] [CrossRef]
  103. Li, T.; Wang, Y.; Liu, C.; Tu, S. Research on Identification of Multiple Cropping Index of Farmland and Regional Optimization Scheme in China Based on NDVI Data. Land 2021, 10, 861. [Google Scholar] [CrossRef]
  104. Liu, Z.; Liang, H.; Pu, D.; Xie, F.; Zhang, E.; Zhou, Q. How Does the Control of Grain Purchase Price Affect the Sustainability of the National Grain Industry? One Empirical Study from China. Sustainability 2020, 12, 2102. [Google Scholar] [CrossRef]
  105. Zhang, X.; Hu, M.; Guo, X.; Yang, H.; Zhang, Z.; Zhang, K. Effects of topographic factors on runoff and soil loss in Southwest China. Catena 2018, 160, 394–402. [Google Scholar] [CrossRef]
  106. Shi, T.; Li, X.; Xin, L.; Xu, X. Analysis of Farmland Abandonment at Parcel Level: A Case Study in the Mountainous Area of China. Sustainability 2016, 8, 988. [Google Scholar] [CrossRef]
  107. Subedi, Y.R.; Kristiansen, P.; Cacho, O. Drivers and consequences of agricultural land abandonment and its reutilisation pathways: A systematic review. Environ. Dev. 2022, 42, 100681. [Google Scholar] [CrossRef]
  108. Xu, J.; Wei, J.; Liu, W. Escalating human-wildlife conflict in the Wolong Nature Reserve, China: A dynamic and paradoxical process. Ecol. Evol. 2019, 9, 7273–7283. [Google Scholar] [CrossRef] [PubMed]
  109. Tian, D.; Xiang, Y.; Wang, B.; Li, M.; Liu, Y.; Wang, J.; Li, Z.; Niu, S. Cropland abandonment enhances soil inorganic nitrogen retention and carbon stock in China: A meta-analysis. Land Degrad. Dev. 2018, 29, 3898–3906. [Google Scholar] [CrossRef]
  110. Wang, C.; Li, L.; Yan, Y.; Cai, Y.; Xu, D.; Wang, X.; Chen, J.; Xin, X. Effects of cultivation and agricultural abandonment on soil carbon, nitrogen and phosphorus in a meadow steppe in eastern Inner Mongolia. Agricult. Ecosyst. Environ. 2021, 309, 107284. [Google Scholar] [CrossRef]
  111. Xu, H.; Wang, X.; Qu, Q.; Zhai, J.; Song, Y.; Qiao, L.; Liu, G.; Xue, S. Cropland abandonment altered grassland ecosystem carbon storage and allocation and soil carbon stability in the Loess Hilly Region, China. Land Degrad. Dev. 2020, 31, 1001–1013. [Google Scholar] [CrossRef]
  112. Corbelle-Rico, E.; Sánchez-Fernández, P.; López-Iglesias, E.; Lago-Peñas, S.; Da-Rocha, J.-M. Putting land to work: An evaluation of the economic effects of recultivating abandoned farmland. Land Use Policy 2022, 112, 105808. [Google Scholar] [CrossRef]
  113. Xin, L.; Li, X. China should not massively reclaim new farmland. Land Use Policy 2018, 72, 12–15. [Google Scholar] [CrossRef]
  114. Deng, X.; Lian, P.; Zeng, M.; Xu, D.; Qi, Y. Does farmland abandonment harm agricultural productivity in hilly and mountainous areas? evidence from China. J. Land Use Sci. 2021, 16, 433–449. [Google Scholar] [CrossRef]
  115. Coleman, E.A.; Schultz, B.; Ramprasad, V.; Fischer, H.; Rana, P.; Filippi, A.M.; Güneralp, B.; Ma, A.; Rodriguez Solorzano, C.; Guleria, V.; et al. Limited effects of tree planting on forest canopy cover and rural livelihoods in Northern India. Nat. Sustain. 2021, 4, 997–1004. [Google Scholar] [CrossRef]
  116. Bratic, G.; Oxoli, D.; Brovelli, M.A. Map of Land Cover Agreement: Ensambling Existing Datasets for Large-Scale Training Data Provision. Remote Sens. 2023, 15, 3774. [Google Scholar] [CrossRef]
  117. Wu, Z.; Thenkabail, P.S.; Mueller, R.; Zakzeski, A.; Melton, F.; Johnson, L.; Rosevelt, C.; Dwyer, J.; Jones, J.; Verdin, J.P. Seasonal cultivated and fallow cropland mapping using MODIS-based automated cropland classification algorithm. J. Appl. Remote Sens. 2014, 8, 083685. [Google Scholar] [CrossRef]
  118. Gong, P.; Wang, J.; Yu, L.; Zhao, Y.; Zhao, Y.; Liang, L.; Niu, Z.; Huang, X.; Fu, H.; Liu, S.; et al. Finer resolution observation and monitoring of global land cover: First mapping results with Landsat TM and ETM+ data. Int. J. Remote Sens. 2012, 34, 2607–2654. [Google Scholar] [CrossRef]
  119. Vicenteserrano, S.; Perezcabello, F.; Lasanta, T. Assessment of radiometric correction techniques in analyzing vegetation variability and change using time series of Landsat images. Remote Sens. Environ. 2008, 112, 3916–3934. [Google Scholar] [CrossRef]
  120. Heidarian Dehkordi, R.; Pelgrum, H.; Meersmans, J. High spatio-temporal monitoring of century-old biochar effects on evapotranspiration through the ETLook model: A case study with UAV and satellite image fusion based on additive wavelet transform (AWT). GIScience Remote Sens. 2021, 59, 111–141. [Google Scholar] [CrossRef]
  121. Zhu, X.; Chen, J.; Gao, F.; Chen, X.; Masek, J.G. An enhanced spatial and temporal adaptive reflectance fusion model for complex heterogeneous regions. Remote Sens. Environ. 2010, 114, 2610–2623. [Google Scholar] [CrossRef]
  122. Kassam, A.; Friedrich, T.; Derpsch, R. Global spread of Conservation Agriculture. Int. J. Environ. Stud. 2018, 76, 29–51. [Google Scholar] [CrossRef]
  123. Zhang, H.; Zhang, J.; Song, J. Analysis of the threshold effect of agricultural industrial agglomeration and industrial structure upgrading on sustainable agricultural development in China. J. Clean. Prod. 2022, 341, 130818. [Google Scholar] [CrossRef]
  124. Munroe, D.K.; van Berkel, D.B.; Verburg, P.H.; Olson, J.L. Alternative trajectories of land abandonment: Causes, consequences and research challenges. Curr. Opin. Environ. Sustain. 2013, 5, 471–476. [Google Scholar] [CrossRef]
  125. Poorter, L.; Bongers, F.; Aide, T.M.; Almeyda Zambrano, A.M.; Balvanera, P.; Becknell, J.M.; Boukili, V.; Brancalion, P.H.; Broadbent, E.N.; Chazdon, R.L. Biomass resilience of Neotropical secondary forests. Nature 2016, 530, 211–214. [Google Scholar] [CrossRef] [PubMed]
  126. Prach, K.; Walker, L.R. Four opportunities for studies of ecological succession. Trends Ecol. Evol. 2011, 26, 119–123. [Google Scholar] [CrossRef] [PubMed]
Figure 1. Study region. (a) The location of the Yangtze River Basin in China. (b) The nine provinces and two municipalities included across the Yangtze River basin. (c) DEM distribution across the Yangtze River Basin.
Remotesensing 16 01052 g001
Figure 2. Detection of cropland abandonment and recultivation. The solid green line represents natural vegetation and the solid brown line represents cropland.
Remotesensing 16 01052 g002
Figure 3. Flowchart of the study. (a) Acquisition and reconstruction of MODIS-NDVI from 2000 to 2020. (b) Collection and Utilization of Sample Points for Annual Land Use Classification Using Random Forest Algorithm. (c) Mapping cropland abandonment and recultivation. (d) Spatiotemporal dynamics of cropland abandonment and its intensity. (e) Spatiotemporal dynamics of recultivation.
Remotesensing 16 01052 g003
Figure 4. Annual land use classification across the Yangtze River basin. Eight types of land use cover were considered, i.e., cropland, grassland, forest, shrubs, impervious surface, wetland, and water.
Remotesensing 16 01052 g004
Figure 5. The spatial pattern of cropland changes from 2000 to 2020 across the Yangtze River basin.
Remotesensing 16 01052 g005
Figure 6. Accuracy estimation of LCLU. Overall accuracy (OA) and kappa index reflecting the overall land cover classification accuracy. Bar charts correspond to 3-year group. Error bars indicate 95% confidence intervals.
Remotesensing 16 01052 g006
Figure 7. Accuracy estimation of classes (i.e., user’s accuracy, producer’s accuracy, and F1). F1 highlights the classification accuracy of each class. The bar charts correspond to the average value between 2000 and 2020, whereas the error bars indicate 95% confidence intervals.
Remotesensing 16 01052 g007
Figure 8. Province wise cropland area comparisons between the present study and CLCDcropland layer considering five points in time (a) 2000, (b) 2005, (c) 2010, (d) 2015, and (e) 2020.
Remotesensing 16 01052 g008
Figure 9. The spatial pattern of cropland abandonment and distribution across the Yangtze River basin. (a) The spatiotemporal pattern of cropland abandonment from 2002 to 2020. The red colors represent pixels that were abandoned earlier, while the blue colors are pixels that have been abandoned more recently. (b,d) Accumulated abandoned area (green bar) along longitudinal and latitudinal gradients (0.5°). The orange line represents the proportion of cropland abandonment area as compared to the total land area at the corresponding latitude/longitude. (c) Annual cropland abandonment area and RCAP in the period 2002–2020.
Remotesensing 16 01052 g009
Figure 10. The spatial pattern of frequency of cropland abandonment and distribution from 2002 to 2020 across the Yangtze River basin. (a) The spatial pattern of cropland abandonment frequency. Cropland remaining cropland (green) represents pixels that remain cropland continuously until 2020. The color-coded frequency scale represents low frequency in shades of yellow (1—light yellow and 2—dark yellow), medium frequency in shades of orange (3—light orange and 4—dark orange), and high frequency in shades of purple (5—light purple and 6—dark purple). (b) Partially enlarged view, legend as in (a). (c) Histogram of abandonment frequency.
Remotesensing 16 01052 g010
Figure 11. The spatial pattern of cropland abandonment duration (in years) across the Yangtze River basin. The color bar graph in the lower right corner represents the area of cropland abandonment with different abandonment durations.
Remotesensing 16 01052 g011
Figure 12. The proportion of abandoned cropland remaining abandoned. The temporal trend showing the proportion of abandoned cropland remaining abandoned over time. The horizontal dashed black line shows a proportion of 0.5, indicating the point where half of abandoned croplands have been recultivated.
Remotesensing 16 01052 g012
Figure 13. The spatiotemporal pattern of cropland recultivation from 2003 to 2020 across the Yangtze River basin. (a) The spatiotemporal pattern of recultivation from 2003 to 2020. (b,d) Accumulated recultivation area (green bar) along longitudinal and latitudinal gradients (0.5°). The orange line represents proportion of recultivation area as compared to the total land area. (c) Annual recultivation area (103 ha).
Remotesensing 16 01052 g013
Figure 14. Temporal distribution in (a) total cropland abandonment area (absolute values) and (b) RCAP based on terrain differences. X axes show different slope ranges (0−5°, 5−10°, 10−15°, 15−20°, and 20−25°), Y axes show different years covered by our study period. Slopes above 25° are not considered in order to excludes GGP’s impacts.
Remotesensing 16 01052 g014
Disclaimer/Publisher’s Note: The statements, opinions and data contained in all publications are solely those of the individual author(s) and contributor(s) and not of MDPI and/or the editor(s). MDPI and/or the editor(s) disclaim responsibility for any injury to people or property resulting from any ideas, methods, instructions or products referred to in the content.

