Article

Increasing Forest Cover and Connectivity Both Inside and Outside of Protected Areas in Southwestern Costa Rica

by
Hilary Brumberg
1,2,*,
Samuel Furey
3,
Marie G. Bouffard
3,4,5,
María José Mata Quirós
1,
Hikari Murayama
3,6,7,
Soroush Neyestani
3,8,9,
Emily Pauline
3,10,
Andrew Whitworth
1,11,12 and
Marguerite Madden
3
1
Osa Conservation, Puerto Jiménez, Puntarenas 60702, Costa Rica
2
Department of Environmental Studies, University of Colorado Boulder, Boulder, CO 80303, USA
3
NASA DEVELOP National Program, Center for Geospatial Research, Department of Geography, University of Georgia, Athens, GA 30602, USA
4
Bren School of Environmental Science & Management, University of California, Santa Barbara, CA 93106, USA
5
Spatial Analysis Laboratory (SAL), Rubenstein School of Environment & Natural Resources, University of Vermont, Burlington, VT 05405, USA
6
Energy and Resources Group, University of California, Berkeley, CA 92720, USA
7
Global Policy Lab, Goldman School of Public Policy, University of California, Berkeley, CA 94720, USA
8
School of Environmental, Civil, Agricultural, and Mechanical Engineering, University of Georgia, Athens, GA 30602, USA
9
Department of Environmental Sciences, University of California, Riverside, CA 92521, USA
10
S&P Global Sustainable1, Raleigh, NC 27601, USA
11
Institute of Biodiversity, Animal Health and Comparative Medicine, College of Medical, Veterinary and Life Sciences, University of Glasgow, Glasgow G12 8QQ, UK
12
Department of Biology, Center for Energy, Environment, and Sustainability, Wake Forest University, Winston-Salem, NC 27106, USA
*
Author to whom correspondence should be addressed.
Remote Sens. 2024, 16(6), 1088; https://doi.org/10.3390/rs16061088
Submission received: 6 February 2024 / Revised: 12 March 2024 / Accepted: 15 March 2024 / Published: 20 March 2024
(This article belongs to the Special Issue Women’s Special Issue Series: Remote Sensing 2023)

Abstract

:
While protected areas (PAs) are an important conservation strategy to protect vulnerable ecosystems and species, recent analyses question their effectiveness in curbing deforestation and maintaining landscape connectivity. The spatial arrangement of forests inside and outside of PAs may affect ecosystem functioning and wildlife movement. The Osa Peninsula—and Costa Rica in general—are unique conservation case studies due to their high biodiversity, extensive PA network, environmental policies, and payment for ecosystem services (PES) programs. This study explores the relationship between forest management initiatives—specifically PAs, the 1996 Forest Law, and PES—and forest cover and landscape metrics in the Osa Conservation Area (ACOSA). The Google Earth Engine API was used to process Surface Reflectance Tier 1 Landsat 5 Thematic Mapper and Landsat 8 Operational Land Imager data for 1987, 1998, and 2019, years with relatively cloud-free satellite imagery. Land use/land cover (LULC) maps were generated with the pixel-based random forest machine learning algorithm, and Normalized Difference Vegetation Index (NDVI), Enhanced Vegetation Index (EVI), and functional landscape metrics were calculated. The LULC maps are the first to track land use change, from 1987 to 2019 and the first to separately classify mature and secondary forest in the region, and have already proven useful for conservation efforts. The results suggest that forest cover, NDVI, EVI, and structural connectivity increased from 1987 to 2019 across the study area, both within and surrounding the PAs, suggesting minimal deforestation encroachment and local leakage. These changes may have contributed to the increasing vertebrate abundance observed in the region. PAs, especially national parks with stricter conservation regulations, displayed the highest forest cover and connectivity. Forest cover increased in properties receiving PES payments. Following the Forest Law’s 1996 deforestation ban, both forest conversion and reforestation rates decreased, suggesting the law curbed deforestation but did not drive reforestation across the region. Connectivity outside of PAs slightly declined following the adoption of the law, so the subsequent forest growth likely occurred in mostly previously unforested areas. Forest expansion alone does not ensure connectivity. We highlight the importance of developing policies, PES programs, and monitoring systems that emphasize conserving and restoring large, connected forest patches for biodiversity conservation and landscape resilience. Resumen: Aunque las áreas protegidas (APs) son una importante estrategia de conservación para proteger ecosistemas y especies vulnerables, algunos análisis recientes cuestionan su eficacia para frenar la deforestación y mantener la conectividad del paisaje. La distribución espacial de los bosques dentro y fuera de las AP puede afectar el funcionamiento de los ecosistemas y los movimientos de la fauna. La Península de Osa–y Costa Rica en general–constituyen casos de estudio únicos de conservación debido a su elevada biodiversidad, su extensa red de AP, sus políticas medioambientales y sus programas de Pago por Servicios Ambientales (PSA). Este estudio explora la relación entre APs, la Ley Forestal de 1996, PSA, cobertura y métricas del paisaje en el Área de Conservación Osa (ACOSA). Se utilizó la plataforma Google Earth Engine API para procesar datos de Reflectancia Superficial Tier 1 Landsat 5 Thematic Mapper y Landsat 8 Operational Land Imager para 1987, 1998 y 2019, años con imágenes satelitales relativamente libres de nubes. Se generaron mapas de uso del suelo con el algoritmo de aprendizaje automático basado en pixeles Random Forest, y se calcularon el índice de vegetación de diferencia normalizada (NDVI), el índice de vegetación mejorado (EVI) y las métricas de paisaje funcionales. Estos mapas, los primeros en clasificar por separado los bosques maduros y secundarios de la región, han demostrado su utilidad para los esfuerzos de conservación. Los resultados sugieren que la cobertura forestal, el NDVI, el EVI y la conectividad estructural aumentaron entre 1987 y 2019 en toda la región de estudio, tanto dentro de las AP como en sus alrededores, lo que sugiere una expansión mínima de la deforestación dentro y fuera de las AP. Estos cambios pueden haber contribuido al aumento de la abundancia de vertebrados observado en la región. Las AP, especialmente los parques nacionales con regulaciones de conservación más estrictas, mostraron la mayor cobertura forestal y conectividad. La cobertura forestal aumentó en aquellas propiedades que recibieron PSA. Tras la prohibición de la deforestación por la Ley Forestal de 1996, disminuyeron tanto las tasas de conversión forestal como las de reforestación, lo que sugiere que la ley frenó la deforestación, pero no impulsó la reforestación. La conectividad fuera de las AP disminuyó ligeramente tras la entrada en vigor de la ley, lo que sugiere que el crecimiento forestal posterior se produjo en zonas que antes no estaban forestadas. Por lo tanto, la expansión forestal por sí sola no garantiza la conectividad. Resaltamos la importancia de desarrollar políticas, programas PSA y sistemas de monitoreo que hagan hincapié en la conservación y restauración de grandes zonas forestales conectadas para apuntalar la conservación de la biodiversidad y la resiliencia del paisaje.

Graphical Abstract

1. Introduction

National parks and other protected areas (PAs) serve as a crucial conservation strategy, safeguarding vulnerable ecosystems and species from threats such as deforestation, overhunting, selective logging, invasive species, mining, and road establishment [1]. Globally, the expanse of protected land has approximately doubled since the 1992 Earth Summit in Rio de Janeiro, Brazil, now encompassing 14.7% of the Earth’s terrestrial surface [2]. While this figure approaches the 17% target set by the Aichi Convention on Biological Diversity for 2020, it falls significantly short of the more ambitious goal to conserve 30% of the planet’s land and oceans by 2030 [1,2,3].
Recent analyses raise doubts about the effectiveness of PAs to conserve forest cover and biodiversity [2,4,5]. One-third of protected land globally is under intense human pressure, and 70% of countries have over 50% of their protected land under ongoing intense human pressure [2]. A recent analysis encompassing more than 18,000 terrestrial protected areas globally indicates that many PAs are not effective in eliminating deforestation—forest habitat loss through conversion of forest to other land uses—and only reduce deforestation rates by an average of 41% [5]. Laurance et al. (2012) found that only half of the PAs analyzed have been effective in conserving biodiversity over the past 20–30 years [4]. Thus, an estimated half of tropical forest reserves have seen deforestation encroachment and decreases in taxonomic and functional diversity due to habitat disruption, hunting, and the exploitation of forest products [4].
A key approach to effectively conserving PAs is to protect ecosystems outside and around officially designated PAs to buffer human pressures from entering PAs and facilitate ecosystem connectivity in structure and function [6]. Tropical PAs have been shown to mirror their surrounding areas; environmental changes immediately outside of PAs, such as deforestation, overhunting, and selective logging, can have almost as large of an impact on the effectiveness of PAs to conserve biodiversity as activities within the PAs [4,7]. Moreover, PAs can lead to deforestation leakage by displacing degradative activities from protected land onto adjacent land, thus accelerating degradation in surrounding areas [7]. Forty-six percent of PAs experience deforestation leakage [7]. In addition to impacting the efficacy of PAs, conservation of land outside of PAs is important to facilitate larger intact ecosystems, ecosystem connectivity, larger viable biodiversity populations, and genetic exchange [4,8]. As such, a diverse array of initiatives has been implemented globally with the goal of conserving land outside of PAs, including biological corridors, forest conservation laws, agroforestry projects, and payment for ecosystem services (PES) schemes [9,10].
Although approximately 40% of the Earth’s terrestrial ecosystems are intact, just 9.7% of the terrestrial PA system can be considered to have structural connectivity [11]. Connectivity, the degree to which forested areas are linked, is important due to its role in supporting ecological processes, such as wildlife movement and dispersal, plant distribution, animal foraging and interaction, and genetic exchange, as well as boosting ecosystem resilience to climate change [8,12,13]. While many analyses focus on changes in forest cover, the spatial arrangement of forest cover and changes to the arrangement are not usually part of forest monitoring efforts [14,15].
It has been widely posited that increased forest cover leads to improved structural connectivity by offering continuous habitat and decreasing isolated forest patches [13,16,17]. However, emerging evidence suggests that this relationship may not be as linear, necessitating further examination [14,18,19,20]. The intricacies of the landscape matrix, including variations in the original landscape composition, human activities, geographic variables, and topography, may imply that an increase in forest cover does not necessarily enhance connectivity [14,20]. Landscape metrics derived from satellite images can be used to depict landscape patterns, patch dynamics, and linkages with ecosystem processes. Complicated landscape processes, such as relationships between forest cover and connectivity, deforestation encroachment, local leakage, and forest transitional processes, can be elucidated through geospatial analysis [21].
Costa Rica has been recognized globally as a leader in conservation and climate change mitigation [22,23]. While Costa Rica was once Central America’s fastest deforesting country, with just 24.4% forest cover in 1985, nearly 60% of the country is forest and almost 30% of the country’s land now comprises Pas [9,24,25]. Costa Rica’s 1996 Forest Law 7575 established a deforestation ban, with special protection of riparian forest buffers [10]. The law also created the pioneering PES program and the National Forestry Financing Fund (FONAFIFO) to implement it [22]. The Osa Peninsula, and the corresponding Osa Conservation Area (ACOSA) on the south Pacific coast of Costa Rica, is a biodiversity hotspot with high rates of endemism; home to two national parks, a forestry reserve, a national wetland, and a biological corridor connecting the PAs. The local economy is driven by ecotourism and agriculture, and there is a strong environmental ethic in the region [26,27]. However, the Osa Peninsula experienced deforestation and forest fragmentation driven by agricultural expansion and urbanization in the mid- to late 20th century [21,28]. This all makes the region an ideal case study to use remotely sensed time series data and landscape metrics to assess the relationship between policy, PAs, and land use/land cover (LULC).
This study addresses the question: What is the relationship between Costa Rican forest management policy—especially PAs, the 1996 Forest Law, and PES—and LULC and landscape dynamics in ACOSA? We address this question by analyzing LULC, remotely sensed vegetation indices, and forest landscape metrics in ACOSA in 1987, 1998, and 2019. These results of this study allow us to evaluate whether ACOSA experiences similar deforestation and local leakage as other tropical regions, to understand whether the Forest Law may have impacted forest cover in the region, and how forest landscape connectivity has changed in relation to changes in forest cover. We hypothesized that (a) forest cover and landscape connectivity were higher inside PAs than outside, (b) forest cover and landscape connectivity increased in both PAs and non-PAs across the study period, especially after the 1996 Forest Law was passed, and (c) areas receiving PES income increased in forest cover. This project establishes the first LULC maps of the ACOSA region between 1987—2019 and the first maps to separately classify mature and secondary forest in the region.

2. Materials and Methods
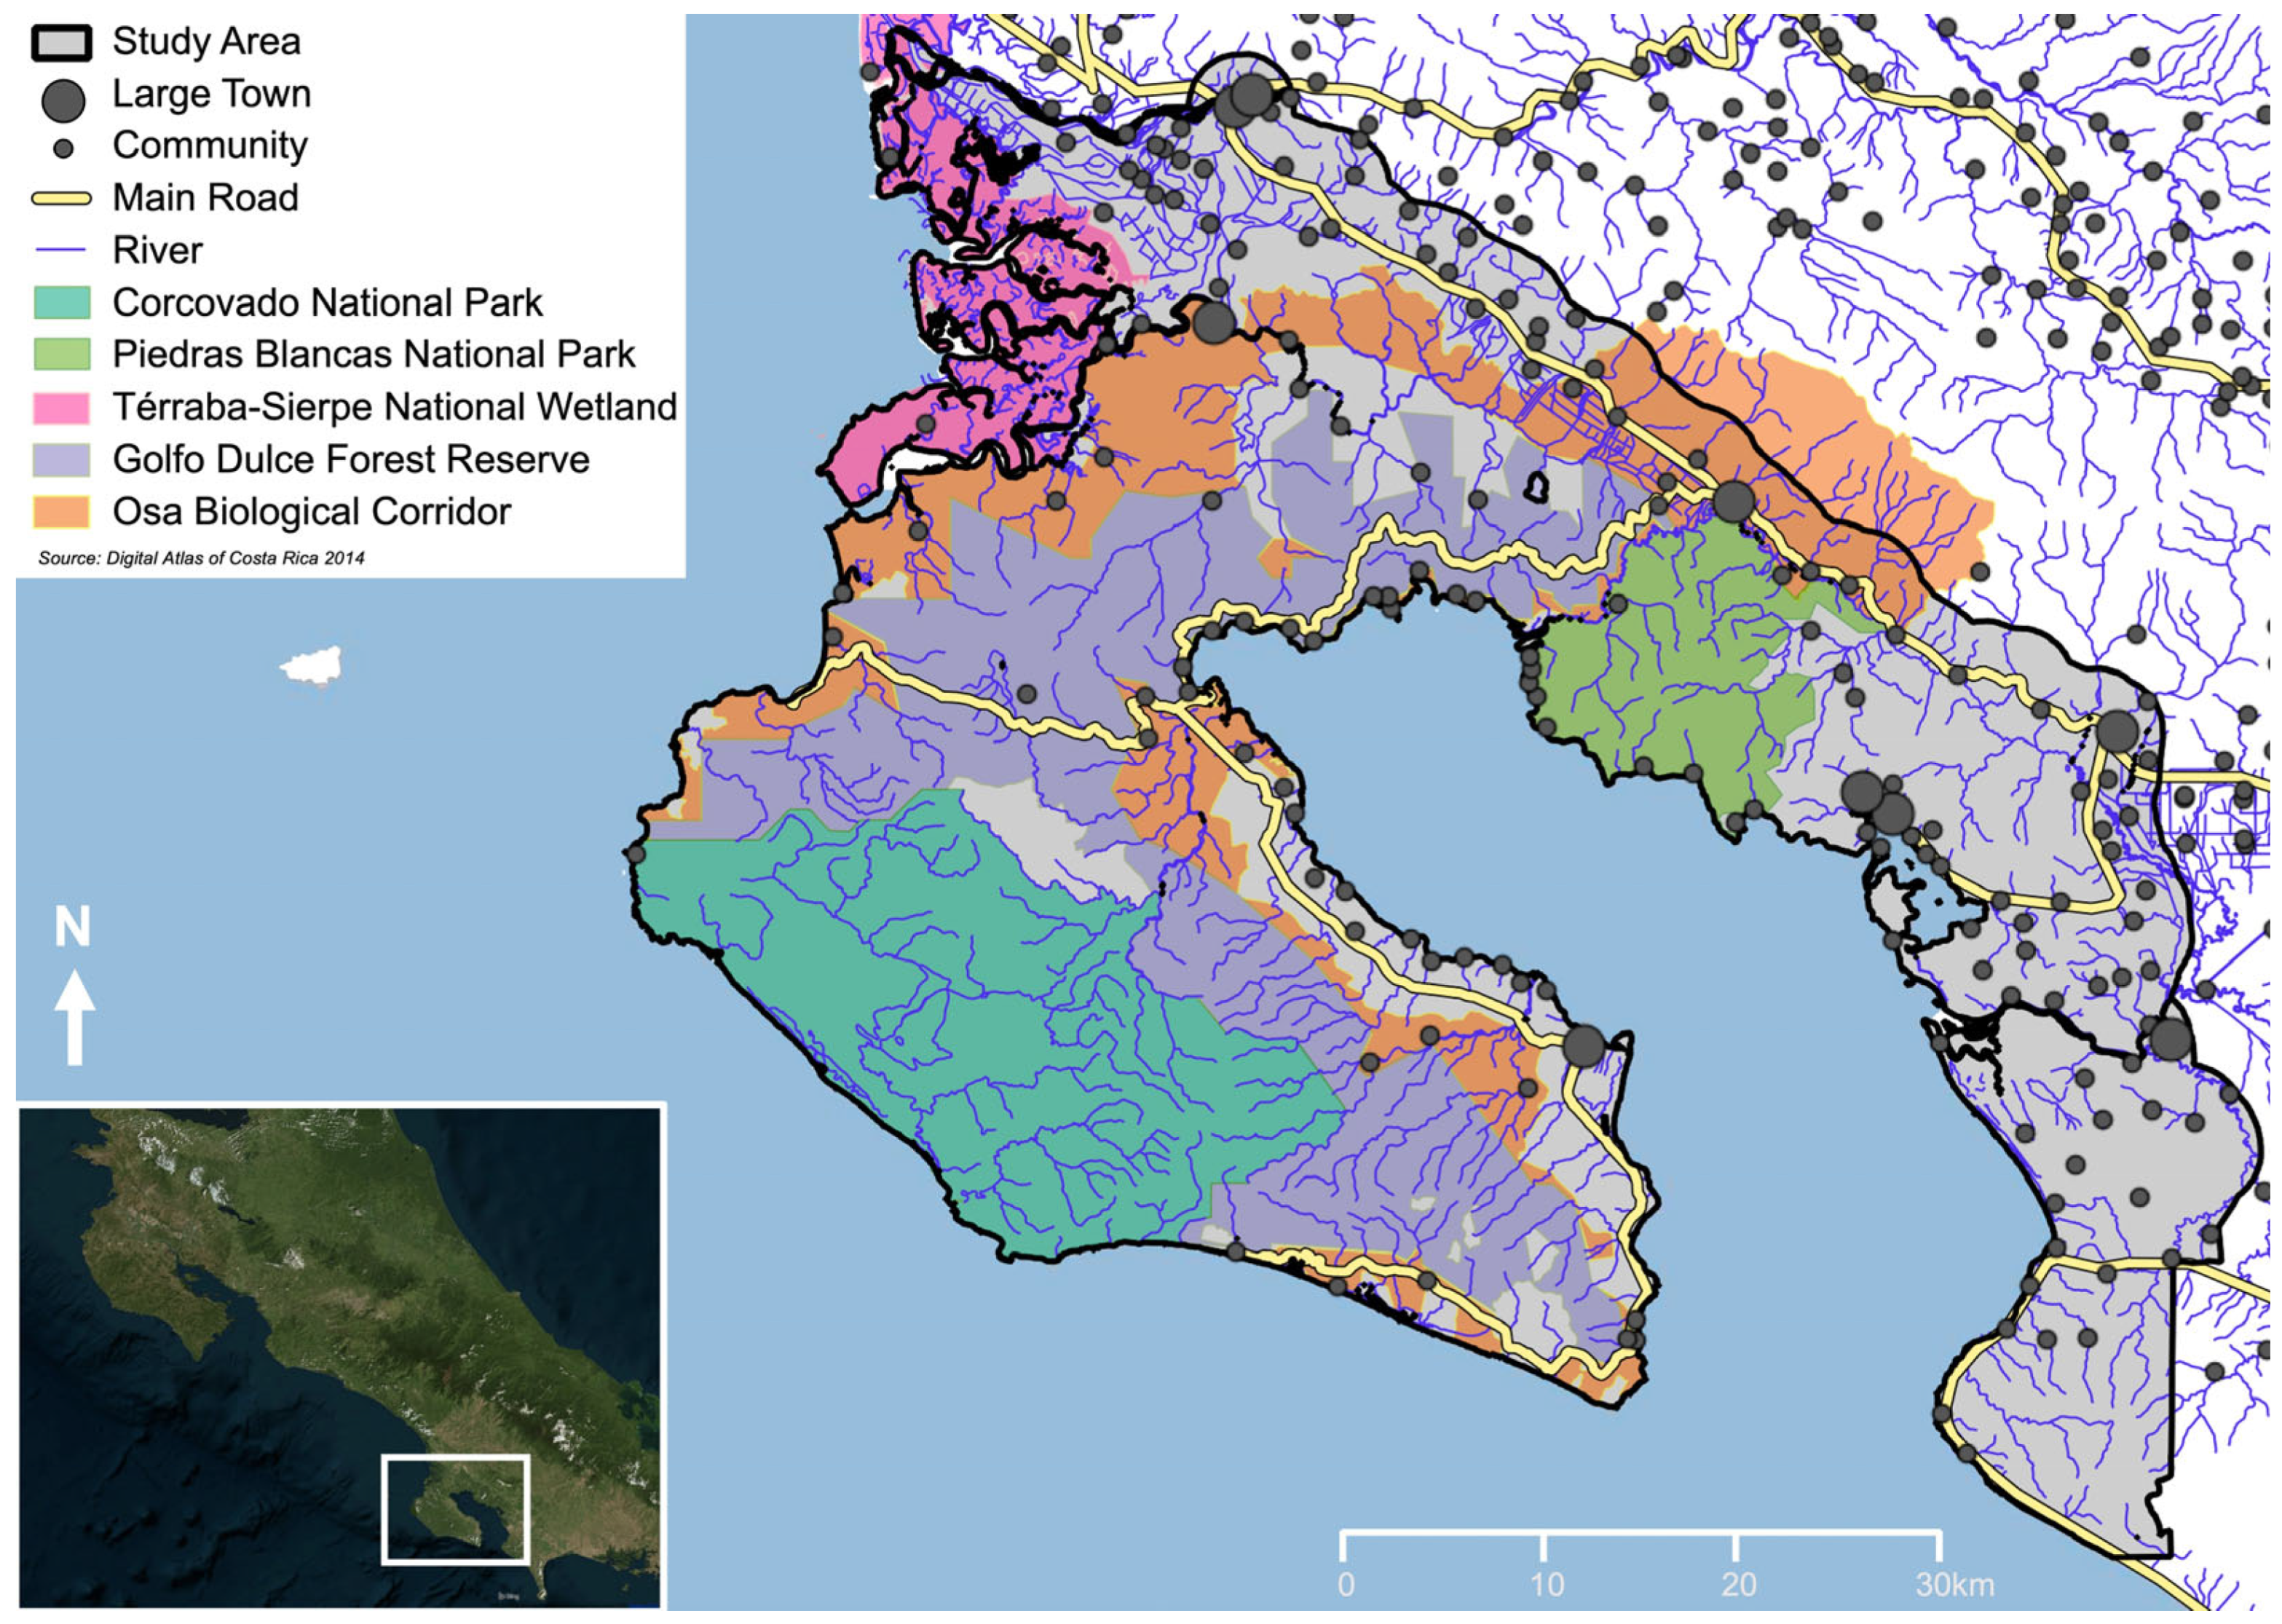
2.1. Study Area

The Osa Peninsula is known for its high biodiversity and contains the largest remaining tract of lowland wet forest in Pacific Mesoamerica [29,30]. The peninsula’s vegetation consists mostly of tropical wet forest and includes premontane wet and tropical moist forest types [31]. Its elevation ranges from sea level to 745 m above sea level, and the mean annual precipitation is 5500 mm, with the majority of the precipitation falling during the wet season (May–November) [32,33]. The Golfo Dulce separates the Osa Peninsula from mainland Costa Rica (Figure 1).
The Osa Conservation Area (ACOSA), one of 11 conservation areas in the National System of Conservation Areas, encompasses the Osa Peninsula and extends onto mainland southwestern Costa Rica. This study spans the majority of ACOSA (delimited by the Térraba River on the northwest and the Inter-American highway on the north with a 1.6 km buffer) in order to compare the unique Osa Peninsula with adjacent mainland Costa Rica and to include more PAs (Figure 1). The study area encompasses 273,900 ha, approximately 5.4% of the land area of Costa Rica. The PAs within the study region are Corcovado National Park (47,945 ha) on the Osa Peninsula; Piedras Blancas National Park (14,020 ha), across the Golfo Dulce on mainland Costa Rica; the Golfo Dulce Forestry Reserve (61,702 ha), extending from the peninsula onto mainland Costa Rica; and the Térraba Sierpe National Wetland (22,208 ha), just north of the peninsula (Figure 1). In Costa Rica, extractive activities are prohibited in NPs, with controlled recreational and educational use permitted; whereas forestry reserves and national wetlands allow sustainable resource management governed by specific technical regulations [34].
As the region is rural, the human population is largely dispersed. The main economic activities are cattle ranching, oil palm production, ecotourism, and artisanal fishing. Consequently, in the 20th century, the Osa Peninsula underwent deforestation for cattle pastures, urbanization, oil palm cultivation, and other agricultural land uses [21,28] (Figure 2). This degradation affects Osa’s habitat connectivity, endemic and endangered species, freshwater wildlife, and coastal marine ecosystems [35,36,37].

2.2. LULC Map Creation

Remotely sensed satellite technology allows for information to be frequently, consistently, and objectively collected without field effort. It can be extremely useful for large and remote locations, like the ACOSA. Satellite imagery can be assessed quickly on a landscape scale, providing a means for frequent data collection, without the need to visit remote sites, travel between plots, and spend hours collecting field data, while minimizing human error and health and safety risks.
Optical remote sensing methods are low-cost and highly effective in assessing landscape change over time. We used the Google Earth Engine (GEE) API to collect and process Surface Reflectance Tier 1 Landsat 5 Thematic Mapper (TM) and Landsat 8 Operational Land Imager (OLI) data for 1987, 1998, and 2019. These sensors are both common and authoritative, providing multi-spectral, atmospherically corrected, orthorectified, surface reflectance, and bottom of atmosphere-derived data. The Landsat 5 TM was used for 1987 and 1998, while Landsat 8 OLI was used for January—March 2019. Cloud cover can be a major limiting factor for optical sensors, especially in tropical wet forests like those on the Osa Peninsula [38]. Therefore, these years were selected due to the availability of relatively cloud-free satellite imagery. Bands 1, 2, 3, and 4 were collected from the Landsat 5 TM, covering visible blue (450–520 nm), visible green (520–600 nm), visible red (630–690 nm), and near-infrared (760–900 nm), which lies just outside the visible spectrum, and can be used to observe surface features that may be difficult or impossible to see in the visible spectrum alone. Bands 2,3,4, and 5 from the Landsat 8 OLI cover blue (450–510 nm), green (530–590 nm), red (640–670 nm), and near-infrared (850–880 nm). These bands’ unique reflectance properties make them very useful for assessing plant condition and distribution. Collectively, these bands were used to investigate historical trends in vegetation across the two satellite sensors.
To harmonize differences between the Landsat missions, we employed the algorithm derived by Roy et al. (2016) [39]. Since the study area is in a tropical region with frequent cloud cover [38], we used the quality assurance band (pixel_qa) to remove clouds and cloud shadows from the imagery. Data gaps resulting from the cloud masking process were filled in by taking the greenest value for each pixel in a year-long image collection.
To develop LULC maps of the study region, we ran a supervised, pixel-based random forest machine learning algorithm using an 80/20 split for training and validating ground truth data polygons. Training data were collected based on landscape trends in spatial patterns and distributions as seen by the naked eye and by spectral signatures. Remote sensing uses the interactions between electromagnetic radiation (light) and a surface to make inferences about a landscape. Surfaces or objects can either absorb, reflect, or transmit radiation. Surfaces uniquely reflect light based on several factors like size, color, or even chemical composition. These unique reflectance patterns are detectable by satellite sensors and transcribed into spectral signatures. A surface’s individual signature allows for the differentiation of one land class from another.
A random forest classification is intrinsically suited for multiple classes, where it uses multiple decision trees that are trained using small variations of the same training data. When classifying an image, the majority vote of these trained trees decides on the output class. The resulting output is a categorical LULC raster.
The LULC maps classified palm plantations, mangroves, water, grasslands and pastures, urban areas and exposed soils, mature forests, secondary forests, wetlands, and teak and gmelina plantations as the dominant LULC classes in the region (Figure 2). It was assumed that new mature forest could not be generated during the 32-year study period. If a pixel was not forest on the 1987 or 1998 map, but was forest in a subsequent map, it was classified as secondary forest.
Additionally, publicly available high-resolution imagery from ESRI’s living atlas platform (50 cm resolution) was used to identify smaller landscape features (e.g., teak and gmelina plantations). By combining these two types of imagery together, it was possible to generate an accurate LULC model that also incorporates smaller landscape features. Further national databases were integrated into the LULC model such as PAs and surface water networks. The LULC maps were created using ArcGIS Pro 2.7., ArcMap 10.8.1, and Google Earth Engine.

2.3. NDVI and EVI Map Creation

To evaluate vegetation distribution and health over time, we calculated a Normalized Difference Vegetation Index (NDVI) and Enhanced Vegetation Index (EVI) [40,41]. NDVI is a graphical indicator that assesses plant health and composition through reflectance patterns using the red and near infrared (NIR) bands. The EVI is determined using similar methods to the NDVI, but it uses additional bands to help discern differences within densely vegetated areas by correcting for atmospheric conditions and canopy background signal [41,42]. The greenest pixel function we used employs NDVI to capture plants at their greenest point, maximizing differences in LULC classes. After applying quality assurance and the greenest pixel function to each year of interest, bands 3 and 4 from Landsat 5 and bands 4 and 5 from Landsat 8 were used to calculate the NDVI (Equation (1)). Bands 1, 3, and 4 from Landsat 5 and bands 2, 4, and 5 from Landsat 8 were used to calculate the EVI (Equation (2)). Furthermore, we also compared these vegetation indices to the EVI2 (Equation (3)) [42]. NDVI and EVI data visualization were executed in Python 3.7.10.
NDVI = NIR     Red NIR +   Red
EVI = 2.5 × NIR     Red NIR + 6 ×   Red 7.5 × B l u e + 1
EVI 2 = 2.5 × NIR     Red NIR + 2.4 ×   Red + 1

2.4. LULC Map Validation

The 2019 LULC maps were validated by ground truth data collection and satellite imagery at 743 points with coverage across the study region. Through field expeditions across the study region, LULC classifications were collected at 364 points. Additionally, LULC classifications at 379 points were manually identified by experts in the region using Bing high-resolution aerial imagery in QGIS macOS-3.8.1-1. Points were selected randomly, ensuring coverage across the study area and that at least 50 validation points were collected for each LULC class. To calculate the producer’s and user’s accuracy, LULC was extracted from the 2019 LULC maps and compared with the validation data at each of the 743 points. To determine accuracy, a confusion matrix was set up to output a kappa coefficient, which measured the extent of agreement between ground-truthed data and machine learning-generated data (Equation (4)) [43].
k = P o P e 1 P e

2.5. LULC Data Analysis

The LULC data were analyzed over the domain by extracting the area covered by each LULC class for the three years analyzed using the r_report tool from GRASS GIS (7.8.0). We conducted this analysis separately over 14 regions in the study area. The Osa Peninsula was delineated from the tip to the narrowest part of the neck. PAs (Corcovado National Park, Golfo Dulce Forest Reserve, Piedras Blancas National Park, and Terraba Sierpe National Wetland) and farms receiving PES payments from FONAFIFO in contracts from 2011 were analyzed. Furthermore, the analysis regions included 15-m-wide buffers on either side of rivers (protected by the 1996 Costa Rican Forest Law), separated by whether the buffer was inside of a PA. Main roads were buffered 700 m, as the effects of roads can be seen up to at least 350 m into the forest interior [44]. LULC was extracted in 500 m buffers around large towns and small towns/communities. Large towns are main towns with defined major roads, and small towns/communities have irregularly distributed houses along roads with or without churches and schools. In addition to assessing LULC change in these areas, we analyzed the contribution of each LULC class to the change in other LULC classes. Following Algeet-Abarquero et al. (2015) [45], we plotted the data in stacked column charts to compare LULC change between two specific years.

2.6. Landscape Metrics Analysis

Landscape patterns are linked to ecological processes and these patterns can be characterized using landscape metrics quantifying a number of patch features such as number, size, shape, configuration, and distribution within landscapes. Landscape metrics quantify structural trends and changes, which can offer insights into habitat loss and fragmentation dynamics as well as impacts on habitat quality. Although some have argued that the patch–mosaic model of landscapes, defined as a mosaic of discrete patches, ignores inherent gradients in natural landscapes over broad scales [46,47,48], landscape metrics were deemed an appropriate method in this study because it aims to provide descriptive statistics of changes at regional scale. Ecological systems can be conceptualized as hierarchical mosaics of interacting patches that differ in characteristics and represent dynamic, functional units within a landscape. The patch-based spatial modeling approach to examining spatial patterns and their link to ecological processes in landscapes holds advantages over grid-based modeling due to the ability to consider dynamic and overlapping interactions between patches [49].
The many landscape metrics that can be used for analysis can be broken into five broad categories: number, area, and edge metrics; subdivision or core metrics; shape metrics; contrast metrics; and aggregation metrics [12,50,51]. Number, area, and edge metrics describe basic characteristics of patches, including the number and the size of patches in a landscape. The amount of edge habitat created by the configuration of forest patch boundaries is also an important characteristic, especially for animal species requiring both forest cover and open spaces for foraging. Core areas refer to the interior portion of a forest patch that is inside a set distance from the edge of the patch to account for edge effects. In this study, “core” is defined as the area inside 60 m of the forest edge, which is two Landsat pixels from the forest patch edge and allows pixels classified as forest to be identified as core forest pixels if they are surrounded on all sides by forest [52]. Shape metrics characterize the geometric complexity of patches, ranging from simple and compact to complex and irregular. The shape of forest patches greatly influences the amount of core area available to species requiring larger home territories or area to ensure diversity of species. Contrast metrics describe the degree of difference between adjacent patches. Aggregation metrics look at the level of cohesion in a landscape and connectivity of like patches, while subdivision metrics look at the interspersion of patch types. Aggregation metrics can be used to measure forest clumping and potential corridors between forest patches. The relative values of these metrics were compared over time and between areas.
In this study, landscape metrics were computed for forest patches to assess changes in forest areas and structural connectivity over time. We evaluated the impact of PAs and the 1996 Forest Law by comparing the relative values of metrics between PAs and non-PAs, as well as before and after the 1996 law. Patch-based land cover classes derived from satellite image classifications were input to FRAGSTATS v4.2.1, a freely available software developed by McGarigal and Marks (1995) [12]. FRAGSTATS required some data pre-processing of the classification LULC rasters using ArcGIS 10.8 to renumber NoData pixels to transform rasters from Geographic coordinates based on the WGS 1984 datum to the UTM Zone 17N ground coordinate system based on NAD 1983. The resulting outputs in TIFF format were input to Fragstats 4.2.1 for landscape metric calculations using an edge depth of 2 pixels, or 60 m. Patch, class, and landscape-level metrics were produced for forest areas for 1987, 1998, and 2019 in the csv file format.
In conjunction with FRAGSTATS, landscapemetrics by Hesselbarth et al. (2019) was explored and tested as an additional tool for analysis in RStudio 2022.07.1+554 and R version 4.1.3 (2022-03-10) [53]. This open-source R package is based on the raster package by Hijmans et al. (2019) and it includes FRAGSTATS-style metrics of Kupfer (2012) and McGarigal et al. (2012) [47,54,55]. The landscapemetrics package offers several advantages, including the ability to operate in multiple operating systems, open-source accessibility, and time-efficient calculations of a variety of useful metrics.

3. Results

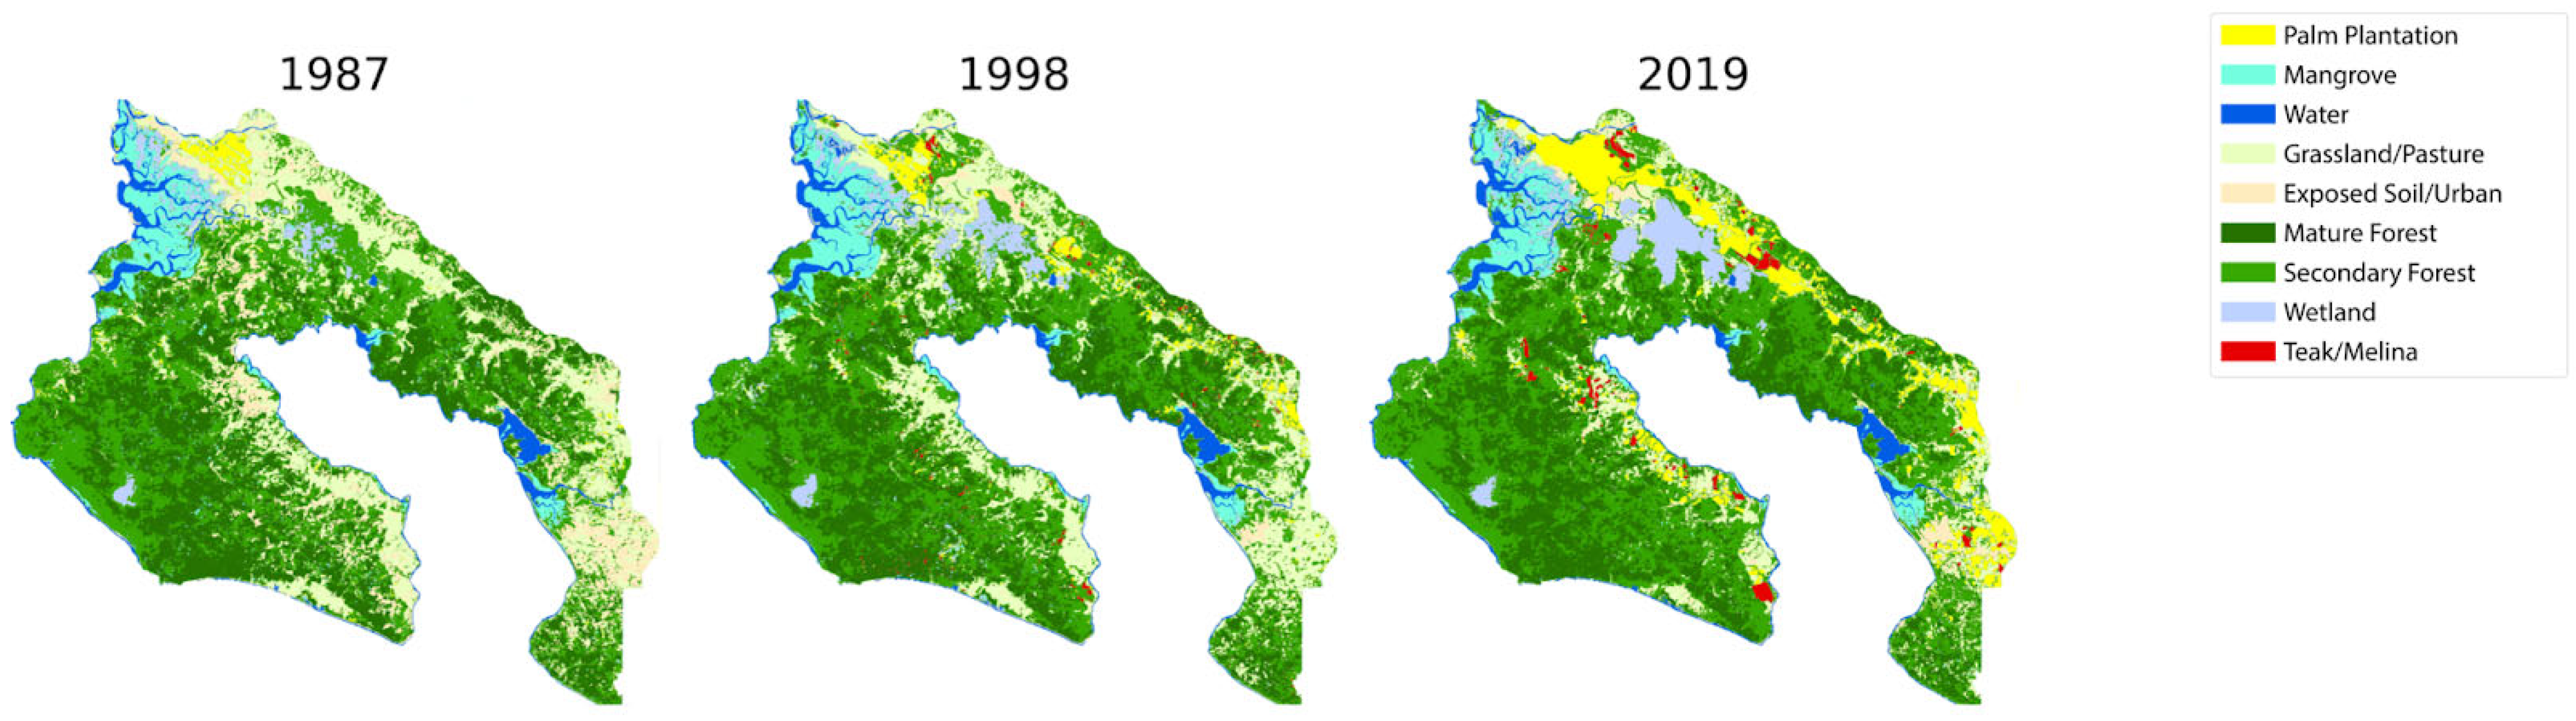
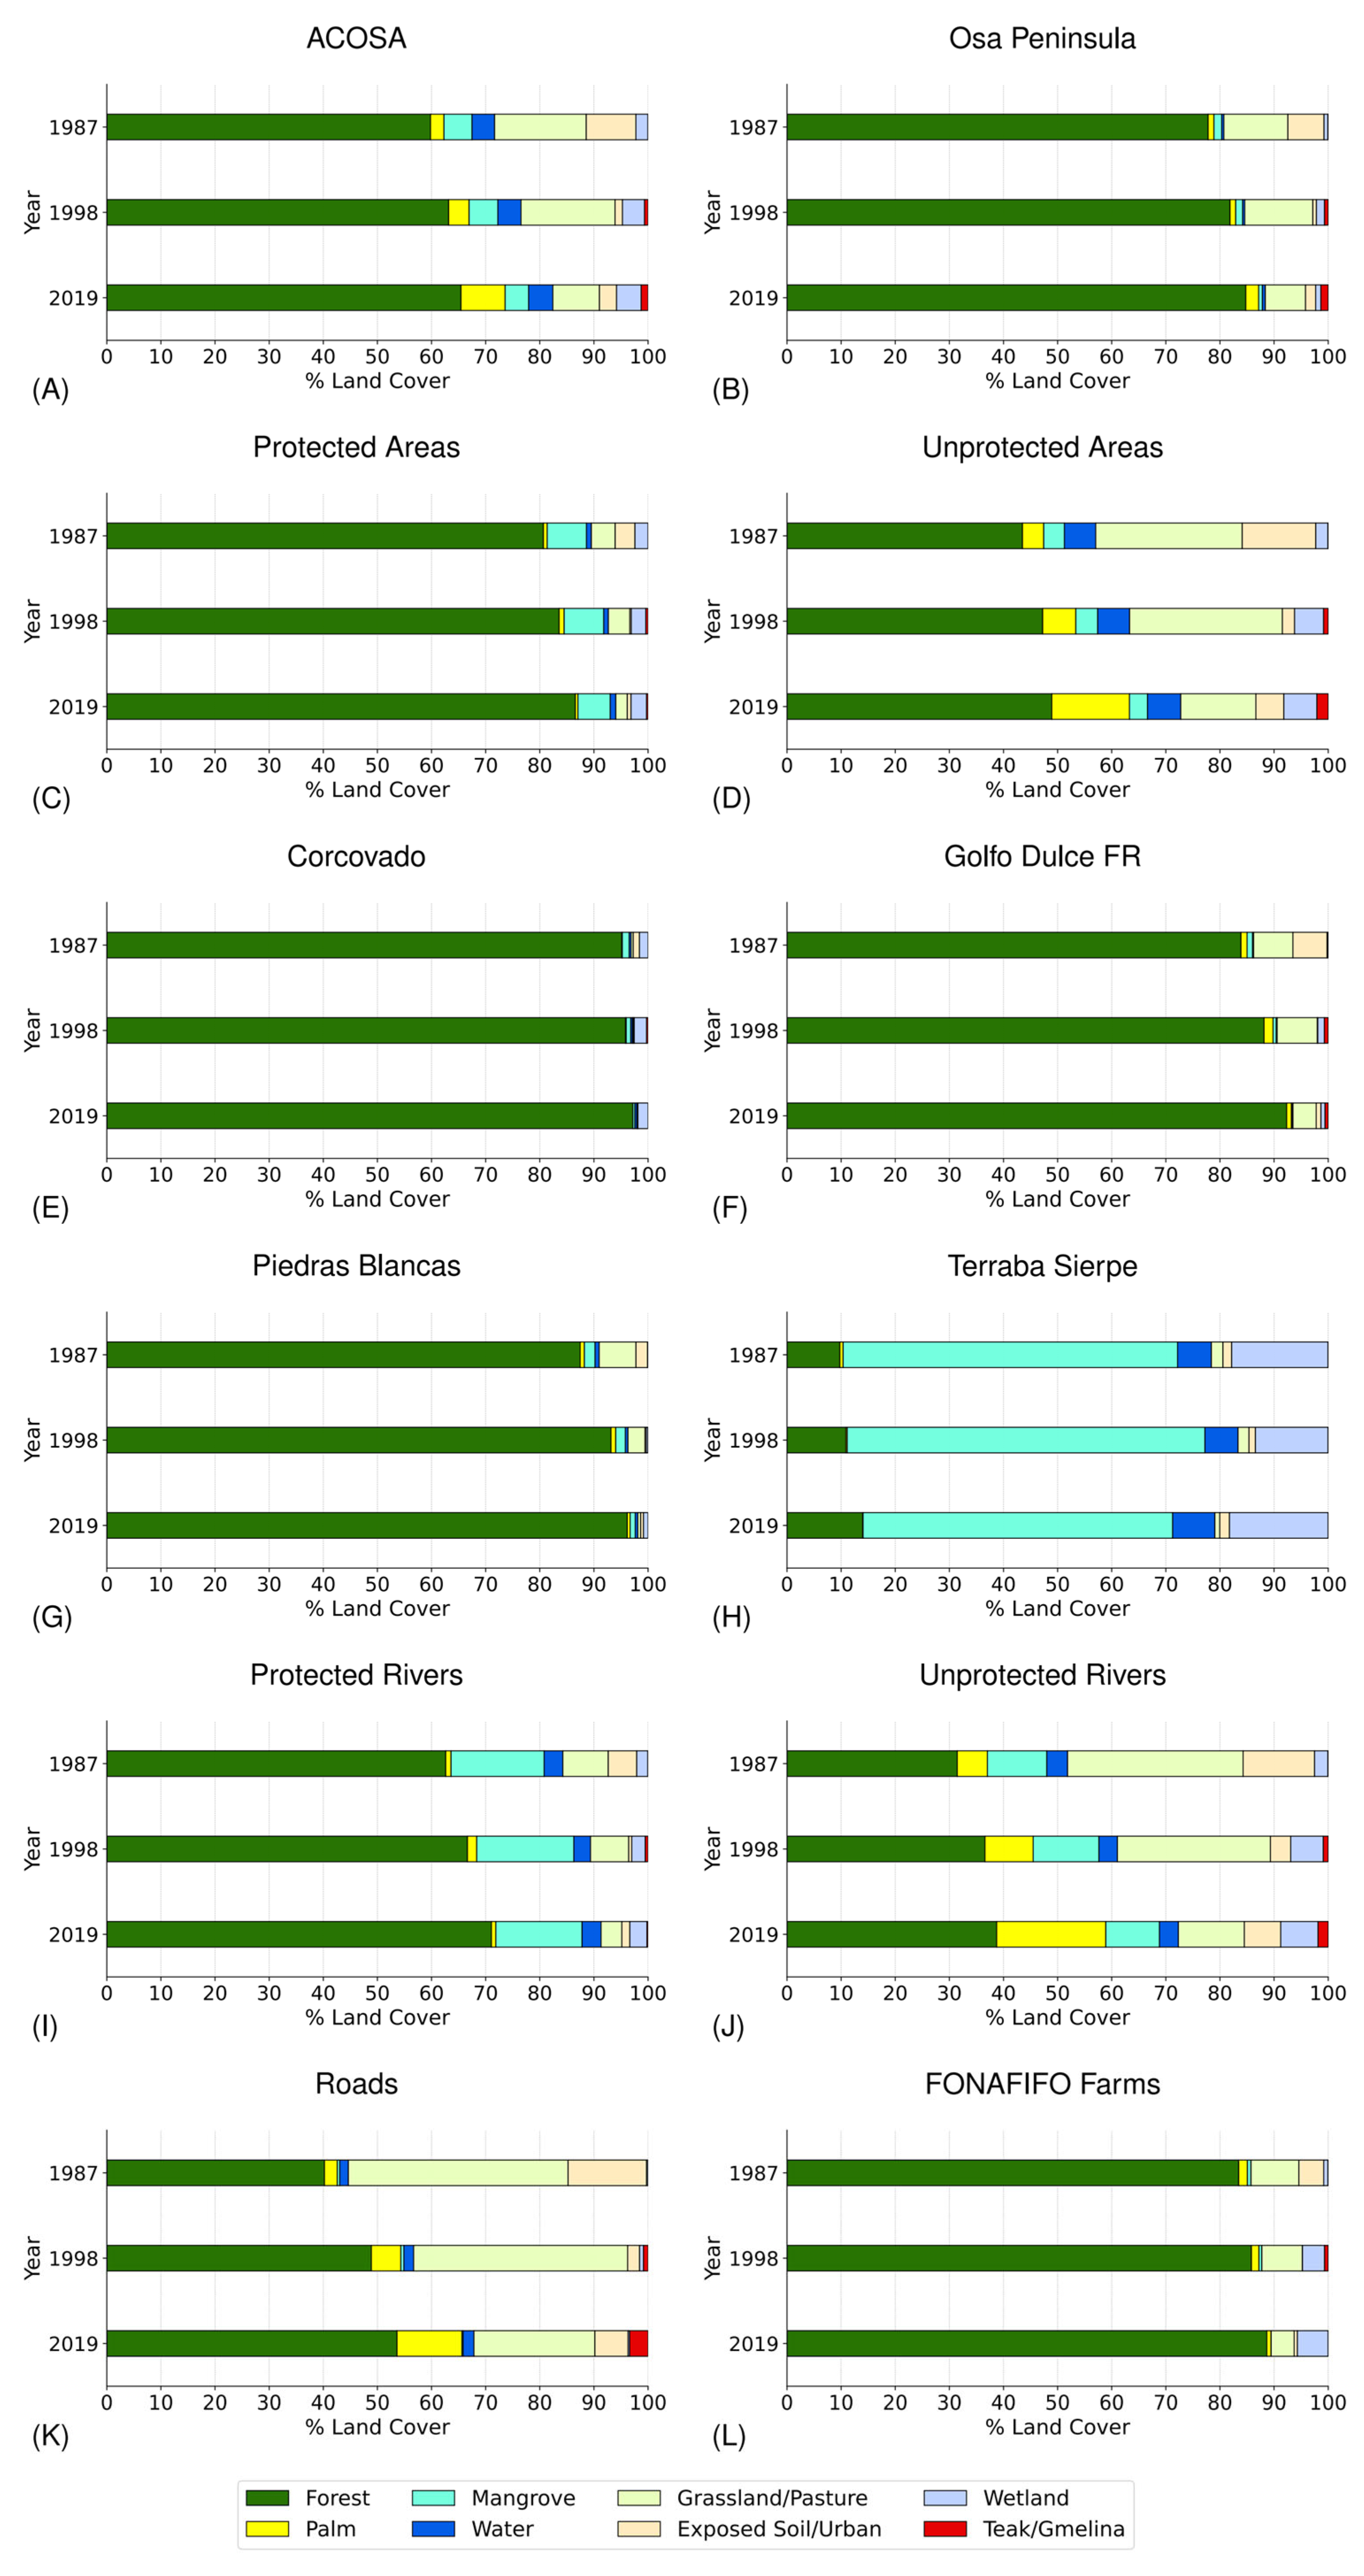
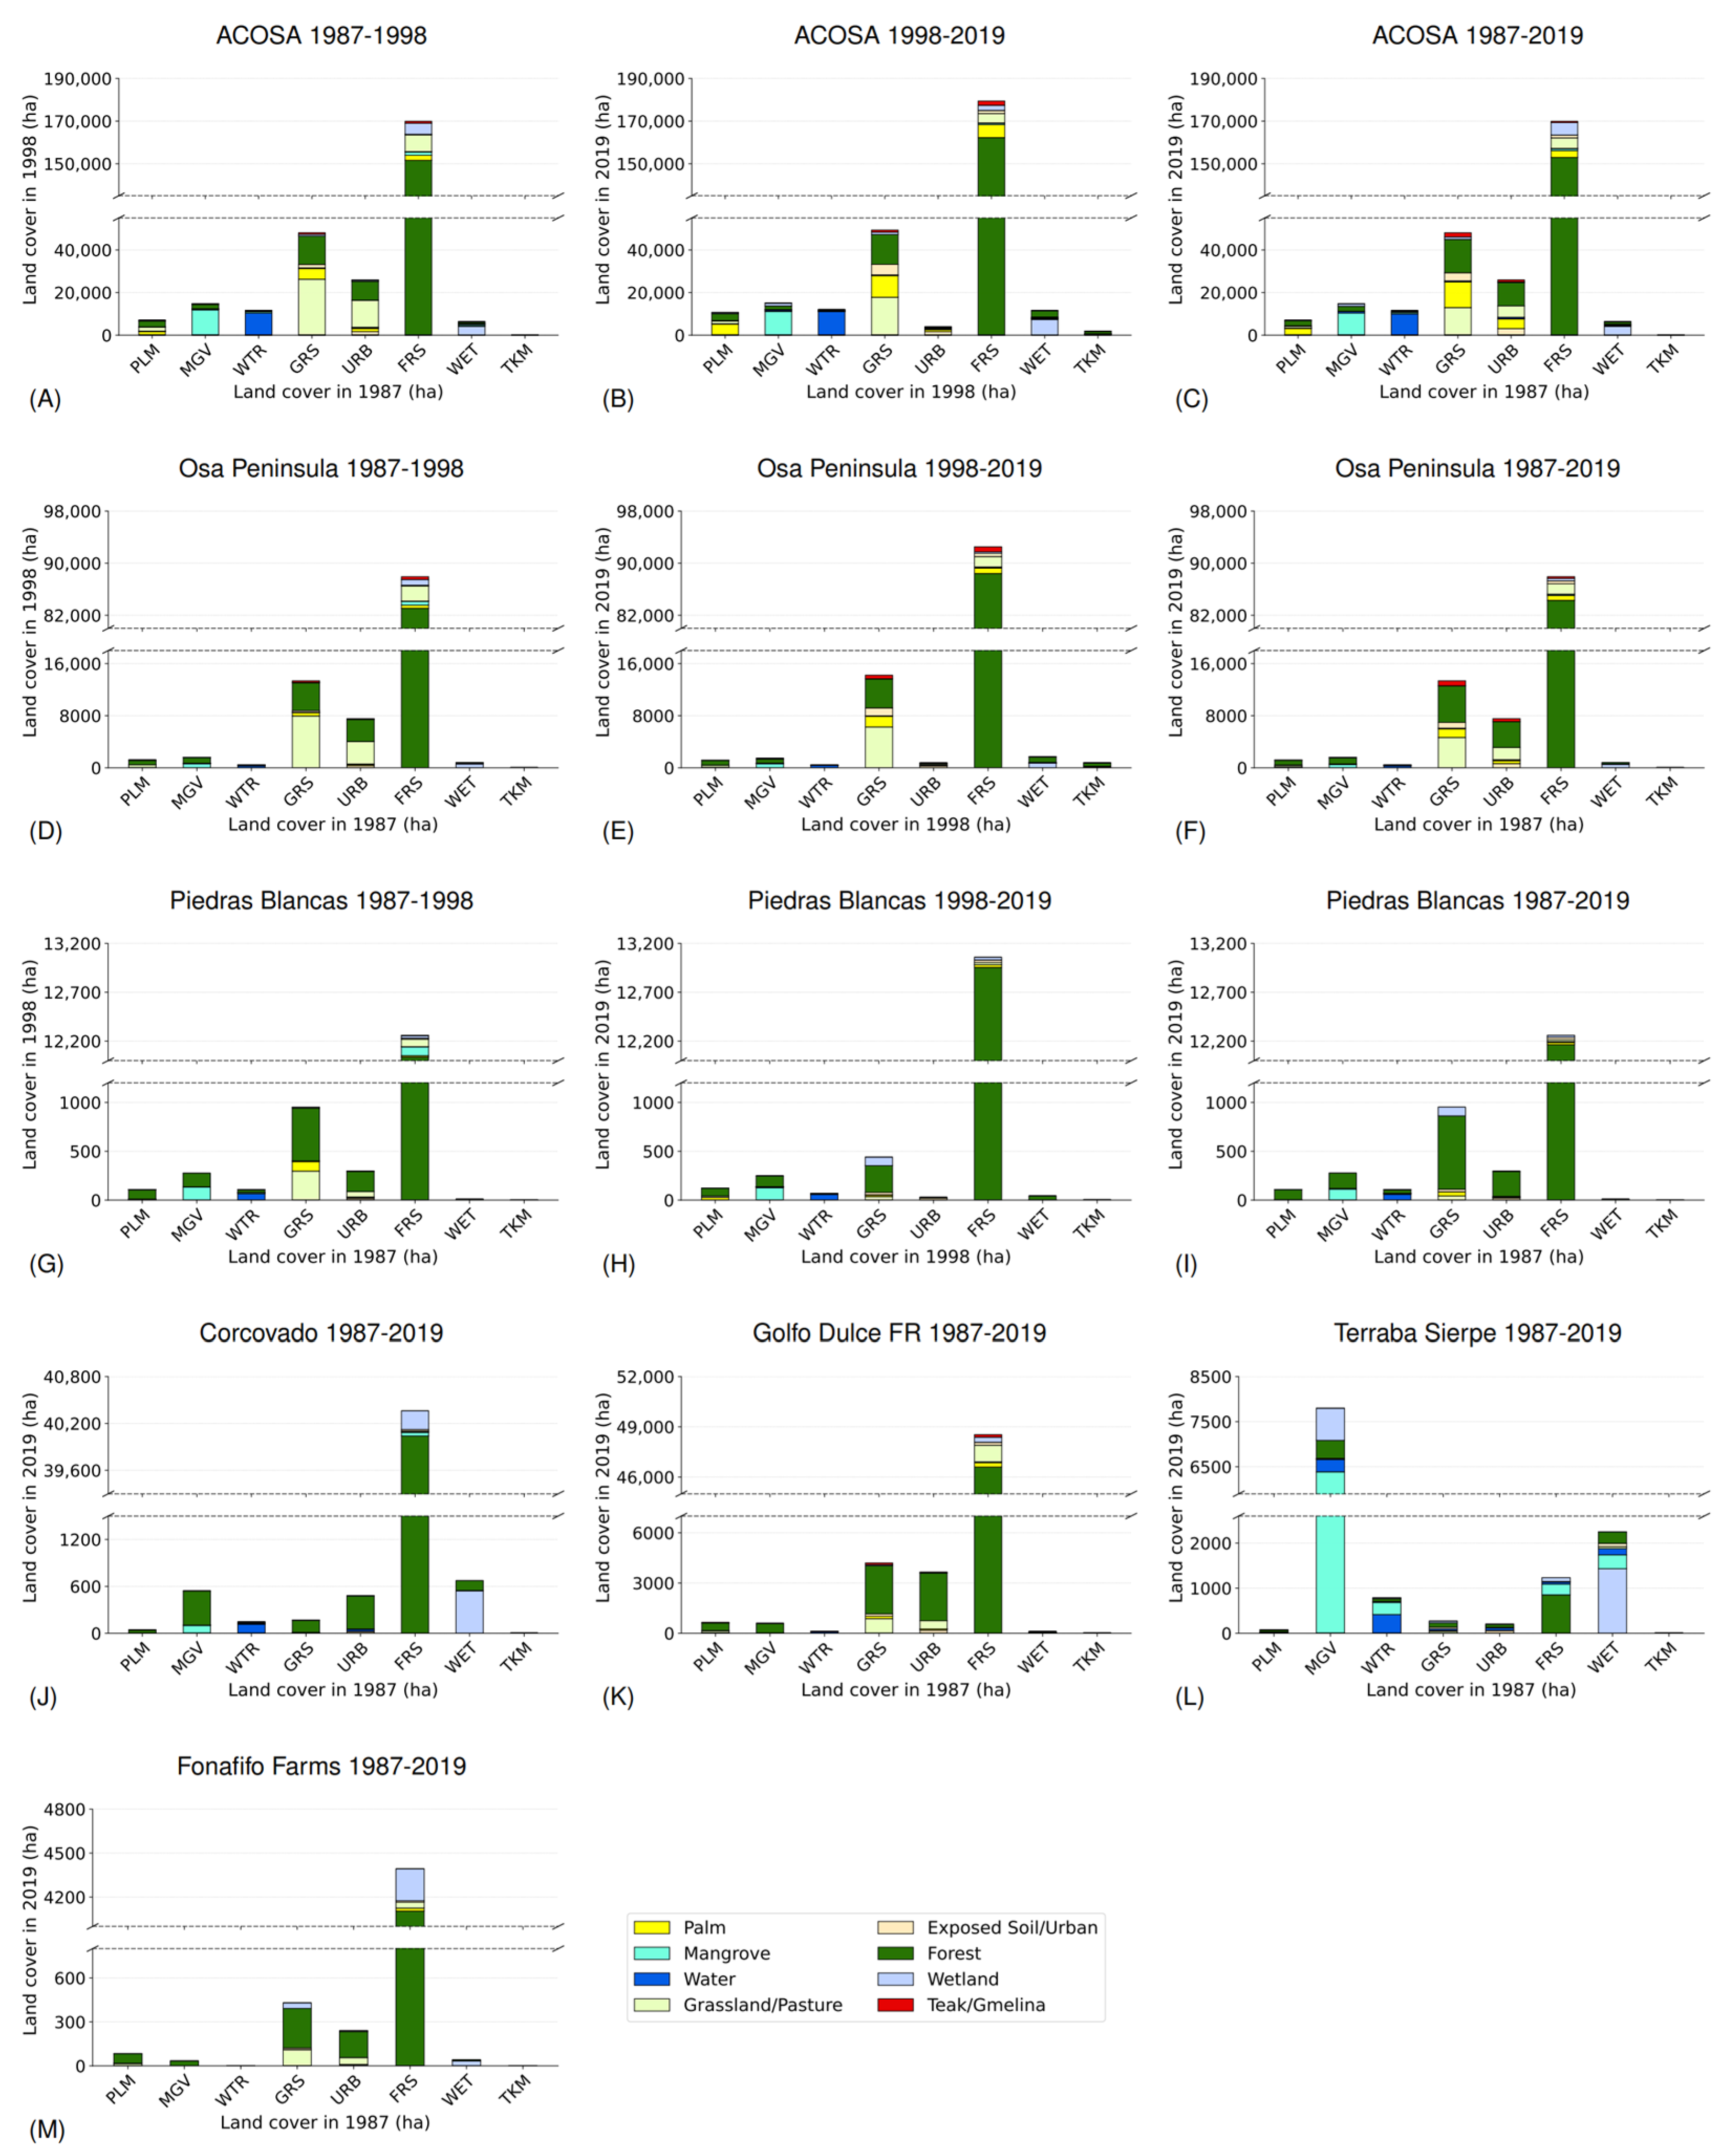
3.1. Overall LULC in the Study Area

Forest was the dominant LULC class in the overall study region and the Osa Peninsula in all time periods analyzed, and grassland is the second most frequent class (Figure 3, Table 1 and Table 2). The Osa Peninsula and the broader ACOSA region experienced increases in forest cover 1987–2019. ACOSA forest cover increased from 59.8% to 65.5% 1987–2019, a 9.4% increase in overall forest cover and a 23.6% increase in secondary forest cover (Table 1). Natural (mature forest, secondary forest, wetland, mangrove, and water) area increased 10.4% in the region. On the Osa Peninsula, forest cover increased from 77.8% in 1987 to 84.8% in 2019, a 9.0% increase in forest cover (Table 2). The Osa Peninsula experienced an 8.2% increase in natural area and a 25.2% increase in secondary forest cover 1987–2019. Only 25.47% of the forest in the ACOSA region and 38.51% of the forest in the Osa Peninsula remains mature forest, as of 2019 (Table 1 and Table 2).
The region experienced very little conversion of forest to other land uses, with greater forest conversion from 1987 to 1998 than from 1998 to 2019. From 1987 to 1998, forest conversion to anthropogenic land uses in the Osa Peninsula averaged 0.50% per year, while from 1998 to 2019, forest conversion averaged 0.21% per year. The majority of forest conversion in ACOSA occurred in the northern portion of the study area, especially along the Inter-American Highway (Figure 4). From 1987 to 1998, reforestation in the Osa Peninsula averaged 0.47% per year, while from 1998 to 2019, reforestation averaged 0.17% per year (Table 2). The ACOSA region overall saw slightly more forest conversion than the Osa Peninsula, with the dominant conversion to grassland and oil palm. Restored areas were scattered across the study region, especially outside of NPs (Figure 4).
In ACOSA, 73% of grassland was converted to other classes, especially to oil palm plantations and forests, with the majority of the grassland loss occurring between 1998 and 2019 (Figure 5A,B and Figure 6A–C). Most urban/exposed land (84%) was converted to palm plantations, grassland, forests, and teak/gmelina. More than one-third of the palm plantation area in 1987 was converted to forest by 2019 (37%). About 10% of the forested area was converted to other classes (e.g., grassland, wetland, and palm plantations); reported forest conversion to wetland could be due to misclassification. The Osa Peninsula experienced similar LULC transitions to ACOSA (Figure 6D–F), but a larger fraction (67%) of palm area was converted to forest on the Osa Peninsula, and less urban/exposed area was converted to palm plantations on the Osa Peninsula compared to ACOSA.

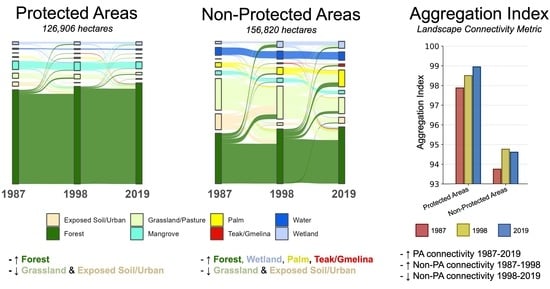
3.2. LULC Changes in PAs

PAs were more forested than non-PAs, with over 80% of PA area forested and less than 50% of non-PA area forested (Figure 5C,D). Forest cover increased in both PAs and non-PAs throughout the study period. In the non-PAs, palm plantations increased from 3.9% in 1987 to 14.3% in 2019, and teak/gmelina plantation area also increased from a negligible contribution in 1987 to 2.1% in 2019. Forest cover increased in each PA, with the largest increases in Piedras Blancas and the Golfo Dulce Forest Reserve (Figure 5E–H). In Piedras Blancas, the majority of the land that was covered by palm plantations, grassland, and urban/exposed in 1987 was converted to forest by 2019 (Figure 6I). More grassland, urban/exposed land, and palm plantations transitioned to forest during the 1987–1998 period (Figure 6G) than the 1998–2019 period (Figure 6H), and more forest transitioned to grassland during the 1987–1998 period than the 1998–2019 period. In both Corcovado (Figure 6J) and the Golfo Dulce Forest Reserve (Figure 6K), a large fraction of palm plantations, grassland, and urban/exposed land area transitioned to forest by 2019. On the other hand, some forest in the Golfo Dulce Forest Reserve was degraded to other classes (e.g., grassland, palm plantation, urban/expose, and teak/gmelina). In Terraba-Sierpe (Figure 6L), some regeneration of forest from palm plantation, grassland, and urban/exposed land was observed between 1987 and 2019.

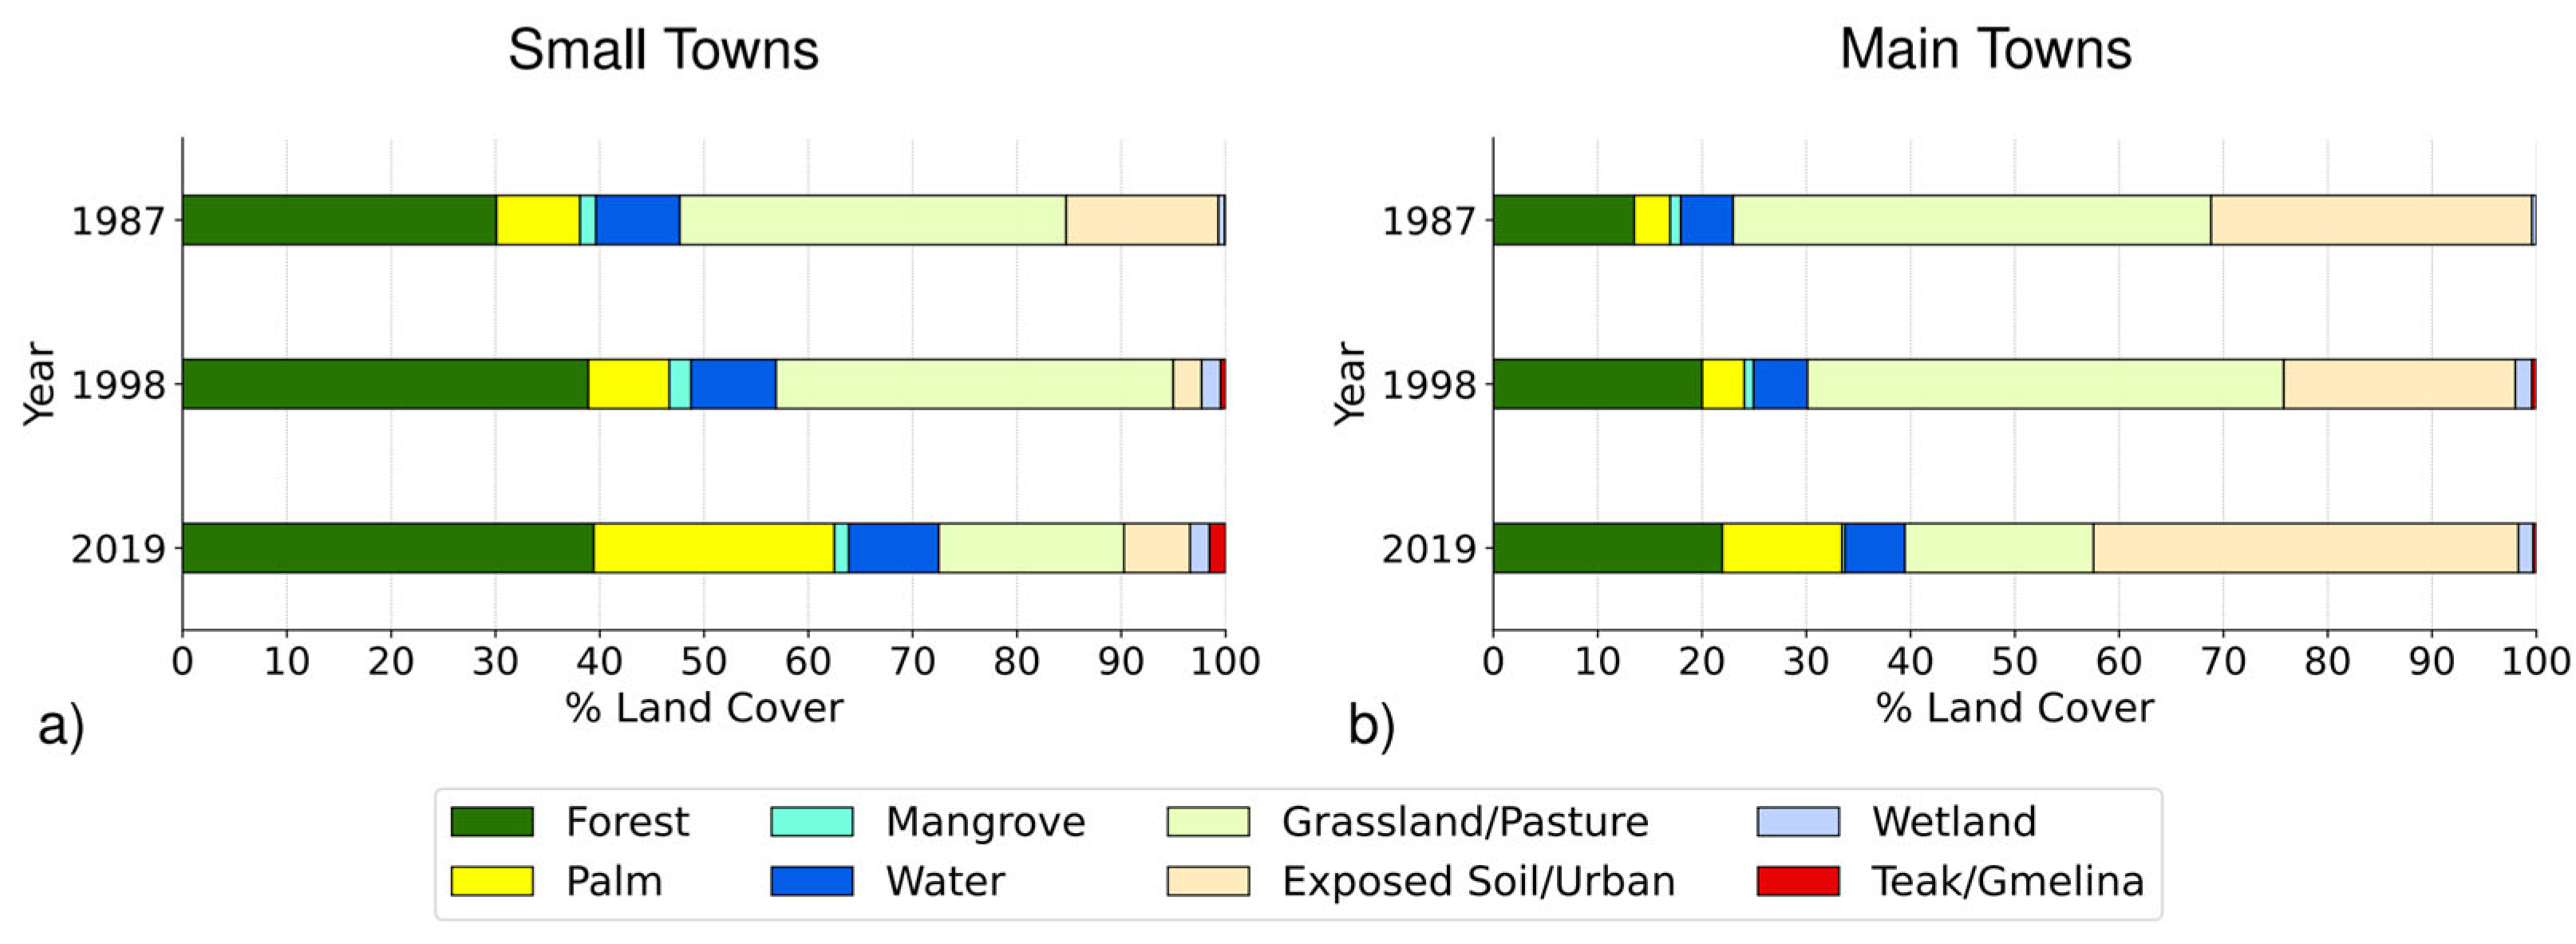
3.3. LULC Changes in Riparian Zones, Roadsides, Towns, and PES Farms

Riparian zones in the PAs had higher forest cover than those in non-PAs (Figure 5I,J). Riparian zones in the non-PAs had more grasslands and palm plantations, and grasslands and urban/exposed land converted to palm plantations. Roadsides experienced increases in forest cover, palm plantations, and teak/gmelina plantations (a 13.40% increase forest cover, 9.62% in palm plantations, and 3.36% in teak/gmelina) and decreases in grassland and urban/exposed area (an 18.25% decrease in grassland and 8.37% in urban/exposed land) (Figure 5K). A grassland decrease was observed in both large towns and communities/small towns, though the contributors to this decrease are different in small and main towns (Figure A1). In communities/small towns, grassland transitioned to palm plantations while, in the main towns, grassland was converted to urban/exposed.
As expected, the LULC over FONAFIFO farms was dominated by forests and this increased during the study period (Figure 5L and Figure 6M). Although the total increase in forest cover within FONAFIFO farms was relatively small (575 ha), the increase was driven by palm plantations, mangrove, grassland, and urban/exposed land transitioning to forest (Figure 5L and Figure 6M). From 1987 to 2019, the majority of land covered by palm plantations (65 of 84 ha, 77%), grassland (270 of 430 ha, 63%), and urban/exposed (177 of 241 ha, 73%) converted to forest.

3.4. LULC Accuracy

The overall producer’s accuracy for the LULC maps based on 743 validation points was 76.99% when secondary forest and mature forest were considered two separate classes (Table A1). Overall producer’s accuracy was 90.44% when the two forest classes were combined into a single forest class, with a 99.28% accuracy for the combined forest class, indicating that forest was almost never confused for another class (Table A2). The accuracy of secondary forest and mature forest individually was 65.18% and 62.05%, respectively (Table A1). Almost all of this confusion is due to misidentification as the other forest class (Table A3 and Table A4). The other classes with the highest rates of confusion were grassland (68.18%) and palm plantations (78.08%). Both grassland and palm plantations were most frequently misclassified as secondary forest (Table A3 and Table A4). Misclassification of teak, gmelina, and palm plantations could be because young plantations and mature plantations look very different, so there could be confusion in classifying them as the same class. Mangrove, water, and wetland had over 90% accuracy. Cohen’s kappa was 0.55 when both forest classes were separated and 0.49 when both forest classes were combined, lending to a substantial and moderate level of agreement, respectively, between the trained machine learning model and the ground truth data.

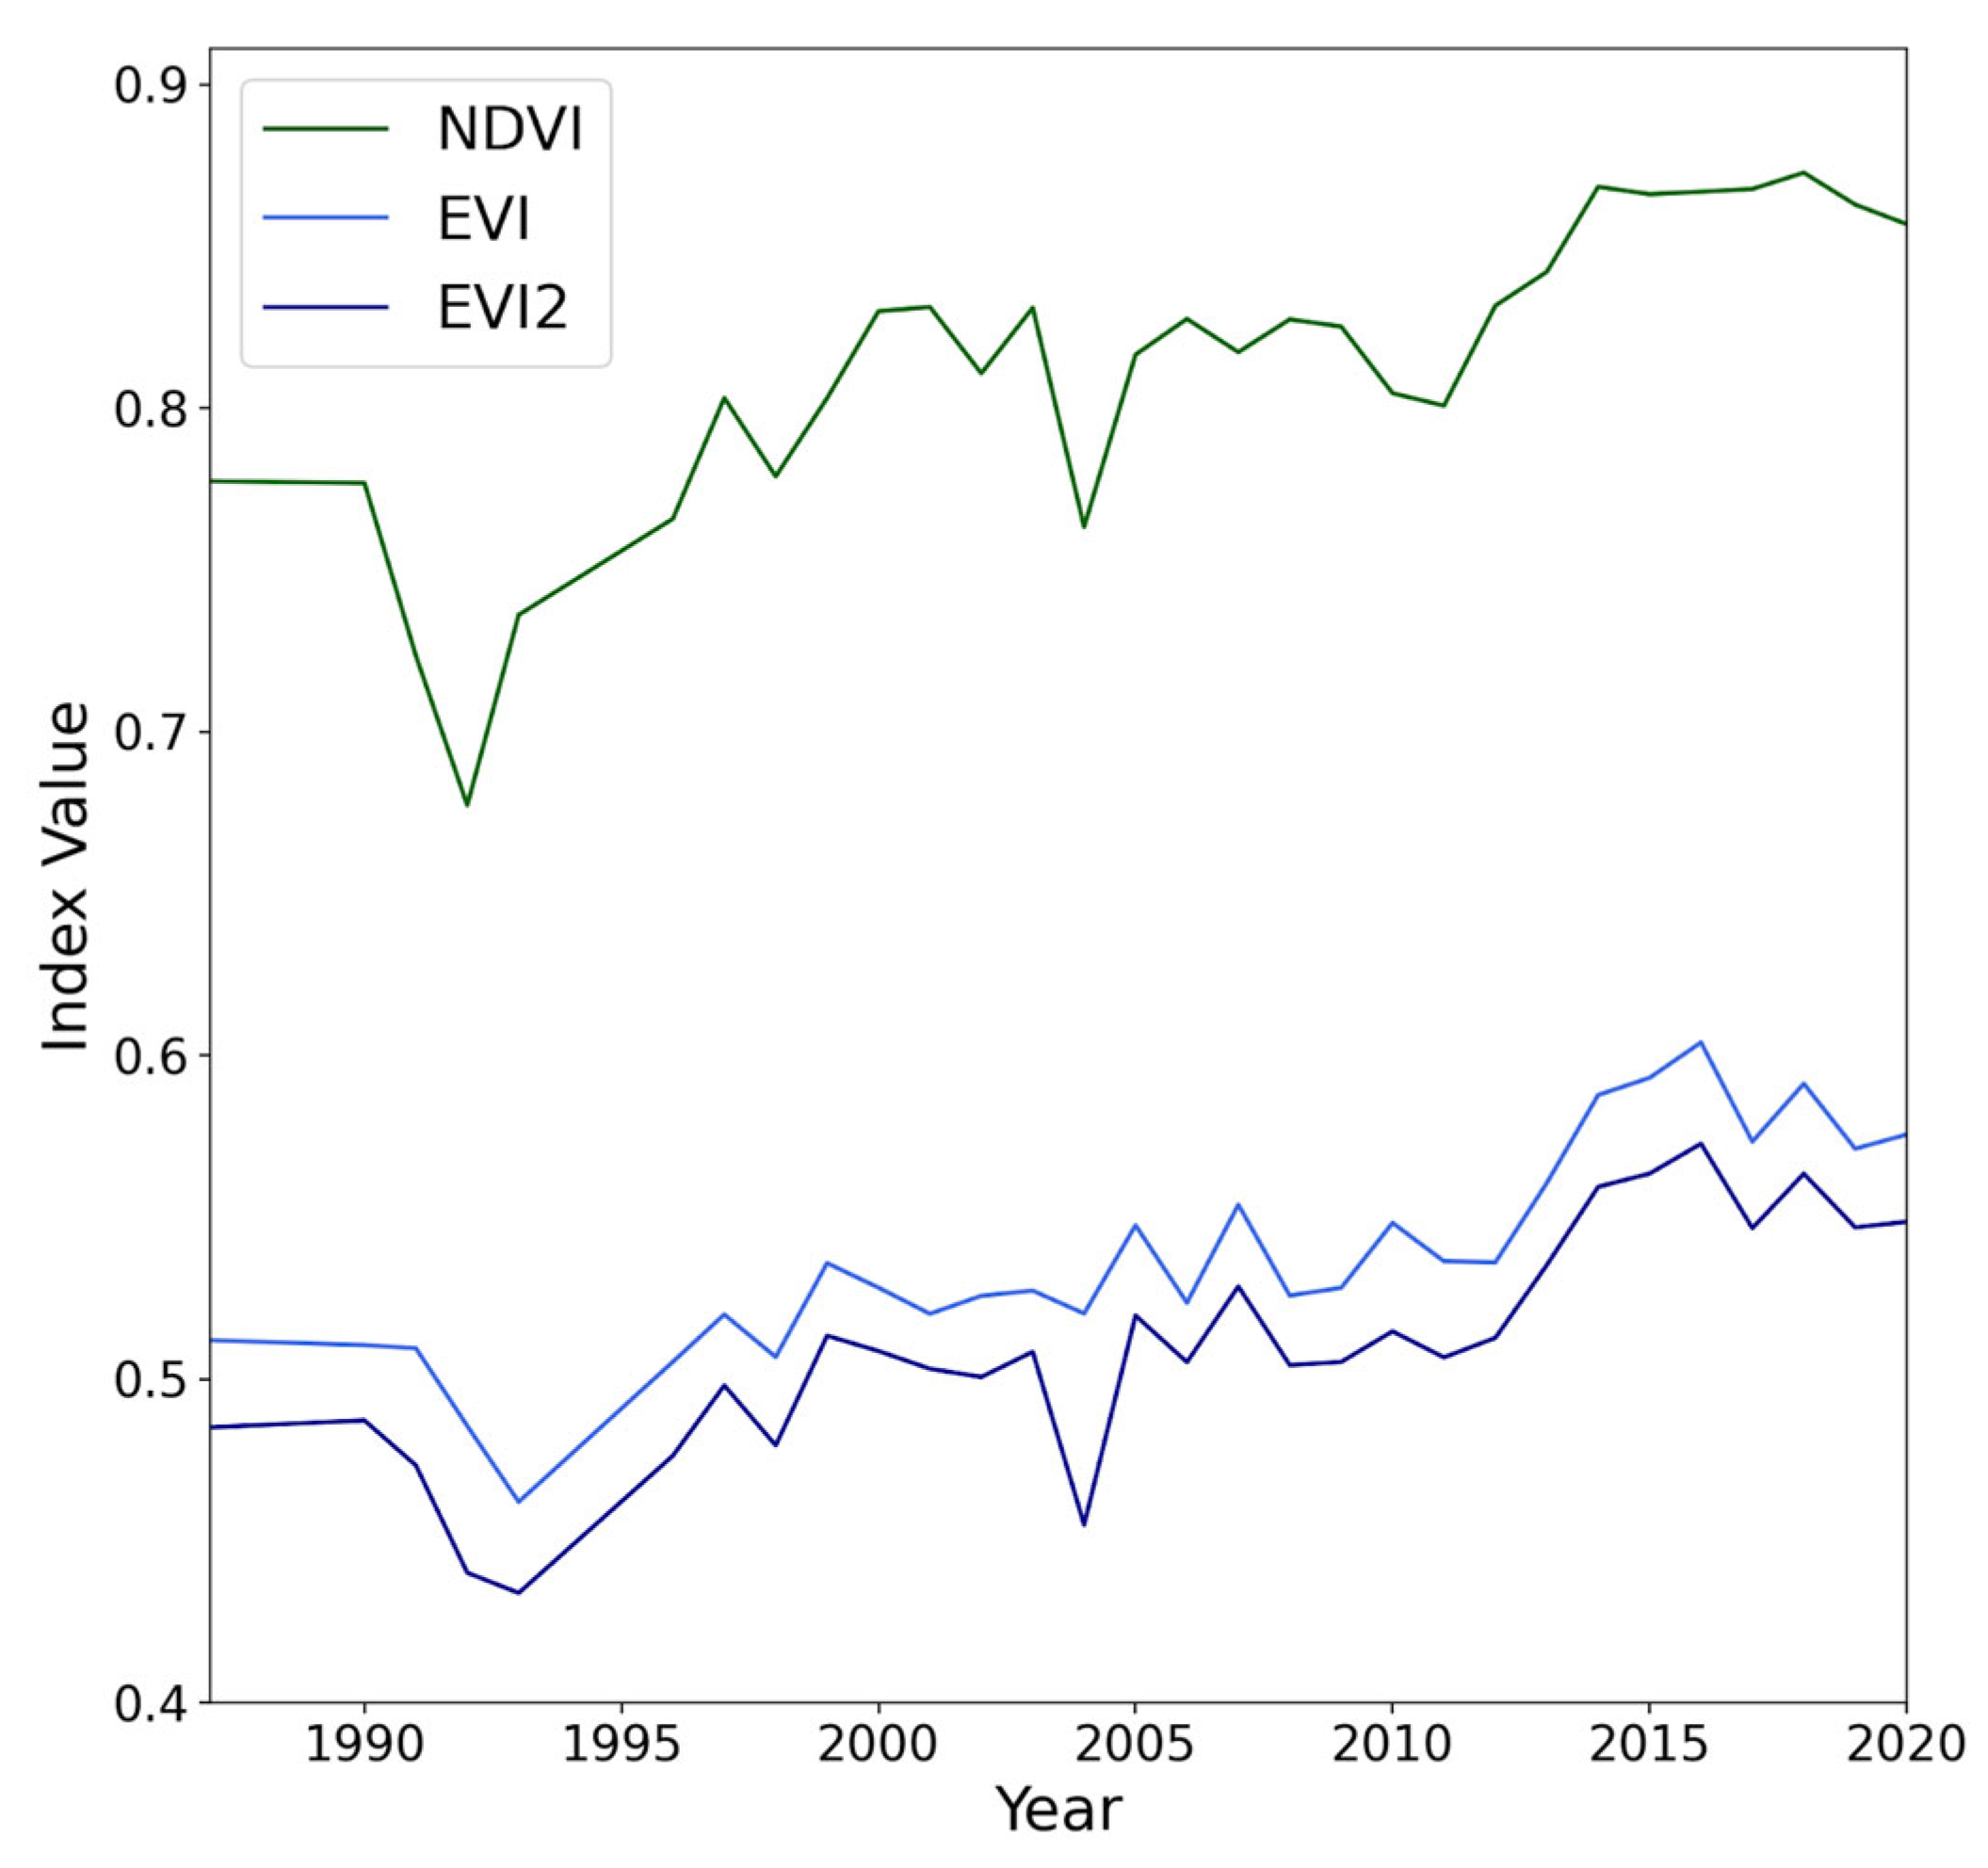
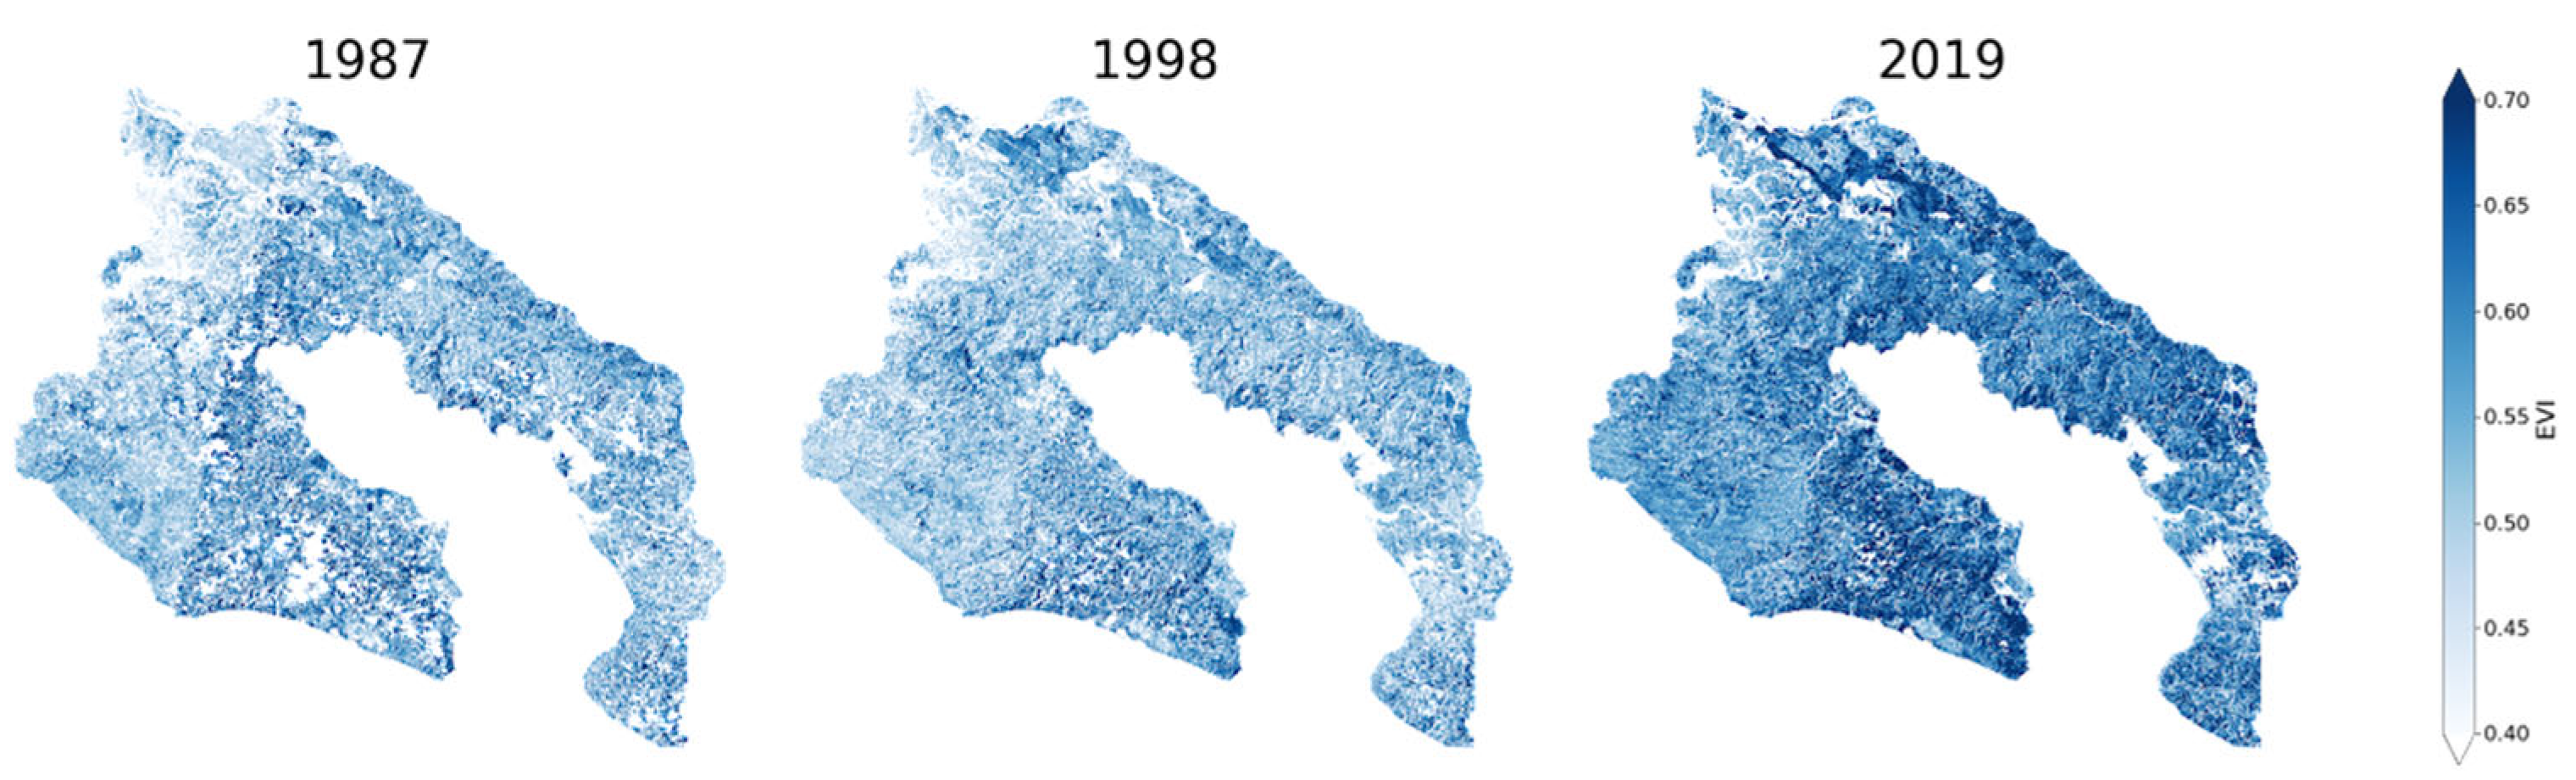
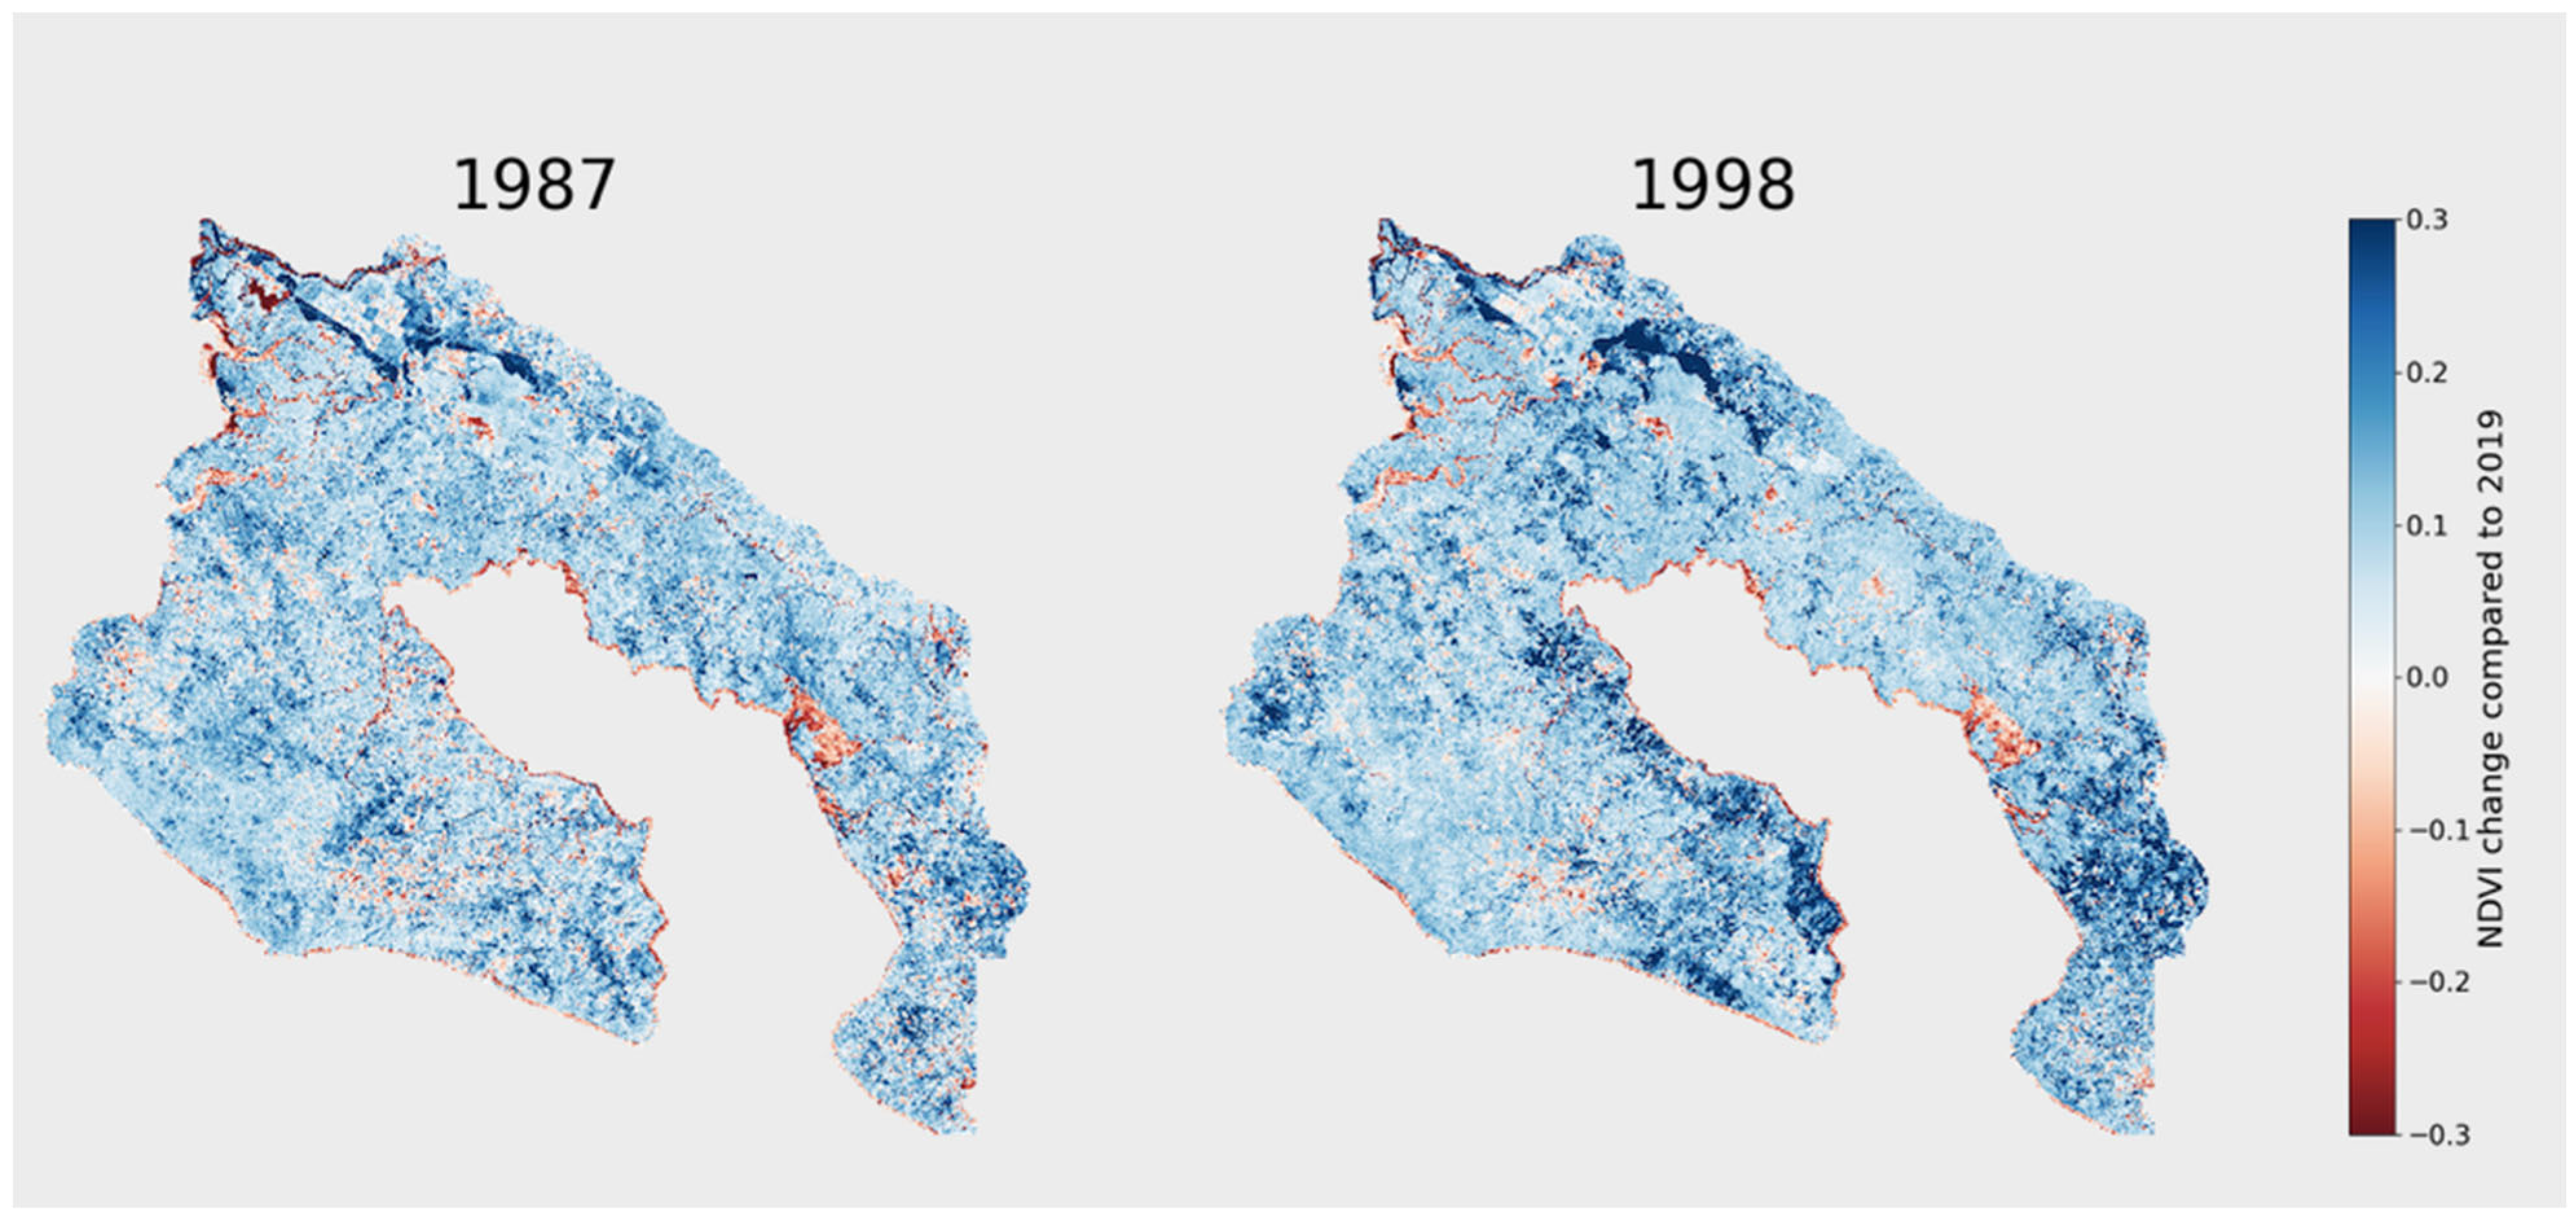
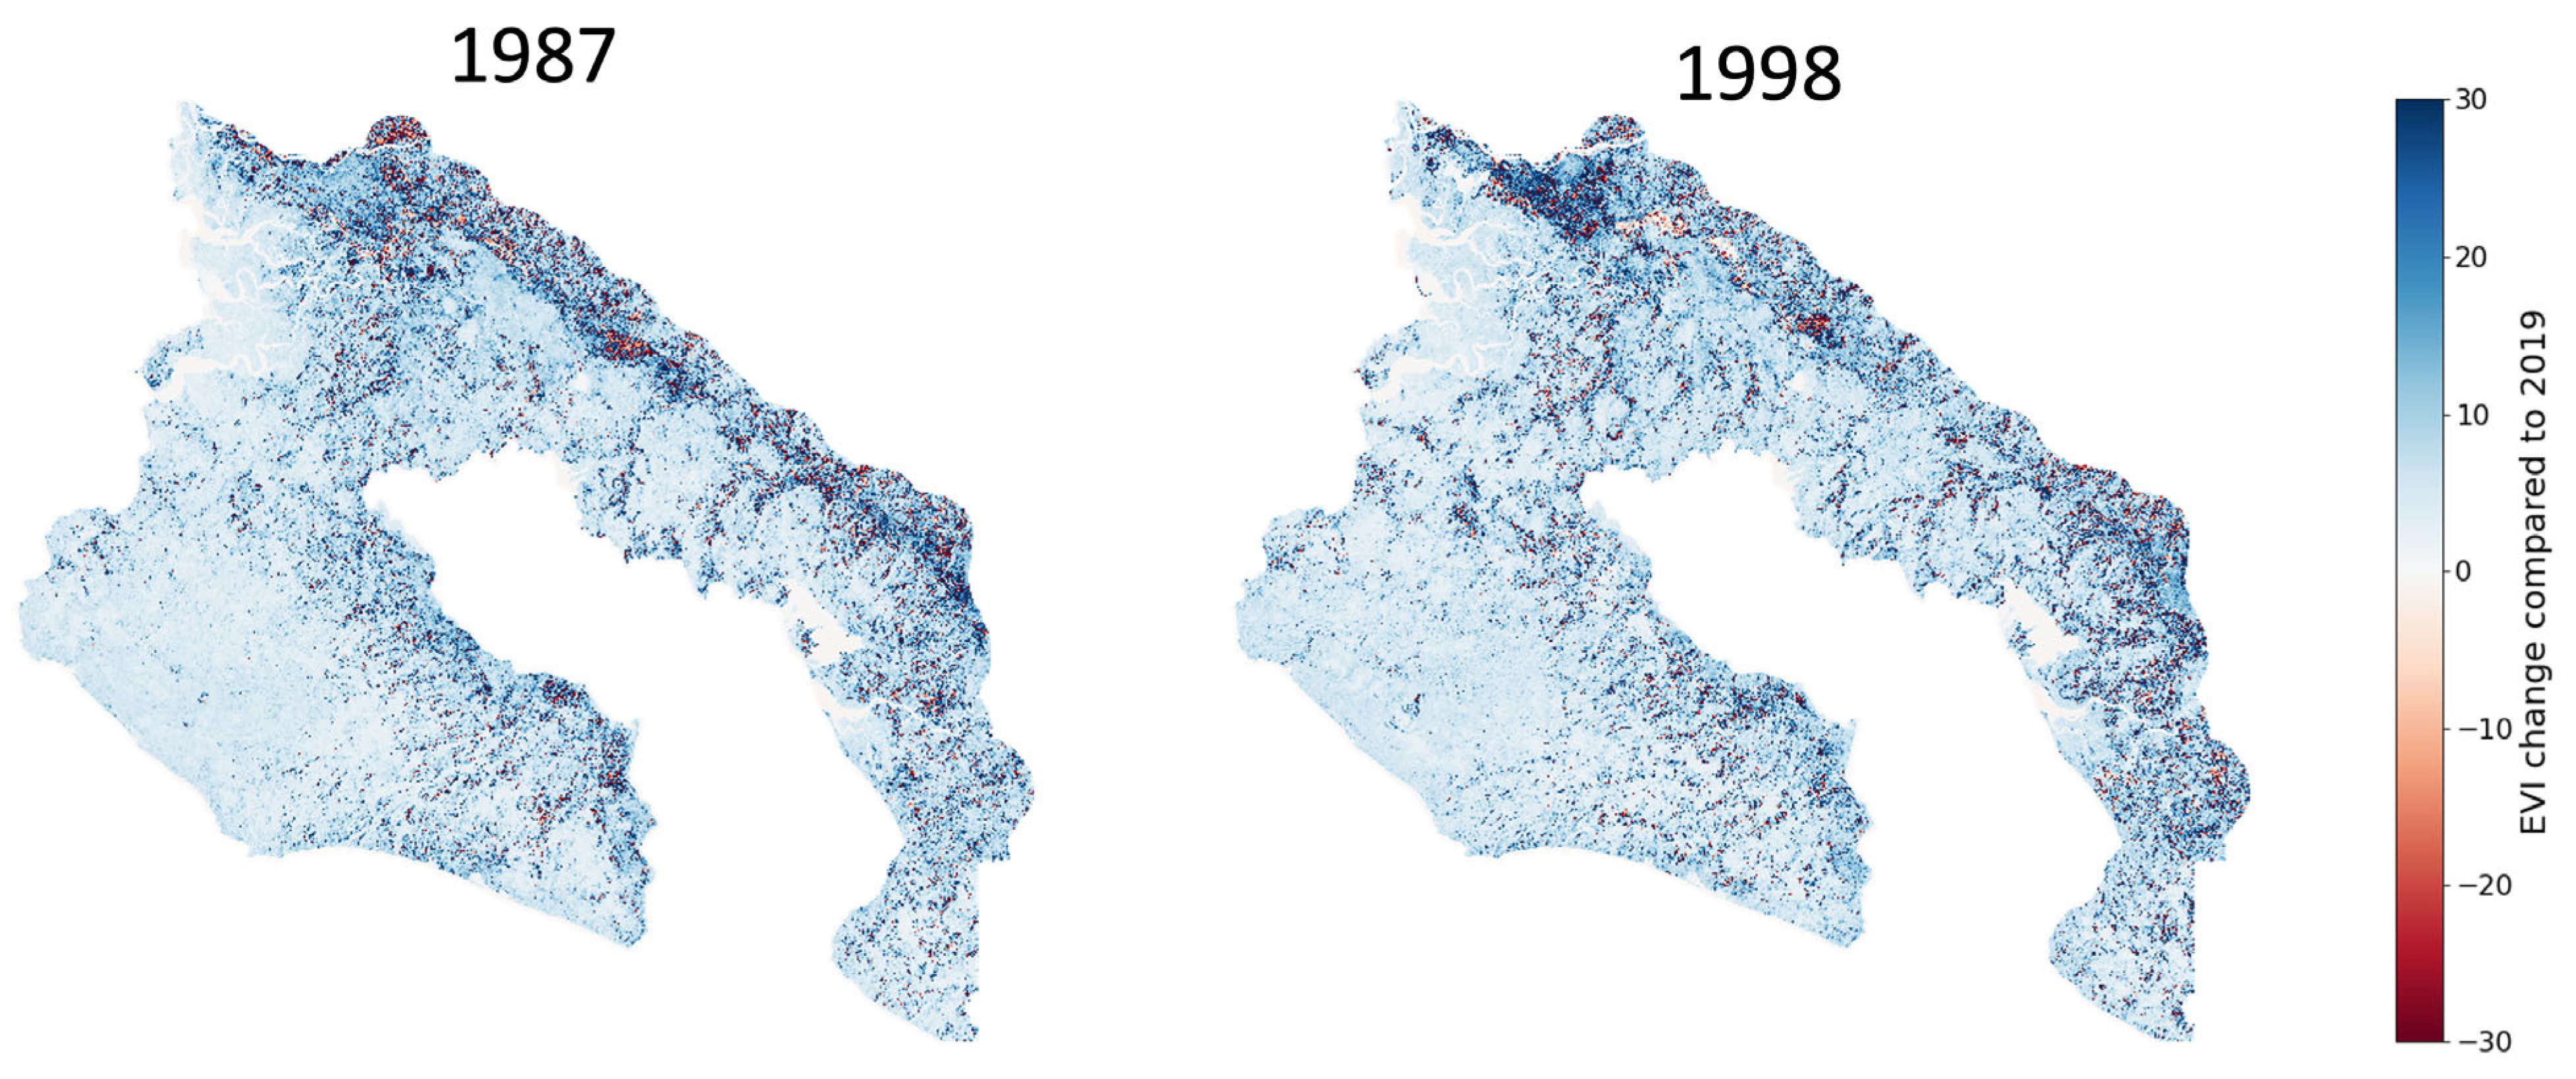
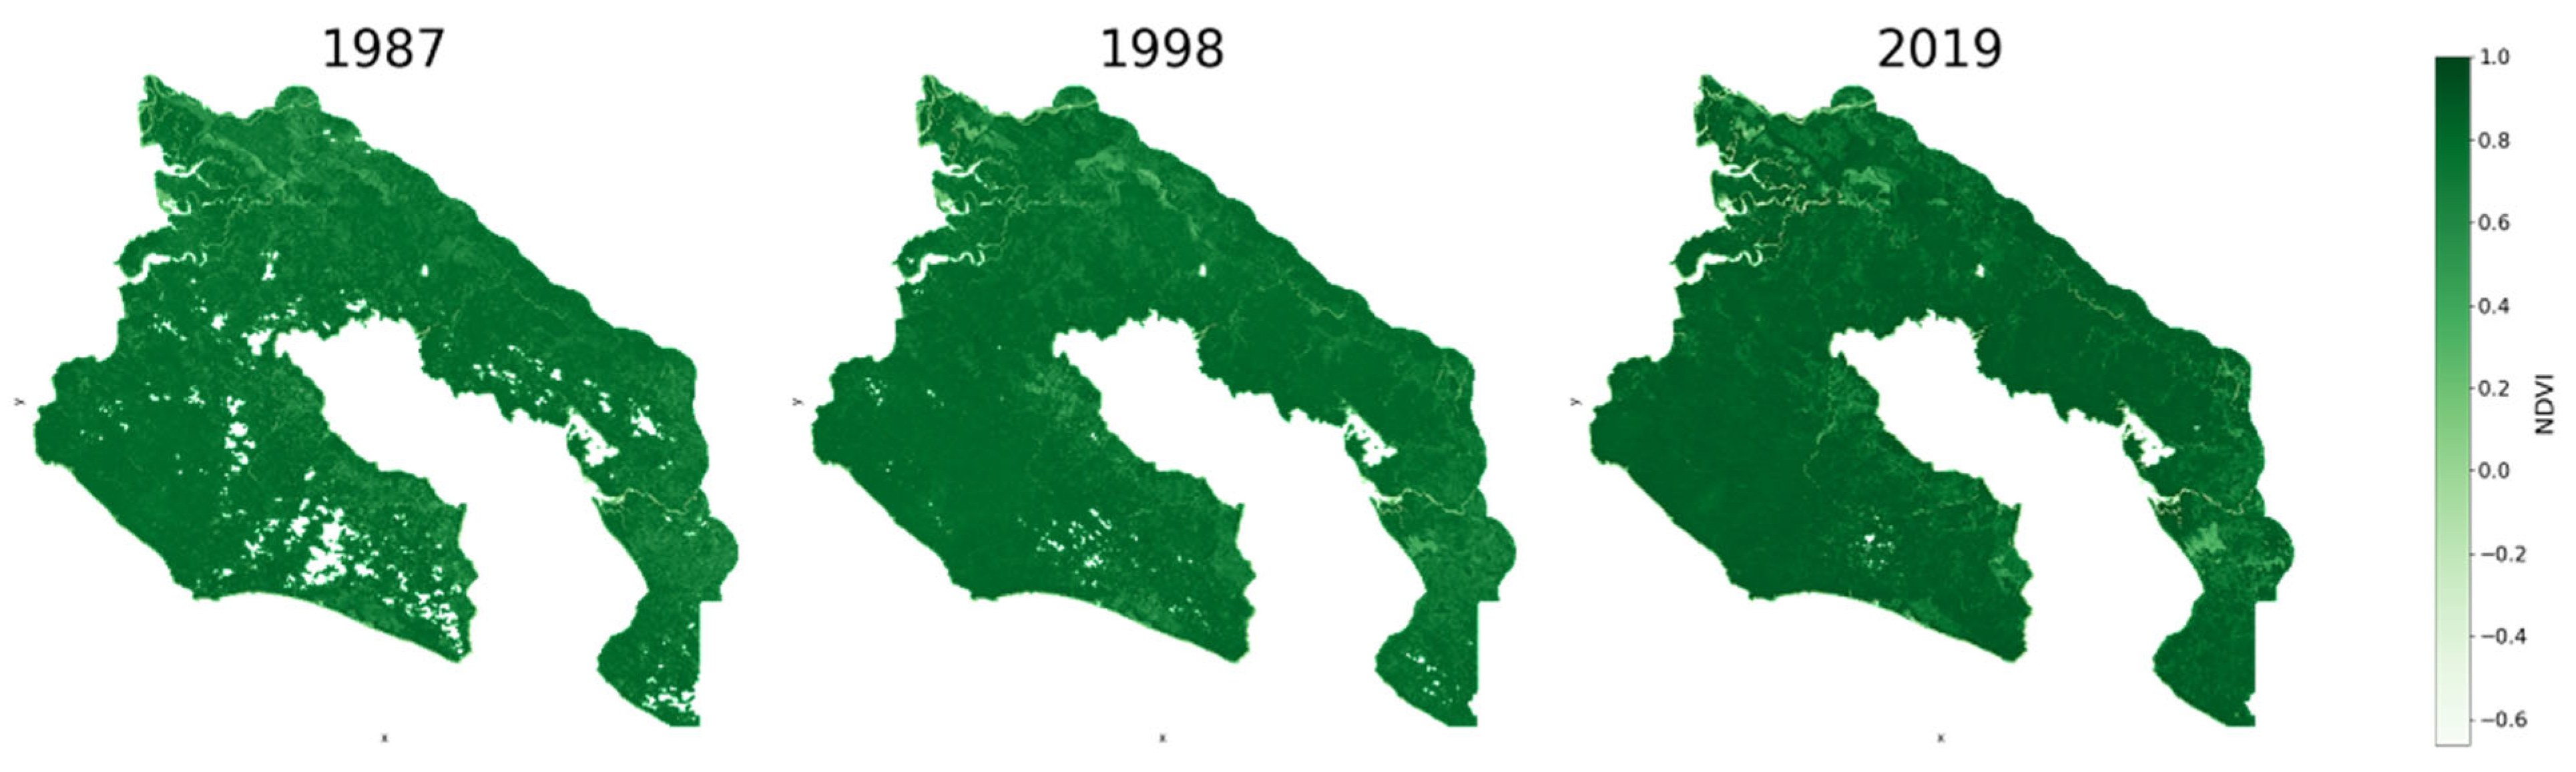
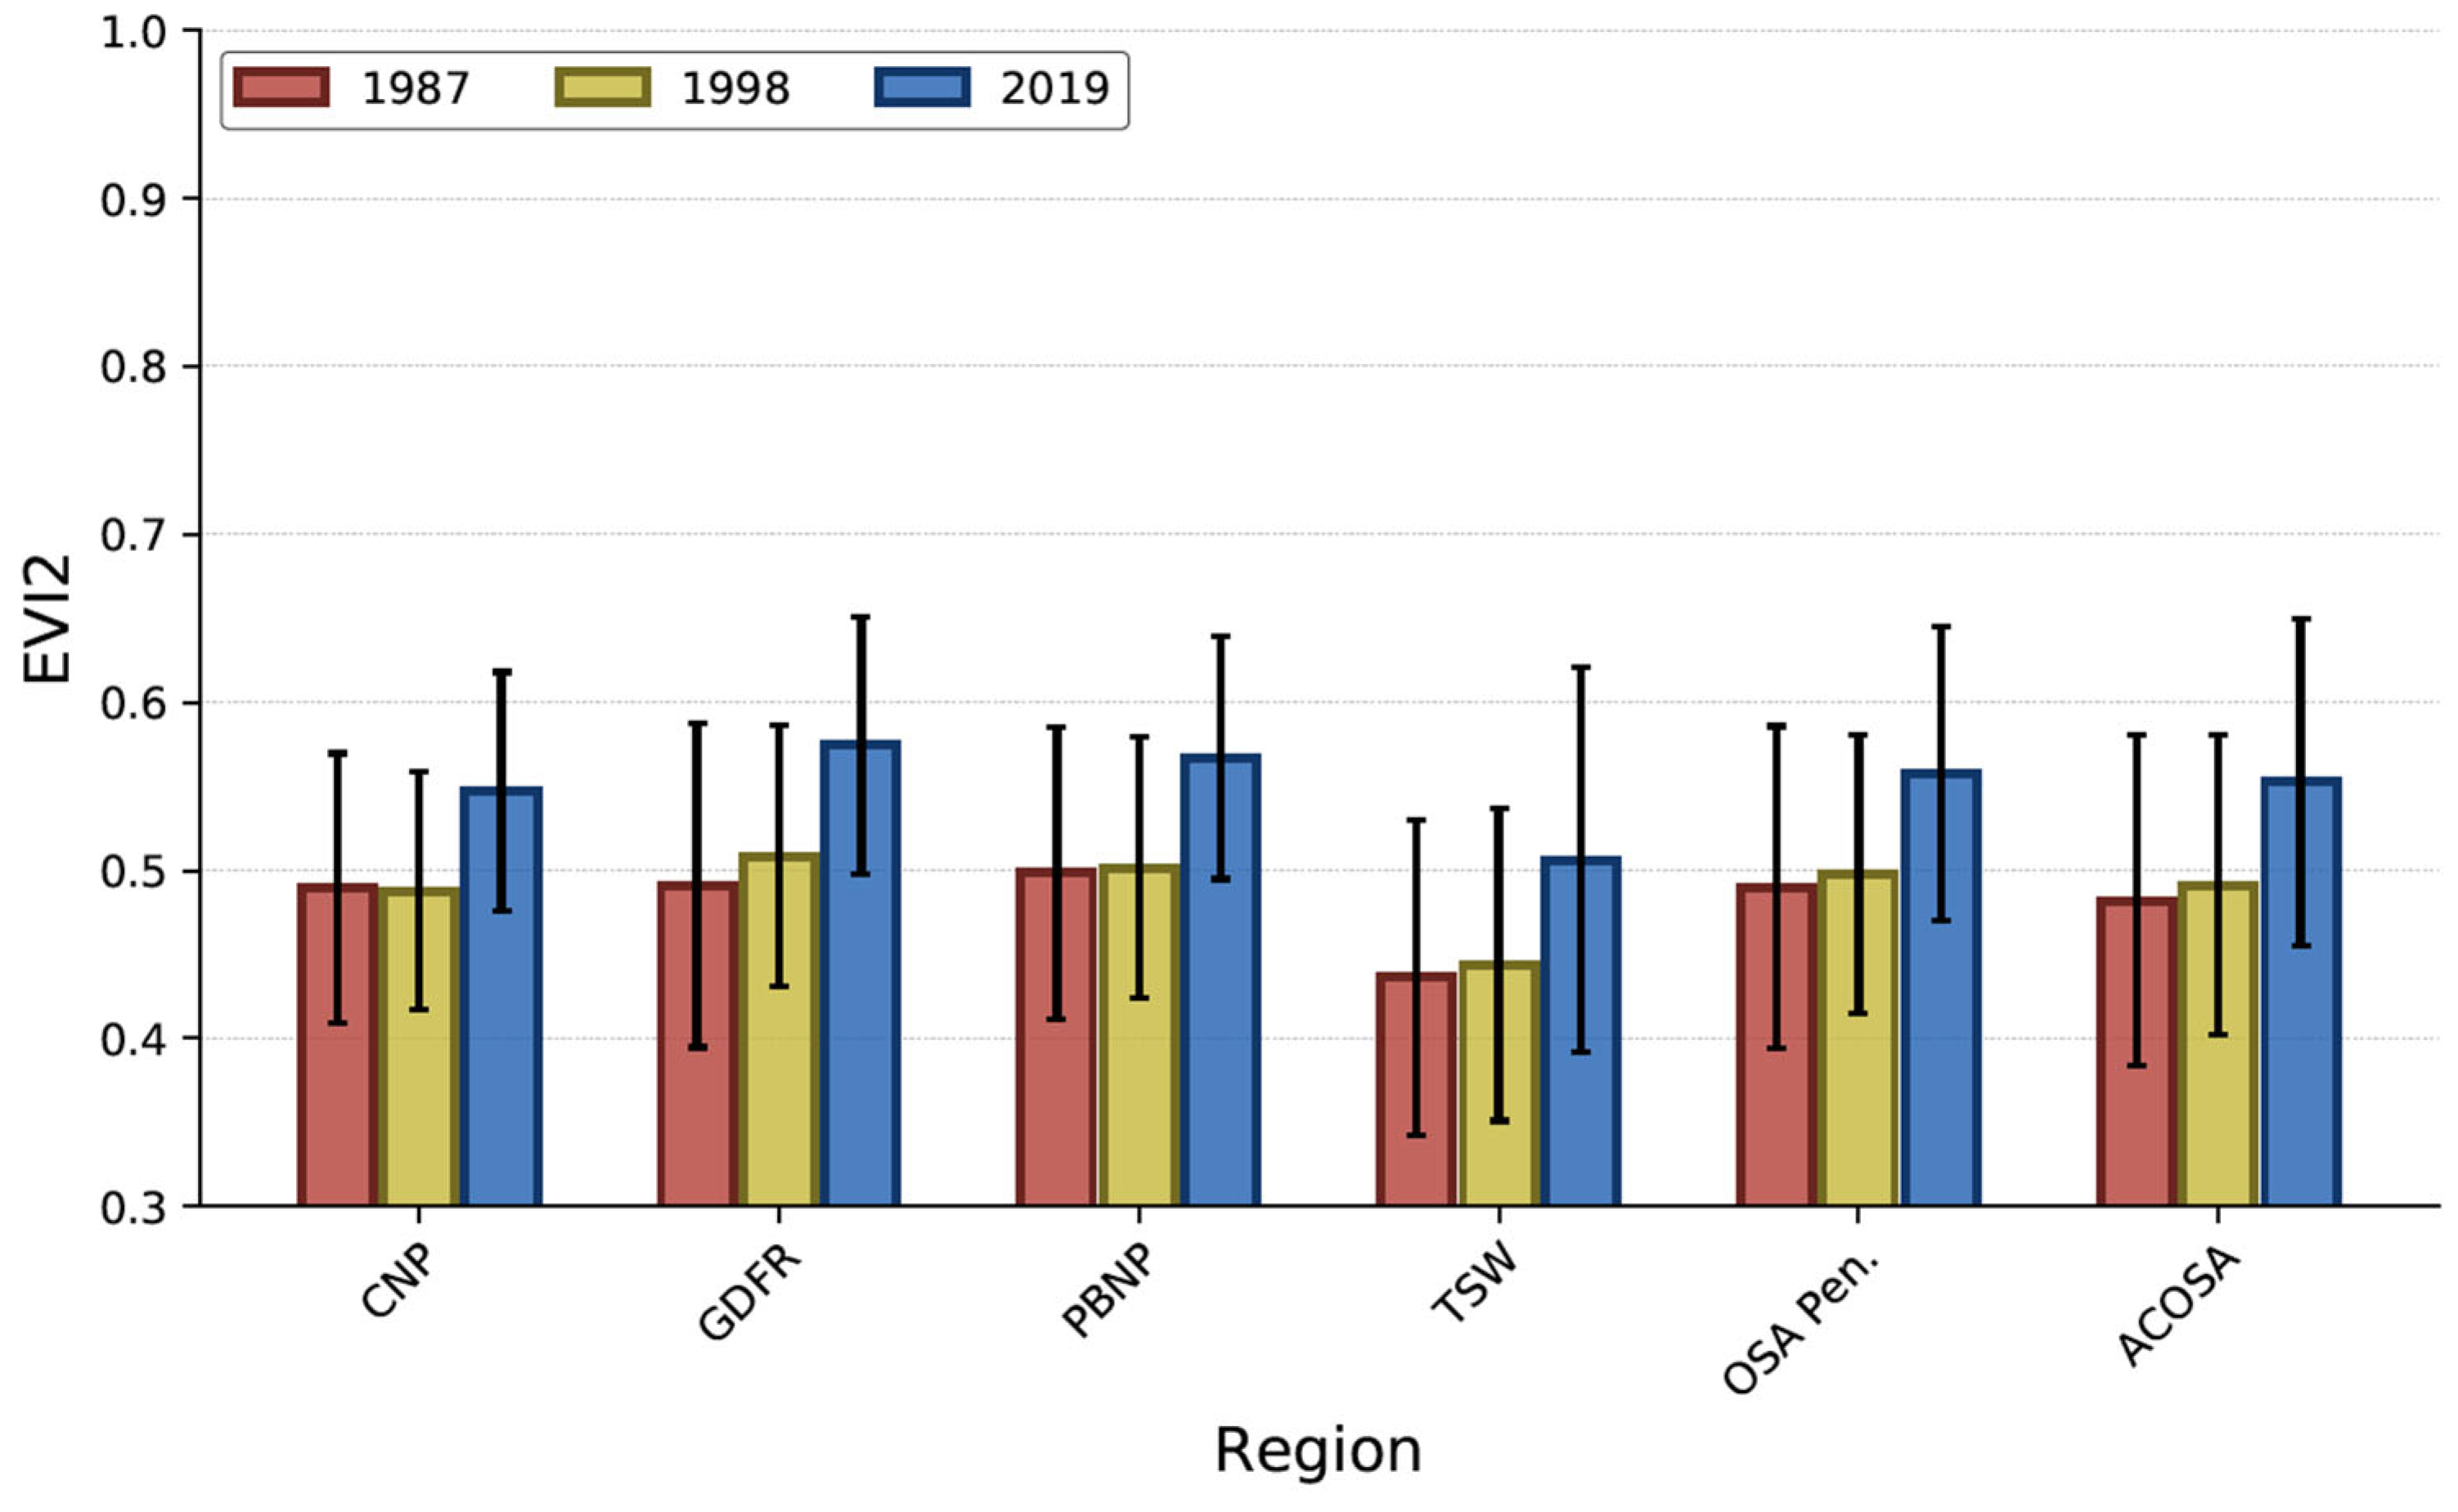
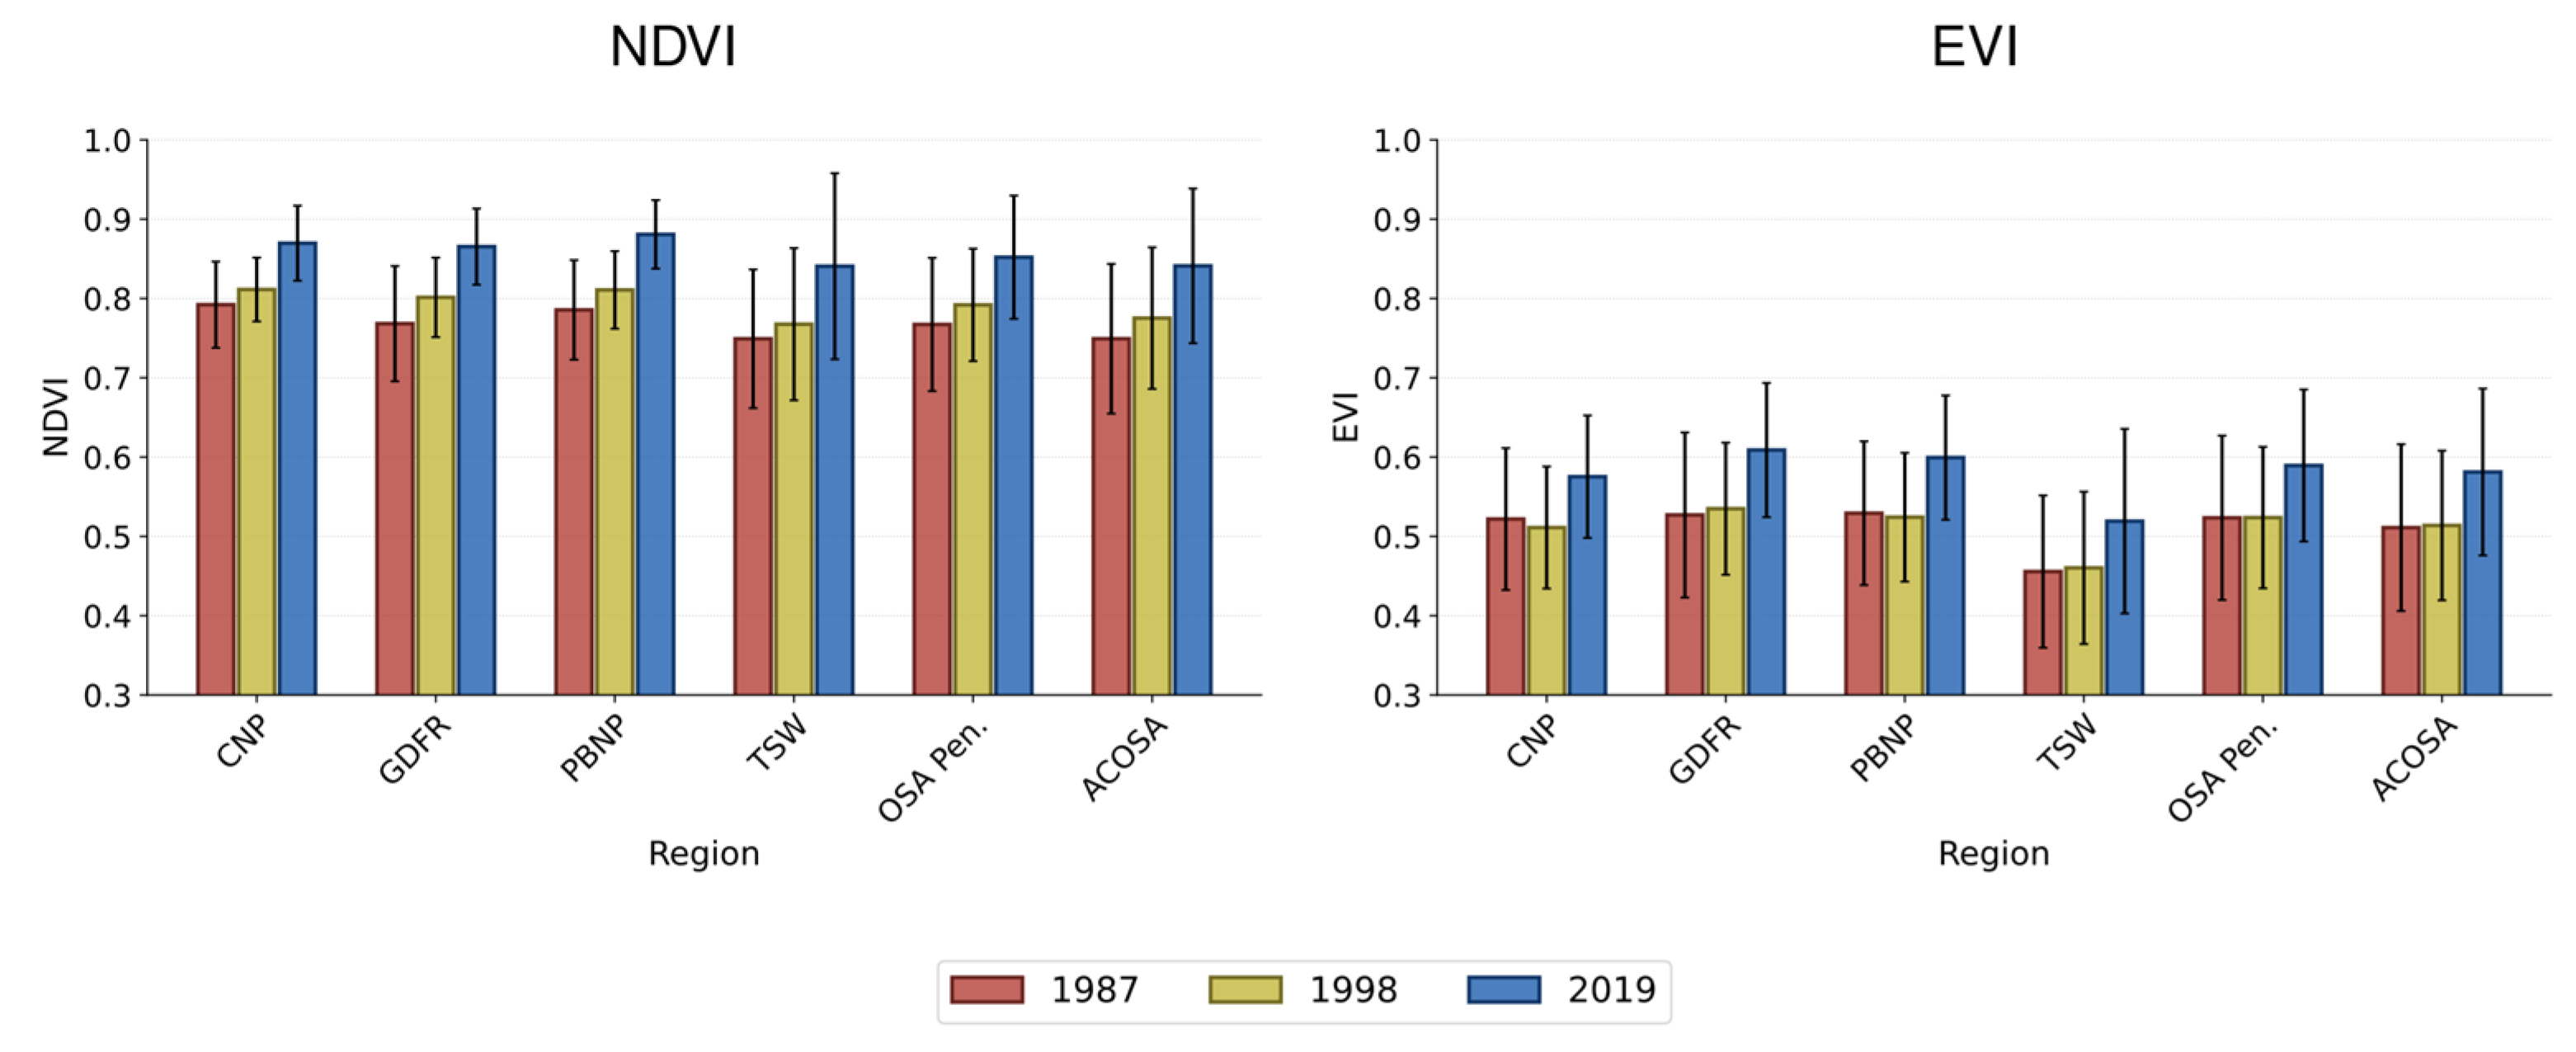
3.5. NDVI and EVI Change

Both the NDVI and EVI show a relative increase in vegetation throughout the study region (Figure 7, Figure 8, and Figure A2, Figure A3, Figure A4, Figure A5, Figure A6). All PAs show the vegetation index trending upwards when comparing 1987, 1998, and 2019 consecutively, with the largest increase occurring during the latter time period. This trend is consistent across PAs and non-PAs (Figure 7 and Figure A6). Comparing these time series shows that trends for the NDVI, EVI, and EVI2 show similar patterns with NDVI consistently being higher (Figure 8). Previous studies have suggested that the EVI may be a more appropriate metric in densely vegetated with high humidity and rainfall in the rainy season, such as ACOSA [41,42,56]. It is imperative to note that these vegetation increases do not directly correlate with reforestation in all cases. For example, some areas experienced transitions from classes with less vegetation (i.e., urban/exposed or grassland) to palm or teak plantations.

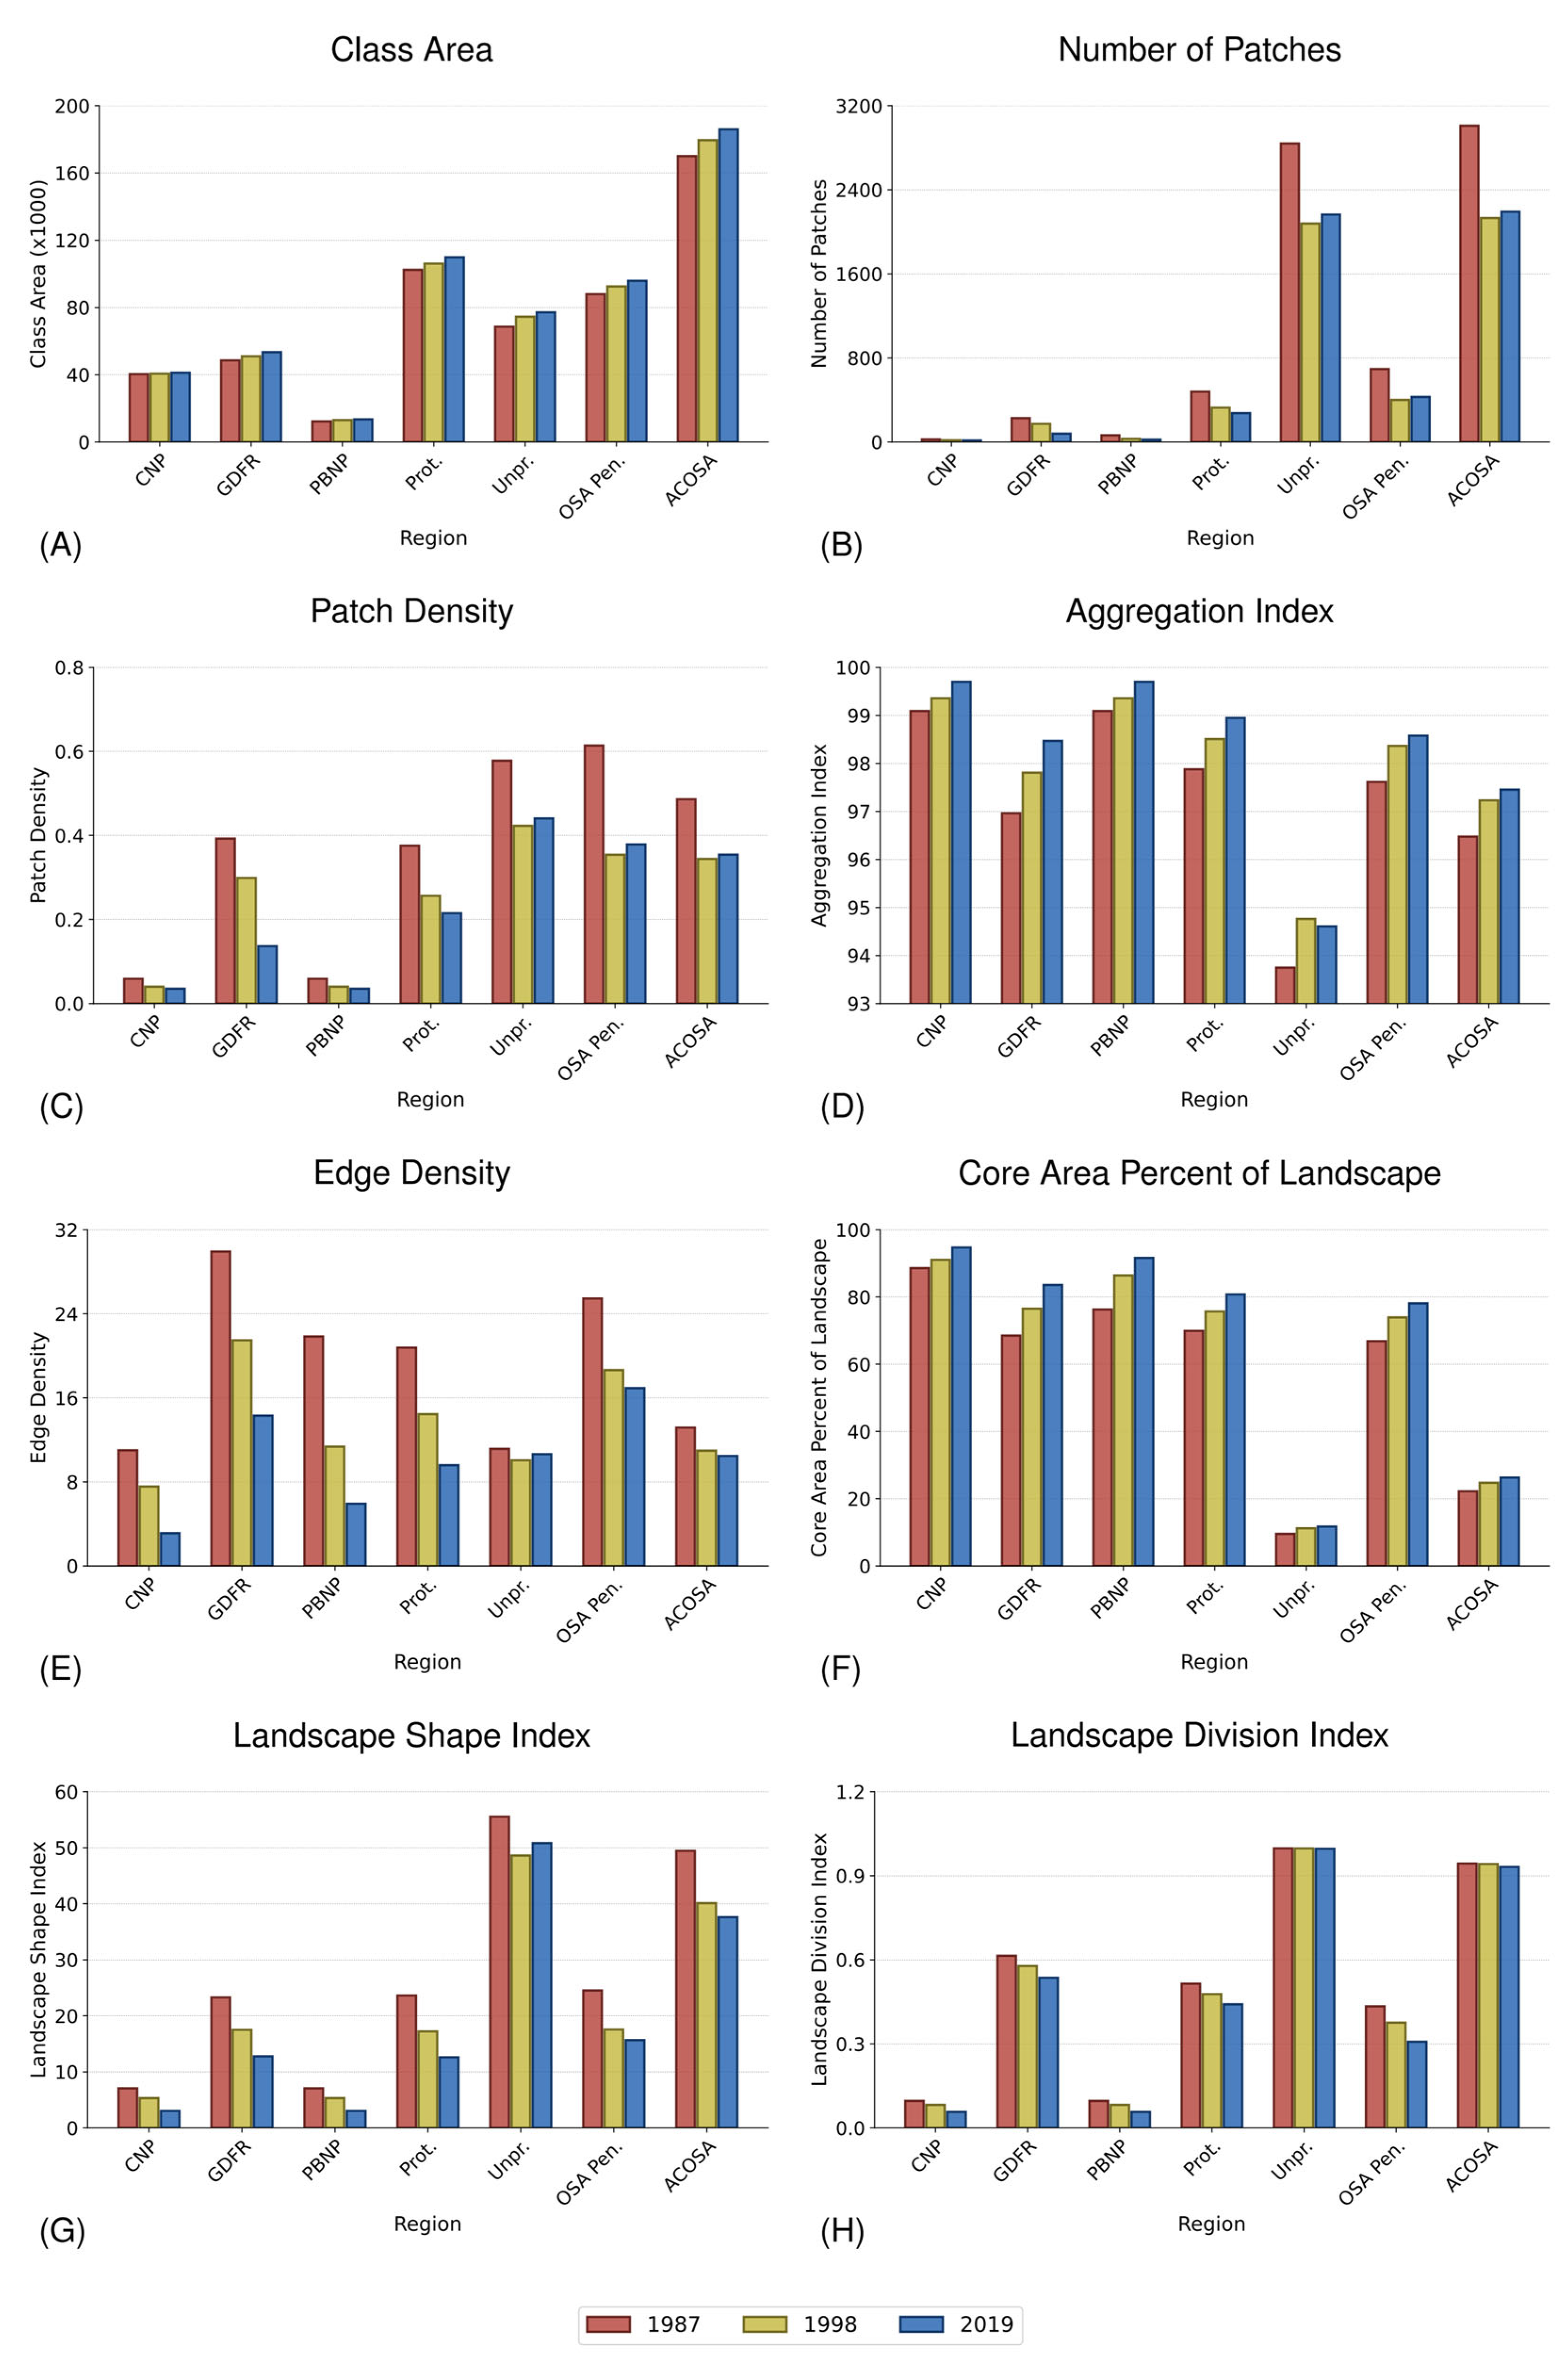
3.6. Landscape Metrics

The results of the forest patch landscape metric computation generally indicate an increase in larger, more regularly shaped, and more connected forest patches over time (Figure 9). The Forest Class area generally increased in all categories at a steady rate over the 32-year period, with higher values in PAs than non-PAs (Figure 9A). The Number of Patches shows that the number of forest patches decreased between 1987 and 2019 in both PAs and non-PAs (Figure 9B). There were 83% more forest patches in non-PAs and ACOSA than PAs in 1987, indicating a more fragmented and discontinuous forest in unprotected areas. The same was true in 1998 (77% more forest patches) and 2019 (87% more patches). Forest Patch Density, another measure of connected and intact forests, decreased from 1987 to 1998 in all areas (Figure 9C). There was a slight increase in patch density from 1998 to 2019 in the more fragmented landscapes of non-PAs, ACOSA and the entire Osa Peninsula, while patch density continued to decrease in PAs. The Aggregation Index values increased for all areas over the three dates, except for a decrease in non-PAs between 1998 and 2019 (Figure 9D). Higher values of the Aggregation Index indicate a higher quantity of pixels sharing the most possible edges. The Edge Density (measured in m/ha) decreased in all areas in all time periods except a small increase in non-PAs from 1998 to 2019 (Figure 9E). PAs, especially Piedras Blancas and the Golf Dulce Forest Reserve, saw the largest decrease in Edge Density. The Core Area Percentage of Landscape increased in all areas in both time periods (Figure 9F). Non-PAs had much lower values of percent core areas and a smaller increase than PAs.
The Landscape Shape Index measures the average complexity of forest patch shapes within a landscape where the least complex shape is a circle (lower values are less complex). PAs had much lower values (3–23) than non-PAs (49–56) in 1987 (Figure 9G). The Landscape Shape Index decreased in all areas in both time periods, except for an increase between 1998 and 2019 in non-PAs. The Landscape Division Index metric measures how divided or connected a landscape is (lower values indicate more connected). Non-PAs had higher values than PAs, indicating a more divided and less connected landscape outside of PAs (Figure 9H). PAs decreased over time (from 0.5 to 0.4) while non-PAs stayed constant (above 0.99 for all three dates).

4. Discussion

While numerous tropical regions are undergoing net deforestation [15,57], our findings indicate that the Osa Conservation Area (ACOSA) has experienced a rise in forest cover, NDVI, EVI, and structural connectivity over the past several decades. The Osa Peninsula saw a 25.2% augmentation in secondary forest cover, predominantly regenerating on former grassland and urban/exposed lands. As of 2019, 85.5% of the Osa Peninsula is forested, with less than half constituting mature forest. The region likely has sufficient forest cover to effectively provide habitat to conserve a wide array of biodiversity. Across the tropics, studies have suggested regional forest cover threshold values of ~30–40% for the effective biodiversity conservation of most generalist species [58]. In some ecosystems, such as the Amazon, values of up to 85% are suggested [3]; Osa’s forest cover meets both of these thresholds.
Forest cover exhibited an increase both prior to and following the enactment of the 1996 Forest Law, implying that the majority of the deforestation in the region transpired before the late 1980s [21,28]. The conversion of forest to anthropogenic land use occurred at a slightly reduced rate subsequent to the law’s implementation compared to the period preceding it on the Osa Peninsula. The observed increase in forest cover coupled with low rates of deforestation both within and outside of PAs suggest minimal local leakage, limited deforestation encroachment, and that conservation mechanisms external to PAs may be effective. Additionally, the increases in the NDVI and EVI across the region are suggestive of forests maturing, higher productivity, and more sequestered carbon [59,60]. Since similar trends in NDVI/EVI and LULC were found, these indices could be useful in determining forest in rural regions where local LULC change maps are not available.
Forest landscape connectivity increased across the ACOSA throughout the study period, potentially increasing the landscape’s ability to support biodiversity. Both PAs and non-PAs saw an increase in landscape connectivity metrics before the Forest Law was implemented. This finding suggests that much of the forest that regenerated during this time was coalescent to and connecting existing forest patches and that deforestation removed many isolated forest patches. After the Forest Law was implemented, landscape connectivity continued to increase in PAs but slightly decreased in non-PAs, despite increases in forest cover during the time period in both PAs and non-PAs. This result suggests that much of the forest regeneration in non-PAs after the law was in new areas and made existing forest patches more irregularly shaped.
To our knowledge, this project generated the first LULC maps of the ACOSA region for the period 1987–2019. Additionally, these are the first maps in the region to separately classify mature and secondary forest, making the maps particularly useful for conservation interventions targeted toward mature forest fragments, since mature forest loss rates are highly correlated with smaller fragment size [15]. The 2019 LULC map in particular may be useful for research and conservation initiatives targeting species of conservation concern, such as the endemic Black-checked Ant-Tanager (Habia atrimaxillaris), found predominantly in secondary forest, and the critically endangered Pleodendron costaricense tree, found in mature forest patches [35,61,62]. These resources are already proving useful for conservation and research initiatives being implemented within the region [61,62].
In the following discussion, we describe the relationship between LULC, connectivity, PAs, and the Forest Law. We begin by discussing LULC trends: contextualizing Osa’s LULC dynamics within its land use transition and globalization process, comparing forest cover trends inside and outside of PAs, and exploring deforestation and reforestation in relation to the Forest Law. Then, we discuss forest connectivity both inside and outside of PAs and in relation to the Forest Law. Subsequently, we discuss LULC trends in relation to specific areas (farms receiving PES, riparian zones, and roads) and conclude with study limitations and opportunities for future research.

4.1. LULC Dynamics Reflect Osa’s Globalization Process

The observed increases in forest cover in the ACOSA and the Osa Peninsula over both study periods are likely linked to LULC transitions in the region, as local communities transition from primary economic activities (such as farming and logging) to secondary and tertiary activities (such as ecotourism and conservation) [26,27]. The trends in LULC in the region are typified by transitions from grassland to forest, urban/exposed surfaces to forest, and grassland to palm. Many of the changes in agricultural land area in the region reflect national and international economic and agricultural trends, suggesting that the Osa Peninsula’s agricultural land use transition is a reflection of its complex globalization process [9]. ACOSA’s drop in grassland between 1998 and 2019 is likely due to a lagged land use transition in response to the international beef price drop [63]. The region saw an increase in oil palm plantations, especially 1998–2019, which is consistent with global increases in oil palm demand and production [64]. Vijay et al. (2016) found that in Southeast Asia and South America, 45% and 31%, respectively, of sampled oil palm plantations were planted on land that was forest in 1989 [65]. Costa Rica, however, had one of the lowest deforestation rates for oil palm plantations, with an estimated 0% of oil palm planted on areas deforested since 1989 [65]. This is likely in part due to the Forest Law that banned deforestation and thus forest clearing for oil palm plantation establishment. Non-native teak trees also increased in the region, but are often harvested young, minimizing their potential carbon sequestration benefits [66]. The region has also experienced an increase in human population size and urbanization. In general, these results indicate that while the Osa Peninsula has substantial conservation and ecotourism benefits, it is still affected by global agriculture, economic, and consumption patterns.

4.2. Forest Cover Increased in PAs, Indicating Almost No Encroachment, which Is Rare in the Tropics

Forest cover increased in all studied PAs, and the PAs experienced very little conversion of forest to anthropogenic uses over the study period. NPs, which are the PAs with the strictest conservation restrictions in the region, had higher forest cover and less forest conversion than other PA types. Corcovado NP, founded in 1975 (prior to this study period), saw relatively stable forest cover and almost no deforestation or encroachment of anthropogenic land uses. Piedras Blancas NP, in the region of ACOSA on mainland Costa Rica, saw the largest increase in forest cover of all PAs in the study area, likely because it was created during the study period (established in 1991). PB saw a large increase in forest cover over the time period immediately around when it was created (1987–1998). Between 1998 and 2019, almost all forest cover in PB remained and new forest continued to regenerate on abandoned agricultural land. The GDFR saw higher forest conversion to other classes (grassland, palm, and teak/gmelina) than other PAs, likely due to its lower protection status. In the Terraba-Sierpe National Wetland, wetland cover increased and mangrove decreased between 1998 and 2019, which could be an indicator that the aggressive negra forra (Acrostichum aureum) fern replacing mangrove in some areas after mangrove forest deforestation [67]. PAs across the tropics tend to have better health where on-the-ground conservation management interventions have increased [4], which could be a contributing factor to Corcovado and Piedras Blancas’ low forest encroachment.
The observed low levels of deforestation and increased forest cover within ACOSA’s PAs stand in contrast to many other PAs across the tropics, which have faced deforestation, encroachment from agriculture, and declining reserve health [2,4,68]. For example, Geldmann et al. (2019) found that cropland increased more in PAs across the globe than in matched areas outside of PAs, a trend that was not observed in ACOSA’s NPs [68]. Costa Rica appears to exhibit a unique correlation between protected status and forest cover compared to other tropical countries. Hansen et al. (2020) found that Costa Rica was one of the tropical countries with the lowest proportional forest loss in PAs (<1%) [15]. Prior research conducted throughout Costa Rica, which employed causal inference techniques to adjust for the non-random placement of PAs, determined that the protected status led to a reduction in deforestation and an increase in reforestation [69,70,71]. Consequently, it is plausible that the observed trends in forest cover within ACOSA’s PAs may be at least partially attributed to the enforcement of their protected status.

4.3. Forest Cover Also Increased Outside of PAs, Suggesting Minimal Local Deforestation Leakage from PAs

Forest cover outside of reserves is one of the most important predictors of reserve health [4]. Studies have found decreases in forest cover outside of PAs, with Laurence et al. (2012) noting that 85% of reserves experienced decreases in surrounding forest cover and just 2% of reserves gained surrounding forest cover [4]. Contrastingly, in ACOSA, both PAs and the surrounding non-PAs saw forest cover increase and very little forest conversion from 1987 to 2019, suggesting there has been minimal deforestation leakage from the PAs. The PAs saw a 7.3% increase in forest cover over 1987 cover, and the non-PAs saw a 12.4% increase in forest cover. As this is a descriptive and not causal study, it is not possible to assess additionality from the creation of the PAs. It is possible that the creation of PAs led to an increase in conservation outside of PAs, which is unique given that tropical PAs tend to have high deforestation rates in surrounding areas [2,5,15]. The strong ecotourism economy, conservation ethic, and environmental policy in Costa Rica overall, and particularly in the Osa Peninsula, which is partially driven by its proximity to Corcovado, may facilitate agricultural abandonment in favor of tourism and other forest conservation and restoration on private land [9,27,45]. Given the importance of forest cover outside of the PAs to help preserve ecosystem health, ACOSA’s increasing forest cover outside of the PAs may improve biodiversity inside the PAs [4]. Lessons learned from ACOSA’s relative success in conserving forests inside and outside of the PAs could be used to help develop PA buffer zone protection strategies, legal frameworks, monitoring schemes, and sustainable livelihoods in Costa Rica and across the tropics.

4.4. Both Forest Conversion and Restoration Rates Decreased after 1996 Forest Law

The Osa Peninsula saw lower rates of forest conversion to anthropogenic land uses and lower rates of restoration after the 1996 Forest Law. It is possible that the Forest Law’s deforestation ban successfully contributed to decreased forest conversion, but it likely did not facilitate an increase in restoration across the region, highlighting the importance of future policies to incentivize large-scale restoration and sustainability [9]. A study in northern Costa Rica similarly found that mature forest loss decreased and forest cover slightly increased after the 1996 ban on forest clearing, but reforestation rates also decreased due to cropland expansion [72].

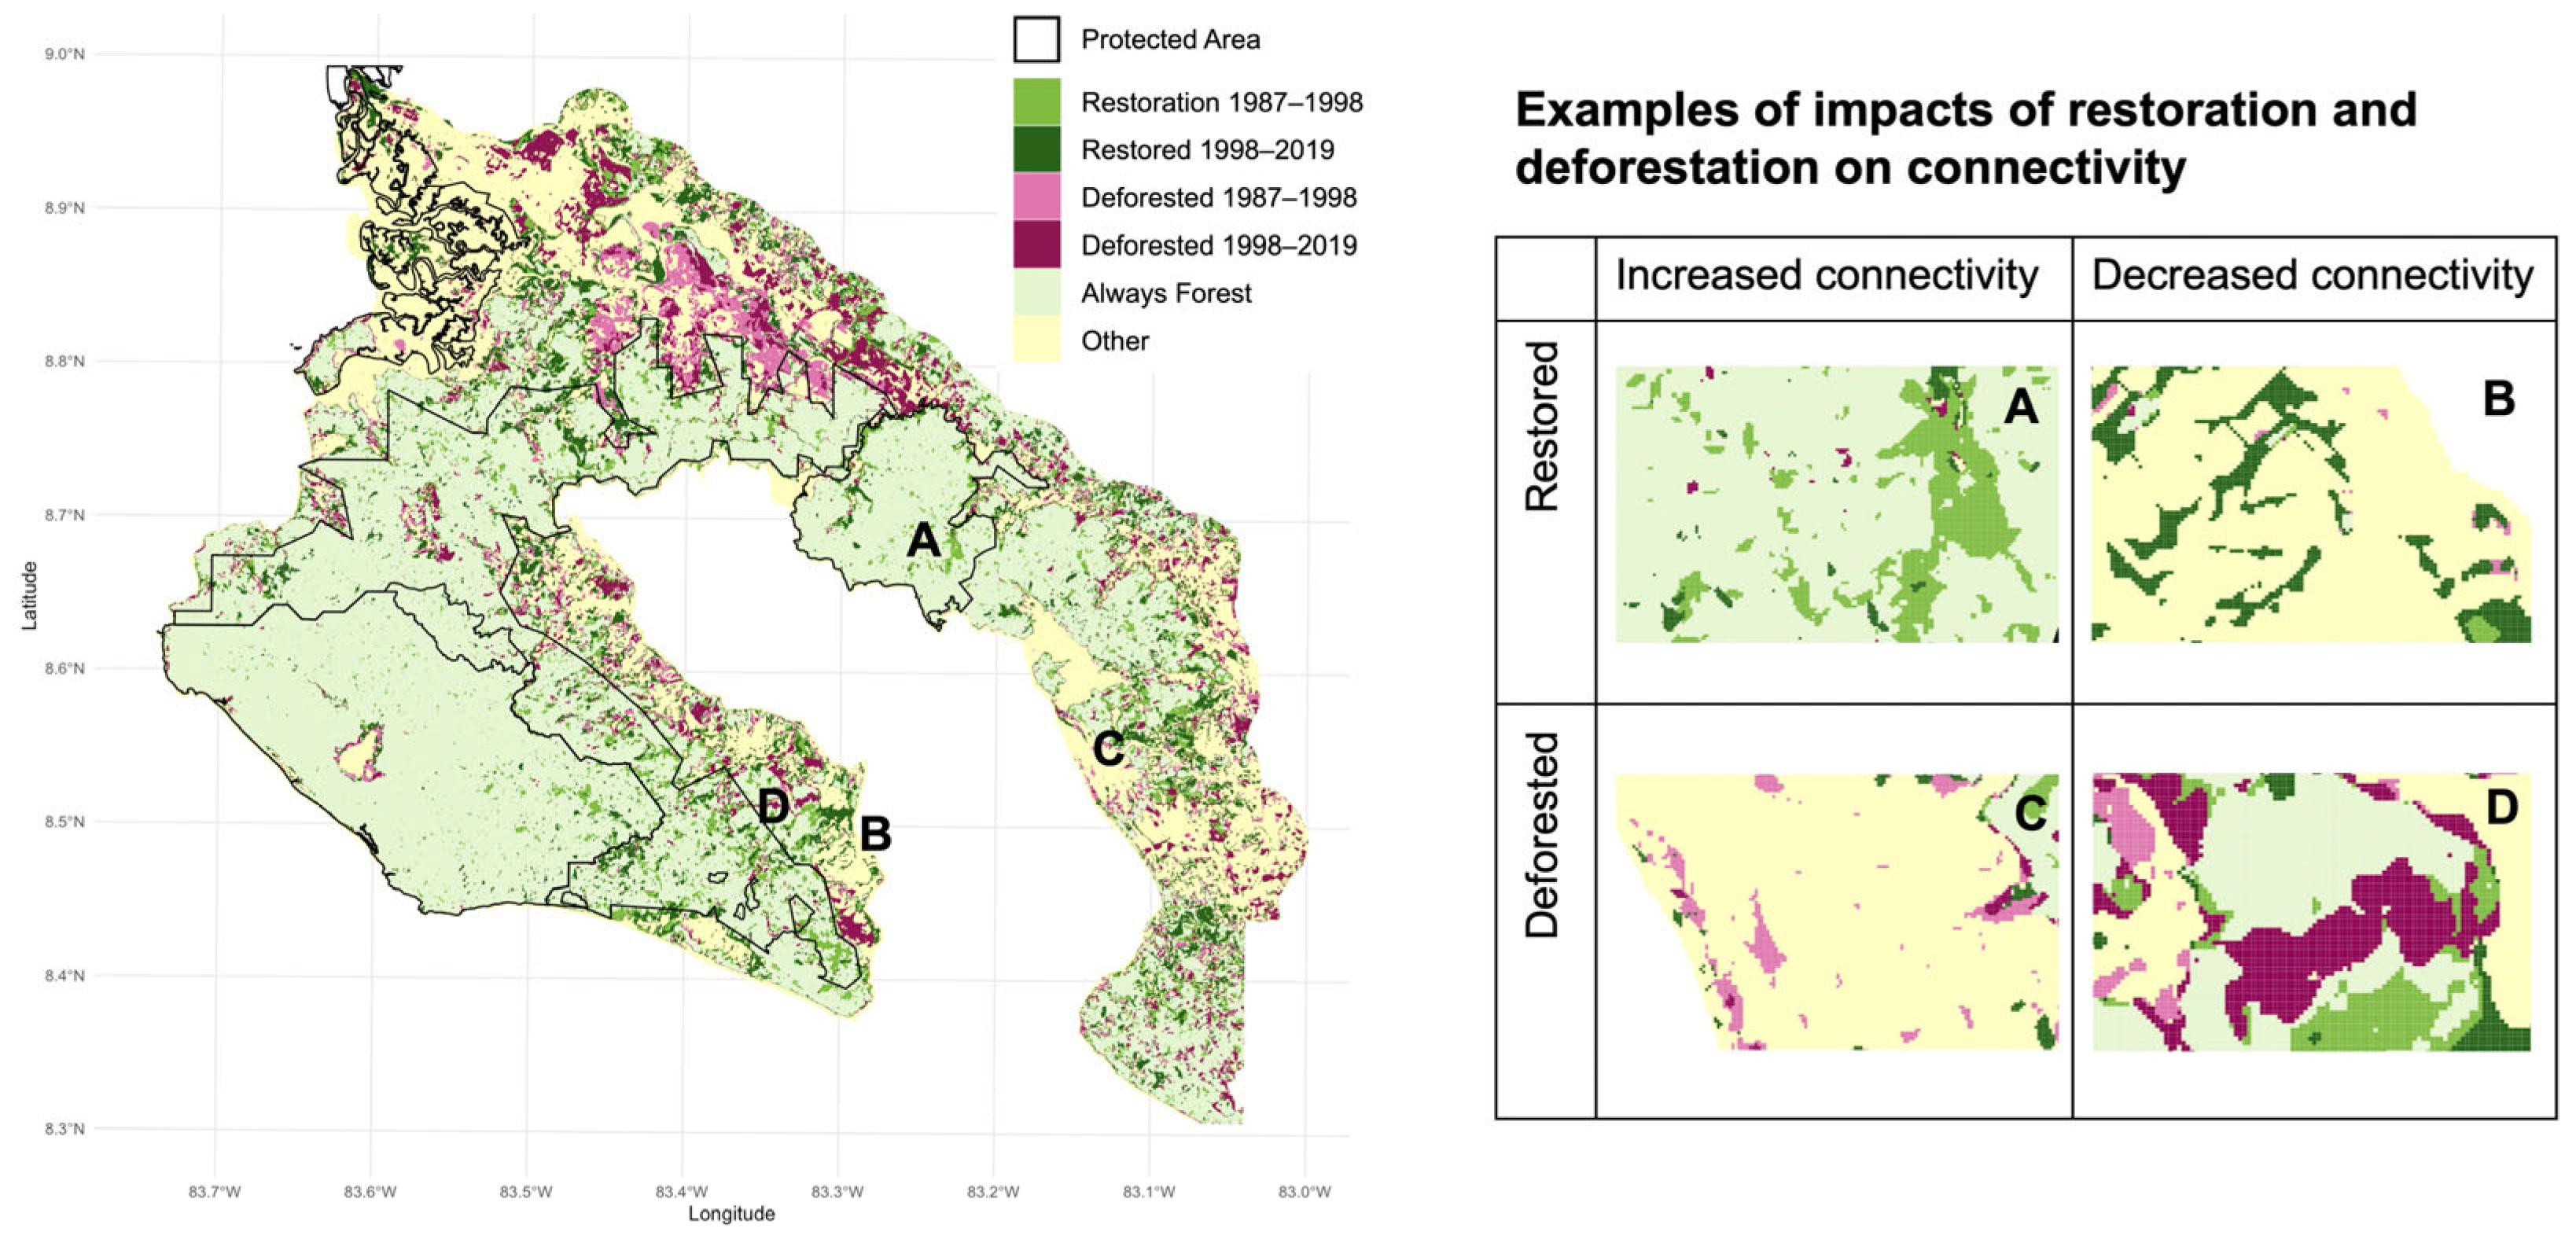
4.5. Connectivity Increased across the Region, with PAs Having Higher Connectivity Than Non-PAs

Landscape metrics indicate that connectivity increased in the region overall, which may have increased the region’s ability to support wildlife populations. Forest Area, Aggregation, and Core Area increased across the region, and Patch Number and Density, Edge Density, and the Landscape Shape Index decreased, suggesting that forest patches tended to be larger, rounder, less curvy, and more aggregated with more core area in 2019 than 1987. Consequently, the larger forest patches with less edge effect may have increased ACOSA’s ability to support a higher diversity of plants and wildlife since they can provide habitat for species that prefer forest edges and interiors, as well as support connectivity for mobile and terrestrial wildlife [14,16,73,74,75]. Additionally, Reid et al. (2018) noted that in southern Costa Rica, larger secondary forest patches exhibited greater longevity compared to smaller ones [76]. Given the observed increase in forest patch size in the Osa Peninsula, it is plausible that they may persist longer, potentially leading to a further reduction in deforestation rates in the future.
A recent study from the region found that Osa’s landscape has become more conducive to sustaining vertebrate communities compared with data from the early 1990’s and that many species’ populations are recovering [77]. The increase in vertebrate abundance from the 1990’s to 2018 aligns with the increasing forest cover and structural connectivity in the region we found over a similar time period. This finding suggests that functional connectivity may have increased in the region in addition to forest cover and structural connectivity, supporting vertebrate populations and other wildlife.
Landscape metrics also indicate that PAs, especially those with higher restrictions (i.e., NPs), had higher structural connectivity than non-PAs. Landscape Shape Index, Landscape Division Index, Patch Density, and Number of Patches are lower in PAs than non-PAs (with lower values generally in NPs than the forest reserve), and the Aggregation Index and Core Area Percent of Landscape are higher in PAs than non-PAs (with higher values generally in NPs than in forest reserves). Additionally, the Osa Peninsula also had higher connectivity than the ACOSA region overall, likely because the Osa Peninsula has higher forest cover and the oldest and largest NP (Corcovado). These metrics may indicate that forest protection through PAs has resulted in less fragmented and complex (i.e., edges are less convoluted) forest patches that are more clumped and in improved connectivity between patches. Consequently, PAs may better facilitate critical habitat requirements for both organisms and ecological processes than non-PAs, especially species that prefer forest interiors [12,75,78]. In areas outside of PAs where restoring and conserving forests may conflict with other management objectives (i.e., agricultural production or urbanization), matrices that also help support connectivity (i.e., teak/gmelina, palm, or agroforestry plantations over cattle pasture) may be preferentially selected [6,79].

4.6. Non-PAs Saw Increasing Forest Cover yet Slightly Decreasing Connectivity 1998–2019

Landscape metrics indicate that PAs saw increasing connectivity throughout the study period. Conversely, landscape metrics indicate that non-PAs experienced a similarly large increase in connectivity before the 1996 Forest Law, and then a small decrease in connectivity after the law’s implementation, despite an increase in forest class area across in the whole study period. Both PAs and non-PAs saw a decrease in the Number of Patches, Patch Density, Edge Density, and Landscape Shape Index and an increase in the Aggregation Index from 1987 to 1998. However, from 1998 to 2019, these trends continued in the PAs but many reversed in non-PAs. These metrics suggest that after the Forest Law was implemented, forests in non-PAs were divided into more small patches, had a larger edge effect, patch edges were more convoluted, and forest patches were less aggregate—factors that are generally detrimental to ecosystem functioning [8,13,80].
Given that forest cover and connectivity are often positively correlated [16,17], it might be expected that connectivity would increase throughout the study period in both study areas since forest cover increases. The increase in connectivity metrics throughout the study period in PAs suggests that new forests generated in PAs were coalescent to and connecting existing forest fragments (Figure 4). Deforestation in PAs is likely centered around smaller and more isolated forest fragments, which have been found to be more likely to vanish than larger fragments, likely also contributing to the increased connectivity [73]. Non-PAs likely experienced similar phenomena between 1987 and 1998, since connectivity and forest cover also increased in non-PAs in that time frame. While forest cover also increased in non-PAs between 1998 and 2019, the decrease in connectivity metrics 1998–2019 suggest that much of the regenerated forest created new, small patches and irregular patch shapes. Moreover, deforestation during this time period, although minimal, likely facilitated fragmentation. This finding suggests that the Forest Law, ecotourism, pastureland abandonment due to the international beef price drop, and other factors that were prevalent between 1998 and 2019 may have incentivized forest regeneration in new areas that did not already have intact forest, while in the 1987–1998 period, forests in the non-PAs dominantly regenerated adjacent to areas that were already forested.
These findings highlight the importance of analyzing connectivity metrics, as increasing forest cover does not necessarily indicate increasing connectivity (Figure 4). Considering the importance of connectivity and intact forest patches for biodiversity and ecosystem services, targeted spatial planning, policies, and PES systems could focus on encouraging forest regeneration adjacent to and connecting intact forest patches, especially in non-PAs and PAs with lower protection statuses (ex. forest reserves). One initiative aiming to promote connectivity by conserving and restoring non-PAs is Costa Rica’s extensive network of 44 biological corridors, extending 38% of the nation’s land [74]. The efficacy of the corridors to improve connectivity is mixed [74]. More comprehensive master planning and ecological restoration initiatives are needed.

4.7. Forest Cover Increased in Properties Receiving Payments for Ecosystem Services

Areas receiving PES from FONAFIFO saw an increase in forest cover and decrease in grassland, urban areas, and oil palm (Figure 6M). These findings suggest that PES may have played a role in facilitating the conservation of natural LULC in these areas. Recent studies in other areas of Costa Rica have also found PES to be effective at decreasing deforestation and increasing reforestation and that the LULC changes remained intact after payment ended [81,82,83,84]. It is important to note that areas analyzed receiving PES from FONAFIFO had higher forest cover than the region on average prior to the establishment of FONAFIFO, so it is possible that farms participating in the program are self-selecting for those already engaging with forest conservation, restoration, or agricultural abandonment. Other studies in Costa Rica that used matching methods to account for the non-random distribution of farms participating in PES still found that PES had a positive conservation impact, suggesting that PES in ACOSA likely also contributed to additionality [82,83]. While PES may lead to conservation and other benefits, access to these programs is not equitable; landowners that participate in national PES initiatives tend to have higher incomes and larger properties than those who do not participate, which could be due to the costs and organizational capabilities needed to register for FONAFIFO payments [81]. Tailoring local PES programs to address the specific needs of individual communities may enhance their efficacy, by better including lower-income individuals who own smaller, sparsely forested farms, thereby augmenting both inclusivity and additionality [81].

4.8. Riparian Zones Had Low Forest Cover but Saw Larger Increases over the Study Period

Riparian zones are both highly desirable for agriculture and human settlement as well as environmentally important for aquatic and terrestrial ecosystems [37,84]. Even narrow riparian forest buffers can have a large impact on water quality [84]. Consequently, riparian forests receive special protection in the Costa Rican Forestry and Water Laws. However, deforestation rates have been found to be higher near rivers in other regions [85]. We found that riparian zones on the Osa Peninsula had less forest cover than the region on average, even where rivers passed through PAs, due to high riparian deforestation prior to the study period. While the overall percentage of forest cover was lower, riparian zones saw a higher percent increase in forest cover than the region as a whole (both riparian zones in PAs and not) from 1987 to 2019. Little deforestation occurred in riparian zones, aligning with the finding of Reid et al. (2018) that secondary forest patches persisted longer if they were close to rivers, potentially due to the Costa Rican Forestry and Water Laws [76]. Many riparian zones that had previously been deforested for grassland converted to other agricultural classes (oil palm and teak/gmelina) during the study period. While the Forestry and Water Laws prohibit riparian deforestation, they do not explicitly provide a legal incentive for riparian reforestation. These policies could be improved by encouraging reforestation and working with producers on watershed-level riparian conservation efforts.

4.9. Roadsides Saw the Largest Increase in Forest Cover

In many regions, most deforestation is found near roads, with almost 95% of Amazonian deforestation occurring within 5.5 km of roads or 1 km of rivers [85]. Forest gaps due to roads can lead to landscape fragmentation and edge effects [86]. In the Osa region, roadsides saw the largest increase in forest cover of all types of areas analyzed. While roadsides had slightly less forest cover than non-PAs in 1987, they increased forest cover more than non-PAs over the course of the study period. Roads saw a 33.28% increase in forest cover in 2019 over 1987, while non-PAs overall saw a 12.40% increase. The increasing forest cover along roads is driven by grassland–forest and urban/exposed–forest land use transitions. Teak/gmelina and palm plantations were also found to increase along roadsides, likely due to agricultural shifts in the region toward these plantations. While forest cover increased near roads overall, land along the Inter-American highway saw high concentrations of deforestation during both study periods (Figure 4), suggesting highways may have a more negative impact on forest cover than smaller paved and gravel roads. It is also important to note that roads can have many other negative impacts on tropical ecosystems beyond deforestation, including roadkill, transportation of miners and hunters, chemical and nutrient pollution, barriers to wildlife movement, and exotic species invasions [86]. In addition to continuing to increase forest cover near roads, efforts should be made to reduce the negative impacts of roads [86]. Additionally, towns and communities have more developed areas around them than the whole region on average, especially “main towns”, likely a consequence of the increasing human population in the region.

4.10. Study Limitations and Further Research

This paper analyzes LULC for three years over the time period 1987–2019. Due to the low spatial resolution of satellite imagery prior to the mid-1980s, no images were included prior to this date. The highest deforestation rates in the region were seen prior to 1987 [21,28], so it is likely that the study region had lower forest cover prior to the study period. It is also possible that nonlinear LULC trends occurred between 1987 and 1998 and between 1998 and 2019. Although we detected small rates (0.23% annual average) of mature forest loss throughout the time period, we cannot be certain as to whether this small number relates to misclassification limits, represents ongoing minor degradation of mature forest to secondary, or simply natural turnover rates (dieback) of mature forest areas over time. No matter which, the rates of loss are low. Future studies could include a higher temporal resolution, such as annual LULC maps, as well as higher spatial resolution imagery from private satellites such as Planet, especially in focal study areas.
It is important to note that leafy agricultural LULC classes, such as teak/gmelina or oil palm, could be confused with native vegetation when relying on NDVI/EVI metrics. Since it is possible to lose nuance when attempting to use NDVI/EVI maps as a proxy for LULC maps, LULC maps can be valuable tools when available.
It is difficult to establish causal links between LULC changes in this study and any individual management intervention, given that the establishment of PAs, PES, the Forest Law, increase in ecotourism, economic market shifts, and environmental ethic changes all occurred around the same time period and, in some cases, prior to the beginning of our time series of LULC maps [21,27,63]. Regardless of the specific causal mechanism, the suite of approaches that Costa Rica is taking seems to be increasing forest cover; the Osa Peninsula and Costa Rica more broadly have managed to increase their forest cover in recent decades, and biodiversity is responding to the increased habitat integrity and continuity [25,36,77]. Furthermore, the absence of causal inference techniques in the present analysis precludes the precise determination of the treatment effects of PAs, PES, the Forest Law, and other factors. Prior research conducted in Costa Rica, which employed matching techniques, has established that PAs and PES contribute to reductions in deforestation and increases in reforestation [70,71,72,82,83]. Given that our analysis of LULC trends aligns with these findings, it can be postulated that a causal investigation utilizing the maps and data generated in this project would likely corroborate that PAs and PES reduce deforestation while promoting reforestation.

5. Conclusions

In contrast to many tropical regions, the Osa Peninsula and the ACOSA region have demonstrated a notable increase in forest cover and connectivity both within and outside of PAs over the past three decades, indicative of minimal deforestation encroachment and local leakage. The increasing forest cover and connectivity and decreasing agricultural land area may have contributed to the increasing vertebrate abundance observed in the region over a similar period. Forest cover also increased in farms receiving PES payments from FONAFIFO. The 1996 Forest Law, which imposed a deforestation ban, may have contributed to reduced rates of forest conversion to anthropogenic land uses in the region. The Forest Law likely did not facilitate an increase in reforestation across the region outside of areas getting PES payments, underscoring the need for policies that actively encourage large-scale restoration and inclusivity. Interestingly, the law may have facilitated a shift in the location of forest restoration outside of PAs, leading to the emergence of new forest patches in areas previously devoid of forest cover. This finding suggests that an increase in forest cover does not invariably correlate with an enhancement in landscape connectivity, as evidenced by a small decrease in connectivity outside of PAs from 1998 to 2019, despite an overall increase in forested area. The spatial arrangement of the increasing forest cover may influence the ecosystem’s capacity to support biodiversity populations and resilience to climate change and other perturbations. To ensure the provision of habitats and to facilitate wildlife movement across the broader landscape, there is a need for strategic policies, PES programs, and monitoring systems that prioritize the conservation and restoration of large, interconnected forest patches both within and outside PAs.

Author Contributions

Conceptualization, H.B.; methodology, H.B., M.G.B., S.F., H.M., M.M., S.N., and E.P.; validation, H.B., S.F., and A.W.; formal analysis, H.B., M.G.B., S.F., H.M., M.J.M.Q., M.M., S.N., and E.P.; investigation, H.B., M.G.B., S.F., H.M., M.J.M.Q., M.M., S.N., and E.P.; resources, M.M., and A.W.; data curation, S.F. and H.M.; writing—original draft preparation, H.B., M.G.B., S.F., H.M., M.J.M.Q., M.M., S.N., and E.P.; writing—review and editing, H.B., M.G.B., S.F., H.M., M.J.M.Q., M.M., S.N., E.P., and A.W.; visualization, H.B., H.M., and S.N.; supervision, M.M. and A.W.; project administration, H.B. and M.M.; funding acquisition, H.B., M.M., and A.W. All authors have read and agreed to the published version of the manuscript.

Funding

This material is based upon work supported by NASA through contract NNL16AA05C. Any opinions, findings, and conclusions or recommendations expressed in this material are those of the author(s) and do not necessarily reflect the views of the National Aeronautics and Space Administration. HB acknowledges the support of the US Department of Agriculture (USDA) and the National Institute of Food and Agriculture (NIFA) (Award number: 2020-38420-30727).

Data Availability Statement

The LULC maps for 1987, 1998, and 2019 are available for download at https://figshare.com/articles/dataset/Osa_Peninsula_LULC_Maps_1987_1998_2019/19337912 (accessed on 6 February 2024).

Acknowledgments

The authors would like to thank the NASA DEVELOP National Program Osa Peninsula Water Resources I-III teams and the Georgia node hosted at the Center for Geospatial Resources, Department of Geography, University of Georgia. We are thankful to Osa Conservation’s staff, visitors, and volunteers for their support. We are grateful to Taufiq Rashid and Claire Bouffard for their contributions and to Rodolfo Dirzo, Amanda Clayton, Kenton Ross, two anonymous reviewers, and members of the Dee Lab and GIRAFFES Lab at the University of Colorado Boulder for their feedback on the manuscript. Thank you to the Bobolink Foundation, Gordon and Betty Moore Foundation, Moore Family Foundation, the International Conservation Fund of Canada, Fondation Franklinia, KEEN Effect, and the Troper Wojcicki Foundation for supporting HB, AW, MJM, and conservation on the Osa Peninsula.

Conflicts of Interest

Author E. P. was employed by The Climate Service, which was acquired by S&P Global Sustainable1. The remaining authors declare that the research was conducted in the absence of any commercial or financial relationships that could be construed as a potential conflict of interest.

Appendix A

Table A1. LULC map accuracy validation by LULC class.
LULC ClassQuantityAccurate CountProducer’s Accuracy
Palm735778.08%
Mangrove878091.95%
Water565292.86%
Grassland664568.18%
Exposed/urban504182.00%
Mature forest1127365.18%
Secondary forest16610362.05%
Wetland676597.01%
Teak/gmelina665684.85%
Grand Total74357276.99%
Table A2. LULC map accuracy validation by land use class, with mature and secondary forest combined.
LULC ClassQuantityAccurate CountProducer’s Accuracy
Palm735778.08%
Mangrove878091.95%
Water565292.86%
Grassland664568.18%
Exposed/urban504182.00%
Forest27827699.28%
Wetland676597.01%
Teak/gmelina665684.85%
Grand Total74367290.44%
Table A3. Confusion matrix and user’s and producer’s accuracy, with mature and secondary forest separately. Gray cells indicate points that were correctly classified based on ground truth points. Orange cells highlight frequent misclassifications.
LULC MAP (PREDICTED)
PalmMangroveWaterGrasslandExposed/UrbanOld Growth ForestSecondary ForestWetlandTeak/GmelinaSUMPRODUCER’S ACCURACY
VERIFICATION POINTS (ACTUAL)Palm570012112007378.08%
Mangrove08040001208791.95%
Water11520001105692.86%
Grassland400452015006668.18%
Exposed/urban00094100005082.00%
Old growth forest0000073390011265.18%
Secondary forest10001611030016662.05%
Wetland01000016506797.01%
Teak/gmelina40010050566684.85%
SUM67825656461351776856
USER’S ACCURACY85.07%97.56%92.86%80.36%89.13%54.07%58.19%95.59%100.00%
Table A4. Confusion matrix and user’s and producer’s accuracy, with mature and secondary forest combined. Gray cells indicate points that were correctly classified based on ground truth points. Orange cells highlight frequent misclassifications.
LULC MAP (PREDICTED)
PalmMangroveWaterGrasslandExposed/UrbanForestWetlandTeak/gmelinaSUMPRODUCER’S ACCURACY
VERIFICATION POINTS (ACTUAL)Palm57001213007378.08%
Mangrove0804001208791.95%
Water1152001105692.86%
Grassland40045215006668.18%
Exposed/urban0009410005082.00%
Forest0000027600276100.00%
Wetland0100016506797.01%
Teak/gmelina4001050566684.85%
SUM66825656453126856
USER’S ACCURACY86.36%97.56%92.86%80.36%91.11%88.46%95.59%100.00%
Figure A1. LULC breakdown in buffer around (a) small towns, and (b) main towns.
Remotesensing 16 01088 g0a1
Figure A2. EVI for 1987, 1998, and 2019 for the entire study region.
Remotesensing 16 01088 g0a2
Figure A3. EVI showing change from 1987 to 2019 (left) and 1998 to 2019 (right).
Remotesensing 16 01088 g0a3
Figure A4. NDVI for 1987, 1998, and 2019 for the entire study area.
Remotesensing 16 01088 g0a4
Figure A5. NDVI changes for 1987 to 2019 (left) and 1998 to 2019 (right).
Remotesensing 16 01088 g0a5
Figure A6. EVI2 trends in PAs and the study region overall.
Remotesensing 16 01088 g0a6

References

  1. Tilman, D.; Clark, M.; Williams, D.R.; Kimmel, K.; Polasky, S.; Packer, C. Future Threats to Biodiversity and Pathways to Their Prevention. Nature 2017, 546, 73–81. [Google Scholar] [CrossRef] [PubMed]
  2. Jones, K.R.; Venter, O.; Fuller, R.A.; Allan, J.R.; Maxwell, S.L.; Negret, P.J.; Watson, J.E.M. One-Third of Global Protected Land Is under Intense Human Pressure. Science 2018, 360, 788–791. [Google Scholar] [CrossRef] [PubMed]
  3. Dinerstein, E.; Vynne, C.; Sala, E.; Joshi, A.R.; Fernando, S.; Lovejoy, T.E.; Mayorga, J.; Olson, D.; Asner, G.P.; Baillie, J.E.M.; et al. A Global Deal for Nature: Guiding Principles, Milestones, and Targets. Sci. Adv. 2019, 5, eaaw2869. [Google Scholar] [CrossRef] [PubMed]
  4. Laurance, W.F.; Carolina Useche, D.; Rendeiro, J.; Kalka, M.; Bradshaw, C.J.A.; Sloan, S.P.; Laurance, S.G.; Campbell, M.; Abernethy, K.; Alvarez, P.; et al. Averting Biodiversity Collapse in Tropical Forest Protected Areas. Nature 2012, 489, 290–294. [Google Scholar] [CrossRef] [PubMed]
  5. Wolf, C.; Levi, T.; Ripple, W.J.; Zárrate-Charry, D.A.; Betts, M.G. A Forest Loss Report Card for the World’s Protected Areas. Nat. Ecol. Evol. 2021, 5, 520–529. [Google Scholar] [CrossRef]
  6. Taylor, P.D.; Fahrig, L.; With, K.A. Landscape Connectivity: A Return to the Basics. In Connectivity Conservation; Crooks, K.R., Sanjayan, M., Eds.; Cambridge University Press: Cambridge, UK, 2006; pp. 29–43. ISBN 978-0-521-85706-2. [Google Scholar]
  7. Ford, S.A.; Jepsen, M.R.; Kingston, N.; Lewis, E.; Brooks, T.M.; MacSharry, B.; Mertz, O. Deforestation Leakage Undermines Conservation Value of Tropical and Subtropical Forest Protected Areas. Glob. Ecol. Biogeogr. 2020, 29, 2014–2024. [Google Scholar] [CrossRef]
  8. Rayfield, B.; Pelletier, D.; Dumitru, M.; Cardille, J.A.; Gonzalez, A. Multipurpose Habitat Networks for Short-Range and Long-Range Connectivity: A New Method Combining Graph and Circuit Connectivity. Methods Ecol. Evol. 2016, 7, 222–231. [Google Scholar] [CrossRef]
  9. Allen, K.E.; Padgett Vásquez, S. Forest Cover, Development, and Sustainability in Costa Rica: Can One Policy Fit All? Land Use Policy 2017, 67, 212–221. [Google Scholar] [CrossRef]
  10. Le Coq, J.-F.; Froger, G.; Pesche, D.; Legrand, T.; Saenz, F. Understanding the Governance of the Payment for Environmental Services Programme in Costa Rica: A Policy Process Perspective. Ecosyst. Serv. 2015, 16, 253–265. [Google Scholar] [CrossRef]
  11. Ward, M.; Saura, S.; Williams, B.; Ramírez-Delgado, J.P.; Arafeh-Dalmau, N.; Allan, J.R.; Venter, O.; Dubois, G.; Watson, J.E.M. Just Ten Percent of the Global Terrestrial Protected Area Network Is Structurally Connected via Intact Land. Nat. Commun. 2020, 11, 4563. [Google Scholar] [CrossRef]
  12. McGarigal, K.; Marks, B.J. FRAGSTATS: Spatial Pattern Analysis Program for Quantifying Landscape Structure; Gen Tech Rep PNW-GTR-351; U.S. Department of Agriculture, Forest Service, Pacific Northwest Research Station: Portland, OR, USA, 1995; 122p. [CrossRef]
  13. Senior, R.A.; Hill, J.K.; Edwards, D.P. Global Loss of Climate Connectivity in Tropical Forests. Nat. Clim. Chang. 2019, 9, 623–626. [Google Scholar] [CrossRef]
  14. Fahrig, L. Effects of Habitat Fragmentation on Biodiversity. Annu. Rev. Ecol. Evol. Syst. 2003, 34, 487–515. [Google Scholar] [CrossRef]
  15. Hansen, M.C.; Wang, L.; Song, X.-P.; Tyukavina, A.; Turubanova, S.; Potapov, P.V.; Stehman, S.V. The Fate of Tropical Forest Fragments. Sci. Adv. 2020, 6, eaax8574. [Google Scholar] [CrossRef]
  16. Martinez Pardo, J.; Saura, S.; Insaurralde, A.; Di Bitetti, M.S.; Paviolo, A.; De Angelo, C. Much More than Forest Loss: Four Decades of Habitat Connectivity Decline for Atlantic Forest Jaguars. Landsc. Ecol. 2023, 38, 41–57. [Google Scholar] [CrossRef]
  17. Rueda, X.; Thomas, N.E.; Lambin, E.F. Eco-Certification and Coffee Cultivation Enhance Tree Cover and Forest Connectivity in the Colombian Coffee Landscapes. Reg. Environ. Chang. 2015, 15, 25–33. [Google Scholar] [CrossRef]
  18. Li, L.; Gou, M.; Wang, N.; La, L.; Liu, C. Do Ecological Restoration Programs Reduce Forest Fragmentation? Case Study of the Three Gorges Reservoir Area, China. Ecol. Eng. 2021, 172, 106410. [Google Scholar] [CrossRef]
  19. Navarro-Cerrillo, R.M.; Rivas, C.A.; Quinto, L.; Navarro, S.H.; Varo-Martínez, M.Á.; Palacios-Rodríguez, P. Afforestation on Agricultural Land in Southern Spain: An Important Driver to Improve Forest Landscape Connectivity. New For. 2023, 54, 1061–1084. [Google Scholar] [CrossRef]
  20. Palmero-Iniesta, M.; Espelta, J.M.; Gordillo, J.; Pino, J. Changes in Forest Landscape Patterns Resulting from Recent Afforestation in Europe (1990–2012): Defragmentation of Pre-Existing Forest versus New Patch Proliferation. Ann. For. Sci. 2020, 77, 1–15. [Google Scholar] [CrossRef]
  21. Bray, D.B. Forest Cover Dynamics and Forest Transitions in Mexico and Central America: Towards a “Great Restoration”? In Reforesting Landscapes: Linking Pattern and Process; Nagendra, H., Southworth, J., Eds.; Landscape Series; Springer: Dordrecht, The Netherlands, 2010; pp. 85–120. ISBN 978-1-4020-9656-3. [Google Scholar]
  22. Pagiola, S. Payments for Environmental Services in Costa Rica. Ecol. Econ. 2008, 65, 712–724. [Google Scholar] [CrossRef]
  23. The Earthshot Prize: Republic of Costa Rica. Available online: https://earthshotprize.org/winners-finalists/costa-rica/ (accessed on 18 July 2023).
  24. Tafoya, K.A.; Brondizio, E.S.; Johnson, C.E.; Beck, P.; Wallace, M.; Quirós, R.; Wasserman, M.D. Effectiveness of Costa Rica’s Conservation Portfolio to Lower Deforestation, Protect Primates, and Increase Community Participation. Front. Environ. Sci. 2020, 8, 580724. [Google Scholar] [CrossRef]
  25. Forest Area (% of Land Area)—Costa Rica. Available online: https://data.worldbank.org/indicator/AG.LND.FRST.ZS?locations=CR (accessed on 19 July 2023).
  26. Hunt, C.A.; Durham, W.H.; Driscoll, L.; Honey, M. Can Ecotourism Deliver Real Economic, Social, and Environmental Benefits? A Study of the Osa Peninsula, Costa Rica. J. Sustain. Tour. 2015, 23, 339–357. [Google Scholar] [CrossRef]
  27. Zambrano, A.M.A.; Broadbent, E.N.; Durham, W.H. Social and Environmental Effects of Ecotourism in the Osa Peninsula of Costa Rica: The Lapa Rios Case. J. Ecotourism 2010, 9, 62–83. [Google Scholar] [CrossRef]
  28. Sanchez-Azofeifa, G.A.; Rivard, B.; Calvo, J.; Moorthy, I. Dynamics of Tropical Deforestation Around National Parks: Remote Sensing of Forest Change on the Osa Peninsula of Costa Rica. Mt. Res. Dev. 2002, 22, 352–358. [Google Scholar] [CrossRef]
  29. Fernandez-Vega, J.; Covey, K.R.; Ashton, M.S. Tamm Review: Large-Scale Infrequent Disturbances and Their Role in Regenerating Shade-Intolerant Tree Species in Mesoamerican Rainforests: Implications for Sustainable Forest Management. For. Ecol. Manag. 2017, 395, 48–68. [Google Scholar] [CrossRef]
  30. Friedlander, A.M.; Ballesteros, E.; Breedy, O.; Naranjo-Elizondo, B.; Hernández, N.; Salinas-de-León, P.; Sala, E.; Cortés, J. Nearshore Marine Biodiversity of Osa Peninsula, Costa Rica: Where the Ocean Meets the Rainforest. PLoS ONE 2022, 17, e0271731. [Google Scholar] [CrossRef] [PubMed]
  31. Holdridge, L.R. Life Zone Ecology; Tropical Science Center: San Jose, Costa Rica, 1967; Available online: https://search.worldcat.org/title/life-zone-ecology/oclc/625212 (accessed on 6 February 2024).
  32. Buchs, D.M.; Baumgartner, P.O.; Baumgartner-Mora, C.; Bandini, A.N.; Jackett, S.-J.; Diserens, M.-O.; Stucki, J. Late Cretaceous to Miocene Seamount Accretion and Mélange Formation in the Osa and Burica Peninsulas (Southern Costa Rica): Episodic Growth of a Convergent Margin. In The Origin and Evolution of the Caribbean Plate; James, K.H., Lorente, M.A., Pindell, J.L., Eds.; Geological Society of London: London, UK, 2009; Volume 328, ISBN 978-1-86239-288-5. [Google Scholar]
  33. Taylor, P.; Asner, G.; Dahlin, K.; Anderson, C.; Knapp, D.; Martin, R.; Mascaro, J.; Chazdon, R.; Cole, R.; Wanek, W.; et al. Landscape-Scale Controls on Aboveground Forest Carbon Stocks on the Osa Peninsula, Costa Rica. PLoS ONE 2015, 10, e0126748. [Google Scholar] [CrossRef]
  34. Ley 7575. Available online: http://www.pgrweb.go.cr/scij/Busqueda/Normativa/Normas/nrm_texto_completo.aspx?nValor1=1&nValor2=41661 (accessed on 19 July 2023).
  35. Huarcaya, R.P.; Morales, M.L.; Álvarez-Alcázar, L.; Whitworth, A. The First Ex-Situ Germination and Dispersal Mechanisms of the Rare, Critically Endangered Tree, Pleodendron Costaricense. Trop. Conserv. Sci. 2022, 15, 1–12. [Google Scholar] [CrossRef]
  36. Lopez Gutierrez, B.; Almeyda Zambrano, A.M.; Mulder, G.; Ols, C.; Dirzo, R.; Almeyda Zambrano, S.L.; Quispe Gil, C.A.; Cruz Díaz, J.C.; Alvarez, D.; Valdelomar Leon, V.; et al. Ecotourism: The ‘Human Shield’ for Wildlife Conservation in the Osa Peninsula, Costa Rica. J. Ecotourism 2020, 19, 197–216. [Google Scholar] [CrossRef]
  37. Lorion, C.M.; Kennedy, B.P. Riparian Forest Buffers Mitigate the Effects of Deforestation on Fish Assemblages in Tropical Headwater Streams. Ecol. Appl. 2009, 19, 468–479. [Google Scholar] [CrossRef]
  38. Sánchez-Azofeifa, G.A.; Harriss, R.C.; Skole, D.L. Deforestation in Costa Rica: A Quantitative Analysis Using Remote Sensing Imagery1. Biotropica 2001, 33, 378–384. [Google Scholar] [CrossRef]
  39. Roy, D.P.; Kovalskyy, V.; Zhang, H.K.; Vermote, E.F.; Yan, L.; Kumar, S.S.; Egorov, A. Characterization of Landsat-7 to Landsat-8 Reflective Wavelength and Normalized Difference Vegetation Index Continuity. Remote Sens. Environ. 2016, 185, 57–70. [Google Scholar] [CrossRef] [PubMed]
  40. Rouse, J.W.; Haas, R.H.; Schell, J.A.; Deering, D.W. Monitoring Vegetation Systems in the Great Plains with ERTS; NTRS—NASA Technical Reports Server. 1974. Available online: https://ntrs.nasa.gov/citations/19740022614 (accessed on 6 February 2024).
  41. Huete, A.; Justice, C.; van Leeuwen, W. MODIS Vegetation Index: Algorithm Theoretical Basis Document; 1999. Available online: https://modis.gsfc.nasa.gov/data/atbd/atbd_mod13.pdf (accessed on 6 February 2024).
  42. Jiang, Z.; Huete, A.R.; Didan, K.; Miura, T. Development of a Two-Band Enhanced Vegetation Index without a Blue Band. Remote Sens. Environ. 2008, 112, 3833–3845. [Google Scholar] [CrossRef]
  43. Cohen, J. A Coefficient of Agreement for Nominal Scales. Educ. Psychol. Meas. 1960, 20, 37–46. [Google Scholar] [CrossRef]
  44. Whitworth, A.; Beirne, C.; Rowe, J.; Ross, F.; Acton, C.; Burdekin, O.; Brown, P. The Response of Faunal Biodiversity to an Unmarked Road in the Western Amazon. Biodivers. Conserv. 2015, 24, 1657–1670. [Google Scholar] [CrossRef]
  45. Algeet-Abarquero, N.; Sánchez-Azofeifa, A.; Bonatti, J.; Marchamalo, M. Land Cover Dynamics in Osa Region, Costa Rica: Secondary Forest Is Here to Stay. Reg. Environ. Chang. 2015, 15, 1461–1472. [Google Scholar] [CrossRef]
  46. Frazier, A.E.; Kedron, P. Comparing Forest Fragmentation in Eastern U.S. Forests Using Patch-Mosaic and Gradient Surface Models. Ecol. Inform. 2017, 41, 108–115. [Google Scholar] [CrossRef]
  47. Kupfer, J.A. Landscape Ecology and Biogeography: Rethinking Landscape Metrics in a Post-FRAGSTATS Landscape. Prog. Phys. Geogr. Earth Environ. 2012, 36, 400–420. [Google Scholar] [CrossRef]
  48. Gustafson, E.J. How Has the State-of-the-Art for Quantification of Landscape Pattern Advanced in the Twenty-First Century? Landsc. Ecol. 2019, 34, 2065–2072. [Google Scholar] [CrossRef]
  49. Wu, J.; Levin, S.A. A Patch-Based Spatial Modeling Approach: Conceptual Framework and Simulation Scheme. Ecol. Model. 1997, 101, 325–346. [Google Scholar] [CrossRef]
  50. Turner, M.G. Landscape Ecology: What Is the State of the Science? Annu. Rev. Ecol. Evol. Syst. 2005, 36, 319–344. [Google Scholar] [CrossRef]
  51. Forman, R.T.T.; Godron, M. Landscape Ecology, 1st ed.; John Wiley & Sons: New York, NY, USA, 1986; ISBN 978-0-471-87037-1. [Google Scholar]
  52. Wang, Y.; Brandt, M.; Zhao, M.; Xing, K.; Wang, L.; Tong, X.; Xue, F.; Kang, M.; Jiang, Y.; Fensholt, R. Do Afforestation Projects Increase Core Forests? Evidence from the Chinese Loess Plateau. Ecol. Indic. 2020, 117, 106558. [Google Scholar] [CrossRef]
  53. Hesselbarth, M.H.K.; Sciaini, M.; With, K.A.; Wiegand, K.; Nowosad, J. Landscapemetrics: An Open-Source R Tool to Calculate Landscape Metrics. Ecography 2019, 42, 1648–1657. [Google Scholar] [CrossRef]
  54. Hijmans, R.J.; van Etten, J.; Sumner, M.; Cheng, J.; Baston, D.; Bevan, A.; Bivand, R.; Busetto, L.; Canty, M.; Fasoli, B.; et al. Raster: Geographic Data Analysis and Modeling 2023. Available online: https://cran.r-project.org/web/packages/raster/raster.pdf (accessed on 6 February 2024).
  55. McGarigal, K.; Cushman, S.; Ene, E. FRAGSTATS v4: Spatial Pattern Analysis Program for Categorical and Continuous Maps; University of Massachusetts: Amherst, MA, USA, 2012. [Google Scholar]
  56. Huete, A.R.; Liu, H.; van Leeuwen, W.J.D. The Use of Vegetation Indices in Forested Regions: Issues of Linearity and Saturation. In Proceedings of the IGARSS’97, 1997 IEEE International Geoscience and Remote Sensing Symposium Proceedings, Remote Sensing—A Scientific Vision for Sustainable Development, Singapore, 3–8 August 1997; Volume 4, pp. 1966–1968. [Google Scholar]
  57. Vancutsem, C.; Achard, F.; Pekel, J.-F.; Vieilledent, G.; Carboni, S.; Simonetti, D.; Gallego, J.; Aragão, L.E.O.C.; Nasi, R. Long-Term (1990–2019) Monitoring of Forest Cover Changes in the Humid Tropics. Sci. Adv. 2021, 7, eabe1603. [Google Scholar] [CrossRef]
  58. Arroyo-Rodríguez, V.; Fahrig, L.; Watling, J.I.; Nowakowski, J.; Tabarelli, M.; Tischendorf, L.; Melo, F.P.L.; Santos, B.A.; Benchimol, M.; Morante-Filho, J.C.; et al. Preserving 40% Forest Cover Is a Valuable and Well-Supported Conservation Guideline: Reply to Banks-Leite et Al. Ecol. Lett. 2021, 24, 1114–1116. [Google Scholar] [CrossRef] [PubMed]
  59. Berveglieri, A.; Imai, N.N.; Christovam, L.E.; Galo, M.L.B.T.; Tommaselli, A.M.G.; Honkavaara, E. Analysis of Trends and Changes in the Successional Trajectories of Tropical Forest Using the Landsat NDVI Time Series. Remote Sens. Appl. Soc. Environ. 2021, 24, 100622. [Google Scholar] [CrossRef]
  60. Piao, S.; Fang, J.; Zhu, B.; Tan, K. Forest Biomass Carbon Stocks in China over the Past 2 Decades: Estimation Based on Integrated Inventory and Satellite Data. J. Geophys. Res. Biogeosci. 2005, 110, 1–10. [Google Scholar] [CrossRef]
  61. Flatt, E.; Basto, A.; Pinto, C.; Ortiz, J.; Navarro, K.; Reed, N.; Brumberg, H.; Chaverri, M.H.; Whitworth, A. Arboreal Wildlife Bridges in the Tropical Rainforest of Costa Rica’s Osa Peninsula. Folia Primatol. 2022, 93, 419–435. [Google Scholar] [CrossRef]
  62. Newcombe, P.B.; Forsyth, A.; Brumberg, H.; Whitworth, A. Climate-Resilient Conservation Strategies for an Endemic Forest Bird, the Black-Cheeked Ant-Tanager. J. Field Ornithol. 2023, 94. [Google Scholar] [CrossRef]
  63. Arroyo-Mora, J.P.; Sánchez-Azofeifa, G.A.; Rivard, B.; Calvo, J.C.; Janzen, D.H. Dynamics in Landscape Structure and Composition for the Chorotega Region, Costa Rica from 1960 to 2000. Agric. Ecosyst. Environ. 2005, 106, 27–39. [Google Scholar] [CrossRef]
  64. Ritchie, H. Palm Oil. Our World Data. 2021. Available online: https://ourworldindata.org/palm-oil (accessed on 14 March 2024).
  65. Vijay, V.; Pimm, S.L.; Jenkins, C.N.; Smith, S.J. The Impacts of Oil Palm on Recent Deforestation and Biodiversity Loss. PLoS ONE 2016, 11, e0159668. [Google Scholar] [CrossRef]
  66. Kraenzel, M.; Castillo, A.; Moore, T.; Potvin, C. Carbon Storage of Harvest-Age Teak (Tectona Grandis) Plantations, Panama. For. Ecol. Manag. 2003, 173, 213–225. [Google Scholar] [CrossRef]
  67. Leiva, R.M.B.; Salas, A.C. Spatial Distribution of Mangrove Species and Their Association with the Substrate Sediment Types, Estuarine Sector Térraba-Sierpe National Wetlands, Costa Rica. Rev. Biol. Trop. 2015, 63, 47–60. [Google Scholar] [CrossRef]
  68. Geldmann, J.; Manica, A.; Burgess, N.D.; Coad, L.; Balmford, A. A Global-Level Assessment of the Effectiveness of Protected Areas at Resisting Anthropogenic Pressures. Proc. Natl. Acad. Sci. USA 2019, 116, 23209–23215. [Google Scholar] [CrossRef] [PubMed]
  69. Joppa, L.; Pfaff, A. Reassessing the Forest Impacts of Protection. Ann. N. Y. Acad. Sci. 2010, 1185, 135–149. [Google Scholar] [CrossRef] [PubMed]
  70. Andam, K.S.; Ferraro, P.J.; Pfaff, A.; Sanchez-Azofeifa, G.A.; Robalino, J.A. Measuring the Effectiveness of Protected Area Networks in Reducing Deforestation. Proc. Natl. Acad. Sci. USA 2008, 105, 16089–16094. [Google Scholar] [CrossRef]
  71. Andam, K.S.; Ferraro, P.J.; Hanauer, M.M. The Effects of Protected Area Systems on Ecosystem Restoration: A Quasi-Experimental Design to Estimate the Impact of Costa Rica’s Protected Area System on Forest Regrowth. Conserv. Lett. 2013, 6, 317–323. [Google Scholar] [CrossRef]
  72. Fagan, M.E.; DeFries, R.S.; Sesnie, S.E.; Arroyo, J.P.; Walker, W.; Soto, C.; Chazdon, R.L.; Sanchun, A. Land Cover Dynamics Following a Deforestation Ban in Northern Costa Rica. Environ. Res. Lett. 2013, 8, 034017. [Google Scholar] [CrossRef]
  73. Haddad, N.M.; Brudvig, L.A.; Clobert, J.; Davies, K.F.; Gonzalez, A.; Holt, R.D.; Lovejoy, T.E.; Sexton, J.O.; Austin, M.P.; Collins, C.D.; et al. Habitat Fragmentation and Its Lasting Impact on Earth’s Ecosystems. Sci. Adv. 2015, 1, e1500052. [Google Scholar] [CrossRef]
  74. Beita, C.M.; Murillo, L.F.S.; Alvarado, L.D.A. Ecological Corridors in Costa Rica: An Evaluation Applying Landscape Structure, Fragmentation-Connectivity Process, and Climate Adaptation. Conserv. Sci. Pract. 2021, 3, e475. [Google Scholar] [CrossRef]
  75. Temple, S.A.; Cary, J.R. Modeling Dynamics of Habitat-Interior Bird Populations in Fragmented Landscapes. Conserv. Biol. 1988, 2, 340–347. [Google Scholar] [CrossRef]
  76. Reid, J.L.; Fagan, M.E.; Lucas, J.; Slaughter, J.; Zahawi, R.A. The Ephemerality of Secondary Forests in Southern Costa Rica. Conserv. Lett. 2019, 12, e12607. [Google Scholar] [CrossRef]
  77. Vargas Soto, J.S.; Beirne, C.; Whitworth, A.; Cruz Diaz, J.C.; Flatt, E.; Pillco-Huarcaya, R.; Olson, E.R.; Azofeifa, A.; Saborío-R, G.; Salom-Pérez, R.; et al. Human Disturbance and Shifts in Vertebrate Community Composition in a Biodiversity Hotspot. Conserv. Biol. 2022, 36, e13813. [Google Scholar] [CrossRef]
  78. Hansen, A.; di Castri, F. (Eds.) Landscape Boundaries; Ecological Studies; Springer: New York, NY, USA, 1992; Volume 92, ISBN 978-1-4612-7677-7. [Google Scholar]
  79. Gilroy, J.J.; Prescott, G.W.; Cardenas, J.S.; Castañeda, P.G.D.P.; Sánchez, A.; Rojas-Murcia, L.E.; Medina Uribe, C.A.; Haugaasen, T.; Edwards, D.P. Minimizing the Biodiversity Impact of Neotropical Oil Palm Development. Glob. Chang. Biol. 2015, 21, 1531–1540. [Google Scholar] [CrossRef] [PubMed]
  80. Cushman, S.A.; McRae, B.; Adriaensen, F.; Beier, P.; Shirley, M.; Zeller, K. Biological Corridors and Connectivity. In Key Topics in Conservation Biology 2; John Wiley & Sons, Ltd.: Hoboken, NJ, USA, 2013; pp. 384–404. ISBN 978-1-118-52017-8. [Google Scholar]
  81. Brownson, K.; Anderson, E.P.; Ferreira, S.; Wenger, S.; Fowler, L.; German, L. Governance of Payments for Ecosystem Ecosystem Services Influences Social and Environmental Outcomes in Costa Rica. Ecol. Econ. 2020, 174, 106659. [Google Scholar] [CrossRef]
  82. Arriagada, R.A.; Ferraro, P.J.; Sills, E.O.; Pattanayak, S.K.; Cordero-Sancho, S. Do Payments for Environmental Services Affect Forest Cover? A Farm-Level Evaluation from Costa Rica. Land Econ. 2012, 88, 382–399. [Google Scholar] [CrossRef]
  83. Robalino, J.; Pfaff, A.; Sandoval, C.; Sanchez-Azofeifa, G.A. Can We Increase the Impacts from Payments for Ecosystem Services? Impact Rose over Time in Costa Rica, yet Spatial Variation Indicates More Potential. For. Policy Econ. 2021, 132, 102577. [Google Scholar] [CrossRef]
  84. Brumberg, H.; Beirne, C.; Broadbent, E.N.; Almeyda Zambrano, A.M.; Almeyda Zambrano, S.L.; Quispe Gil, C.A.; Lopez Gutierrez, B.; Eplee, R.; Whitworth, A. Riparian Buffer Length Is More Influential than Width on River Water Quality: A Case Study in Southern Costa Rica. J. Environ. Manag. 2021, 286, 112132. [Google Scholar] [CrossRef] [PubMed]
  85. Barber, C.P.; Cochrane, M.A.; Souza, C.M.; Laurance, W.F. Roads, Deforestation, and the Mitigating Effect of Protected Areas in the Amazon. Biol. Conserv. 2014, 177, 203–209. [Google Scholar] [CrossRef]
  86. Laurance, W.F.; Goosem, M.; Laurance, S.G.W. Impacts of Roads and Linear Clearings on Tropical Forests. Trends Ecol. Evol. 2009, 24, 659–669. [Google Scholar] [CrossRef]
Figure 1. Protected areas, biological corridors, rivers, main roads, large towns, and communities/small towns in the study area. The white rectangle in the bottom left indicates the location of the study area within Costa Rica.
Remotesensing 16 01088 g001
Figure 2. Dominant LULC in the Osa region, including (A) oil palm plantation, (B) mangrove, (C) water, (D) cattle pasture, (E) urban/exposed, (F) mature forest, (G) secondary forest, (H) wetland, (I) teak/gmelina plantation.
Remotesensing 16 01088 g002
Figure 3. LULC maps for the study region in 1987, 1998, and 2019.
Remotesensing 16 01088 g003
Figure 4. Forest cover change and connectivity. Left panel: Forest cover change in the study region between the LULC maps created for 1987, 1998, and 2019. Light pink indicates areas that were forest in 1987 and were not forest by 1998, and dark maroon indicates areas that were forest in 1998 and were not forest by 2019. Lime green indicates areas that were not forest in 1987 and were forest by 1998, and forest green indicates areas that were not forest in 1998 and were forest by 2019. Light mint green indicates areas that were forested in the 1987, 1998, and 2019 maps. Light yellow indicates other classes. Black lines indicate protected area boundaries. Bold black letters denote the locations of the example areas from the right figure. Right panel: Examples of the impact restoration and deforestation may cause on connectivity, noting that both restoration and deforestation may increase and decrease connectivity. Example A shows an area where restored land increases forest connectivity by increasing forest patch size and connecting forest patches. Example B shows an area where restored land leads to a decrease in net forest connectivity by creating new, small, and irregularly shaped forest patches. Example C shows an area where deforestation has a net increase in forest connectivity by removing small, isolated forest patches. Example D shows an area where deforestation decreases forest connectivity by separating forest patches and increasing edge density.
Remotesensing 16 01088 g004
Figure 5. Percentage of area comprising each LULC class in (A) study area within ACOSA, (B) the Osa Peninsula, (C) protected areas across the region, (D) non-protected areas across the region, (E) the Corcovado National Park, (F) the Golfo Dulce Forest Reserve, (G) the Piedras Blancas National Park, and (H) the Terraba Sierpe National Wetland, (I) 15 m wide riparian buffer zones passing through protected areas, (J) 5 m wide riparian buffer zones that do not pass through protected areas, (K) 700 m wide buffers around main roads, and (L) farms receiving FONAFIFO payments.
Remotesensing 16 01088 g005
Figure 6. LULC transitions by class. The x axis shows LULC classes at the first year in the time range, while the colors inside each column show LULC classes at the final year of the time range. Therefore, total column height is the total area (in ha) covered by a given LULC class in the initial year (x axis) and the colors in each column demonstrate the contribution of different LULC classes over the same area, but in the final year. The panels show LULC transitions in (A) ACOSA from 1987 to 1998, (B) ACOSA from 1998 to 2019, (C) ACOSA over the whole study period, 1987–2019, (D) the Osa Peninsula from 1987 to 1998, (E) the Osa Peninsula from 1998 to 2019, (F) the Osa Peninsula over the whole study period from 1987 to 2019, (G) the Piedras Blancas from1987 to 1998, (H) the Piedras Blancas from 1998 to 2019, (I) the Piedras Blancas from 1987 to 2019, (J) Corcovado from 1987 to 2019, (K) the Golfo Dulce Forest Reserve from 1987 to 2019, (L) Terraba-Sierpe from 1987 to 2019, (M) farms receiving FONAFIFO PES payments from1987 to 2019.
Remotesensing 16 01088 g006
Figure 7. NDVI values for individual conservation areas (the Corcovado National Park (CNP), the Golfo Dulce Forest Reserve (GDFR), Piedras Blancas National Park (PBNP), and Terraba-Sierpe National Wetland (TSW)), the Osa Peninsula (OSA Pen.), and the entire study area (ACOSA) in 1987, 1998, and 2019 (left) and for EVI (right).
Remotesensing 16 01088 g007
Figure 8. NDVI, EVI, and EVI2 from 1984 to 2020, averaged over the entire study region.
Remotesensing 16 01088 g008
Figure 9. Results of forest patch landscape metric computation. Graphs indicate changes in the particular metric over the three dates of LULC maps, 1987 in red, 1998 in gold and 2019 in blue. The metrics are grouped from left to right by the smallest units to largest units: individual conservation areas (the Corcovado National Park (CNP), the Golfo Dulce Forest Reserve (GDFR), and the Piedras Blancas National Park (PBNP)), protected and unprotected areas (Prot. and Unprot.), the Osa Peninsula (OSA Pen.), and, finally, the entire study area (ACOSA). Landscape metrics for the Forest Class Area (A), Number of Patches (B), Patch Density (C), Aggregation Index (D), Edge Density (E), Core Area Percent of Landscape (F), Landscape Shape Index (G), and Landscape Division Index (H).
Remotesensing 16 01088 g009
Table 1. LULC percentages for the ACOSA study region for 1987, 1998, and 2019. Natural is an aggregation of mature forest, secondary forest, wetland, mangrove, and water classes.
Palm PlantationMangroveWaterGrasslandExposed Soil/UrbanMature ForestSecondary ForestWetlandTeak/GmelinaNatural
19872.48%5.19%4.17%16.93%9.16%27.47%32.34%2.23%0.02%71.40%
19983.78%5.3%4.28%17.37%1.37%26.26%36.90%4.07%0.66%76.81%
20198.16%4.34%4.48%8.61%3.16%25.47%39.98%4.55%1.27%78.82%
Table 2. LULC percentages for the Osa Peninsula for 1987, 1998, and 2019. Natural is an aggregation of mature forest, secondary forest, wetland, mangrove, and water classes.
Palm PlantationMangroveWaterGrasslandExposed Soil/UrbanMature ForestSecondary ForestWetlandTeak/GmelinaNatural
19871.07%1.42%0.41%11.83%6.68%40.84%36.97%0.73%0.04%80.37%
19981.05%1.29%0.38%12.58%0.66%39.36%42.51%1.5%0.67%85.04%
20192.37%0.69%0.54%7.43%1.86%38.51%46.27%0.96%1.36%86.97%
Disclaimer/Publisher’s Note: The statements, opinions and data contained in all publications are solely those of the individual author(s) and contributor(s) and not of MDPI and/or the editor(s). MDPI and/or the editor(s) disclaim responsibility for any injury to people or property resulting from any ideas, methods, instructions or products referred to in the content.

