Article

Vertical Profiles of Aerosols Induced by Dust, Smoke, and Fireworks in the Cold Region of Northeast China

1
College of Biological and Agricultural Engineering, Jilin University, Changchun 130022, China
2
State Key Laboratory of Black Soils Conservation and Utilization, Northeast Institute of Geography and Agroecology, Chinese Academy of Sciences, Changchun 130102, China
3
College of New Energy and Environment, Jilin University, Changchun 130021, China
4
School of Energy and Science Engineering, Harbin Institute of Technology, Harbin 150001, China
5
Hongke Photonics Company, Liaoyuan 136200, China
*
Author to whom correspondence should be addressed.
Remote Sens. 2024, 16(6), 1098; https://doi.org/10.3390/rs16061098
Submission received: 17 January 2024 / Revised: 12 March 2024 / Accepted: 15 March 2024 / Published: 20 March 2024
(This article belongs to the Special Issue Aerosol and Atmospheric Correction)

Abstract

:
Despite the long-term implementation of air pollution control policies in northeast China, severe haze pollution continues to occur frequently. With the adoption of a megacity (Changchun) in northeast China, we analysed the vertical characteristics of aerosols and the causes of aerosol pollution throughout the year using multisource data for providing recommendations for controlling pollution events (i.e., straw burning and fireworks). Based on a ground-based LiDAR, it was found that the extinction coefficient (EC) of aerosols at a height of 300 m in Changchun was highest in winter (0.44 km−1), followed by summer (0.28 km−1), with significant differences from those in warmer regions, such as the Yangtze River Delta. Therefore, it is recommended that air pollution control policies be differentiated between winter and summer. On Chinese New Year’s Eve in Changchun, the ignition of firecrackers during the day and night caused increases in the EC at a height of 500 m to 0.37 and 0.88 km−1, respectively. It is suggested that the regulation of firecracker ignition should be reduced during the day and strengthened at night. Based on the CALIPSO and backward trajectory analysis results, two events of dust–biomass-burning composite pollution were observed in March and April. In March, the primary aerosol component was dust from western Changchun, whereas in April, the main aerosol component was biomass-burning aerosols originating from northern and eastern Changchun. Hence, reducing the intensity of spring biomass burning can mitigate the occurrence of dust–biomass-burning composite pollution. These findings can provide emission policy suggestions for areas facing similar issues regarding biomass-burning transmission pollution and firework emissions.

1. Introduction

Aerosols are significant constituents of Earth’s atmosphere; they comprise suspended solid and liquid particles with varying chemical properties and sizes [1]. Much attention has been devoted to the consequential impacts of aerosols on the air quality (e.g., atmospheric haze, acid precipitation, and particulate matter), climate change (e.g., global warming and extreme weather events), the ecological environment (e.g., carbon emissions and biodiversity), and human health (e.g., physical ailments and mental disorders) [2,3].
Acquiring the long-term baseline characteristics of aerosols and tracking their short-term variations are essential for gauging the extent of aerosol pollution and assessing the downwind effects. Furthermore, understanding the dynamic evolution of aerosol properties lays the foundation for formulating strategies to manage anthropogenic emissions, thereby contributing to improvement in air pollution, which poses risks to human health [4]. Based on remote sensing satellites (e.g., the moderate-resolution imaging spectroradiometer, MODIS; medium-resolution imaging spectrometer, MERIS; and cloud–aerosol LiDAR with orthogonal polarization, CALIOP), multiple datasets, such as the aerosol optical depth (AOD), radiance, and water cloud properties, can be retrieved [5,6,7,8]. Notably, cloud–aerosol LiDAR pathfinder satellite observations (CALIPSO) have provided openly accessible observation data on a global scale since June 2006 [9]. Subsequently, the analysis of aerosol vertical profiles in Europe, North America, and East Asia using satellite remote sensing data has achieved significant progress [10,11]. However, its accuracy gradually decreases with decreasing altitude (distance from the surface) of the measurements.
During the last two decades, northeast China has faced fluctuating levels of air pollution from natural emissions, intense anthropogenic activities, and cross-regional transport of aerosols from nearby regions [12,13,14,15]. Studies have focused on proposing control measures to reduce the intensity of anthropogenic activities, including energy combustion, illegal emissions, and biomass burning, as well as leveraging favourable meteorological conditions to mitigate the formation of intense haze over megacities in northeast China [16,17,18,19,20,21]. However, further development is needed to establish efficient air pollution control measures. Understanding the vertical distribution patterns of air pollution is also essential for revealing the mechanisms underlying extreme air pollution events and air-quality regulation [22]. Research was conducted in northeast China using a ground-based LiDAR to investigate the vertical characteristics and transport mechanisms of dust- and biomass-burning aerosol pollution [23,24]. Satellites such as MODIS/Terra, MODIS/Aqua, and CALIOP were employed to analyse the long-term (over ten years) vertical structure of aerosols in this region [25]. Furthermore, studies have focused on exploring the vertical distribution of particulate matter and its correlation with the atmospheric boundary layer structure in northeast China [26,27]. However, most research on the vertical characteristics of aerosols in northeast China has focused on either the temporal variation in the vertical structure or the generation or transmission mechanisms of severe pollution events, with limited exploration of potential policy applications.
In this study, using the ground-based LiDAR, the seasonal aerosol vertical structures and characteristics of severe haze pollution events were studied in Changchun, a megacity in northeast China, from October 2020 to September 2021, and recommendations for air-quality control were determined based on the obtained vertical aerosol characteristics. The results and policy suggestions could serve as a reference for other similar hotspots facing severe pollution.

2. Materials and Methods
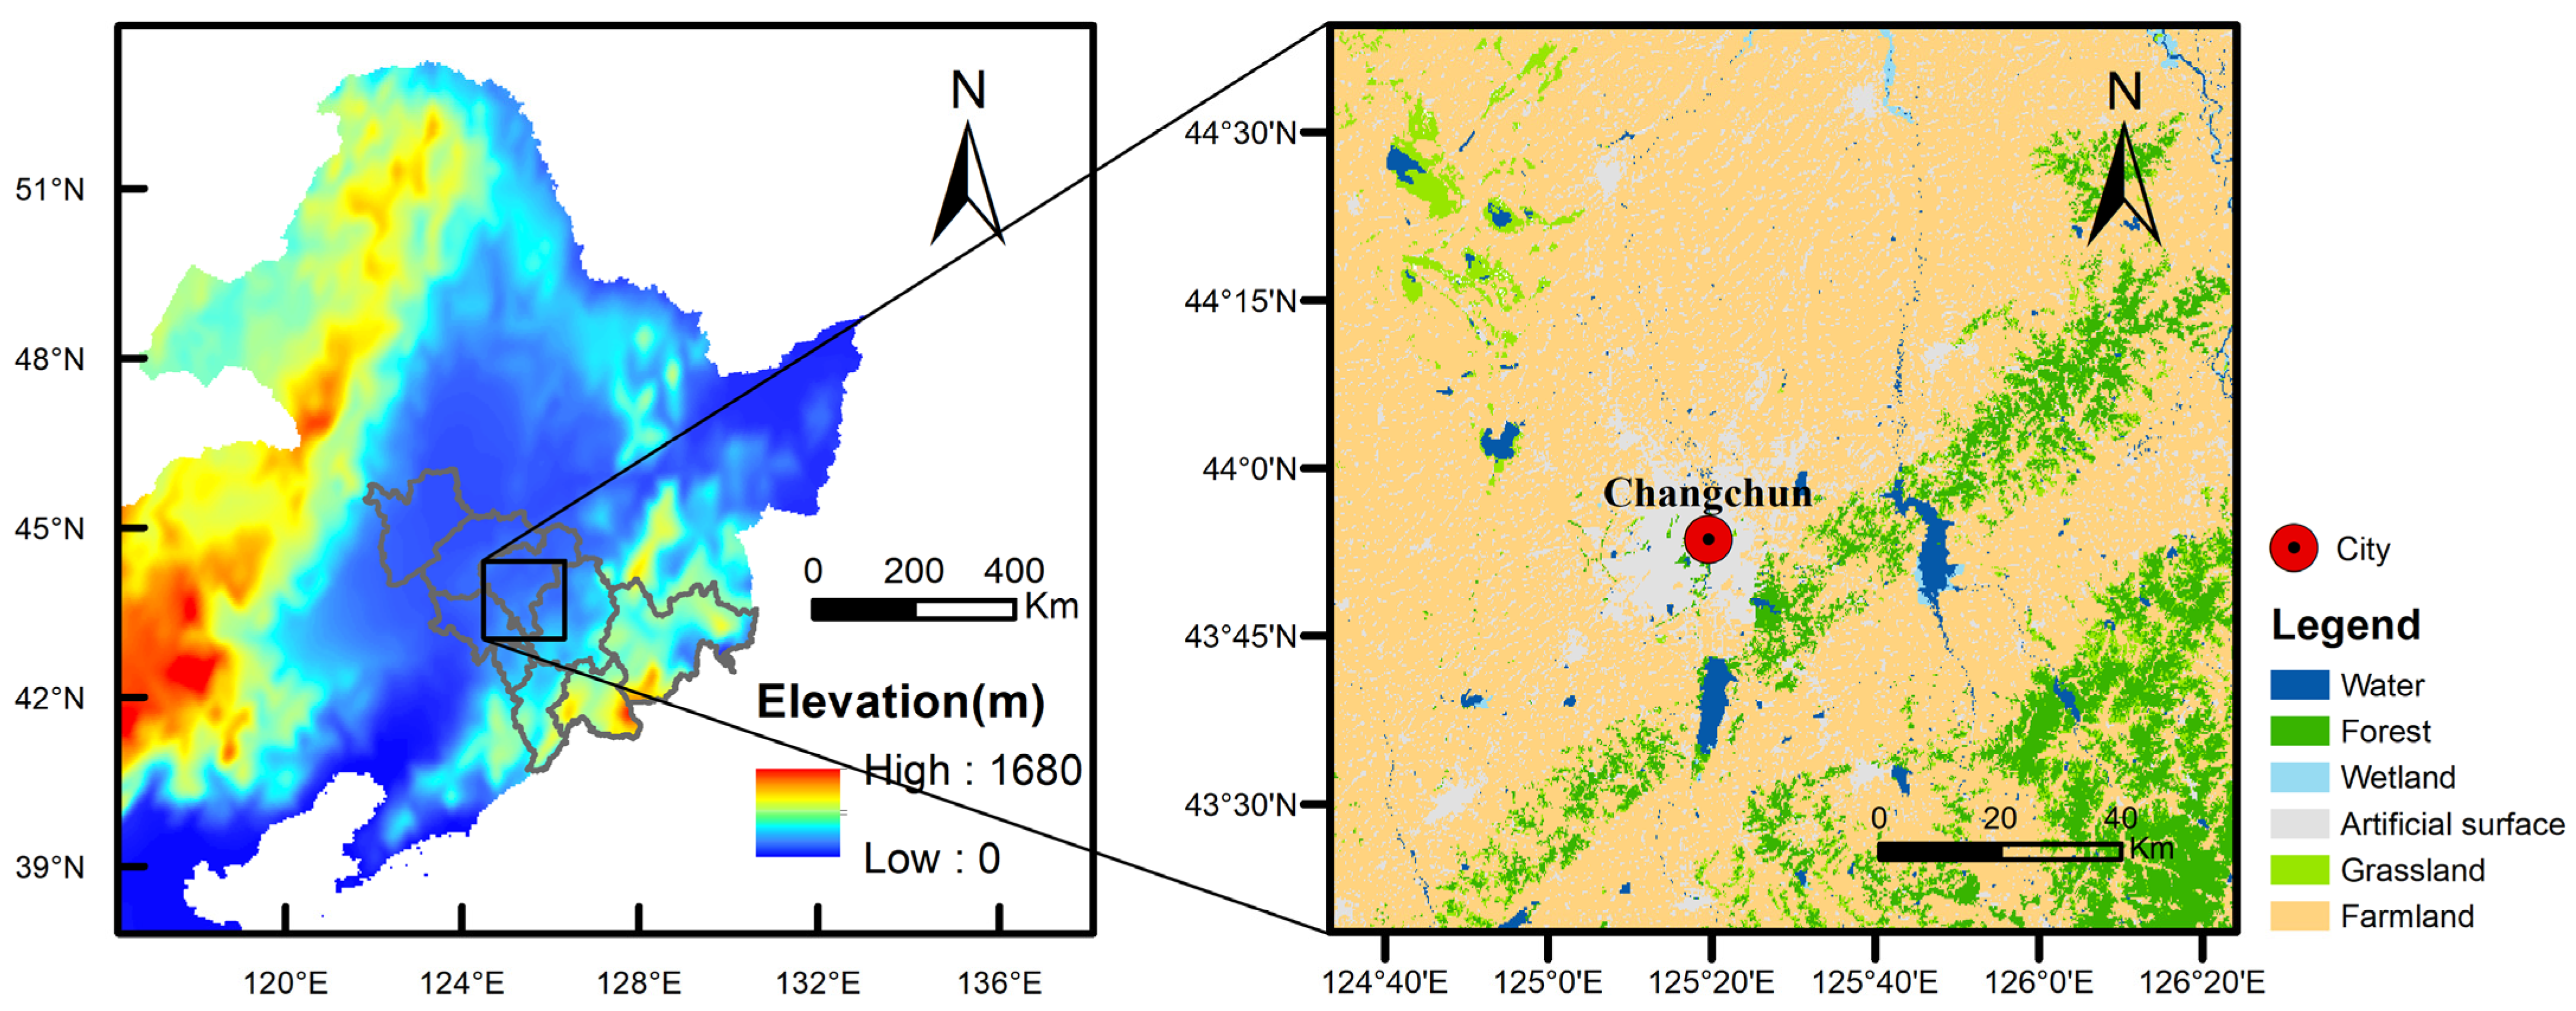
2.1. Study Area

In this study, atmospheric monitoring was conducted in the cold region of northeast China (CRC), specifically in the provincial city of Changchun (43°5′–45°15′N, 124°18′–127°5′E) (Figure 1). The region experiences winter from November to March of the following year, characterized by long-term coal-fired heating. June, July, and August are classified as summer, while September and October are considered autumn, and April and May are categorized as spring. Additionally, Changchun is located in a large, cultivated area spanning over 1.32 million hectares and is renowned for its automobile industry, optoelectronic information, and applied chemistry [28]. The city of Changchun falls within the UTC+8 time zone. Hence, all the times referred to in this paper are in UTC+8 (Beijing time), unless otherwise specified.

2.2. Data Source

The daily concentration variations of six air pollutants (PM2.5, PM10, NO2, SO2, CO, and O3) in Changchun were analysed using hourly data from October 2020 to September 2021. The data were obtained from the China National Environmental Monitoring Center (http://106.37.208.233:20035/, accessed on 1 January 2021). The meteorological data included precipitation (Prec), relative humidity (RH), air temperature (AT), and wind speed (WS), which were provided by the China Meteorological Administration. For the verification of planetary boundary layer height (PBLH), reanalysis data with a horizontal resolution of 0.25° were downloaded from the European Centre for Medium-Range Weather Forecasts (ECMWF). Specifically, the dataset named “ERA5 monthly averaged data on a single level from 1979 to present”, containing monthly average PBLHs (https://cds.climate.copernicus.eu/, accessed on 10 January 2021) from 2020 to 2021, was selected.
The ground-based polarization LiDAR (PL) (HKLiDAR-V, Jilin Hongke Photonics Corporation, Liaoyuan, China) was installed at the Northeast Institute of Geography and Agroecology, Chinese Academy of Sciences in Changchun (44°00′N, 125°24′E), as depicted in Figure 1. The PL was equipped with a 532 nm wavelength laser emitter, which has high atmospheric transmittance, with a maximum pumping-pulse energy of 12 MJ. Furthermore, the PL has a range resolution of 7.5 m, an integration time of 20 s, and a blind detection zone of 150 to 200 m. The LiDAR is installed in an analysis room in Changchun with a constant temperature of 20–25 °C and humidity below 60%. Quarterly calibration of the equipment was conducted using quadrant testing, geometric overlap factor correction, polarization channel gain ratio calibration, and signal-to-noise ratio calculations. The uncertainty range estimated for the LiDAR optical parameters remains stable at 25–35%. The aerosol extinction coefficient (EC) profiles were retrieved from October 2020 to September 2021 using the retrieval algorithm developed by Fernald [29].
In this study, to acquire the high-resolution images of the vertical and horizontal profiles of six major aerosol subtypes—namely clean marine, clean continental, polluted continental, dust, polluted dust, and smoke—the V3.41 products of CALIPSO Level 2 data were used [30], which are available at the NASA Langley Research Center (https://www-calipso.larc.nasa.gov/, accessed on 10 February 2021).

2.3. Potential Sources of Pollution

In this study, backwards trajectory analysis was utilized, and the HYSPIT4 model from the National Oceanic and Atmospheric Administration (NOAA) and the meteorological data of the Global Data Assimilation System (GDAS) provided by the National Centers for Environmental Prediction (NCEP) (https://www.ready.noaa.gov/archives.php, accessed on 18 January 2021) were used to calculate trajectories.
Using the GIS-based software (TrajStat 1.5.3, http://meteothink.org/docs/trajstat/trajstatrun.html, accessed on 10 March 2021), the 72-h backward trajectories at three dimensions were calculated over the Changchun observation site, starting at an arrival level of 1000 m above the ground level every 6 h (00:00, 06:00, 12:00, and 18:00 UTC). Then, the modified Ward’s hierarchical clustering method was used to form the trajectory clusters [31]. In this study, the potential source contribution function (PSCF) model and the concentration weighted trajectory (CWT) model were used to analyse the source locations of pollutants (PM2.5 and PM10). The values of PSCF and CWT are defined as follows [32]:
P S C F i j = m i j / n i j
C i j = 1 l = 1 M τ i j l l = 1 M C l τ i j l
where PSCFij is the PSCF value in the ijth cell; nij is the number of endpoints that fall in the ijth cell; mij is the number of endpoints for the same cell having arrival times at the sampling site corresponding to PM concentrations higher than an arbitrarily set criterion; Cij is the average weighted concentration (μg/m3) in the ijth cell; l is the index of the trajectory; M is the total number of trajectories; Cl is the concentration observed on arrival of trajectory l; and τijl is the time spent in the ijth cell by trajectory l. A high value of Cij implies that air parcels travelling over the ijth cell would be, on average, associated with high concentrations at the receptor.
Moreover, the arbitrary weighting function Wij was applied to minimize the uncertainty in the PSCF and CWT values, which are referred to as the WPSCF and WCWT, respectively. The Wij values are defined as follows [33]:
W i j = 1.00 n i j > 3 A v g 0.70 A v g < n i j 3 A v g 0.42 0.5 A v g < n i j A v g 0.17 0 < n i j 0.5 A v g
where Avg is the average number of trajectory segment endpoints in all cells.

2.4. Statistical Analysis

A characteristic radar chart is a relatively intuitive method for analysing the spatial and temporal types (e.g., sand dust, biomass burning, and coal combustion) of air pollutants [21]. Characteristic values, standard values, upper-limit values, and lower-limit values were used to plot the characteristic radar charts. The pollution types can be determined by the magnitude of the characteristic values. Furthermore, the extent of pollution can be determined based on standard values, upper-limit values, and lower-limit values. The standard value was set as a natural number 1, and the characteristic values were calculated from the pollutant concentration data as follows:
Z k l = C k l / l = 1 n C k l
C V k l = Z k l / Z l ¯
where Ckl is the concentration of type l pollutant at time k; Zkl, which can eliminate the influence of pollutant concentration fluctuations, is the component ratio of type l pollutant at time k; CVkl is the characteristic value of type l pollutant at time k; and Z l ¯ is the average concentration of type l pollutant in a study period.
Upper-limit values and lower-limit values were calculated based on the following equations:
M a x l = ( Z l ¯ + S l ) / Z l ¯
M i n l = ( Z l ¯ S l ) / Z l ¯
where Maxl, Minl, and Sl are the upper limit, lower limit, and standard deviation of the type l pollutant in the study period, respectively.

3. Results

3.1. Variation in Aerosol Vertical Distribution

Throughout the study period, the ECs within the near surface layer (below 1 km) consistently demonstrated the highest values in the observed range and decreased with increasing altitude (Figure 2). The average ECs within the near surface layer were greater in winter than that in other seasons, reaching their peak in January at approximately 0.45 km−1. From May to June, the near-surface layer ECs averaged approximately 0.2 km−1, followed by a subsequent increase from July to September, reaching approximately 0.3 km−1. Additionally, during the heating period, the EC ranged from 0.3 to 0.4 km−1 under 1 km height, while during the non-heating period, it varied from 0.2 to 0.3 km−1. In July, the extinction coefficient (EC) showed a 7.2% increase per 100 m below 1 km, while in January, it exhibited a significantly higher increase of 31.9% per 100 m below 1 km. Above 1.5 km, the average ECs remained below 0.15 km−1 during the study period. At an altitude of 2.5 km, a peak structure was observed in August, with the EC reaching 0.1 km−1. During autumn, the mean EC within the 0–3 km range was the lowest in that year, measuring less than 0.13 km−1.
The AOD1/TAOD ratio exhibited smaller values in summer (46%) and larger values in winter (65%) (Figure 2). This ratio peaked at 70% in December and reached a minimum of 40% in May. Furthermore, the AOD1/TAOD and AOD2/TAOD ratios were nearly equal from May to July. In contrast to AOD1/TAOD, AOD2/TAOD showed the opposite seasonal variation, with higher values in summer (38%) and lower values in winter (24%) (Table 1). The AOD2/TAOD ratio peaked at 42% in July and decreased to a minimum of 22% in December throughout the year. The AOD3/TAOD ratio was lowest in winter at 11% compared to other seasons, where it ranged from 16% to 19%.
Based on Pearson correlation analysis, the ECs between AOD1 and the concentrations of PM2.5 and PM10 throughout the year were 0.28 (p < 0.05) and 0.24 (p < 0.05), respectively (Table 2). In this table, we present the correlation matrix between PM2.5, PM10, AOD1, AOD2, AOD3, TAOD, PBLH, AT, and RH. The correlation coefficients range from −1 to 1, where 1 represents a perfect positive correlation, −1 represents a perfect negative correlation, and 0 indicates no linear correlation. From the observations, it can be noted that PM2.5 and PM10 exhibit a relatively high correlation coefficient of 0.736. AOD1 shows a moderate positive correlation with AOD3, with a coefficient of 0.8. Additionally, some variables exhibit negative correlations, such as AOD1 and AOD2 with a correlation coefficient of −0.048. The correlation coefficient between AOD2 and the PM2.5 concentration was 0.17 (p < 0.05), while the correlation between AOD2 and the PM10 concentration was not statistically significant.

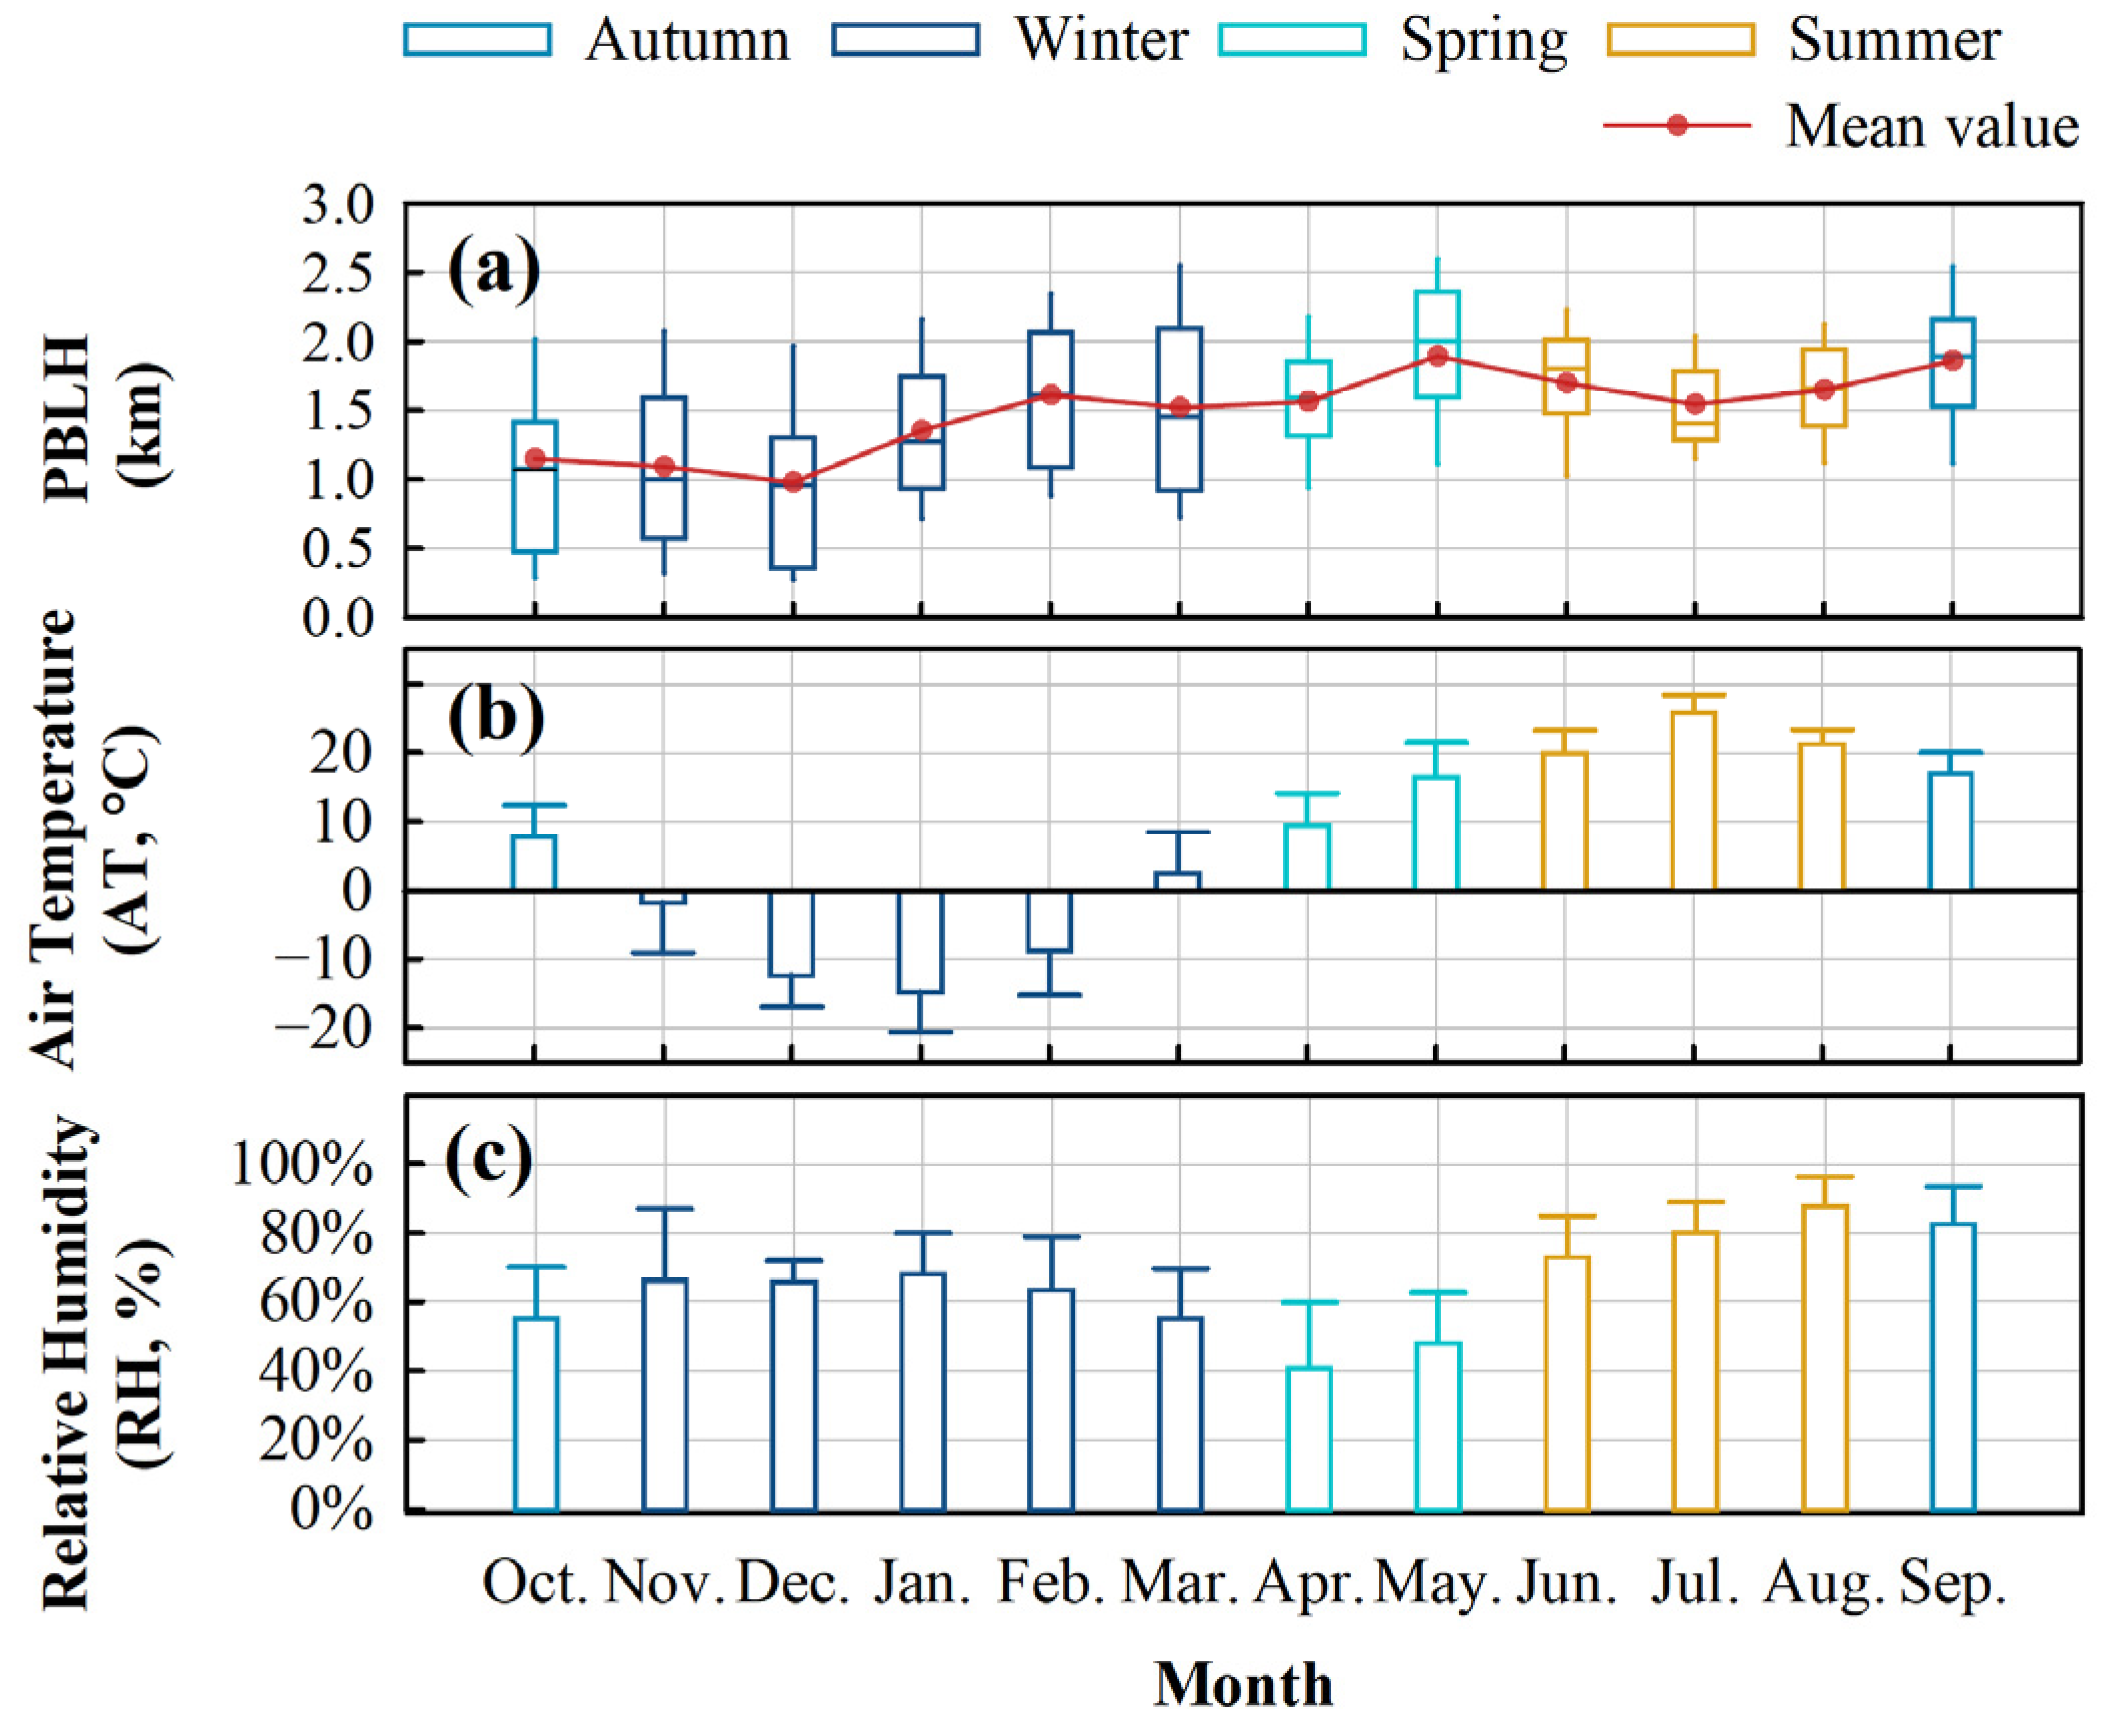
3.2. Variations in Meteorological Parameters and Air Pollutants

There was a strong positive correlation of the PBLH between the retrieved data from LiDAR in this study and the data released by the ECMWF (R = 0.74, p < 0.05). Throughout the study period, the highest PBLH was observed in May with a mean value of 1.9 km, while the lowest was observed in December with a mean value of 1 km (Figure 3a). In spring and summer, the PBLH was relatively higher, with averages of 1.73 km and 1.64 km, respectively, compared to 1.47 km and 1.32 km in autumn and winter. Over the study period, a negative correlation coefficient was found between the PBLH and the concentrations of PM2.5 (R = −0.27, p < 0.05) and PM10 (R = −0.16, p < 0.05) (Table 2).
The study period covered a range of temperatures in the Changchun region, with January being the coldest month at −15 °C and July being the warmest month at 26 °C (Figure 3b). The average temperature in winter was −7 °C, while in summer, it was 22 °C. August had the highest relative humidity, reaching 88%, while April had the lowest at 41% (Figure 3c). In spring, the relative humidity was recorded at 44%, while in summer, it increased to 80%. These temperature and humidity variations have significant implications for air quality in the region.
Between October 2020 and September 2021, the study recorded a total of 33 days where the air-quality index (AQI) exceeded the threshold of 100, as defined by the Technical Regulation on Ambient Air-Quality Index (HJ633-2012) (Figure 4). High AQI values indicate a significant increase in air pollution levels during these periods, which could pose health risks to the population.
Further analysis revealed that PM dominated most pollution events, as shown in the radar charts in Figure 4a–e. This finding is consistent with previous studies, indicating that particulate matter is a major contributor to air pollution in many regions of China, including Changchun. The presence of high PM concentrations can lead to respiratory issues, cardiovascular diseases, and other health problems, highlighting the urgent need to address particulate matter pollution in the region.
In accordance with the ambient air-quality standards in China (GB 3095-2012) [34], Grade-II classification was adopted for this study (Table A1). Within the October 2020 to September 2021 period, Changchun experienced 22 days in which the Grade-II limits for PM2.5 were exceeded (Table 3). Notably, during winter, the concentration of PM2.5 exceeded the Grade-II limit for 17 days, indicating that winter was the primary period for haze pollution in the Changchun area. According to the WHO 2021 AQG standards [35], it was found that the pollution situation of PM2.5 in the winter in Changchun area was severe. Additionally, there are 29 and 27 days in December and January, respectively, when NO2 exceeds the health standards set by WHO.

3.3. Typical Aerosol Pollution Scenarios

Using multisource data, we analysed the vertical distributions of aerosol particles during typical aerosol pollution cases. The main information of these cases is summarized in Table 4. In northeast China during winter, pollution events exhibit a higher extinction coefficient. Moreover, based on the extinction coefficient and air-quality index (AQI) of China, it can be inferred that biomass combustion constitutes a significant pollution event in this region.

3.3.1. Firework Aerosols

In China, it is a long-standing tradition to ignite an abundance of firecrackers on Chinese New Year’s Eve (11 February) and Lunar New Year’s Day (12 February). At 14:00 on February 11, the average EC below 0.5 km was 0.37 km−1, while at 22:00 on the same day, it increased to 0.88 km−1 (Figure 5a). Additionally, the ECs within a height range of 0.5 km from 22:00 on 11 February to 13:00 on 12 February remained elevated, averaging between 0.82 and 1.07 km−1. In contrast, the depolarization ratio within 0.5 km is approximately 0.05 (Figure 5b), indicating a low level of coarse particles [36]. The concentration of PM2.5 exhibited a rapidly increased after 20:00 on 11 February, reaching 118 μg/m3 at midnight that night (Figure 5c). In recent years, as a result of the Chinese government’s efforts to control fireworks, the use of fireworks in urban areas has decreased significantly. However, the tradition of setting off fireworks unavoidably persists, driven by people’s pursuit of spiritual fulfilment. During 11–12 February, there was a simultaneous occurrence of high extinction and elevated concentrations of PM2.5. Furthermore, the PBLH on that day was exceptionally lower than in the rest of that month. As a result, aerosols from firework setoffs still have a significant impact when there is an extremely low boundary layer.
Table 4. Characteristics of aerosol optical parameters during haze pollution (i.e., fireworks pollution, dust, and biomass-burning) in northeast China.
ResearcherStudy AreaPeriodEC (0–500 m)AQIUncertaintyAerosol Types
Zhao et al., 2018 [37]Shenyang31 March 20160.1–0.5182NoneDust
Zhao et al., 2018 [37]Shenyang5 November 20160.5–1.1259NoneBiomass-burning
Liu et al., 2017 [38]Shenyang7 January 20170.3–1.1250NoneNone
Zhao et al., 2020 [39]Siping12 January 20190.9–1.3210NoneNone
This studyChangchun12 February 20210.1–0.714325–35%Firework
This studyChangchun15 March 20210.2–0.615225–35%Dust
This studyChangchun9 April 20210.3–0.718825–35%Biomass-burning

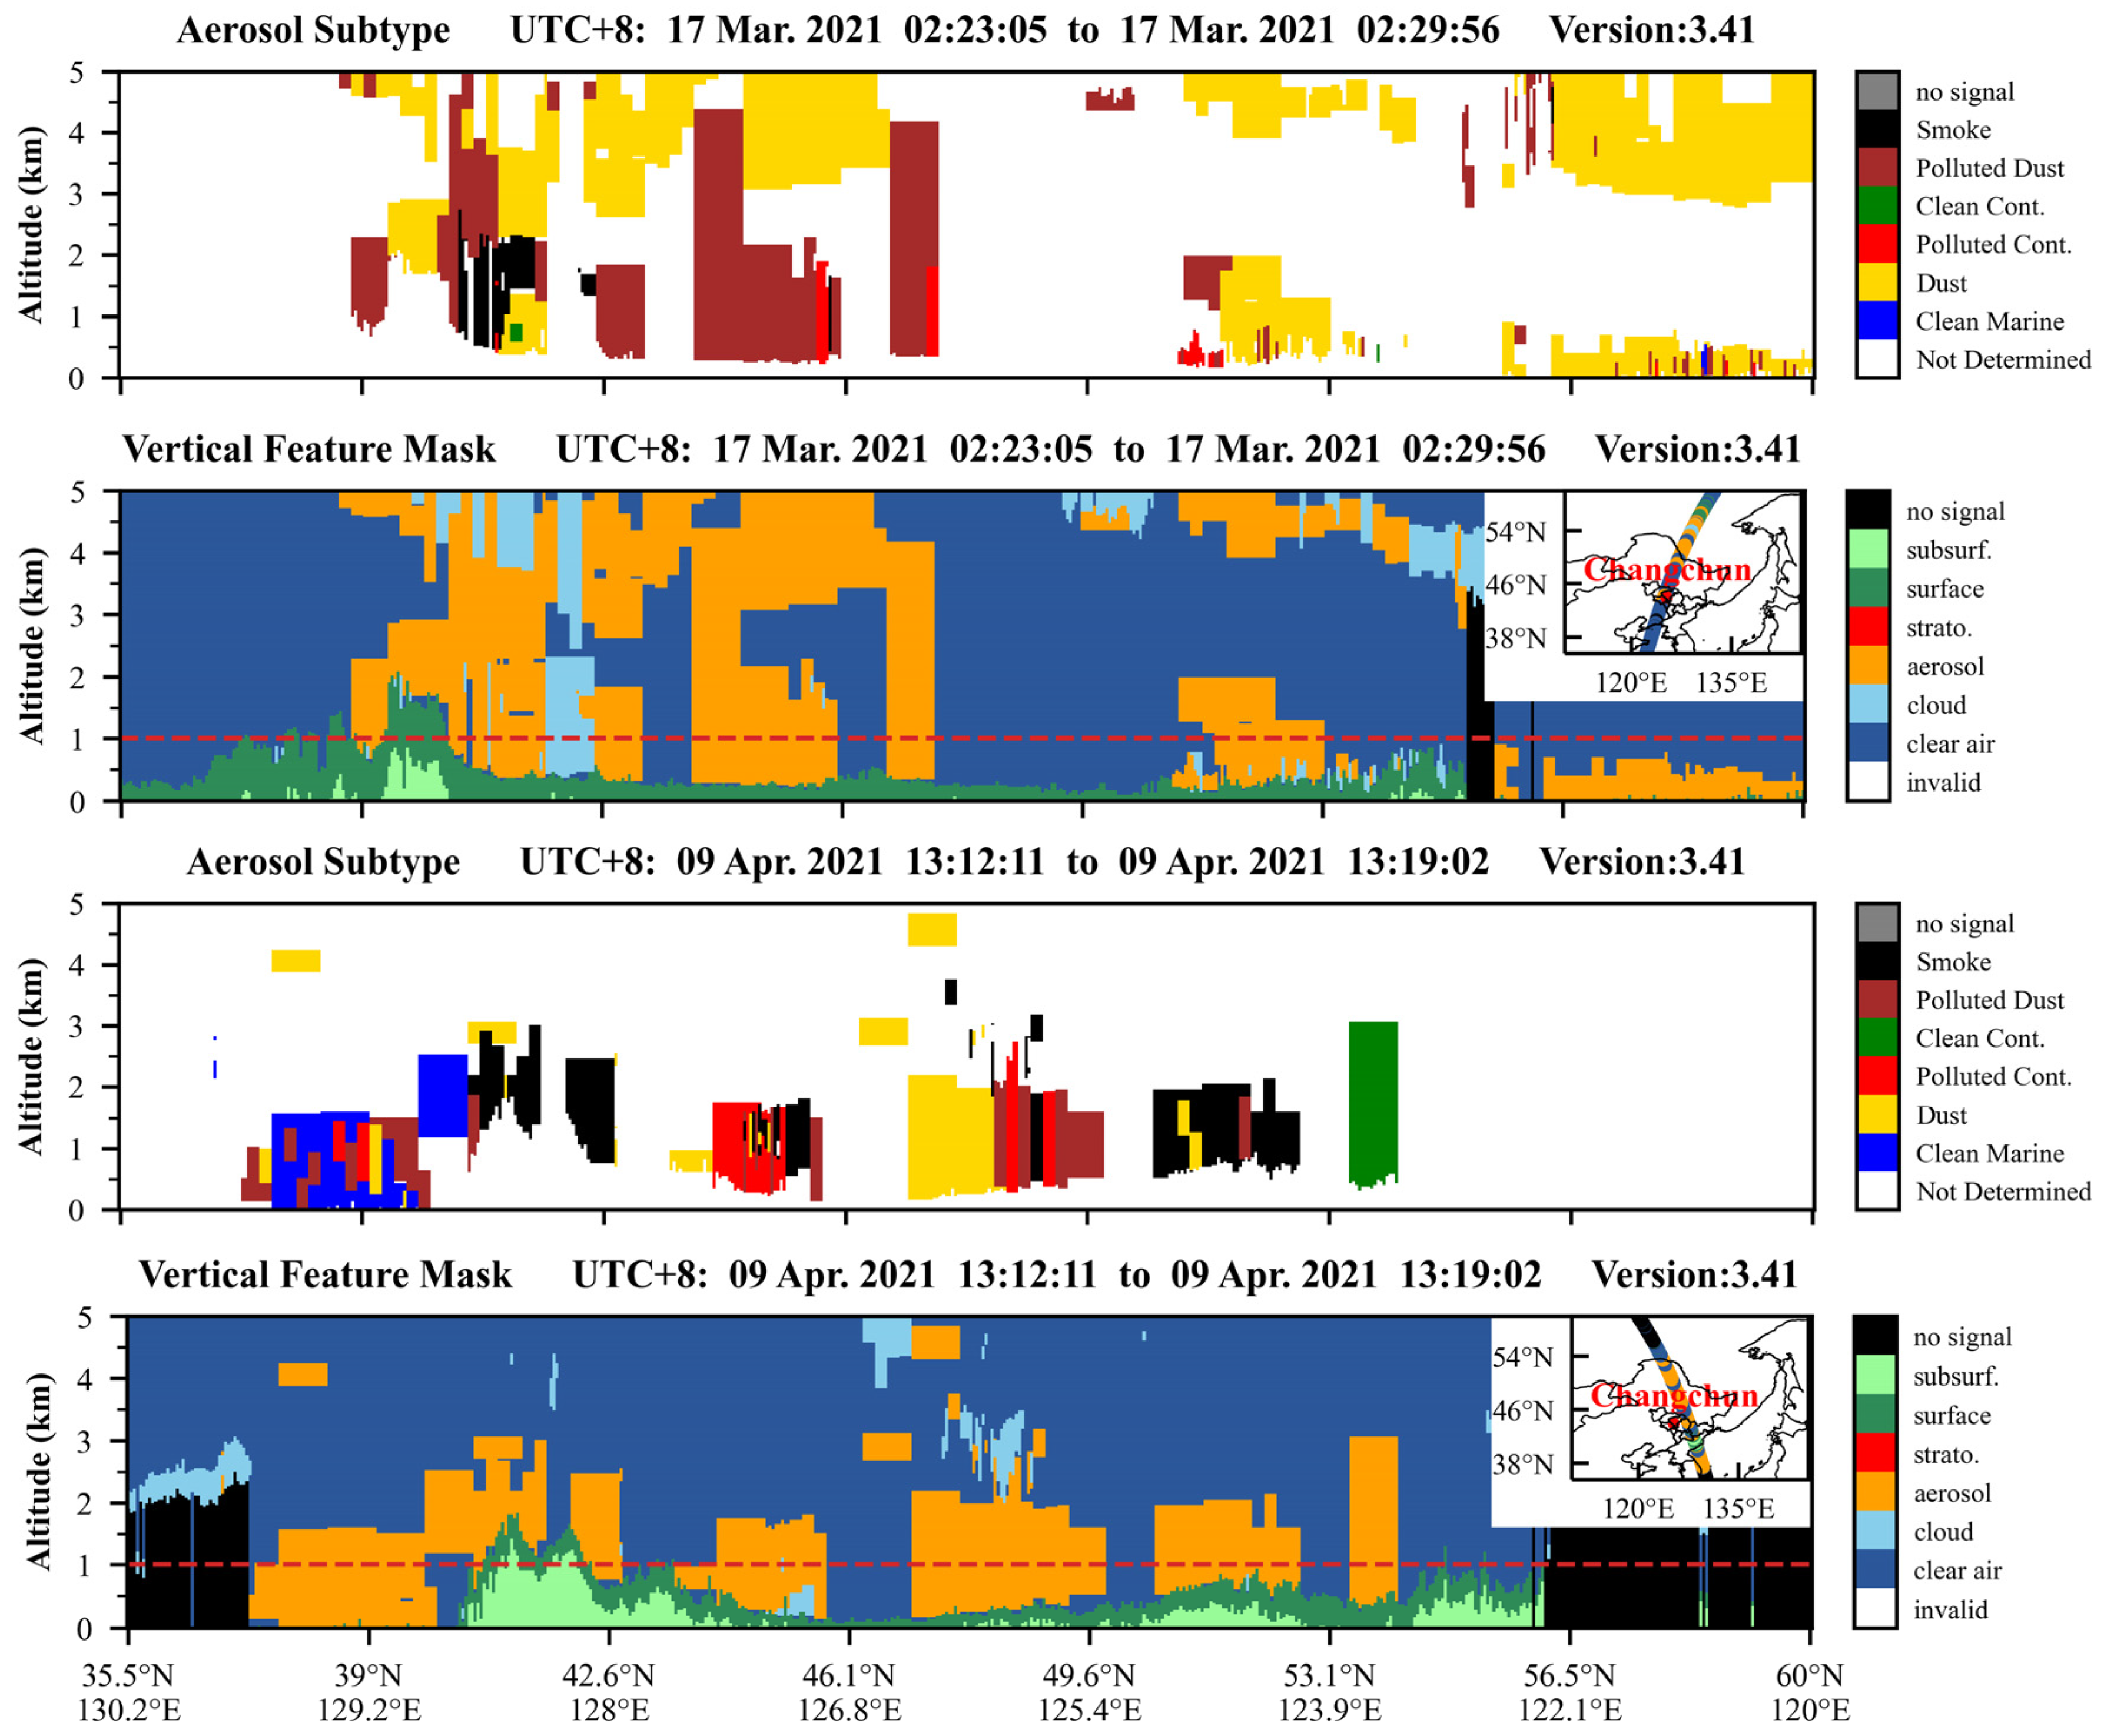
3.3.2. Dust Aerosols

At 22:00 on 14 March, an aerosol air mass was observed with its base located approximately 1 km above ground level and a thickness that could extend up to 2 km (Figure 6a). However, by 4:00 on 15 March, the air mass had mostly dissipated. Furthermore, at 12:00 on 15 March, the average depolarization ratio within the 0–1 km range increased to 0.11 (Figure 6b). At 19:00 on 15 March, the profiles of the EC and depolarization ratio both indicated that the top of the aerosol air mass reached a maximum altitude of 2.2 km. Additionally, between 10:00 on 15 March and 4:00 on 16 March, the PM2.5 concentration ranged from 16 to 69 μg/m3, while the PM10 concentration ranged from 91 to 838 μg/m3 (Figure 6c).
Based on the backwards trajectories, the sources of PM10 transport in Changchun on 15 March were analysed (Figure 6d–f). The cluster analysis of the 24 trajectories revealed two primary clusters. The first cluster originated from the desertified area in the western part of Jilin Province, accounting for 83% of the trajectories, while the second cluster originated from the Liaoning and Shandong provinces, accounting for 17%. Additionally, based on PSCF and CWT calculations, it was determined that the desert areas in the western CRC had the highest potential for the source of dust aerosol pollution. The CALIPSO data from 17 March at 02:27 revealed that dust aerosols had accumulated below 2 km and between 4–5 km, creating two distinct zones of dust accumulation (Figure 7a,b). This indicates that dust aerosols were the predominant aerosol subtype in Changchun on 17 March. Despite the lack of CALIPSO data for the Changchun region on 15 March, the observation of dust aerosols on 17 March still provides evidence of the impact of natural source transport in the CRC.

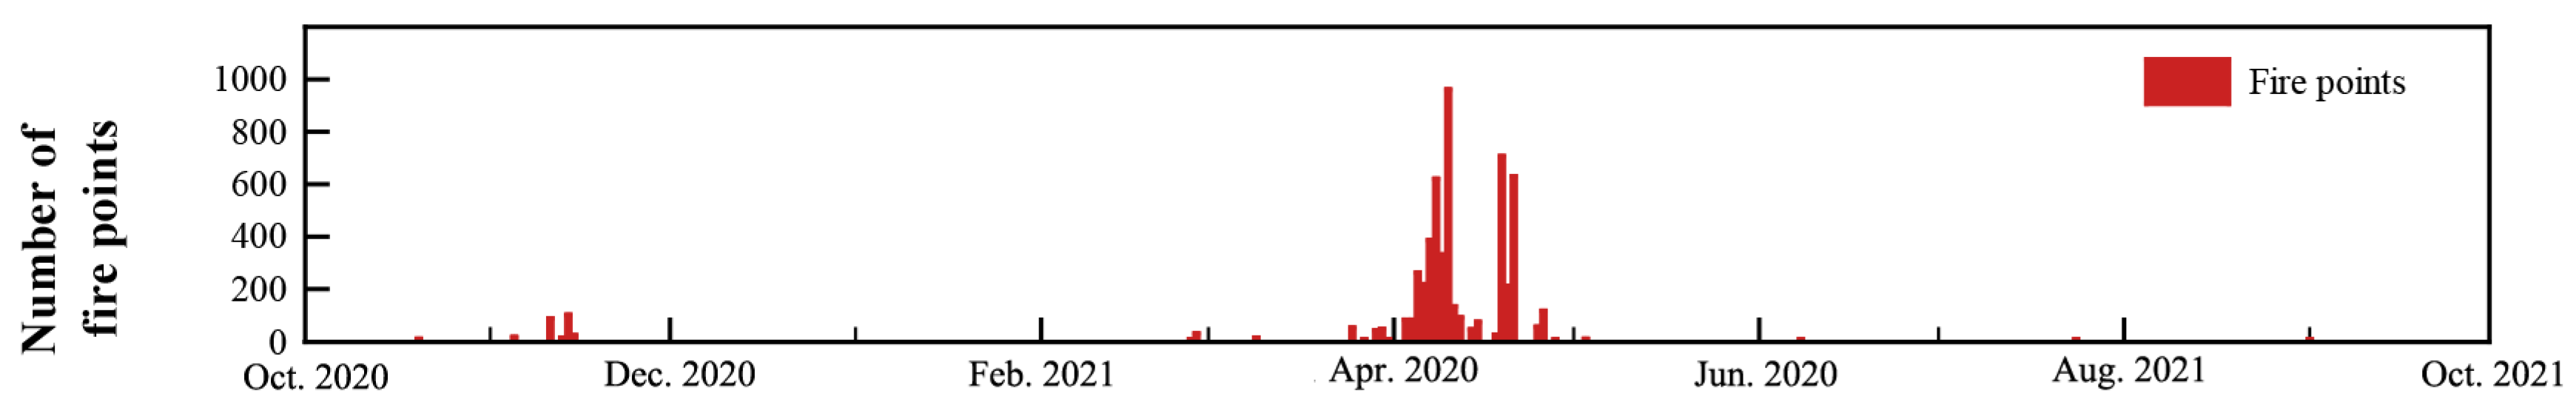
3.3.3. Biomass-Burning Aerosols

In the Changchun region, straw burning is regulated by the government and is typically scheduled before the spring tilling period, which occurs in April each year. Consequently, in April 2021, a total of 5070 fire points was recorded by the MODIS product in Changchun (Figure 8).
At 04:00 on 8 April, the EC of the air mass at a height of 0.6 km was 1.5 km−1, and it decreased by 7:00 (Figure 9a). At approximately 20:00 on 8 April, the average EC within 1 km increased to 1.11 km−1 and then decreased to 0.31 km−1 by 15:00 on 9 April. Nevertheless, on 9 April, the mean depolarization ratio below 1 km was less than 0.01 (Figure 9b). At 04:00 on 8 April, the PM2.5 concentration peaked at 598 μg/m3 and subsequently decreased to 21 μg/m3 by 08:00 (Figure 9c). Moreover, between 16:00 on 8 April and 08:00 on 9 April, the PM2.5 concentration increased from 55 to 251 μg/m3.
CALIPSO dataset analysis indicated that smoke and polluted continents were the predominant aerosol subtypes observed in the Changchun area (Figure 7c,d). To determine the source of PM2.5 transport on 9 April, a backwards trajectory analysis was conducted (Figure 9d–f). The trajectory clustering analysis revealed that the backwards trajectories could be primarily separated into two clusters, each accounting for 50% of the trajectories. These clusters originated from the western and northern regions of the Changchun region, respectively. The PSCF analysis indicated that these regions were the primary potential sources of PM2.5. Additionally, the CWT analysis suggested that these regions, with a significant number of fire points, contributed more than 90 μg/m3 of PM2.5 to Changchun.

4. Discussion

4.1. Seasonal Vertical Distribution of Aerosols

Previous investigations have demonstrated that in warm regions, such as the Yangtze River Delta region of China, the near-surface aerosol ECs were comparable between summer and winter in most years, with the maximum extinction sometimes occurring during the period from June to September [40]. However, in CRC, the near-surface layer within 1 km exhibits greater ECs during winter than during other months. Furthermore, there were significant differences in the vertical variation trend of EC with height among the different seasons. This is mainly manifested by a significant increase in the nonuniformity of the gradient in the vertical profile of aerosols as the temperature decreases. This difference may be attributed to several factors. First, during winter, a lower PBLH of 1.32 km in Changchun and a higher proportion of AOD within 1 km (65%) were observed, indicating that aerosols were primarily concentrated at lower altitude. Second, the low temperatures during winter may attenuate the atmospheric thermal turbulence in northern China [41], thereby facilitating the accumulation of aerosol particles. Finally, the concentrations of PM2.5 and PM10 in the atmosphere were significantly greater during winter compared to other seasons, primarily due to material combustion for heating purposes. These factors collectively contribute to the increase in ECs near the surface in CRC during the winter. It is worth noting that, due to the inconvenience of data acquisition, the impact of motor vehicles was not fully considered. Further investigation into the impact of motor vehicles is still needed. Additionally, in spring, the extinction characteristics may be influenced by fine particles emitted from centralized biomass burning and wind erosion from bare agricultural land surfaces in CRC. The atmospheric diffusion conditions during spring are more favourable compared to other seasons [42], which could explain the relatively lower EC in spring compared to winter in this region.
The study period revealed a negative correlation coefficient between the PBLH and the concentrations of PM2.5 and PM10. The negative correlation coefficient suggests that as the PBLH decreases, the concentrations of PM2.5 and PM10 increase, indicating a strong link between atmospheric mixing depth and particulate matter concentration. These findings are consistent with similar studies conducted across many regions in China [40,43]. However, the correlation between the PBLH and PM concentration in CRC was weak, which could be due to the impact of various complex meteorological and anthropogenic emissions in the area. For example, the Changchun region has a unique climate, with cold temperatures prevailing throughout the year. Additionally, the region has a high density of industries and factories, leading to significant anthropogenic emissions, which could have influenced the observed weak correlation coefficient. Furthermore, the topography of the region could also play a role in the weak correlation, as it may contribute to the formation of local circulations or wind patterns that could further influence the dispersion and accumulation of particulate matter.
Although the weak correlation between the PBLH and PM concentration in CRC may indicate the complexity of the factors affecting air pollution in the region, it also highlights the need for targeted measures to mitigate the adverse effects of particulate matter pollution. Effective strategies that address the unique circumstances of the region are necessary to promote healthy living environments for the population. Such measures could include the implementation of stricter emission controls for industrial facilities in the area, the promotion of cleaner transportation modes, and the adoption of sustainable agricultural practices, among others. In conclusion, this study provides valuable insights into the relationship between the PBLH and particulate matter concentrations in the Changchun region. Although the weak correlation coefficient observed in CRC underscores the complexity of the factors influencing air pollution in the area, it also highlights the importance of adopting targeted measures to mitigate the adverse effects of particulate matter pollution in the region.

4.2. Typical Aerosol Pollution

To gain a comprehensive understanding of aerosol pollution in urban atmospheres during firework displays, scientists conducted analyses utilizing MODIS data [44]. The analysis revealed that during festival days, India experienced a significant increase of 56–121% in aerosol surface mass loading in the middle Indo-Gangetic Plain compared to that under normal conditions. This indicates that firework displays have a substantial impact on aerosol pollution levels in the region. Furthermore, Joly’s findings [45] indicated that the concentration of PM2.5, which is a fine particulate matter known to have detrimental effects on human health, reached its peak during firework emissions. These concentrations were found to be nearly 1000 times higher than the background level within just one hour. Such high levels of PM2.5 pose serious health risks to the population, highlighting the need for effective measures to mitigate the pollution caused by fireworks. Although our study primarily focused on low-intensity fireworks emissions that did not result in a vertical expansion of the affected area, they still had a considerable impact on the enhancement of EC within the boundary layer. EC is a key component of aerosols and is associated with various adverse health effects. Our research revealed that the emissions from low-intensity fireworks contributed to a significant 76.4% increase in EC concentrations within the boundary layer, further emphasizing the implications of pollution from fireworks.
During the spring season, East Asia frequently experiences the presence of dust aerosols, as indicated by previous research [46]. To identify these dust aerosols in East Asia, past studies have utilized a depolarization ratio threshold of 0.1 [47,48]. For instance, on 15 March 2021, an observed aerosol air mass exhibited a depolarization ratio of 0.11, surpassing the established threshold. This air mass extended vertically up to 3 km, indicating the significant spread and coverage of the dust aerosols in the atmosphere. Furthermore, the concentration of PM10, which includes inhalable particles with diameters that are generally 10 μm and smaller, peaked for the entire year on this day. Additionally, the EC values exceeded the average level for the month of March. These findings suggest a substantial presence of dust aerosols and associated particulate matter pollution during this period, underscoring the environmental and public health implications of such atmospheric conditions in East Asia.
In warmer regions of China, farmers implement crop rotation practices, which results in biomass-burning aerosols being released into the atmosphere during the summer season [49]. However, in colder regions such as Changchun, only one cultivation cycle is possible each year, and as a result, anthropogenic biomass burning is mainly conducted during the spring. Prior research has indicated that biomass-burning aerosols exhibit a lower depolarization ratio and a moderate-to-significant level of EC [47,50]. On 8–9 April, an aerosol air mass with a vertical extent of up to 2 km was observed in the CRC area, showing high values of EC. This indicates that the intensity of biomass burning in this region is higher compared to warmer regions in China. Furthermore, the depolarization ratio of this air mass was found to be lower than 0.1, indicating the presence of biomass-burning aerosols. These findings suggest that anthropogenic biomass-burning activities significantly contribute to the atmospheric pollution in this region. Additionally, on 9 April, an increase in the concentration of PM2.5 was detected, further indicating the presence of pollutants in the atmosphere. High levels of PM2.5 pose serious health risks to the population, especially for those with respiratory issues, highlighting the urgent need for effective measures to mitigate the pollution caused by biomass-burning activities. Overall, the study suggested that the air pollution observed on 8–9 April in the CRC area was primarily associated with the transportation of biomass-burning aerosols. The results illustrate the importance of understanding the impact of different agricultural practices on the environment and the need to adopt sustainable farming methods to minimize the negative consequences of biomass burning on air quality. While the implementation of crop rotation practices may have benefits in some regions, it is essential to consider the associated environmental impacts carefully. By adopting sustainable agricultural practices, we can reduce the adverse effects of biomass burning on air quality and promote healthier living environments for all.

4.3. Implication for Local Pollution Control

During the implementation of air pollution control measures, it is essential to understand the long-term variations in local atmospheric aerosols [51]. However, traditional aerosol monitoring networks are primarily located in developed areas and are designed to capture atmospheric composition characteristics near the surface only. Fortunately, ground-based LiDAR technology allows for the acquisition of long-term and high-resolution vertical profiles of aerosols [52]. In this study, utilizing ground-based LiDAR technology, we found that the ECs in the near-surface layer of in CRC were significantly greater during the winter season than during other seasons. Therefore, it is advisable to implement specific air pollution control measures tailored to the distinct characteristics of winter and summer seasons. A case in point is the observation made on Chinese New Year’s Eve in Changchun, where the daytime and night-time discharge of firecrackers resulted in an elevation of EC levels at a height of 500 m to 0.37 km−1 and 0.88 km−1, respectively. As a potential solution, it is proposed to ease restrictions on firecracker usage during the day while intensifying regulations during night-time hours. Furthermore, through an analysis of data obtained from CALIPSO and backwards trajectory assessments, it was determined that two instances of dust–biomass-burning composite pollution occurred in March and April. The findings revealed that in March, the predominant aerosol component consisted of dust originating from western Changchun, while in April, biomass-burning aerosols stemming from the north and east of Changchun were identified as the primary aerosol component. Consequently, a reduction in the intensity of spring biomass-burning activities could serve as an effective measure to alleviate the prevalence of dust–biomass-burning composite pollution. These insights could offer valuable guidance for formulating emission policies aimed at addressing similar challenges related to the transmission of biomass burning pollutants and firework emissions in other regions.
To effectively control air pollution, it is crucial to establish a comprehensive monitoring network that enables the government to develop informed policies and manage air quality [53]. However, it is important to note that atmospheric pollutants are primarily generated, dispersed, and degraded in the upper troposphere, typically within altitudes ranging from 2 to 8 km above ground level [54]. Consequently, an air pollution episode caused by aerosol transport from the free troposphere may not be effectively addressed only by reducing local anthropogenic sources [55]. This highlights the need for a well-established three-dimensional characterization of air pollutants to ensure informed decision making in policy development. Therefore, we propose the implementation of three-dimensional monitoring in CRC to analyse and forecast the extent and types of air pollution. This approach will not only enhance local pollution control efforts but also safeguard public health.
As for the limitations, although certain vertical structures of aerosol pollution have been emphasized, decades of monitoring are required to reduce the impact of uncertainty and consider other factors, such as chemical generation and natural emissions. In the future, we will continue to conduct long-term monitoring in cold regions and develop aerosol pollution recognition models based on identification elements such as aerosol pollution recognition to provide valuable policy recommendations.

5. Conclusions

In this study, the properties and impacts of atmospheric aerosols in the megacity of Changchun in the CRC were investigated. The nonuniformity of the gradient in the vertical profile of aerosols significantly increased with decreasing temperature. In contrast, in warmer regions, the differences in the aerosol vertical distribution remained relatively consistent across the different seasons. The correlation between the temperature and ground-level PM concentration was greater than that between the planetary boundary layer height and PM concentration. The EC concentration in the near-surface layer (below 1 km) in winter in the CRC was significantly greater than that during the other seasons, which could be attributed to the low PBLH and anthropogenic emissions in winter. The ignition of fireworks in suburban regions on Chinese New Year’s Eve, despite the government’s prohibition in urban areas, led to a substantial increase in aerosol concentrations below the 3 km altitude. Additionally, during the scheduled biomass-burning period, the EC concentration of polluted aerosols originating from the western and northern areas of Changchun below 3 km exceeded the annual average in April, indicating the persistence of high aerosol levels despite the prevailing monsoon winds. The analysis using the CWT method indicated that these regions, characterized by a substantial number of fire points, contributed over 90 μg/m3 of PM2.5 to the air pollution levels in Changchun. Sand–dust activity and biomass burning in March and April could cause severe pollution in this region, even under the conditions of elevated boundary layers. These findings are beneficial for understanding the characteristics of the aerosol variations in cold climates and substantial anthropogenic emissions.

Author Contributions

Conceptualization, L.D., L.G., and Z.X.; data curation, L.D.; formal analysis, Y.Y.; funding acquisition, W.C. and L.G.; investigation, J.F.; methodology, H.Y. and G.S.; project administration, W.C.; resources, W.C.; software, L.D.; supervision, W.C.; validation, Y.Y.; visualization, G.S.; writing—original draft, L.D.; writing—review and editing, W.C. and L.G. All authors have read and agreed to the published version of the manuscript.

Funding

This study was funded by the National Natural Science Foundation of China (No. U23A6001), the Education Department of Jilin Province (No. JJKH20211079KJ), the National Natural Science Foundation of China (No. 41775116), the Strategic Priority Research Program of the Chinese Academy of Sciences (XDA28020400), the Research Foundation of Science and Technology Department of Jilin Province, China (20230508032RC), the Joint Funds of the Key Research and Development Program Project of Jilin Province (20220202028NC) and the Government Project of the Ecology and Environment Department of Jilin Province (2023-11).

Data Availability Statement

Data will be made available on request.

Conflicts of Interest

The Author Hongwu Yang was employed by the Hongke Photonics Company. The remaining authors declare that the research was conducted in the absence of any commercial or financial relationships that could be construed as a potential conflict of interest. The funders had no role in the design of the study; in the collection, analyses, or inter-pretation of data; in the writing of the manuscript; or in the decision to publish the results.

Appendix A

Table A1. Concentration limits of PM2.5, PM10, SO2, CO, NO2, and O3 (8 h) within the air-quality standards of China (GB 3095-2012) [34].
StandardPM2.5
(µg/m3)
PM10
(µg/m3)
SO2
(µg/m3)
CO (mg/m3)NO2
(µg/m3)
O3 (8 h)
(µg/m3)
Grade II75150150480160

References

  1. Prather, K.A.; Hatch, C.D.; Grassian, V.H. Analysis of Atmospheric Aerosols. Annu. Rev. Anal. Chem. 2008, 1, 485–514. [Google Scholar] [CrossRef] [PubMed]
  2. Burnett, R.T.; Pope, C.A.; Ezzati, M.; Olives, C.; Lim, S.S.; Mehta, S.; Shin, H.H.; Singh, G.; Hubbell, B.; Brauer, M.; et al. An Integrated Risk Function for Estimating the Global Burden of Disease Attributable to Ambient Fine Particulate Matter Exposure. Environ. Health Perspect. 2014, 122, 397–403. [Google Scholar] [CrossRef] [PubMed]
  3. Menon, S. Current uncertainties inassessing aerosol effects on climate. Annu. Rev. Environ. Resour. 2004, 29, 1–30. [Google Scholar] [CrossRef]
  4. Mhawish, A.; Banerjee, T.; Sorek-Hamer, M.; Lyapustin, A.; Broday, D.M.; Chatfield, R. Comparison and evaluation of MODIS Multi-angle Implementation of Atmospheric Correction (MAIAC) aerosol product over South Asia. Remote Sens. Environ. 2019, 224, 12–28. [Google Scholar] [CrossRef]
  5. Chen, W.; Duanmu, L.; Qin, Y.; Yang, H.W.; Fu, J.; Lu, C.W.; Feng, W.; Guo, L. Lockdown-induced urban aerosol change over Changchun, China during COVID-19 outbreak with polarization LiDAR. Chin. Geogr. Sci. 2022, 32, 824–833. [Google Scholar] [CrossRef] [PubMed]
  6. She, L.; Mei, L.L.; Xue, Y.; Che, Y.H.; Guang, J. SAHARA: A Simplified Atmospheric Correction Algorithm for Chinese gaofen Data: 1. Aerosol Algorithm. Remote Sens. 2017, 9, 21. [Google Scholar] [CrossRef]
  7. Sorribas, M.; Andrews, E.; Ogren, J.A.; del Aguila, A.; Fraile, R.; Sheridan, P.; Yela, M. Climatological study for understanding the aerosol radiative effects at southwest Atlantic coast of Europe. Atmos. Environ. 2019, 205, 52–66. [Google Scholar] [CrossRef]
  8. Yu, H.B.; Chin, M.; Winker, D.M.; Omar, A.H.; Liu, Z.Y.; Kittaka, C.; Diehl, T. Global view of aerosol vertical distributions from CALIPSO lidar measurements and GOCART simulations: Regional and seasonal variations. J. Geophys. Res. Atmos. 2010, 115, 19. [Google Scholar] [CrossRef]
  9. Amiridis, V.; Wandinger, U.; Marinou, E.; Giannakaki, E.; Tsekeri, A.; Basart, S.; Kazadzis, S.; Gkikas, A.; Taylor, M.; Baldasano, J.; et al. Optimizing CALIPSO Saharan dust retrievals. Atmos. Chem. Phys. 2013, 13, 12089–12106. [Google Scholar] [CrossRef]
  10. Cheng, Y.M.; Dai, T.; Goto, D.; Schutgens, N.A.J.; Shi, G.Y.; Nakajima, T. Investigating the assimilation of CALIPSO global aerosol vertical observations using a four-dimensional ensemble Kalman filter. Atmos. Chem. Phys. 2019, 19, 13445–13467. [Google Scholar] [CrossRef]
  11. Li, J.W.; Han, Z.W. Aerosol vertical distribution over east China from RIEMS-Chem simulation in comparison with CALIPSO measurements. Atmos. Environ. 2016, 143, 177–189. [Google Scholar] [CrossRef]
  12. Wang, Y.; Zhuang, G.; Xu, C.; An, Z. The air pollution caused by the burning of fireworks during the lantern festival in Beijing. Atmos. Environ. 2007, 41, 417–431. [Google Scholar] [CrossRef]
  13. Lai, Y.; Brimblecombe, P. Changes in Air Pollutants from Fireworks in Chinese Cities. Atmosphere 2022, 13, 1388. [Google Scholar] [CrossRef]
  14. Yao, W.; Zhao, Y.; Chen, R.; Wang, M.; Song, W.; Yu, D. Emissions of Toxic Substances from Biomass Burning: A Review of Methods and Technical Influencing Factors. Processes 2023, 11, 853. [Google Scholar] [CrossRef]
  15. Jiang, K.; Xing, R.; Luo, Z.; Huang, W.; Yi, F.; Men, Y.; Zhao, N.; Chang, Z.; Zhao, J.; Pan, B.; et al. Pollutant emissions from biomass burning: A review on emission characteristics, environmental impacts, and research perspectives. Particuology 2023, 85, 296–309. [Google Scholar] [CrossRef]
  16. Yang, T.; Gbaguidi, A.; Yan, P.Z.; Zhang, W.D.; Zhu, L.L.; Yao, X.F. Model elucidating the sources and formation mechanisms of severe haze pollution over Northeast mega-city cluster in China. Environ. Pollut. 2017, 230, 692–700. [Google Scholar] [CrossRef] [PubMed]
  17. Chen, S.; Jiang, L.; Liu, W.; Song, H. Fireworks regulation, air pollution, and public health: Evidence from China. Reg. Sci. Urban Econ. 2022, 92, 103722. [Google Scholar] [CrossRef]
  18. Tomlin, A.S. Air quality and climate impacts of biomass use as an energy source: A review. Energy Fuels 2021, 35, 14213–14240. [Google Scholar] [CrossRef]
  19. Chen, J.; Li, C.; Ristovski, Z.; Milic, A.; Gu, Y.; Islam, M.S.; Wang, S.; Hao, J.; Zhang, H.; He, C.; et al. A review of biomass burning: Emissions and impacts on air quality, health and climate in China. Sci. Total Environ. 2017, 579, 1000–1034. [Google Scholar] [CrossRef]
  20. Yin, S.; Wang, X.F.; Zhang, X.R.; Zhang, Z.X.; Xiao, Y.; Tani, H. Exploring the effects of crop residue burning on local haze pollution in Northeast China using ground and satellite data. Atmos. Environ. 2019, 199, 189–201. [Google Scholar] [CrossRef]
  21. Li, L.L.; Wang, K.; Chen, W.W.; Zhao, Q.L.; Liu, L.J.; Liu, W.; Liu, Y.; Jiang, J.Q.; Liu, J.M.; Zhang, M.D. Atmospheric pollution of agriculture-oriented cities in Northeast China: A case in Suihua. J. Environ. Sci. 2020, 97, 85–95. [Google Scholar] [CrossRef] [PubMed]
  22. Li, C.; Liu, M.; Hu, Y.; Wang, H.; Xiong, Z.; Wu, W.; Liu, C.; Zhang, C.; Du, Y. Investigating the vertical distribution patterns of urban air pollution based on unmanned aerial vehicle gradient monitoring. Sustain. Cities Soc. 2022, 86, 104144. [Google Scholar] [CrossRef]
  23. Dickerson, R.R.; Li, C.; Li, Z.; Marufu, L.T.; Stehr, J.W.; McClure, B.; Krotkov, N.; Chen, H.; Wang, P.; Xia, X.; et al. Aircraft observations of dust and pollutants over northeast China: Insight into the meteorological mechanisms of transport. J. Geophys. Res. 2007, 112, D24S90. [Google Scholar] [CrossRef]
  24. Ma, Y.; Zhao, H.; Dong, Y.; Che, H.; Li, X.; Hong, Y.; Li, X.; Yang, H.; Liu, Y.; Wang, Y.; et al. Comparison of two air pollution episodes over Northeast China in winter 2016/17 using ground-based lidar. J. Meteorol. Res. 2018, 32, 313–323. [Google Scholar] [CrossRef]
  25. Zhao, H.; Gui, K.; Ma, Y.; Wang, Y.; Wang, Y.; Wang, H.; Zheng, Y.; Li, L.; Zhang, L.; Che, H.; et al. Seasonal evolution of aerosol loading and its vertical distribution in northeastern China from long-term satellite observations and model reanalysis. Atmos. Environ. 2023, 302, 119720. [Google Scholar] [CrossRef]
  26. Li, X.; Ma, Y.; Wang, Y.; Wei, W.; Zhang, Y.; Liu, N.; Hong, Y. Vertical Distribution of Particulate Matter and its Relationship with Planetary Boundary Layer Structure in Shenyang, Northeast China. Aerosol Air Qual. Res. 2019, 19, 2464–2476. [Google Scholar] [CrossRef]
  27. Wang, F.; Li, Z.; Ren, X.; Jiang, Q.; He, H.; Dickerson, R.R.; Lv, F. Vertical distributions of aerosol optical properties during the spring 2016 ARIAs airborne campaign in the North China Plain. Atmos. Chem. Phys. 2018, 18, 8995–9010. [Google Scholar] [CrossRef]
  28. Zhang, M.D.; Zhang, S.C.; Bao, Q.Y.; Yang, C.J.; Qin, Y.; Fu, J.; Chen, W.W. Temporal Variation and Source Analysis of Carbonaceous Aerosol in Industrial Cities of Northeast China during the Spring Festival: The Case of Changchun. Atmosphere 2020, 11, 18. [Google Scholar] [CrossRef]
  29. Fernald, F.G. Analysis of atmospheric lidar observations: Some comments. Appl. Optics 1984, 23, 652. [Google Scholar] [CrossRef]
  30. Han, Y.; Wu, Y.H.; Wang, T.J.; Zhuang, B.L.; Li, S.; Zhao, K. Impacts of elevated-aerosol-layer and aerosol type on the correlation of AOD and particulate matter with ground-based and satellite measurements in Nanjing, southeast China. Sci. Total Environ. 2015, 532, 195–207. [Google Scholar] [CrossRef]
  31. Sirois, A.; Bottenheim, J.W. Use of backward trajectories to interpret the 5-year record of PAN and O3 ambient air concentrations at Kejimkujik National Park, Nova Scotia. J. Geophys. Res. Atmos. 1995, 100, 2867–2881. [Google Scholar] [CrossRef]
  32. Han, Y.J.; Holsen, T.M.; Hopke, P.K. Estimation of source locations of total gaseous mercury measured in New York State using trajectory-based models. Atmos. Environ. 2007, 41, 6033–6047. [Google Scholar] [CrossRef]
  33. Xin, Y.J.; Wang, G.C.; Chen, L. Identification of Long-Range Transport Pathways and Potential Sources of PM10 in Tibetan Plateau Uplift Area: Case Study of Xining, China in 2014. Aerosol. Air Qual. Res. 2016, 16, 1044–1054. [Google Scholar] [CrossRef]
  34. GB 3095-2012Ambient Air Quality Standards of the People’s Republic of China; The Ministry of Environmental Protection of the People’s Republic of China: Beijing, China, 2016. Available online: http://www.mee.gov.cn/ywgz/fgbz/bz/bzwb/dqhjbh/dqhjzlbz/201203/W020120410330232398521.pdf (accessed on 21 February 2021).
  35. World Health Organization. WHO Global Air Quality Guidelines: Particulate Matter (PM2.5 and PM10), Ozone, Nitrogen Dioxide, Sulfur Dioxide and Carbon Monoxide. 2021. Available online: https://iris.who.int/handle/10665/345329. (accessed on 21 February 2021).
  36. Freudenthaler, V.; Esselborn, M.; Wiegner, M.; Heese, B.; Tesche, M.; Ansmann, A. Depolarization ratio profiling at several wavelengths in pure Saharan dust during SAMUM 2006. Tellus B Chem. Phys. Meteorol. 2009, 61, 165–179. [Google Scholar] [CrossRef]
  37. Zhao, H.; Che, H.; Wang, Y.; Dong, Y.; Ma, Y.; Li, X.; Hong, Y.; Yang, H.; Liu, Y.; Wang, Y.; et al. Aerosol vertical distribution and typical air pollution episodes over northeastern China during 2016 analyzed by ground-based lidar. Aerosol. Air Qual. Res. 2018, 18, 918–937. [Google Scholar] [CrossRef]
  38. Liu, Y.; Zhao, H.; Ma, Y.; Yang, H.; Wang, Y.; Wang, H.; Zhang, Y.; Zou, X.; Wang, H.; Wen, R.; et al. Characteristics of particulate matter and meteorological conditions of a typical air-pollution episode in Shenyang, northeastern China, in winter 2017. Atmos. Pollut. Res. 2021, 12, 316–327. [Google Scholar] [CrossRef]
  39. Zhao, H.; Che, H.; Zhang, L.; Gui, K.; Ma, Y.; Wang, Y.; Wang, H.; Zheng, Y.; Zhang, X. How aerosol transport from the North China plain contributes to air quality in northeast China. Sci. Total Environ. 2020, 738, 139555. [Google Scholar] [PubMed]
  40. Fan, W.Z.; Qin, K.; Xu, J.; Yuan, L.M.; Li, D.; Jin, Z.; Zhang, K.F. Aerosol vertical distribution and sources estimation at a site of the Yangtze River Delta region of China. Atmos. Res. 2019, 217, 128–136. [Google Scholar] [CrossRef]
  41. Tao, M.H.; Chen, L.F.; Li, R.; Wang, L.L.; Wang, J.; Wang, Z.F.; Tang, G.Q.; Tao, J.H. Spatial oscillation of the particle pollution in eastern China during winter: Implications for regional air quality and climate. Atmos. Environ. 2016, 144, 100–110. [Google Scholar] [CrossRef]
  42. Fu, J.; Song, S.T.; Guo, L.; Chen, W.W.; Wang, P.; Duanmu, L.J.; Shang, Y.J.; Shi, B.W.; He, L.Y. Interprovincial Joint Prevention and Control of Open Straw Burning in Northeast China: Implications for Atmospheric Environment Management. Remote Sens. 2022, 14, 17. [Google Scholar] [CrossRef]
  43. Miao, Y.C.; Liu, S.H. Linkages between aerosol pollution and planetary boundary layer structure in China. Sci. Total Environ. 2019, 650, 288–296. [Google Scholar] [CrossRef] [PubMed]
  44. Kumar, M.; Singh, R.K.; Murari, V.; Singh, A.K.; Singh, R.S.; Banerjee, T. Fireworks induced particle pollution: A spatio-temporal analysis. Atmos. Res. 2016, 180, 78–91. [Google Scholar] [CrossRef]
  45. Joly, A.; Smargiassi, A.; Kosatsky, T.; Fournier, M.; Dabek-Zlotorzynska, E.; Celo, V.; Mathieu, D.; Servranckx, R.; D’Amours, R.; Malo, A.; et al. Characterisation of particulate exposure during fireworks displays. Atmos. Environ. 2010, 44, 4325–4329. [Google Scholar] [CrossRef]
  46. Kim, S.W.; Yoon, S.C.; Kim, J.; Kang, J.Y.; Sugimoto, N. Asian dust event observed in Seoul, Korea, during 29–31 May 2008: Analysis of transport and vertical distribution of dust particles from lidar and surface measurements. Sci. Total Environ. 2010, 408, 1707–1718. [Google Scholar] [CrossRef] [PubMed]
  47. Fan, S.D.; Liu, C.; Xie, Z.Q.; Dong, Y.S.; Hu, Q.H.; Fan, G.Q.; Chen, Z.Y.; Zhang, T.S.; Duan, J.B.; Zhang, P.F.; et al. Scanning vertical distributions of typical aerosols along the Yangtze River using elastic lidar. Sci. Total Environ. 2018, 628–629, 631–641. [Google Scholar] [CrossRef] [PubMed]
  48. Liu, J.J.; Zheng, Y.F.; Li, Z.Q.; Flynn, C.; Cribb, M. Seasonal variations of aerosol optical properties, vertical distribution and associated radiative effects in the Yangtze Delta region of China. J. Geophys. Res. Atmos. 2012, 117, 16. [Google Scholar] [CrossRef]
  49. Sun, T.Z.; Che, H.Z.; Qi, B.; Wang, Y.Q.; Dong, Y.S.; Xia, X.G.; Wang, H.; Gui, K.; Zheng, Y.; Zhao, H.J.; et al. Characterization of vertical distribution and radiative forcing of ambient aerosol over the Yangtze River Delta during 2013–2015. Sci. Total Environ. 2019, 650, 1846–1857. [Google Scholar] [CrossRef] [PubMed]
  50. Burton, S.P.; Ferrare, R.A.; Hostetler, C.A.; Hair, J.W.; Rogers, R.R.; Obland, M.D.; Butler, C.F.; Cook, A.L.; Harper, D.B.; Froyd, K.D. Aerosol classification using airborne High Spectral Resolution Lidar measurements—Methodology and examples. Atmos. Meas. Tech. 2012, 5, 73–98. [Google Scholar] [CrossRef]
  51. Lu, X.; Hong, J.Y.; Zhang, L.; Cooper, O.R.; Schultz, M.G.; Xu, X.B.; Wang, T.; Gao, M.; Zhao, Y.H.; Zhang, Y.H. Severe Surface Ozone Pollution in China: A Global Perspective. Environ. Sci. Technol. Lett. 2018, 5, 487–494. [Google Scholar] [CrossRef]
  52. Badarinath, K.V.S.; Kharol, S.K.; Sharma, A.R. Long-range transport of aerosols from agriculture crop residue burning in 517 Indo-Gangetic Plains-A study using LIDAR, ground measurements and satellite data. J. Atmos. Sol. Terr. Phys. 2009, 71, 112–120. [Google Scholar] [CrossRef]
  53. Jin, Y.N.; Andersson, H.; Zhang, S.Q. Air Pollution Control Policies in China: A Retrospective and Prospects. Int. J. Environ. Res. Public Health 2016, 13, 22. [Google Scholar] [CrossRef]
  54. Liu, C.; Gao, M.; Hu, Q.H.; Brasseur, G.P.; Carmichael, G.R. Stereoscopic Monitoring A Promising Strategy to Advance Diagnostic and Prediction of Air Pollution. Bull. Am. Meteorol. Soc. 2021, 102, E730–E737. [Google Scholar] [CrossRef]
  55. Colette, A.; Menut, L.; Haeffelin, M.; Morille, Y. Impact of the transport of aerosols from the free troposphere towards the boundary layer on the air quality in the Paris area. Atmos. Environ. 2008, 42, 390–402. [Google Scholar] [CrossRef]
Figure 1. The elevation and land-use types surrounding Changchun City in the cold region of China. The grey outline shows the administrative boundary of Jilin Province; the red circle represents the LiDAR monitoring site in Changchun.
Remotesensing 16 01098 g001
Figure 2. Monthly averaged profiles of aerosol extinction coefficients and monthly ratios of the aerosol optical depth (AOD) in different layers to the TAOD retrieved from LiDAR in the cold region of China from October 2020 to September 2021 during the day (6:00–18:00). Note: AOD1, AOD2, AOD3, and TAOD were used to indicate the AODs within the height ranges of 0–1 km, 1–2 km, 2–3 km, and 0–3 km, respectively.
Remotesensing 16 01098 g002
Figure 3. Monthly variations in (a) planetary boundary layer height (PBLH), (b) air temperature, and (c) relative humidity in the cold region of China from October 2020 to September 2021.
Remotesensing 16 01098 g003
Figure 4. Daily variation in AQI with aerosol pollution type (when daily AQI value is over 100) and (ae) characteristic radar chart for pollution cases in the cold region of China from October to November 2020 (Note: Columns under five aerosol pollution scenarios are marked with grey circles).
Remotesensing 16 01098 g004
Figure 5. Variations in the (a) extinction coefficient (EC, 532 nm), (b) depolarization ratio, and (c) concentrations of PM2.5, PM10, and planetary boundary layer height (PBLH) in the cold region of China during a firework event (11–14 February 2021).
Remotesensing 16 01098 g005
Figure 6. Variations in the (a) extinction coefficient (EC, 532 nm); (b) depolarization ratio; (c) concentrations of PM2.5, PM10, and planetary boundary layer height (PBLH); (d) mean 48-hour backwards trajectories; (e) spatial distributions of WPSCF values for PM10; and (f) spatial distributions of WCWT values for PM10 in the cold region of China during a dust event (14–16 March 2021).
Remotesensing 16 01098 g006
Figure 7. CALIPSO L2 products of (a,b) aerosol subtype, (c,d) vertical feature mask, and their ground track in the cold region of China on 17 March 2021 and 9 April 2021 (Note: The vertical feature mask at a height of 1 km is shown on the track).
Remotesensing 16 01098 g007
Figure 8. Daily variations of total fire points in Changchun from October 2020 to September 2021.
Remotesensing 16 01098 g008
Figure 9. Variations of the (a) extinction coefficient (EC, 532 nm), (b) depolarization ratio, (c) concentrations of PM2.5 and PM10 and planetary boundary layer height (PBLH), (d) mean 48-hour backward trajectories, (e) spatial distributions of WPSCF values for PM2.5, and (f) spatial distributions of WCWT values for PM2.5 (f) in the cold region of China during a biomass-burning event (8–10 April 2021).
Remotesensing 16 01098 g009
Table 1. The AOD of each height range and their ratio to the TAOD in different seasons.
SeasonAOD1 1AOD2 2AOD3 3TAOD 4AOD1/
TAOD
AOD2/
TAOD
AOD3/
TAOD
Spring 0.155 0.136 0.069 0.359 43.13%37.78%19.09%
Summer 0.169 0.141 0.058 0.368 45.83%38.42%15.75%
Autumn 0.117 0.078 0.042 0.237 49.36%32.86%17.77%
Winter 0.180 0.067 0.032 0.279 64.59%24.09%11.32%
1 AOD1, the integral of the extinction coefficients between the heights of 0.27 km and 1 km; 2 AOD2, the integral of the extinction coefficients between the heights of 1 km and 2 km; 3 AOD3, the integral of the extinction coefficients between the heights of 2 km and 3 km; 4 TAOD, the integral of the extinction coefficients between the heights of 0.27 km and 3 km.
Table 2. Correlation coefficients among the PM concentrations, AOD, PBLH, air temperature, and relative humidity in Changchun.
PM2.5PM10AOD1AOD2AOD3TAODPBLHATRH
PM2.510.7360.277−0.169−0.2450.032 *−0.245−0.358−0.133
PM10-10.24−0.029 *−0.1 *0.112−0.159−0.166−0.343
AOD1--10.387−0.048 *0.8−0.304−0.015 *0.264
AOD2---10.4030.8080.071 *0.3060.241
AOD3----10.440.4190.1740.139
TAOD-----−1−0.041 *0.1760.317
PBLH------10.2620.053 *
AT-------10.144
RH--------1
Note: The significance was investigated using the independent-samples t-test. A value with an asterisk (*) (p > 0.05) is not significant at a confidence level of 95%. PBLH, planetary boundary layer height; AT, air temperature; RH, relative humidity.
Table 3. The number of days in which the concentrations of PM2.5, PM10, SO2, CO, NO2, and O3 (8 h) exceeded Grade Ⅱ and the WHO 2021 AQG from October 2020 to September 2021.
PeriodPM2.5
(GB/WHO)
PM10
(GB/WHO)
SO2
(GB/WHO)
NO2
(GB/WHO)
CO
(GB/WHO)
O3
(GB/WHO)
Jan. 20216/311/200/01/270/00/0
Feb. 20216/281/160/00/150/00/2
Mar. 20214/294/250/00/250/00/4
Apr. 20214/282/280/00/220/01/14
May 20210/280/250/00/200/04/15
June 20210/110/60/00/190/02/14
July 20210/180/60/00/110/00/11
Aug. 20210/100/50/00/80/00/7
Sept. 20210/110/80/00/200/00/3
Oct. 20201/210/170/00/240/00/4
Nov. 20201/250/200/00/240/00/0
Dec. 20200/311/200/00/290/00/0
Disclaimer/Publisher’s Note: The statements, opinions and data contained in all publications are solely those of the individual author(s) and contributor(s) and not of MDPI and/or the editor(s). MDPI and/or the editor(s) disclaim responsibility for any injury to people or property resulting from any ideas, methods, instructions or products referred to in the content.

