
Seasonal Variation in Vertical Structure for Stratiform Rain at Mêdog Site in Southeastern Tibetan Plateau

1
State Key Laboratory of Severe Weather, Chinese Academy of Meteorological Science, Beijing 100081, China
2
Mêdog National Climate Observatory, Nyingchi 860700, China
*
Author to whom correspondence should be addressed.
Remote Sens. 2024, 16(7), 1230; https://doi.org/10.3390/rs16071230
Submission received: 16 February 2024
/
Revised: 28 March 2024
/
Accepted: 28 March 2024
/
Published: 30 March 2024
(This article belongs to the Special Issue Advance of Radar Meteorology and Hydrology II)
Abstract
:Mêdog is located at the entrance of the water vapor channel of the Yarlung Tsangpo Great Canyon on the southeastern Tibetan Plateau (TP). In this study, the seasonal variation in the microphysical vertical structure of stratiform precipitation at the Mêdog site in 2022 was investigated using micro rain radar (MRR) observations, as there is a lack of similar studies in this region. The average melting layer height is the lowest in February, after which it gradually increases, reaches its peak in August, and then gradually decreases. For lower rain categories, the vertical distribution of small drops remains uniform in winter below the melting layer. The medium-sized drops show slight increases, leading to negative gradients in the microphysical profiles. Slight or evident decreases in concentrations of small drops are observed with decreasing height in the premonsoon, monsoon, and postmonsoon seasons, likely due to significant evaporation. The radar reflectivity, rain rate, and liquid water content profiles decrease with decreasing height according to the decrease in concentrations of small drops. With increasing rain rate, the drop size distribution (DSD) displays significant variations in winter, and the fall velocity decreases rapidly with decreasing height. In the premonsoon, monsoon, and postmonsoon seasons, the concentrations of large drops significantly decrease below the melting layer because of the breakup mechanism, leading to the decreases in the fall velocity profiles with decreasing height during these seasons. Raindrops with sizes ranging from 0.3–0.5 mm are predominant in terms of the total drop number concentration in all seasons. Precipitation in winter and postmonsoon seasons is mainly characterized by small raindrops, while that in premonsoon and monsoon seasons mainly comprises medium-sized raindrops. Understanding the seasonal variation in the vertical structure of precipitation in Mêdog will improve the radar quantitative estimation and the use of microphysical parameterization schemes in numerical weather forecast models over the TP.
1. Introduction
Precipitation plays a crucial role in the Earth’s climate system, influencing various aspects of weather and climate. A comprehensive understanding of the structural characteristics, microphysical processes, and drop size distribution (DSD) of precipitation is highly important for enhancing radar-based quantitative precipitation estimation (QPE) and improving microphysical parameterization schemes in numerical weather prediction models [1,2].
Although previous studies have focused predominantly on the characteristics of precipitation during the rainy season, distinct seasonal variations exist in the microphysical characteristics of precipitation. Notably, Wen et al. [3] discerned the dominance of convective precipitation during the summer months in eastern China, with stratiform precipitation contributing significantly in other seasons. Zeng et al. [4] analyzed the dynamic and microphysical characteristics of precipitation in the South China Sea and revealed that small raindrops are prevalent during premonsoon season, medium-sized raindrops dominate during monsoon season, and raindrop concentrations are lowest during postmonsoon season. Kozu et al. [5] reported that raindrops in the southwestern monsoon at Gadanki are generally larger than those in the northeastern monsoon. However, ground-level DSDs may not fully represent the characteristics of precipitation in the atmosphere due to evaporation, coalescence, and breakup of raindrops during fallout. Feng et al. [6] highlighted that the surface average DSD was narrower and steeper in shape than the upper DSD according to aircraft observations.
Micro rain radar (MRR), a low-cost, miniaturized vertical directional Doppler rain radar, has been widely used for measuring the vertical structure of precipitation [7]. Das et al. [8] utilized the MRR to explore the vertical profiles of precipitation in the tropical regions of India and found distinct variations in the vertical profiles of rain under different rain rates, with heavier rainfall events exhibiting pronounced vertical variation and more significant collision effects during raindrop descent. Based on MRR observations, the diurnal variation in the vertical structure of DSDs associated with stratiform rain in the Kototabang region of West Sumatra, Indonesia, was investigated by Ramadhan et al. [9]. These researchers reported that nocturnal precipitation (e.g., 0000–0600 LST and 1800–2400 LST) has a lower number concentration of small raindrops and a higher number concentration of large raindrops than daytime precipitation (e.g., 0600–1800 LST).
The Tibetan Plateau (TP) is a prominent inland plateau in Asia and is known as the “Roof of the World” and “Water Tower of Asia” due to its high elevation and the origin of several important rivers. Clouds and precipitation over the TP have a significant impact on climate change and the formation and development of severe weather events in China [10,11]. Due to the complex terrain and sparse ground observation stations across the TP, previous research has relied heavily on satellite measurements [12,13,14,15,16]. However, there is still some uncertainty in satellite products of clouds and precipitation over the TP due to the complex terrain of the region [17]. For example, Zhang et al. [18] reported that the rainfall product from the global precipitation measurement (GPM) overestimates the maximum rainfall intensity across the whole TP. Fu et al. [19] investigated the characteristics of precipitation types in summer over the TP via Tropical Rainfall Measuring Mission (TRMM) datasets; the result shows that the frequency of precipitation in summer over the TP is increasing from the western to the eastern plateau, but the 2A25, version 7 misjudges the stratiform precipitation is predominant over the TP (accounting for up to 85%). Yan et al. [20] investigated the vertical structure of clouds and their connection with precipitation and cloud radiative effects (CRE) via CloudSat and CALIPSO datasets, but due to the limitations of local time sampling by satellite observations, more precise information needs to be combined with ground-based observations. To better understand the three-dimensional structural characteristics of clouds and precipitation over the TP, a Ka-band cloud radar, an X-band dual polarization radar, a C-band frequency-modulated continuous-wave (C-FMCW) radar, and an MRR were deployed in the central part of the TP during “the Third Tibetan Plateau Atmospheric Science Experiment” (TIPEX-III) [21]. Based on these ground-based cloud and precipitation observations, Chang et al. [22] investigated the characteristics of the vertical structures and DSDs of convective clouds and precipitation and revealed that convective activities were mainly concentrated in the central and southeastern TP, with obvious diurnal variation. However, there are significant differences in the spatial distribution of precipitation across the TP due to the influences of westerly monsoon synergy and complex topography. The representativeness of a single ground-based observation site is poor.
Mêdog is located in a key area of the water vapor channel of the Yarlung Tsangpo Grand Canyon (YTGC), through which warm and moist water vapor from the Indian Ocean is transported to the whole TP. To investigate multiscale water vapor conversion and the influence mechanisms of water resources, a cloud and precipitation field campaign was performed at the Mêdog National Climate Observatory (MNCO) in 2019 by the Academy of Meteorological Sciences (CAMS). An X-band dual-polarization phased array radar (X-PAR), a disdrometer, a micro rain radar (MRR) instrument, and other instruments were successively deployed at MNCO. Based on these remote sensing instruments, the characteristics of clouds and precipitation in key areas of the water vapor channel were investigated. Cloud cover frequently occurs over Mêdog, and clouds usually form at night and gradually dissipate during the day [23]. The convective rainfall in the premonsoon season has more large raindrops due to the predominant cold rain process and deeper convective activity, while the monsoon season convective rainfall is characterized by a large number of small- and medium-sized raindrops and is close to maritime-like due to abundant warm and humid flows [24,25]. The height of the bright band (BB) in Mêdog varies significantly with season, and ice crystal growth above the BB in the dry season is more obvious than that in the rainy season [26]. However, there have been no studies examining the vertical structure of precipitation and its seasonal variation in the Mêdog region. Therefore, this study investigated the seasonal variation in the vertical structural characteristics of stratiform precipitation in Mêdog by using MRR measurements at MNCO, considering the deviation in MRR measurements caused by strong updrafts in convective precipitation [27].
2. Data and Methods
2.1. Site and Instruments
The mean annual precipitation in Mêdog exceeds 2000 mm, exhibiting significant seasonal variation [25]. To investigate the seasonal variation in the vertical structure of stratiform rain in Mêdog, measurements were collected from the MRR-pro at MNCO (95.32°E, 29.31°N; 1305 m above sea level) during the period from 1 January 2022 to 31 December 2022. The MRR measurements were divided into four seasons following Li et al. [25]: winter (January–February), premonsoon (March–May), monsoon (June–September), and postmonsoon (October–December). Figure 1 shows the mean vertical integral of the water vapor flux in the different seasons, superimposed on the position of the MNCO and the topography of the TP. The monsoon season exhibits the maximum water vapor flux due to abundant warm and humid flows from the Indian Ocean. The premonsoon season is similar to the postmonsoon season, with the minimum water vapor flux occurring in winter, when westerly winds bring dry and cold airflow.
The MRR-pro used in this study is a K-band (24.23 GHz) vertical pointing, frequency-modulated continuous wave (FMCW) Doppler radar manufactured by the METEK Meteorologische Messtechnik GmbH, Elmshorn, Germany. The MRR estimates the drop size distributions (DSDs) from Doppler spectra based on the empirical relation between terminal fall velocity and drop size [28]. Once the DSD is estimated, other rain parameters, such as the mean fall velocity, rain rate, liquid water content, and radar reflectivity, can be calculated. The main specifications of MRR-pro are shown in Table 1. MRR-pro has an adjustable high spatiotemporal resolution, with a minimum temporal (range) resolution of 1 s (10 m). In this study, the temporal (range) resolution was set to 1 min (50 m). The number of range gates was set to 128; therefore, the MRR-pro’s maximum measurement height reaches 6400 m (above ground level, same as later), exceeding the melting layer level in Mêdog (approximately 4600 m in the monsoon season). Thus, MRR-pro can completely observe the variations in the vertical structure below the melting layer.
To establish the credibility of the MRR, the time series of rainfall rates at a height of 150 m from the MRR were compared to those from a collocated rain gauge, considering that its first two range gates might be contaminated by ground echoes. Figure 2 shows an example of a comparison of rain rates (5 min average) from 0100 to 0800 local standard time (LST) on 14 May 2022. The MRR and the rain gauge data exhibited very good agreement in terms of their rainfall trends, with a correlation coefficient (CC) exceeding 0.88. However, the 5 min rainfall trend of the tipping-bucket gauge exhibits frequent pulsations, likely attributed to its coarse sensitivity of 0.1 mm. However, the MRR tends to underestimate the gauge rainfall, with a mean bias of 3.02%. Besides, the mean and standard deviation of D (mm)and ND (in log scale) is calculated, the mean of D (ND) is 1.51 (1.27), and the standard deviation of D (ND) is 1.34 (2.64).
2.2. Rain Parameter Calculation
The concentration (N (D, h)) of raindrops with diameter D at height h can be calculated from the reflectivity spectra η (D, h) at height h and the single-particle backscattering cross section σ(D):
σ(D) can be derived based on Mie scattering theory. The η (D, h) value is related to the Doppler velocity, which is directly measured by the MRR:
where (η (v, h)) is the Doppler spectrum and D (v, h) is the diameter of raindrops at height h. Under the zero vertical wind assumption, the relation between the terminal fall velocity of raindrops and D (v, h) is given by the following:
where δ(h) is the air density correction factor and was given by Foote and Toit [29]:
When the DSD is known, the radar reflectivity (Z, dB), rain rate (R, mm h−1), and liquid water content (LWC, g m−3) can be calculated as follows:
The mean fall velocity (VEL, m s−1) is directly calculated from the Doppler spectrum. The first moment of the Doppler spectra (i1) is the usual way to determine radial velocities:
where δf is the frequency resolution and λ is the radar wavelength. The MRR products were corrected through path integrated attenuation (PIA) if PIA ≤ 10 was reached [30]. Therefore, the attenuation effect of the MRR can be ignored for weak and moderate precipitation.
2.3. Stratiform Rain Identification
The presence of a strong updraft in convective rainfall contradicts the assumption of zero vertical wind, and heavy rainfall tends to result in significant rain attenuation for MRR measurements. Additionally, in Mêdog, stratiform precipitation predominates, accounting for approximately 95% of the accumulated rain duration [31]. Therefore, this paper primarily focuses on the vertical structures of stratiform precipitation and their seasonal variations in Mêdog. The bright band (BB) serves as an important indicator for identifying stratiform rain [9]. In this study, the gradient of falling velocity (GFV) method, proposed by Wang et al. [32], was utilized to determine the BB bottom. The GFV was calculated at each range gate of the MRR, and the maximum GFV was used to determine the height of the BB bottom. This approach is adopted because as ice particles further melt after falling into the BB, there is an increase in density and a faster falling velocity [33,34]. In addition, the gradient of Ze above the BB bottom was calculated, and the maximum gradient was used to define the height of the BB top. An example of the identification of the BB bottom and top heights is given in Figure 3. The maximum GFV values were located at the bottom of the melting layer (Figure 3a). The corresponding time-height reflectivity factor (RF) observed by the MRR from 0000 to 0700 LST on 10 February 2022 is shown in Figure 3b, where the solid red line marks the BB bottom calculated by the maximum GFV. The identified BB bottom height is consistent with the bottom of the strong radar RF related to ice-phase hydrometeors with raincoat. The height of the BB top with a solid black line in Figure 3b indicates the 0 °C- isotherm layer, which is in good agreement with the height of the strong radar RF. This finding suggests the feasibility of this method for identifying stratiform precipitation.
The stratiform precipitation events determined based on the GFV method were divided into four rain rate categories, namely very light rain (R1, 0.1 ≤ R < 1 mm h−1), light rain (R2, 1 ≤ R < 2 mm h−1), moderate rain (R3, 2 ≤ R < 5 mm h−1), and heavy rain (R4, 5 ≤ R < 10 mm h−1). The samples for each category in the four seasons are shown in Table 2. Due to abundant water vapor, the monsoon season has the most samples, followed by the premonsoon and postmonsoon seasons, and winter has the least. The samples in the R1 category are the most common in all seasons, accounting for more than 50% of the total stratiform precipitation samples.
The height of the BB bottom in Mêdog has obvious seasonal variations (Figure 4). The average monthly BB bottom height is the lowest in February at approximately 1 km, then gradually increases to 4.2 km in August and then gradually decreases again. During the winter and monsoon periods, the monthly variation in the average BB bottom height is relatively small, while it is more significant in the premonsoon and postmonsoon seasons.
3. Results
3.1. Vertical Profiles of Rain Parameters
To comprehend the characteristics of the rain structure in different seasons, the vertical profiles of rain parameters such as radar reflectivity, fall speed, rain rate, and liquid water content under different rain rate categories are discussed.
3.1.1. Vertical Profile of the Radar Reflectivity
Figure 5 displays the vertical profile of the radar reflectivity for several rain rate categories in the four seasons. The radar reflectivity profiles indicate an approximately consistent melting layer level of approximately 1.0 (4.0) km under all rain rate categories in the winter (monsoon) season, aligning with the insignificant intra-seasonal variability in the bottom of the BB (Figure 4). This uniformity can be attributed to the relatively steady surface temperature. Conversely, the melting layer structures of the different rain categories are inconsistent during the premonsoon and postmonsoon seasons. This inconsistency is closely related to the significant changes in ground temperature during these two seasons, as confirmed by the notable intra-seasonal variation in the height of the BB bottom shown in Figure 4.
The radar RF near the ground is weakest in winter compared to that in other seasons. In winter, the radar reflectivity profiles of all rain categories exhibit a negative gradient with height up to below the melting layer. Significantly, the radar reflectivity slopes are similar for the four rain categories, suggesting the potential influence of different microphysical mechanisms.
The radar reflectivity profiles exhibit similarities among the premonsoon, monsoon, and postmonsoon seasons. In the case of very light rain (R1), evident positive slopes are observed at lower heights. The very light rain category (R1) is typically associated with shallow precipitation or drizzle, which is usually considered to have negligible attenuation. The observed behavior may be attributed to evaporation, which reduces the number of drops reaching the ground, especially size-limited drops [8]. Moreover, compared to the monsoon and postmonsoon seasons, the premonsoon season shows a steeper positive gradient of radar reflectivity, possibly due to stronger surface winds in the premonsoon season [25]. For the other three rain categories, the vertical profiles indicate a negative gradient with height, and the slope gradually increases with increasing rain rate. The stronger the rain is, the greater the attenuation of the MRR. Additionally, radar reflectivity is sensitive to large drops. Therefore, the negative gradients of radar reflectivity profiles with decreasing height for these rain categories result partly from rain attenuation and partly from the coalescence growth of large drops.
3.1.2. Vertical Profile of the Fall Velocity
The fall velocity also clearly indicates the height of the melting layer (Figure 6), which shows a signature similar to that of the radar reflectivity for the four seasons. Above the melting layer, a steep negative gradient with a lower fall velocity appears, indicating the presence of slow-moving ice crystals. Within the melting layer, the fall velocity varies dramatically. As ice crystal particles gradually melt, their density continues to increase, leading to a dramatic increase in fall velocity with height deceases [33,34]. Below the melting layer, ice crystals completely melt into liquid, and their fall velocity varies less with height.
Considering that it is not susceptible to attenuation or radar calibration, the fall velocity can be used to characterize changes in drop size. In winter, the fall velocity exhibits a slight increase with decreasing height below the melting layer in the very light rain category (R1); this indicates the coalescence of raindrops during the falling process, leading to a slight increase in drop size with decreasing height. This may be responsible for the increase in radar reflectivity with decreasing height in this rain category. For the other rain categories, the fall velocity shows a positive gradient with height deceases below the melting layer, and the gradient increases with increasing rain rate. This suggests the breakup of larger drops during fallout, with the breakup phenomenon gradually strengthening as the rainfall rate increases.
The fall velocities near the ground for the four rain categories are greater in the premonsoon season than in the other seasons. In the case of light rain (e.g., 0.1 ≤ R < 2.0 mm h−1), discrepancies in fall velocity can be observed for the premonsoon, monsoon, and postmonsoon seasons. The fall velocity profiles for the R1 and R2 categories were almost uniform with height during the premonsoon season, implying that the mean drop size did not vary significantly in the vertical direction. However, the decrease (increase) with decreasing height is evident for the R2 (R1) category in the monsoon (postmonsoon) season. For the R3 and R4 categories, a similar trend for the fall velocity with a significant positive gradient with decreasing height can be seen for premonsoon, monsoon, and postmonsoon seasons. Furthermore, the R4 category has a greater slope than the R3 category.
3.1.3. Vertical Profile of the Rain Rate and Liquid Water Content
As shown in Figure 7 and Figure 8, the variations in the rain rate and liquid water content (LWC) are similar because both are directly proportional to the cube power of the raindrop diameter. In winter, the rain rate and LWC profiles exhibit a negative gradient with height below the melting layer in all rain categories, and the slopes increase as the rain rate increases, which is consistent with the radar reflectivity profiles (Figure 5a).
In the premonsoon, monsoon, and postmonsoon seasons, the rain rate and LWC profiles show a significant positive gradient in the very light rain category (R1), indicating more pronounced evaporation in this rain category. As the rain rate increases, the relative humidity also increases, reducing evaporation and leading to more pronounced coalescence of raindrops. The rain rate and LWC profiles then tend to increase with decreasing height. In the heavy rain category (R4), the negative slopes show a noticeable increase at lower heights. In some precipitation cases in this rain category, precipitation clouds still exhibit a clear bright band structure at the melting layer height, but the characteristics of convective precipitation, known as mixed cloud precipitation, have emerged [35]. In these cases, significant decreases are shown in the fall velocity profiles with decreasing height (e.g., Figure 6b,c), indicating the occurrence of a certain upward airflow and causing significant variations in the rain rate and liquid water content of raindrops.
3.2. The Seasonal Variation in Drop Size Distribution
Figure 9 shows the vertical structure of the DSD under the various rain categories across the four seasons. The very light rain category (R1) exhibits the narrowest spectral width for all seasons, with raindrop diameters no more than 2.5 mm above the ground. Spectral width increases gradually with increasing rain rate, and the maximum raindrop diameter exceeds 3.5 mm for the heavy rain category (R4).
In the case of the very light rain category (R1), the concentration of small raindrops shows a positive gradient with decreasing height, and a slight increase with decreasing height is observed in the concentration of moderate-sized raindrops, contributing to the slight increase in radar reflectivity within this category (Figure 5a). In other seasons, the concentration of 0.3–0.5 mm (1.5–2.5 mm) raindrops exhibits a slight (significant) decrease with decreasing height (Figure 9e,i,m), which may be associated with the evaporation (breakup) process of smaller (larger) raindrops during their fallout. The positive gradients of these raindrop concentrations may be responsible for the decreases in radar reflectivity, rain rate, and LWC with decreasing height. Moreover, the concentration of 0.5–1.5 mm raindrops remains uniform in the vertical direction, suggesting an equilibrium state of microphysical processes in raindrops.
For the light rain category (R2), raindrops smaller than 0.5 mm exhibit a higher concentration in winter than in the other seasons. Larger raindrops exhibit a slight negative gradient with height, and their diameter extends to 3 mm (Figure 9b). In the premonsoon season, raindrops smaller than 1.5 mm tend to be nearly uniform below 2 km, while the concentration of raindrops larger than 1.5 mm shows a positive gradient. This may suggest that the breakup of large raindrops may supplement the small raindrops consumed by evaporation (Figure 9f). Below 500 m, the concentrations of small raindrops (0.3–0.5 mm) marginally increase with decreasing height during the monsoon and postmonsoon seasons. This may be related to abundant water vapor during the two seasons (Figure 1c,d), in which evaporation of small drops tends to decrease. The concentration of larger raindrops with diameter larger than 1.5 mm is characterized by an evident positive gradient in premonsoon, monsoon, and postmonsoon seasons, indicating dominant fragmentation processes.
As the rain rate increases, the DSD shows significant variations. In winter, within the height range of 400–800 m, the concentrations of 0.3–1.5 mm raindrops decrease, while the concentrations of raindrops larger than 1.5 mm increase rapidly (Figure 9c,d). This trend is particularly pronounced in the heavy rain category (R4). The decrease in concentrations of small raindrops in this category cannot be solely attributed to evaporation; instead, the primary factor is the coalescence of raindrops. Notably, significant coalescence in winter is rarely observed in other seasons. In contrast, the concentration of large raindrops decreases significantly across the entire height range in other seasons. The vertical variation in DSD is similar in the premonsoon and monsoon seasons, but the spectral width is wider in the premonsoon season than in the monsoon season. During the postmonsoon season, the decrease in the concentrations of large raindrops is not as pronounced as that in the premonsoon and monsoon seasons. However, visible variations in the vertical direction still occur, likely caused by variations in the melting layer height during this season. In the heavy rain category (R4), notably, the concentration of raindrops smaller than 1.0 mm significantly increases downward below 500 m, which may not be a natural occurrence. Conversely, the attenuation of the MRR at high rain rates is the main factor influencing this phenomenon.
The vertical structures of the mean DSDs for different seasons are more clearly illustrated in Figure 10. Due to the lower melting layer in winter (below 1 km), the height limit in winter was set to 700 m. The spectral width is relatively narrow, and the number concentration of raindrops is lower in winter than in other seasons. For instance, for D = 1 mm (3 mm), the concentrations of raindrops on the logarithmic scale at 300 m in winter, premonsoon, monsoon, and postmonsoon seasons are 1.75 (−2.4), 2.0 (−1.75), 2.1 (−1.6), and 1.8 (−1.9), respectively. The number concentration of raindrops exceeding 2.5 mm shows an evident decreasing trend with increasing height (Figure 10a).
For the other three seasons, the average concentration of raindrops smaller than 1.5 mm remains relatively consistent in the vertical direction, with values of 1.0~1.2 at 300 m and 1.1~1.25 at 1700 m for D = 1.5 mm (logarithmic scale). However, a notable increase in the concentration of medium and large drops with increasing height can be observed. For example, for D = 2 mm, the concentrations of raindrops in the premonsoon, monsoon, and postmonsoon at 300 m (1700 m) are 0 (0.35), 0.1 (0.3), and −0.1 (0.25), respectively. At 300 m, the concentration of 4 mm raindrops is −2.9, −3.0, and −3.3, and these values increase to −2.2, −2.4, and −2.4 at 1700 m, respectively (Figure 10b–d). At the same height, the raindrop number concentration is similar between the monsoon and postmonsoon seasons and slightly lower than that in the premonsoon season.
3.3. The Relative Contributions of Raindrops to the Total Number Concentration Nt and Precipitation Intensity R in Four Seasons
To further understand the relative contributions of raindrops of different sizes to the total number concentration Nt and precipitation intensity R, raindrops are divided into five diameter categories, namely D1: 0.3 < D ≤ 0.5 mm; D2: 0.5 < D ≤ 1 mm; D3: 1 < D ≤ 2 mm; D4: 2 < D ≤ 3 mm; and D5: 3 < D ≤ 6 mm. The relative contributions of the different diameter categories to Nt and R are shown in Figure 11.
In winter, the D1 category has the largest contribution to Nt, accounting for more than 78% of the total variance at all heights (Figure 11a). The contribution of raindrops larger than 1 mm to Nt is very small, does not exceed 2%, increases with decreasing height from 900 to 500 m, and then exhibits a positive gradient below 500 m. The profiles of the contribution to R are similar to those of the contribution to Nt. The contribution of the D1 (D3) category to R decreases (increases) with decreasing height above 500 m. Below a height of 500 m, the contribution of the D1 category to R increases from approximately 22% to approximately 32% with decreasing height. The contribution of the D2 category to R in the vertical direction remains nearly constant at 40%. However, the contribution of raindrops larger than 1 mm exhibits a negative gradient with increasing height, decreasing from 40% to 28% (Figure 11b).
The vertical variations during the premonsoon and monsoon seasons exhibit similarities (Figure 11c,e). The contribution of the D1 category to Nt is still dominant but decreases compared to that in winter. In contrast, the contribution of the D2 category increases, reaching 20% near the ground (e.g., 200 m). A negative gradient is observed above 600 m for the D3 category, followed by a positive gradient near the ground. In terms of the contributions to R (Figure 11d,f), D1 and D3 show significant variations above 1800 m (3400 m) during the premonsoon (monsoon) season. In these two seasons, the contribution of the D1 category to R shows a positive gradient at 500–1800 m (600–3400 m) but a negative gradient below 500 m (600 m). The D2 category has an almost uniform profile, accounting for 28% at all heights. The D3 category has the greatest contribution to R below the melting layer in the premonsoon and monsoon seasons. The contributions continuously increase with decreasing height and reach 51% and 48%, respectively, near the ground. The contributions of both the D4 and D5 categories to R decrease with decreasing height and are still greater than those in winter. The contribution of the D1 category to Nt in the postmonsoon season exceeded that in the premonsoon and monsoon seasons but was less than that in winter. Between 500 and 1200 m, D3 shows a negative gradient with decreasing height and has the greatest contribution to R compared to the other categories. However, the contribution is less in the postmonsoon season than in the premonsoon and monsoon seasons. Below 500 m, the contribution of the D1 (D3) category to R gradually increases (decreases) with decreasing height.
Overall, the contribution of the D1 category to Nt is the greatest in all seasons. The contributions of D2 and D3 to Nt slightly increase during the premonsoon and monsoon seasons. In the winter and postmonsoon seasons, the rain rate is primarily contributed by small raindrops (e.g., 0.3–1 mm). However, the contribution of medium-sized raindrops (e.g., 1–3 mm) to R is dominant during the premonsoon and monsoon seasons. Notably, although 0.3–0.5 mm raindrops have the highest contribution to Nt in all seasons, their contribution to R is less than 30% below the melting layer and even less than 20% in the premonsoon and monsoon seasons. For raindrops larger than 1 mm, although they have minimal contributions to Nt, their contributions to R are significant.
4. Discussion
In this study, we aimed to enhance the understanding of the vertical variation in microphysical characteristics of precipitation at the entrance of the YTGC. Previous studies have focused on the seasonal and diurnal variations in DSD at the ground [25,36], but there are still some differences between ground and upper DSD [6]. The mean vertical integrals of the water vapor flux from the ERA5 reanalysis data in the winter, premonsoon, monsoon, and postmonsoon seasons are shown in Figure 1. The monsoon season exhibits the maximum water vapor flux, which is probably responsible for the greater number of precipitation events (e.g., Table 2).
Winter has the lowest melting layer height, and the intra-seasonal variations are not significant (Figure 4). For the R1 category, the concentration of small drops remains uniform in winter below the melting layer. The concentration of medium-sized drops show slight increases (e.g., Figure 9a), indicating the coalescence of raindrops, leading to the increases in the microphysical profiles with height decreases (e.g., Figure 5a, Figure 7a and Figure 8a). The breakup of large raindrops at lower heights becomes more pronounced as the rain rate increases (e.g., Figure 9c,d), leading to a rapid decrease in the fall velocity profiles as height decreases (Figure 6a). However, the concentration of large raindrops in winter is greater than that in the monsoon and postmonsoon seasons below 400 m (Figure 9d,l,p), which is potentially associated with the presence of more ice-phase particles in winter. For the D1 category, the contribution to Nt exceeds 78% at all heights in winter. Raindrops larger than 1 mm contribute minimally to Nt, while their contribution to R is approximately 25% (e.g., Figure 11a,b).
The variations in the vertical structure during the premonsoon and monsoon seasons are relatively similar. However, the concentration of small drops in the monsoon season is significantly greater than that in the premonsoon season (e.g., Figure 9g–l); this is partly due to the greater surface wind speed during the premonsoon season, which results in greater evaporation [25]. On the other hand, the southwest monsoon brings more warm and humid airflow during the monsoon season, which tends to produce higher concentrations of small raindrops. For lower rain rates, the concentrations of small and large raindrops decrease simultaneously (e.g., Figure 9c,f,i,j), indicating that the breakup process is unable to counteract evaporation, leading to decreases in the radar reflectivity, rain rate, and LWC profiles with decreasing height (e.g., Figure 5b,c, Figure 7b,c, and Figure 8b,c). However, the falling velocity remains almost uniform with height (e.g., Figure 6b,c). For the R4 category, the concentrations of large drops decrease rapidly with decreasing height (e.g., Figure 9g,l), leading to significant decrease in the fall velocity profiles with decreasing height. These results are consistent with those of Das et al. [8], who reported that breakup is the main evolutionary mechanism of raindrops during stratiform precipitation. The contributions of the D1 category to Nt decrease during the premonsoon and monsoon seasons compared to those in winter but still dominate (e.g., Figure 11c,e). The D3 category has the greatest contribution to R below the melting layer, and the contribution continues to increase with decreasing height, reaching 51% and 48% near the ground (e.g., Figure 11d and Figure 11f, respectively).
The postmonsoon season exhibits noticeable variations in the melting layer height (Figure 4), likely attributed to the pronounced fluctuations in intra-seasonal temperatures. These variations in melting layer height contribute to irregularities in the vertical direction, which are evident in the statistics (e.g., Figure 6d, Figure 7d, Figure 9n and Figure 11d). The water vapor flux during the postmonsoon season slightly exceeds that during the premonsoon season (Figure 1d), leading to greater concentrations of small drops (e.g., Figure 9f,n). Unlike that in the premonsoon season, the radar reflectivity profile in the R2 category showed a negative gradient with decreasing height (Figure 5b,d), indicating that evaporation is no longer significant in this category. The breakup in the postmonsoon season is not significant compared to that in the premonsoon and monsoon seasons (e.g., Figure 9f,j,n), and the fall velocity profile remains uniform with height (e.g., Figure 6d). Like in winter, rain rates during the postmonsoon season are predominantly influenced by small drops (e.g., Figure 11h).
Cloud microphysical processes in numerical prediction models are often described using parameterizations of raindrop size distribution. However, parameterization schemes for cloud microphysics in numerical forecasting models lack detailed descriptions of microphysical parameters. Utilizing local raindrop size distribution can enhance the accuracy of DSD parameterization in models. Studies have coupled parameterization relationships obtained from ground-based DSD with cloud microphysics parameterization schemes, leading to improved forecast accuracy [37]. Therefore, correcting the DSD characteristics in models using locally observed DSD can improve simulation results of precipitation processes. However, ground-based DSD characteristics differ from those in the upper air. MRR can retrieve DSD characteristics in the upper air, enabling a more detailed distribution analysis of raindrop spectra and effective examination of microphysical processes such as melting, evaporation, coalescence, and breakup during descent [38]. Parameterizing upper-level or mean raindrop spectra and coupling them with numerical model parameterization schemes may effectively improve simulation performance of cloud microphysical characteristics and precipitation and the predictive ability of numerical models for precipitation on the TP. Besides, the accuracy of radar quantitative estimation (QPE) using ground-based disdrometer still needs improvement. Due to the underestimated concentration of small raindrops observed by disdrometer, substituting the concentration of small raindrops from MRR for the results of disdrometer to fit the Z-R relationship may enhance the accuracy of QPE.
5. Conclusions
Mêdog is located at the entrance of the Yarlung Tsangpo Great Canyon, through which warm and moist water vapor from the Indian Ocean is transported to the TP. In this study, we aimed to enhance our understanding of the vertical variation in the microphysical characteristics of precipitation at the entrance of the water vapor channel of the Yarlung Tsangpo River. Continuous data from the MRR at MNCO in 2022 were collected and divided into four rain rate categories to investigate the seasonal variation in the vertical microphysical structure of stratiform precipitation in the winter, premonsoon, monsoon and postmonsoon seasons. The conclusions are summarized as follows:
- (1)
- There is a significant seasonal variation in the melting layer height in Mêdog. The average BB bottom height is the lowest in February, reaches a peak of 4.2 km in August, and then gradually decreases again. In the winter and monsoon seasons, the seasonal variation in the BB bottom height is relatively small. However, in the premonsoon and postmonsoon seasons, BB bottom height changes are more pronounced, possibly because of significant monthly temperature fluctuations during these periods.
- (2)
- For the R1 category (0.1 ≤ R < 1 mm h−1), the concentrations of small drops remains uniform in winter below the melting layer. The concentrations of medium-sized drops show slight increases, indicating the coalescence of raindrops, leading to the increases in the microphysical profiles with decreasing height. Slight or evident decreases in concentrations of small drops are observed in the premonsoon, monsoon, and postmonsoon seasons, likely due to significant evaporation. The radar reflectivity, rain rate, and liquid water content profiles decrease with decreasing height according to the variations in the drop size distribution (DSD). As the rain rate increases, the spectral width increases significantly, with the maximum raindrop diameter exceeding 3.5 mm. For the R4 category (5 ≤ R < 10 mm h−1), the DSD displays significant variations in winter. The concentrations of large drops increase at 400–800 m but decrease rapidly below 400 m, leading to a significant positive gradient in the fall velocity profiles. In the premonsoon, monsoon, and postmonsoon seasons, the concentrations of large drops significantly decrease below the melting layer because of the breakup mechanism, leading to the decreases in the fall velocity profiles with decreasing height during these seasons. However, the radar reflectivity, rainfall rate, and LWC profiles exhibit increases with decreasing height, likely due to the attenuation of the MRR at high rain rates.
- (3)
- The raindrops are divided into five diameter categories. The concentrations of D1 raindrops to Nt are the greatest in winter, and raindrops larger than 1 mm contribute minimally to Nt, while the contributions to R reach approximately 25%. The contributions of D1 raindrops to Nt decrease during the premonsoon and monsoon seasons compared to those in winter but still dominate. The contributions of raindrops larger than 1 mm to R are greater than those of small drops in these two seasons, indicating that the rain rate in these two seasons is more controlled by medium and large raindrops. In the postmonsoon season, the contributions of raindrops to Nt are greater than those in the premonsoon and monsoon seasons but less than those in winter. The contributions to R gradually decrease with decreasing height below 500 m and are ultimately equal to the contributions of D2 category raindrops. The contributions of small raindrops to Nt and R increase gradually below a height of 500 m in all seasons. However, the large drops exhibit a positive gradient with decreasing height, indicating the significant breakup mechanism.
Notably, this study mainly focused on the vertical structure of stratiform precipitation, as the MRR estimates raindrop spectra under the assumption of zero vertical wind. A significant vertical velocity leads to retrieval errors in the case of convective precipitation. Further studies of convective precipitation should include the use of multiple instruments, such as a wind profile radar (WPR), Ka-band cloud radar (Ka-CR), and X-band dual-polarization phased array radar (X-PAR).
Author Contributions
Conceptualization, G.W. and J.W.; methodology, J.W. and G.W.; software, J.W., R.Z. and R.L.; data curation, S.Z. and M.B.; writing—original draft preparation, J.W.; writing—review and editing, J.W. and G.W.; funding acquisition, G.W. All authors have read and agreed to the published version of the manuscript.
Funding
This research was funded by the Second Tibetan Plateau Scientific Expedition and Research (STEP) program, Grant No. 2019QZKK0105; Basic Research Fund of CAMS (2023Z009); Science and Technology Development Fund of Chinese Academy of Meteorological Sciences (2023KJ041).
Data Availability Statement
Data used in this study can be requested from the corresponding author under the research institute polices of Chinese Academy of Meteorological Sciences.
Acknowledgments
The authors thank Suolang Zhaxi, Ting Wang, and Maqiao Bai for their assistance in maintaining the instruments at Mêdog National Climate Observatory.
Conflicts of Interest
The authors declare no conflicts of interest.
References
- Milbrandt, J.A.; Yau, M.K. A Multimoment Bulk Microphysics Parameterization. Part I: Analysis of the Role of the Spectral Shape Parameter. J. Atmos. Sci. 2005, 62, 3051–3064. [Google Scholar] [CrossRef]
- Zhang, G.; Sun, J.; Brandes, E.A. Improving Parameterization of Rain Microphysics with Disdrometer and Radar Observations. J. Atmos. Sci. 2006, 63, 1273–1290. [Google Scholar] [CrossRef]
- Wen, L.; Zhao, K.; Wang, M.; Zhang, G. Seasonal Variations of Observed Raindrop Size Distribution in East China. Adv. Atmos. Sci. 2019, 36, 346–362. [Google Scholar] [CrossRef]
- Zeng, Q.; Zhang, Y.; Lei, H.; Xie, Y.; Gao, T.; Zhang, L.; Wang, C.; Huang, Y. Microphysical Characteristics of Precipitation during Pre-monsoon, Monsoon, and Post-monsoon Periods over the South China Sea. Adv. Atmos. Sci. 2019, 36, 1103–1120. [Google Scholar] [CrossRef]
- Kozu, T.; Reddy, K.K.; Mori, S.; Thurai, M.; Ong, J.T.; Rao, D.N.; Shimomai, T. Seasonal and Diurnal Variations of Raindrop Size Distribution in Asian Monsoon Region. J. Meteorol. Soc. Jpn. Ser. II 2006, 84A, 195–209. [Google Scholar] [CrossRef]
- Feng, Q.; Lei, P.; Ding, J.; Shen, D.; Jin, L. Observation and analysis of microphysical characteristics of stratiform cloud precipitation in Shanxi Province. Trans. Atmos. Sci. 2012, 36, 537–545. [Google Scholar] [CrossRef]
- Peters, G.; Fischer, B.; Andersson, T. Rain observations with a vertically looking Micro Rain Radar (MRR). Boreal Environ. Res. 2002, 7, 353–362. [Google Scholar]
- Das, S.; Maitra, A. Vertical profile of rain: Ka band radar observations at tropical locations. J. Hydrol. 2016, 534, 31–41. [Google Scholar] [CrossRef]
- Ramadhan, R.; Marzuki; Vonnisa, M.; Harmadi; Hashiguchi, H.; Shimomai, T. Diurnal Variation in the Vertical Profile of the Raindrop Size Distribution for Stratiform Rain as Inferred from Micro Rain Radar Observations in Sumatra. Adv. Atmos. Sci. 2020, 37, 832–846. [Google Scholar] [CrossRef]
- Duan, A.; Wu, G.; Liang, X. Influence of the Tibetan Plateau on the summer climate patterns over Asia in the IAP/LASG SAMIL model. Adv. Atmos. Sci. 2008, 25, 518–528. [Google Scholar] [CrossRef]
- Gao, Y.; Zhou, X.; Wang, Q.; Wang, C.; Zhan, Z.; Chen, L.; Yan, J.; Qu, R. Vegetation net primary productivity and its response to climate change during 2001–2008 in the Tibetan Plateau. Sci. Total Environ. 2013, 444, 356–362. [Google Scholar] [CrossRef] [PubMed]
- Fujinami, H.; Yasunari, T. The Seasonal and Intraseasonal Variability of Diurnal Cloud Activity over the Tibetan Plateau. J. Meteorol. Soc. Jpn. Ser. II 2001, 79, 1207–1227. [Google Scholar] [CrossRef]
- Gao, B.C.; Yang, P.; Guo, G.; Park, S.K.; Wiscombe, W.J.; Chen, B. Measurements of water vapor and high clouds over the Tibetan plateau with the terra modis instrument. IEEE Trans. Geosci. Remote Sens. 2003, 41, 895–900. [Google Scholar] [CrossRef]
- Fu, Y.; Liu, G.; Wu, G.; Yu, R.; Xu, Y.; Wang, Y.; Li, R.; Liu, Q. Tower mast of precipitation over the central Tibetan Plateau summer. Geophys. Res. Lett. 2006, 33, L05802. [Google Scholar] [CrossRef]
- Li, Y.; Liu, X.; Chen, B. Cloud type climatology over the Tibetan Plateau: A comparison of ISCCP and MODIS/TERRA measurements with surface observations. Geophys. Res. Lett. 2006, 33, L17716. [Google Scholar] [CrossRef]
- Zhao, Y.; Wang, D.; Yin, J. A study on cloud microphysicalcharacteristics over the tibetan plateau using cloudsat data. J. Trop. Meteorol. 2014, 30, 239–248. [Google Scholar] [CrossRef]
- Wu, Y.; Liu, L. Statistical characteristics of raindrop size distribution in the Tibetan Plateau and southern China. Adv. Atmos. Sci. 2017, 34, 727–736. [Google Scholar] [CrossRef]
- Zhang, S.; Wang, D.; Qin, Z.; Zheng, Y.; Guo, J. Assessment of the GPM and TRMM Precipitation Products Using the Rain Gauge Network over the Tibetan Plateau. J. Meteorol. Res. 2018, 32, 324–336. [Google Scholar] [CrossRef]
- Fu, Y.; Pan, X.; Liu, G. Characteristics of precipitation based on cloud brightness temperatures and storm tops in summer over the Tibetan Plateau. Chin. J. Atmos. Sci. 2016, 40, 102–120. (In Chinese) [Google Scholar] [CrossRef]
- Yan, Y.; Liu, Y.; Lu, J. Cloud vertical structure, precipitation, and cloud radiative effects over Tibetan Plateau and its neighboring regions. J. Geophys. Res. Atmos. 2016, 121, 5864–5877. [Google Scholar] [CrossRef]
- Liu, L.; Zheng, J.; Ruan, Z.; Cui, Z.; Hu, Z.; Wu, S.; Dai, G.; Wu, Y. The preliminary analyses of the cloud properties over the Tibetan Plateau from the field experiments in clouds precipitation with the vavious radars. Acta Meteorol. Sin. 2015, 73, 635–647. [Google Scholar] [CrossRef]
- Chang, Y.; Guo, X. Characteristics of convective cloud and precipitation during summer time at Naqu over Tibetan Plateau. Chin. Sci. Bull. 2016, 61, 1706–1720. [Google Scholar] [CrossRef]
- Zhou, R.; Wang, G.; Zhaxi, S. Cloud vertical structure measurements from a ground-based cloud radar over the southeastern Tibetan Plateau. Atmos. Res. 2021, 258, 105629. [Google Scholar] [CrossRef]
- Wang, G.; Zhou, R.; Zhaxi, S.; Liu, L. Comprehensive observations and preliminary statistical analysis of clouds and precipitation characteristics in Motuo of Tibet Plateau. Acta Meteorol. Sin. 2021, 79, 841–852. [Google Scholar] [CrossRef]
- Li, R.; Wang, G.; Zhou, R.; Zhang, J.; Liu, L. Seasonal Variation in Microphysical Characteristics of Precipitation at the Entrance of Water Vapor Channel in Yarlung Zangbo Grand Canyon. Remote Sens. 2022, 14, 3149. [Google Scholar] [CrossRef]
- Zhang, J.; Wang, G.; Zheng, J. Study of the Microphysical Characteristics of Weak Precipitation in Mêdog, Southeastern Tibetan Plateau Using Ka-Band Cloud Radar. Chin. J. Atmos. Sci. 2022, 46, 1239–1252. (In Chinese) [Google Scholar]
- Wagner, A.; Clemens, M.; Münster, H.; Fischer, B.; Peters, G. Profiles of Raindrop Size Distributions as Retrieved by Microrain Radars. J. Appl. Meteorol. 2005, 44, 1930–1949. [Google Scholar] [CrossRef]
- Gunn, R.; Kinzer, G.D. The Terminal Velocity of Fall for Water Droplets in Stagnant Air. J. Meteorol. 1949, 6, 243–248. [Google Scholar] [CrossRef]
- Foote, G.B.; Du Toit, P.S. Terminal Velocity of Raindrops Aloft. J. Appl. Meteorol. 1969, 8, 249–253. [Google Scholar] [CrossRef]
- Clemens, M.; Fischer, B.; Peters, G. Rain Attenuation of Radar Echoes Considering Finite-Range Resolution and Using Drop Size Distributions. J. Atmos. Ocean. Technol. 2010, 27, 829–842. [Google Scholar] [CrossRef]
- Wang, G.; Zhou, R.; Zhaxi, S.; Liu, S. Raindrop size distribution measurements on the Southeast Tibetan Plateau during the STEP project. Atmos. Res. 2021, 249, 105311. [Google Scholar] [CrossRef]
- Wang, H.; Lei, H.; Yang, J. Microphysical processes of a stratiform precipitation event over eastern China: Analysis using micro rain radar data. Adv. Atmos. Sci. 2017, 34, 1472–1482. [Google Scholar] [CrossRef]
- White, A.B.; Gottas, D.J.; Strem, E.T.; Ralph, F.M.; Neiman, P.J. An Automated Brightband Height Detection Algorithm for Use with Doppler Radar Spectral Moments. J. Atmos. Ocean. Technol. 2002, 19, 687–697. [Google Scholar] [CrossRef]
- White, A.B.; Neiman, P.J.; Ralph, F.M.; Kingsmill, D.E.; Persson, P.O.G. Coastal Orographic Rainfall Processes Observed by Radar during the California Land-Falling Jets Experiment. J. Hydrometeorol. 2003, 4, 264–282. [Google Scholar] [CrossRef]
- Huo, Z.; Ruan, Z.; Wei, M.; Ge, R.; Li, F.; Ruan, Y. Statistical characteristics of raindrop size distribution in south China summer based on the vertical structure derived from VPR-CFMCW. Atmos. Res. 2019, 222, 47–61. [Google Scholar] [CrossRef]
- Wang, G.; Li, R.; Sun, J.; Xu, X.; Zhou, R.; Liu, L. Comparative Analysis of the Characteristics of Rainy Season Raindrop Size Distributions in Two Typical Regions of the Tibetan Plateau. Adv. Atmos. Sci. 2022, 39, 1062–1078. [Google Scholar] [CrossRef]
- Seifert, A. On the Shape–Slope Relation of Drop Size Distributions in Convective Rain. J. Appl. Meteorol. 2005, 44, 1146–1151. [Google Scholar] [CrossRef]
- Radhakrishna, B.; Rao, T.N.; Rao, D.N.; Rao, N.P.; Nakamura, K.; Sharma, A.K. Spatial and seasonal variability of raindrop size distributions in southeast India. J. Geophys. Res. Atmos. 2009, 114, D04203. [Google Scholar] [CrossRef]
Figure 1.
Location of the Mêdog National Climate Observatory (red solid dots) and topography (shaded, unit: m) of the Tibetan Plateau, which are superimposed with the mean vertical integral of the water vapor flux (unit: kg m−1 s−1) in different seasons in 2022.
Figure 1.
Location of the Mêdog National Climate Observatory (red solid dots) and topography (shaded, unit: m) of the Tibetan Plateau, which are superimposed with the mean vertical integral of the water vapor flux (unit: kg m−1 s−1) in different seasons in 2022.
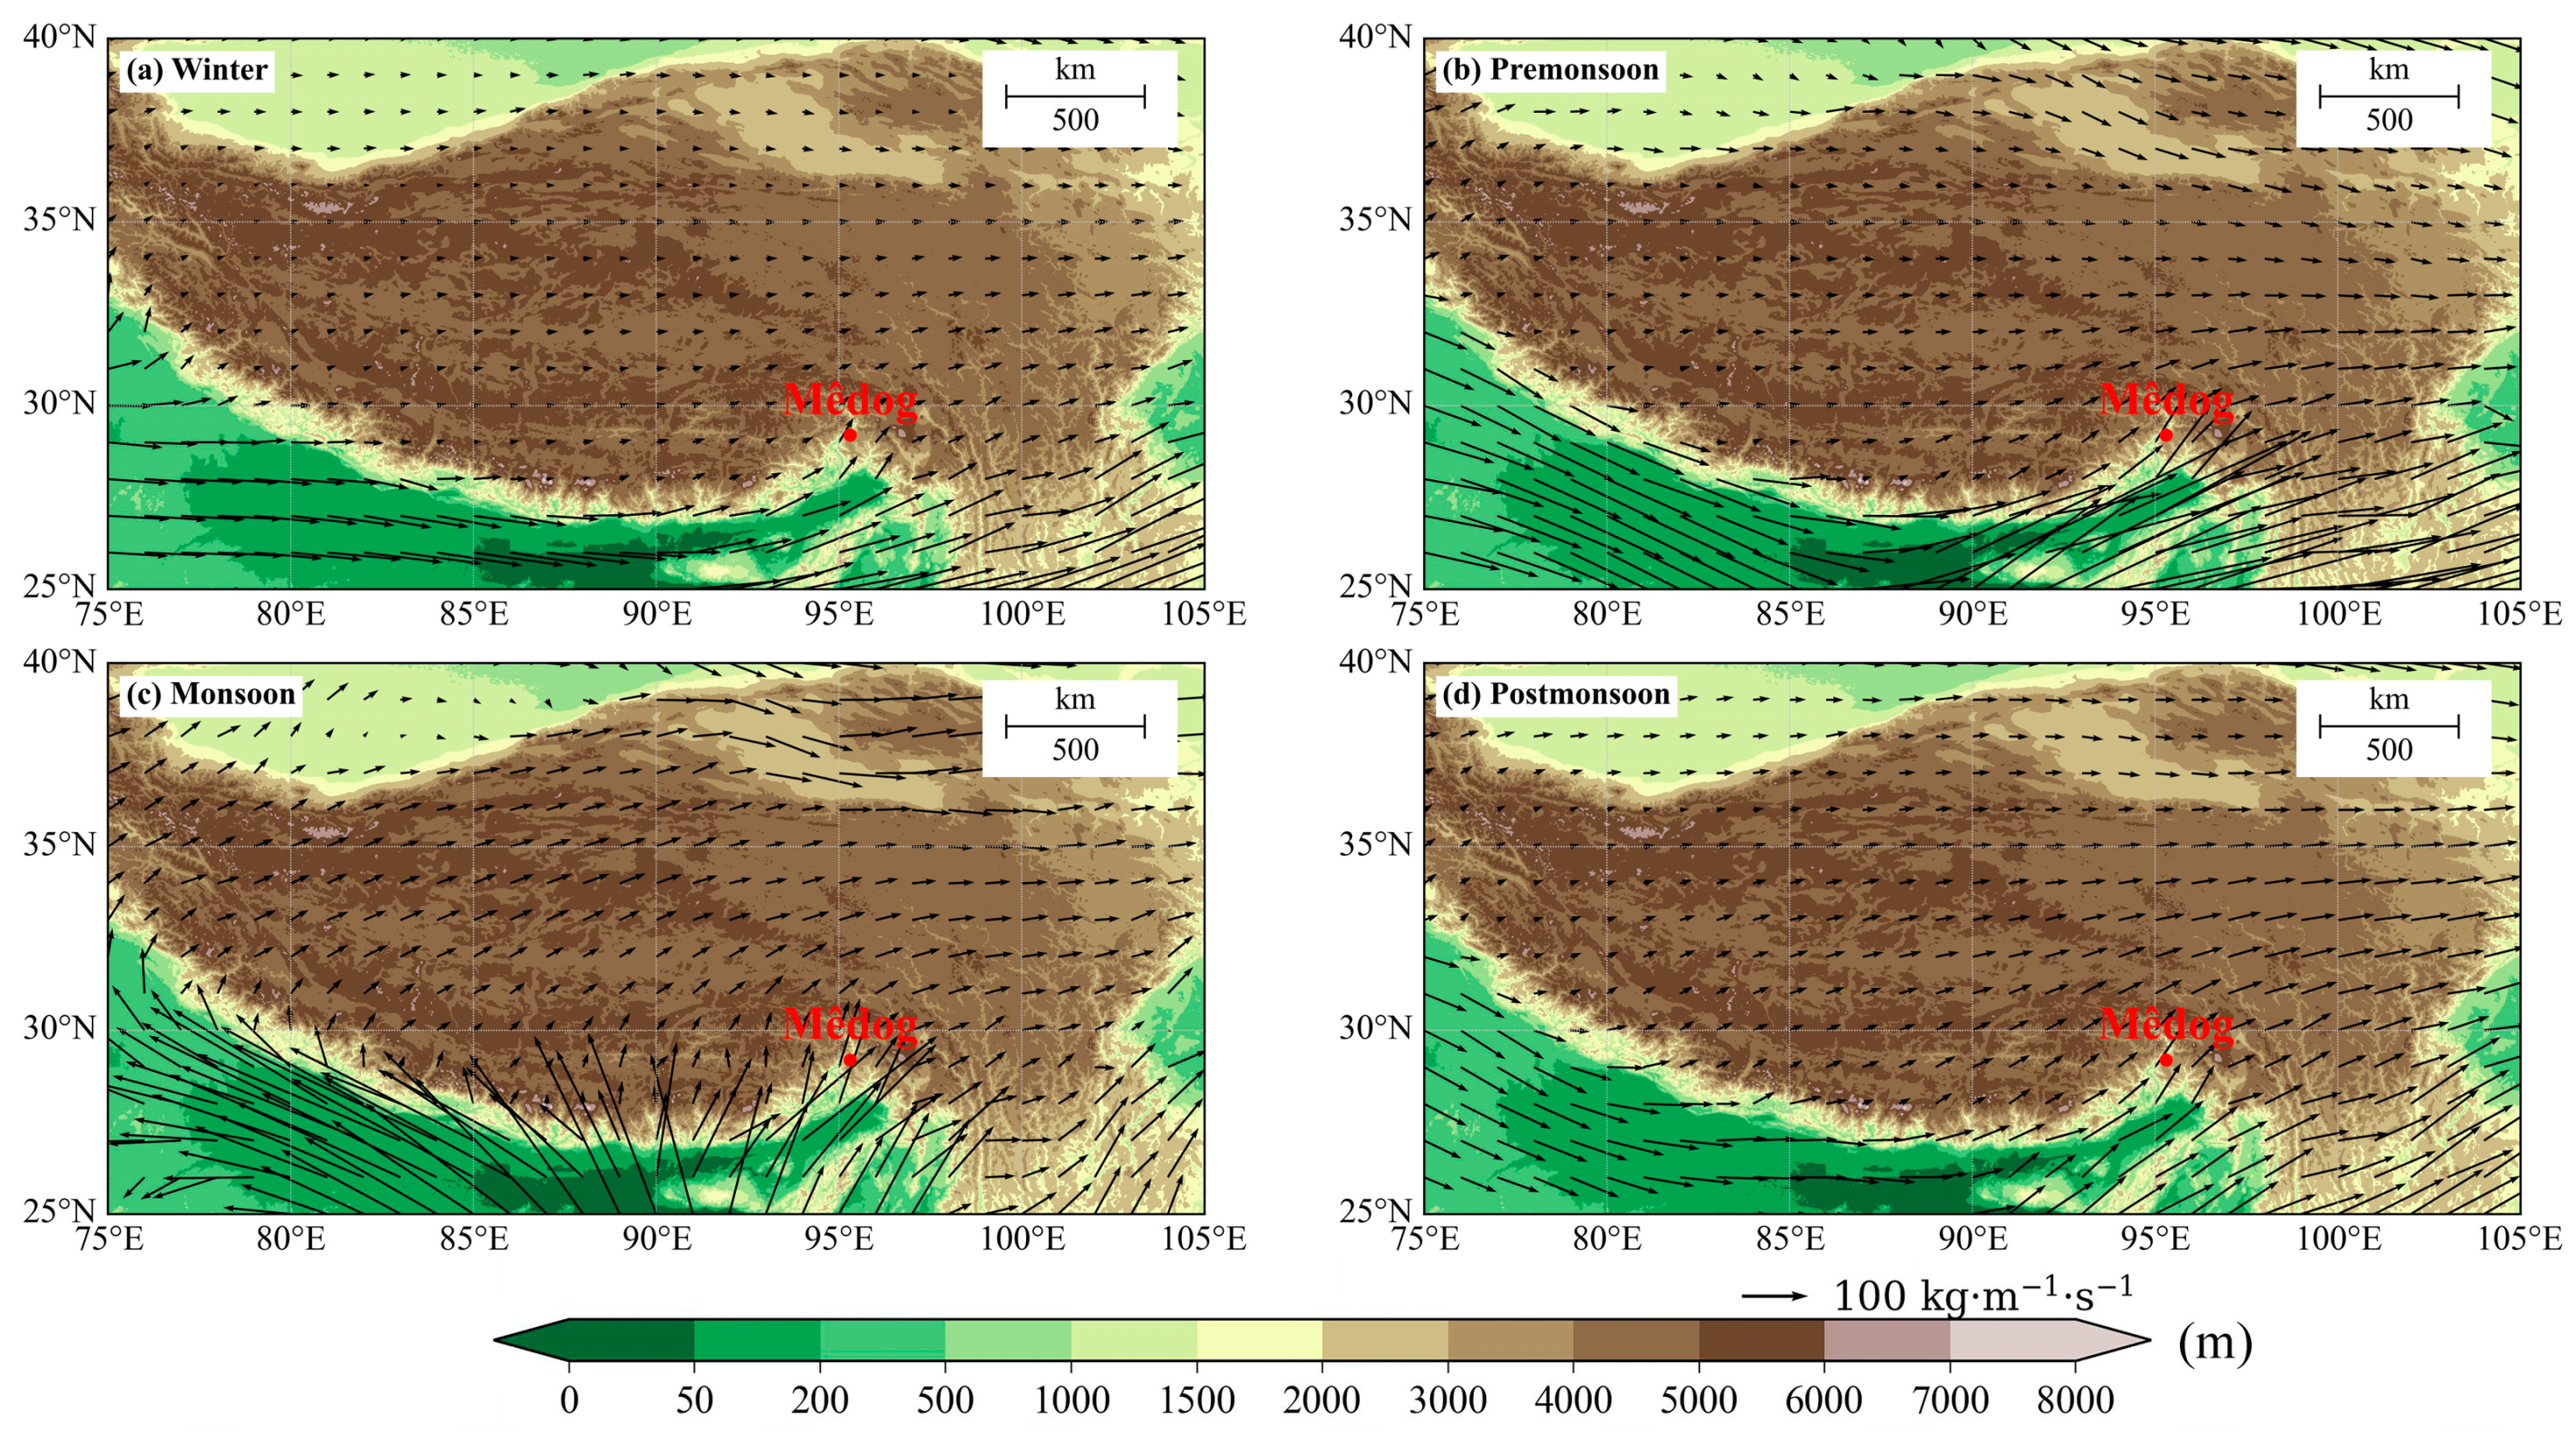
Figure 2.
Comparison of rain rates (5 min average) between the MRR at 150 m above ground and rain gauge data of the precipitation process from 0100 to 0800 (local standard time) on 14 May 2022.
Figure 2.
Comparison of rain rates (5 min average) between the MRR at 150 m above ground and rain gauge data of the precipitation process from 0100 to 0800 (local standard time) on 14 May 2022.
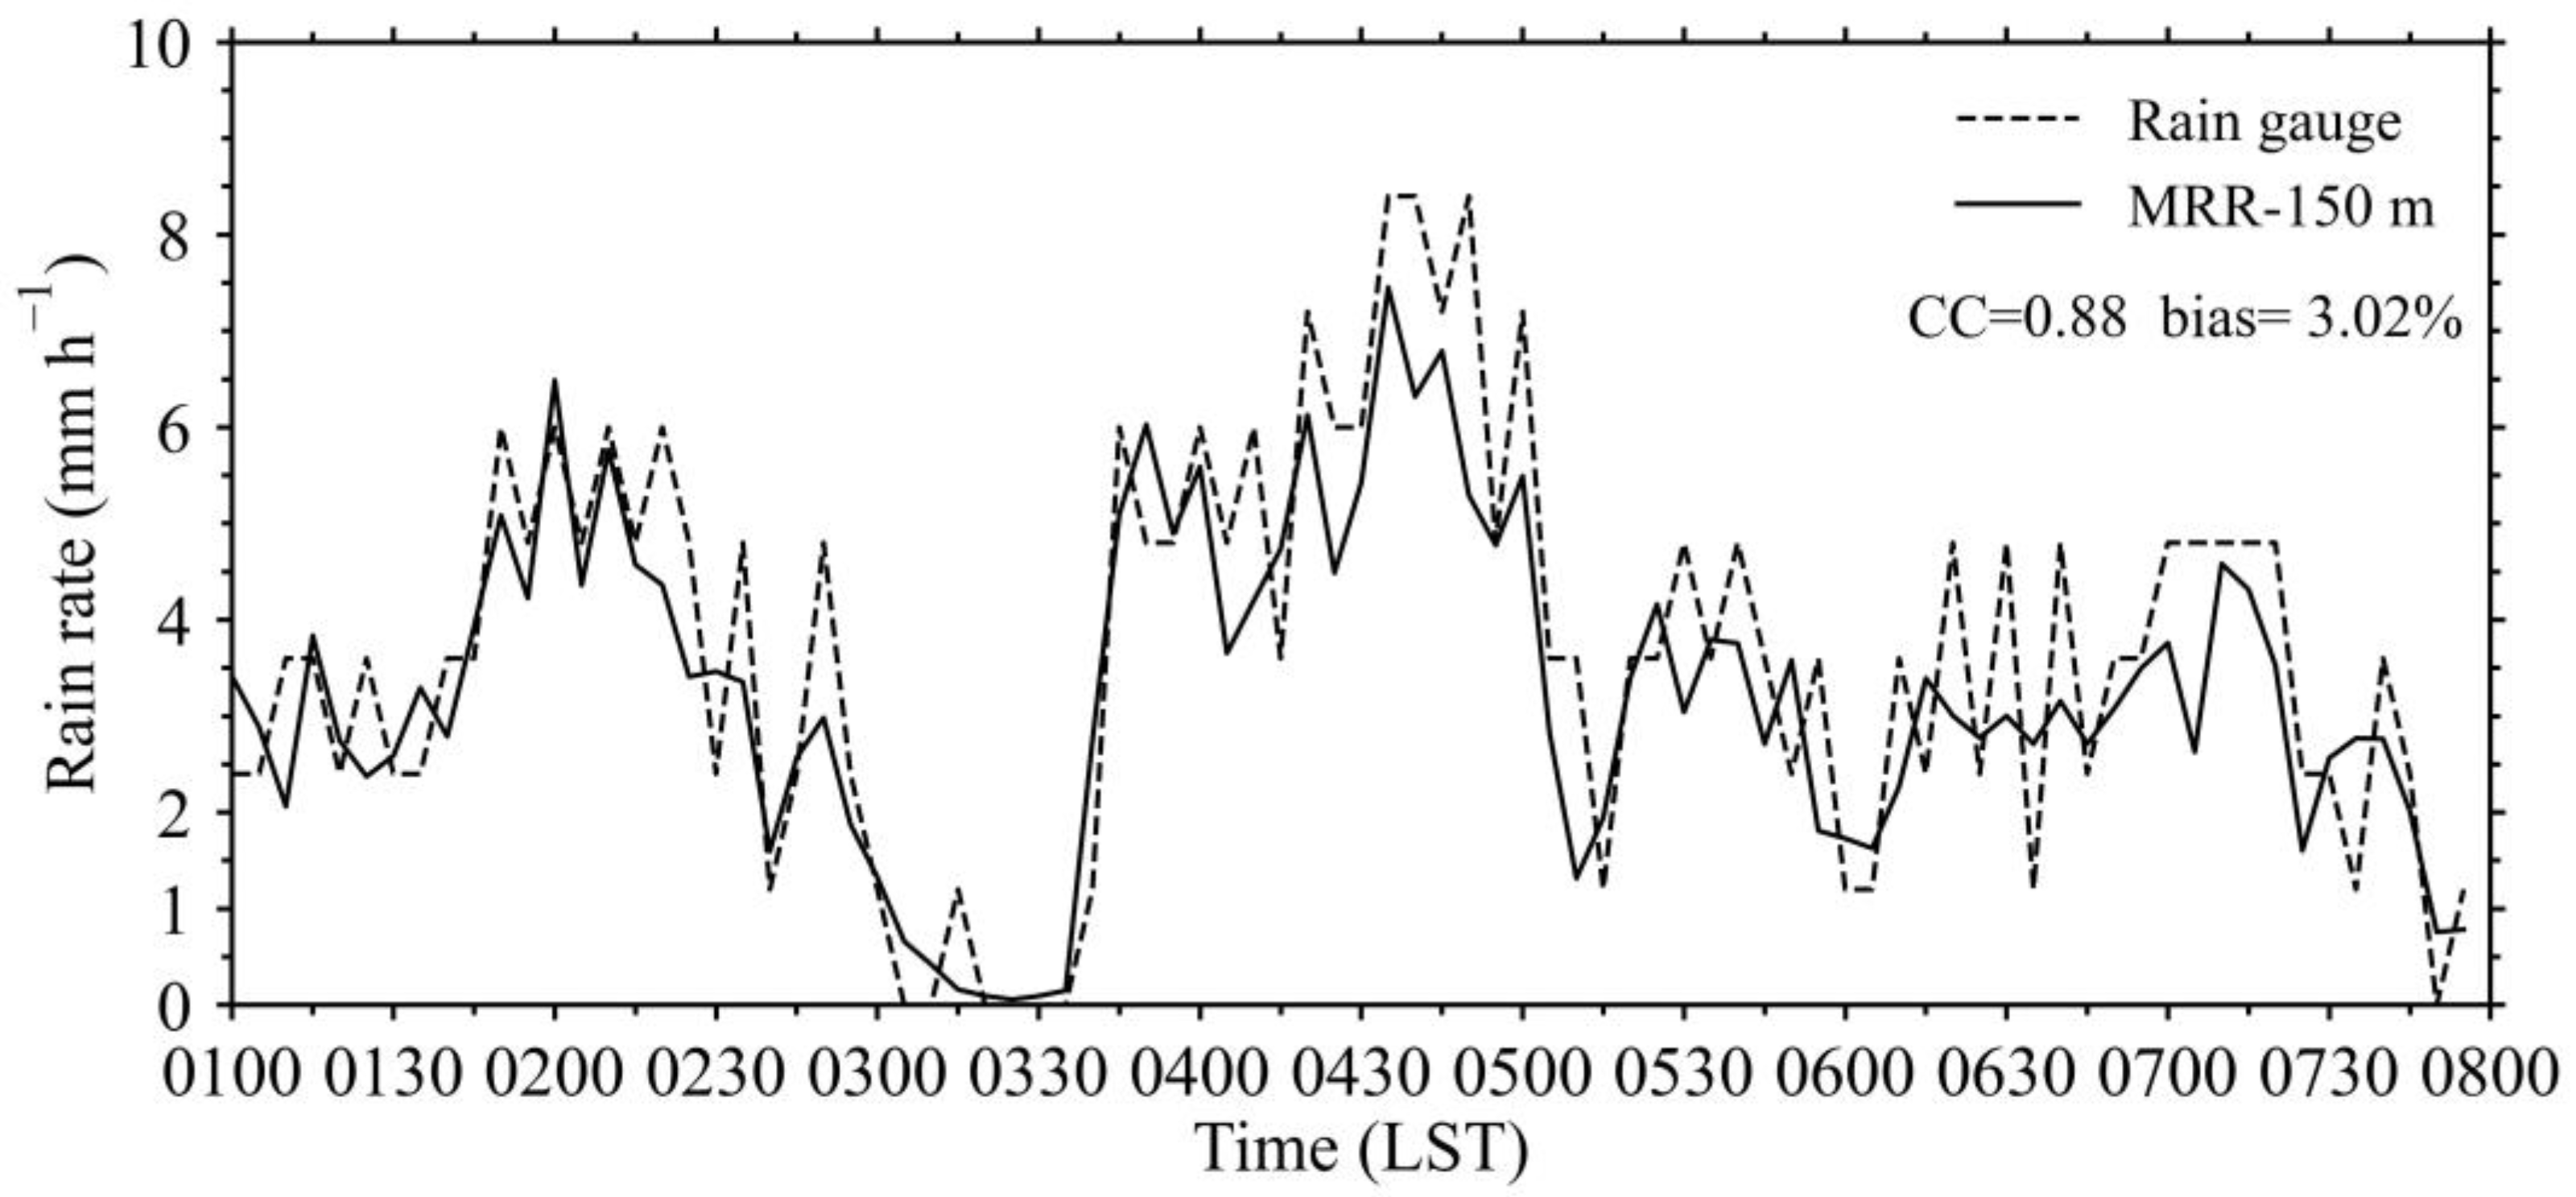
Figure 3.
(a) The GFV time series calculated from the MRR based on precipitation events from 0000 LT to 0700 LST on 10 February 2022. (b) The corresponding vertical profile of reflectivity from the MRR, in which the solid red line (the solid black line) marks the BB bottom calculated by the maximum GFV (the BB top calculated by the gradient of Ze).

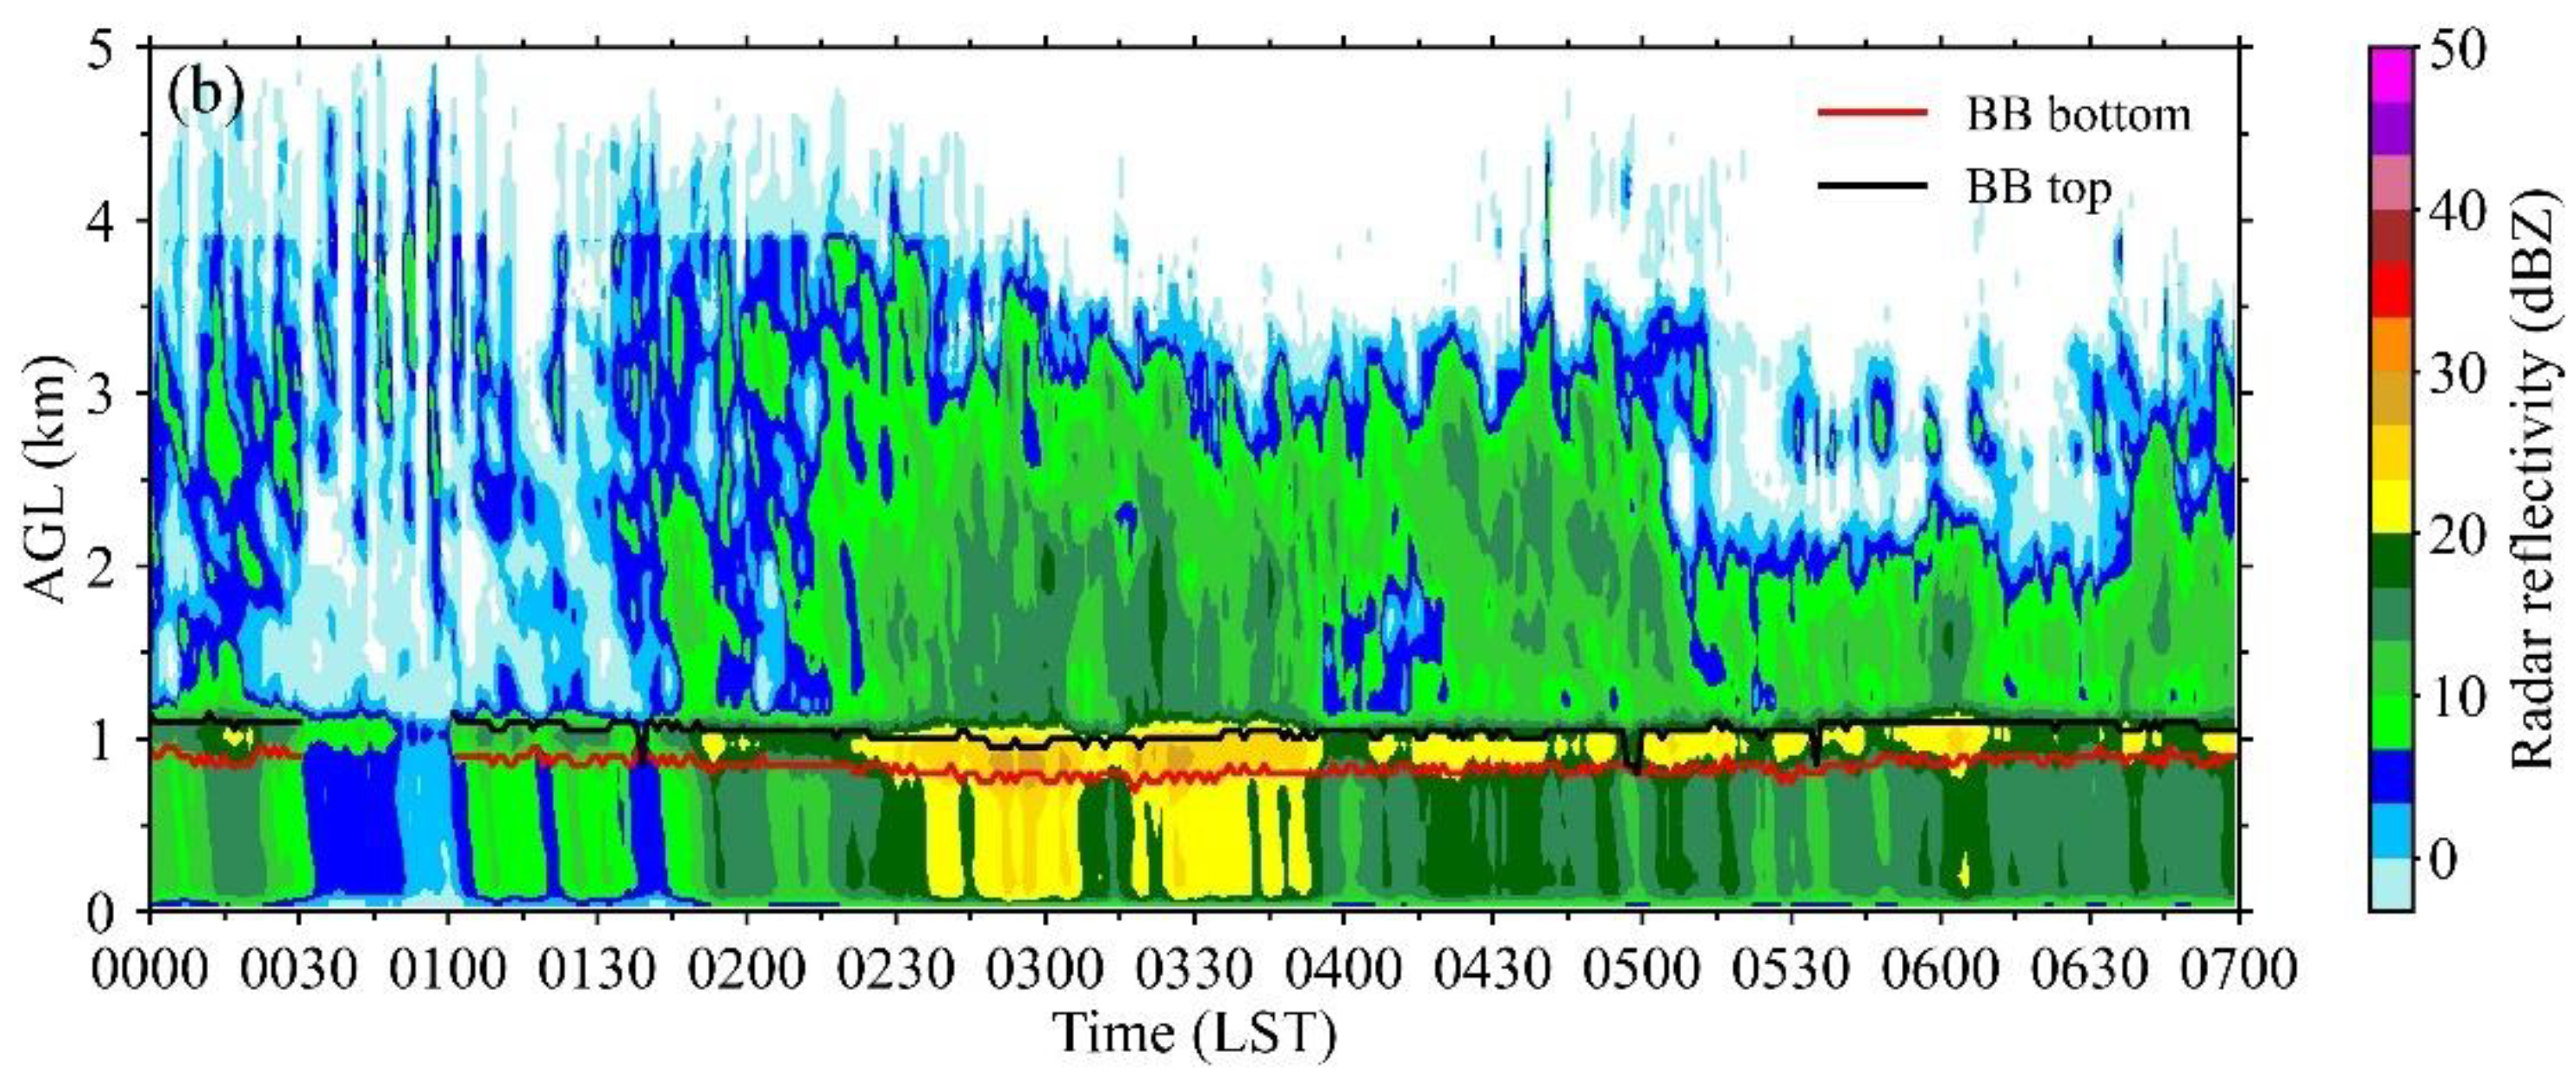
Figure 4.
Monthly variation in the BB bottom height based on the GFV method in the Mêdog region.

Figure 5.
Vertical profiles of the radar reflectivity factor for each category in the four seasons. R1: 0.1 ≤ R < 1.0 mm h−1, R2: 1.0 ≤ R < 2.0 mm h−1, R3: 2.0 ≤ R < 5.0 mm h−1, and R4: 5.0 ≤ R < 10.0 mm h−1: (a) winter; (b) premonsoon; (c) monsoon; and (d) postmonsoon.
Figure 5.
Vertical profiles of the radar reflectivity factor for each category in the four seasons. R1: 0.1 ≤ R < 1.0 mm h−1, R2: 1.0 ≤ R < 2.0 mm h−1, R3: 2.0 ≤ R < 5.0 mm h−1, and R4: 5.0 ≤ R < 10.0 mm h−1: (a) winter; (b) premonsoon; (c) monsoon; and (d) postmonsoon.
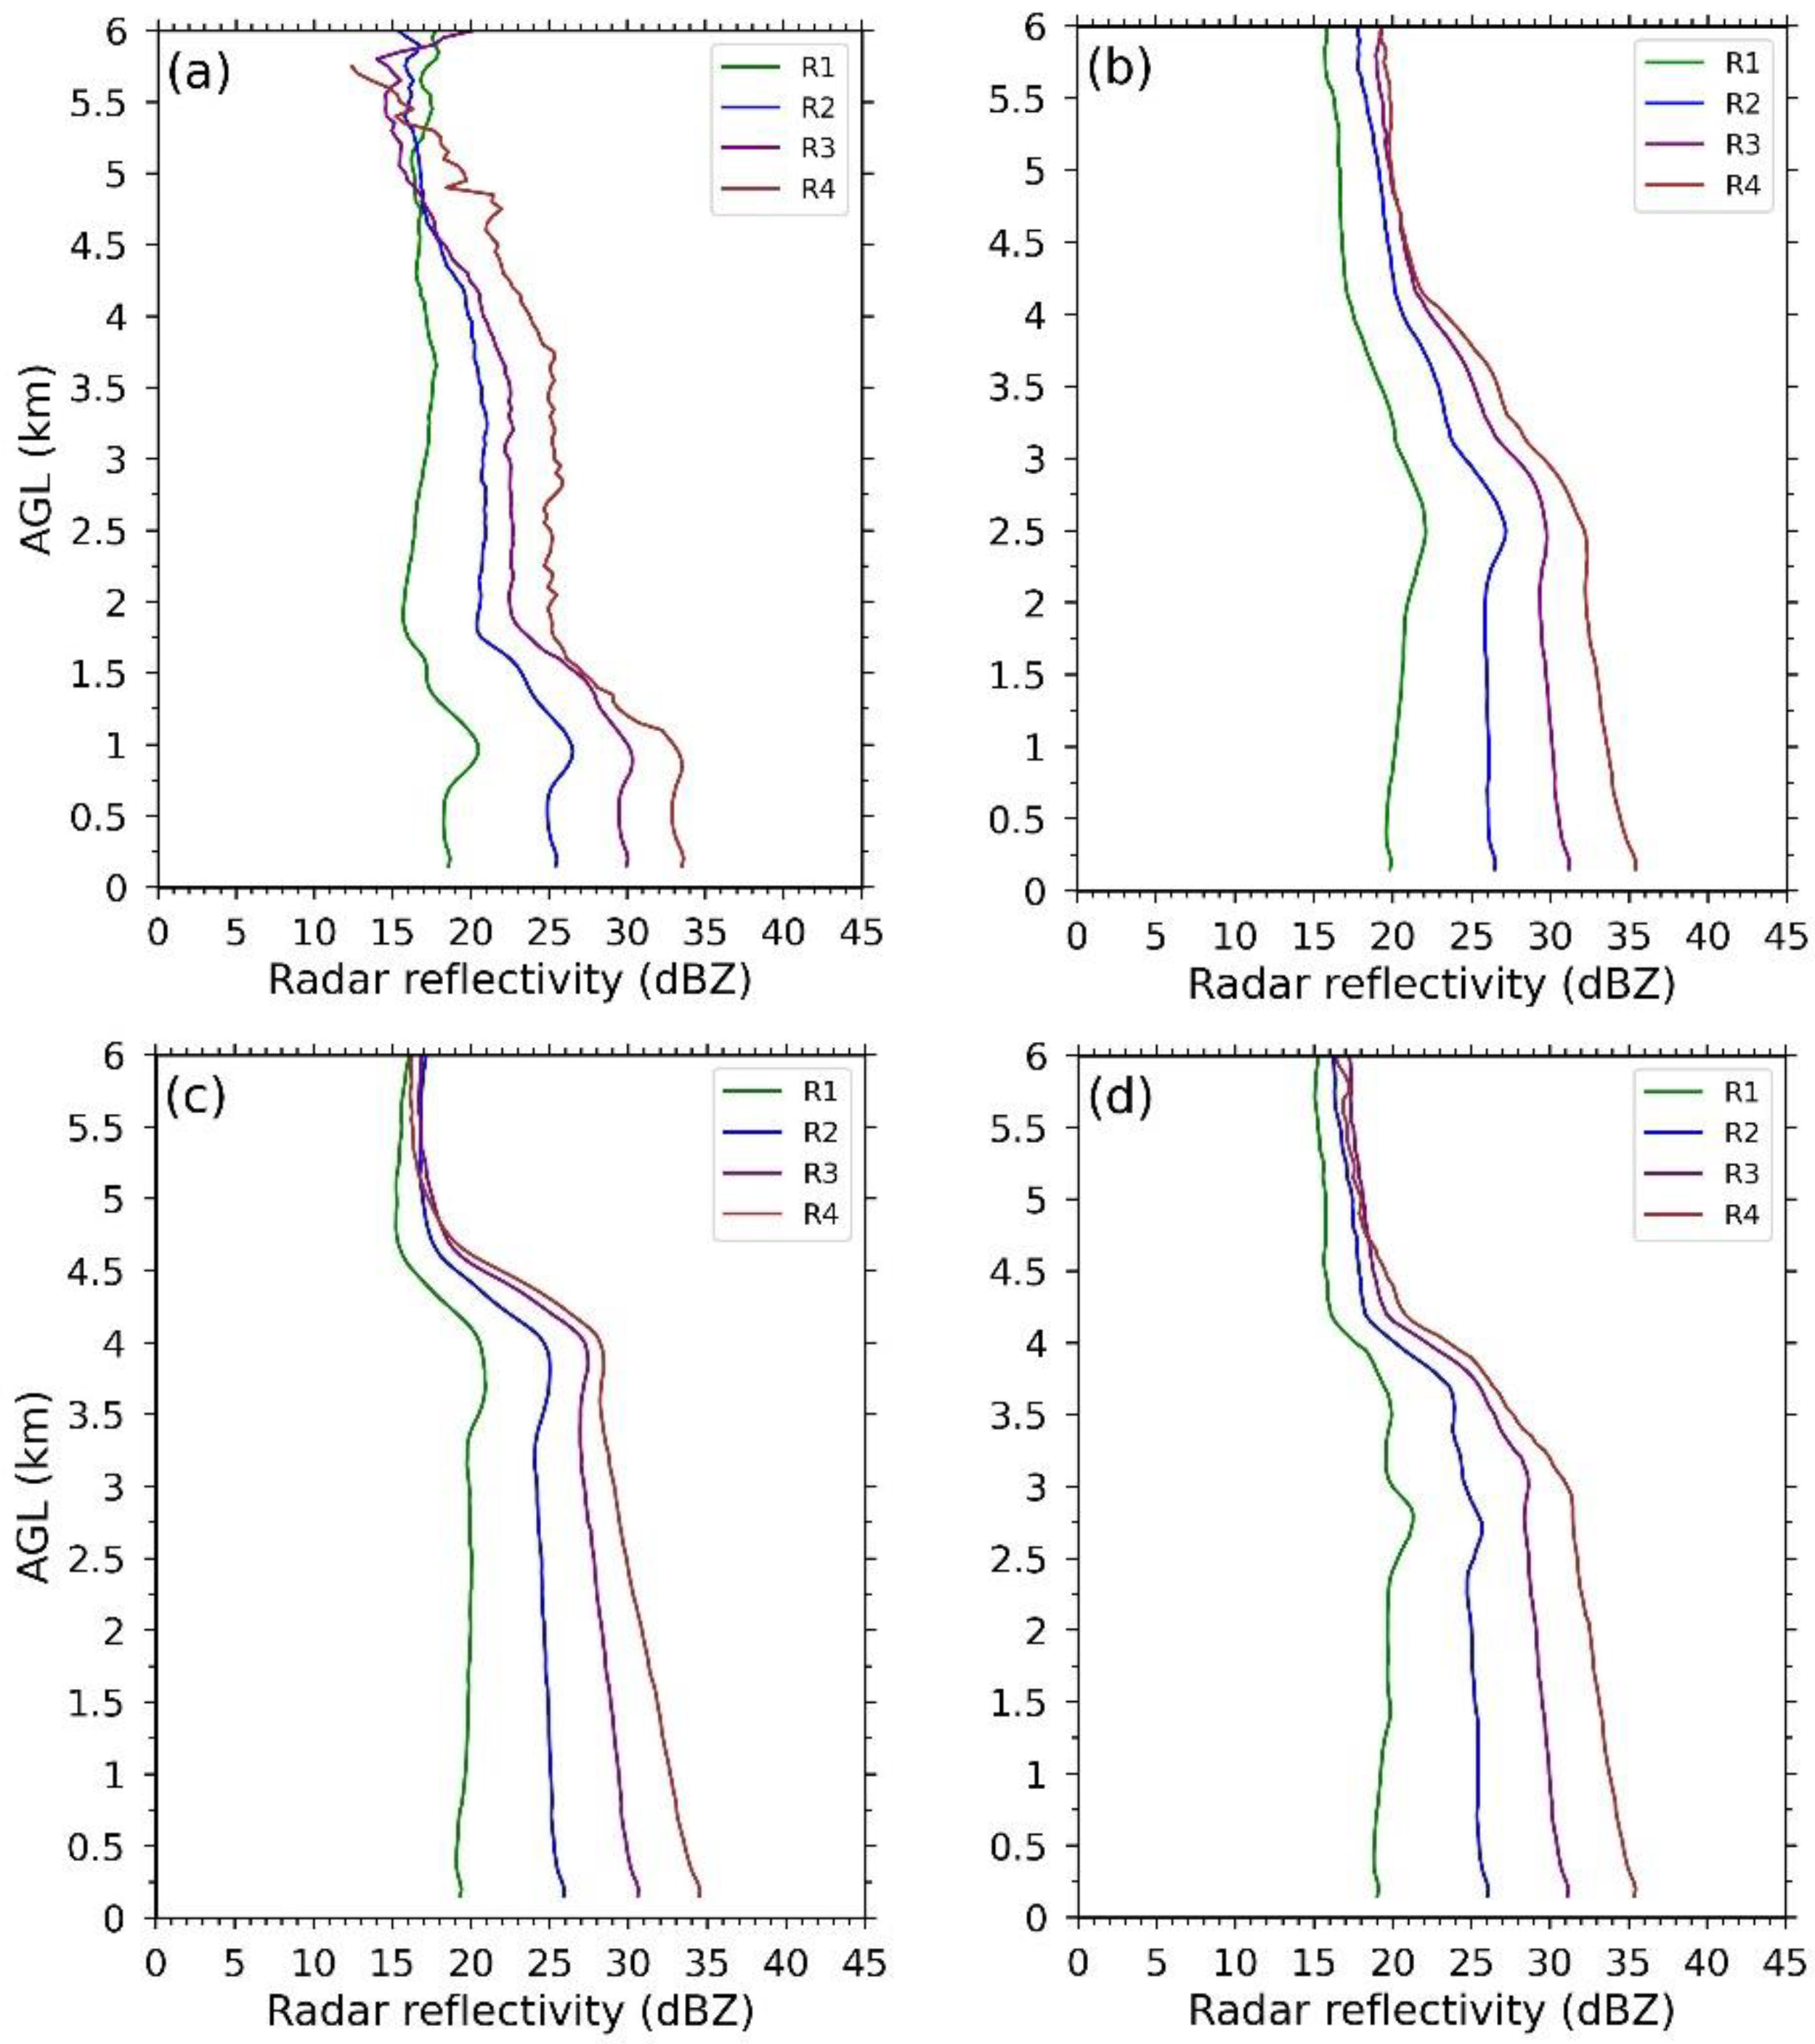
Figure 6.
Vertical profiles of the fall velocity for each category in the four seasons. R1: 0.1 ≤ R < 1.0 mm h−1, R2: 1.0 ≤ R < 2.0 mm h−1, R3: 2.0 ≤ R < 5.0 mm h−1, and R4: 5.0 ≤ R < 10.0 mm h−1: (a) winter; (b) premonsoon; (c) monsoon; and (d) postmonsoon.
Figure 6.
Vertical profiles of the fall velocity for each category in the four seasons. R1: 0.1 ≤ R < 1.0 mm h−1, R2: 1.0 ≤ R < 2.0 mm h−1, R3: 2.0 ≤ R < 5.0 mm h−1, and R4: 5.0 ≤ R < 10.0 mm h−1: (a) winter; (b) premonsoon; (c) monsoon; and (d) postmonsoon.
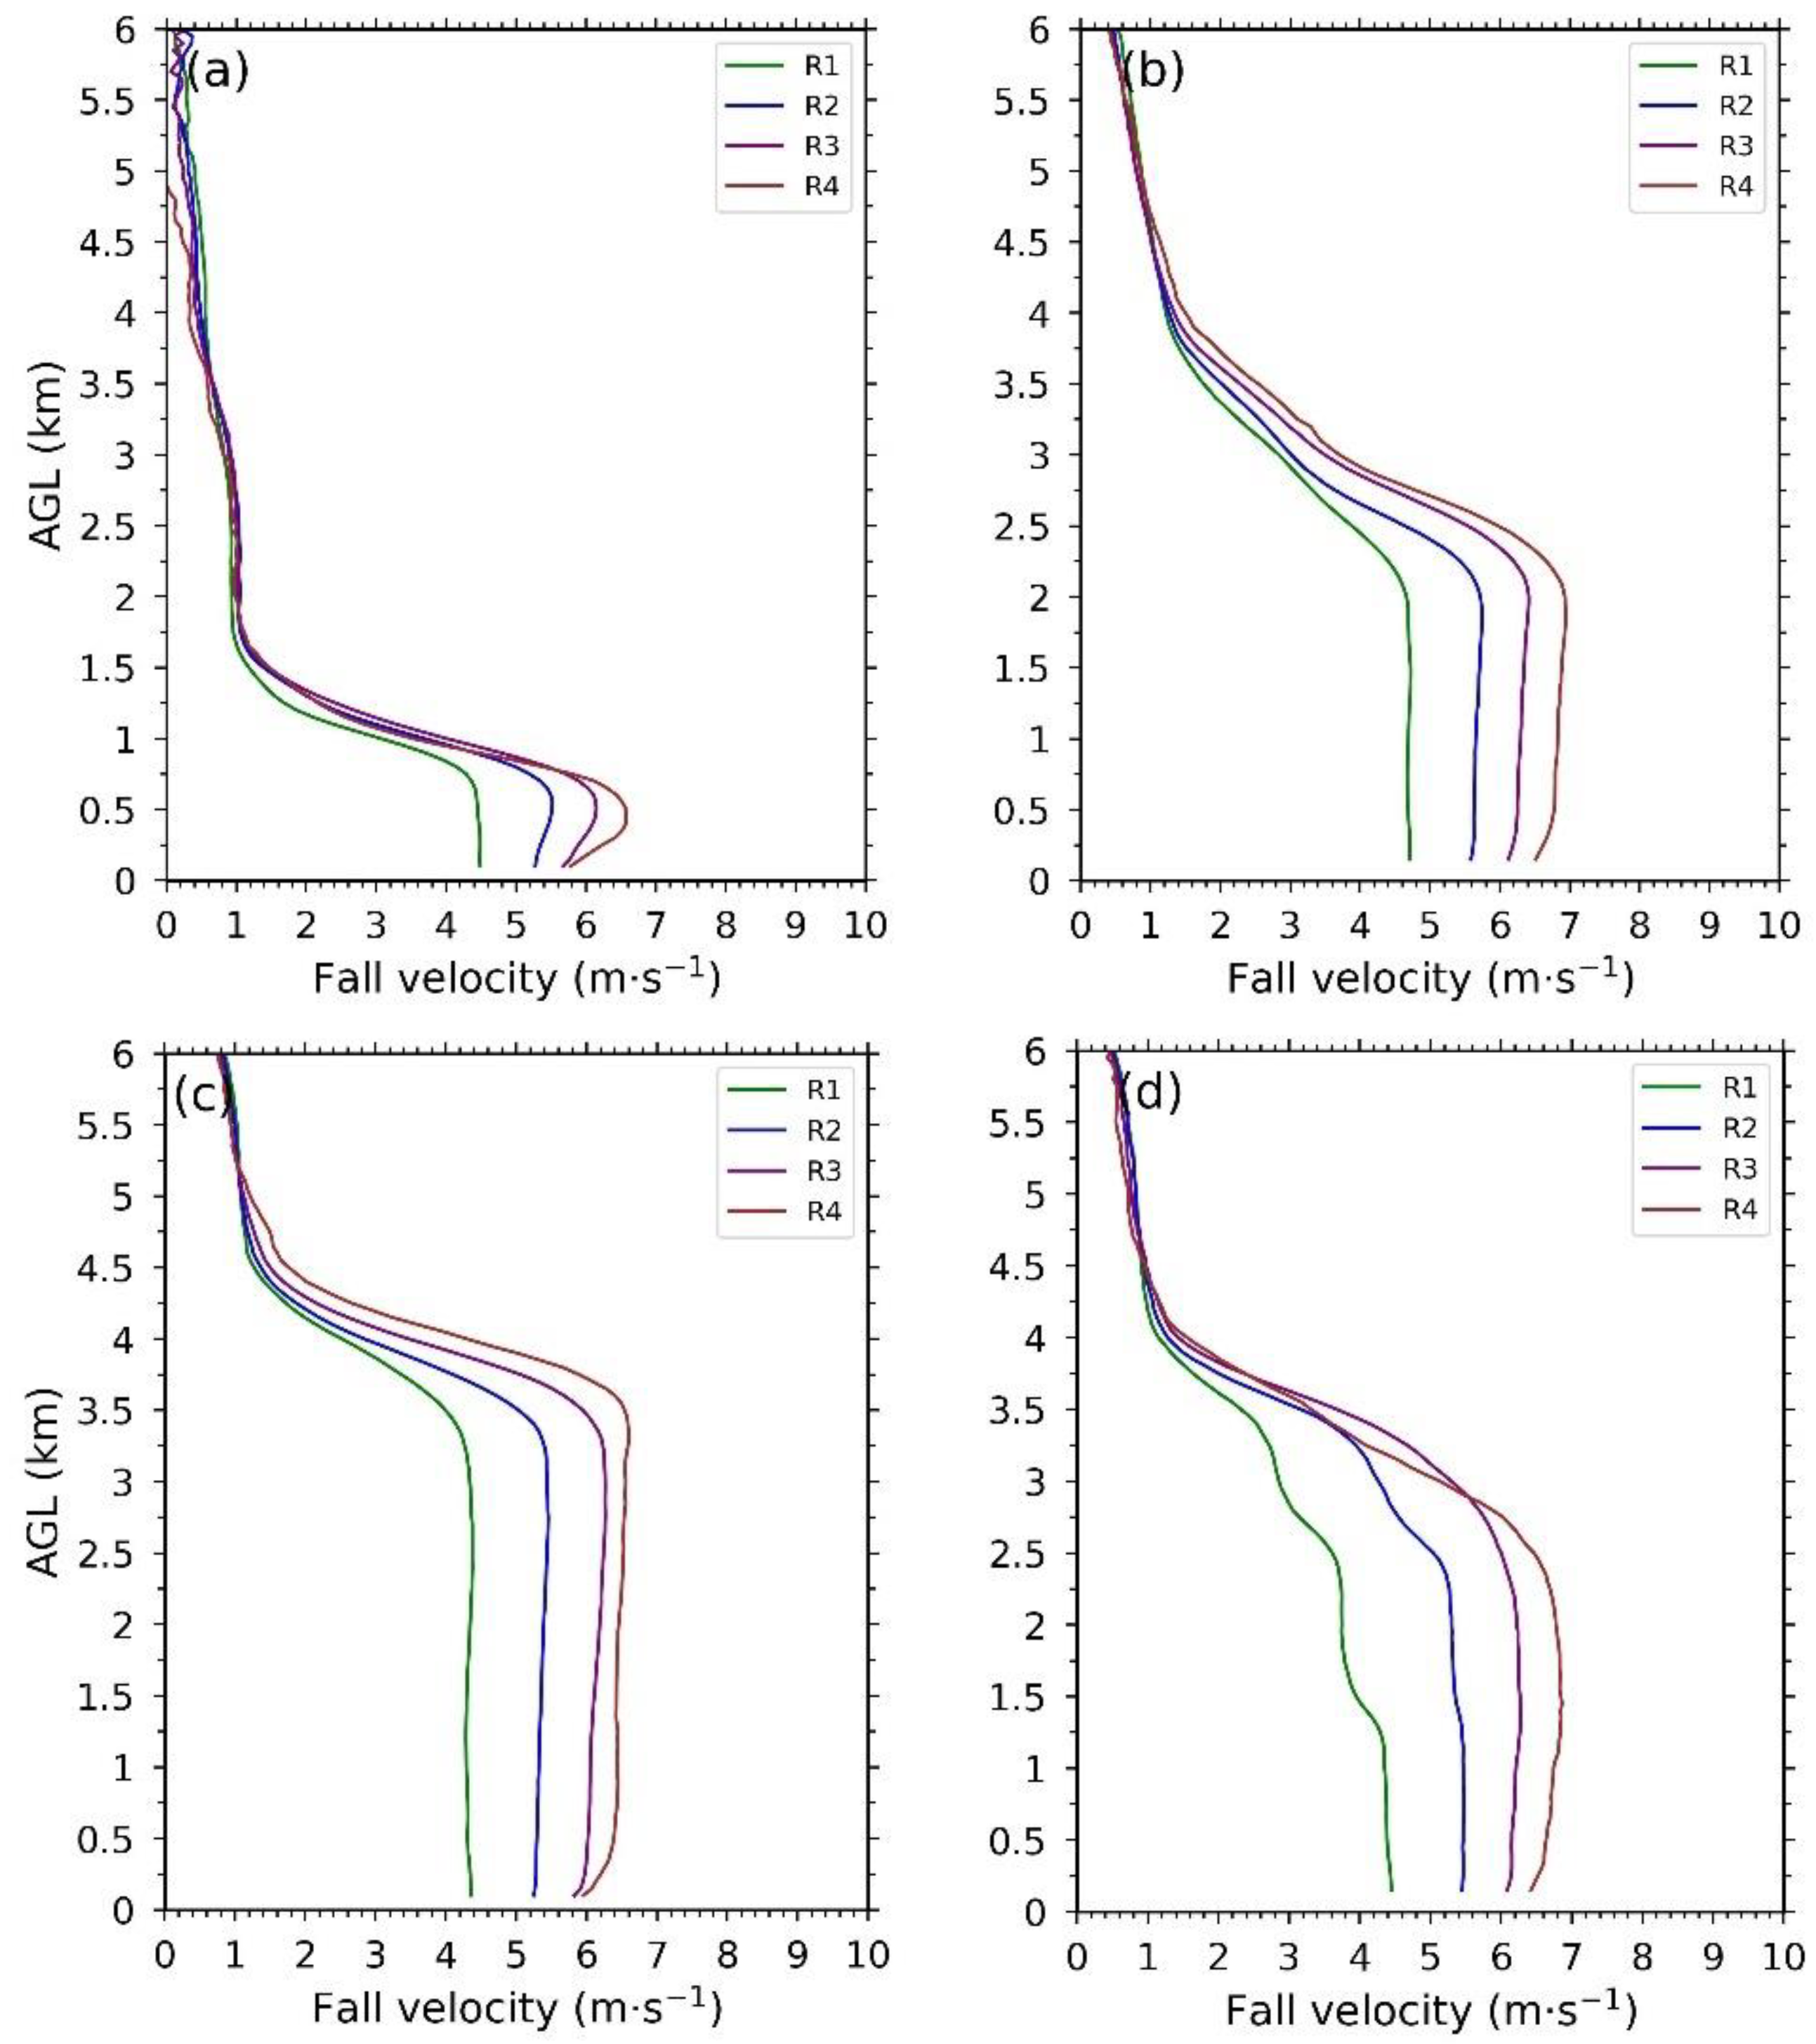
Figure 7.
Vertical profiles of the rain rate for each category in the four seasons. R1: 0.1 ≤ R < 1.0 mm h−1, R2: 1.0 ≤ R < 2.0 mm h−1, R3: 2.0 ≤ R < 5.0 mm h−1, and R4: 5.0 ≤ R < 10.0 mm h−1: (a) winter; (b) premonsoon; (c) monsoon; and (d) postmonsoon.
Figure 7.
Vertical profiles of the rain rate for each category in the four seasons. R1: 0.1 ≤ R < 1.0 mm h−1, R2: 1.0 ≤ R < 2.0 mm h−1, R3: 2.0 ≤ R < 5.0 mm h−1, and R4: 5.0 ≤ R < 10.0 mm h−1: (a) winter; (b) premonsoon; (c) monsoon; and (d) postmonsoon.
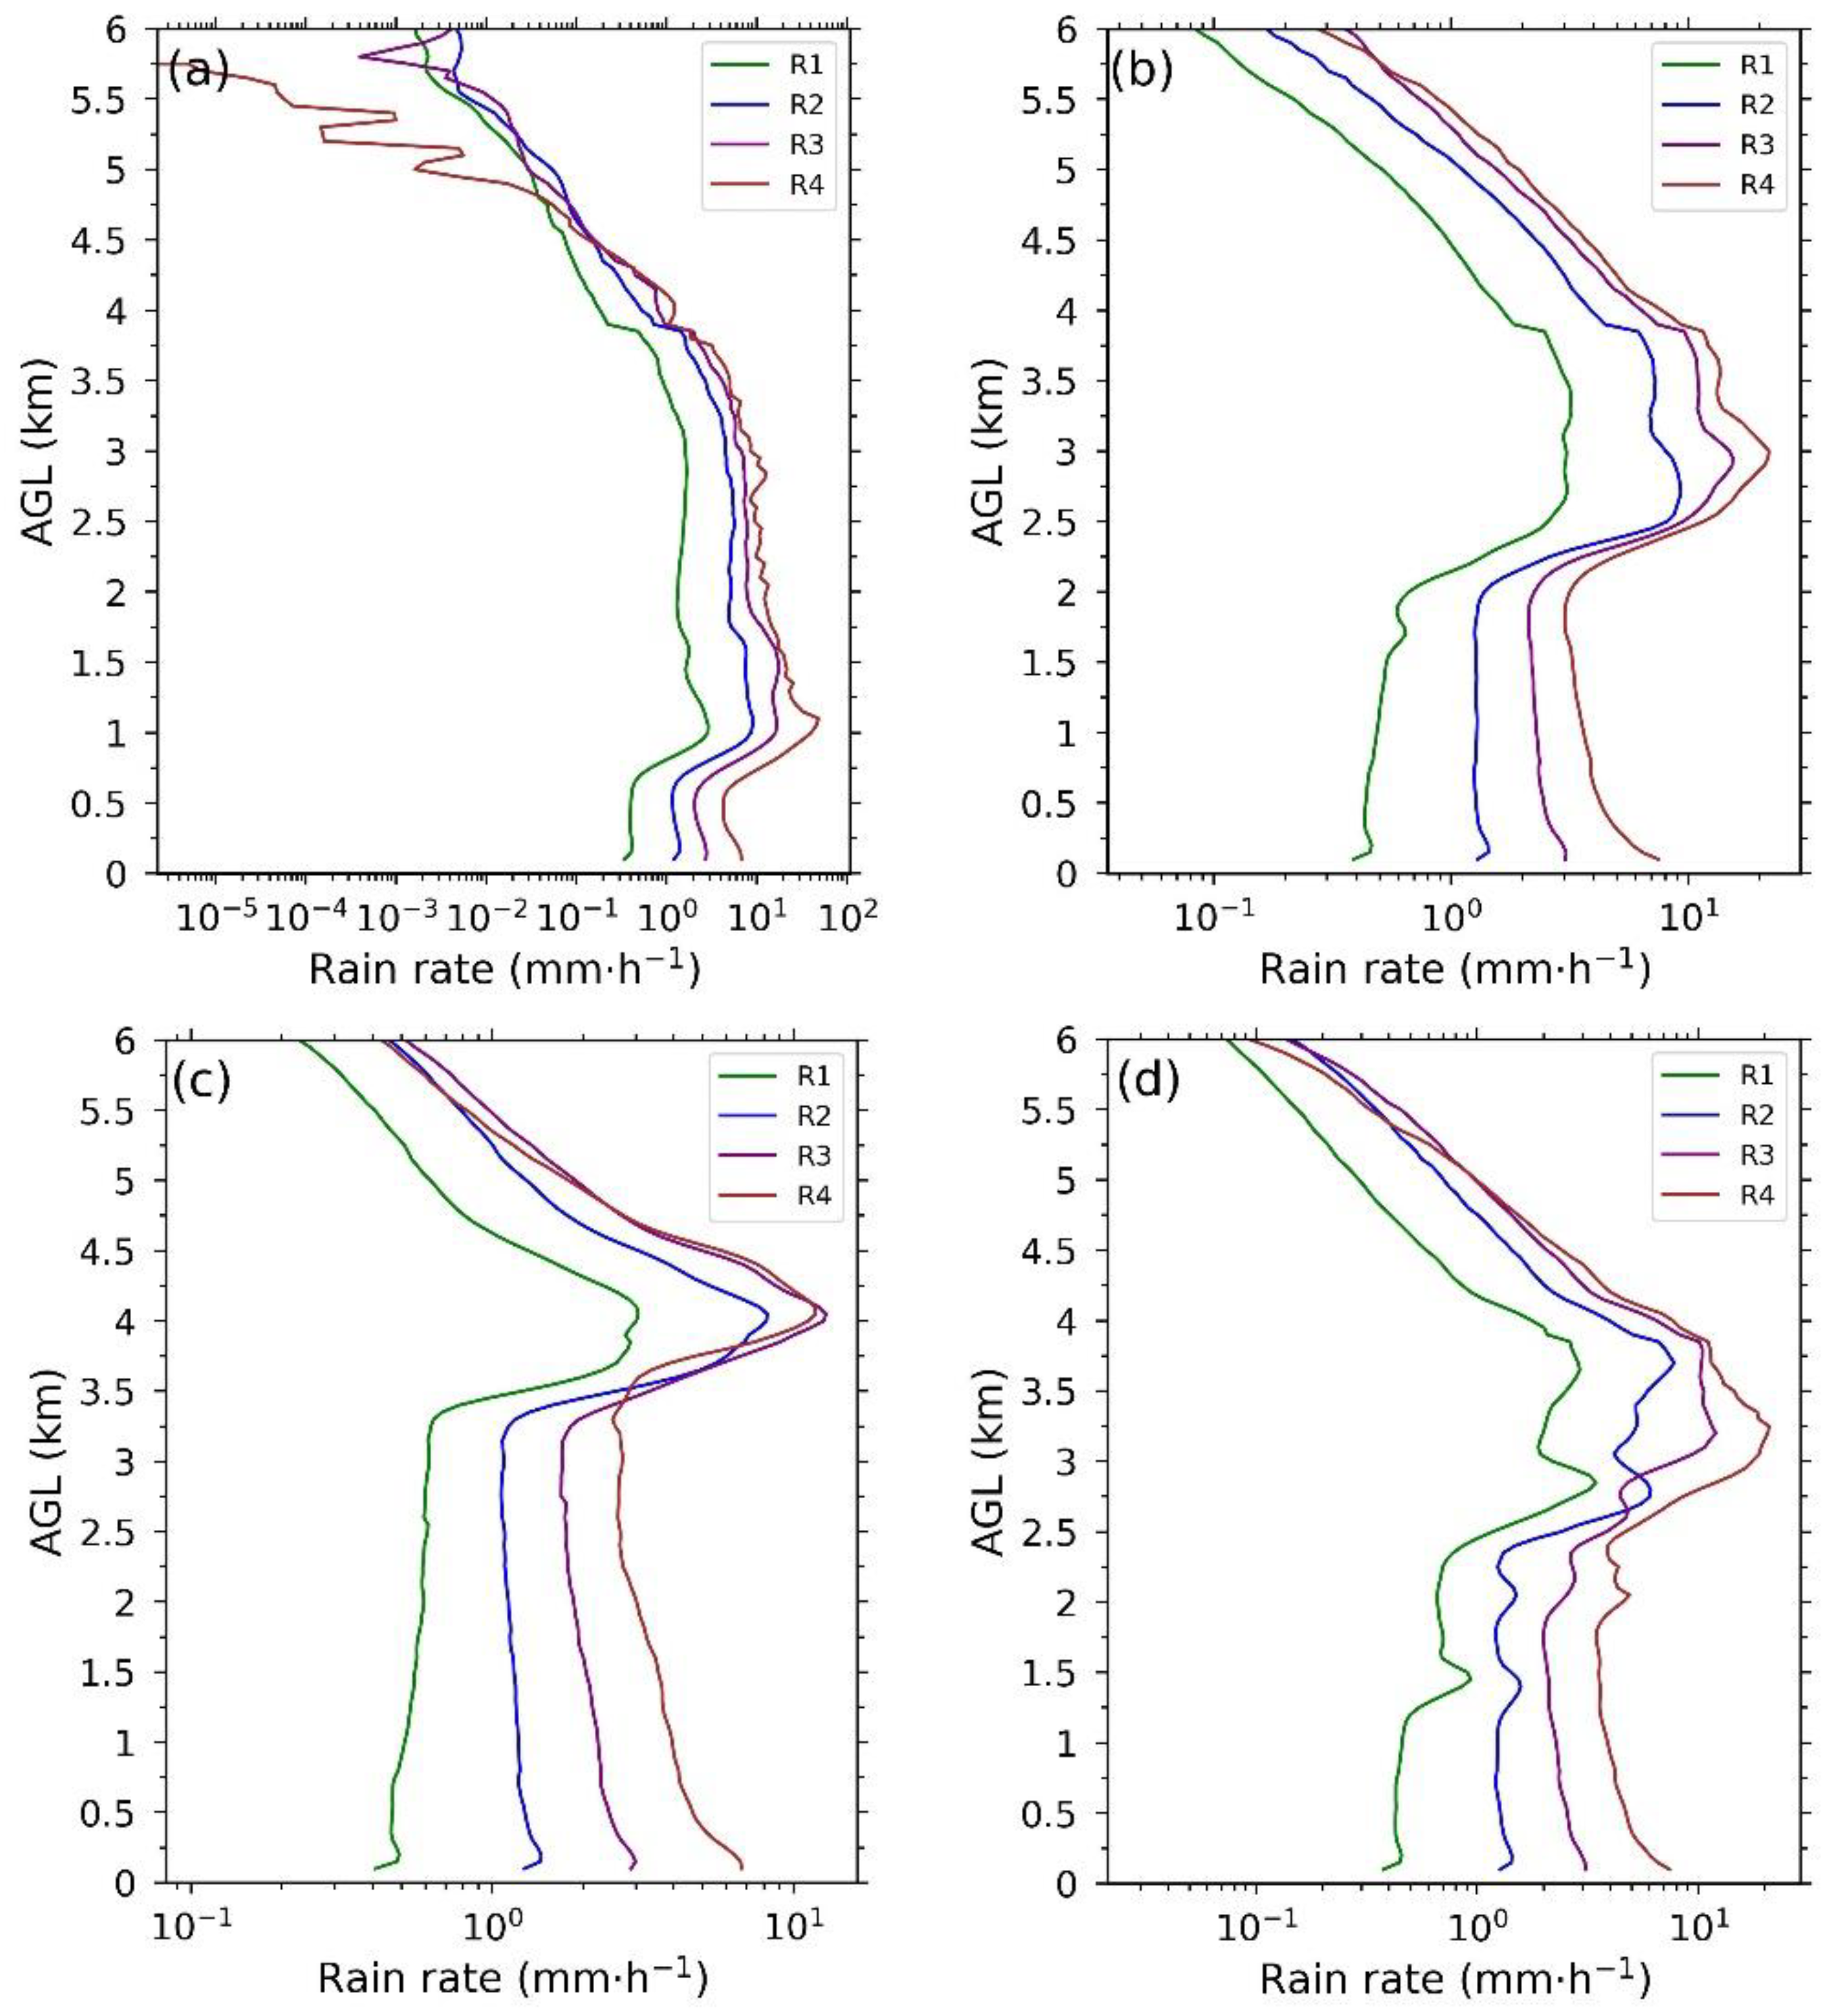
Figure 8.
Vertical profiles of the liquid water content for each category in the four seasons. R1: 0.1 ≤ R < 1.0 mm h−1, R2: 1.0 ≤ R < 2.0 mm h−1, R3: 2.0 ≤ R < 5.0 mm h−1, and R4: 5.0 ≤ R < 10.0 mm h−1: (a) winter; (b) premonsoon; (c) monsoon; and (d) postmonsoon.
Figure 8.
Vertical profiles of the liquid water content for each category in the four seasons. R1: 0.1 ≤ R < 1.0 mm h−1, R2: 1.0 ≤ R < 2.0 mm h−1, R3: 2.0 ≤ R < 5.0 mm h−1, and R4: 5.0 ≤ R < 10.0 mm h−1: (a) winter; (b) premonsoon; (c) monsoon; and (d) postmonsoon.
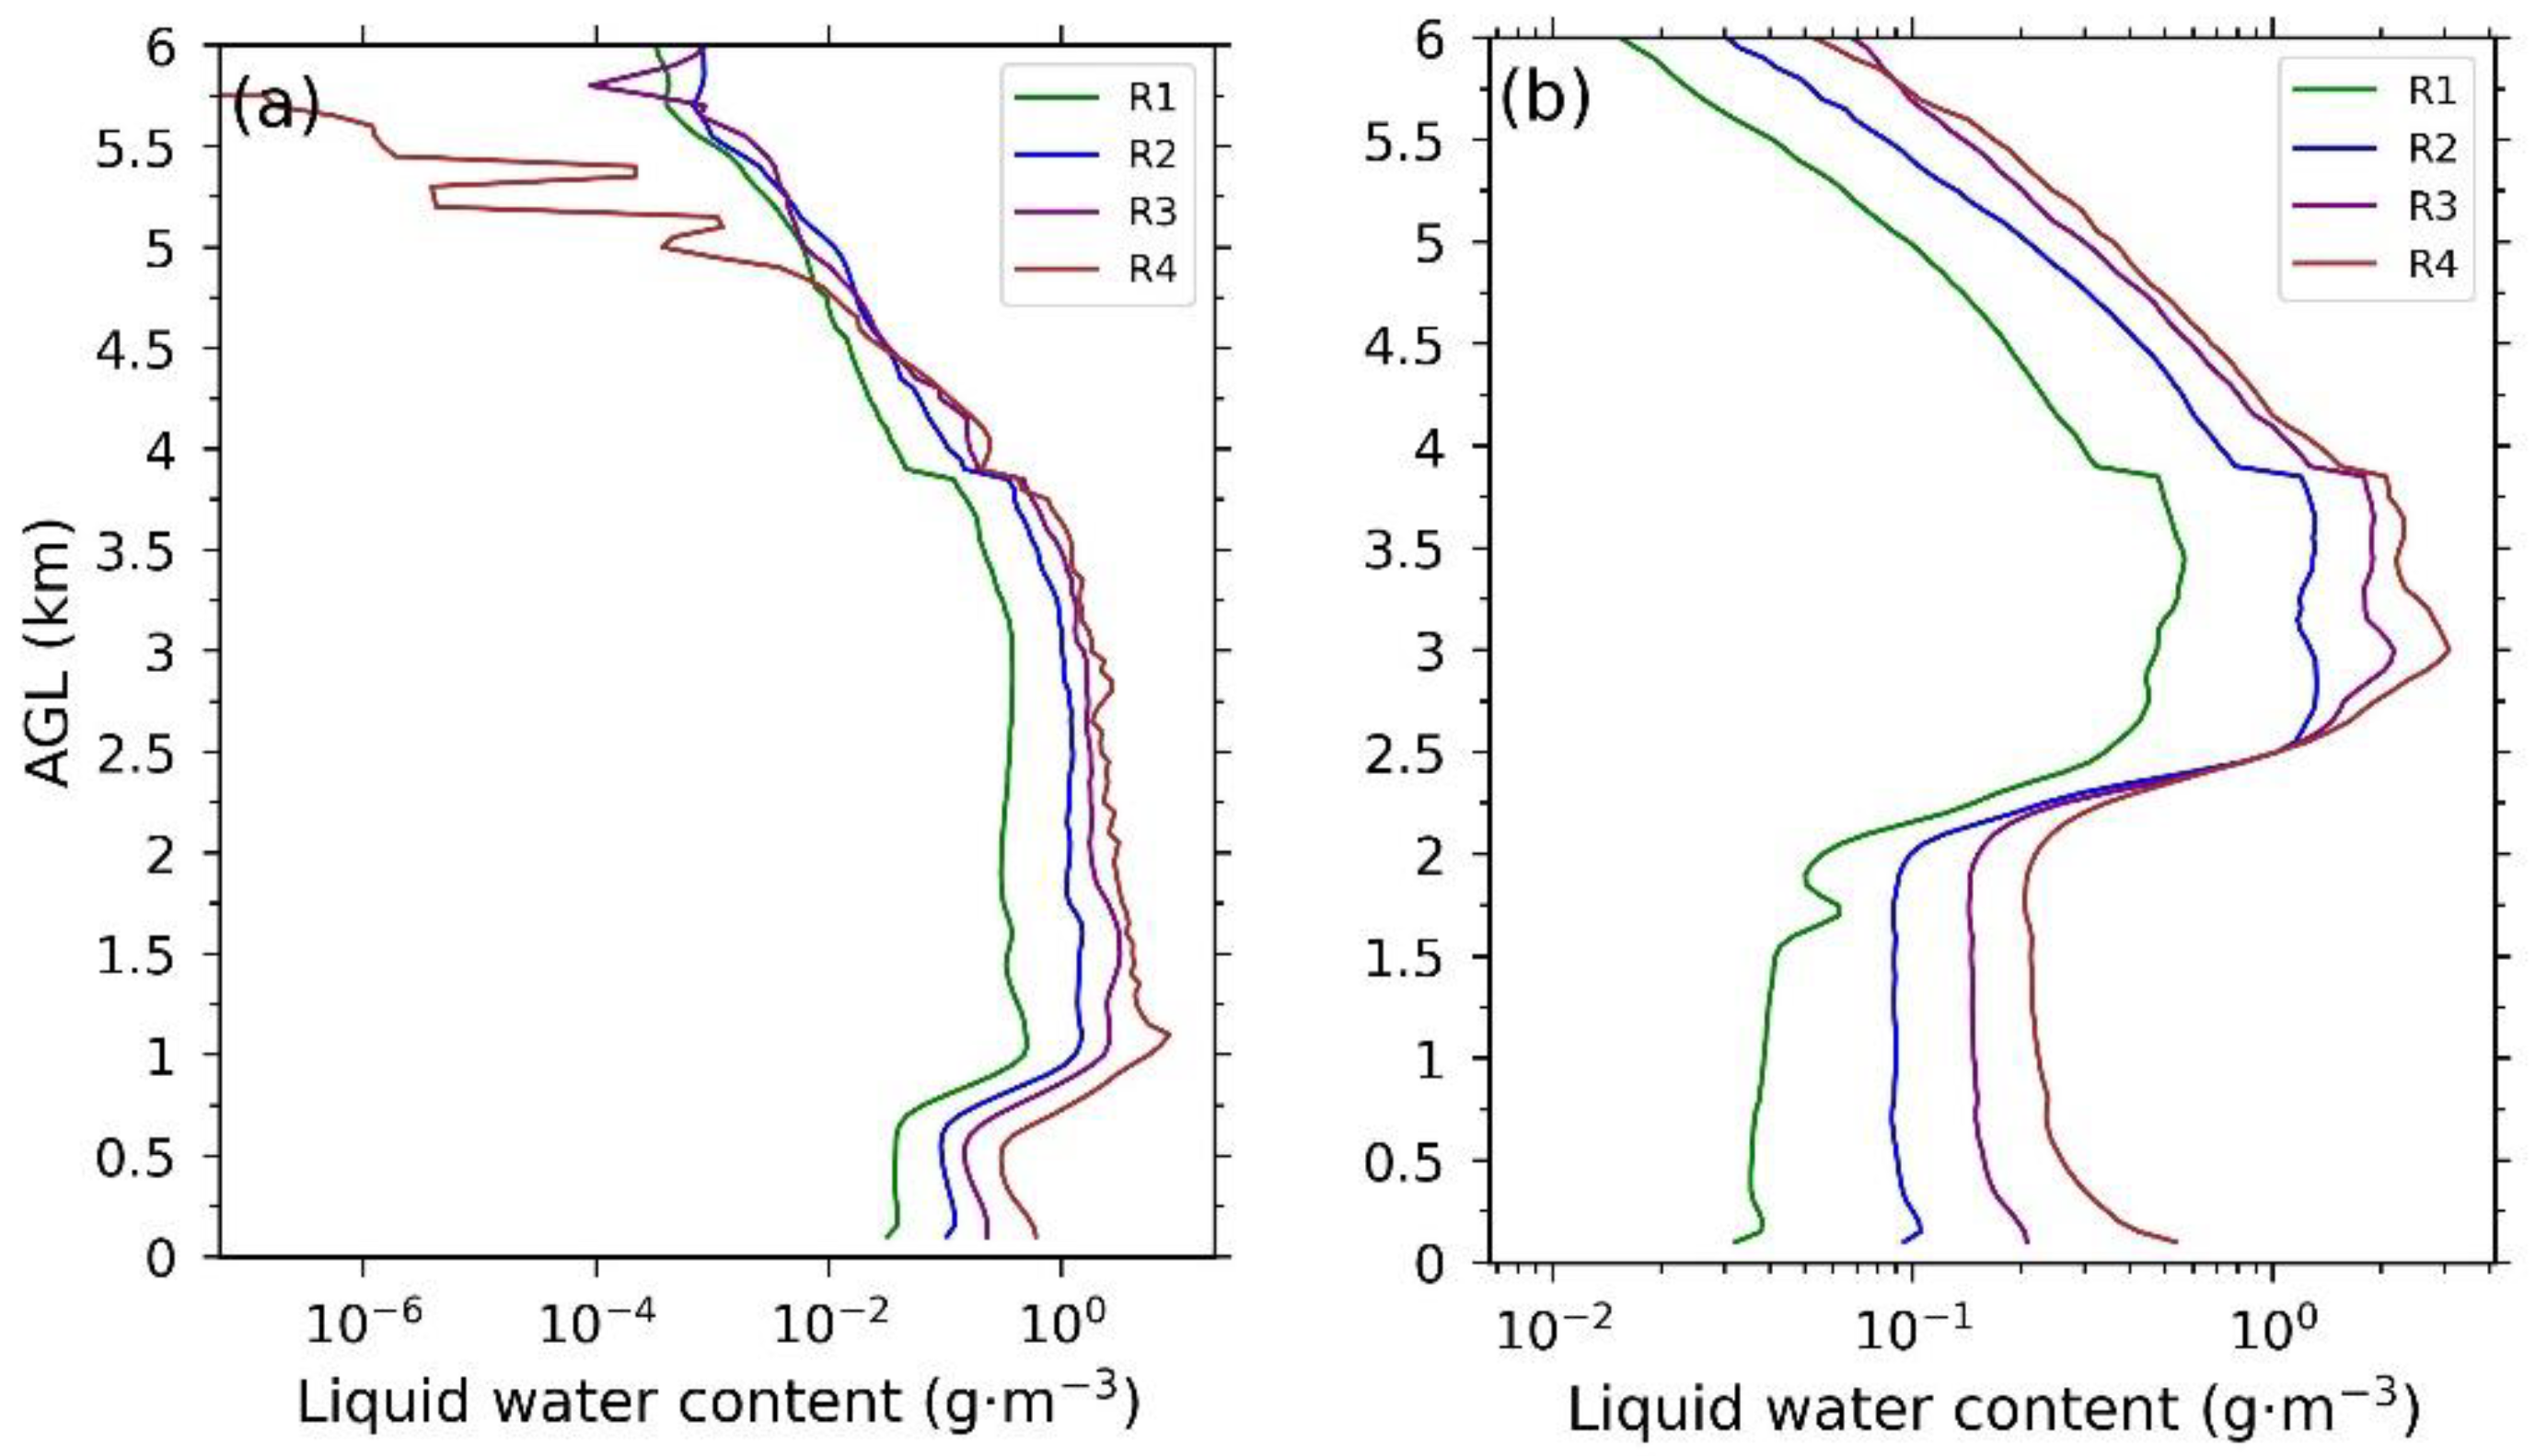
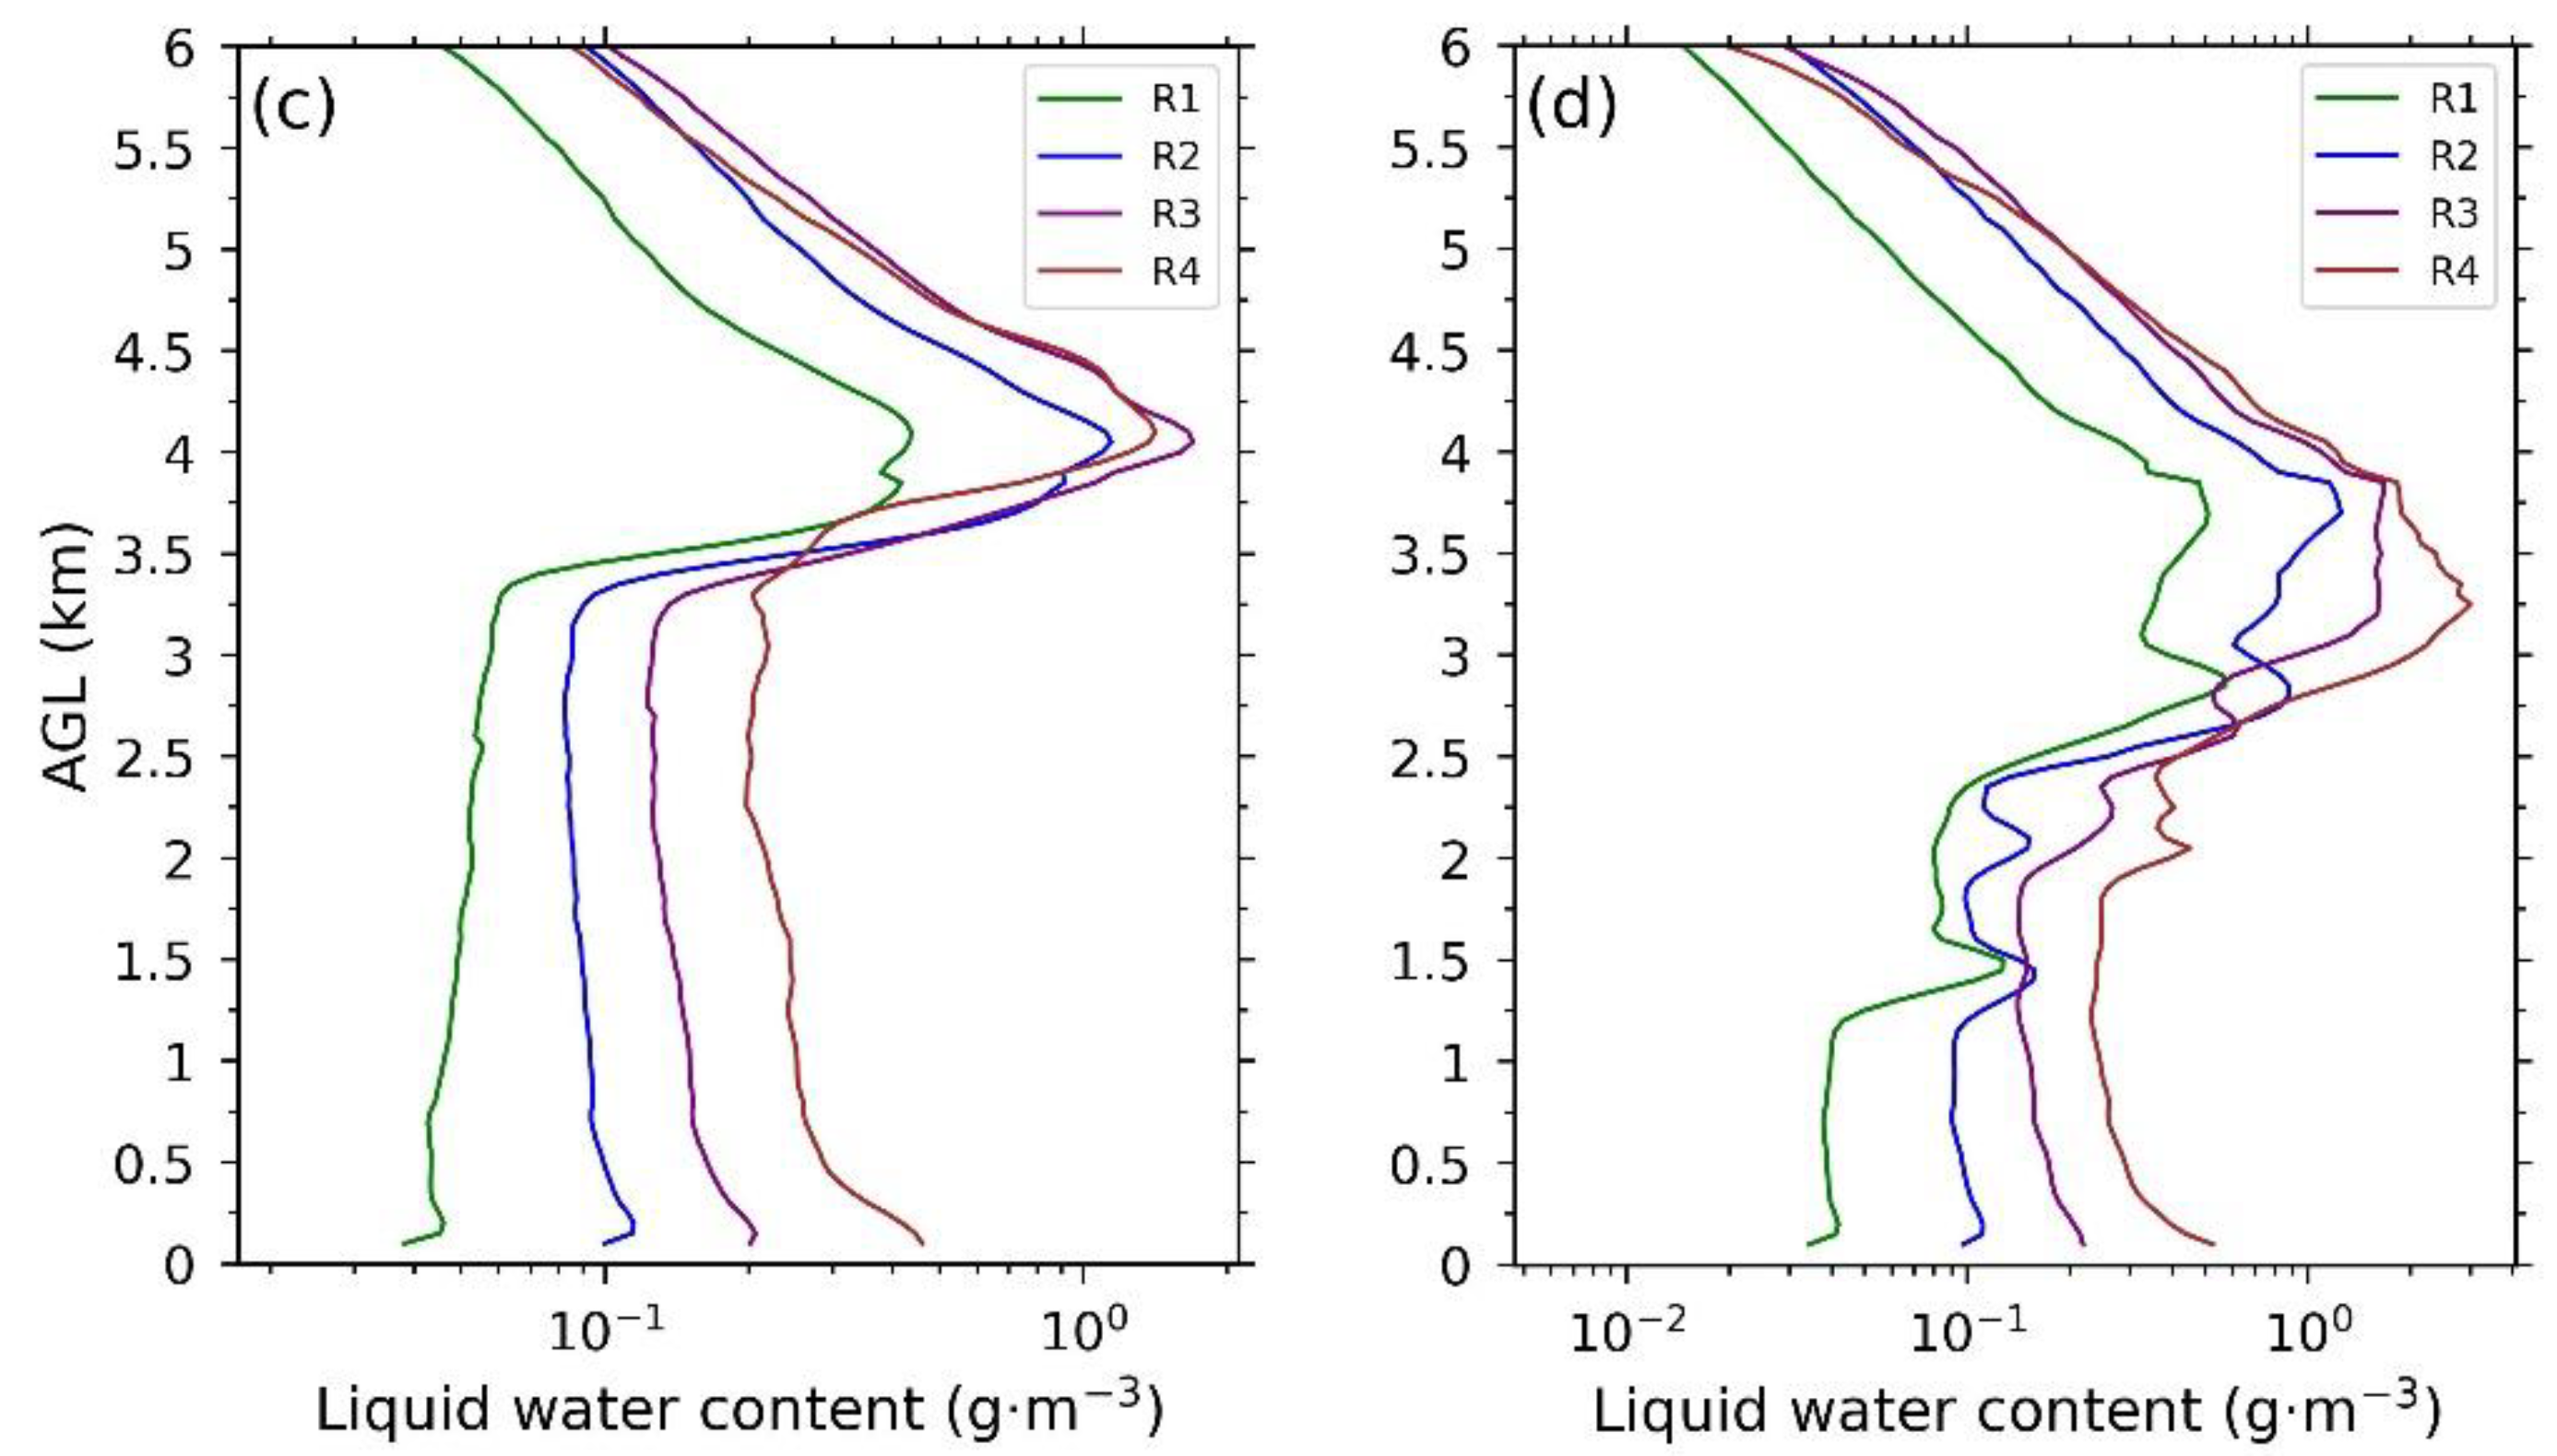
Figure 9.
Vertical structure of the DSD in different rain categories in the winter (a–d), premonsoon (e–h), monsoon (i–l), and postmonsoon (m–p) seasons.
Figure 9.
Vertical structure of the DSD in different rain categories in the winter (a–d), premonsoon (e–h), monsoon (i–l), and postmonsoon (m–p) seasons.
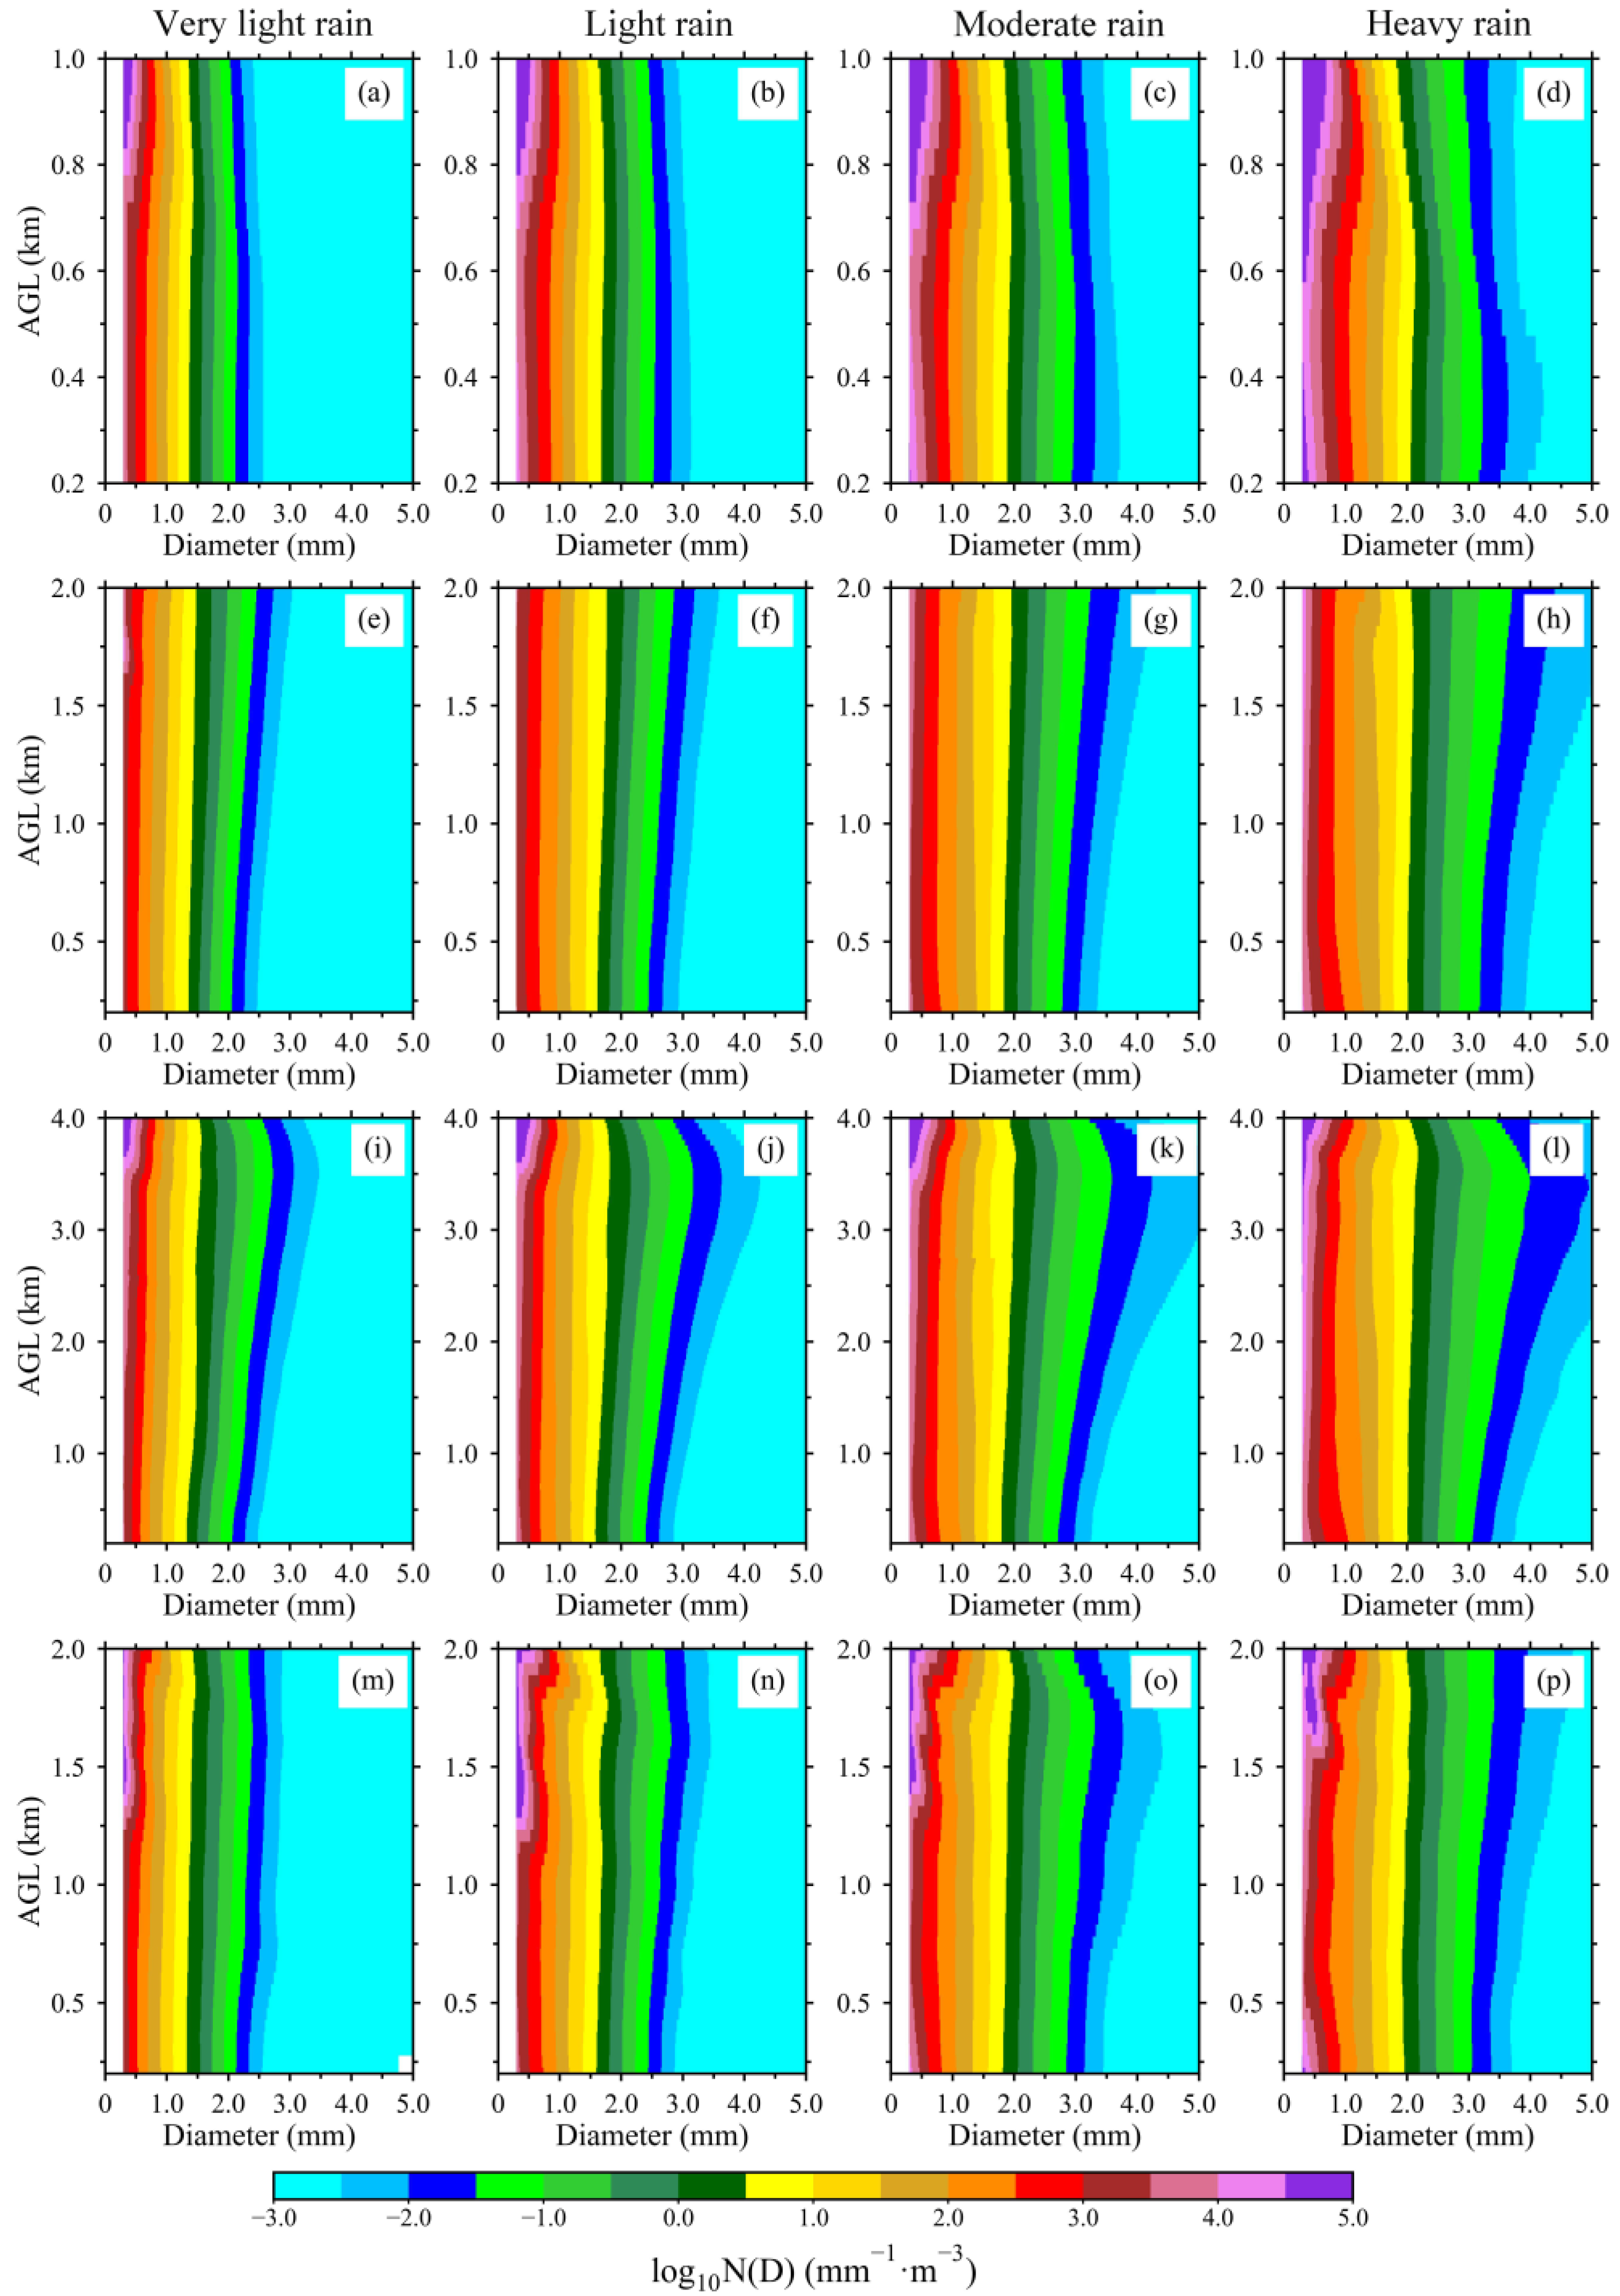
Figure 10.
Seasonal variation in the average DSD at several heights.
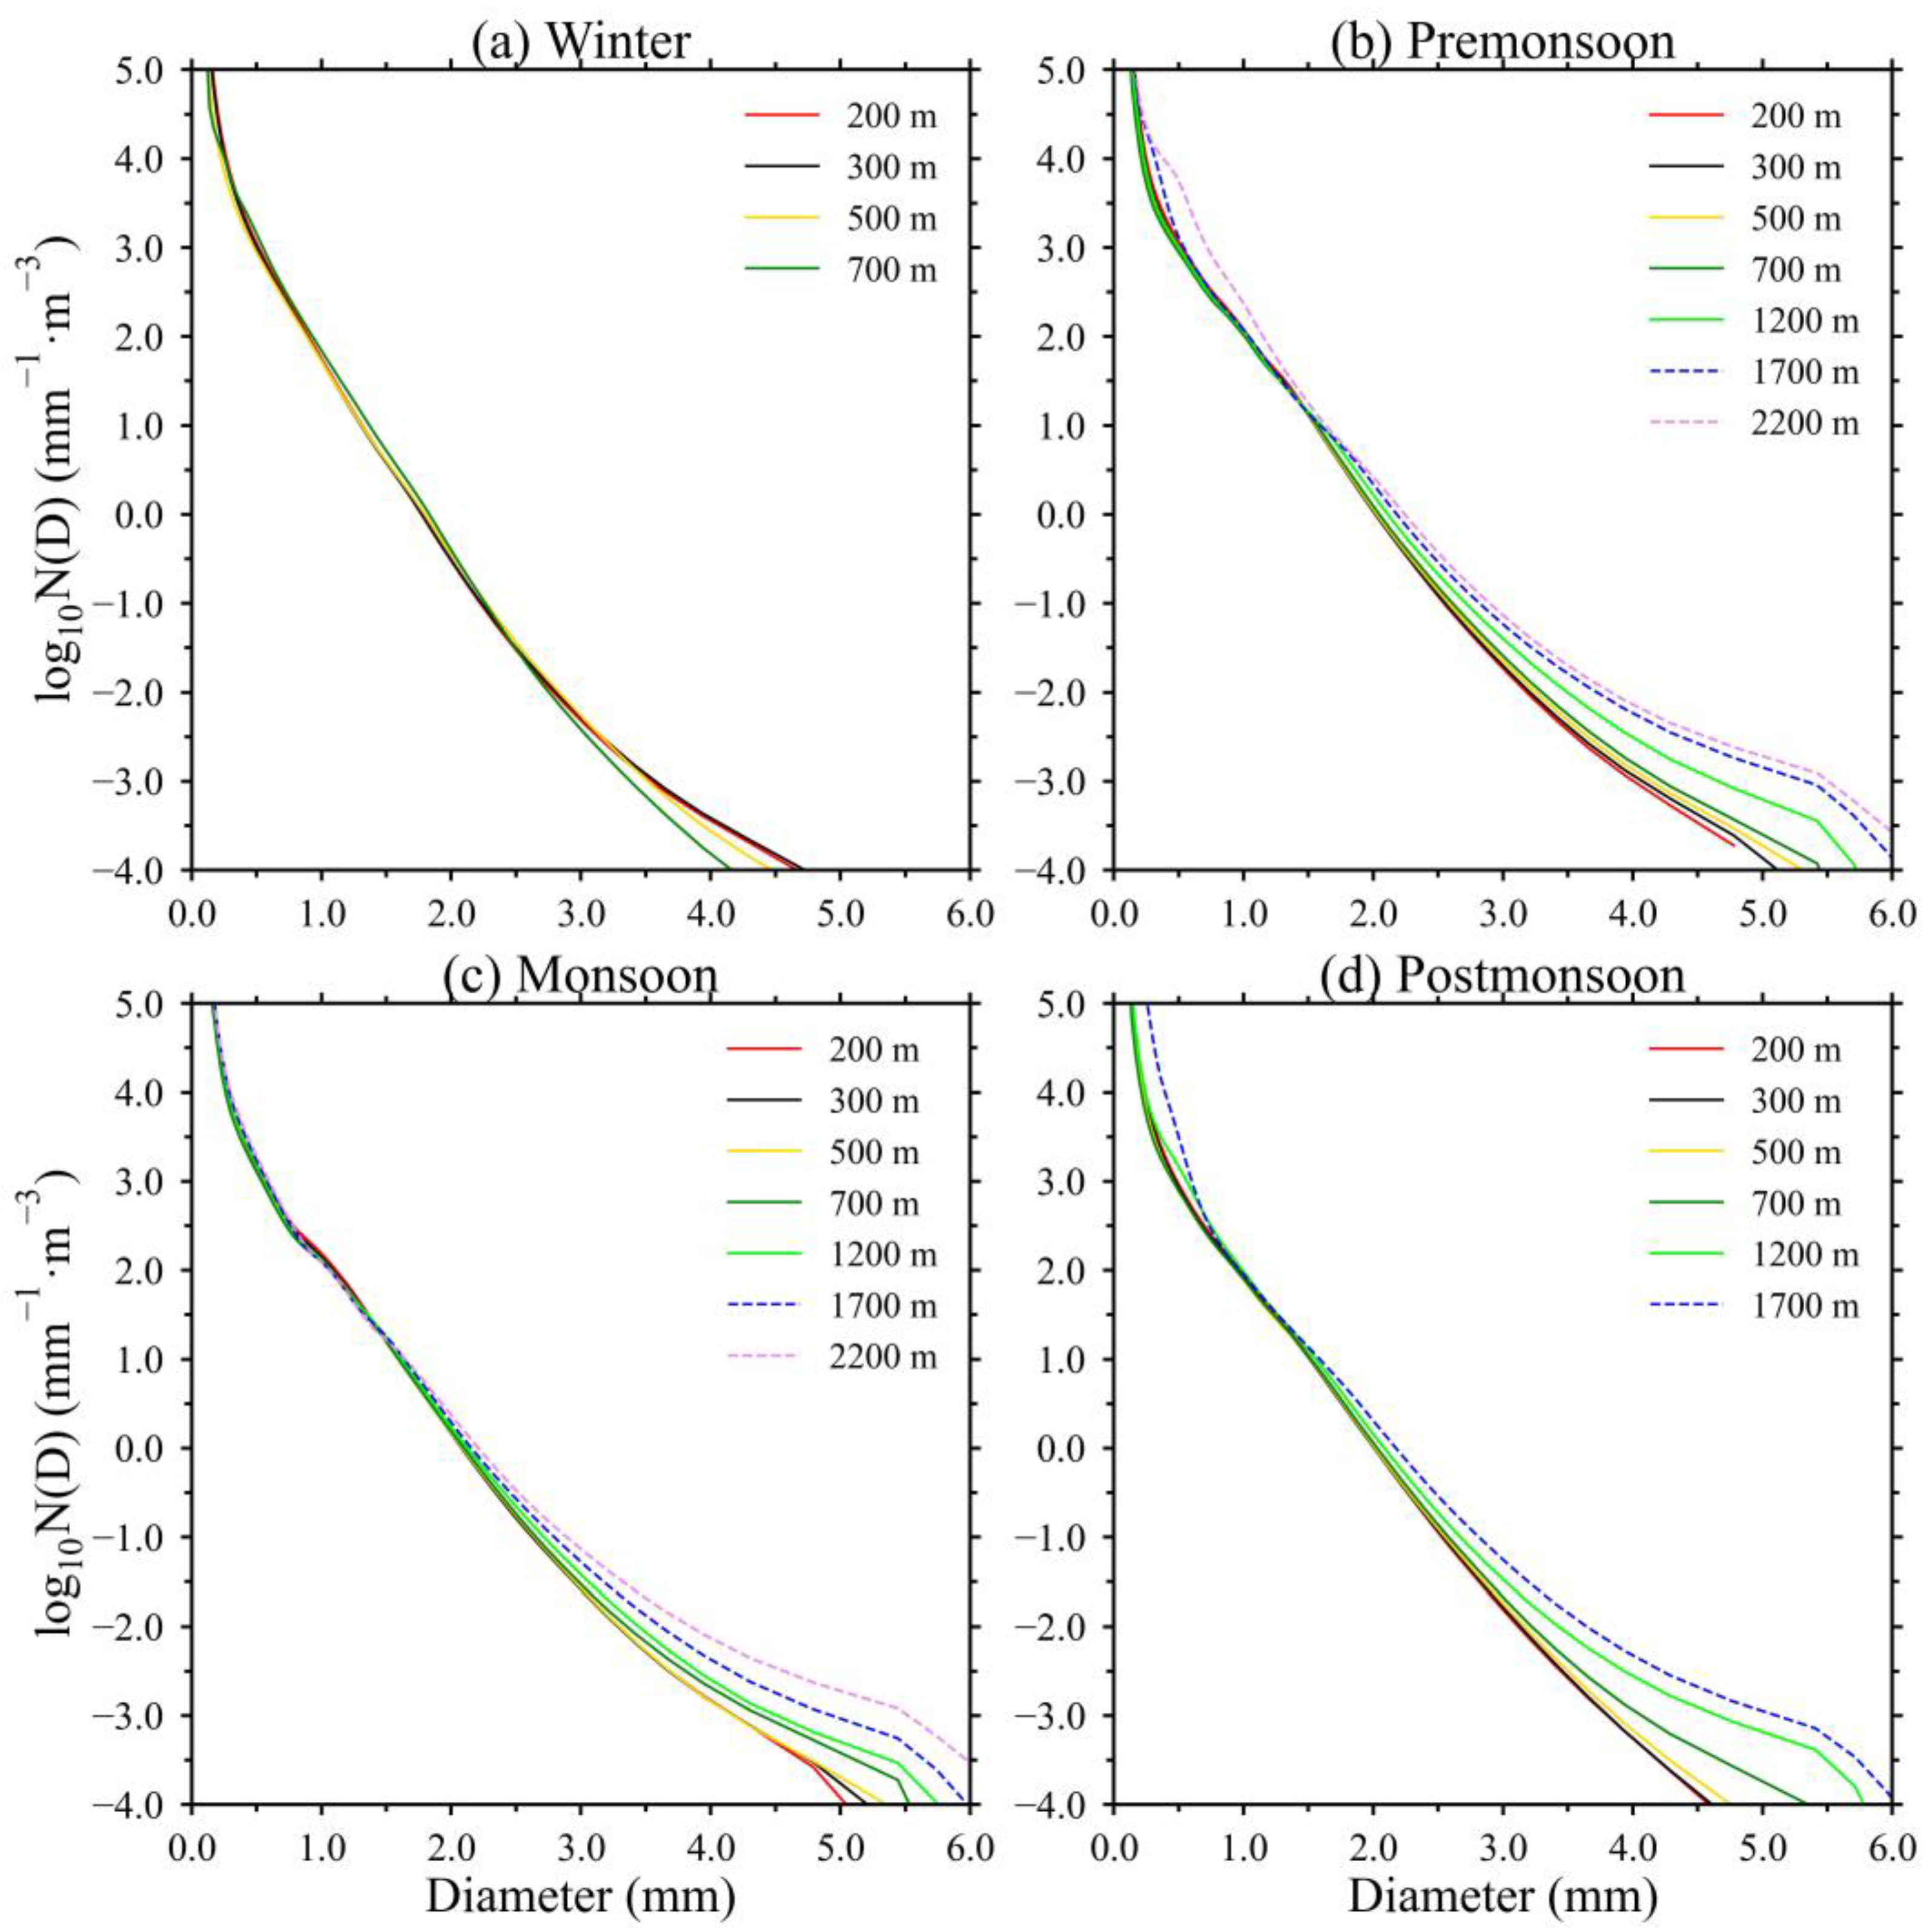
Figure 11.
Contributions of different diameter categories to the total number concentration Nt (a,c,e,g) and precipitation intensity R (b,d,f,h) for stratiform samples in each season.
Figure 11.
Contributions of different diameter categories to the total number concentration Nt (a,c,e,g) and precipitation intensity R (b,d,f,h) for stratiform samples in each season.


Table 1.
The main specifications of the MRR-pro.
| Specifications | |
|---|---|
| Operating frequency | 24.23 GHZ |
| Operating mode | FMCW |
| Output power | 50 mW (+17 dBm) |
| Beam width | 1.5° |
| Temporal resolution | 60 s (minimum 1 s) |
| Height resolution | 50 m |
| Range gates | 32–256 |
Table 2.
Stratiform precipitation samples for each category during the four seasons.
| R Categories () | Samples (min) | |||
|---|---|---|---|---|
| Winter | Premonsoon | Monsoon | Postmonsoon | |
| R1 () | 7450 | 9950 | 10,152 | 6357 |
| R2 () | 1564 | 4228 | 5265 | 2188 |
| R3 () | 734 | 3934 | 4710 | 1703 |
| R4 () | 74 | 741 | 894 | 401 |
| Total | 9822 | 18,853 | 21,021 | 10,649 |
Disclaimer/Publisher’s Note: The statements, opinions and data contained in all publications are solely those of the individual author(s) and contributor(s) and not of MDPI and/or the editor(s). MDPI and/or the editor(s) disclaim responsibility for any injury to people or property resulting from any ideas, methods, instructions or products referred to in the content. |
© 2024 by the authors. Licensee MDPI, Basel, Switzerland. This article is an open access article distributed under the terms and conditions of the Creative Commons Attribution (CC BY) license (https://creativecommons.org/licenses/by/4.0/).
Share and Cite
MDPI and ACS Style
Wen, J.; Wang, G.; Zhou, R.; Li, R.; Zhaxi, S.; Bai, M. Seasonal Variation in Vertical Structure for Stratiform Rain at Mêdog Site in Southeastern Tibetan Plateau. Remote Sens. 2024, 16, 1230. https://doi.org/10.3390/rs16071230
AMA Style
Wen J, Wang G, Zhou R, Li R, Zhaxi S, Bai M. Seasonal Variation in Vertical Structure for Stratiform Rain at Mêdog Site in Southeastern Tibetan Plateau. Remote Sensing. 2024; 16(7):1230. https://doi.org/10.3390/rs16071230
Chicago/Turabian StyleWen, Jiaqi, Gaili Wang, Renran Zhou, Ran Li, Suolang Zhaxi, and Maqiao Bai. 2024. "Seasonal Variation in Vertical Structure for Stratiform Rain at Mêdog Site in Southeastern Tibetan Plateau" Remote Sensing 16, no. 7: 1230. https://doi.org/10.3390/rs16071230
Note that from the first issue of 2016, this journal uses article numbers instead of page numbers. See further details here.