
Spatiotemporal Variation and Causes of Typical Extreme Precipitation Events in Shandong Province over the Last 50 Years


1
School of Geography and Tourism, Qufu Normal University, Rizhao 276826, China
2
Institute of Yellow River Ecology, Qufu Normal University, Rizhao 276826, China
*
Author to whom correspondence should be addressed.
Remote Sens. 2024, 16(7), 1283; https://doi.org/10.3390/rs16071283
Submission received: 19 February 2024
/
Revised: 24 March 2024
/
Accepted: 2 April 2024
/
Published: 5 April 2024
(This article belongs to the Special Issue Remote Sensing Applications for Flood Forecasting and Flood Risk Management)
Abstract
:In this study, based on hourly ERA5 reanalysis data from July to September, from 1971 to 2020, for Shandong Province, we used mathematical statistical analysis, the Mann–Kendall nonparametric statistical test, cluster analysis, and other methods to extract and analyze the spatiotemporal variation characteristics and causes of typical extreme precipitation events. The results indicated the following: (1) The total number and duration of precipitation events show a nonsignificant upward trend, while the average and extreme rainfall intensities show a nonsignificant downward trend. (2) Extreme precipitation events are primarily concentrated in Qingdao, Jinan, Heze, and Binzhou, with fewer events occurring in central Shandong Province. (3) Extreme precipitation events are classified into four types (namely, patterns I, II, III, and IV). Pattern I exhibits two rain peaks, with the primary rain peak occurring after the secondary rain peak. Similarly, pattern II also displays two rain peaks, with equivalent rainfall amounts for both peaks. In contrast, pattern III has multiple, evenly distributed rain peaks. Finally, pattern IV shows a rain peak during the first half of the precipitation event. Pattern I has the highest occurrence probability (46%), while pattern IV has the lowest (7%). (4) The spatial distributions of the different rain patterns are similar, with most being found in the eastern coastal and western regions. (5) Extreme precipitation events result from interactions between large-scale circulation configurations and mesoscale convective systems. The strong blocking situation and significant circulation transport at middle and low latitudes in East Asia, along with strong convergent uplift, abnormally high specific humidity, and high-water-vapor convergence centers, play crucial roles in supporting large-scale circulation systems and triggering mesoscale convective systems.
1. Introduction
Global climate warming is an undeniable reality and a significant environmental concern that has attracted the attention of governments and scientific researchers worldwide. Due to global warming, the water cycle has significantly changed, leading to significant increases in the intensity and frequency of extreme precipitation events, which have significantly impacted human society and economies. For example, from 2001 to 2020, the average annual population affected by floods exceeded 100 million people in China, resulting in a direct economic loss of CNY 167.86 billion [1]. In 2019, direct economic losses due to floods in Shandong, Sichuan, Jiangxi, Hunan, and Heilongjiang Provinces accounted for more than 65% of the total flood-related economic loss in China. Among these provinces, Shandong Province experienced a direct economic loss of CNY 30.8 billion, amounting to the greatest loss among 31 provinces (autonomous regions and municipalities) [2]. Therefore, studying the spatiotemporal changes and underlying causal mechanisms of extreme climate events has important scientific significance for formulating disaster prevention and reduction strategies.
The formation mechanism of extreme precipitation events has become a prominent topic of discussion and research among experts and scholars globally, and important research results have been obtained. The characterization of extreme precipitation changes primarily involves conducting original and unconstrained model simulations at global, continental, and subcontinental scales to project smaller future extreme precipitation events with reduced uncertainty [3]. Additionally, satellite-based extreme precipitation regression methods have been applied in Austria and three regions in the southeastern Mediterranean with varying climatic conditions, demonstrating the outcomes under different rain-gauge-density scenarios [4]. Furthermore, comparisons between the National Oceanic and Atmospheric Administration’s Precipitation Frequency Atlas of the United States (NOAA Atlas 14) and new precipitation records developed in the early 21st century are used to evaluate changes in extreme precipitation features spatially and quantitatively [5]. Additionally, the Multi-Source Weighted Ensemble Precipitation (MSWEP) dataset is used to compute the regression levels of extreme precipitation for various durations across the global domain [6]. This approach is designed to allow the quantitative analysis of the spatiotemporal patterns of extreme precipitation. The evolving nature of extreme precipitation has been examined using the extreme precipitation index [7,8,9,10,11,12,13], and various methods for modeling extreme precipitation changes have been assessed [14]. Furthermore, the spatiotemporal evolution of extreme precipitation has been investigated by developing an index system that considers both temporal and spatial dynamics [15,16,17]. Researchers have explored the distribution patterns of extreme climate events, including precipitation and temperature, and utilized geographical detector methods in conjunction with atmospheric circulation factors to identify potential drivers of these patterns [18]. The analysis of extreme precipitation events begins with conducting global climate model simulations to study the impacts of these events. Researchers use global climate models to understand how such events may change in the future [19,20,21,22]. Incorporating interannual climate variability as a time-varying covariate into nonstationary point process models using regional climate indices, such as the Caribbean Low-Level Jet (CLLJ) index, the Oceanic El Niño Index (ONI), the representative El Niño Southern Oscillation (ENSO), and the Atlantic Multidecadal Oscillation (AMO) index, can help characterize climate drivers of extreme precipitation in the Tempisque–Bebedero River Basin (TBRB), Costa Rica [23]. The complete geographical and temporal spectra of ERA-5 reanalysis data and extreme value theory are utilized to pinpoint areas where atmospheric moisture transport impacts daily extreme precipitation [24]. By employing a substantial ensemble of community earth system models and an optimal fingerprint method to distinguish the influences of various forcings on extreme precipitation (EP) in the Northeast Atlantic and sea surface temperatures (SSTs) in the North Atlantic during the period of 1929–2018, this study examines the influence of internal variability and external forcing (including anthropogenic and natural factors) on the growing significance of EP and SST [25]. This study focuses on the circulation background, influencing systems, physical quantity fields of extreme precipitation weather processes, and the backward trajectory characteristics of air parcels during precipitation events [26,27,28,29]. Different levels of extreme precipitation events are categorized into various types based on large-scale circulation patterns [30,31,32]. This research explores the connection between extreme precipitation events, atmospheric rivers (ARs), and moisture contribution [33,34,35,36,37], using a moisture trajectory model to identify the primary moisture source of precipitation. Additionally, coupled models are employed to compare findings with Phase 6 of the project (CMIP6) model, analyzing various aspects such as the detection and attribution of extreme precipitation events [38,39,40,41]. Current research on extreme precipitation changes and their causes primarily exhibits two key characteristics: (1) While global analysis has shed light on the changing characteristics of extreme precipitation events from various perspectives, there is a need for more in-depth study on the specific indices of these events, particularly focusing on spatial and temporal distribution as well as rain pattern characteristics. (2) Various methods such as global models, climate indices, circulation backgrounds, and physical fields have been used to analyze the driving mechanisms of extreme precipitation events, but there is still a lack of understanding regarding the differences between these mechanisms.
Therefore, the study presented in this article is based on hourly precipitation data from July to September for Shandong Province from 1971 to 2020. Typical (≥200 mm) extreme precipitation events were extracted, the spatiotemporal distribution and rain pattern characteristics of extreme precipitation events in Shandong Province were analyzed, and the formation mechanisms and differences between typical extreme precipitation events with different rain patterns were explored. The research results can provide a scientific basis for flood disaster prevention and water resource management in the region and offer a theoretical foundation for addressing global climate change.
2. Study Area, Data, and Methods
2.1. Study Area Overview
The geographical location of Shandong Province is 114°48′–122°42′E and 34°23′–38°17′N (Figure 1). It is located along the eastern coast of China and in the lower reaches of the Yellow River, adjacent to the Bohai Sea in the northeast and the Yellow Sea in the east and southeast. The onshore location of this area includes Hebei Province to the northwest, Henan Province to the west, and Anhui and Jiangsu Provinces to the south. The width of the area from east to west is approximately 721 km, while its length from north to south is approximately 437 km. This region’s total land area is 15.58 × 10⁴ km2, and its total sea area is 15.96 × 10⁴ km2. Additionally, the coastline measures 3024 km in length. Shandong Province, situated in the East Asian monsoon region, has a warm temperate monsoon climate. This area is heavily influenced by monsoons [42]. The rainy season in Shandong Province typically occurs from July to September, with extreme precipitation events being most common during this time.
2.2. Data Sources
The climate data for the research area are from the European Center for Medium-Range Weather Forecasting (ECMWF) and primarily consist of hourly ERA5 reanalysis data on precipitation, geopotential, the wind U component, the wind V component, divergence, vertical velocity, specific humidity, and water vapor flux divergence in Shandong Province from July to September from 1971 to 2020. The precipitation data have a horizontal resolution of 0.1° × 0.1°, while the other data have a horizontal resolution of 0.25° × 0.25°.
2.3. Method
2.3.1. Extraction of Extreme Precipitation Events
Extreme weather and climate events are commonly known as extreme events, and they are characterized by their infrequent occurrence or rarity within a specific area, as defined by their statistical distribution. Extreme precipitation events meet these criteria and have a significant impact on human society. Many methods utilize the percentile of a precipitation event sequence to establish a threshold for extreme precipitation. For instance, precipitation events that surpass the 95% or 99% percentile of a precipitation sequence are categorized as extreme precipitation. In China, extreme precipitation events are collectively referred to as rainstorms and usually refer to events in which the amount of precipitation exceeds 16 mm/hour and 30 mm for 12 consecutive hours or exceeds 50 mm for 24 consecutive hours (from 20:00 on the previous day to 20:00 on the present day, Beijing time) [43,44].
To extract the most significant extreme precipitation events in the study area over the last 50 years, the Chinese extreme precipitation algorithm was employed, building upon existing research [45,46]. Five criteria were then re-evaluated and established to select typical extreme precipitation events: (1) The precipitation duration is greater than or equal to 24 h. (2) The total precipitation amount of each precipitation event is greater than or equal to 200 mm. (3) During the entire precipitation process, the maximum daily precipitation exceeds 170 mm (in cases where the daily precipitation is less than 170 mm, more extreme precipitation events will be excluded). (4) The hourly precipitation in the interval between two precipitation events is less than 0.1 mm. (5) Excluding the maximum 1 h precipitation amount, the average hourly precipitation is greater than 1 mm (to agree with extreme precipitation events and avoid measuring prolonged bouts of light rain). Based on the above criteria, a total of 41 typical precipitation events were extracted in this study (Table 1). The selected extreme precipitation screening criteria in this study accurately identify the most significant precipitation events that contribute to flood disasters while effectively filtering out less-representative events, providing a scientific foundation for researching extreme precipitation events in Shandong Province.
2.3.2. Classification of Rain Patterns for Extreme Precipitation Events
According to the extreme precipitation screening criteria outlined in this article, a total of 41 typical extreme precipitation events were extracted. The precipitation data throughout the precipitation process were subjected to Ward’s hierarchical clustering analysis to perform cluster analysis and classify the data into different rain patterns for extreme precipitation events.
We divided each precipitation duration in m extreme precipitation events into equal parts and calculated the percentage x of precipitation in each extreme precipitation event period compared to the total precipitation. The m extreme precipitation events are represented as points in m rows and n columns, with each point having the coordinate x and clustered using the Euclidean distance L as the similarity index:
In the formula above, and represent the percentages of rainfall in the l-th period at points i and j, respectively, with respect to the total rainfall of the event, for i, j = 1, 2…, m and l = 1, 2…, n.
In Ward’s hierarchical clustering analysis method, m points are assumed to form a separate class. The Euclidean distance between two classes is calculated, and the two points with the smallest distance are clustered into a new class. This process continues until the number of classes is reduced to m−1, and the newly formed class is subsequently used to calculate the Euclidean distance (L) from other classes to this class. According to the principle of minimizing the sum of squares of the total intraclass deviations, clustering is iteratively performed until the data are finally clustered into one class. The calculation formula for the sum of the squared deviations, St, within a class is calculated as follows:
In the above equation, is the spatial coordinate of the j-th point in class t, and is the spatial coordinate of the center point in class t [47]. To enhance the accuracy of the cluster analysis and capture the precipitation characteristics of each rain pattern, we divided each of the 41 extreme precipitation events into an average of 15 periods; subsequently, these periods were considered to be a matrix with 41 rows and 15 columns. Ward’s hierarchical clustering analysis method was used for classification, and the extreme precipitation events that were selected were categorized into four distinct rainfall patterns.
2.3.3. Comparative Analysis of the Causes of Extreme Precipitation Events
- (1)
- Comparison of the average situation field, average dynamic field, and average water vapor field
To analyze the causes of extreme precipitation events, we selected representative events for each rain pattern and compared and analyzed the climate driving fields (the situation field, dynamic field, water vapor field, etc.) during the first hour of an extreme precipitation event and the average of the precipitation events.
- (2)
- Comparison of water vapor flux divergence
When calculating the water vapor flux, the single-layer water vapor transport flux Q can be obtained as follows:
where V is the magnitude of the wind speed; u and v are the latitudinal and meridional wind speed components, respectively, of each layer of the atmosphere; q is the specific humidity of each layer of the atmosphere; and g is gravitational acceleration.
The following formula is used for calculating the water vapor flux divergence D:
2.3.4. Other Methods
The Spearman correlation coefficient was used to examine the correlation between the total amount of precipitation and the duration of precipitation. The Mann–Kendall trend and mutation test methods were used to analyze the trend changes and mutations in the total precipitation duration, average rainfall intensity, and extreme rainfall intensity of typical extreme precipitation events in Shandong Province. The average rainfall intensity (total rainfall/rainfall duration) refers to the average hourly precipitation, while the extreme rainfall intensity refers to the maximum hourly precipitation during a heavy precipitation event at a given station [49].
3. Results and Analysis
3.1. Variation Characteristics of Typical Extreme Precipitation Events
3.1.1. Characteristics of the Changes in Total Precipitation
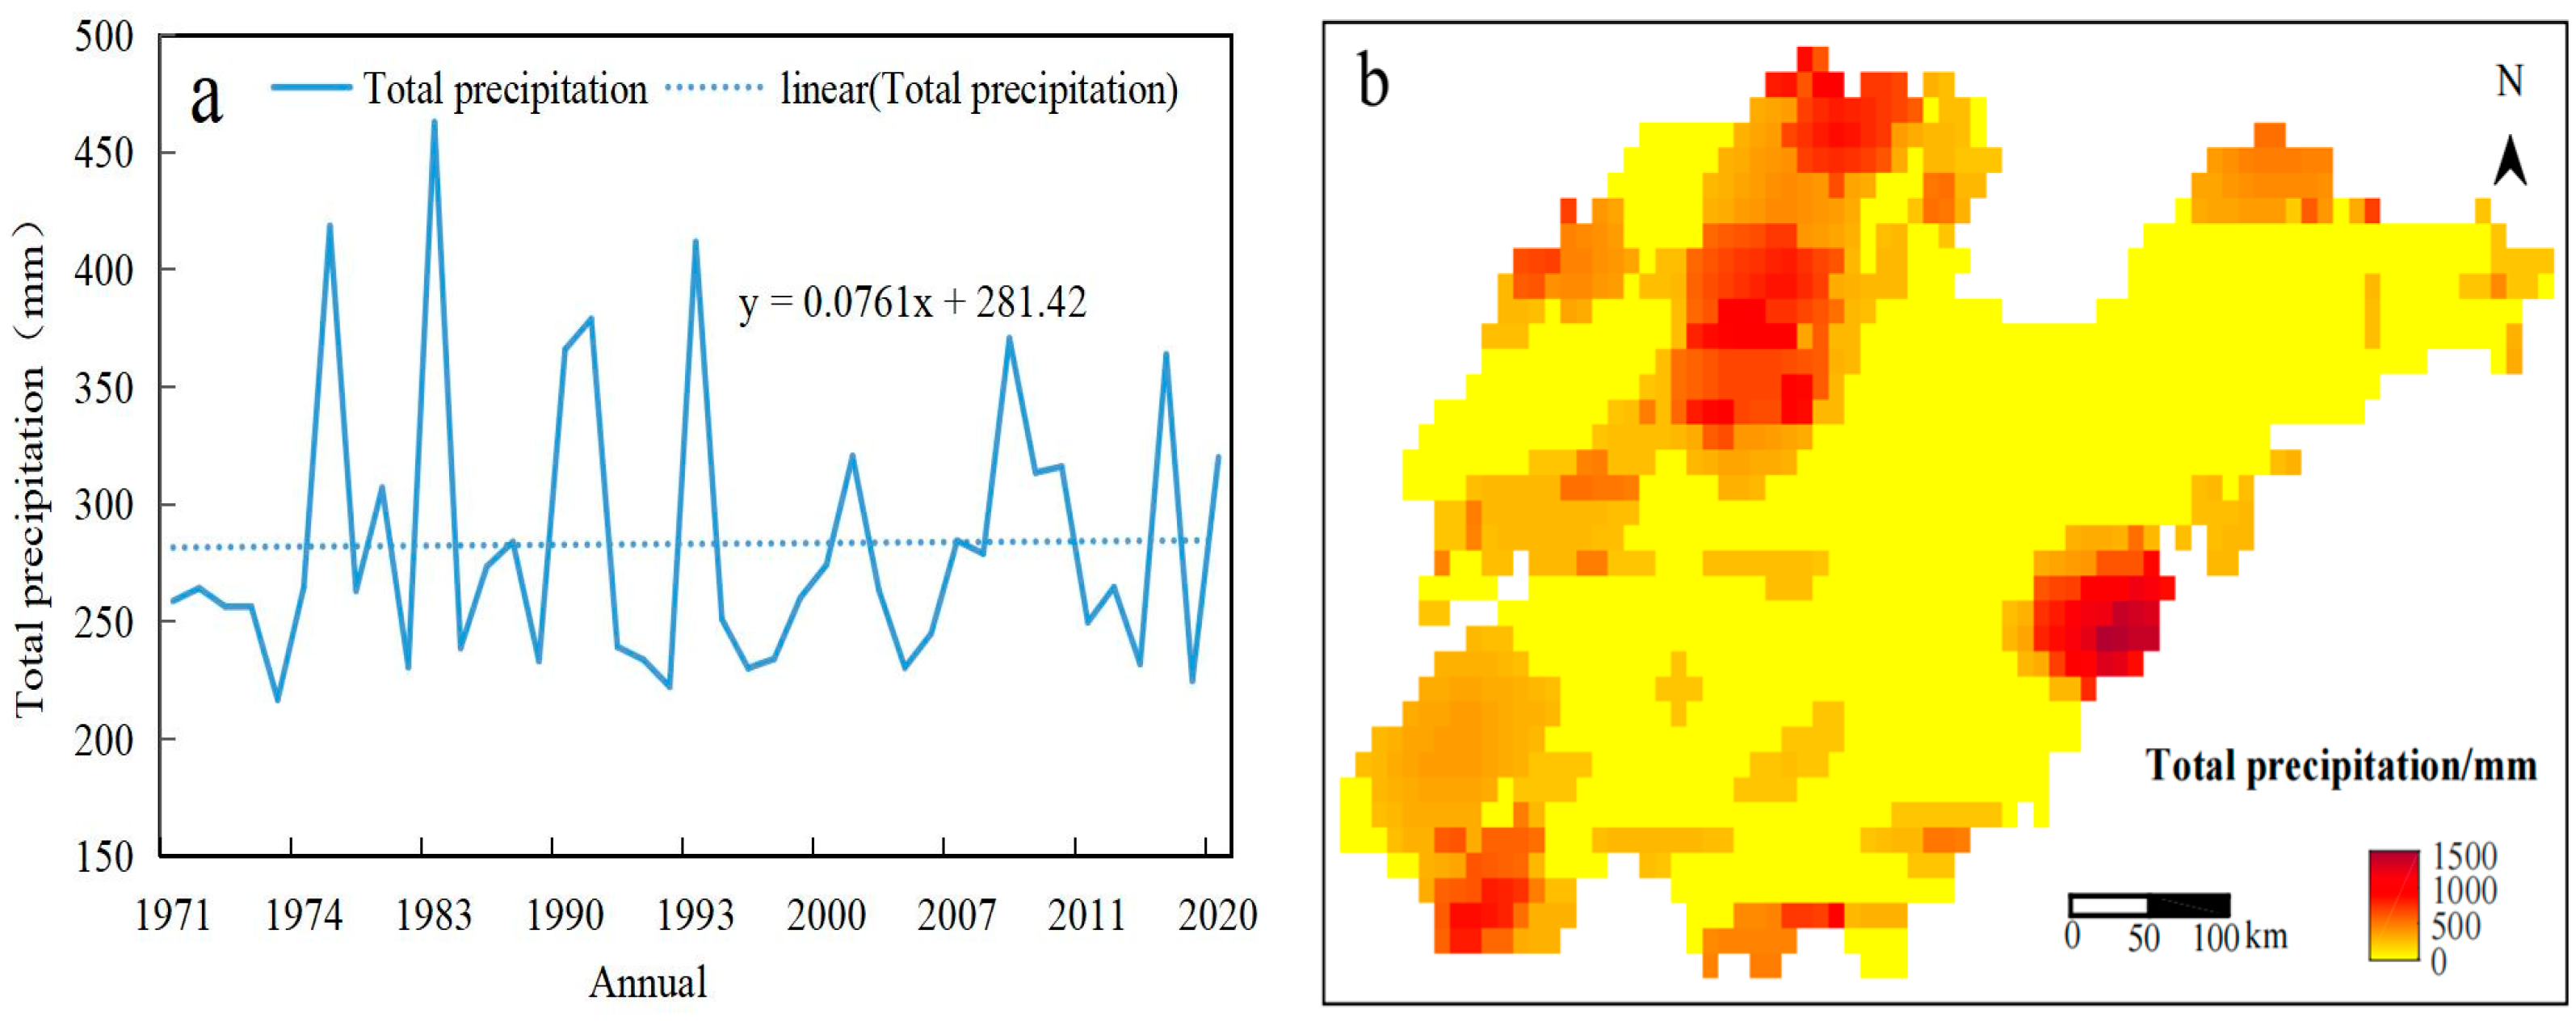
The total precipitation of typical extreme precipitation events in Shandong Province generally exhibited a nonsignificant upward trend (Figure 2a). The precipitation event that occurred on 18 July 1983, exhibited the highest total precipitation: 463 mm. The precipitation event that occurred on 30 August 1973, exhibited the lowest total precipitation: 217 mm. The difference between the two precipitation events was 246 mm. Following a thorough analysis of the differences, it was observed that there was a significant disparity in the total precipitation between each extreme precipitation event. The Mann–Kendall (MK) mutation analysis indicated that there was no clear mutation point in the total precipitation data over the study period. The spatial distribution of total extreme precipitation is primarily concentrated in the eastern coastal areas and in the northern, northwestern, and southwestern regions of Shandong (Figure 2b). However, there are relatively fewer occurrences of extreme precipitation in central Shandong. The total precipitation amount from extreme precipitation events was highest in Qingdao, exceeding 1500 mm, followed by Jinan, Binzhou, Heze, and other regions.
3.1.2. Characteristics of Precipitation Duration Variation
The duration of extreme precipitation events in Shandong Province generally exhibited a nonsignificant upward trend in precipitation (Figure 3a). The precipitation event that occurred on 18 July 1983, had the longest precipitation duration: 95 h. The extreme precipitation event that occurred on 29 July 1973, had the shortest precipitation duration: 28 h. The time gap between the two precipitation events was 67 h. Following a thorough analysis, there was a significant difference in the duration of precipitation between each extreme precipitation event. The MK mutation analysis revealed that there were no significant mutation points in the duration of precipitation throughout the study period. The correlation coefficient between total precipitation and precipitation duration after detrending was 0.71, which indicates a significant correlation at the 99% confidence level. This strong correlation suggests a positive relationship between the total precipitation and duration. The spatial distribution of the duration of extreme precipitation is similar to that of total precipitation (Figure 3b). The total duration of extreme precipitation events in Qingdao and Linyi exceeded 180 h, while the duration of extreme precipitation events in Jinan, Yantai, and Heze exceeded 150 h.
3.1.3. Characteristics of the Changes in the Average and Extreme Rainfall Intensities
The analysis of the average rainfall intensity and extreme rainfall intensity of typical extreme precipitation events in Shandong Province revealed: the average rainfall intensity (9.14 mm/h) was greatest for the precipitation event that occurred on 29 July 1973. The average rainfall intensity (3.96 mm/h) of the precipitation event that occurred on 29 July 2001 was the lowest. The difference between the two events was 5.18 mm/h (Figure 4a). Following a thorough analysis of this significant difference, there was a significant disparity in the average rainfall intensity between each extreme precipitation event. The analysis of average rainfall intensity during extreme precipitation events over the past 50 years reveals a marginal and statistically downward trend. Although the total amount of extreme precipitation has increased, the magnitude of the increase in precipitation duration is greater, resulting in a slight decrease in the average rainfall intensity. The spatial distribution of average rainfall intensity is primarily concentrated in the northern, northwestern, southwestern, and eastern coastal areas of Shandong, and the average rainfall intensity is less evenly distributed in central Shandong. The average rainfall intensity in the Dongying, Dezhou, and Heze areas is above 9 mm/h, with Qingdao and other areas having similar values (Figure 4b).
The highest extreme rainfall intensity (30.09 mm/h) was associated with the precipitation event that occurred on 3 August 1993. The extreme rainfall intensity (8.62 mm/h) of the precipitation event that occurred on 30 August 1973 was the lowest. The difference between the two events was 21.47 mm/h (Figure 4a). Following a thorough analysis of this significant difference, it was observed that there was a significant disparity in the extreme rainfall intensity between each extreme precipitation event. According to the MK trend analysis, the extreme rainfall intensity of typical extreme precipitation events has been relatively stable over the past 50 years. The spatial distribution of the extreme rainfall intensity mainly includes northwestern Shandong Province and other regions, with the extreme rain intensity in Dezhou and Jinan exceeding 30 mm/h (Figure 4c). The intensities of the extreme precipitation events that occurred on 29 July 1973 and 3 August 1993 were relatively high, while the intensities of the extreme precipitation events that occurred on 29 July 2001 and 30 August 1973 were relatively low.
3.1.4. Start Time Characteristics
The start time of extreme precipitation events in Shandong Province shows two peak periods (Figure 5a). The highest frequency of precipitation events occurred at 2:00 and 17:00, with six and four occurrences, respectively. The frequency of precipitation events was lowest at 0:00, 1:00, 11:00, 19:00, 20:00, and 22:00, while the distribution of precipitation events was relatively uniform at other times. The distribution frequency of extreme precipitation events was greater during the day than at night. This difference can be attributed to the higher temperatures during the day, which lead to increased evaporation and a greater amount of water vapor rising in the lower levels of the atmosphere; additionally, the water vapor condenses and forms precipitation [50]. The spatial distribution of extreme precipitation events occurring from 0:00 to 5:00 was relatively uniform. Precipitation events occurring from 6:00 to 11:00 and 18:00 to 23:00 were mainly distributed in the northern, northwestern, and southwestern regions of Shandong, while precipitation events occurring from 12:00 to 17:00 were mainly distributed in the southwestern, southern, and eastern coastal areas of Shandong (Figure 5c). Based on the topographic characteristics of Shandong Province, the southwestern, southern, and eastern coastal areas are characterized by plains, low mountains, and hilly terrain, respectively. These features enable summer monsoon penetration into the area, which brings an abundant amount of water vapor, and the temperature tends to increase in the afternoon, resulting in strong convective movements and frequent occurrences of extreme precipitation events. On the other hand, the northern and northwestern parts of Shandong Province, which are shielded by the central Shandong mountainous area, are less influenced by the summer monsoon; thus, extreme precipitation is more likely to occur during the morning and night in these areas [50].
The peak period of the start time (i.e., the rainstorm start time) of extreme precipitation events wherein the precipitation exceeds 30 mm for 12 consecutive hours occurred from 17:00 to 19:00 and accounted for 34% of the total frequency of typical extreme precipitation events. The occurrence frequency of precipitation events was the lowest at 0:00, 8:00, 14:00, and 23:00, while the distributions at other times were relatively uniform (Figure 5b). Rainstorm start times typically occur in the afternoon and at night according to an analysis of the air flow characteristics. In the afternoon, as the ground temperature increases, the air layer near the surface becomes unstable, and air in the atmosphere rises, generating thermal convection. This upward movement of air in the atmosphere causes moist air to encounter colder temperatures, resulting in rainfall formation [50]. Extreme precipitation events with rainstorm start times ranging from 0:00 to 5:00 are mainly distributed in the northern, northwestern, and other regions of Shandong Province. Precipitation events with start times ranging from 6:00 to 11:00 and 12:00 to 17:00 are mainly distributed in the western, southwestern, southern, and eastern coastal regions of Shandong Province. The regional distribution of precipitation events with start times ranging from 18:00 to 23:00 was relatively uniform (Figure 5d). Considering the latitude, sea and land locations, topography, and atmospheric circulation characteristics of Shandong Province, it could be gleaned that the western, southwestern, and southern parts of Shandong Province, as well as the eastern coastal areas, are characterized by plains, low mountains, and hilly terrains. These geographical features contribute to the process of evapotranspiration in the region. In addition, the southwestern, southern, and eastern coastal areas of Shandong Province receive abundant amounts of water vapor from the summer monsoon, which creates favorable conditions for rainstorms to occur. Another factor is the influence of weather systems. During the day, when the temperature is high, water vapor evaporates rapidly, leading to active convection movement and the occurrence of intense precipitation events. The mountainous areas in central Shandong Province prevent the summer monsoon from penetrating deeply into the northern and northwestern areas of Shandong Province. As a result, extreme precipitation occurs mostly at night [50].
3.1.5. Spatial Distribution of the Extreme Precipitation Frequency
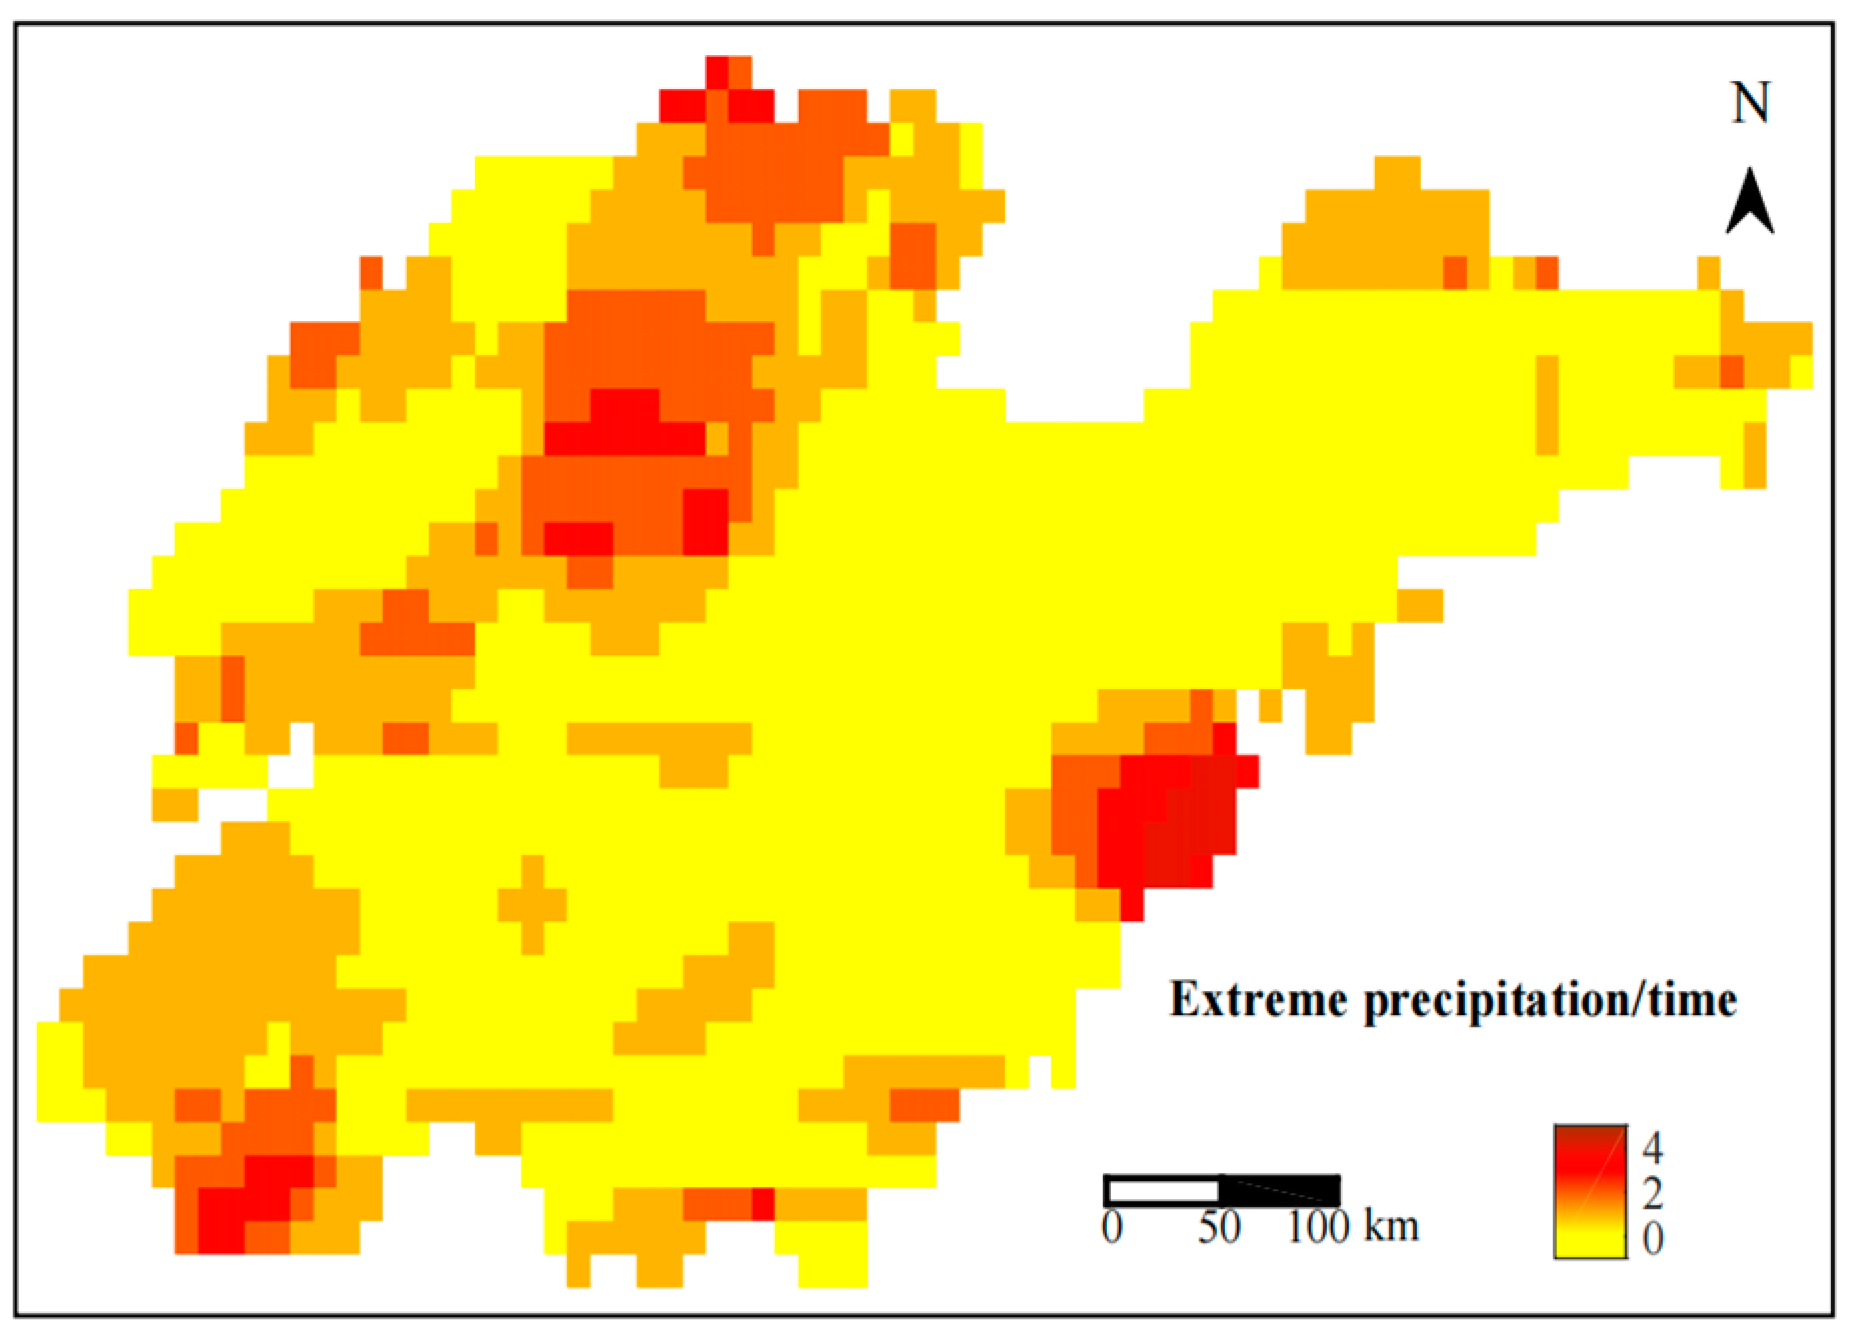
The spatial distribution of extreme precipitation events can indicate the overall distribution of heavy precipitation in Shandong Province. These extreme precipitation events are mainly distributed in areas such as the eastern coast and western Shandong Province. However, these events occur less frequently in central Shandong Province (Figure 6). The extreme precipitation events in Qingdao, Jinan, Binzhou, and Heze account for 32% of the total extreme precipitation events. Central Shandong Province is characterized by a large mountainous area and rugged terrain. Due to its topography, the summer monsoon cannot easily penetrate deep into the interior, resulting in low water vapor content; thus, extreme precipitation events occur less frequently in central Shandong Province.
3.2. Extreme Precipitation Characteristics of Different Rainfall Patterns
3.2.1. Rain Pattern Classification and Its Characteristics
By employing Ward’s hierarchical cluster analysis, extreme precipitation events can be categorized into four distinct types of rain patterns (Figure 7): I (factory shape), II (square-root shape), III (wave shape), and IV (spoon-shaped buckle). The pattern I precipitation process exhibits two rain peaks: the primary rain peak occurs after the secondary rain peak, when the precipitation during the primary rain peak exceeds 10 mm, while the secondary rain peak corresponds to a smaller amount of precipitation and is characterized by a shape resembling a “factory”. The pattern II precipitation process also exhibited two rain peaks, and the precipitation amounts of these peaks were equal and had a shape resembling a “square root”. The pattern III precipitation process exhibits multiple rain peaks that are evenly distributed and shaped like a “wave”. The pattern IV precipitation process exhibits a peak in precipitation, which occurs during the first half of the precipitation period. The precipitation intensity at this peak exceeds 14 mm. In the second half of precipitation, the amount of precipitation decreases, forming a shape resembling a “spoon-shaped buckle”. Rain pattern I accounts for the largest proportion (46%), followed by rain pattern II (29%), and rain pattern III accounts for 17%, while rain pattern IV accounts for the smallest proportion (7%). Rain patterns I, II, and III exhibit multiple rain peaks, and the primary peak of precipitation for rain patterns I and III is generally lower than that of rain patterns II and IV. Additionally, the duration of precipitation for rain patterns I and II is shorter than that for rain patterns III and IV [47].
The changing characteristics of each precipitation event in Shandong Province were analyzed by examining the characteristic values of the different rain patterns of the extreme precipitation events (Table 2).
Pattern I. By analyzing the characteristic values of extreme precipitation events for different rain patterns, we found that rain pattern I has the lowest values among the four rain patterns: maximum precipitation amount (319.89 mm), range (89.86 mm), average (254.77 mm), standard deviation (22.16 mm), and coefficient of variation (0.09). This pattern of rainfall is mainly concentrated in the later period, and there is a slight difference in the changes in the various precipitation events.
Pattern II. This pattern’s minimum total precipitation (216.64 mm) is the lowest among the four rain patterns. Its standard deviation (54.31 mm) is similar to that of rain pattern IV but is greater than that of rain pattern I. Additionally, its coefficient of variation (0.20) is greater than that of rain patterns I and IV. This rain pattern exhibits a sharp decrease after a high peak in the early stage and a sharp increase in rainfall in the later stage, with significant differences in the changes in the various precipitation events.
Pattern III. Among the four rain patterns, the maximum (462.68 mm), range (198.14 mm), average (354.23 mm), standard deviation (72.75 mm), and coefficient of variation (0.21) of the total precipitation are the highest for this pattern. This rain pattern exhibits different peaks during different periods, resembling a wave, with significant variations in the different precipitation events.
Pattern IV. This pattern’s minimum value of total precipitation (313.38 mm) is the highest among the four rain patterns. Its coefficient of variation is 0.16, which is higher than that of rain pattern I. Importantly, this rain pattern exhibits only one peak period, which occurs during the early stage of rainfall.
There are some variations in the characteristic values of the different precipitation events. Among the four rain patterns, pattern III had the highest values for the maximum, range, average, standard deviation, and coefficient of variation, indicating the largest variation difference. In contrast, rain pattern I exhibited the lowest values for the maximum, range, average, standard deviation, and coefficient of variation among the four rain patterns, indicating the smallest change difference. The difference between rain pattern II and rain pattern IV lies between these two patterns.
3.2.2. Spatial Distribution of the Different Rain Patterns
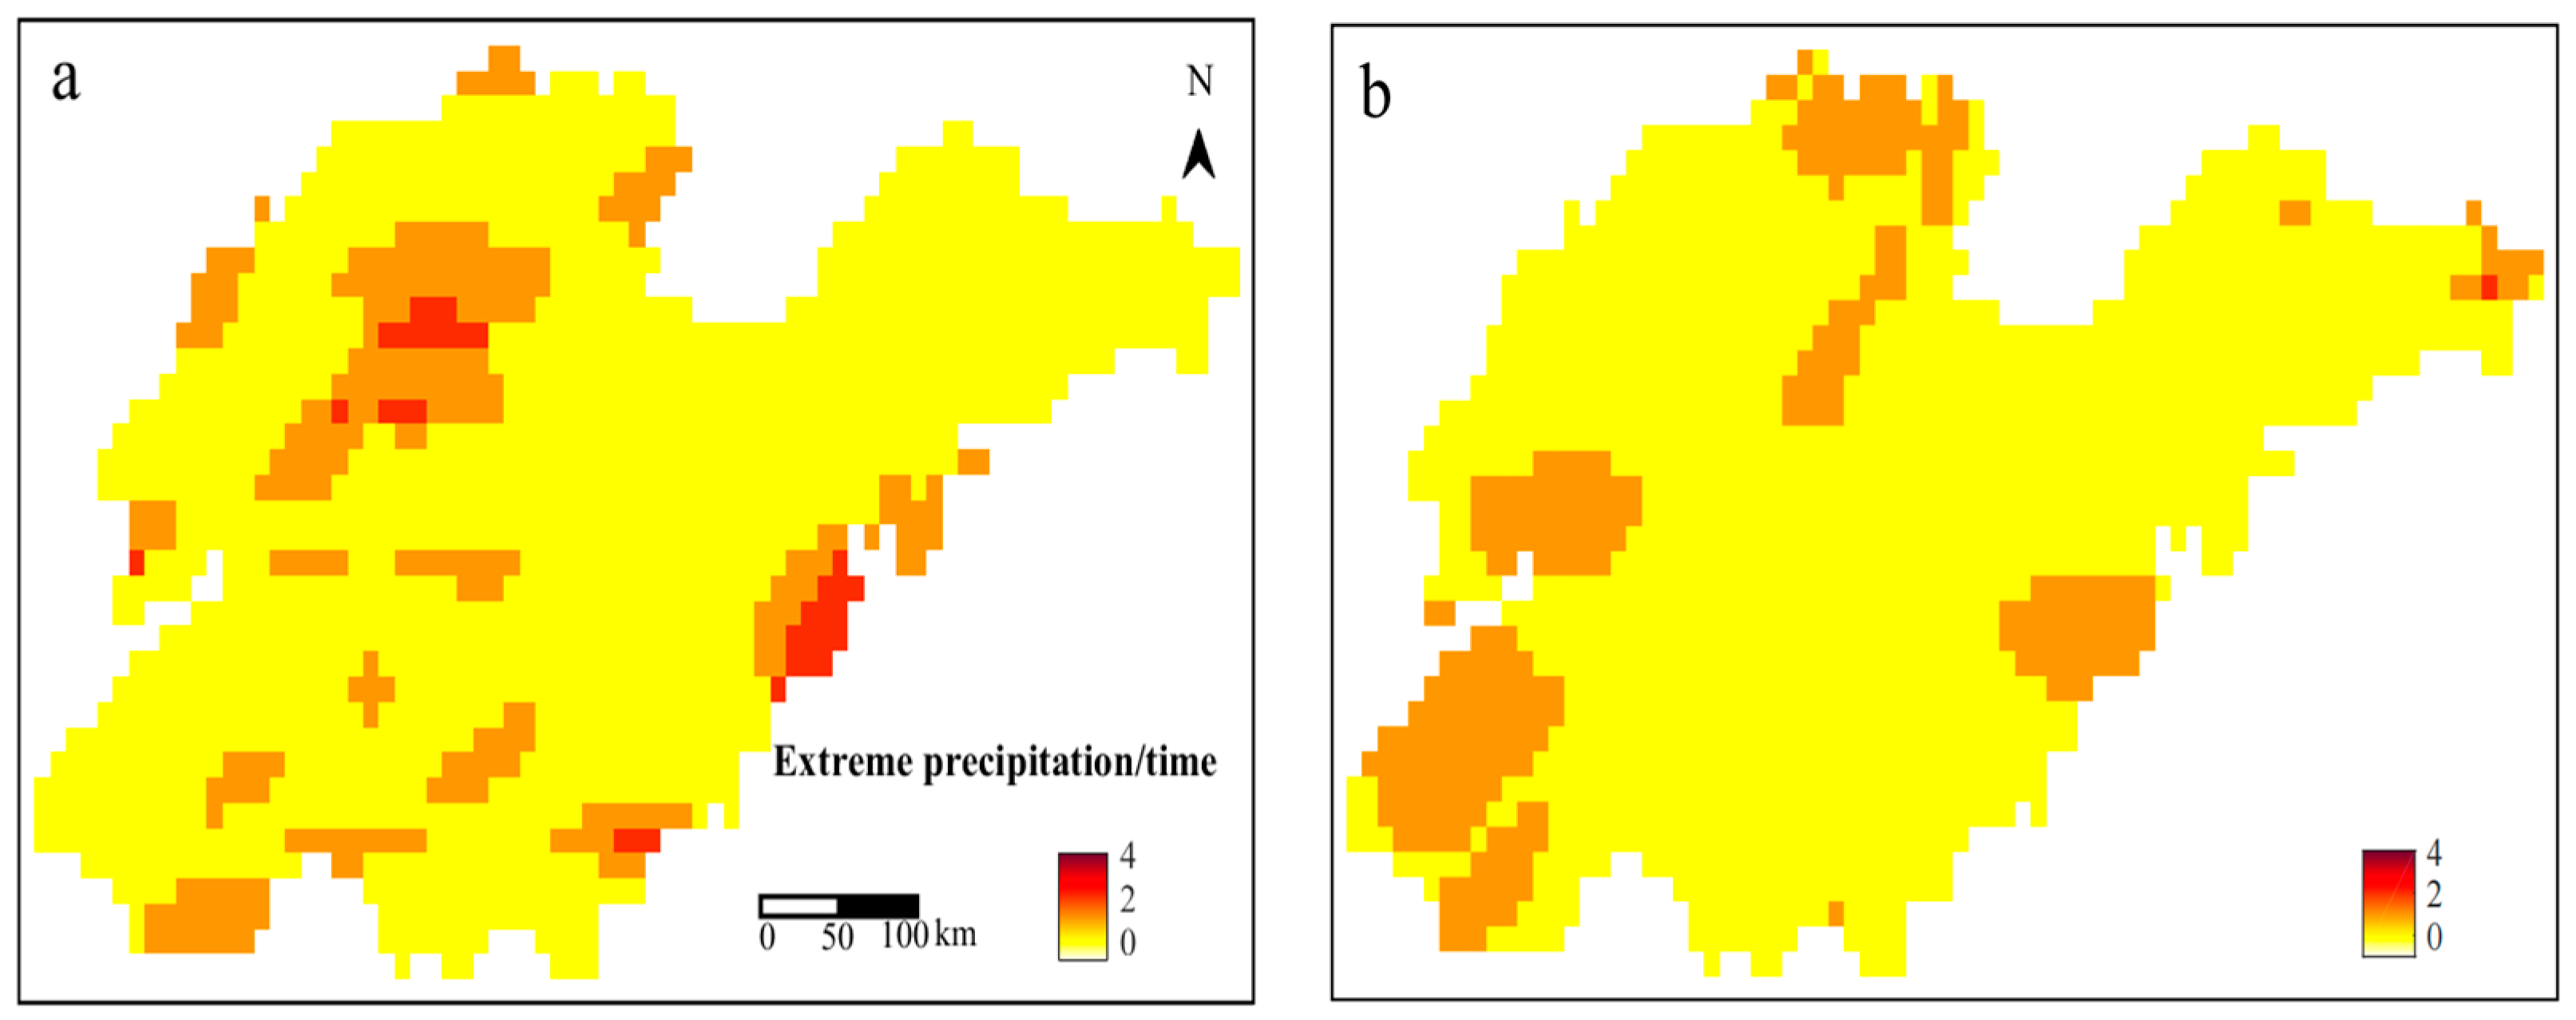
The spatial distribution of the different rain patterns of extreme precipitation events provides insight into the overall impact of each rain pattern on Shandong Province (Figure 8). Rain pattern I is primarily distributed in Qingdao, Jinan, Linyi, and Heze, accounting for 36% of this rainfall pattern; rain pattern II is predominantly found in Binzhou, Dongying, Liaocheng, Jinan, Heze, Weihai, and Qingdao, with a frequency of up to two times that in the Weihai area; rain pattern III is mainly distributed in Binzhou, Jinan, Heze, Linyi, Zaozhuang, Qingdao, and Yantai, with a frequency of up to two times that in the Linyi area; and rain pattern IV is largely distributed in Dezhou, Yantai, and Weihai.
3.2.3. Analysis of the Occurrence Times of the Different Rainfall Patterns
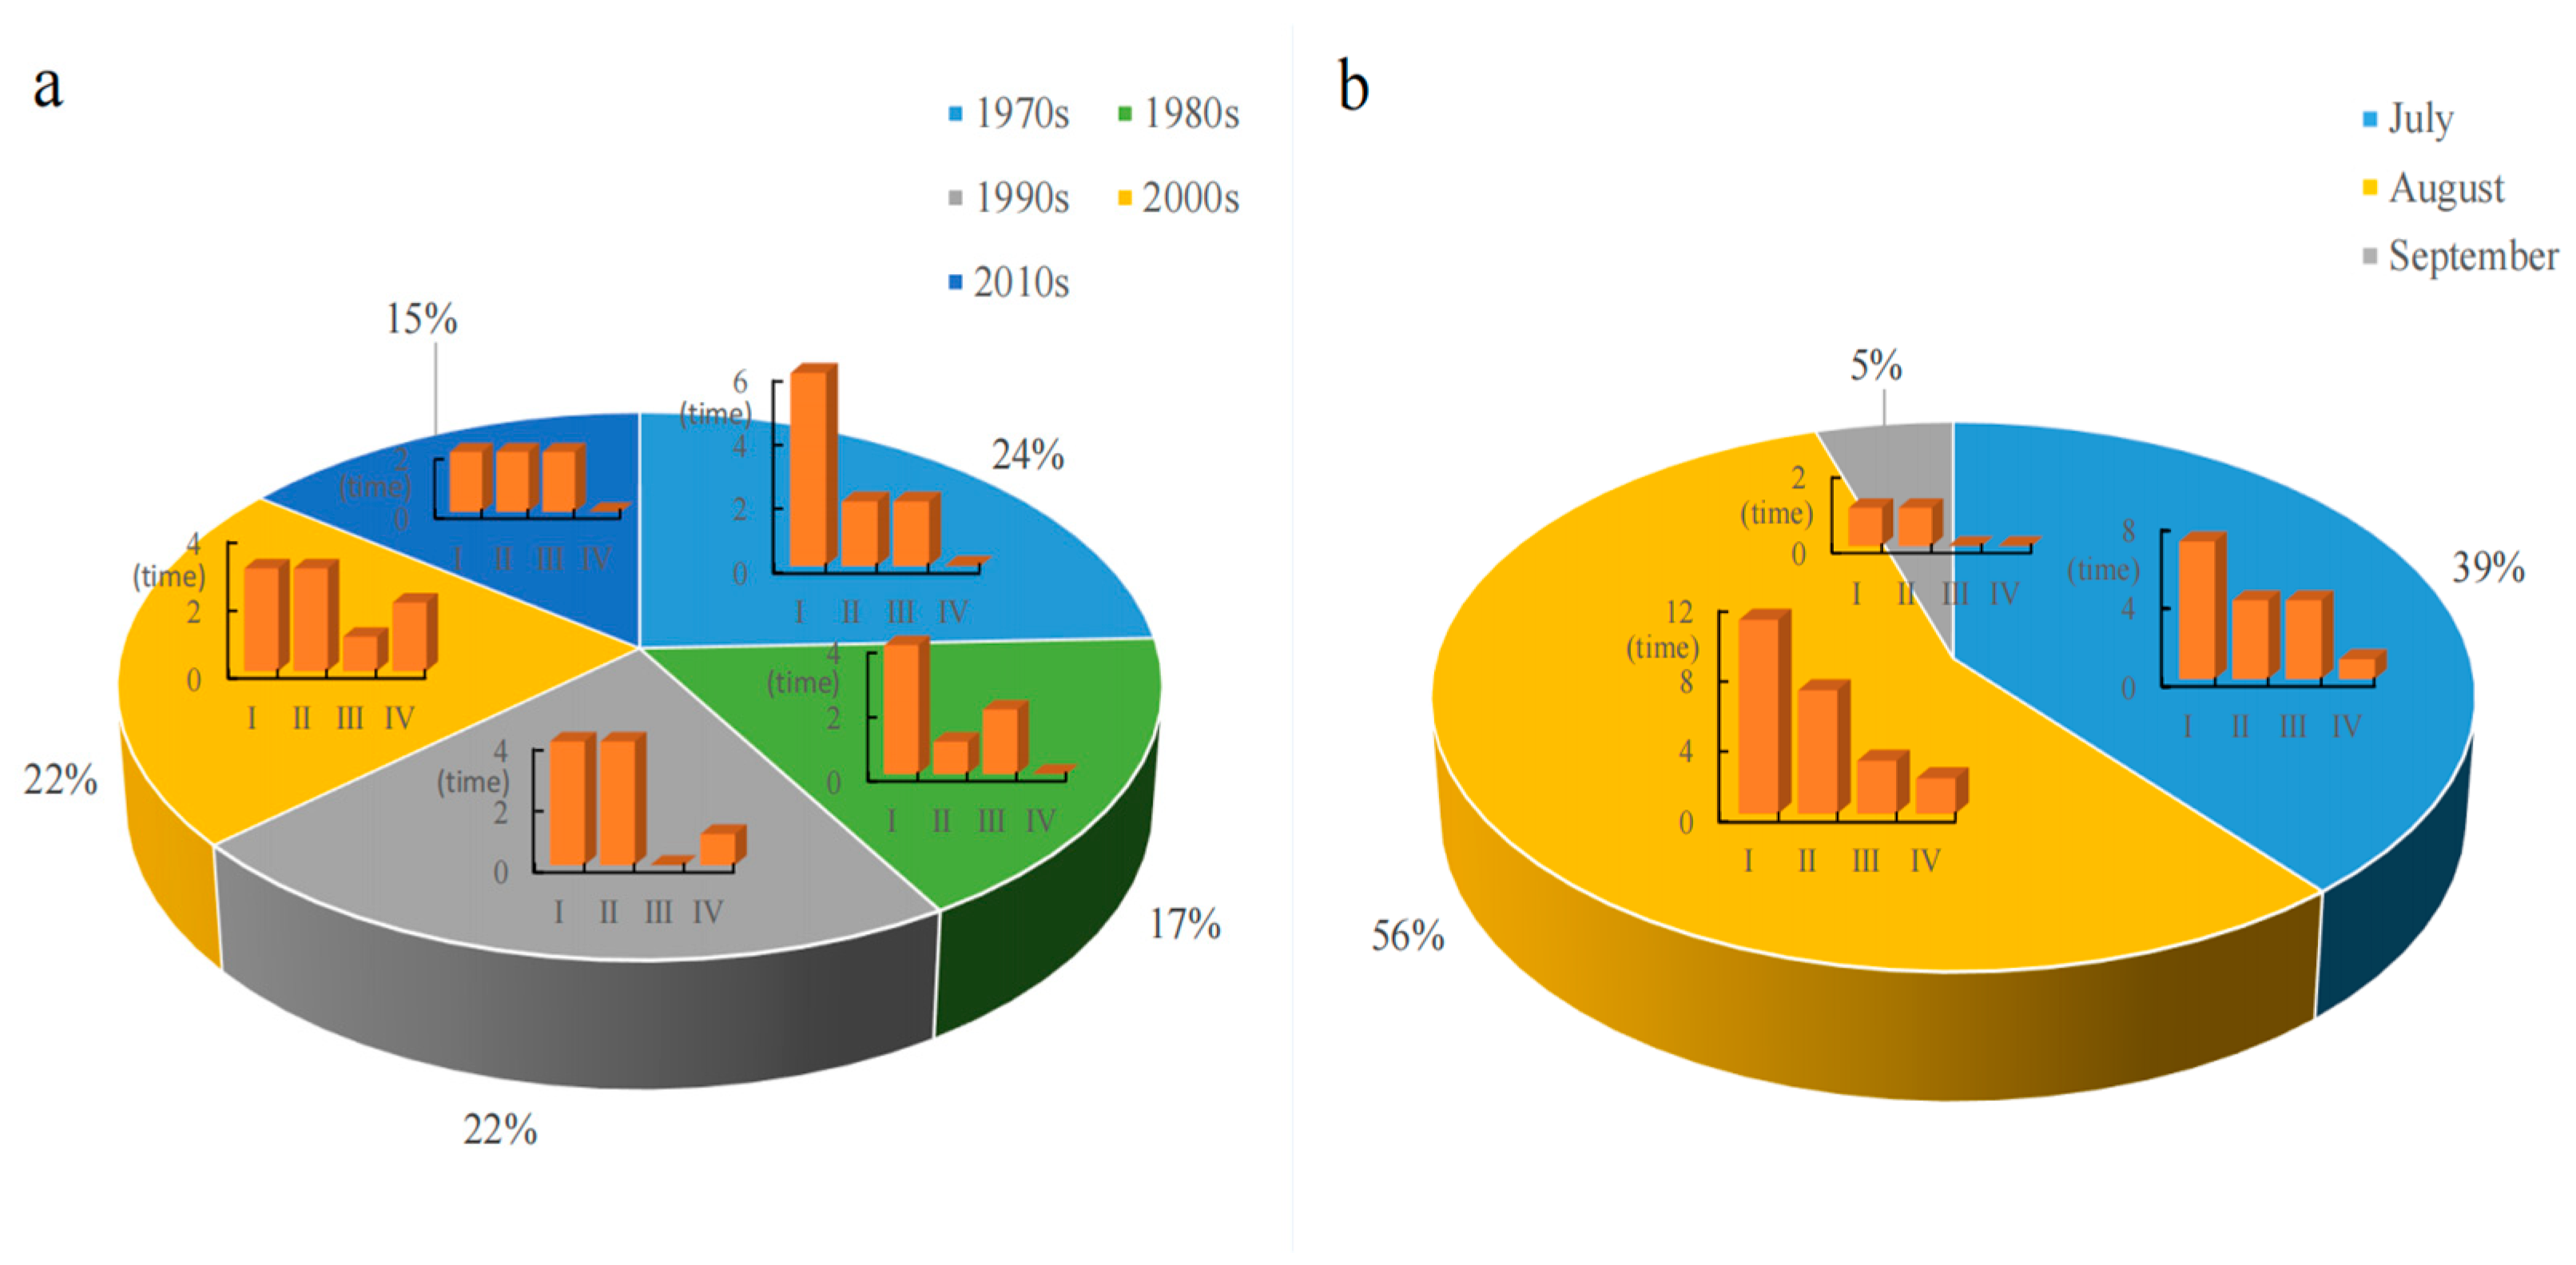
The occurrence times of extreme precipitation events vary among the different rain patterns. The frequency of extreme precipitation is influenced by factors such as monsoons and sea temperature anomalies. The summer monsoon in the tropical ocean supplies water vapor for precipitation in Shandong Province, while the northwest monsoon in the subarctic zone contributes to precipitation in this region. El Niño/La Niña events are phenomena resulting from abnormal increases in sea surface temperatures in the Eastern and Central Pacific, along with large-scale air–sea interactions. These events manifest as cold-phase La Niña events and warm-phase El Niño events, both of which can impact precipitation in Shandong Province [51]. The largest number of precipitation events occurred in the 1970s (24%), the smallest number occurred in the 2010s (15%), and the remaining years exhibited similar numbers; extreme precipitation events in the rainy season are predominantly observed in July and August, accounting for 56% and 39% of the events, respectively, while September accounts for only 5%. Years and months with more extreme precipitation are significantly influenced by the summer monsoon, while SST anomalies are not readily apparent. Conversely, years and months with less extreme precipitation are less impacted by the summer monsoon but exhibit noticeable SST anomalies. The greatest diversity of rainfall patterns occurred in the 2000s. Rain pattern I was mainly observed in the 1970s-1990s, appearing 4–6 times. Rain pattern II mainly occurred in the 1990s–2000s, appearing 3–4 times. Rain pattern III did not appear in the 1990s and had a relatively even occurrence of 1–2 times. Rain pattern IV occurred 1–2 times in the 1990s–2000s but not in other years (Figure 9a). The precipitation patterns are most prominent in July and August, with all four rain patterns being present, while only rain patterns I and II appear in September (Figure 9b). Years and months with higher levels of rainfall are significantly influenced by the summer monsoon and northwest monsoon. Sea temperature anomalies do not appear to have a clear impact, leading to more frequent occurrences of precipitation events with varying rain patterns.
3.3. Analysis of the Causes of Typical Extreme Precipitation Events
The occurrence of typical extreme precipitation events in Shandong Province is influenced by a variety of factors. These mesoscale phenomena are caused by the interaction of multiple weather systems at different scales [52]. In this article, we examine the impacts of various factors, such as geopotential height, the wind U component, the wind V component, divergence, vertical velocity, specific humidity, and water vapor flux divergence, on different rain patterns considering weather dynamics. The formation mechanisms of different rain patterns are analyzed by considering the large-scale circulation background and mesoscale circulation conditions.
3.3.1. Comparative Analysis of the Average Situation Fields of the Different Rain Patterns against the Background of Large-Scale Circulation
Based on the large-scale circulation background, the mid-level height field and low-level wind field [31] can be used to effectively illustrate the circulation characteristics of various rain patterns during extreme precipitation events in Shandong Province. To characterize the average situation field conditions [26] in Shandong Province, an analysis was conducted on the average physical quantities of the geopotential height and the U and V components of wind (Figure 10).
Pattern I (southwest low-pressure cyclone–Western Pacific subtropical high-pressure anticyclone–mid-latitude cyclone). In the 500 hPa height field, the South China Sea was identified as a low-pressure center, while the Western Pacific subtropical region was identified as a high-pressure center. Corresponding to the 850 hPa wind field, there is distinct cyclonic circulation in the South China Sea, anticyclonic circulation in the Western Pacific subtropical region, and a cyclone at mid-latitudes in Northeastern China. This results in the formation of a strong double-blocking circulation [41], with evident blocking patterns developing and persisting at middle and low latitudes in East Asia [53]. The formation and maintenance of the blocking high pressure and cutoff low pressure disrupt normal westerly circulation, preventing upstream fluctuations from propagating downstream and blocking the movement of cyclones and anticyclones on the ground; this circulation event is referred to as a blocking situation. There are two main types of circulation transport. The first is influenced by the subtropical high pressure in the Western Pacific, and the airflow moves northward along the high-pressure ridge from the southwestern side. The second is the convergence of the cross-equatorial airflow originating from the South China Sea low-pressure trough near 105°E in the southern part of the Bay of Bengal, with the southeastern airflow traveling through the South China Sea toward the north; these two airflows meet and are transported northward together. Furthermore, it is also influenced by the presence of mild mid-latitude cyclones in Northeastern China, which form large-scale circulation conditions for extreme precipitation events (Figure 10a).
Pattern II (low-pressure trough–tropical cyclone (typhoon type)–Western Pacific subtropical high pressure–anticyclone). The 500 hPa height field across Shandong Province exhibits a low-pressure trough, while the Western Pacific subtropical region is characterized by a high-pressure center. The 850 hPa wind field across Shandong Province exhibits tropical cyclonic circulation, while the Western Pacific subtropical area displays anticyclonic circulation; this pattern is reminiscent of double-blocking circulation [41]. This circulation occurs as a result of the southeastern airflow from the southwestern side of the Western Pacific subtropical high, which combines with the southeastern airflow from the Bay of Bengal and the South China Sea; then, this combined airflow moves northward, creating circulation conditions (Figure 10b).
Pattern III (due-south cyclone–Western Pacific subtropical high pressure–northeast low-pressure shallow trough–cyclone–mid-latitude anticyclone). In the 500 hPa height field, the Western Pacific subtropical area is characterized by a high-pressure center, while at mid-latitudes in Northeastern China there are low-pressure shallow troughs. In relation to the 850 hPa wind field, cyclonic circulation occurs in southern Shandong Province and at mid-latitudes in Northeastern China, and anticyclonic circulation occurs at mid-latitudes in Mongolia. These types of circulation are less notably affected by the subtropical high pressure in the Western Pacific; they occur as a result of the southeastern airflow passing through the Bay of Bengal and the South China Sea and intersecting with the northeastern cyclonic airflow moving southward along the northeastern low-pressure shallow trough (Figure 10c).
Pattern IV (southwest low-pressure trough–cyclone–northeast low-pressure cyclone–mid-latitude cyclone). In the 500 hPa height field, there is a low-pressure trough located in southwestern Shandong Province and a low-pressure center in Northeastern China along the west coast of the Pacific Ocean. The 850 hPa wind fields in southwestern Shandong Province, Northeastern China, and at mid-latitudes in Mongolia all exhibit cyclonic circulations. These circulations are influenced by cutoff low pressure, resulting in the formation of a single-block circulation pattern [31]. This circulation is primarily caused by the southwestern airflow flowing through the Bay of Bengal and being transported northward through the southwestern low-pressure trough (Figure 10d).
There are significant differences in the circulation configurations of the different rain patterns. Patterns I and II are both characterized by double-blocking circulation, with pattern I exhibiting a stronger blocking effect, while pattern IV is single-blocking circulation. As a result, patterns I and II both exhibit two rain peaks, with the main rain peak in pattern I generally being lower than that of pattern II; pattern IV exhibits only a single rain peak. Patterns I, II, and III are influenced by the Western Pacific subtropical high; although pattern III is comparatively less affected by it, all three patterns exhibit multiple rain peaks. The East Asia region, including Shandong Province, has four major circulation pathways [53] that contribute to the availability of abundant water vapor conditions for extreme precipitation. The circulation routes of patterns I and II are identical and occur due to the southeastern airflow on the southwest side of the Western Pacific subtropical high. This airflow intersects the southeastern airflow moving through the Bay of Bengal and the South China Sea, resulting in continuous northward transport. Pattern III forms when the southeastern airflow passes through the Bay of Bengal and the South China Sea converges with the northeastern cyclonic airflow moving southward along the northeastern low-pressure shallow trough. Pattern IV mainly originates from the southwestern airflow that passes through the Bay of Bengal and is subsequently carried northward along the southwest low-pressure trough. Therefore, the durations of the precipitation of patterns I and II are shorter than those of precipitation for patterns III and IV. The strong blocking situation [53] and significant circulation transport at middle and low latitudes in East Asia create the conditions necessary to support large-scale circulation systems.
3.3.2. Comparative Analysis of the Average Dynamic Fields of the Different Rain Patterns in Mesoscale Convective Systems
The convergence and uplift mechanism of extreme precipitation centers play crucial roles in initiating mesoscale convective systems. To characterize the dynamic field conditions [26] in Shandong Province, an analysis was conducted on the average physical quantities of the average divergence and vertical velocity at various pressure levels. These pressure levels include 100 hPa, 200 hPa, 500 hPa, 700 hPa, 850 hPa, and 925 hPa (Figure 11, three representative pressure levels were selected for six pressure levels).
Pattern I. Over extreme precipitation areas, the divergence field exhibits a maximum divergence center at 500 hPa, with a central value of 5 × 10⁻⁶ s−1; a maximum convergence center occurs at 700 hPa, with a center value of −6 × 10⁻⁶ s−1; and the maximum upward movement center near the 700 hPa vertical field has an intensity of 4 Pa·s−1. The concepts of low-level convergence and high-level divergence are relatively weak. The overall movement tends to be weak upward [54], and the movement centers are mainly distributed across areas such as Dongying and Jining (Figure 11a1,b1,c1).
Pattern II. The divergence field exhibits a maximum divergence center at 200 hPa, with a central value of 10 × 10−6 s−1; a maximum convergence center occurs at 925 hPa, with a center value of −13 × 10−6 s−1; and the maximum upward movement center near the 700 hPa vertical field has an intensity of 7 Pa·s−1. The structures of low-level convergence and high-level divergence are conducive to the formation and development of upward movement. The movement centers are mainly distributed across Qingdao, Weifang, and Rizhao (Figure 11a2,b2,c2).
Pattern III. The divergence field exhibits a maximum divergence center at 500 hPa, with a central value of 6 × 10⁻⁶ s−1; a maximum convergence center is apparent at 700 hPa, with a center value of −9 × 10⁻⁶ s−1; and the maximum upward movement center near the 850 hPa vertical field has an intensity of 4 Pa·s−1. The rising movement centers are primarily distributed across areas such as Zaozhuang (Figure 11a3,b3,c3).
Pattern IV. The divergence field exhibits a maximum divergence center at 200 hPa, with a central value of 19 × 10−6 s−1; a maximum convergence center is apparent at 925 hPa, with a center value of −11 × 10−6 s−1; and the maximum upward movement center near the 850 hPa vertical field has an intensity of 6 Pa·s−1. Over areas experiencing extreme precipitation, there is more high-level divergence than low-level convergence, and the establishment of suction mechanisms is conducive to the maintenance of upward motion [54]. The movement centers are mainly distributed across Linyi (Figure 11a4,b4,c4).
The dynamic field conditions of the different rain patterns exhibit certain similarities and differences. The maximum divergence centers of patterns I and III are lower than those of patterns II and IV, while the maximum convergence centers are higher for patterns II and IV. Patterns I and III exhibit weak rising movements, whereas patterns II and IV show relatively powerful rising movements. Therefore, the main rainfall peaks in patterns I and III are generally lower than those in patterns II and IV. The maximum rising motion centers of patterns I and II are greater than those of patterns III and IV; thus, the main rain peaks in patterns I and II are both observed in the second half of the precipitation period. The four rain patterns exhibit a rising structure characterized by low-level convergence and high-level divergence. The high-level divergence of pattern IV is stronger than the low-level convergence, creating a suction mechanism that supports upward motion. Pattern IV experiences only one peak in rainfall during the first half of the process. Strong convergent uplift not only promotes the formation and development of upward motion but also has a significant impact on triggering mesoscale convective systems.
3.3.3. Comparative Analysis of the Average Water Vapor Fields of the Different Rain Patterns in Mesoscale Convective Systems
The supply of water vapor in extreme precipitation centers is abundant, creating favorable conditions for mesoscale convective systems. To characterize the water vapor field conditions [26] in Shandong Province, an analysis was conducted on the average physical quantities of the specific humidity and water vapor flux divergence at various pressure levels. These pressure levels include 100 hPa, 200 hPa, 500 hPa, 700 hPa, 850 hPa, and 925 hPa (Figure 12, three representative pressure levels are selected for six pressure levels).
Pattern I. Over the extreme precipitation areas, in the specific humidity field, the local specific humidity center at 925 hPa reaches 16 g·kg−1. For the water vapor flux divergence field at 700 hPa, the precipitation center is situated within the region of water vapor convergence, with an intensity of −2 × 10⁻⁸ g·cm−2·hpa−1·s−1, while the water vapor convergence intensity is relatively weak. The water vapor centers are located mainly in Qingdao, Jinan, and Dezhou (Figure 12a1,b1,c1).
Pattern II. The center of extreme precipitation is situated in an area characterized by high specific humidity and strong water vapor convergence. There is a high-specific-humidity center near the 925 hPa specific humidity field, with a center value of 17 g·kg−1; the 700 hPa water vapor flux divergence field exhibits a significant center of strong water vapor convergence, with an intensity of −12 × 10−8 g·cm−2·hpa−1·s−1, which indicates a robust intensity of water vapor convergence. A significantly high specific humidity and strong water vapor convergence center provide favorable water vapor conditions for extreme precipitation. The water vapor centers are located mainly in Qingdao, Heze, and Linyi (Figure 12a2,b2,c2).
Pattern III. The center of extreme precipitation is located at the center of the specific humidity and water vapor convergence zone. There is a high-specific-humidity center near the 925 hPa specific humidity field, with a center value of 17 g·kg−1. There is a high-water vapor convergence center near the 700 hPa water vapor flux divergence field, with an intensity of −4 × 10⁻⁸ g·cm−2·hpa−1·s−1. The centers are located mainly in areas such as Zaozhuang and Heze (Figure 12a3,b3,c3).
Pattern IV. In the specific humidity field, the high-specific humidity center is near the 925 hPa horizontal distribution area, with a center value of 18 g·kg−1. In the divergence field of the water vapor flux, the highest water vapor convergence center is located in the horizontal distribution area at 700 hPa, with an intensity of −10 × 10−8 g·cm−2·hpa−1·s−1. An abnormally high specific humidity promotes the occurrence of extreme precipitation events (Figure 12a4,b4,c4).
The water vapor fields of the different rain patterns also exhibited some differences. The four rain patterns exhibit a gradual decrease in humidity as the altitude increases from low to high. The centers of high specific humidity are consistently found near the 925 hPa horizontal distribution area, with values above 16 g·kg−1. Pattern I has the lowest specific humidity intensity, while pattern IV has the highest intensity. The water vapor flux convergence of the four rain patterns from 200 hPa to 100 hPa is nearly zero. The intensity of water vapor convergence at 700 hPa, 850 hPa, and 925 hPa is strong in the middle and lower layers, and the strong centers of water vapor convergence are all located in the horizontal distribution area at 700 hPa. Rain pattern I exhibits the smallest convergence intensity, while rain pattern II exhibits the maximum water vapor convergence intensity. Based on the specific humidity intensity and water vapor convergence intensity of the four rain patterns, rain pattern I has the smallest main rain peak rainfall, while rain patterns II and IV have the largest main rain peak rainfall. Abnormally high specific humidity and strong water vapor convergence centers supply water vapor for extreme precipitation and create the conditions necessary for the development of mesoscale convective systems.
4. Conclusions and Discussion
Analyzing hourly precipitation data from July to September in Shandong Province between 1971 and 2020, this study examines the characteristics of the most common extreme precipitation events over the past five decades. The findings show a gradual increase in total rainfall and duration, alongside a slight decrease in rainfall intensity. These events are predominantly concentrated in the eastern coastal areas and in northern, northwest, and southwestern Shandong, occurring less frequently in central Shandong. The typical extreme precipitation events are primarily located in the eastern coastal and western regions. The distribution frequency of the start time of extreme precipitation events shows greater occurrence during the daytime than at night. In regions such as southwestern Shandong, southern Shandong, and eastern coastal areas, extreme precipitation is more likely to happen in the afternoon, while it occurs more frequently in the morning and night in northern Shandong and northwest Shandong. Heavy rains tend to start in the afternoon and at night. Specifically, extreme precipitation in western Shandong, southwestern Shandong, southern Shandong, and eastern coastal areas is more common during the day, whereas it predominantly occurs at night in northern Shandong and northwest Shandong. By analyzing the extreme precipitation index, this study investigates the spatiotemporal distribution characteristics and changes in extreme precipitation events in Shandong Province. The findings align with existing research, but there is room for improvement in the standard for extracting typical extreme precipitation events. The analyzed index is relatively simple, and a more comprehensive analysis of the changing characteristics of extreme precipitation events is recommended. Further exploration is needed to delve deeper into the conclusions.
Cluster analysis was utilized to classify extreme precipitation events into four rain patterns. The results revealed that rain patterns I, II, and III exhibit multiple rain peaks, while rain pattern IV has a single rain peak. The main rainfall peak of rain patterns I and III generally has lower intensity compared to the peaks of rain patterns II and IV. Additionally, the precipitation duration of patterns I and II is shorter than that of patterns III and IV. This classification method can more accurately cluster the entire precipitation process, thereby analyzing the characteristics of precipitation processes of different rain patterns, reducing tedious human work. However, there are various approaches to classifying rain patterns, and different methods can be applied from multiple perspectives in classification research.
Extreme precipitation events result from interactions between large-scale circulation configurations and mesoscale convective systems. The causes of extreme precipitation events with varying rain patterns are examined by considering the large-scale circulation background and mesoscale convective systems and how they relate to the characteristics of the precipitation process. In the context of large-scale circulation, double-block circulation results in two rain peaks, while single-block circulation leads to one rain peak. The presence of a Western Pacific subtropical high-pressure system can induce multiple rain peaks during the precipitation process, with circulation transport influencing the duration of precipitation events. The intensity of the ascending motion in mesoscale convective systems plays a crucial role in determining the amount of rainfall at the peak of a rain event. The vertical height of the maximum ascending motion influences the location of the primary rain peak. Additionally, the intensity of specific humidity and water vapor convergence also contribute to the overall rainfall amount at the rain peak. This article examines the causal mechanisms and contrasts the variations among various patterns of rain precipitation events. The findings contribute to enhancing the forecasting of extreme precipitation events and future climate predictions in Shandong Province while also addressing the challenges posed by global climate warming. A comparative analysis was conducted on various weather dynamic factors to examine the driving mechanisms of extreme precipitation events, considering both the large-scale circulation background and mesoscale convective systems. Further research is needed to understand how each dynamic factor responds to climate warming, particularly in relation to large-scale circulation. Understanding the correlation between the background and mesoscale convective systems is crucial for improving climate prediction and addressing meteorological disaster challenges.
Author Contributions
Conceptualization, B.L.; Data curation, J.L. and M.M.; Formal analysis, J.L.; Funding acquisition, B.L.; Investigation, J.L. and M.M.; Methodology, J.L.; Project administration, B.L.; Resources, B.L.; Software, J.L.; Supervision, B.L. and M.M.; Validation, J.L.; Writing—original draft, J.L.; Writing—review and editing, B.L. All authors have read and agreed to the published version of the manuscript.
Funding
This research was funded by the Shandong Provincial Natural Science Foundation (ZR2021YQ28) and the Taishan Scholars Project of Shandong Province (tsqn202306182).
Data Availability Statement
No new data were created or analyzed in this study. Data sharing is not applicable to this article.
Conflicts of Interest
The authors declare no conflict of interest.
References
- Li, Y.; Zhao, S.S. Floods losses and hazards in china from 2001 to 2020. Clim. Chang. Res. 2022, 18, 154–165. [Google Scholar]
- Qiu, C.; Liu, H.B.; Wan, C.C.; Zhao, L.N.; Wen, J.H. Tempo-spatial variation and cause analysis of rainstorms and related flood disasters in Shandong from 1984 to 2019. J. Catastrophol. 2022, 37, 57–63. [Google Scholar]
- Yuan, X.; Yang, K.; Sun, J.; Wang, Y.; He, Y.Y.; Zou, M.J.; Jiang, Y.Z. Why was Pakistan extreme precipitation stronger in 2022 than in 2010? Adv. Clim. Chang. Res. 2023, 14, 913–920. [Google Scholar]
- Siena, M.; Levizzani, V.; Marra, F. A method to derive satellite-based extreme precipitation return levels in poorly gauged areas. J. Hydrol. 2023, 626, 130295. [Google Scholar] [CrossRef]
- Kim, J.; Amodeo, M.; Kearns, E.J. Atlas of probabilistic extreme precipitation based on the early 21st century records in the United States. J. Hydrol. Reg. Stud. 2023, 48, 101480. [Google Scholar] [CrossRef]
- Gründemann, G.J.; Zorzetto, E.; Beck, H.E.; Schleiss, M.; van de Giesen, N.; Marani, M.; van der Ent, R.J. Extreme precipitation return levels for multiple durations on a global scale. J. Hydrol. 2023, 621, 129558. [Google Scholar] [CrossRef]
- Rojpratak, S.; Supharatid, S. Regional extreme precipitation index: Evaluations and projections from the multi-model ensemble CMIP5 over Thailand. Weather Clim. Extrem. 2022, 37, 100475. [Google Scholar] [CrossRef]
- Regmi, S.; Bookhagen, B. The spatial pattern of extreme precipitation from 40 years of gaugedatain the central Himalaya. Weather Clim. Extrem. 2022, 37, 100470. [Google Scholar] [CrossRef]
- Yanagisawa, H.; Touge, Y.; Kazama, S. Spatial frequency analysis of annual extreme daily precipitati on across Japan. J. Hydrol. Reg. Stud. 2022, 42, 101131. [Google Scholar] [CrossRef]
- Miao, S.L.; Cao, Y.P.; Li, Q.Q. Spationtemporal distribution of extreme climate events in the yellow river basin during 1951–2019. J. Henan Univ. (Nat. Sci. Ed.) 2022, 52, 416–429. [Google Scholar]
- Bai, D.Y.; Cao, L.; Zhang, Y. Temporal and spatial distribution of extreme precipitation in Qinghai Province in recent 60 years. Yangtze River 2022, 53, 59–64. [Google Scholar]
- Li, S.; Chen, X.Y.; Gong, W.T.; Shen, Z.Y.; Zhu, W.L. Characteristics of precipitation extremes in three gorges reservoir intervening basin during 1961–2020. Resour. Environ. Yangtze Basin 2022, 31, 2166–2175. [Google Scholar]
- Sun, G.K.; Ma, L.; Wang, X.C.; Huang, R.; Wang, L.; Du, T.; Mo, C.X. Spatial distribution characteristic and recurrence period analysis of extreme precipitation in Guangxi. Water Resour. Power 2022, 40, 931. [Google Scholar]
- VishnuPriya, M.S.; Agilan, V. Evaluation of change factor methods in downscaling extreme precipitationover India. J. Hydrol. 2022, 614, 128531. [Google Scholar] [CrossRef]
- Jiao, Y.F.; Liu, J.; Li, C.Z.; Zhang, X.J.; Yu, F.L.; Cui, Y.J. Spatial and temporal trends of extreme temperature and precipitation in the Daqing River Basin, North China. Theor. Appl. Climatol. 2021, 147, 627–650. [Google Scholar] [CrossRef]
- Shang, S.W.; Wang, L.Z.; Wang, Y.T.; Deng, P.X.; Gai, Y.W.; Jie, S.Q. Analysis of spatial and temporal evolution characteristics of extreme precipitation in Chendu area from 1960 to 2019. Water Resour. Prot. 2023, 39, 195–204. [Google Scholar]
- Cheng, P.; Yang, M.; Sun, H.Y.; Zhang, Y.; Xiao, G.L.; Zhu, X.L.; Zhu, X.L. Study on the return period of extreme precipitation in Liaoning Province based onthe compound extreme Value Model. Torrential Rain Disasters 2023, 42, 662–670. [Google Scholar]
- Zhang, Y.H.; Liang, K.; Liu, C.M.; Lv, J.X.; Bai, P. Spatio-temporal distribution characteristics and possible causes of extreme climatein the Niyang River Basin. Geogr. Res. 2022, 41, 2808–2820. [Google Scholar]
- Yang, H.; Liu, M.; Wang, M.; Qin, P.C.; Fang, S.D. Projections of extreme precipitation in the middle and upper Yangtze River at 1.5 °C and 2 °C warming thresholds based on bias correction. Theor. Appl. Climatol. 2022, 147, 1589–1600. [Google Scholar] [CrossRef]
- Khodayar, S.; Pastor, F.; Valiente, J.A.; Benetó, P.; Ehmele, F. What causes a heavy precipitation period to become extreme? The exceptional October of 2018 in the western Mediterranean. Weather Clim. Extrem. 2022, 38, 100493. [Google Scholar] [CrossRef]
- Blanchet, J.; Blanc, A.; Creutin, J.-D. Explaining recent trends in extreme precipitation in the southwestern alps by changes in atmospheric influences. Weather Clim. Extrem. 2021, 33, 100356. [Google Scholar]
- Patricola, C.M.; Wehner, M.F.; Bercos-Hickey, E.; Maciel, F.V.; May, C.; Mak, M.; Yip, O.; Roche, A.M.; Leal, S. Future changes in extreme precipitation over the San Francisco Bay Area: Dependence on atmospheric river and extratropical cyclone events. Weather Clim. Extrem. 2022, 36, 100440. [Google Scholar] [CrossRef]
- Huguenin, C.N.; Serafin, K.A.; Waylen, P.R. A spatio-temporal analysis of the role of climatic driversinfluencing extreme precipitation events in a Costa Rican basin. Weather Clim. Extrem. 2023, 42, 100602. [Google Scholar] [CrossRef]
- Gimeno-Sotelo, L.; Gimeno, L. Where does the link between atmospheric moisture transport and extreme precipitation matter? Weather Clim. Extrem. 2023, 39, 100536. [Google Scholar]
- Huang, H.; Patricola, C.M.; Winter, J.M.; Osterberg, E.C.; Mankin, J.S. Rise in Northeast US extreme precipitation caused by Atlantic variability and climate change. Weather Clim. Extrem. 2021, 33, 100351. [Google Scholar] [CrossRef]
- Xiao, Y.; Nurshati; Ma, B.H.; Li, H.H.; Ma, Z.Y. Analysis on causes of extreme precipitation events in the Yuan river Basin. J. Mar. Meteorol. 2022, 42, 77–87. [Google Scholar]
- Zhang, J.G.; Wang, J.; Wu, T.; Zhou, J.L.; Zhong, M.; Wang, S.S.; Huang, X.Y.; Li, S.J.; Han, F.R.; Wang, X.C. Weather system types of extreme precipitation in the middle reaches of the Yangtze river. Torre-Ntial Rain Disasters 2018, 37, 14–23. [Google Scholar]
- Xiang, S.Q.; Zhou, M.; Xu, Y.Q.; Du, J.S. The characteristics of typhoon “Lekima” and the of extreme rainfall. Mar. Forecast. 2020, 37, 76–85. [Google Scholar]
- Hu, S.Q.; Xi, R.T.; Li, N.; Ran, L.K.; Chang, Y.Z. Comparative analysis of two extreme rainstorms in the Arid Area of western south Xinjiang. Chin. J. Atmos. Sci. 2022, 46, 1177–1197. (In Chinese) [Google Scholar]
- Xu, J.; Li, R.M.; Zhang, Q.H.; Chen, Y.; Liang, X.D.; Gu, X. Extreme large-scale atmospheric circulation associated with the “21·7” Henan flood. Sci. China Earth Sci. 2022, 52, 1873–1886. [Google Scholar] [CrossRef]
- Zhang, L.; Xiong, K.G.; Zhou, Y. Characteristics and Circulation Classification of Extreme Daily Precipitation Events in Hubei Province During Summer. Resour. Environ. Yangtze Basin 2022, 31, 1393–1401. [Google Scholar]
- Chang, J.; Wang, J.; Wu, L.; Shi, H.B.; Zhu, L.L. Characteristics of the synoptic conditions of summer extreme heavy precipitation in the Yellow River Basin. Torrential Rain Disasters 2022, 41, 536–543. [Google Scholar]
- Michel, C.; Sorteberg, A.; Eckhardt, S.; Weijenborg, C.; Stohl, A.; Cassiani, M. Characterization of the atmospheric environmentduring extremeprecipitation events associated with atmospheric rivers in Norway-Seasonal and regional aspect. Weather Clim. Extrem. 2021, 34, 100370. [Google Scholar] [CrossRef]
- Gimeno-Sotelo, L.; Gimeno, L. Concurrent extreme events of atmospheric moisture transport and continental precipitation:The role of land falling atmospheric rivers. Atmos. Res. 2022, 278, 106356. [Google Scholar] [CrossRef]
- Barton, Y.; Rivoire, P.; Koh, J.; Muhabashir, A.S.; Kopp, J.; Martius, O. On the temporal clustering of European extreme precipitation events and it relationship to persistent and transient large-scale atmospheric drivers. Weather Clim. Extrem. 2022, 38, 100518. [Google Scholar] [CrossRef]
- Liu, Z.; Gao, T.; Zhang, W.; Luo, M. Implications of the Pacific meridional mode for summer precipitation extremes over China. Weather Clim. Extrem. 2021, 33, 100359. [Google Scholar] [CrossRef]
- Nan, Y.T.; Sun, J.Q.; Zhang, M.Q.; Hong, H.X.; Yuan, J. Strengthened influence of the East Asian trough on springextreme precipitation variability over eastern Southwest China after the late 1980s. Atmos. Ocean. Sci. Lett. 2022, 15, 100191. [Google Scholar] [CrossRef]
- Zuo, Q.T.; Song, Y.X.; Wang, H.J.; Li, J.L.; Han, C.H. Spatial variations of extreme precipitation events and attribution analysis in the main water resource area of the Belt and Road Initiative. Theor. Appl. Climatol. 2021, 144, 535–554. [Google Scholar] [CrossRef]
- Yang, H.W.; Gong, Z.Q.; Wang, X.; Feng, G.L. Analysis of the characteristics and causes of interdecadal changes in the Summer Extreme Precipitation over eastern China. Chin. J. Atmos. Sci. 2021, 45, 683–696. [Google Scholar]
- Qin, H.; Yuan, W.; Wang, J.; Chen, Y.; Dai, P.X.; Sobel Adam, H.; Meng, Z.Y.; Nei, J. Climate change attribution of the 2021 Henan extreme precipitation: Impacts of convective organization. Sci. China Earth Sci. 2022, 65, 1837–1846. [Google Scholar] [CrossRef]
- Dong, T.Y.; Zhu, X.; Deng, R.; Ma, Y.L.; Dong, W.J. Detection and attribution of extreme precipitation events over the Asian monsoon region. Weather Clim. Extrem. 2022, 38, 100497. [Google Scholar] [CrossRef]
- Yang, X.B. Multi-Scale Integrated Analysis of Extreme Heavy Rain in Shandong in Spring of 2009; Lanzhou University: Lanzhou, China, 2010; pp. 1–53. [Google Scholar]
- Kong, F.; Shi, P.J.; Fang, J.; Lu, L.L.; Fang, J.Y.; Guo, J.P. Advances and prospects of spatiotemporal pattern variation of extreme precipitation and its affecting factors under the background of global climate change. J. Catastrophol. 2017, 32, 165–173. [Google Scholar]
- Hu, Q.; Yue, D.P.; Zhao, J.B.; Ma, A.H. Characteristics and disasters of rainstorms in GansuProvince in recent50 years. Bull. Soil Water Conserv. 2019, 39, 68–75. [Google Scholar]
- Guo, Z.; Zhang, X.; Zhao, Y.; Liu, J. Study on regional design storm in urban area: A case of Wuhan city. Water Wastewater Eng. 2022, 48, 78–83. [Google Scholar]
- He, S.; Zhao, W.; Wang, D.G.; Liao, W.L.; Wu, X.S.; Lai, C.G. Spatiotemporal variability of event-based rainstorm: The perspective ofrainfallpattern and concentration. R. Meteorol. Soc. 2022, 42, 6258–6276. [Google Scholar] [CrossRef]
- Hu, R.; Wang, S.Y.; Wang, P.F. Research on rainstorm pattern of short duration based on cluster analysis. Water Resour. Power 2021, 39, 8–10. [Google Scholar]
- Liu, J.; Guan, Z.Y.; Gong, Z.B.; Chen, Y.D. Characteristics and causes of extreme precipitation events over Fujian province during May and June in recent three decades. J. Meteorol. Sci. 2016, 36, 28–35. [Google Scholar]
- Yuan, J.; Peng, Y.; Li, C.; Gu, P.S. Analysis on characteristics of heavy precipitation in Nantong region. Resour. Environ. Sci. 2021, 9, 197–200. [Google Scholar]
- Yang, F.; Zhou, Y.; Luo, L.Y.; Miao, X.Y.; Ma, M.H.; Liu, R.H. Analysis of spatiotemporal distribution characteristics of rainfall in Guangdong Province. China Flood Drought Manag. 2023, 33, 46–51, 82. [Google Scholar]
- Wang, X.J.; Liu, Y.; Song, L.J. Correlation between Climate Change and El Nino/La Nina Events in Shandong Province. Beijing Surveying and Mapping. Beijing Surv. Mapp. 2021, 35, 712–716. [Google Scholar]
- Song, G.Y.; Li, X.Z.; Jiang, J.; Xun, X.Y.; Chen, L.; Ma, S.Y. Procession and causes of the extreme rainstorm event in Inner Mongolia in July 2012. Plateau Meteorol. 2015, 34, 163–172. [Google Scholar]
- Wei, F.Y.; Chen, G.J.; Li, Q. Differences of oceanic and atmospheric circulation featureamong the rainfall-band patterns insummer in eastern China. Acta Meteorol. Sin. 2012, 70, 1004–1020. [Google Scholar]
- Hu, Y.P.; Guo, H.Q.; Wu, W.; Shan, T.L. Analysis of the Mesoscale Characteristics of an extreme short-time heavy rainfall in Shaying River Basin. Meteorol. Environ. Sci. 2021, 44, 63–71. [Google Scholar]
Figure 1.
Geographical location map of Shandong Province.

Figure 2.
Typical extreme precipitation total amount trend map (a) and spatial distribution map (b) of Shandong Province (1971–2020).
Figure 2.
Typical extreme precipitation total amount trend map (a) and spatial distribution map (b) of Shandong Province (1971–2020).

Figure 3.
The typical extreme precipitation duration trend (a) and spatial distribution (b) in Shandong Province (1971–2020).
Figure 3.
The typical extreme precipitation duration trend (a) and spatial distribution (b) in Shandong Province (1971–2020).

Figure 4.
Typical extreme rainfall intensity trend map (a), average rainfall intensity spatial distribution map (b), and extreme rainfall intensity spatial distribution map (c) of Shandong Province (1971–2020).
Figure 4.
Typical extreme rainfall intensity trend map (a), average rainfall intensity spatial distribution map (b), and extreme rainfall intensity spatial distribution map (c) of Shandong Province (1971–2020).

Figure 5.
Statistical chart of the typical extreme precipitation start time (a), statistical chart of the rainstorm start time (b), spatial distribution map of the precipitation start time (c), and spatial distribution map of the rainstorm start time (d) in Shandong Province (1971–2020).
Figure 5.
Statistical chart of the typical extreme precipitation start time (a), statistical chart of the rainstorm start time (b), spatial distribution map of the precipitation start time (c), and spatial distribution map of the rainstorm start time (d) in Shandong Province (1971–2020).

Figure 6.
Typical extreme precipitation frequency distribution in Shandong Province (1971–2020).

Figure 7.
Classification of the different rain patterns of typical extreme precipitation events in Shandong Province from 1971 to 2020 ((a) rain pattern I, (b) rain pattern II, (c) rain pattern III, and (d) rain pattern IV; color line: precipitation process of extreme precipitation events).
Figure 7.
Classification of the different rain patterns of typical extreme precipitation events in Shandong Province from 1971 to 2020 ((a) rain pattern I, (b) rain pattern II, (c) rain pattern III, and (d) rain pattern IV; color line: precipitation process of extreme precipitation events).

Figure 8.
Typical extreme precipitation frequency distributions of the different rain patterns in Shandong Province from 1971 to 2020 ((a) rain pattern I, (b) rain pattern II, (c) rain pattern III, and (d) rain pattern IV).
Figure 8.
Typical extreme precipitation frequency distributions of the different rain patterns in Shandong Province from 1971 to 2020 ((a) rain pattern I, (b) rain pattern II, (c) rain pattern III, and (d) rain pattern IV).


Figure 9.
Statistical chart of the typical extreme precipitation in the year of occurrence (a) and monthly time of occurrence (b) for the different rain patterns in Shandong Province from 1971 to 2020.
Figure 9.
Statistical chart of the typical extreme precipitation in the year of occurrence (a) and monthly time of occurrence (b) for the different rain patterns in Shandong Province from 1971 to 2020.

Figure 10.
Extreme precipitation average in the field for the different rain patterns in Shandong Province from 1971 to 2020 ((a) rain pattern I, (b) rain pattern II, (c) rain pattern III, and (d) rain pattern IV; shadow: 500 hPa height field, unit: gpm; arrow: 850 hPa vector wind field, unit: m/s; A: anticyclone, and C: cyclone).

Figure 11.
Typical extreme precipitation average dynamic fields of the different rain patterns in Shandong Province from 1971 to 2020 ((a) 200 hPa, (b) 700 hPa, and (c) 925 hPa; 1. rain pattern I, 2. rain pattern II, 3. rain pattern III, and 4. rain pattern IV; contour line: divergence, unit: s−1; shadow: vertical velocity, unit: Pa·s−1).


Figure 12.
Typical extreme precipitation average water vapor fields of the different rain patterns in Shandong Province from 1971 to 2020 ((a) 700 hPa, (b) 850 hPa, and (c) 925 hPa; 1. rain pattern I, 2. rain pattern II, 3. rain pattern III, and 4. rain pattern IV; contour line: specific humidity, unit: g·kg−1; shadow: water vapor flux divergence, unit: g·cm−2·hpa−1·s−1).


Table 1.
Information on extreme precipitation events.
| Number | Start Date | Start Time | Total Precipitation/mm | Precipitation Duration/h | Number | Start Date | Start Time | Total Precipitation/mm | Precipitation Duration/h |
|---|---|---|---|---|---|---|---|---|---|
| 1 | 8 August 1971 | 12:00 | 259 | 37 | 22 | 6 August 1994 | 6:00 | 251 | 43 |
| 2 | 20 August 1971 | 2:00 | 264 | 47 | 23 | 21 August 1995 | 10:00 | 230 | 39 |
| 3 | 23 September 1971 | 12:00 | 256 | 37 | 24 | 19 August 1997 | 13:00 | 234 | 36 |
| 4 | 29 July 1973 | 21:00 | 256 | 28 | 25 | 21 August 1998 | 18:00 | 260 | 31 |
| 5 | 30 August 1973 | 17:00 | 217 | 32 | 26 | 30 August 2000 | 2:00 | 274 | 47 |
| 6 | 12 August 1974 | 7:00 | 265 | 42 | 27 | 29 July 2001 | 16:00 | 320 | 81 |
| 7 | 13 August 1975 | 4:00 | 419 | 69 | 28 | 20 July 2003 | 12:00 | 264 | 37 |
| 8 | 4 July 1977 | 17:00 | 263 | 32 | 29 | 28 August 2005 | 16:00 | 230 | 33 |
| 9 | 9 July 1978 | 2:00 | 307 | 71 | 30 | 2 July 2006 | 7:00 | 245 | 42 |
| 10 | 28 July 1980 | 14:00 | 231 | 35 | 31 | 4 July 2007 | 17:00 | 284 | 56 |
| 11 | 18 July 1983 | 2:00 | 463 | 95 | 32 | 21 July 2008 | 23:00 | 279 | 50 |
| 12 | 20 July 1984 | 13:00 | 239 | 36 | 33 | 7 August 2009 | 3:00 | 371 | 46 |
| 13 | 23 July 1984 | 17:00 | 273 | 32 | 34 | 26 August 2010 | 2:00 | 313 | 71 |
| 14 | 29 August 1984 | 5:00 | 284 | 47 | 35 | 6 September 2010 | 3:00 | 316 | 46 |
| 15 | 13 August 1987 | 9:00 | 233 | 40 | 36 | 10 August 2011 | 4:00 | 250 | 45 |
| 16 | 2 August 1990 | 2:00 | 366 | 47 | 37 | 23 July 2014 | 9:00 | 265 | 64 |
| 17 | 14 August 1990 | 14:00 | 379 | 59 | 38 | 8 July 2018 | 7:00 | 232 | 42 |
| 18 | 23 July 1991 | 23:00 | 239 | 50 | 39 | 10 August 2019 | 4:00 | 364 | 69 |
| 19 | 10 August 1992 | 8:00 | 234 | 41 | 40 | 22 July 2020 | 15:00 | 225 | 34 |
| 20 | 31 August 1992 | 16:00 | 222 | 33 | 41 | 5 August 2020 | 6:00 | 320 | 43 |
| 21 | 3 August 1993 | 23:00 | 412 | 50 |
Table 2.
Statistics regarding the characteristic values of the different rain patterns in Shandong Province.
Table 2.
Statistics regarding the characteristic values of the different rain patterns in Shandong Province.
| Rainfall Pattern | Maximum Value | Minimum Value | Range | Average Value | Standard Deviation | Coefficient of Variation |
|---|---|---|---|---|---|---|
| Pattern I (factory shape) | 319.89 | 230.03 | 89.86 | 254.77 | 22.16 | 0.09 |
| Pattern II (square-root shape) | 370.60 | 216.64 | 153.96 | 269.83 | 54.31 | 0.20 |
| Pattern III (wave shape) | 462.68 | 264.54 | 198.14 | 354.23 | 72.75 | 0.21 |
| Pattern IV (spoon-shaped buckle) | 411.68 | 313.38 | 98.30 | 348.50 | 54.83 | 0.16 |
Disclaimer/Publisher’s Note: The statements, opinions and data contained in all publications are solely those of the individual author(s) and contributor(s) and not of MDPI and/or the editor(s). MDPI and/or the editor(s) disclaim responsibility for any injury to people or property resulting from any ideas, methods, instructions or products referred to in the content. |
© 2024 by the authors. Licensee MDPI, Basel, Switzerland. This article is an open access article distributed under the terms and conditions of the Creative Commons Attribution (CC BY) license (https://creativecommons.org/licenses/by/4.0/).
Share and Cite
MDPI and ACS Style
Liu, J.; Li, B.; Ma, M. Spatiotemporal Variation and Causes of Typical Extreme Precipitation Events in Shandong Province over the Last 50 Years. Remote Sens. 2024, 16, 1283. https://doi.org/10.3390/rs16071283
AMA Style
Liu J, Li B, Ma M. Spatiotemporal Variation and Causes of Typical Extreme Precipitation Events in Shandong Province over the Last 50 Years. Remote Sensing. 2024; 16(7):1283. https://doi.org/10.3390/rs16071283
Chicago/Turabian StyleLiu, Jie, Baofu Li, and Mengqiu Ma. 2024. "Spatiotemporal Variation and Causes of Typical Extreme Precipitation Events in Shandong Province over the Last 50 Years" Remote Sensing 16, no. 7: 1283. https://doi.org/10.3390/rs16071283
Note that from the first issue of 2016, this journal uses article numbers instead of page numbers. See further details here.