
A Pseudo-Satellite Fingerprint Localization Method Based on Discriminative Deep Belief Networks
1
School of Instrument Science and Engineering, Southeast University, Nanjing 210096, China
2
State Key Laboratory of Satellite Navigation System and Equipment Technology, Shijiazhuang 050081, China
3
The 54th Research Institute of China Electronics Technology Group Corporation, Shijiazhuang 050081, China
*
Author to whom correspondence should be addressed.
Remote Sens. 2024, 16(8), 1430; https://doi.org/10.3390/rs16081430
Submission received: 2 April 2024
/
Revised: 15 April 2024
/
Accepted: 16 April 2024
/
Published: 18 April 2024
Abstract
:Pseudo-satellite technology has excellent compatibility with the BDS satellite navigation system in terms of signal systems. It can serve as a stable and reliable positioning signal source in signal-blocking environments. User terminals can achieve continuous high-precision positioning both indoors and outdoors without any modification to the navigation module. As a result, pseudo-satellite indoor positioning has gradually emerged as a research hotspot in the field. However, due to the complex and variable indoor radio propagation environment, signal propagation is interfered with by noise, multipath, non-line-of-sight (NLOS) propagation, etc. The geometric relation-based localization algorithm cannot be applied in indoor non-line-of-sight environments. Therefore, this paper proposes a pseudo-satellite fingerprint localization method based on the discriminative deep belief networks (DDBNs). The method acquires the model parameters of pseudo-satellite multi-carrier noise density signal strength in non-line-of-sight indoor spaces through a greedy unsupervised learning method and gradient descent-supervised learning method. It establishes a mapping relationship between the implied features of the pseudo-satellite multi-carrier noise density signal strength and indoor location, enabling pseudo-satellite fingerprint matching localization in indoor non-line-of-sight environments. In this paper, the performance of the positioning algorithm is verified in dynamic and static scenarios through numerous experiments in a laboratory environment. Compared to the commonly used localization algorithms based on fingerprint library matching, the results demonstrate that, in indoor non-line-of-sight test conditions, the system’s 2D static positioning has a maximum error of less than 0.24 m, an RMSE better than 0.12 m, and a 2σ (95.4%) positioning error better than 0.19 m. For 2D dynamic positioning, the maximum error is less than 0.36 m, the average error is 0.23 m, and the 2σ positioning error is better than 0.26 m. These results effectively tackle the challenge of pseudo-satellite indoor positioning in non-line-of-sight environments.
1. Introduction
With the rapid development of a digital, informatized, and intelligent society, people’s demand for positioning and navigation is also growing. Location services play a fundamental role in various fields, such as smart city development, smart manufacturing, smart transportation, smart warehousing, smart healthcare, emergency rescue operations, virtual/augmented reality, and social networking. Although the Global Navigation Satellite System (GNSS) can provide high-precision positioning in outdoor open environments, it cannot function in complex indoor scenarios due to wall occlusion [1]. In some complex indoor environments, such as airport terminals, sports stadiums, shopping malls, supermarkets, libraries, and underground car parks, high-precision location services are essential for personnel management and vehicle navigation. Therefore, indoor positioning technology has become a focal point for research both domestically and internationally [2,3]. Currently, indoor positioning techniques mainly include 5G positioning [4,5], Wi-Fi fingerprint positioning [6,7,8], ultra-wideband (UWB) positioning [9], low-power Bluetooth (BLE) positioning [10,11], acoustic wave positioning [12], LED light positioning [13], magnetic field positioning [14], pseudo-satellite positioning [15,16,17], and motion-sensor-based PDR [18]. However, various positioning techniques have their own advantages and disadvantages, and they offer different benefits when addressing indoor positioning requirements in various scenarios.
The pseudo-satellite is an artificially arranged signal generator on the ground that can emit signals similar to those of a global satellite navigation system. The deployment of pseudo-satellites in indoor environments can be used as a reliable positioning source. It can achieve seamless indoor and outdoor navigation and positioning without changing the existing hardware of satellite navigation terminals. Therefore, a wide range of scholars have conducted extensive research on pseudo-satellite indoor positioning technology. Aiming to address the issue of pseudo-satellite fuzzy resolution and localization in indoor large-scale occluded spaces, Dr. Zhang proposed a factor map localization method based on the fuzzy estimation of the phase ranging of BDS pseudo-satellite clusters. This method facilitates the process of BDS pseudo-satellite localization in LSOS, achieving localization accuracy at the submeter level [19]. Due to the indoor environment being affected by multipath propagation and other factors, effective positioning becomes challenging. Dr. Huang proposed a pseudo-satellite carrier phase difference positioning algorithm based on particle filtering. This algorithm avoids solving the problem of integer ambiguity by calculating the pseudo-distance similarity. Meanwhile, to address the issue of dispersion in localization results caused by varying moving speeds, a method is proposed based on the Doppler shift dynamic estimation of particle speeds. This method enhances the accuracy of the particle weight distribution, thereby improving both the localization accuracy and the continuity of the localization system [20]. Dr. Gan proposed a pseudo-satellite Doppler differential positioning algorithm that utilizes Doppler differential equations and known point initialization (KPI) to calculate the speed and position of the receiver [21]. However, there are some challenging problems in the research and system design of pseudo-satellite indoor positioning technology due to the influence of indoor building occlusion. Factors such as near and far effects, multipath effects, and linearization errors typically result in pseudo-satellite signals being out of lock. Traditional high-precision positioning algorithms based on geometrical relations often face challenges, particularly in non-line-of-sight environments, impacting the accuracy and reliability of positioning [22,23].
In order to address the issue of pseudo-satellites being challenging to locate in indoor non-line-of-sight environments, this paper introduces a positioning method based on pseudo-satellite multi-channel carrier noise density (C/N0) signal strength fingerprinting. The method utilizes a novel deep architecture that combines the abstraction capability of the deep belief networks with the differentiation ability of the exponential loss function. By leveraging a small amount of annotated data, the method establishes an indoor spatial distribution model of the pseudo-satellite C/N0 signal strength, enabling the accurate prediction of user location in non-line-of-sight environments. The accurate prediction of user location in non-line-of-sight environments is finally achieved by this algorithm. The main contributions of this paper are as follows:
- (1)
- Aiming to address the challenges of poor positioning reliability and the inability to position faced by pseudo-satellites in indoor non-line-of-sight environments, a fingerprint matching positioning method based on pseudo-satellite multiplexed carrier noise density (C/N0) signal strength is proposed. An eight-channel indoor array pseudo-satellite base station is developed. Each channel transmits independent C/A code and B1/L1 band RF signals, enabling stable and continuous positioning in indoor non-line-of-sight environments.
- (2)
- This paper proposes a fingerprint positioning method based on the discriminative deep belief networks (DDBNs). The greedy unsupervised learning method is utilized to finalize the construction of the DDBN deep architecture. Subsequently, the gradient descent-supervised learning method is employed to optimize the parameter space further. Finally, the classification performance of the entire deep architecture is enhanced by implementing the backpropagation strategy with an exponential loss function. The optimal model for pseudo-satellite multi-channel C/N0 signal strength is ultimately achieved by leveraging a small amount of annotated data through repeated iterative calculations.
- (3)
- In this paper, a large number of experiments are conducted in an indoor non-line-of-sight environment to achieve the static and dynamic positioning of pedestrians using the constructed C/N0 signal strength model. The results are compared to commonly used fingerprint positioning methods. The experimental findings indicate that the proposed positioning method can achieve a better accuracy and effectively meet the indoor positioning requirements of unmanned vehicles.
The remainder of this paper is arranged as follows: Section 2 introduces the technical architecture of the pseudo-satellite positioning technology for indoor arrays and analyzes the working principle of the technology. The third section introduces the proposed positioning model of the discriminative deep belief networks and the implementation details of the algorithm. In the fourth section, a large number of experiments are conducted in a laboratory room with a non-line-of-sight environment. The performance evaluation of two different positioning methods, static and dynamic, is performed to verify the effectiveness of the positioning algorithm. The final section summarizes the entire text and outlines the next research plan.
2. Related Work
This section first introduces the basic concepts of indoor array pseudo-satellite base stations and carrier noise density signal strength. It then analyzes the fluctuation of carrier noise density signal strength at different times and the variations in different locations in a non-line-of-sight environment using measured data. Finally, the algorithmic technology architecture and implementation process proposed in this paper are introduced.
2.1. Multi-Channel Indoor Array Pseudo-Satellites
The indoor pseudo-satellite base station described in this paper adopts a homologous multi-array element design. The time-frequency reference of the multi-channel pseudo-satellite signal is controlled by the same crystal oscillator. The pseudo-satellite base station equipment and the base station transmitting antenna are shown in Figure 1. The eight-channel transmission signal modulates the GPS L1 C/A code and BDS B1C navigation signal with different spread spectrum codes. These codes are utilized to differentiate between various channels and navigation information, ensuring the distinctiveness of each channel signal.
2.2. Indoor Array Pseudo-Satellite Carrier Noise Density (C/N0) Signal Strength
In outdoor line-of-sight environments, satellite navigation systems typically utilize pseudo-range and carrier phase observation measurements to calculate absolute positioning based on geometric relationships. Due to the complex internal structure of the indoor environment and the diversity of the layout of indoor items, the pseudo-satellite signal is affected by factors such as multipath effect in the non-line-of-sight environment, and accurate ranging cannot be achieved. The pseudo-satellite base station has a different spread code for each channel modulation; so, each pseudo-satellite signal is unique in the indoor space. Due to the influence of reflection and refraction caused by walls, floors, and metal objects, pseudo-satellite navigation signals can be effectively received in non-line-of-sight environments; so, this paper used the signal strength of pseudo-satellite carrier noise density (C/N0) to measure the signal intensity of pseudo-satellite carrier noise density (C/N0) in non-line-of-sight environment to generate fingerprint data to carry out indoor positioning research.
In fingerprint-based technology, the long-term stability and significant spatial difference of fingerprint data will have a positive impact on signal feature extraction and position matching; so, the above attributes of indoor array pseudo-satellite C/N0 were verified in this paper.
- (1)
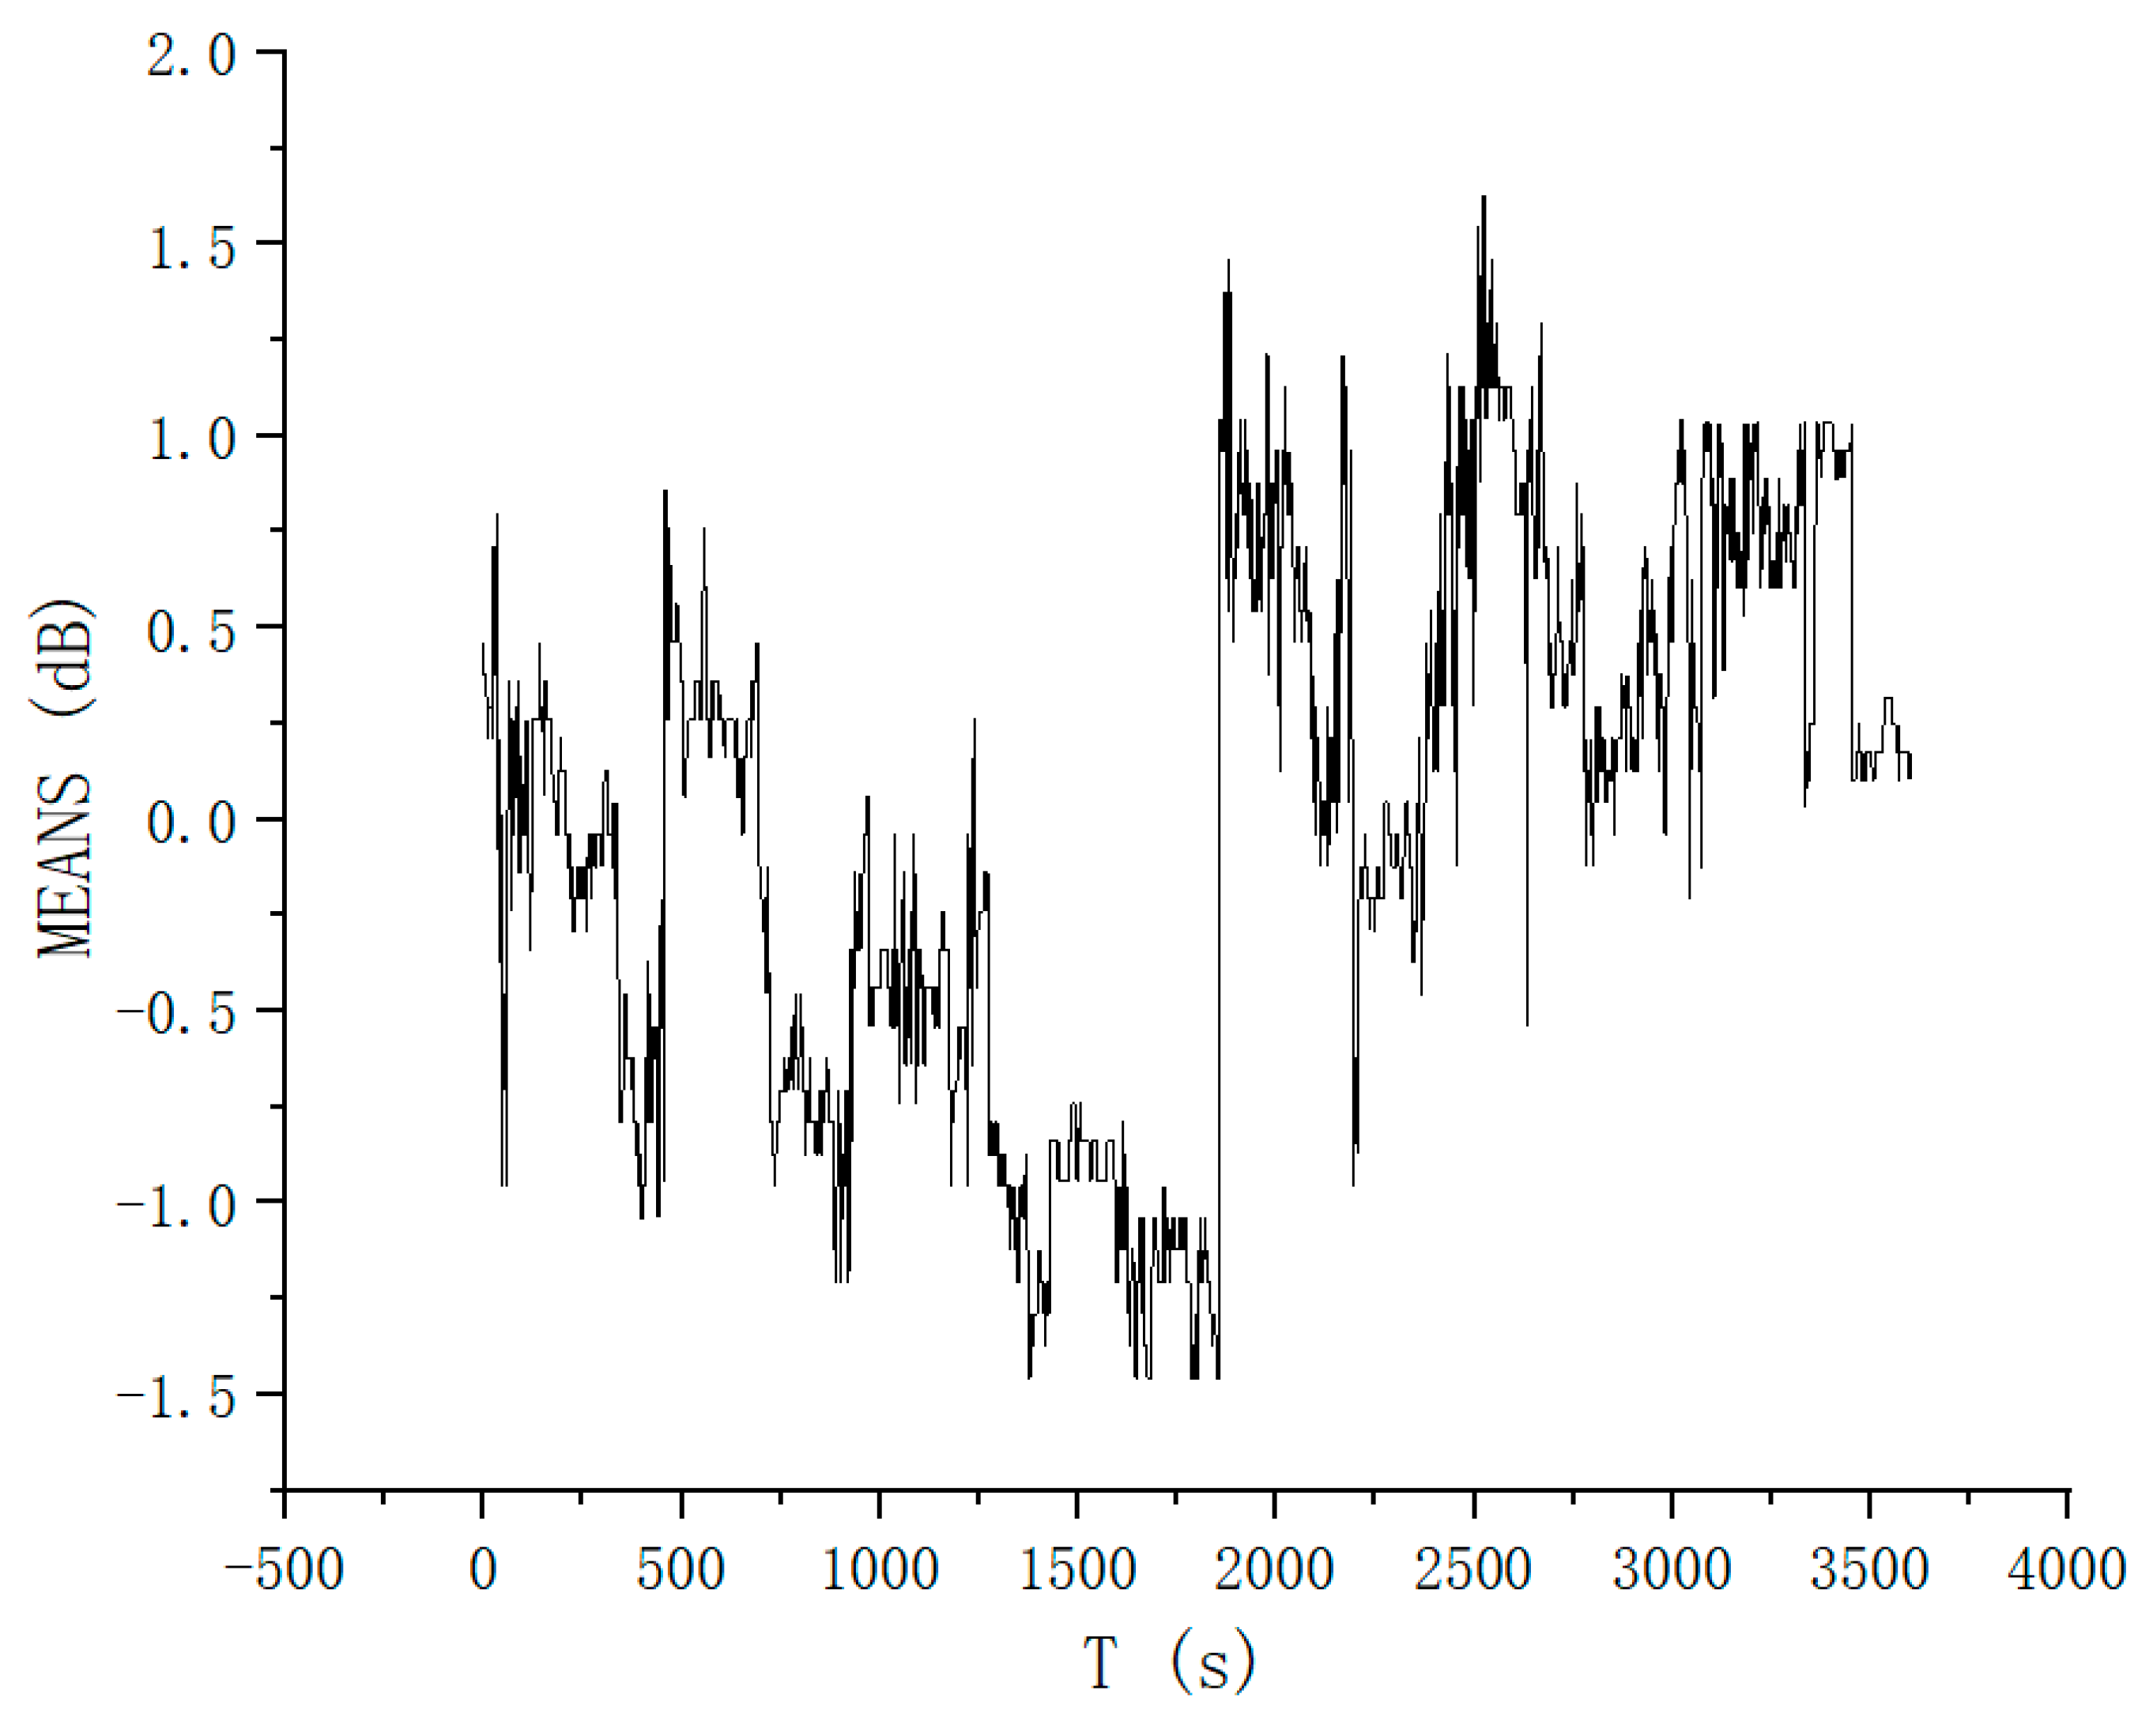
- Pseudo-satellite C/N0 time stability test. In this paper, the Ublox F9P commercial receiver was utilized to observe the pseudo-satellite base station signal in a non-line-of-sight environment for 1 h. The sampling frequency was set at 1 Hz, and the C/N0 data results of each channel were recorded. The average C/N0 of all channels was used as the evaluation metric for time stability. The C/N0 stability test results of the pseudo-satellite signal from the indoor array are depicted in Figure 2.
As it can be seen from Figure 2, the average signal strength of the multi-channel pseudo-satellite C/N0 is used as the evaluation object for time stability. The average fluctuation range is −1.5~1.5 dB in 1 h sampling time, the absolute value of the minimum signal strength fluctuation is 0 dB, the absolute value of the maximum signal strength fluctuation is 1.5 dB, and the standard deviation of the multi-channel pseudo-satellite C/N0 signal strength at 1 h sampling time is 0.70 dB. It can be seen from the test results indicate that the signal strength of pseudo-satellite C/N0 exhibits minor fluctuations in non-line-of-sight environments, with a temporal stability that is significantly superior to that of Wi-Fi signals. This difference ensures positioning stability and robustness.
- (2)
- Pseudo-satellite C/N0 spatial difference test. Theoretically, the greater the spatial difference of the signal, the higher the positioning accuracy of the fingerprint matching algorithm. Therefore, in non-line-of-sight indoor environments, two sampling points were established with a spacing of 0.2 m. The signal strength of the eight-channel pseudo-satellite C/N0 was collected at these points. The data were collected over a period of 1 h with a sampling frequency of 1 Hz. The C/N0 spatial difference test results of the indoor array pseudo-satellite signal were obtained by comparing the C/N0 difference between two pseudo-satellites on the same channel but at different positions as the spatial difference evaluation metric. The C/N0 spatial difference test results of the pseudo-satellite signal from the indoor array, as depicted in Figure 3, were obtained.
In Figure 3, the signal strength difference of the channel 1 pseudo-satellite C/N0 at two different positions is in the range of −12~4 dB, and the range of the channel 2 pseudo-satellite C/N0 is −4~11 dB. From the test results of the two channels, it can be seen that there is a significant difference in the signal strength of pseudo-satellite C/N0 between the same channels in a non-line-of-sight environment. This variance will serve as a foundation for the fingerprint matching and positioning algorithm based on pseudo-satellite C/N0 signal strength.
2.3. Technical Architecture
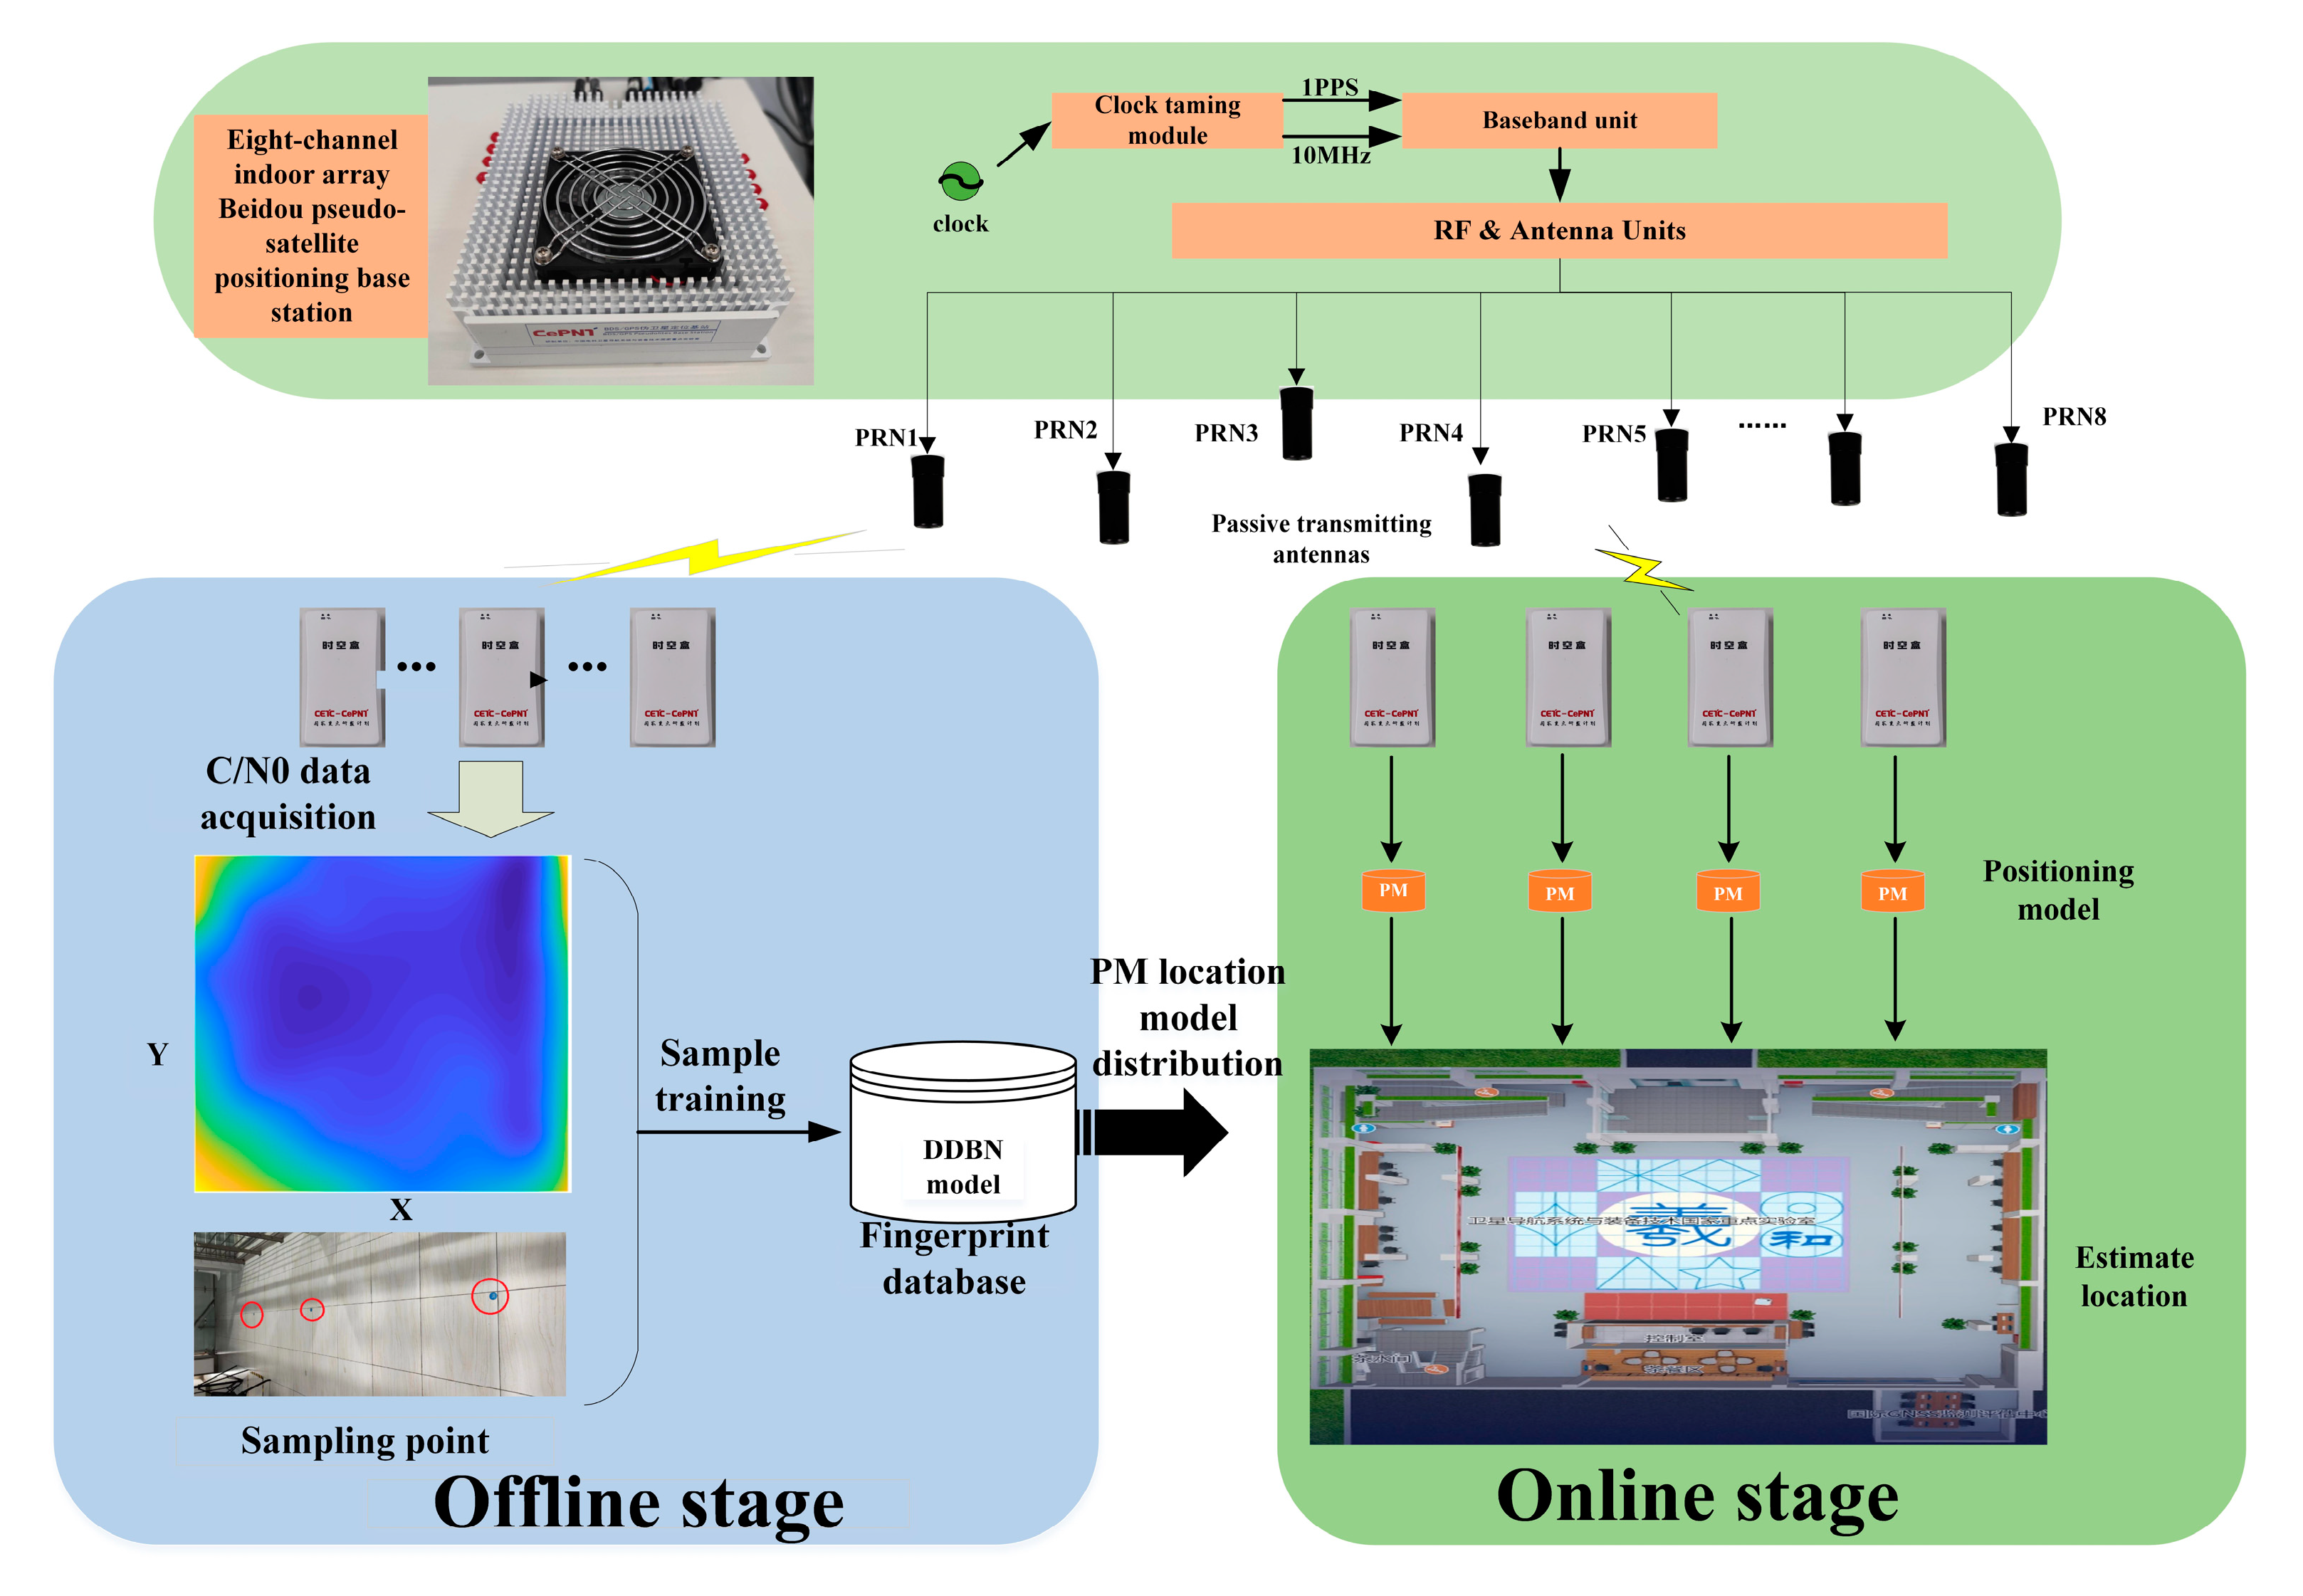
The implementation steps of the pseudo-satellite C/N0 signal strength fingerprint matching and positioning algorithm proposed in this paper included two parts: offline fingerprint database construction and online matching and positioning. The system architecture is shown in Figure 4.
- (1)
- Offline stage. In the indoor non-line-of-sight environment test area, observation data from eight pseudo-satellite C/N0 signal strengths were collected. The median preprocessing method, based on the root-mean-square error, was utilized to reduce data noise. The observation data was organized into an ordered vector, and a pseudo-satellite C/N0 signal strength position fingerprint was constructed using the location coordinates of the sampling points. Afterward, the constructed dataset was transferred to a server-side database for training the localization model. Finally, the trained positioning model was distributed to the user terminal.
- (2)
- Online stage. In the current indoor non-line-of-sight environment, the user terminal receives the eight-channel pseudo-satellite RF signal in real time and estimates the real-time position of the user terminal using the positioning model.
3. Fingerprint Localization Method Based on the Discriminative Deep Belief Network Pseudo-Satellite C/N0 Signal Strength
3.1. Discriminative Deep Belief Networks
The deep belief network (DBN) was proposed by Hinton et al. [24] in 2006 to address the shortcomings of the BP algorithm. The BP algorithm has shown good results in data compression applications, like image processing [25,26] and speech recognition [27], but its performance in classification tasks needs enhancement. Discriminative deep belief networks are suitable for indoor localization scenarios with rich multimodal data. They can integrate these heterogeneous data sources and extract deep feature representations to enhance localization accuracy. The training and inference of discriminative deep belief networks may involve high computational complexity. It is necessary to ensure that sufficient hardware resources are available to support the operation of the model. Discriminative deep belief networks are adept at handling nonlinear and complex relationships, making them well-suited for indoor environments facing challenges like multipath propagation, signal occlusion, and dynamic interference. In situations demanding high positioning accuracy, discriminative deep belief networks can outperform traditional methods by learning intricate environmental features at a deep level.
In the research on pseudo-satellite fingerprint positioning technology in a non-line-of-sight environment, if the fingerprint database can be constructed with a small amount of annotated data and the positioning accuracy can be ensured, the usability of pseudo-satellite indoor positioning in a non-line-of-sight environment will be guaranteed. In this paper, we introduced a model named the discriminative deep belief network, which utilizes a novel deep architecture to combine the abstract capability of the deep belief networks with the discriminative power of the exponential loss function. First, the collected data were simplified for pre-processing. The noise density of multiple carriers (C/N0) distribution features at different locations were analyzed using a small amount of labeled data to extract data features. The greedy unsupervised learning method was employed to construct the DDBN deep architecture. Subsequently, the gradient descent-supervised learning method was utilized to optimize the parameter space further. The classification performance of the entire deep architecture was then optimized by employing the backpropagation strategy through the exponential loss function. The optimal model of the pseudo-satellite multi-channel C/N0 positioning network was achieved through repeated iterative calculations, accurately reflecting the correlation between C/N0 signal strength and position. Finally, indoor high-precision positioning was achieved based on this model.
The DDBN structure diagram is shown in Figure 5. The DDBN consists of an input layer h0, n hidden layers h1, h2, ……, hn, and a label layer on top. The input layer h0 has D cells, which is equal to the number of features in data x. The label layer has C cells, which is equal to the number of categories in the label data y. W = {w1, w2, ……, wN+1} is the parameter that needs to be learned in the deep architecture. For DDBN networks, increasing the number of layers of the hidden layer and the number of nodes in each hidden layer can improve the positioning accuracy, but the complexity of the calculation also increases. In this paper, the number of hidden layers of the DDBN was set to three; the number of nodes in each hidden layer was set to 8, 6, and 4; and the number of nodes in the output layer was 2.
The deep architecture of DDBN is built up by multiple RBMs. RBM is a two-layer recurrent neural network where random binary inputs are linked to random binary outputs by symmetric weights.
The DDBN training process is divided into two steps:
- (1)
- DDBN uses RBM as the basic module and uses a greedy and unsupervised method to build a deep architecture layer by layer. U unlabeled data and L annotated data are used to find the parameter space W of the N-layer network.
- (2)
- DDBN uses the gradient descent method to train the deep architecture based on the exponential loss function. The parameter space W is further optimized by L annotated data.
3.2. DDBN Unsupervised Learning Method
In the DDBN deep architecture, the energy state (, ) is defined as:
where is the model parameter and is the symmetrical connection parameter between the element s in the hidden layer and the element t in the hidden layer , with . is the s-th bias in the hidden layer , and is the t-th bias in the hidden layer . is the number of contacts at the k-th layer.
The probability of occurrence of is:
where denotes the normalization constant.
The probability of and occurring is:
The probability that the t-th unit is 1 is a logistic function containing and :
The probability that the s-th unit is 1 is a logical function containing and :
where the logical function is:
The logarithm of the probability generated by the hidden layer is derived relative to the model parameter , which is obtained by the contrastive divergence method [18]:
where represents the expected data distribution, and represents the data distribution after running Gibbs sampling M times from the input data.
Parameter can then be adjusted in the following steps:
where is the momentum and is the learning rate.
After the parameter is calculated by the above method, the hidden layer can be calculated by the following formula after data x are input from :
Parameter space , like the classical backpropagation method, is initialized by a random number that obeys a normal distribution.
3.3. DDBN Supervised Learning Method
After greedy unsupervised training, is an abstract representation of . Then, based on labeled data, the parameter space is optimized by the supervised learning method using the gradient descent method:
where
denotes the exponential loss function as follows:
The exponential loss function has been applied to the boosting algorithm and performs well in the actual application dataset [28].
4. Test Results and Evaluation
This section validates the positioning performance of the algorithm in real non-line-of-sight scenarios. The DDBN model was trained with a small amount of labeled data, and the model’s static and dynamic positioning performance was tested in a real-world environment.
4.1. Test Environment and Test Settings
The test area was located at the artificial intelligence navigation test site of the State Key Laboratory of Satellite Navigation System and Equipment Technology. The test site was a three-story building with a steel structure. The indoor array pseudo-satellite antenna was deployed at the top of the test site, utilizing a double-circle array network. The first floor of the test site included the central line-of-sight test area and the non-line-of-sight (NLOS) test area on both sides. The second and third floors of the test area consisted of circular corridor structures. The test environment was situated in the signal NLOS area on both sides of the first floor, and the left NLOS signal area was selected as the test area for this experiment. The total area measured 48 m², with dimensions of 12 m in length and 4 m in width. The test environment comprised a wooden workbench, concrete columns, tin cabinets, iron shelves, concrete walls, and a smooth ceramic tile floor. The internal structure and test scene of the test site are illustrated in Figure 6.
The performance of the fingerprint database significantly influences the results of fingerprint matching and positioning. In the offline data acquisition of the signal strength of each pseudo-satellite carrier noise density (C/N0), the dynamic fingerprint database construction method was adopted, which is fast and cost-effective. In order to address the issue of poor fingerprint positioning accuracy resulting from unstable signal strength during the dynamic fingerprint database construction process, an unmanned robot data acquisition platform was developed. This platform integrates an indoor pseudo-satellite receiver with an external high-gain antenna, as illustrated in Figure 7. The integrated indoor pseudo-satellite receiver receives the indoor pseudo-satellite navigation signal in real time through the high-gain antenna. It parses the original observation and measurement data of the pseudo-satellite signal of each channel through data preprocessing and stores the pseudo-satellite carrier noise density (C/N0) signal strength data of each channel in the receiver.
During the construction of the offline fingerprint database, the tester operates the unmanned robot data acquisition platform to ensure consistent movement in the NLOS environment. The receiver gathers and logs real-time C/N0 signal strength fingerprint data, which are then stored locally on the receiver. Once the fingerprint collection process is finished, the locally stored data are transmitted to the server for positioning model training.
In the process of building the offline fingerprint database, the tester controls the unmanned robot data acquisition platform to maintain a uniform motion in the NLOS environment, the receiver collects and records the C/N0 signal strength fingerprint data in real time, the collected fingerprint data are saved on the receiver, and the locally stored data are sent to the server for positioning model training after the fingerprint collection activity is completed.
During online positioning, the tester retrieves the trained positioning model from the server, receives and analyzes the carrier-to-noise density (C/N0) signal strength data from each indoor pseudo-satellite channel in real time, and achieves position estimation through the fingerprint matching positioning algorithm.
4.2. Static Positioning Performance Test
In order to verify the static positioning accuracy of the carrier noise density signal strength fingerprint positioning system based on pseudo-satellite channels, the tester set up several test reference points on the ground of the NLOS test environment. These points were calibrated with high precision using a total station. The test data accuracy was at the centimeter level, and four typical test points were selected in the test environment. Test point TP1 was surrounded by iron shelves, concrete pillars, and walls. Test point TP2 was positioned between two concrete pillars, with a wooden workbench and a concrete wall on the right side. Test point TP3 was situated in the center of the test area, with no obvious objects in close proximity. Test point TP4 was surrounded by an iron storage cabinet at the lower end and a concrete pillar on the right side. The test area and test reference points are illustrated in Figure 8.
The tester positions the receiver on the reference point, and the receiver antenna captures the indoor BDS pseudo-satellite navigation signal to generate real-time positioning results. We set the receiver positioning frequency to 1 Hz, and the static positioning time was 10 min. The experimental results are shown in Figure 9, Figure 10, Figure 11 and Figure 12.
Figure 9, Figure 10, Figure 11 and Figure 12 display the real-time static positioning results and the test results for positioning errors at the four test points. In the real-time static positioning results, the red circles represent the positions of the test points that are calibrated with high precision, while the blue dots inside the box indicate the real-time positioning results. The Euclidean distance formula was used to calculate the positioning error by comparing the real-time positioning result with the real coordinates of the reference point. The positioning errors of the four test points were statistically analyzed, as shown in Table 1.
From the statistical analysis results in Table 1, it can be seen that the maximum positioning error of the four test points is 0.24 m, the root-mean-square error (RMSE) is less than 0.12 m, and the 2σ positioning error is less than 0.19 m. The DDBN positioning model proposed in this paper can achieve a high positioning accuracy in static positioning tests in non-line-of-sight environments.
4.3. Dynamic Positioning Performance Test
To enhance the assessment of the dynamic positioning performance of the BBDN positioning model, this study devised various test routes within an indoor non-line-of-sight environment. In order to eliminate the influence of the tester’s body on the positioning performance during the testing process, an unmanned robotic test platform was used in this test. The tester remotely controlled the unmanned robotic test platform to move at a constant speed along the planned test route. The test results are shown in Figure 12.
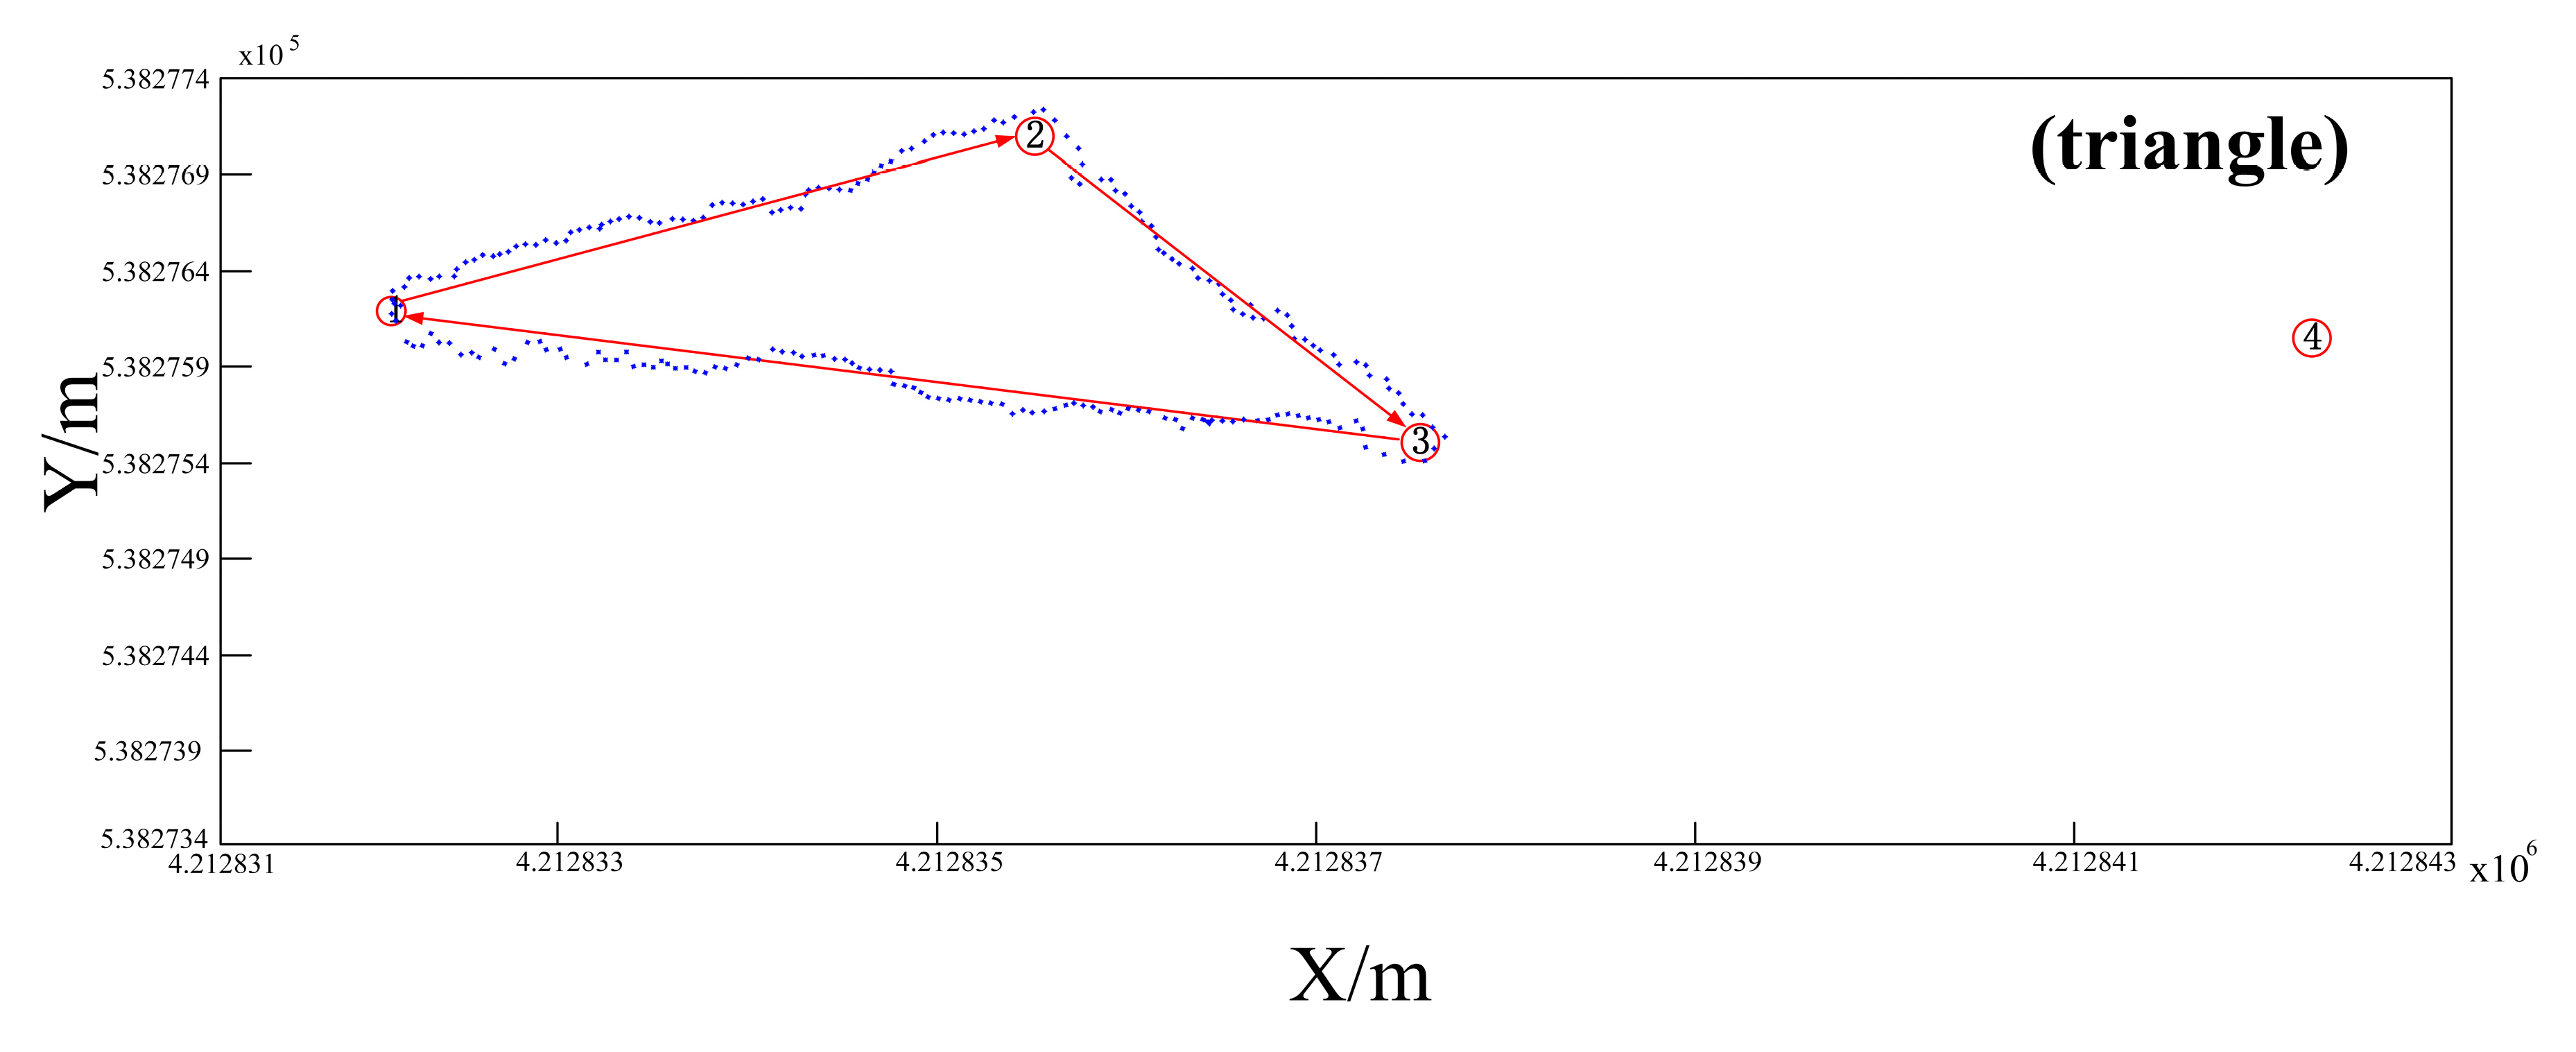
Figure 13 and Figure 14 show the results of the dynamic positioning test. The red circles represent test points 1-4 calibrated with high precision, while the blue dots indicate the real-time positioning results. The red lines represent the predefined test routes, which include a triangular test route consisting of test points 1-2-3-1 and a linear test route consisting of test points 1-2-3-4. In the dynamic positioning error analysis, high-precision calibrated test points along the motion trajectory were selected as reference points to assess the positioning accuracy of the real-time dynamic positioning results. The evaluation results are shown in Table 2.
From the statistical analysis results in Table 2, it can be seen that the maximum 2D localization error of the triangular test route is less than 0.36 m, the average localization error is less than 0.23 m, and the 2σ positioning error is less than 0.26 m. The discriminative deep belief network-based localization model proposed in this paper can achieve a high localization accuracy in dynamic localization tests in a non-line-of-sight environment.
In order to evaluate the localization performance of various algorithms in the created pseudo-satellite C/N0 fingerprint library, the algorithms in this study were compared to the PSO-ANN [29] and M-WKNN [30] algorithms from the existing literature, as well as the traditional WKNN (K = 6). Figure 15 illustrates the comparison of the cumulative probability distribution of the localization accuracy of these four algorithms.
5. Conclusions
In this paper, we address the issue of unmanned robot positioning and navigation in pseudo-satellite indoor non-line-of-sight environments. We leverage the unique features of indoor array pseudo-satellite multi-channel navigation signals, such as high discriminative capability, high spatial resolution of carrier noise density, and high temporal stability. We propose a fingerprint localization method based on discriminative deep belief networks (DDBNs). The method utilizes a greedy unsupervised learning approach to finalize the construction of a discriminative DDBN deep architecture. Subsequently, it employs gradient descent-supervised learning to further optimize the parameter space. Finally, an exponential loss function is used with a backpropagation strategy to enhance the classification performance of the entire deep architecture. Through repeated iterative calculations, the optimal pseudo-satellite multi-channel carrier noise density (C/N0) positioning network is achieved. This study then conducts static and dynamic positioning accuracy tests to evaluate the system in non-line-of-sight conditions at the State Key Experimental Artificial Intelligence Navigation Test Site for Satellite Navigation System and Equipment Technology. The experimental results show that the maximum positioning error of the 2D static positioning of the system is less than 0.24 m, the RMSE is less than 0.12 m, and the 2σ positioning error is less than 0.19 m. The maximum positioning error of 2D dynamic positioning is less than 0.36 m, the average positioning error is 0.23 m, and the 2σ positioning error is less than 0.26 m. Compared to the PSO-ANN, M-WKNN, and traditional WKNN algorithms, the proposed DDBN positioning method has the advantages of better localization results. In the future, our work will focus on considering the influence of pedestrians’ bodies to achieve accurate pedestrian positioning based on a small amount of indoor location tag data in non-line-of-sight environments.
Author Contributions
All authors developed together the idea that led to this paper. Conceptualization, S.P. and X.L.; methodology, X.L.; data processing and experimental analysis, X.L., S.D. and S.L.; article writing and typesetting, X.L.; financial support, B.Y. All authors have read and agreed to the published version of the manuscript.
Funding
This research was funded by the National Key Research and Development Plan of China (project: High Precision Positioning, Navigation and Control Technology for Large Underground Space (No. 2021YFB3900800, 2021YFB3900801)).
Data Availability Statement
The original contributions presented in the study are included in the article material, further inquiries can be directed to the corresponding author/s.
Conflicts of Interest
The authors declare no conflicts of interest.
References
- Qi, L.; Liu, Y.; Yu, Y.; Chen, L.; Chen, R. Current Status and Future Trends of Meter-Level Indoor Positioning Technology: A Review. Remote Sens. 2024, 16, 398. [Google Scholar] [CrossRef]
- Zafari, F.; Gkelias, A.; Leung, K.K. A Survey of Indoor Localization Systems and Technologies. IEEE Commun. Surv. Tutor. 2019, 21, 2568–2599. [Google Scholar] [CrossRef]
- Chan, P.Y.; Chao, J.-C.; Wu, R.-B. A Wi-Fi-Based Passive Indoor Positioning System via Entropy-Enhanced Deployment of Wi-Fi Sniffers. Sensors 2023, 23, 1376. [Google Scholar] [CrossRef] [PubMed]
- Yang, C.; Cheng, Z.; Jia, X.; Zhang, L.; Li, L.; Zhao, D. A Novel Deep Learning Approach to 5G CSI/Geomagnetism/VIO Fused Indoor Localization. Sensors 2023, 23, 1311. [Google Scholar] [CrossRef] [PubMed]
- Jayawardana, P.A.D.N.; Obaid, H.; Yesilyurt, T.; Tan, B.; Lohan, E.S. Machine-Learning-Based LOS Detection for 5G Signals with Applications in Airport Environments. Sensors 2023, 23, 1470. [Google Scholar] [CrossRef] [PubMed]
- Wan, Q.; Duan, X.; Yu, Y.; Chen, R.; Chen, L. Self-Calibrated Multi-Floor Localization Based on Wi-Fi Ranging/Crowdsourced Fingerprinting and Low-Cost Sensors. Remote Sens. 2022, 14, 5376. [Google Scholar] [CrossRef]
- Zheng, X.; Chen, R.; Chen, L.; Wang, L.; Yu, Y.; Zhang, Z.; Li, W.; Pei, Y.; Wu, D.; Ruan, Y. A Novel Device-Free Positioning Method Based on Wi-Fi CSI with NLOS Detection and Bayes Classification. Remote Sens. 2023, 15, 2676. [Google Scholar] [CrossRef]
- Zhang, Z.; Yu, Y.; Chen, L.; Chen, R. Hybrid Indoor Positioning System Based on Acoustic Ranging and Wi-Fi Fingerprinting under NLOS Environments. Remote Sens. 2023, 15, 3520. [Google Scholar] [CrossRef]
- Zhang, H.; Wang, Q.; Li, Z.; Mi, J.; Zhang, K. Research on High Precision Positioning Method for Pedestrians in Indoor Complex Environments Based on UWB/IMU. Remote Sens. 2023, 15, 3555. [Google Scholar] [CrossRef]
- De Blasio, G.; Quesada-Arencibia, A.; García, C.R.; Molina-Gil, J.M.; Caballero-Gil, C. Study on an Indoor Positioning System for Harsh Environments Based on Wi-Fi and Bluetooth Low Energy. Sensors 2017, 17, 1299. [Google Scholar] [CrossRef]
- Cantón Paterna, V.; Calveras Auge, A.; Paradells Aspas, J.; Perez Bullones, M.A. A Bluetooth Low Energy Indoor Positioning System with Channel Diversity, Weighted Trilateration and Kalman Filtering. Sensors 2017, 17, 2927. [Google Scholar] [CrossRef]
- Murata, S.; Yara, C.; Kaneta, K.; Ioroi, S.; Tanaka, H. Accurate Indoor Positioning System Using Near-Ultrasonic Sound from a Smartphone. In Proceedings of the 2014 Eighth International Conference on Next Generation Mobile Apps, Services and Technologies, Oxford, UK, 10–12 September 2014; pp. 13–18. [Google Scholar] [CrossRef]
- Peng, Q.; Guan, W.; Wu, Y.; Cai, Y.; Xie, C.; Wang, P. Three-dimensional high-precision indoor positioning strategy using Tabu search based on visible light communication. Opt. Eng. 2018, 57. [Google Scholar] [CrossRef]
- Yeh, S.-C.; Hsu, W.-H.; Lin, W.-Y.; Wu, Y.-F. Study on an Indoor Positioning System Using Earth’s Magnetic Field. IEEE Trans. Instrum. Meas. 2020, 69, 865–872. [Google Scholar] [CrossRef]
- Zhang, B.; Wang, Q.; Xia, W.; Sun, Y.; Wang, J. Pseudolite Multipath Estimation Adaptive Mitigation of Vector Tracking Based on Ref-MEDLL. Remote Sens. 2023, 15, 4041. [Google Scholar] [CrossRef]
- Fujii, K.; Sakamoto, Y.; Wang, W.; Arie, H.; Schmitz, A.; Sugano, S. Hyperbolic Positioning with Antenna Arrays and Multi-Channel Pseudolite for Indoor Localization. Sensors 2015, 15, 25157–25175. [Google Scholar] [CrossRef]
- Huang, L.; Yu, B.; Du, S.; Li, J.; Jia, H.; Bi, J. Multi-Level Fusion Indoor Positioning Technology Considering Credible Evaluation Analysis. Remote Sens. 2023, 15, 353. [Google Scholar] [CrossRef]
- Kang, W.; Han, Y. SmartPDR: Smartphone-Based Pedestrian Dead Reckoning for Indoor Localization. IEEE Sens. J. 2015, 15, 2906–2916. [Google Scholar] [CrossRef]
- Zhang, H.; Pan, S. LSOS: An FG Position Method Based on Group Phase Ranging Ambiguity Estimation of BeiDou Pseudolite. Remote Sens. 2023, 15, 1924. [Google Scholar] [CrossRef]
- Huang, L.; Yu, B.; Li, J.; Zhang, H.; Liang, X.; Cheng, J. A Robust Indoor High-precision Positioning Method Based on Arrayed Pseudolites. In Proceedings of the 2022 IEEE 12th International Conference on Indoor Positioning and Indoor Navigation (IPIN), Beijing, China, 5–8 September 2022; pp. 1–8. [Google Scholar] [CrossRef]
- Gan, X.; Yu, B.; Huang, L.; Jia, R.; Zhang, H.; Sheng, C.; Fan, G.; Wang, B. Doppler Differential Positioning Technology Using the BDS/GPS Indoor Array Pseudolite System. Sensors 2019, 19, 4580. [Google Scholar] [CrossRef] [PubMed]
- Jiang, C.; Chen, Y.; Xu, B.; Jia, J.; Sun, H.; Chen, C.; Duan, Z.; Bo, Y.; Hyyppa, J. Vector Tracking Based on Factor Graph Optimization for GNSS NLOS Bias Estimation and Correction. IEEE Internet Things J. 2022, 9, 16209–16221. [Google Scholar] [CrossRef]
- Wu, Z.; Li, Y.; Meng, X.; Lv, X.; Guo, Q. A Minimum Joint Error Entropy-Based Localization Method in Mixed LOS/NLOS Environments. IEEE Internet Things J. 2023, 10, 19913–19924. [Google Scholar] [CrossRef]
- Hinton, G.E.; Salakhutdinov, R.R. Reducing the dimensionality of data with neural networks. Science 2006, 313, 504–507. [Google Scholar] [CrossRef]
- Tong, G.; Li, Y.; Cao, L.; Jin, C. A DBN for hyperspectral remote sensing image classification. In Proceedings of the 2017 12th IEEE Conference on Industrial Electronics and Applications (ICIEA), Siem Reap, Cambodia, 18–20 June 2017; pp. 1757–1762. [Google Scholar] [CrossRef]
- Horvath, J.; Montserrat, D.M.; Hao, H.; Delp, E.J. Manipulation Detection in Satellite Images Using Deep Belief Networks. In Proceedings of the 2020 IEEE/CVF Conference on Computer Vision and Pattern Recognition Workshops (CVPRW), Seattle, WA, USA, 14–19 June 2020; pp. 2832–2840. [Google Scholar] [CrossRef]
- Jiang, D.-M.; Wu, P.; Wang, F.-N.; Sahli, H.; Verhelst, W. Audio visual speech recognition based on multi-stream DBN models with Articulatory Features. In Proceedings of the 2010 7th International Symposium on Chinese Spoken Language Processing, Tainan, Taiwan, 29 November–3 December 2010; pp. 190–193. [Google Scholar] [CrossRef]
- Friedman, J.; Tibshirani, R.; Hastie, T. Additive logistic regression: A statistical view of boosting—Rejoinder. Ann. Stat. Off. J. Inst. Math. Stat. 2000, 28, 337–407. [Google Scholar]
- Gharghan, S.K.; Nordin, R.; Ismail, M.; Ali, J.A. Accurate Wireless Sensor Localization Technique Based on Hybrid PSO-ANN Algorithm for Indoor and Outdoor Track Cycling. IEEE Sens. J. 2016, 16, 529–541. [Google Scholar] [CrossRef]
- Liu, W.; Fu, X.; Deng, Z.; Xu, L.; Jiao, J. Smallest enclosing circle-based fingerprint clustering and modified-WKNN matching algorithm for indoor positioning. In Proceedings of the 2016 International Conference on Indoor Positioning and Indoor Navigation (IPIN), Alcalá de Henares, Spain, 4–7 October 2016. [Google Scholar]
Figure 1.
Eight-channel indoor array pseudo-satellite base station and transmitting antenna.

Figure 2.
Pseudo-satellite C/N0 signal strength temporal stability test.

Figure 3.
Pseudo-satellite C/N0 spatial variability test. (a) Channel 1 pseudo-satellite signal C/N0 spatial variability test. (b) Channel 2 pseudo-satellite signal C/N0 spatial variability test.
Figure 3.
Pseudo-satellite C/N0 spatial variability test. (a) Channel 1 pseudo-satellite signal C/N0 spatial variability test. (b) Channel 2 pseudo-satellite signal C/N0 spatial variability test.

Figure 4.
Pseudo-satellite C/N0 signal strength fingerprint positioning technology system architecture.
Figure 4.
Pseudo-satellite C/N0 signal strength fingerprint positioning technology system architecture.

Figure 5.
DDBN structure diagram.

Figure 6.
Non-line-of-sight test scene at the proving ground.

Figure 7.
Unmanned robot platform and indoor pseudo-satellite receiver data acquisition equipment based on high-gain antennas.
Figure 7.
Unmanned robot platform and indoor pseudo-satellite receiver data acquisition equipment based on high-gain antennas.

Figure 8.
NLOS test area and test reference points.

Figure 9.
Real-time static positioning results and positioning errors of test point 1. (a) Real-time static positioning results of test point 1. (b) Positioning error of test point 1.
Figure 9.
Real-time static positioning results and positioning errors of test point 1. (a) Real-time static positioning results of test point 1. (b) Positioning error of test point 1.

Figure 10.
Real-time static positioning results and positioning errors of test point 2. (a) Real-time static positioning results of test point 2. (b) Positioning error of test point 2.
Figure 10.
Real-time static positioning results and positioning errors of test point 2. (a) Real-time static positioning results of test point 2. (b) Positioning error of test point 2.


Figure 11.
Real-time static positioning results and positioning errors of test point 3. (a) Real-time static positioning results of test point 3. (b) Positioning error of test point 3.
Figure 11.
Real-time static positioning results and positioning errors of test point 3. (a) Real-time static positioning results of test point 3. (b) Positioning error of test point 3.

Figure 12.
Real-time static positioning results and positioning errors of test point 4. (a) Real-time static positioning results of test point 4. (b) Positioning error of test point 4.
Figure 12.
Real-time static positioning results and positioning errors of test point 4. (a) Real-time static positioning results of test point 4. (b) Positioning error of test point 4.

Figure 13.
Triangular route of the dynamic positioning test results.

Figure 14.
Linear route of the dynamic positioning test results.

Figure 15.
CDF results for the errors of the different positioning algorithms.


Table 1.
Statistical analysis results of two-dimensional static positioning error.
| Name | TP1 | TP2 | TP3 | TP4 |
|---|---|---|---|---|
| RMSE (m) | 0.09 | 0.09 | 0.08 | 0.12 |
| Maximum (m) | 0.19 | 0.19 | 0.16 | 0.24 |
| 2σ | 0.15 | 0.16 | 0.12 | 0.19 |
Table 2.
Statistical analysis results of 2D dynamic positioning accuracy.
| Test Track | True Location | Real-Time Positioning Results | X Error (m) | Y Error (m) | 2D Positioning Error | ||
|---|---|---|---|---|---|---|---|
| X (m) | Y (m) | X (m) | Y (m) | ||||
| Triangle | 4,212,835.42 | 538,277.09 | 4,212,835.71 | 538,277.31 | 0.29 | 0.22 | 0.26 |
| 4,212,837.69 | 538,275.61 | 4,212,837.87 | 538,275.74 | 0.18 | 0.13 | 0.16 | |
| 4,212,832.08 | 538,276.15 | 4,212,832.40 | 538,276.01 | 0.32 | 0.14 | 0.25 | |
| Linear | 4,212,835.42 | 538,277.09 | 4,212,835.63 | 538,277.35 | 0.21 | 0.26 | 0.24 |
| 4,212,837.69 | 538,275.61 | 4,212,837.85 | 538,275.72 | 0.16 | 0.11 | 0.14 | |
| 4,212,842.31 | 538,276.21 | 4,212,842.54 | 538,275.75 | 0.23 | 0.46 | 0.36 | |
Table 3.
Comparison of the positioning accuracy (m) of commonly used fingerprint matching algorithms.
Table 3.
Comparison of the positioning accuracy (m) of commonly used fingerprint matching algorithms.
| Algorithm Name | Our Model | PSO-ANN | M-WKNN | WKNN |
|---|---|---|---|---|
| Average error (m) | 0.23 | 0.32 | 0.40 | 0.62 |
| 2σ error (m) | 0.26 | 0.38 | 0.52 | 0.74 |
Disclaimer/Publisher’s Note: The statements, opinions and data contained in all publications are solely those of the individual author(s) and contributor(s) and not of MDPI and/or the editor(s). MDPI and/or the editor(s) disclaim responsibility for any injury to people or property resulting from any ideas, methods, instructions or products referred to in the content. |
© 2024 by the authors. Licensee MDPI, Basel, Switzerland. This article is an open access article distributed under the terms and conditions of the Creative Commons Attribution (CC BY) license (https://creativecommons.org/licenses/by/4.0/).
Share and Cite
MDPI and ACS Style
Liang, X.; Pan, S.; Yu, B.; Li, S.; Du, S. A Pseudo-Satellite Fingerprint Localization Method Based on Discriminative Deep Belief Networks. Remote Sens. 2024, 16, 1430. https://doi.org/10.3390/rs16081430
AMA Style
Liang X, Pan S, Yu B, Li S, Du S. A Pseudo-Satellite Fingerprint Localization Method Based on Discriminative Deep Belief Networks. Remote Sensing. 2024; 16(8):1430. https://doi.org/10.3390/rs16081430
Chicago/Turabian StyleLiang, Xiaohu, Shuguo Pan, Baoguo Yu, Shuang Li, and Shitong Du. 2024. "A Pseudo-Satellite Fingerprint Localization Method Based on Discriminative Deep Belief Networks" Remote Sensing 16, no. 8: 1430. https://doi.org/10.3390/rs16081430
Note that from the first issue of 2016, this journal uses article numbers instead of page numbers. See further details here.