


Abstract
Mount Meager is a deeply eroded quaternary volcanic complex located in southwestern British Columbia (BC) and is known for its frequent large landslides. In 2010, the south face of Mount Meager collapsed, generating a long-runout debris avalanche that was one of the largest landslides (50 × 106 m3) in Canadian history. Over the past 14 years, the landslide deposit has been reworked by stream action, delivering large amounts of sediment to Lillooet River, just downstream. In this study, we investigate 10 years of geomorphic evolution of the landslide deposit using orthophotos and digital elevation models (DEMs) generated using Structure from Motion (SfM) photogrammetry on aerial photographs acquired during unmanned aerial vehicle (UAV) and Global Navigation Satellite System (GNSS) surveys. The SfM products were used to produce a series of precise maps that highlight the geomorphological changes along the lower Meager Creek within the runout area of the landslide. Comparison of DEMs produced from 2010, 2012, 2015, and 2019 imagery allowed us to calculate deposit volume changes related to erosion, transport, and redeposition of landslide material. We estimate that about 1.1 × 10⁶ m3 of sediment was eroded from the landslide deposit over the period 2015–2019. About 5.2 × 10⁵ m3 of that sediment was redeposited inside the study area. About 5.8 × 10⁵ m3 of sediment, mainly sand, silt, and clay, were exported from the study area and are being carried by Lillooet River towards Pemberton, 40 km from Mount Meager, and farther downstream. These remobilized sediments likely reduce the Lillooet River channel capacity and thus increase flood hazards to the communities of Pemberton and Mount Currie. Our study indicates a landslide persistence in the landscape, with an estimated 47-year half-life decay, suggesting that higher flood hazard conditions related to increased sediment supply may last longer than previously estimated. This study shows the value of using SfM in tandem with historic aerial photographs, UAV photos, and high-resolution satellite imagery for determining sediment budgets in fluvial systems.
1. Introduction
The Mount Meager massif, about 150 km north of Vancouver, British Columbia, is an eroded volcanic complex comprising about 20 km3 of mainly andesitic and dacitic volcanic rocks ranging in age from the Pliocene to the Holocene period [1,2,3,4,5]. It is part of the Garibaldi volcanic belt and lies near the northern limit of the Cascade magmatic arc [1,3,6,7,8]. The most recent eruption was an explosive event that occurred about 2360 years ago [9] with an estimated Volcanic Explosivity Index (VEI) value of 4 [10]. A fumarole emerged from a glacier cave on the massif in 2016 [8], sparking new studies to better understand the volcanic system [11], which, in turn, led to the production of a volcanic hazard map [12] and the installation of a preliminary monitoring system.
The massif has been deeply eroded by glaciers and streams that flow from it. Relief, from the top of Mount Meager to Lillooet River on the east side of the volcano, is about 2100 m. Steep slopes, developed in highly fractured and commonly hydrothermally altered volcanic rocks [1,2], are metastable and subject to frequent landslides during the Holocene [13,14,15]. The largest and most recent of the landslides [16,17,18] have been studied in detail, as has the role of post-Little Ice Age deglaciation on slope stability [19]. A landslide inventory has been created by Roberti et al. [20,21]
Mount Meager was investigated in the 1970s for its geothermal potential [22,23], and interest in it as a power source has recently increased due to Canada’s national commitment to achieve carbon neutrality by 2050, accompanied by new mapping and drilling programs [24]. A run-of-the-river hydropower generation plant was recently constructed on Lillooet River on the east flank of Mount Meager, which could potentially be affected by future landslides [25].
Moreover, Mount Meager is an important case study for long-term sediment transfers linked to large landslides, which provides context for the paraglacial sediment paradigm [26,27,28]. Friele and Clague [28] advocated a modification of the classic paraglacial paradigm at Mount Meager due to the recurrent instantaneous delivery of large volumes of sediment into the Lillooet River watershed. Some years later, Northwest Hydraulic Consultants [29] performed a study of sediment remobilization between Meager Creek and Lillooet River following and resulting from the very large (50 × 106 m3) 2010 Mount Meager landslide and in consideration of a possible increase in flood risk to downstream communities. The landslide was triggered during a summer heatwave and rapidly progressed from the collapse of the south flank of Mt. Meager to a fast (>270 km/h), long-runout debris avalanche [30]. The landslide temporarily dammed Meager Creek (19 h) and Lillooet River (2 h), triggering the evacuation of the downstream community for fear of a possible failure of the landslide dam and consequent flood wave.
This paper presents a detailed analysis of the geomorphic evolution of the 2010 Mount Meager landslide deposit along lower Meager Creek over the 10-year period ending in 2019. The study is based on the application of geomatic techniques to gain an in-depth view of sediment mobilization and redeposition triggered by the 2010 landslide. By analyzing DEMs created from orthophotos acquired through conventional aerial flights, unmanned aerial vehicles (UAVs), and Global Navigation Satellite System (GNSS) surveys, including datasets obtained immediately before the 2010 Mount Meager landslide, we created static and dynamic versions of aerial geomorphic change that illustrate the evolution of the landscape impacted by the event. Additionally, we estimated sediment volumes eroded and redeposited within the landslide area, as well as volumes exported from the area by the Lillooet River. This study presents a novel analysis of landslide deposit erosion and remobilization, contributing to the understanding of how landslide sediments may affect fluvial systems and associated flood hazards.
1.1. The 2010 Mount Meager Landslide
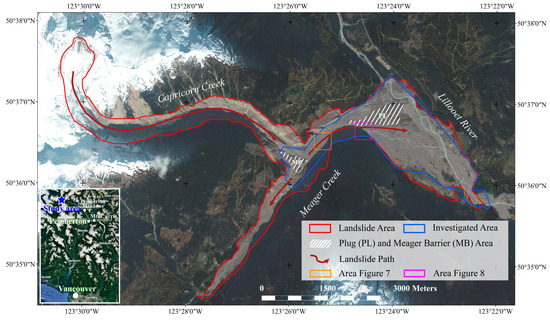
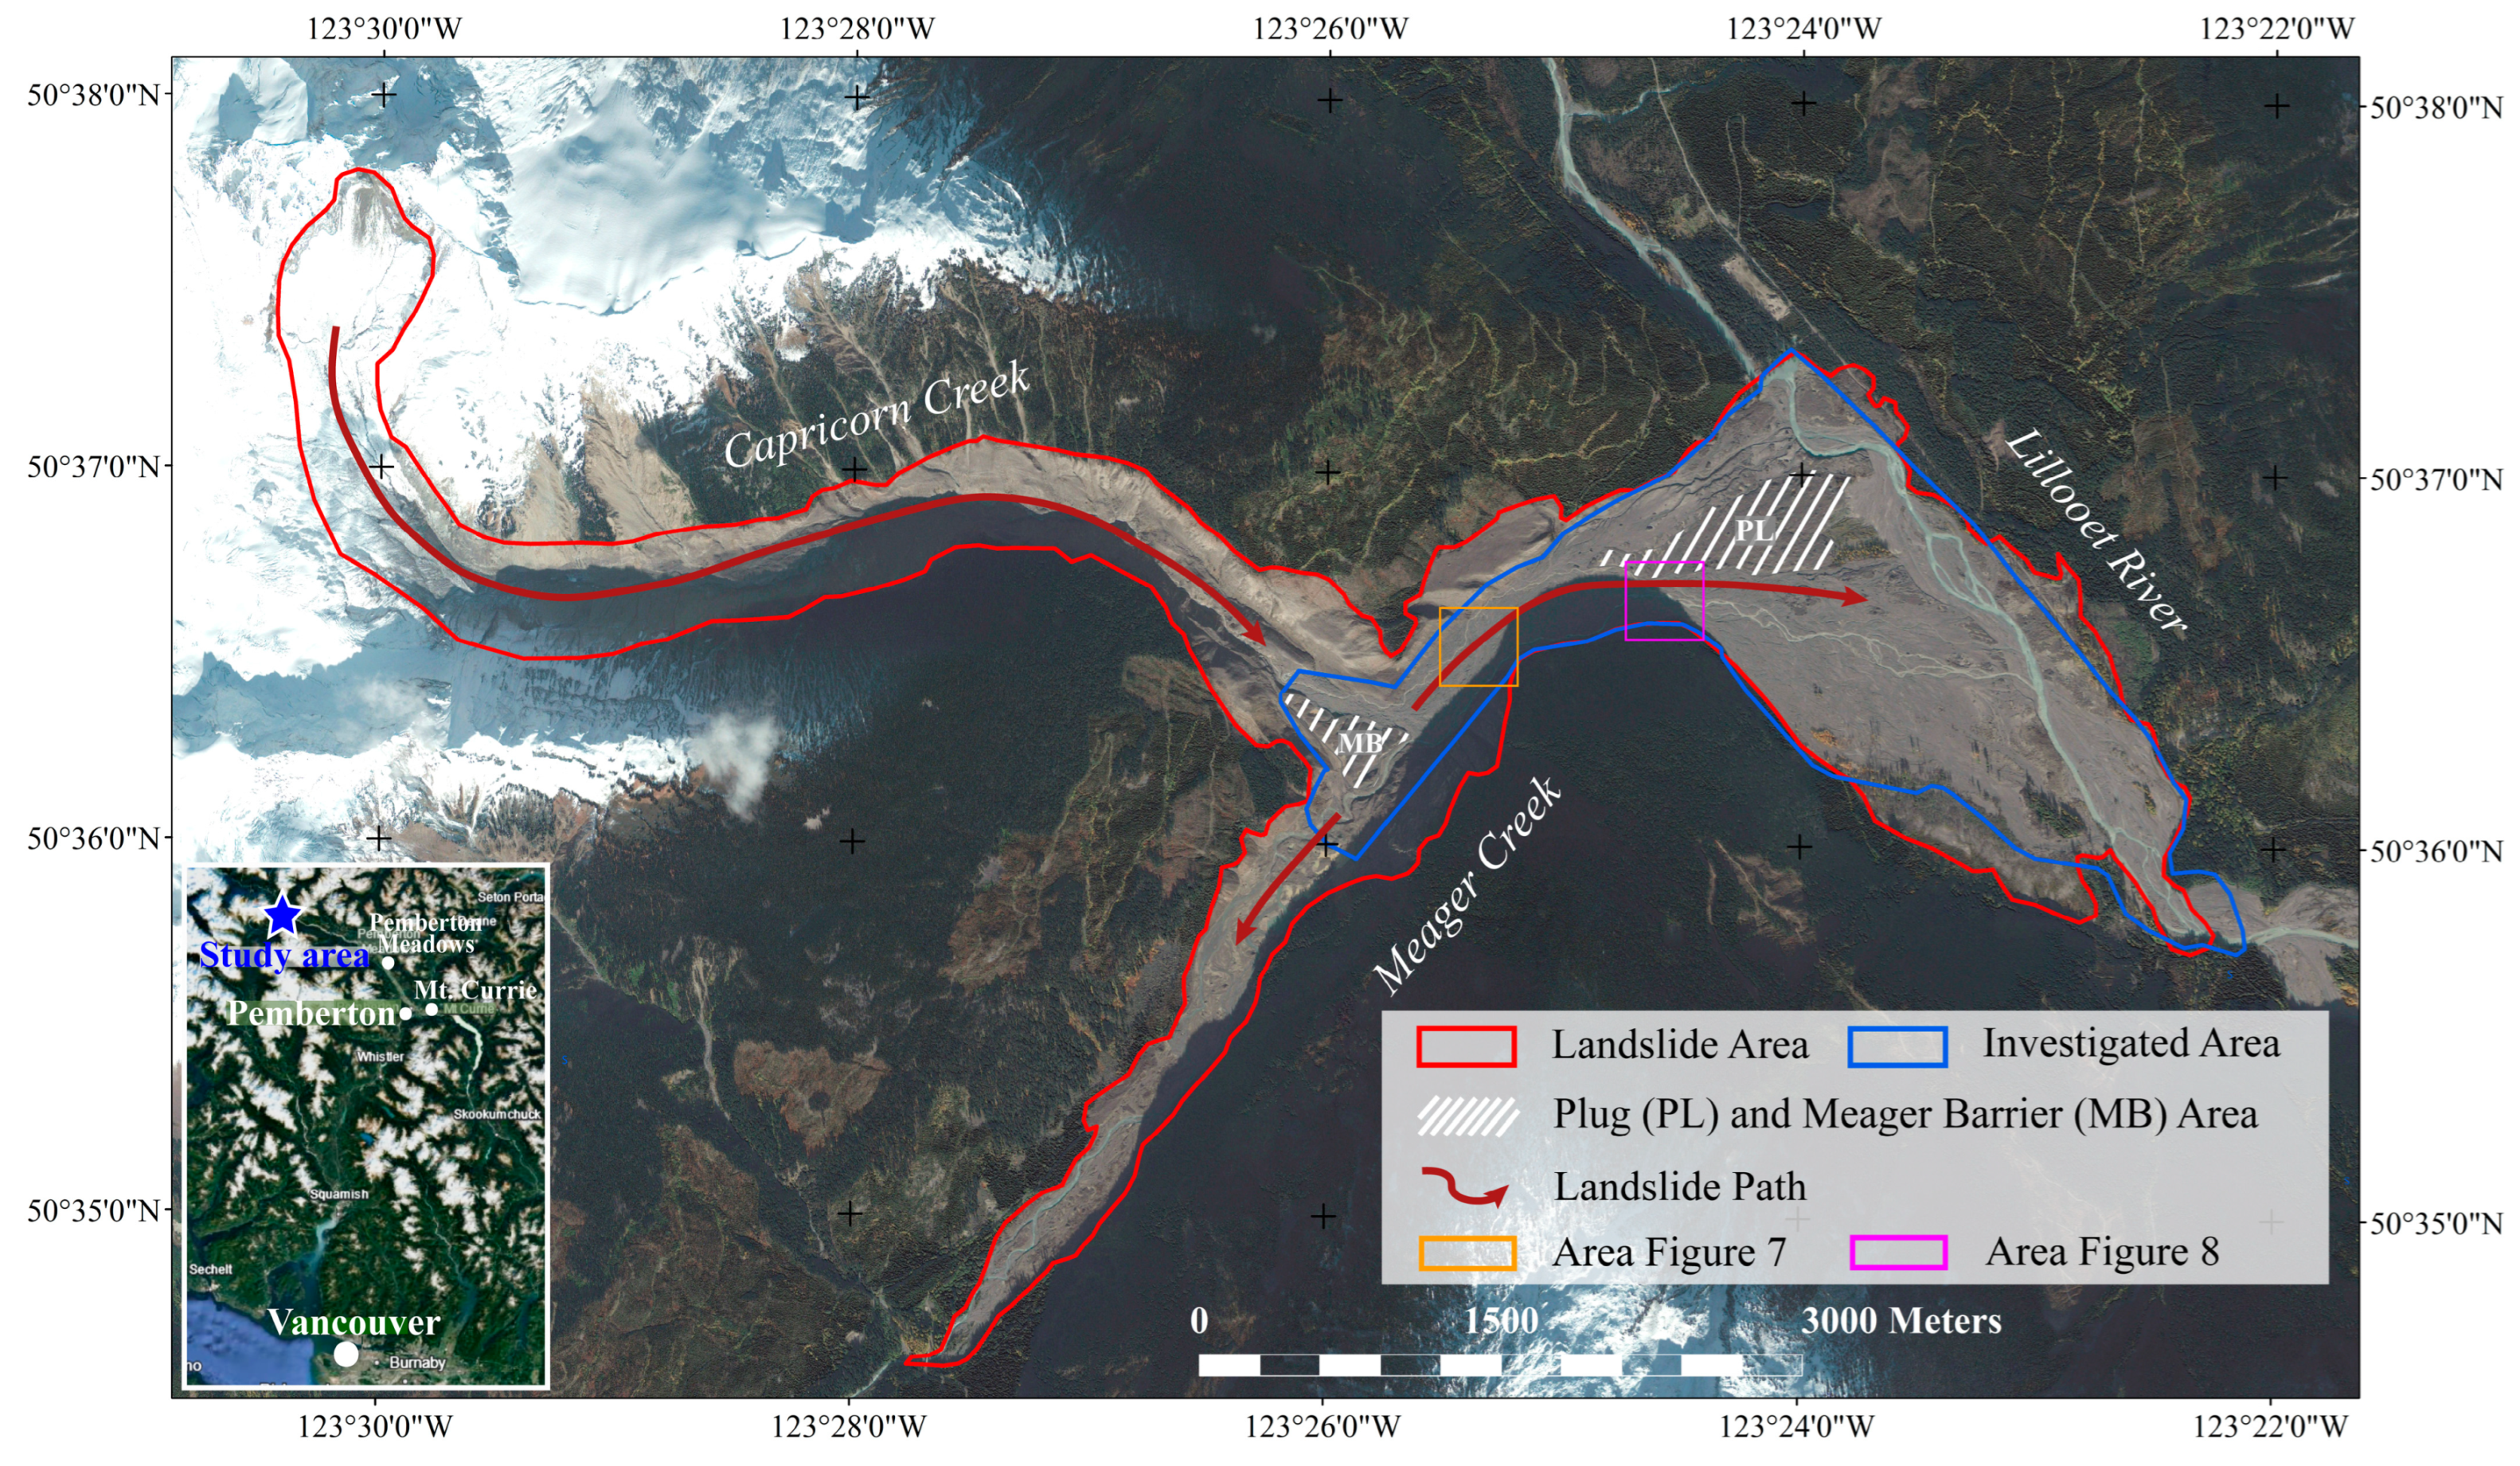
On 6 August 2010, the unstable, hydrothermally altered south flank of Mount Meager (2554 m a.s.l.) collapsed, producing a long-runout debris avalanche that delivered 50 × 106 m3 of blocky-to-clayey debris to the river system draining the volcano (Figure 1). The collapse was triggered by snow and ice melting during hot summer weather; however, the slope had been slowly deforming since at least 1947 [20]. The landslide traveled 12.7 km down the Capricorn and Meager Creeks over a vertical elevation range of 2183 m. The travel angle from source to toe was 9.75° [18]. The landslide dammed Meager Creek for 19 h, impounding a lake with about 2.9 × 10⁶ m3 of water before draining [18].
Figure 1.
Area and path of the 2010 Mount Meager landslide.
It also briefly dammed Lillooet River at the mouth of the Meager Creek. Downstream communities (Pemberton and Pemberton Meadows) were evacuated due to the possible flood hazard associated with the breaching of the landslide dams, but fortunately, the flood wave was contained by the constructed levees in Pemberton Valley. However, landslide sediments are still being reworked and carried downstream, reducing the channel capacity of the Lillooet River and increasing the likelihood of future flooding in Pemberton and Mount Currie [29].
1.2. Description of the Landslide Deposit
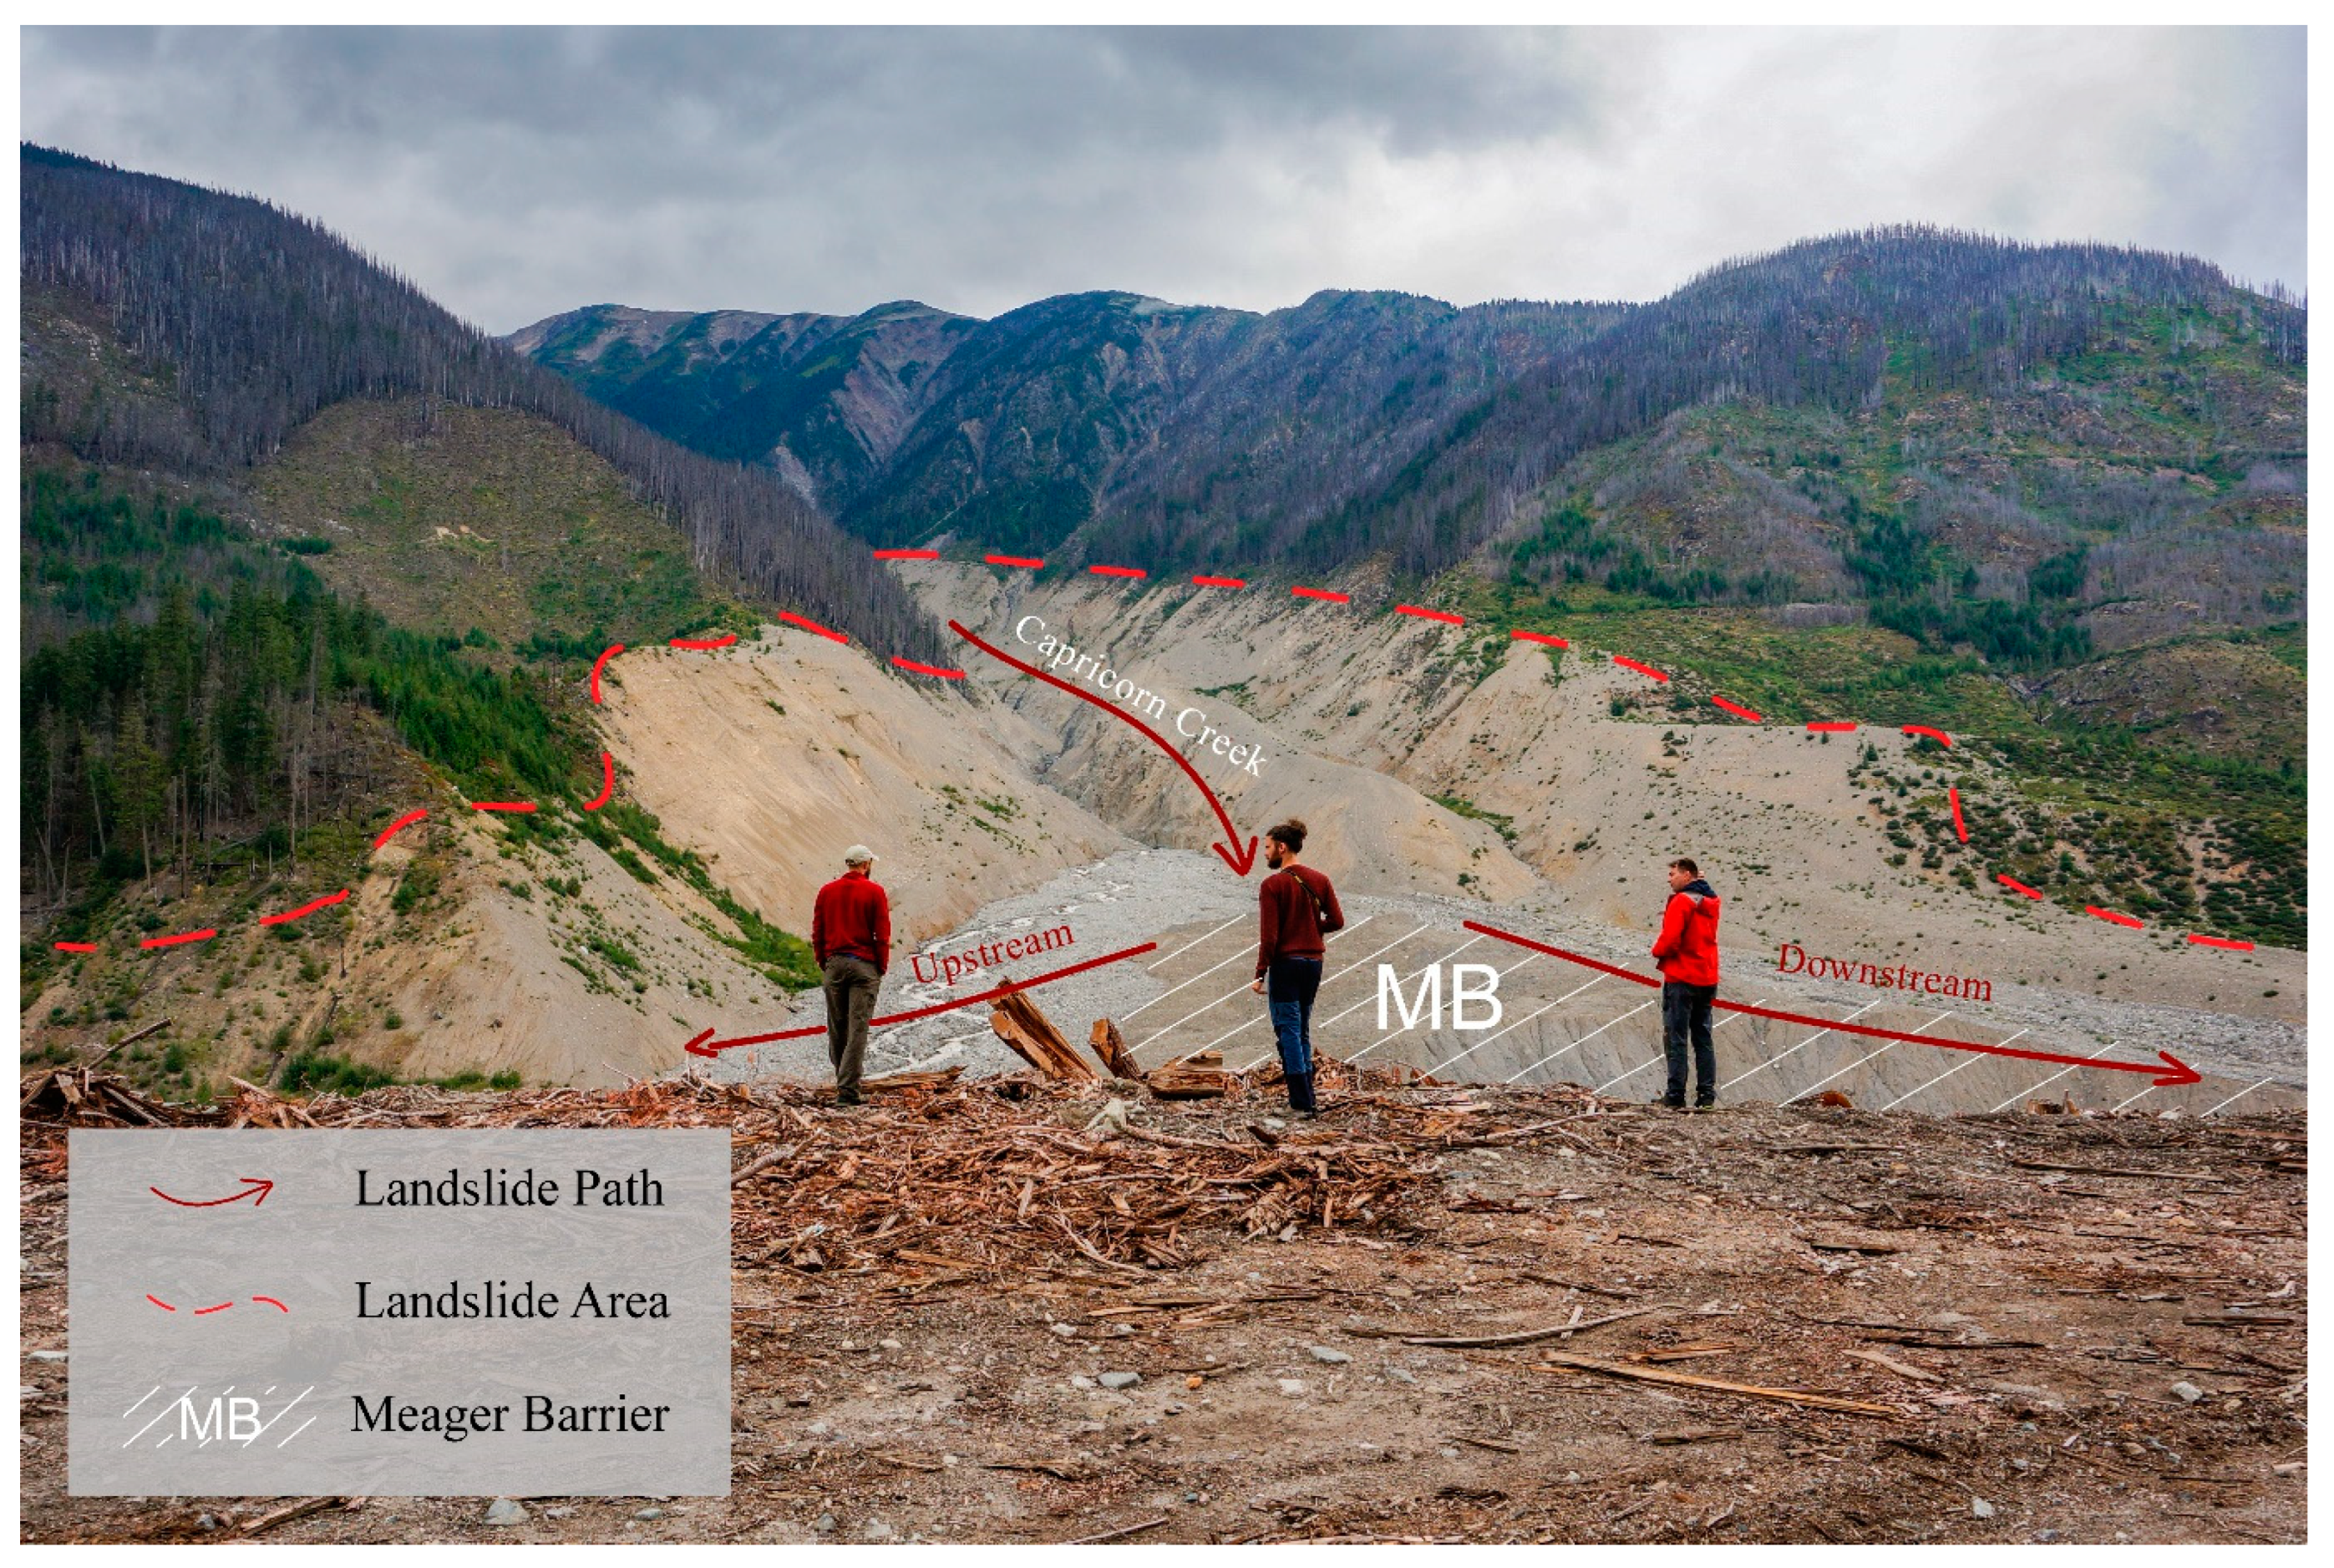
The 2010 Mount Meager landslide deposit has been described in detail by Roberti et al. [30] and thus is only briefly reviewed here. These authors subdivided the deposit into five main areas: (1) the Meager Creek barrier at the mouth of Capricorn Creek, (2) the ‘plug’, (3) the ‘terrace’, (4) the distal area upstream of the confluence of Meager and Capricorn creeks, and (5) the distal area downstream of Capricorn Creek to Lillooet River (Figure 1). In this study, we focused on two of the five areas that hosted the bulk of the landslide deposits and where subsequent reworking of the deposit has occurred: the Meager Creek barrier (MB in Figure 1 and Figure 2) and the plug (PL in Figure 1).
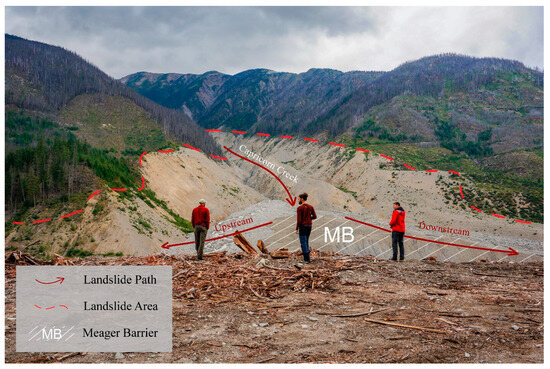
Figure 2.
View to the northwest near the confluence of Capricorn and Meager creeks; Meager Creek barrier (MB) in the foreground. Part of the landslide travelled up Meager Creek (left side of image), but most of it travelled down Meager Creek to Lillooet River.
The landslide achieved its peak velocity when it reached the mouth of Capricorn Creek [31]. There, it struck the rising valley slope bordering Meager Creek on the southeast and ran 270 m up it. The flow split into two lobes, one of which traveled southwest up Meager Creek, and the other downvalley to Lillooet River. It left a hummocky deposit up to 10 m thick at the mouth of Capricorn Creek that created a dam blocking Meager Creek. The deposit downvalley of the barrier consists of compressional ridges formed of mixed debris and large gray blocks. The water rose rapidly behind the barrier; upon overtopping it, it rapidly incised the debris dam at the mouth of Capricorn Creek and spread the reworked debris downstream [32].
The landslide deposited most of its material as it was losing energy just above Lillooet River (the plug in Figure 1). Here, the landslide deposit is a multi-meter-thick body of debris characterized by hummocky topography, blocks up to 7 m high, and compressional and transcurrent ridges and depressions [18,30]. When the barrier dam at the mouth of Capricorn Creek breached, the escaping waters reworked part of the landslide deposit in lower Meager Creek, leaving deep channels at the north edge of the deposit. Meager Creek is currently eroding the south edge of the plug, leaving a tall, rapidly retrogressing scarp.
2. Materials and Methods
2.1. Dataset Availability
This study was developed based on comparisons between existing data and data collected in the field specifically for the project. Some data in the literature were used previously to carry out the first studies on the 2010 landslide (Table 1). The first data product of relevance is a GeoEye image collected by the Province of BC in July 2010 in the area at the confluence of Meager Creek and Lillooet River. A pair of GeoEye stereo satellite images dating to 2012 were subsequently used to obtain a DEM and an orthophoto [18]. Additional data collected over the years since the landslide include: (1) 2011 helicopter orthophotos and a DEM generated from photogrammetry, with partial coverage of the study area [30], (2) a 2012 orthophoto and a DEM (Province of BC), and (3) a 2015 Province of BC Lidar DEM.
Table 1.
Dataset used in this study.
2.2. 2019 UAV Survey
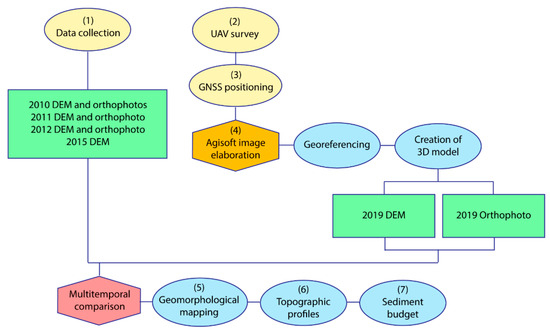
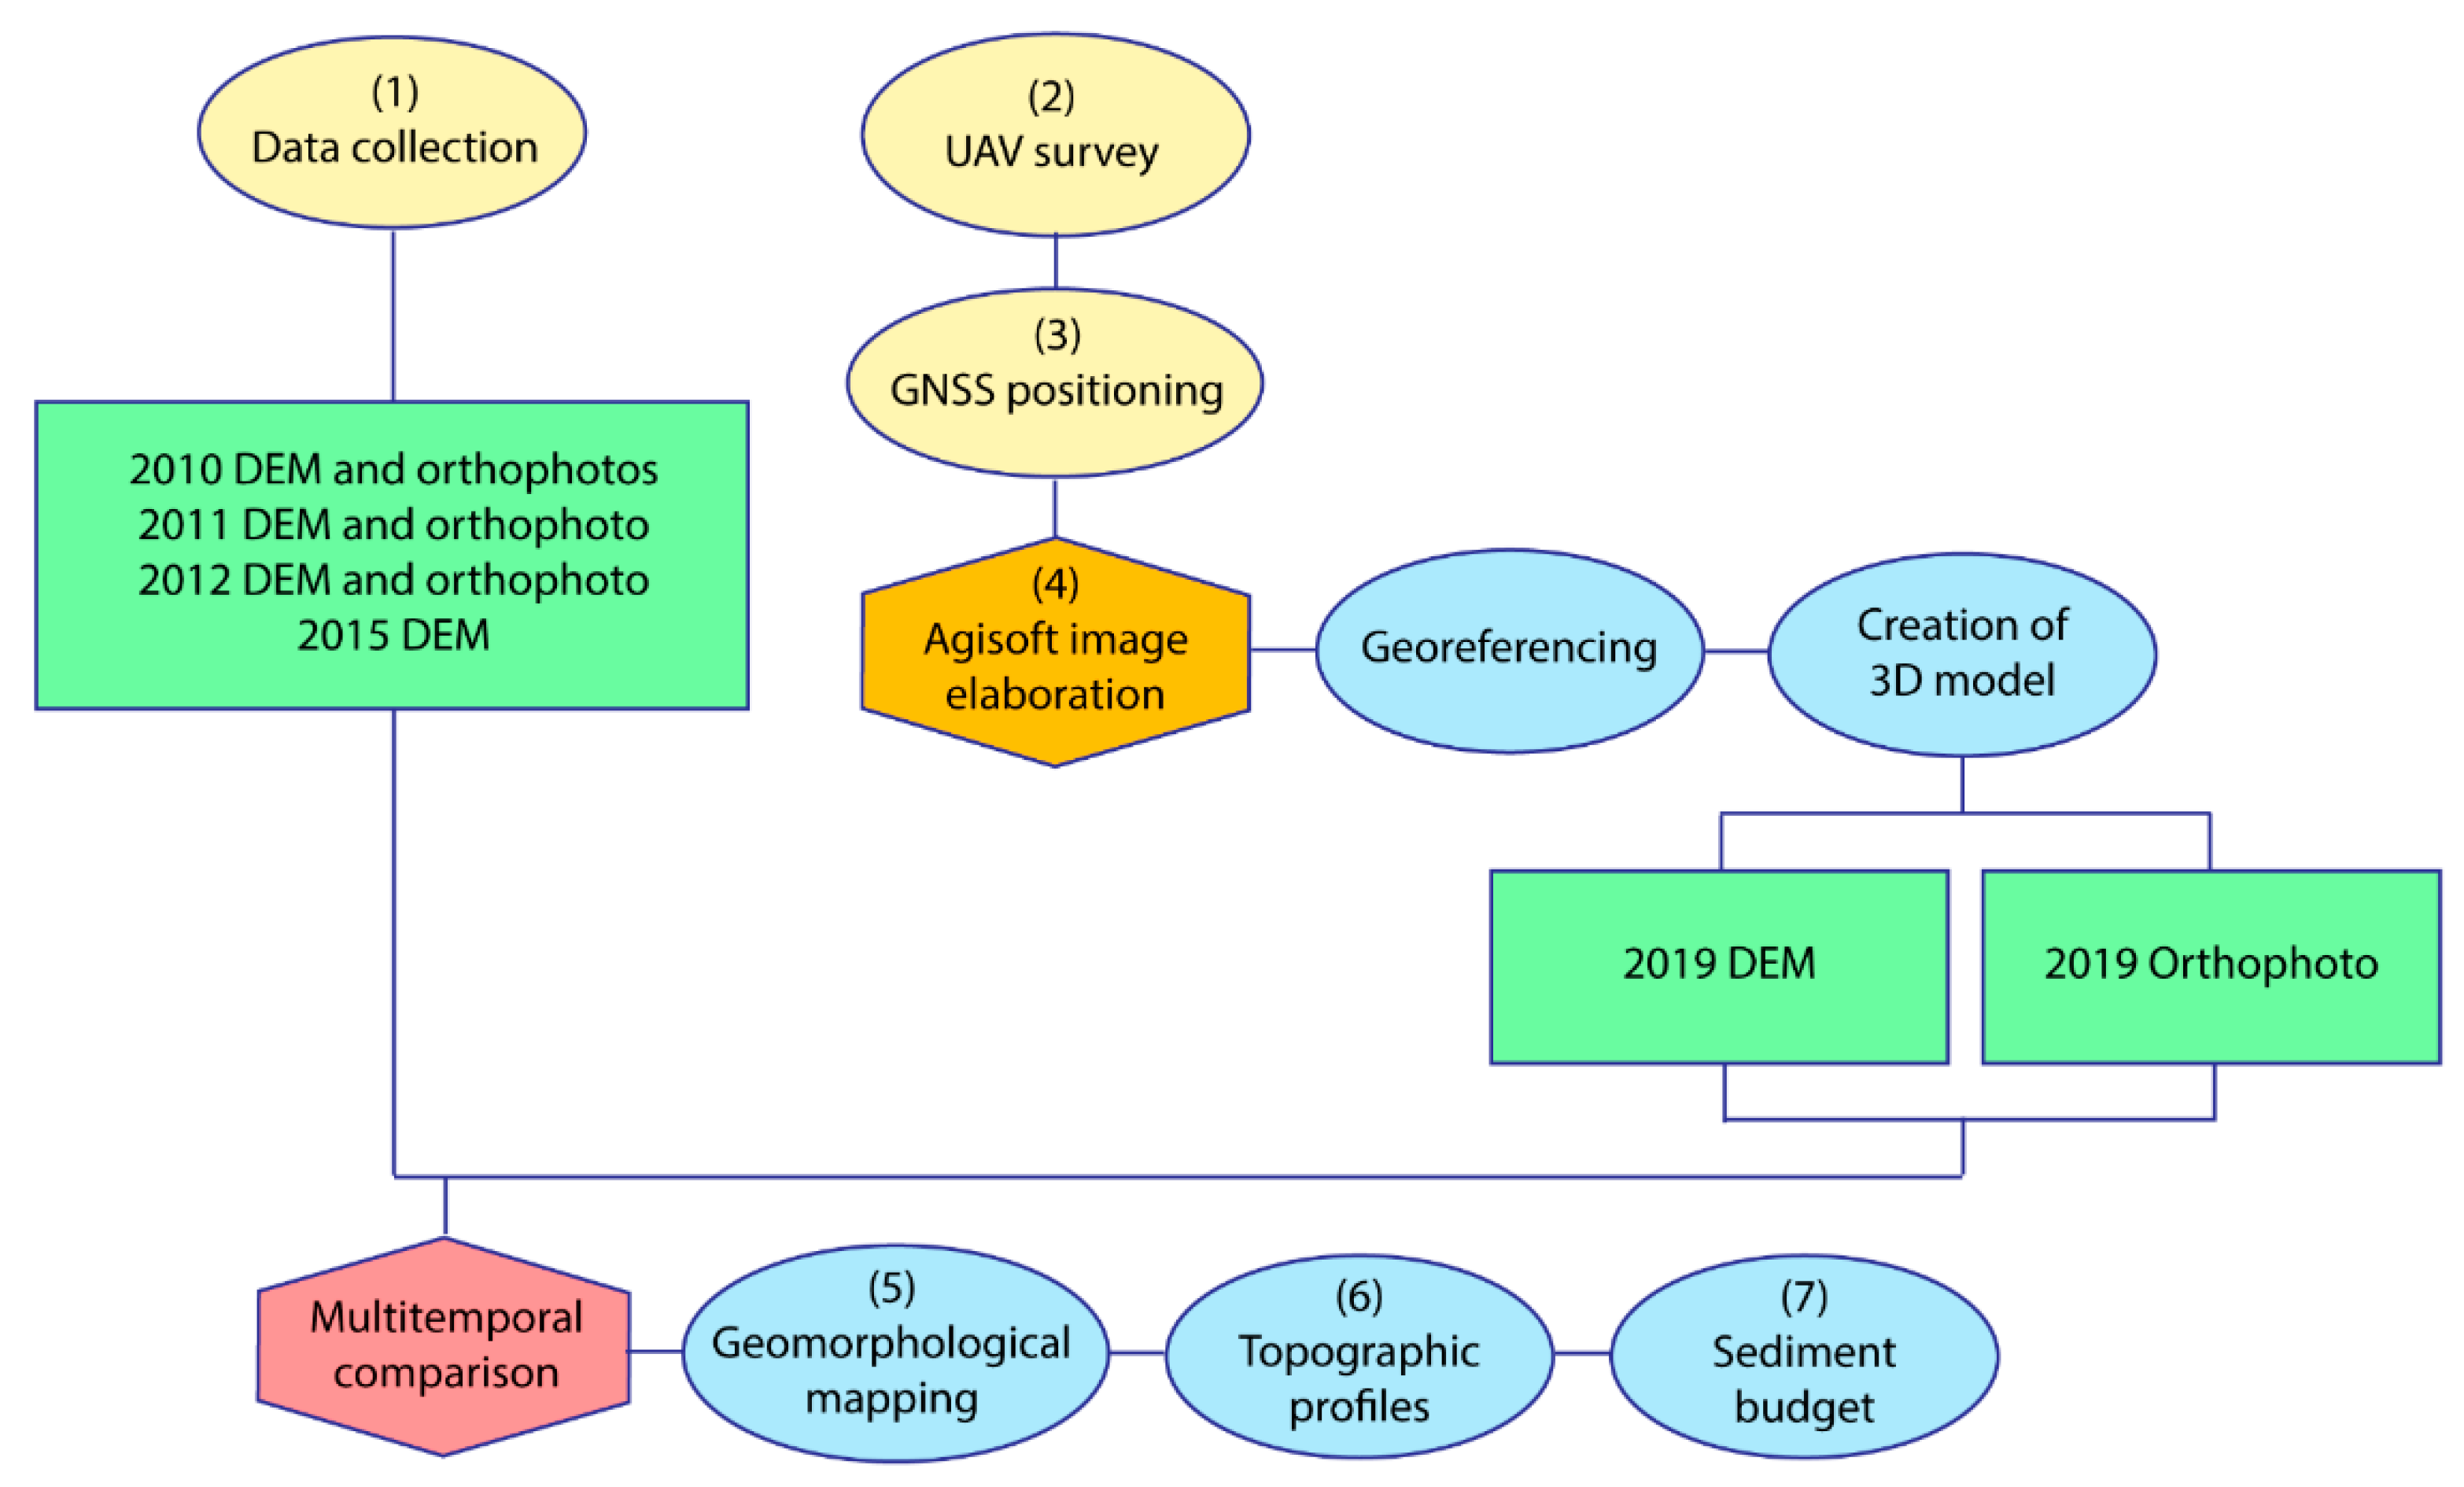
The research workflow for this study included the use of UAVs, GNSS, and satellite images (Figure 3). We first reviewed available orthophotos and DEMs, planned a UAV survey to create up-to-date base maps, and carried out a GNSS campaign to georeference the UAV products. Next, we processed the UAV images with Agisoft Metashape [33] in order to create orthophotos and a Digital Surface Model (DSM). Finally, we mapped geomorphic features, created and compared multi-temporal topographic profiles, and performed sediment budget volume calculations based on DEM differencing. There is no vegetation within the landslide area; therefore, the surface model matches the terrain model. For this reason, all DSMs are generically called DEMs.
Figure 3.
Workflow summarizing research procedures used in this study. The yellow ellipses are data collection activities; the orange hexagon is the SfM elaboration; light-blue ellipses are singular data processing and analysis steps; green rectangles are cartographic products; and the red hexagon is the multi-temporal comparison of the entire dataset. The numbers indicate the sequence of steps.
Three different UAVs were used to survey the study area in 2019 (Table 2). Seventeen flight paths at a height from 110 m to 120 m above the ground were planned and executed using the PIX4D Capture app [34]. The UAVs captured 4164 photos over a total travel distance of 116,978 m, with 80% front overlap and 70% side overlap. The photos were processed using the SfM photogrammetric technique [35] in Agisoft Metashape [33].
Table 2.
UAVs used in the study.
To georeference the SfM models and create high-precision DEMs and orthophotos, we completed a differential GNSS campaign using two Topcon HiPer Lite geodetic receivers and the post-processing static method [36]. We placed 25 targets within the study area that were clearly visible in the UAV images and collected their precise locations (0.2 m mean accuracy). Locations of the points were calculated in ITRF2000 (NAD 83) Epoch 2010.0 and provided in the UTM10N adjusted grid. All elevation values were referenced to the orthometric (above sea level) reference level; the mean error of the calculated points is 0.01 m. The target points were identified in the SfM-generated models and used as Ground Control Points (GCPs) to improve the accuracy of the model in indirect georeferencing [37]. They also were used as checkpoints (CPs) to check the spatial accuracy of the model. Accuracies of the SfM model within the 2 km2 study area are about 5 cm (GCPs) and 15 cm (CPs). The final products generated from the SfM model are a DEM with a resolution of 18 cm and an orthophoto with a pixel size of 4 cm. We used the 2019 orthophoto as the base map for geomorphic mapping and the corresponding DEM to generate topographic profiles and perform multi-temporal volumetric analysis.
2.3. Multi-Temporal Digital Elevation Model (DEM) Analysis
We investigated changes within the landslide runout area and estimated landslide sediment volumes mobilized in the decade following the landslide by creating and comparing precisely located topographic profiles on DEMs. Calculations of mobilized sediment volume were performed with a DEM difference (DoD) application in a GIS [38]. Differences between DEMs show elevation changes, with negative values indicating net erosion and positive values indicating net deposition [39]. We determined what we consider to be the most relevant changes in DoD by calculating a Level of Detection (LoD). The LoD equation is derived from error propagation theory and yields a value that delimits a threshold below which elevation changes are unreliable [40,41,42,43]. The LoD equation we used [40] is:
where tcrit is the value corresponding to the confidence interval (in this study, 95% corresponds to a tcrit of 1.96), δ1 is the error of the older DEM, and δ2 is the error of the newer DEM. DoD analysis was performed by comparing the 2015 DEM with the 2019 DEM, which are the two DEMs with the highest resolution available for our study.
LoD = tcrit √(δ12 + δ22)
3. Results
3.1. Volumetric Analysis
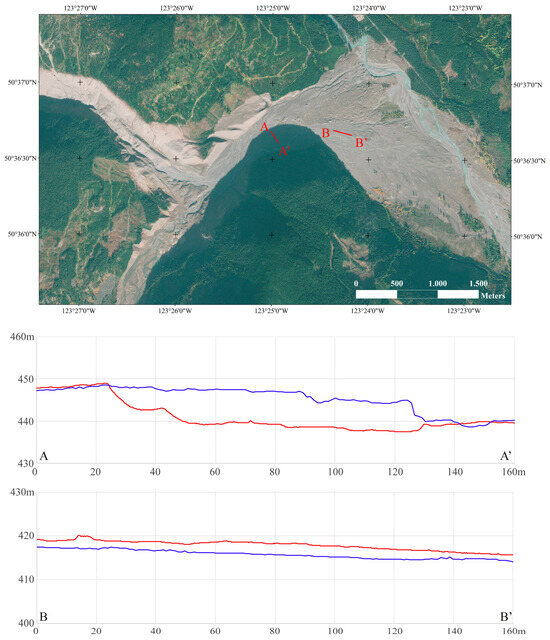
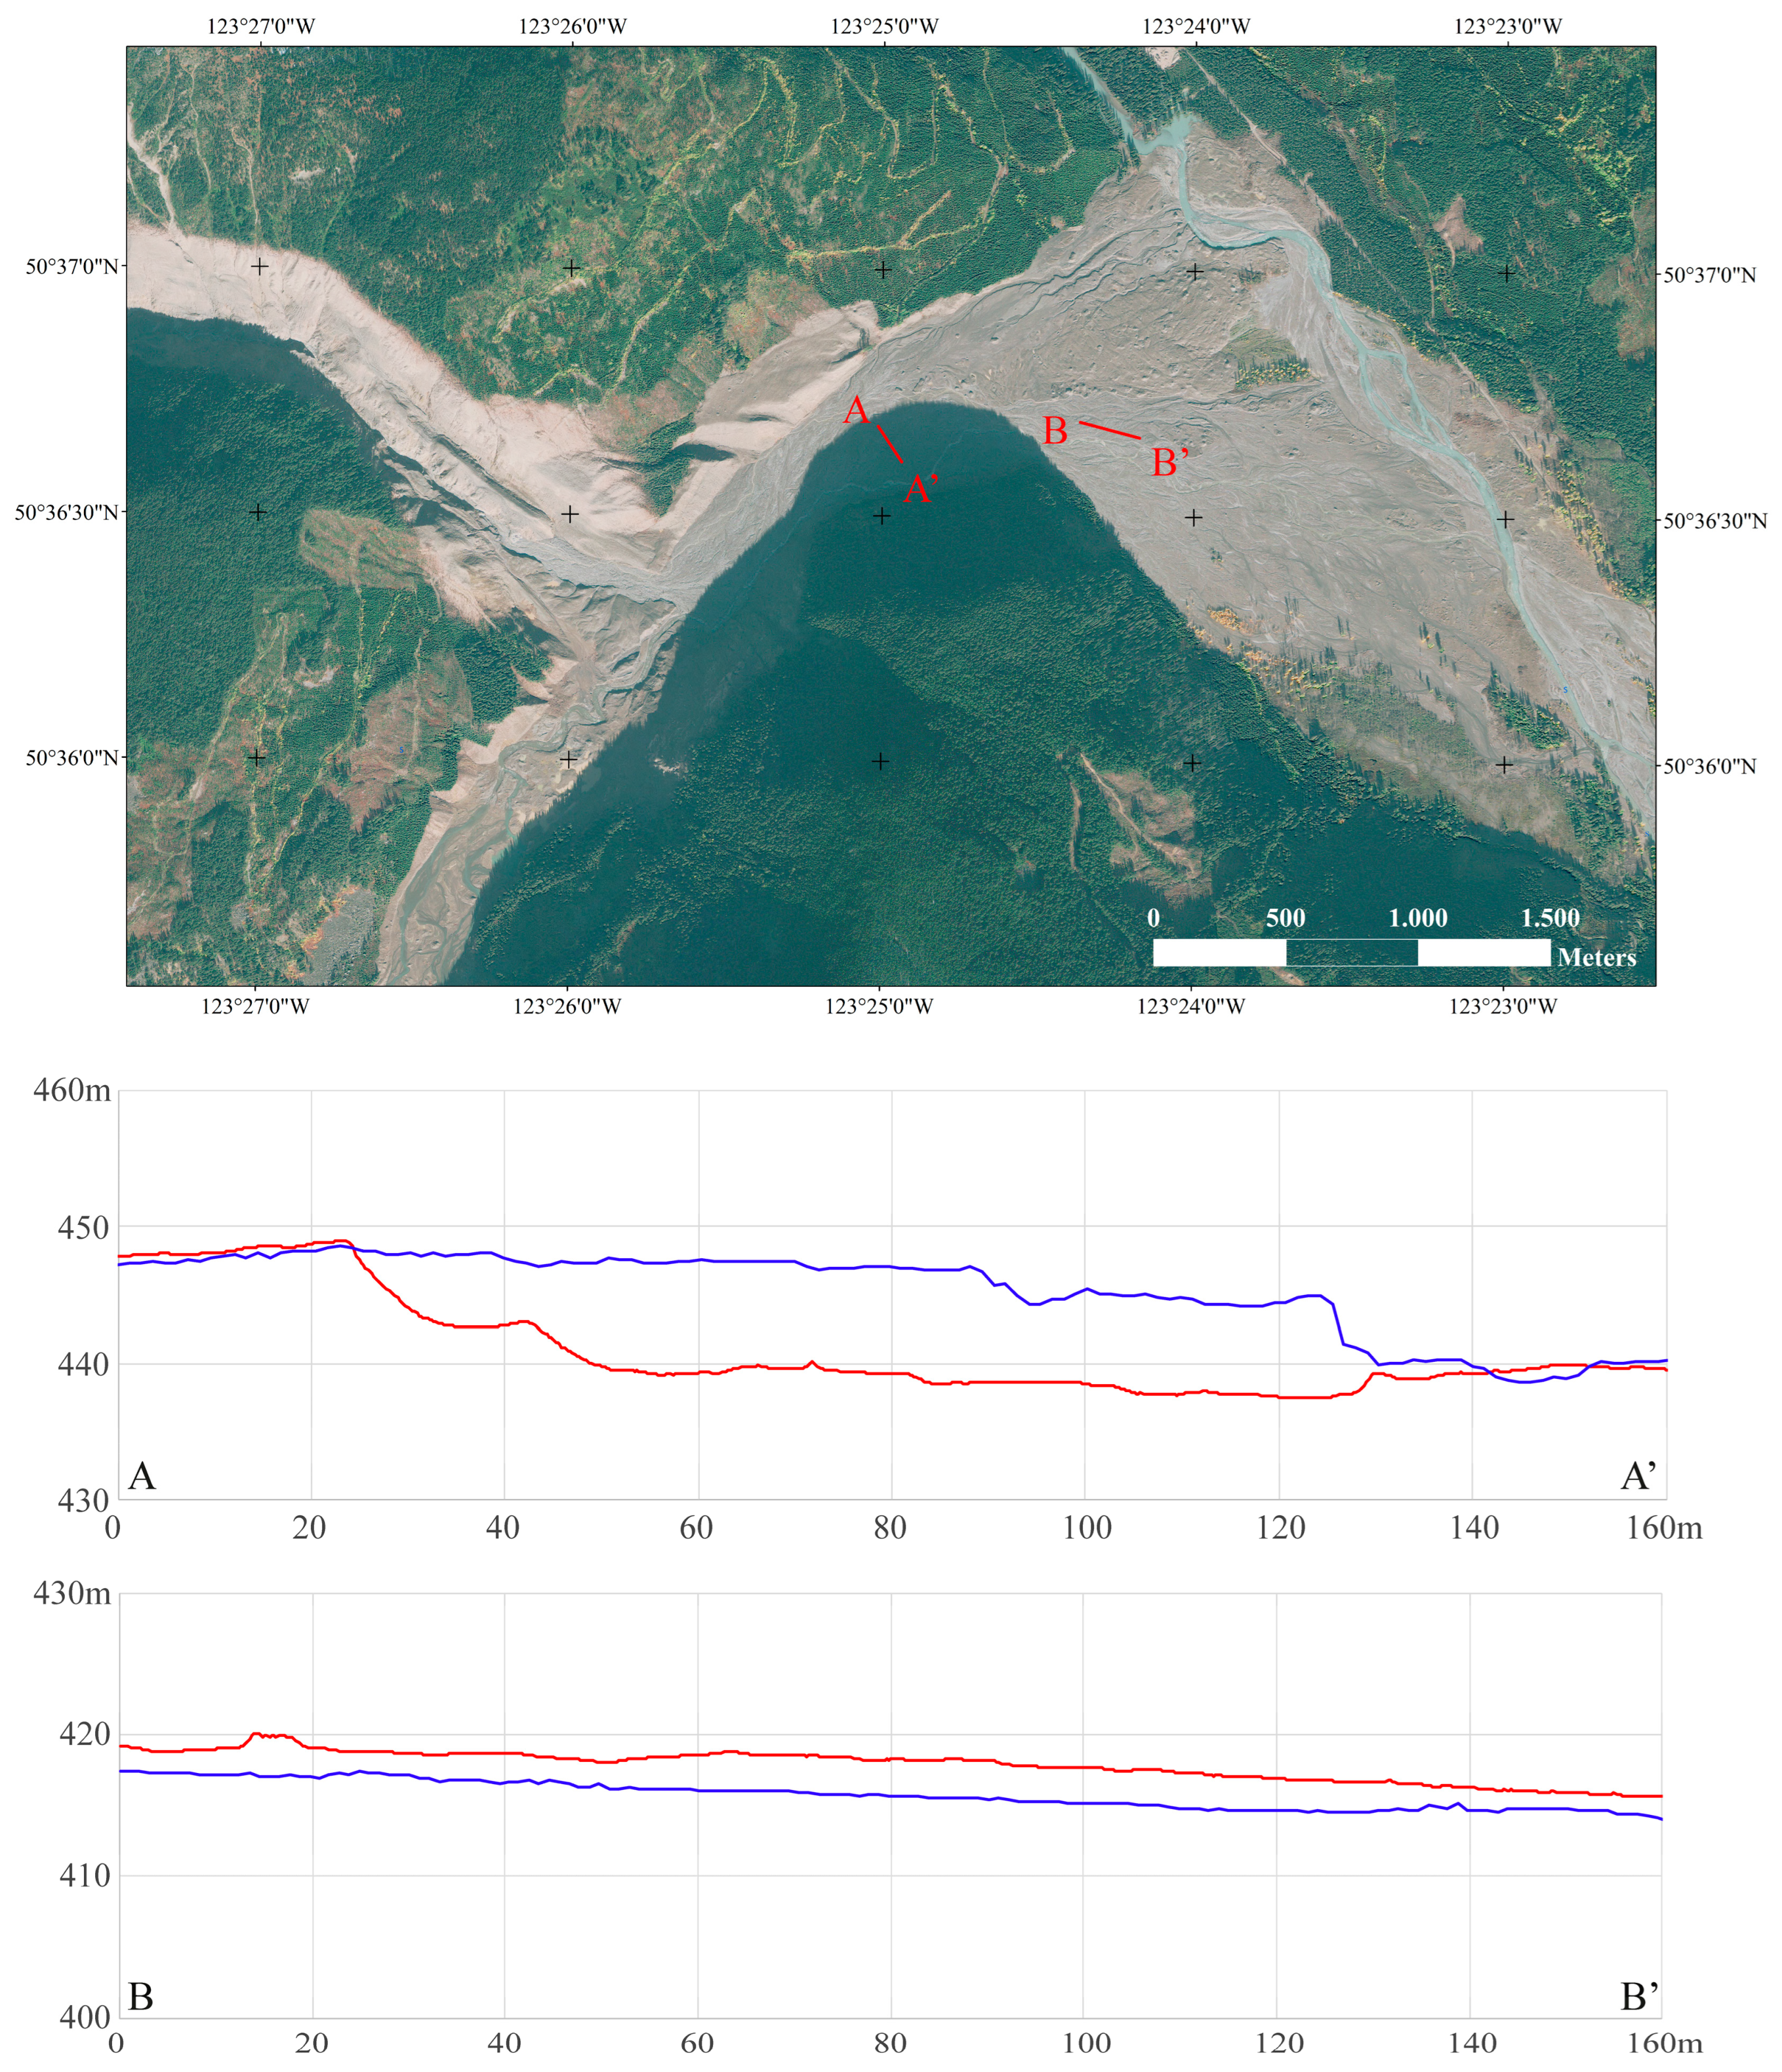
In order to understand the volumetric changes, two topographic profiles were established in two separate sectors: one along the major scarp in the area, located along Meager Creek about 1 km east of the barrier (A-A′ in Figure 4) and the other farther downstream along the plain south of the plug (B-B′ in Figure 4). The two sectors were chosen because qualitatively their morphology showed an erosional system in the first case and a depositional system in the second. Multi-temporal quantitative analysis of the cross-section A-A’ (Figure 4) shows 100 m of horizontal erosion of a scarp from 2015 to 2019. In contrast, cross-section B-B’ (Figure 4), which is within an area characterized by deposition, shows an increase in elevation of up to 4 m along the profile line.
Figure 4.
Topographic profiles in lower Meager Creek Valley, showing surface elevations in 2015 (blue), and 2019 (red). Erosion has occurred along profile A-A′. Profile B-B′ shows accumulation over the survey period.
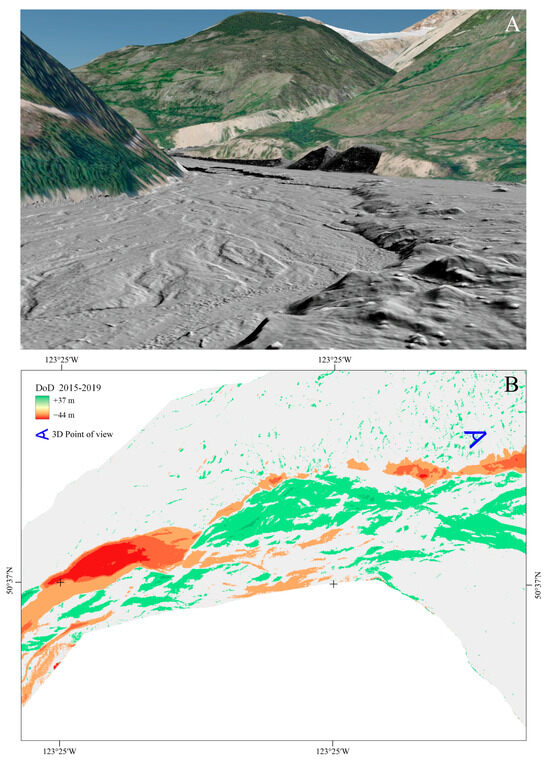
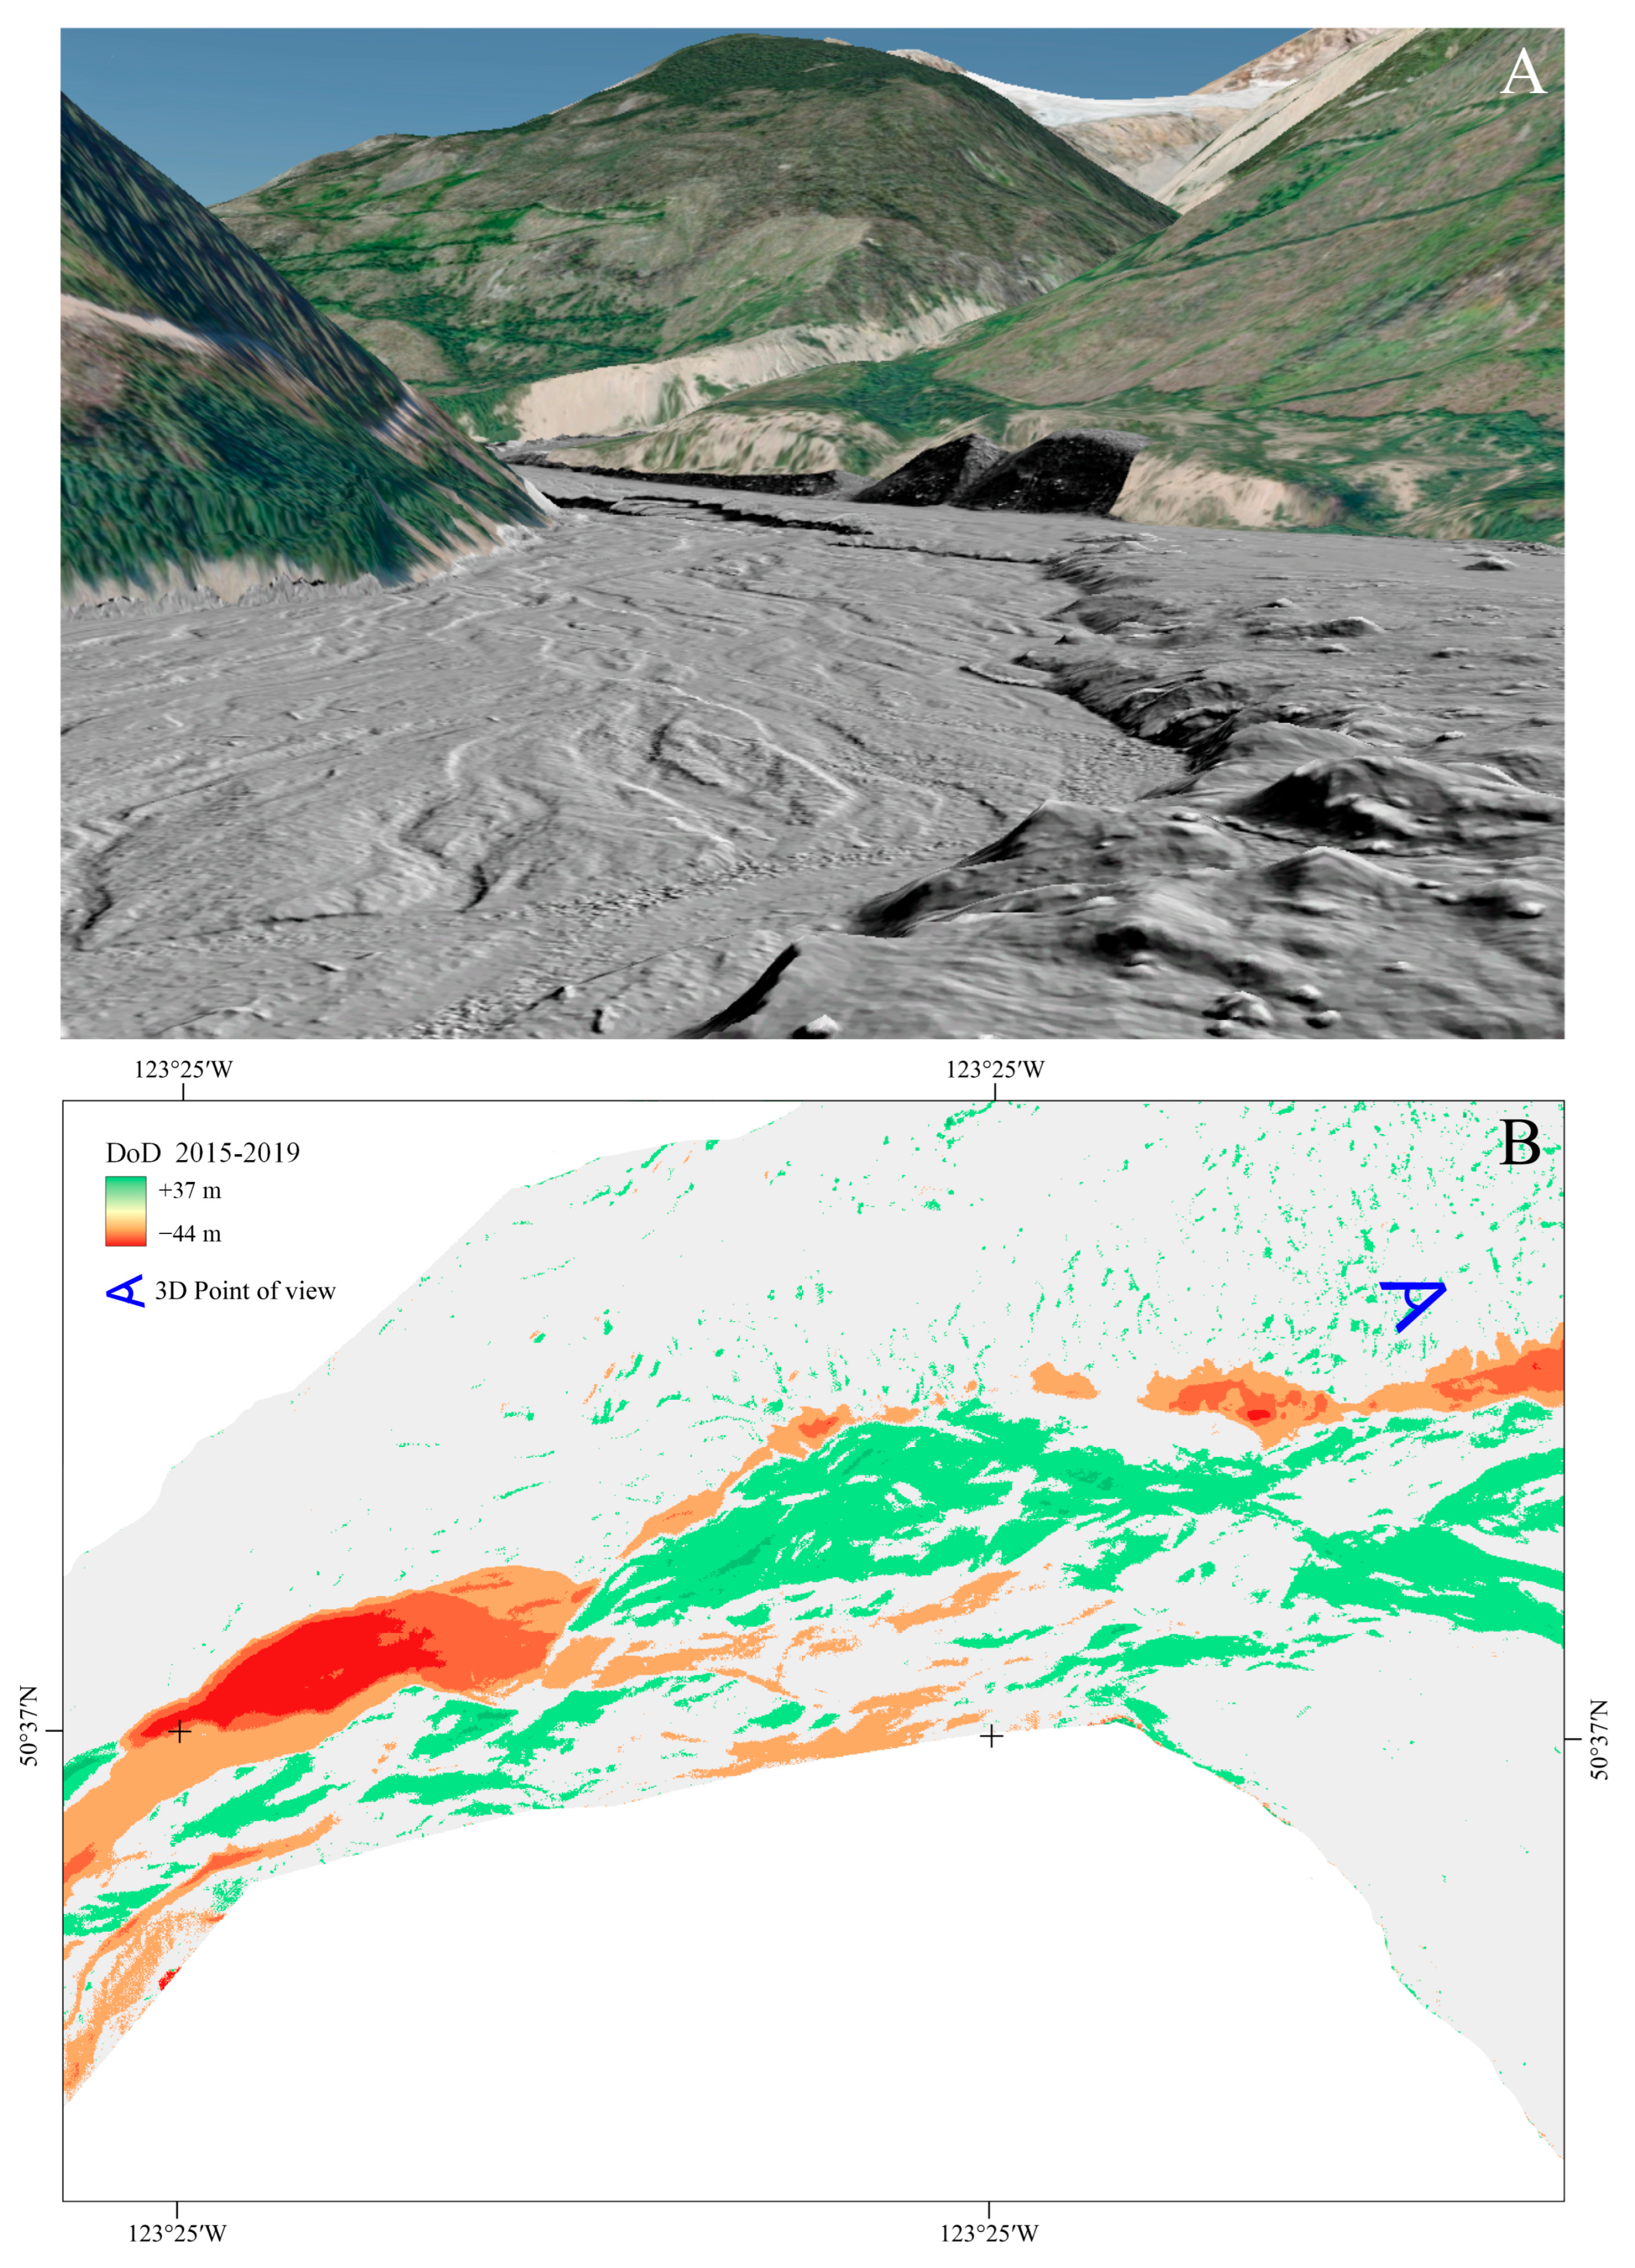
The two profiles in Figure 4 provide only limited views of erosion and deposition over the survey area. Thus, to better understand and display the pattern over the entire study area, we performed a DoD analysis on the two datasets with the best resolution: the 2015 and 2019 DEMs. In Figure 5, we show a comparison between the 2019 DEM (hillshade view) and the DoD. The figure reveals areas dominated by erosion and areas where there has been net deposition.
Figure 5.
(A) 3D view of the 2019 DEM (hillshade view), providing a better understanding of the study area landscape. (B) DoD created by subtraction of the 2015 and 2019 DEMs. Areas of erosion are shown in red, and deposition is indicated in green. The blue symbol at the upper right corner of (B) indicates the viewpoint and direction of (A).
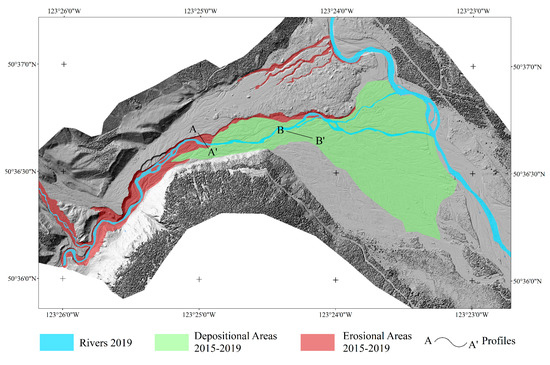
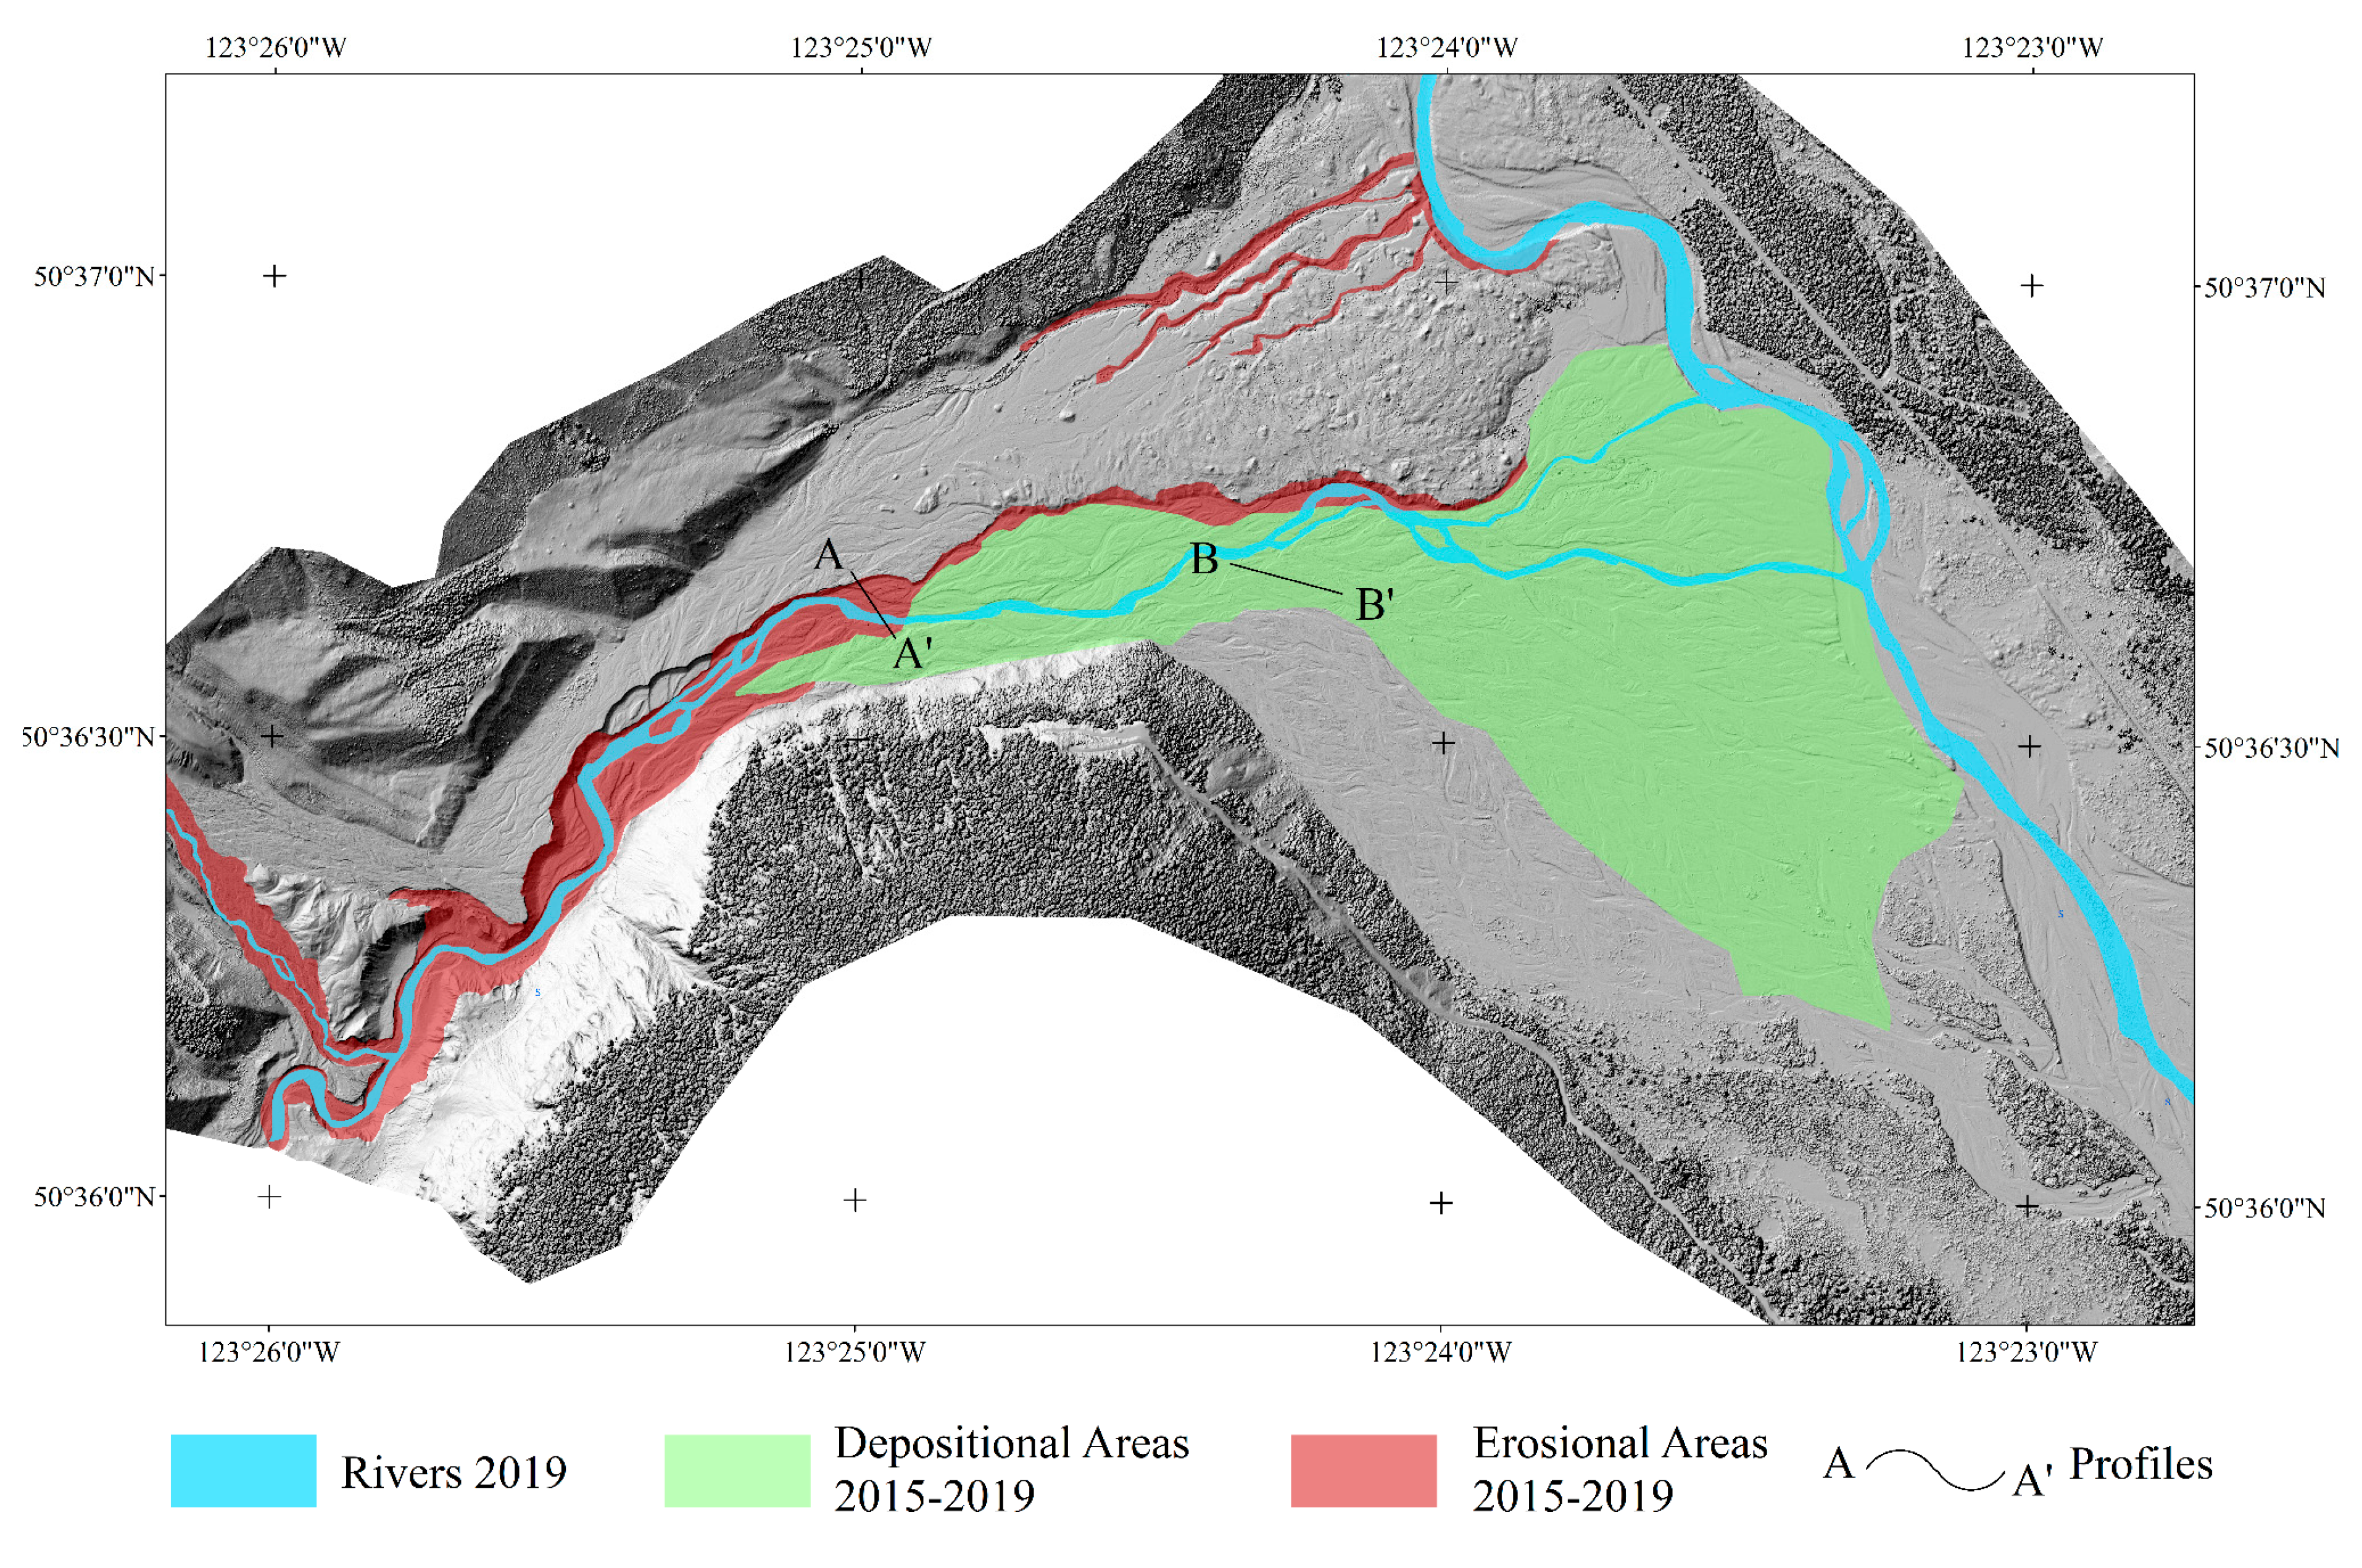
In order to better understand the contours of the depositional and erosional areas, a cut-and-fill map was created at a pixel resolution of 1 m and is shown in Figure 6.
Figure 6.
Areas of erosion and deposition along lower Meager Creek between 2015 and 2019. The detailed description of depositional and erosional areas is described in detail in the following paragraphs (Section 3.2) and Figure 7 and Figure 8.
The level of detection (LoD) of the two DEMS, calculated using Equation (1), is 0.1 m (Table 3).
Table 3.
Error and level of detection of the two DEMs used in the volumetric calculations.
The DoD analysis revealed considerable geomorphic change, with elevation differences between the two DEMs ranging from −44 m to +37 m (the highest positive values, however, are considered ‘noise’, reflecting the growth of trees in wooded areas). The net sediment budget for the study area over the period 2015–2019 is summarized in Table 4.
Table 4.
Volume of sediment mobilized during the period 2015–2019.
3.2. Multi-Temporal Orthophoto Analysis and Geomorphic Mapping
By comparing all datasets in a GIS environment, it was possible to create a geomorphic map that depicts landforms on a yearly to multi-annual timescale between 2010 and 2019. The purpose of this exercise was to determine and depict the changes and evolution of the landslide runout area over timescales of six months to five years, principally due to erosion and redeposition of the landslide debris by Meager Creek and Lillooet River. The following subsections summarize these changes, starting in 2010 and ending in 2019.
3.2.1. 2010 before the Landslide
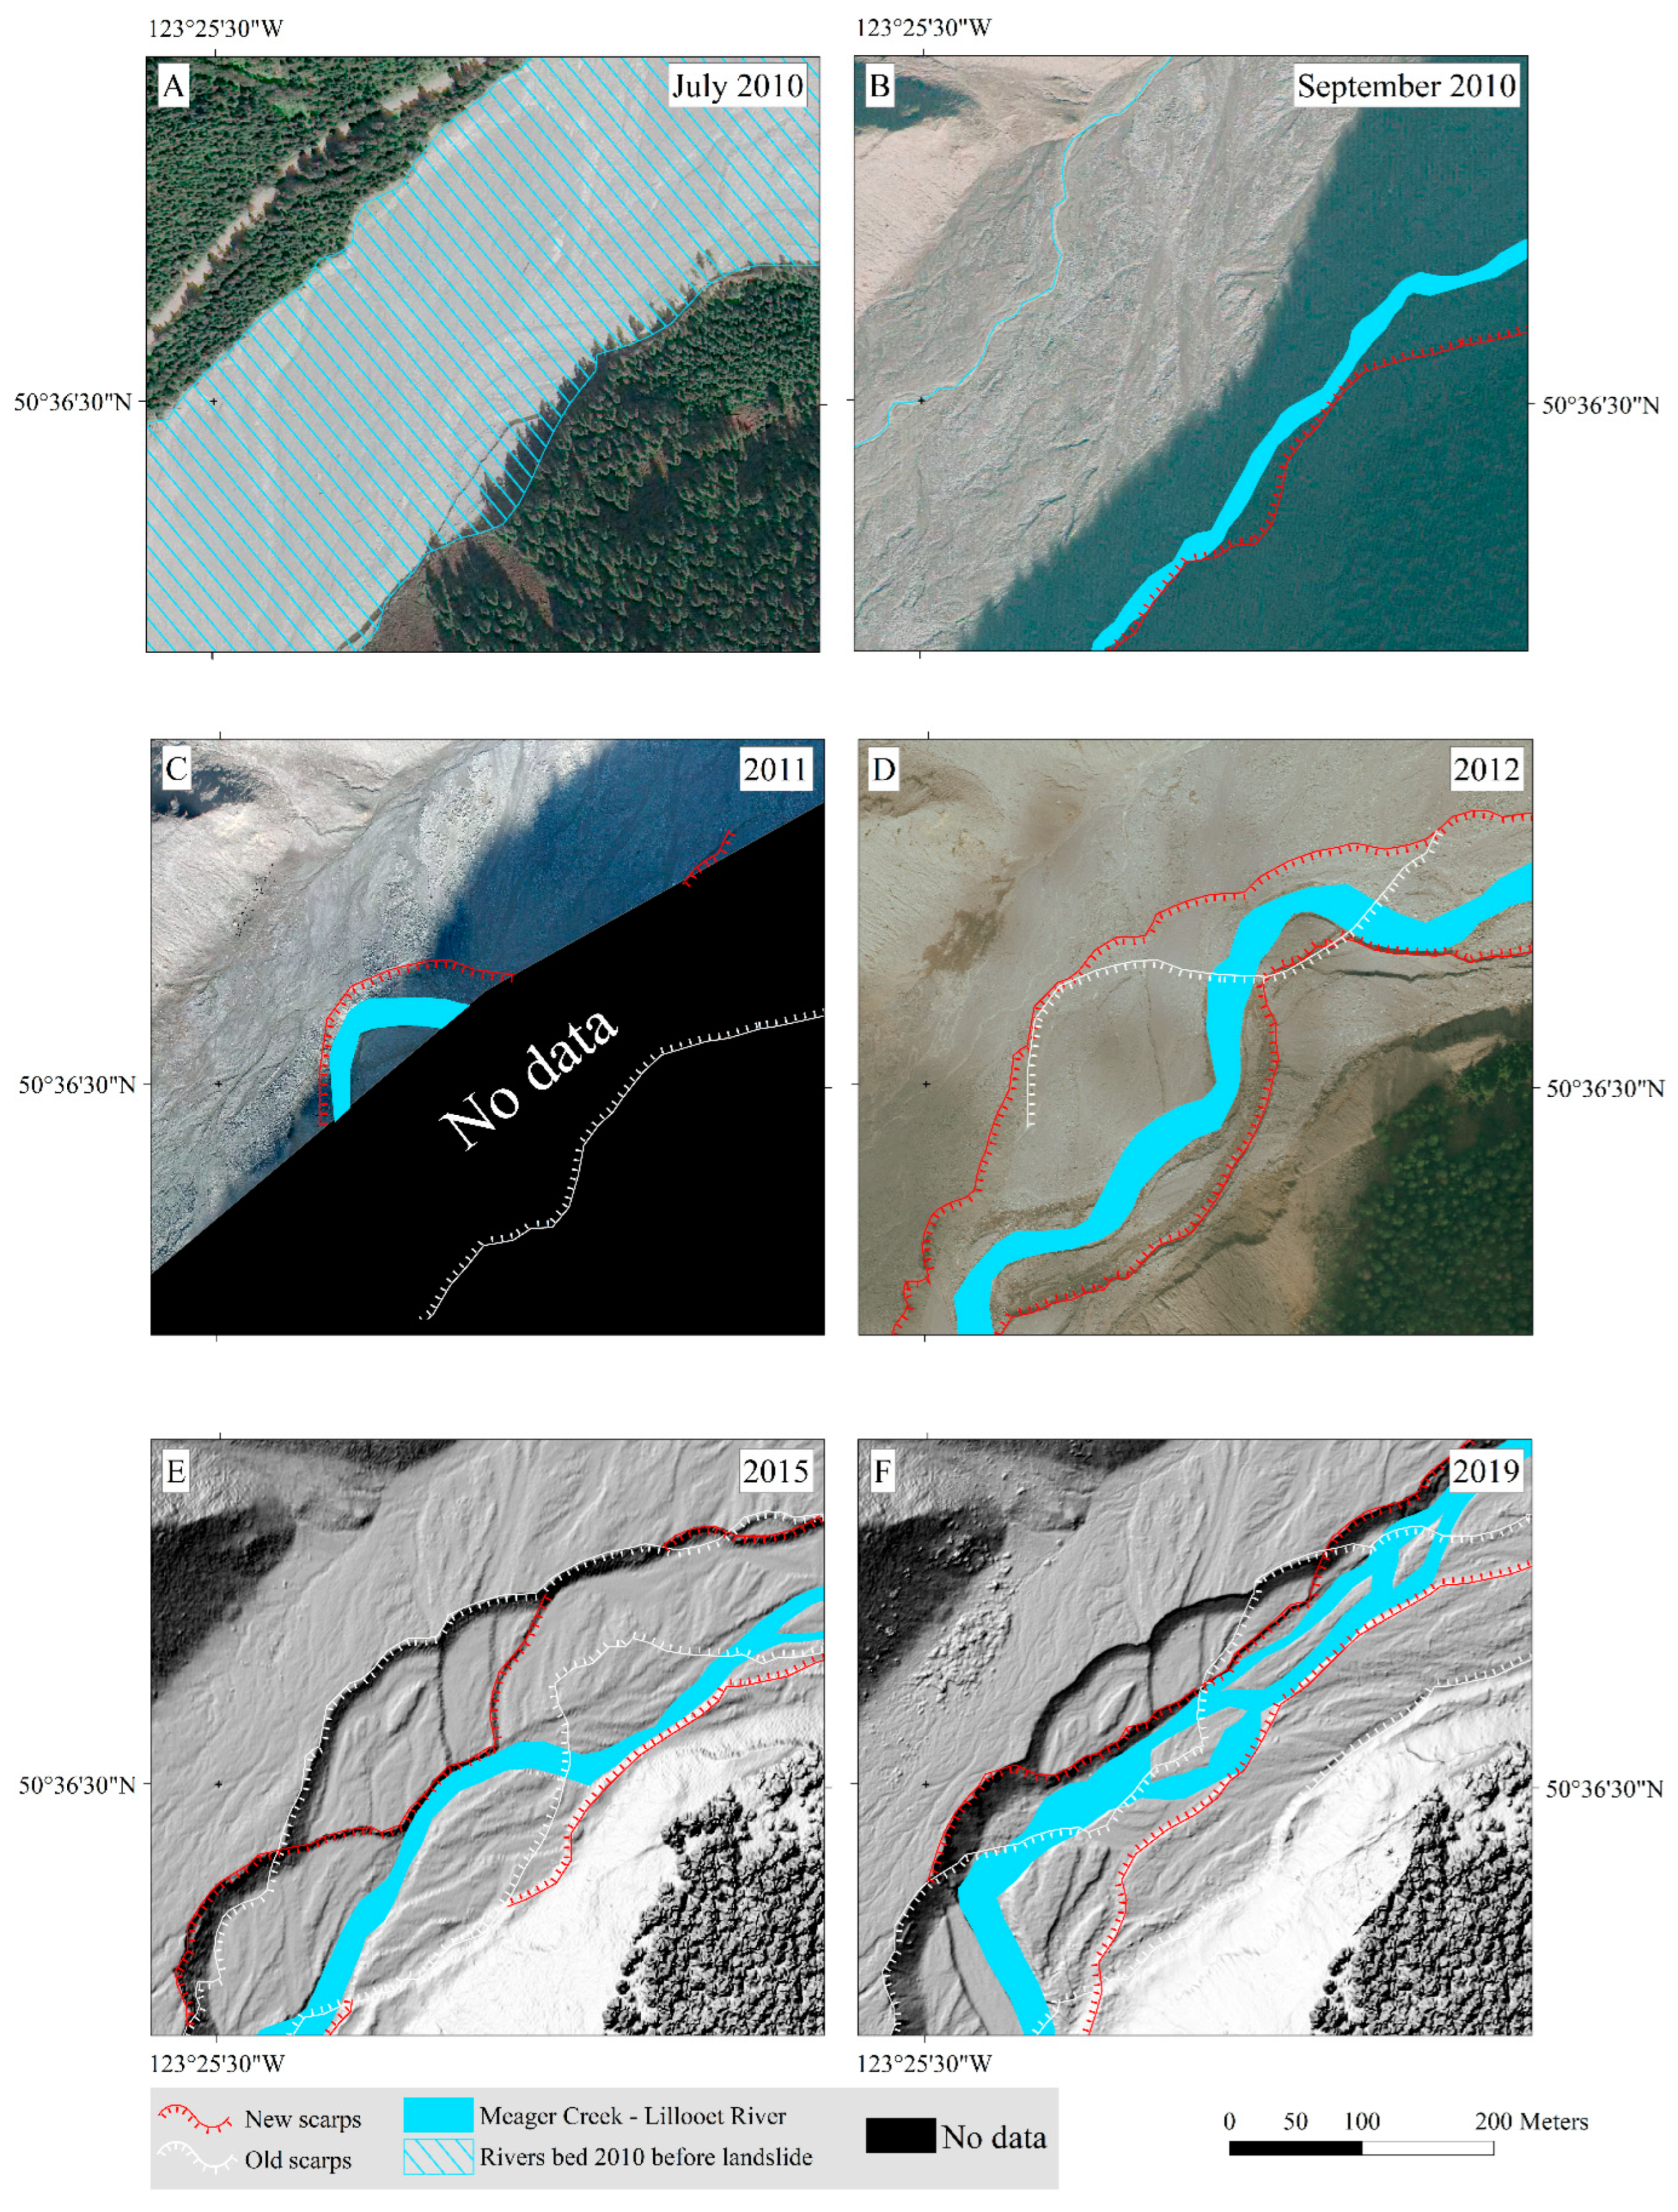
Prior to the 2010 landslide, the study area experienced other, albeit much smaller, landslides, with the most recent being a debris flow that descended Capricorn Creek, blocked Meager Creek and impounded an upstream lake in 2009 [18]. We used the July 2010 GeoEye orthophoto for an overview of the study area before the 2010 event. Figure 7 and Figure 8 show the situation in two areas in July 2010, one month before the 2010 landslide at Meager Creek. One area is just downstream of the Capricorn-Meager Creek confluence (Figure 7; the location is shown by the orange rectangle in Figure 1). The second area is along Meager Creek just upstream of its confluence with Lillooet River (Figure 8; purple rectangle in Figure 1). In July 2010, the active floodplain of Meager Creek was about 220 m wide (Figure 7A), and the area directly outside the floodplain was forested. Two active channels of Meager Creek just upstream of the Lillooet River confluence are also separated by forest (Figure 8A).
3.2.2. July 2010 to September 2010
The debris avalanche on 6 August 2010 overran the entire study area and completely changed the channels of Capricorn Creek and lower Meager Creek, creating a dam at their confluence (Meager Barrier, Figure 1 and Figure 2) and affecting a reach of Lillooet River more than 3 km in length. Meager Creek had a riverbed about 200 m wider than before the landslide (Figure 7B). There are two channels of Meager Creek in areas that were previously tree-covered, and the first scarp eroded by the creek is located just southwest of the image. The entire area at the confluence of Meager Creek and Lillooet River was covered by debris avalanche deposits. The eroded plug of landslide debris at the mouth of Capricorn Creek is visible in Figure 8B. Meager Creek flowed through an area that was previously forested.
3.2.3. 2010 to 2011
The data from 2011 (Figure 7C and Figure 8C) do not cover the entire study area; thus, river channels from that time are not included in the images. However, in the northwest corner of Figure 7C, it is evident that Meager Creek had started to erode into the deposits, creating a first system of erosional scarps. The erosional scarp in the plug has changed little since 2010 and thus is represented by a white line because it has the same location as the one in Figure 8B,C.
3.2.4. 2011 to 2012
3.2.5. 2012 to 2015
In the 2015 image (Figure 8E), the erosional gap in the plug area had significantly widened, with little vertical incision. However, in the area depicted in Figure 7E, it can be seen that Meager Creek had further incised its channel, leaving abandoned fluvial terraces at its margin. The surface above the highest terrace, upon which the northern channel of Meager Creek (Section 3.2.2) flowed in 2010, is unchanged.
3.2.6. 2015 to 2019
Between 2015 and 2019, Meager Creek continued to incise its channels, creating the scarps highlighted in Figure 7F. It was bordered by two erosional scarps separated by only 50–180 m in 2019. This observation indicates that the stream incised more vertically than laterally over this four-year period. The plug area, on the other hand, maintained the same erosional trend, as shown by the earlier time series (Figure 8A–D), with a total widening of the breach of 30–80 m from 2010 to 2019.
Figure 7.
Evolution of fluvial erosional scarps along Meager Creek downstream of the confluence of Meager and Capricorn creeks (area evidenced in orange in Figure 1). Red scarps shown in each panel are those created during that period. White scarps are those created in past years. (A) 2010, before the landslide (B) July to September 2010, (C) 2010 to 2011, (D) 2011 to 2012, (E) 2012 to 2015, (F) 2015 to 2019.
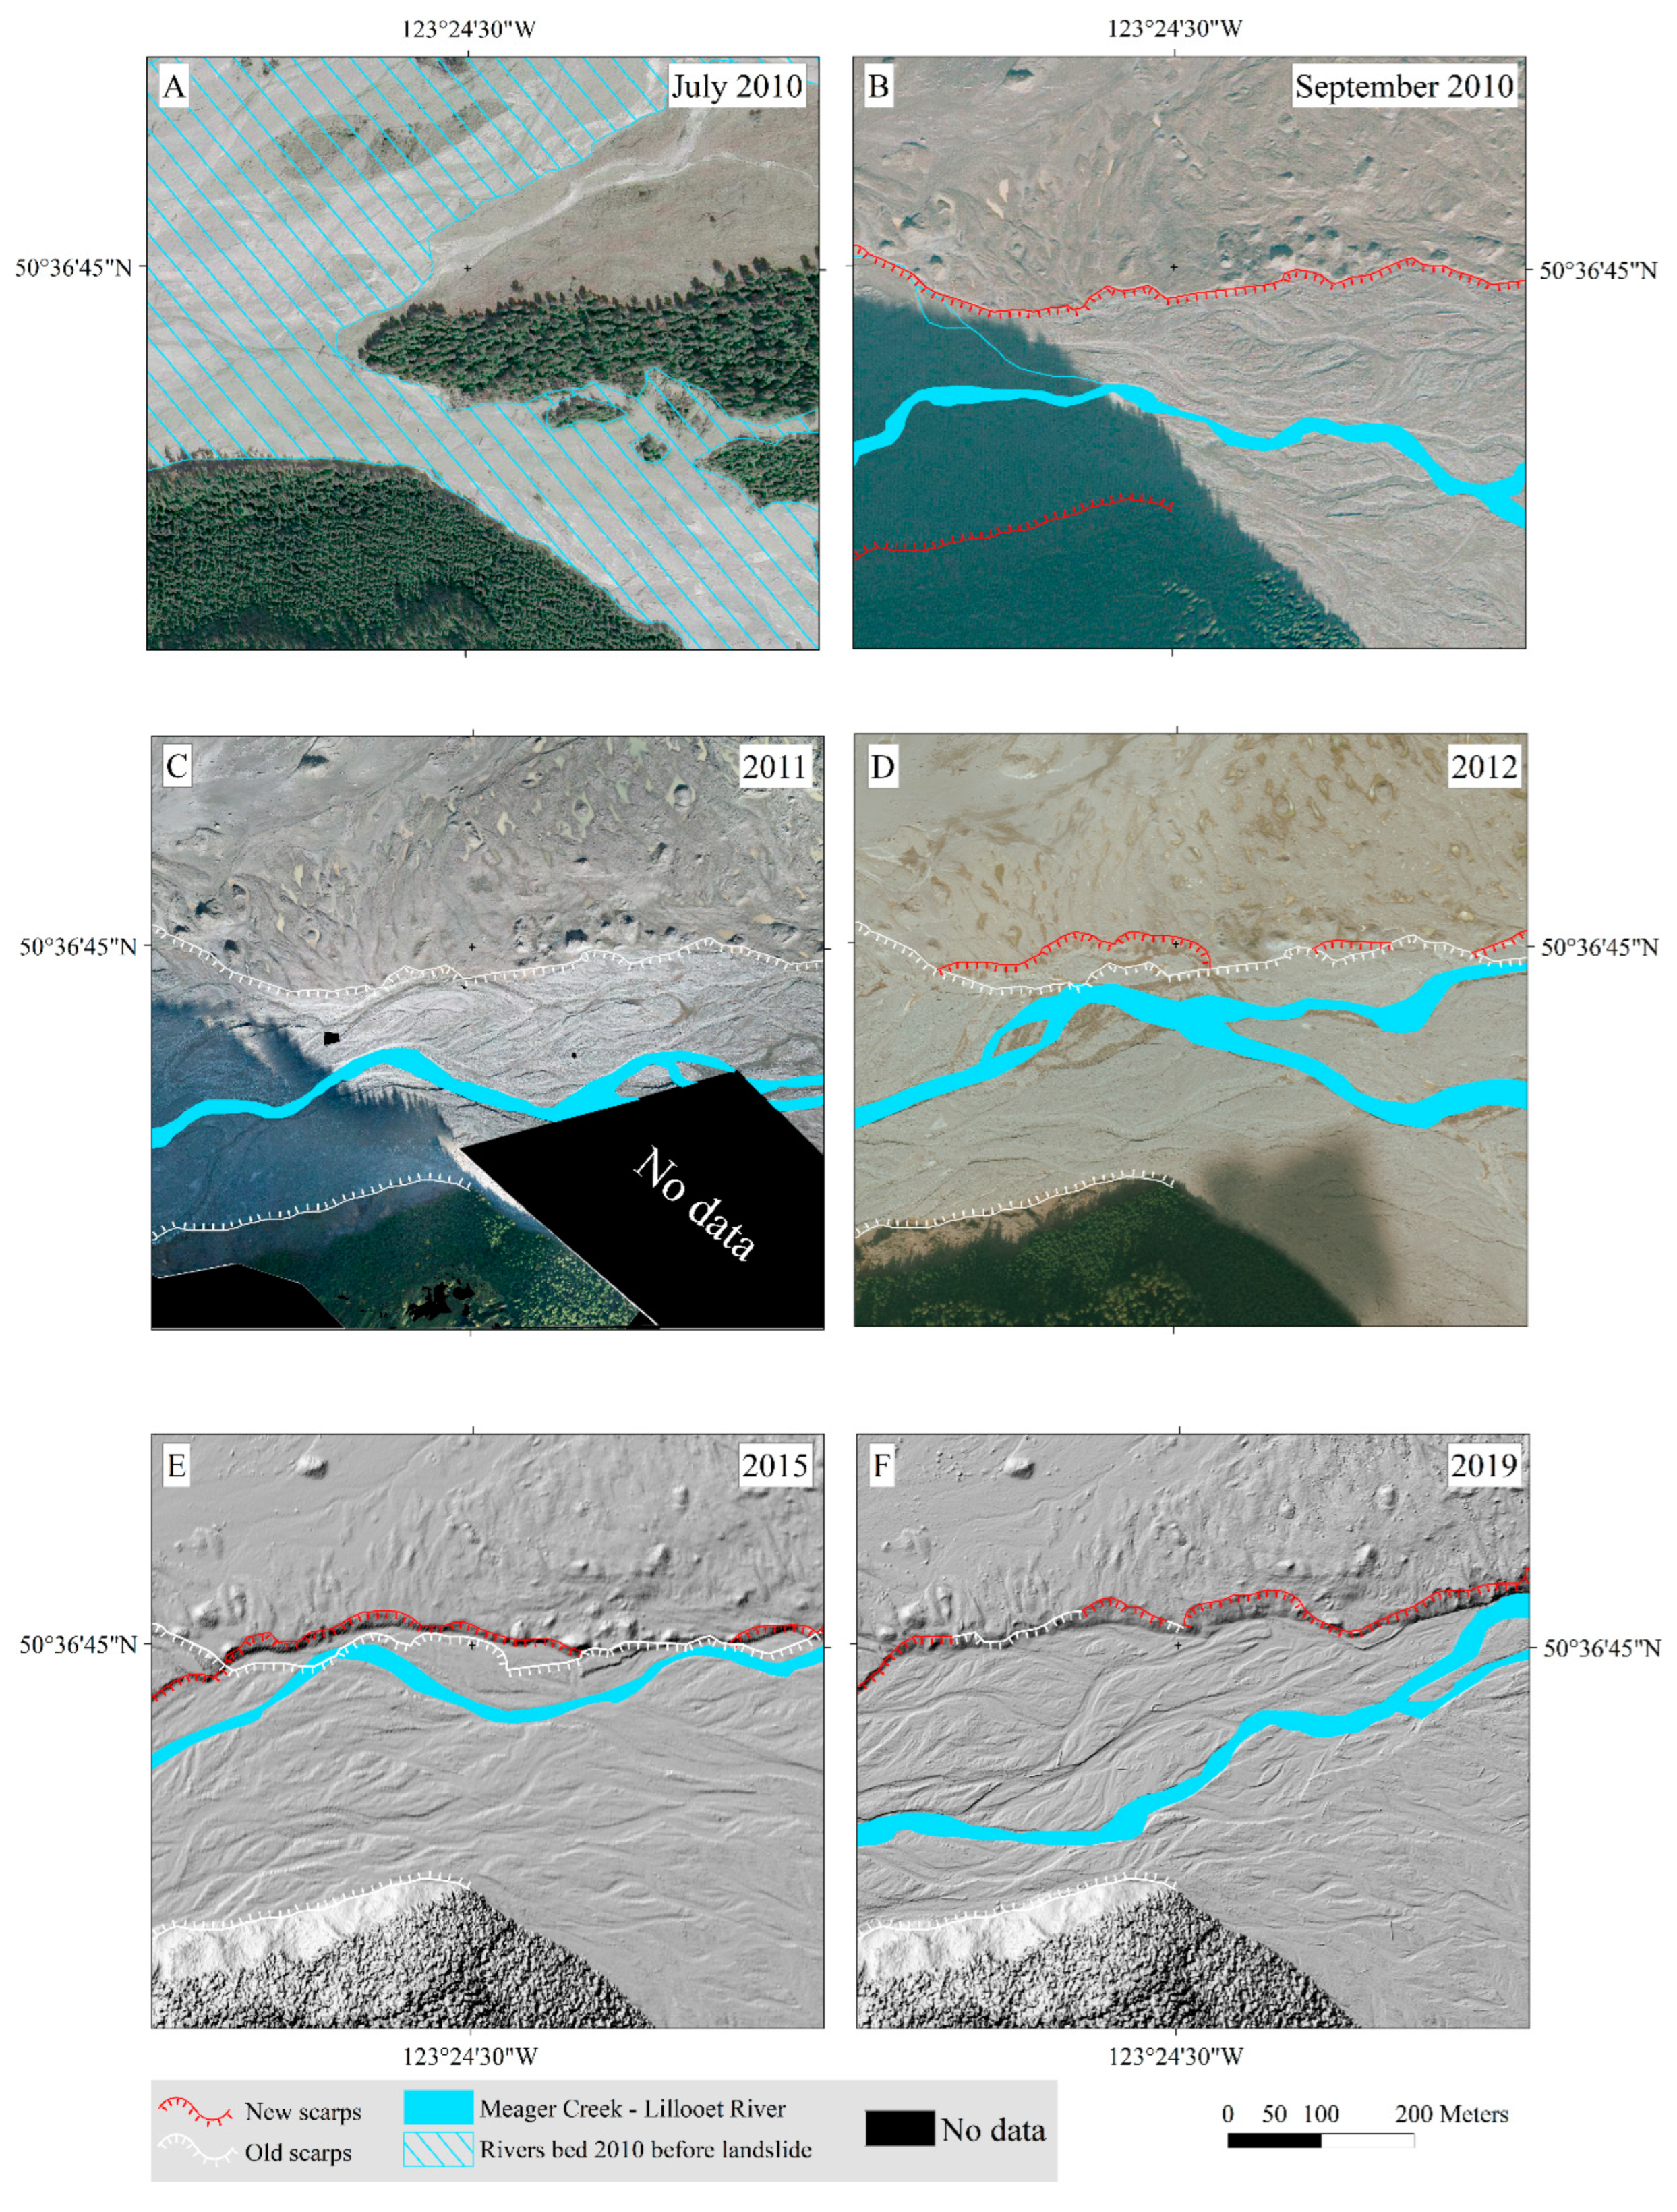
Figure 8.
Evolution of fluvial erosional scarps along Meager Creek just downstream of the confluence of Meager and Capricorn creeks (area evidenced in purple in Figure 1). Red scarps shown in each panel are those created during that period. White scarps are those created in past years. (A) 2010, before the landslide (B) July to September 2010, (C) 2010 to 2011, (D) 2011 to 2012, (E) 2012 to 2015, (F) 2015 to 2019.
4. Discussion
Surveys by Northwest Hydraulic Consultants [29] indicate that the channel of Lillooet River in the Pemberton Valley below Meager Creek has been aggrading since the 2010 landslide, creating an elevated flood risk to the communities of Pemberton, Pemberton Meadows, and Mount Currie. The Mt. Meager area is subject to a high frequency of post-glacial landslides [14,28], creating a temporal imbalance of sediment delivery to the fluvial system. The total volume of sediment evacuated from the accumulation area during the period 2010–2015 is 5.5 × 10⁶ m3 [29]. Adding our negative sediment balance for the period 2015–2019 (Table 4) to this value yields a total of 6 × 10⁶ m3 of sediment eroded from the landslide deposit area since 2010.
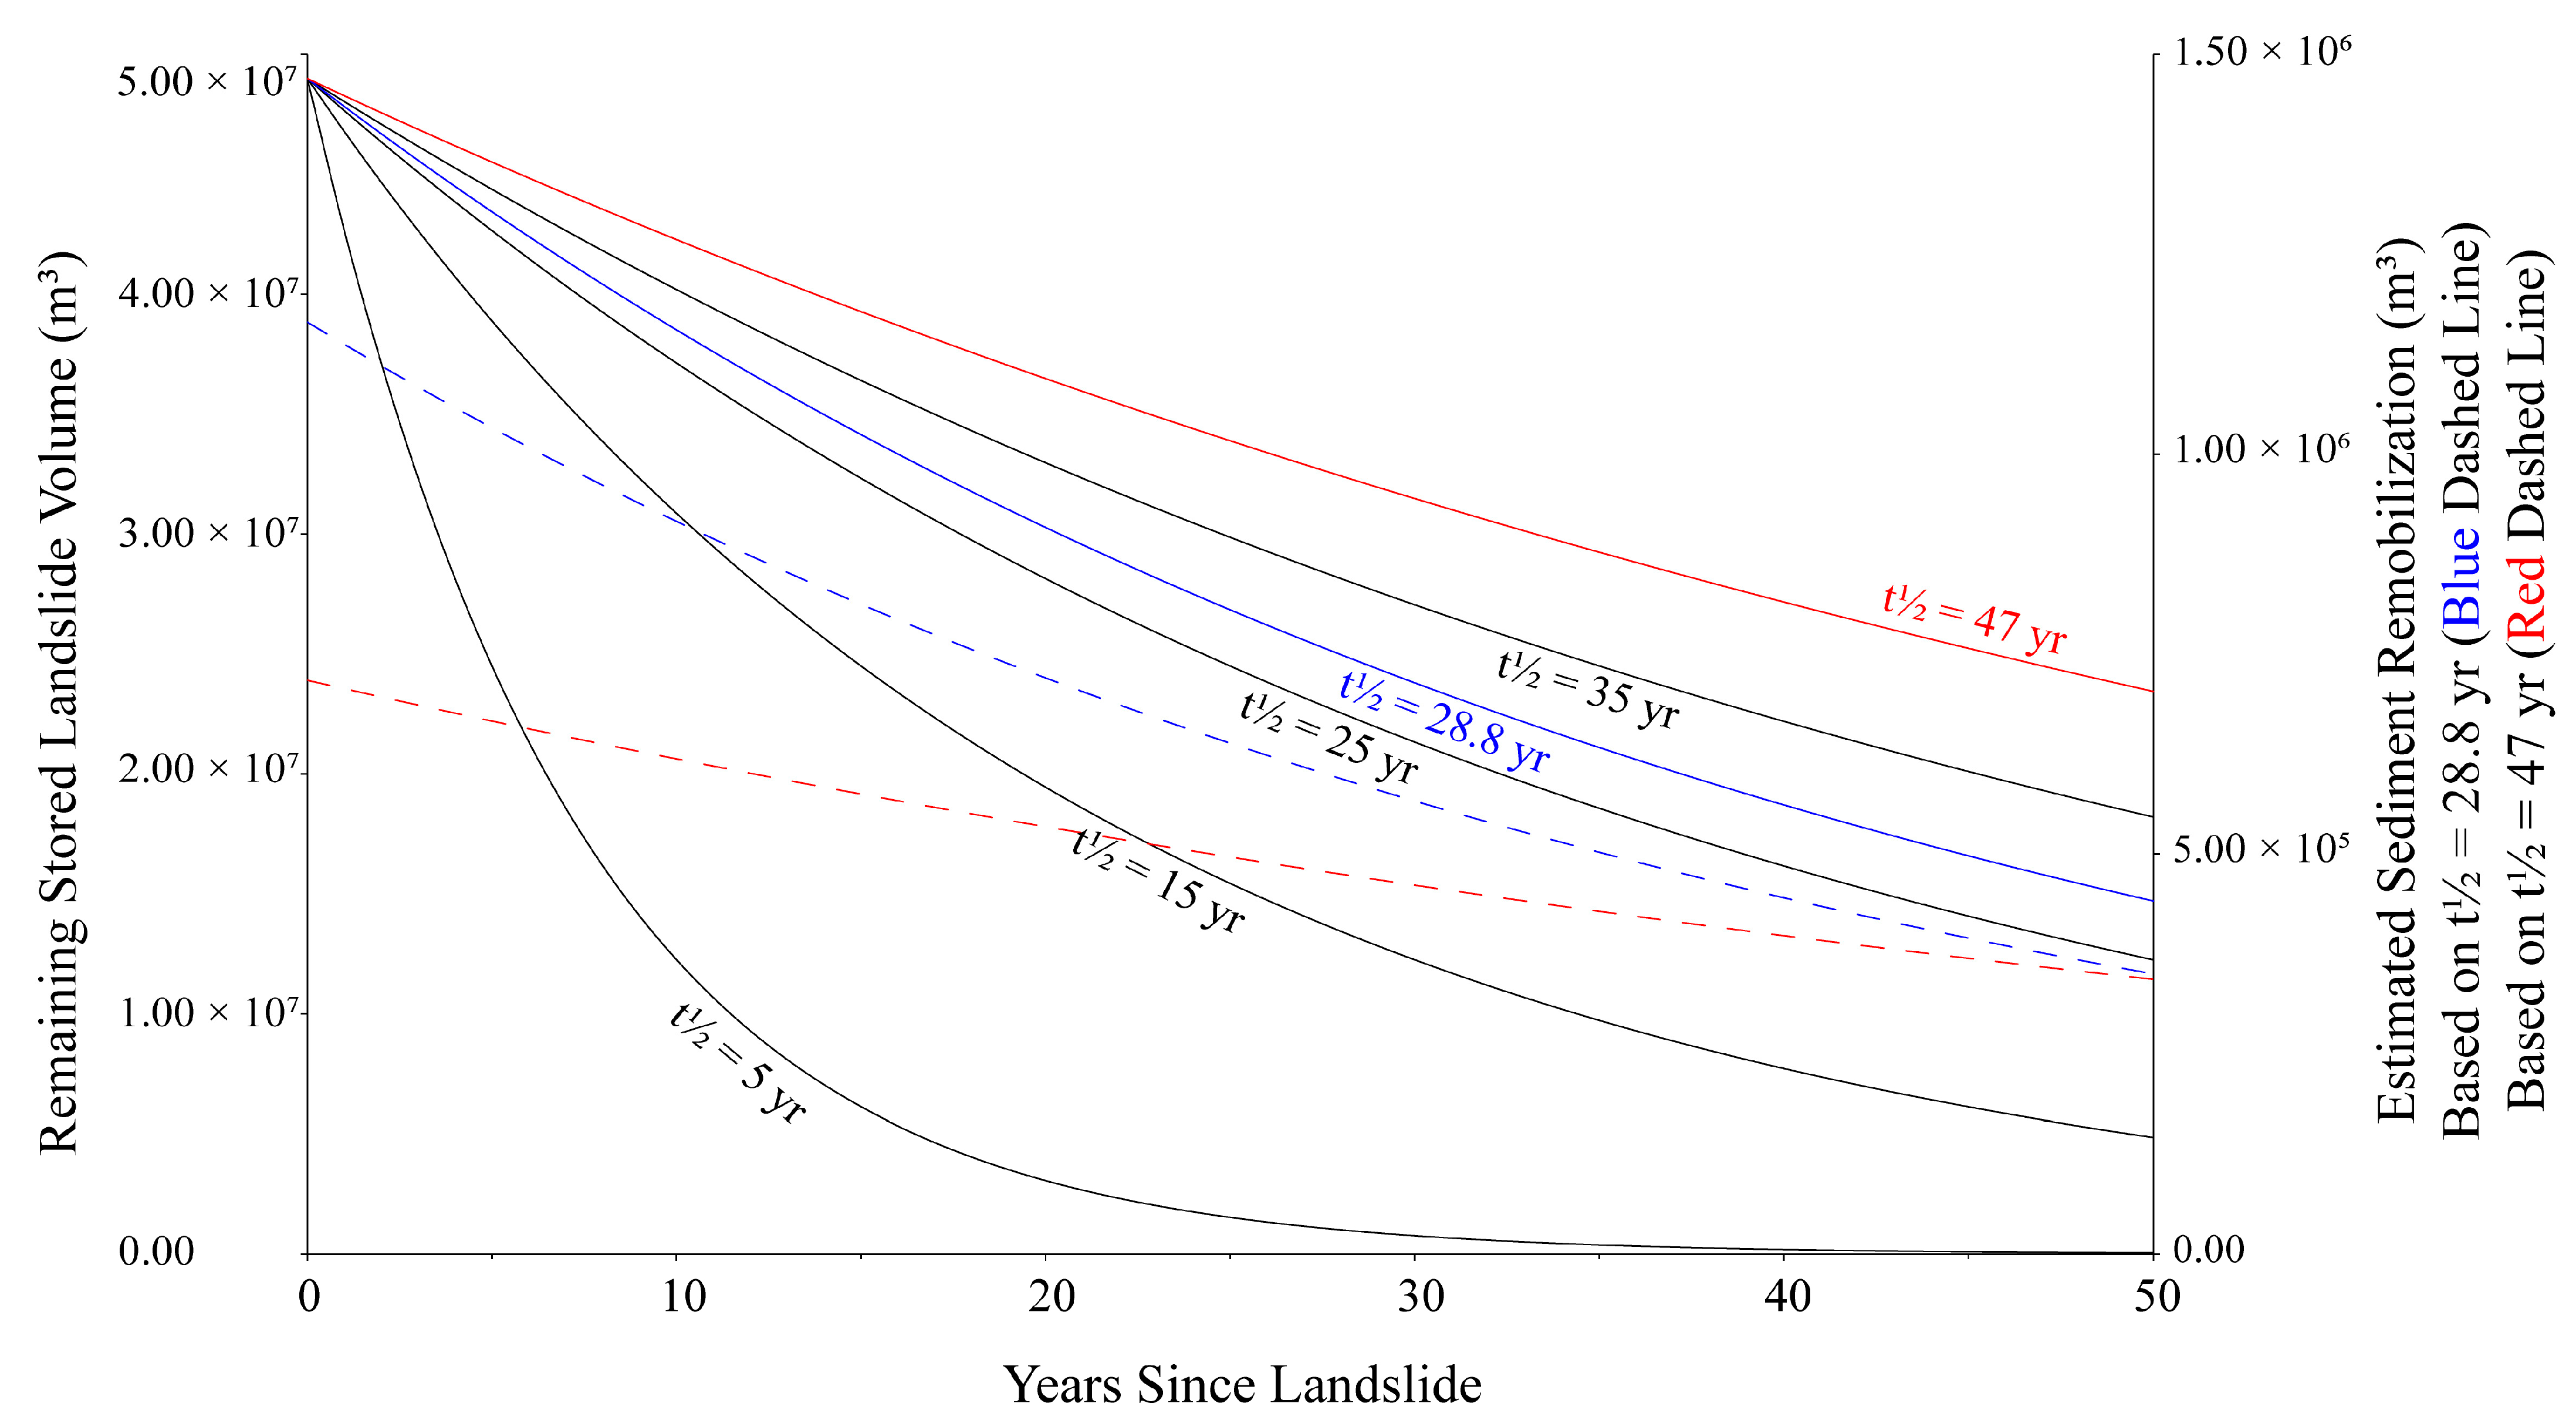
Northwest Hydraulic Consultants [29] estimated that the half-life for evacuation of sediment from the Meager Creek landslide area is 28.8 years. Similarly, many researchers have investigated the evolution of other landslide bodies eroded by streams and have calculated a range of values for the half-life of exponential decay in the landslide sediment stored in the system. ranging from approximately 5 to 50 years [29,44,45,46,47,48,49,50].
The trend in sediment export from the landslide area can be approximated by the following exponential decay function [51]:
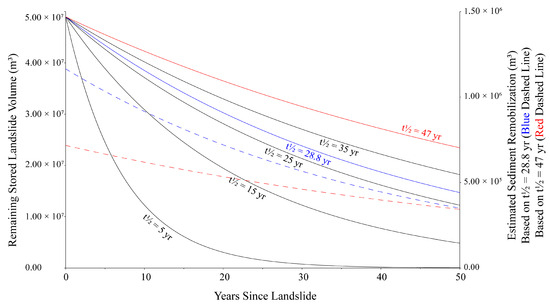
where t½ is the half-life of the decay function, t is the time a measurement is made, vi is the initial volume of the accumulation, and vf is the volume at time t. Figure 9 shows some representative half-life decay curves based on Equation (2). The curve for the Mount Meager landslide was generated from differences in volumes of sediment evacuated from the landslide area at two different times, based on our data and those reported by Northwest Hydraulic Consultants [29]. We have made a new estimate of 47 years for t½ based on the entire period of our study (2010–2019). Our results suggest that remnants of a landslide as large as this might persist for centuries see also ([45,46,51,52,53]).
t1/2 = (tln2)/ln(vi/vf)
Figure 9.
Graphs summarizing remobilization of the sediment deposited by the Mount Meager landslide in the lower Meager Creek Valley. Solid black lines represent volume changes of the landslide body over time for a specific half-life curve. The curves show trends in erosion, rapidly at first but diminishing over time. The blue solid line represents volume changes calculated using the data for the period 2010–2015, with a corresponding half-life of 28.8 years [29]. The red solid line represents the volume changes calculated for the period 2010–2019, with an overall half-life of 47 years (this study). The blue dashed line shows the annual sediment reduction based on t½ = 28.8 years [29]. The red dashed line shows the annual reduction in the volume of sediment for the period 2010–2019 based on the half-life value of 47 years.
This study has important implications for the erosive dynamics of landslide accumulations in paraglacial settings. In addition, this finding is significant from a flood-risk perspective, because a long half-life for retention of landslide debris reduces the rate of downstream channel aggradation and thus lowers the risk to downstream communities. However, it does not eliminate that risk.
Meager Creek Valley is an important and dynamic area from a geomorphic perspective. Surface processes are concentrated in this area with such energy that sudden and possibly unexpected morphological changes can happen. For this reason alone, it will be important to maintain an active monitoring campaign of the type reported in this paper to document and understand changes as they happen, as well as to plan for adverse consequences to downstream communities.
5. Conclusions
This study focuses on the evolution of the deposit of the debris avalanche that fell from the south flank of Mount Meager in August 2010. We used geomatic and geomorphic techniques to track the evolution of the deposit and found that Meager Creek and Lillooet River continuously eroded the landslide deposit between 2010 and 2019. Our results, in combination with data obtained by Northwest Hydraulic Consultants, suggest that about 6 × 10⁶ m3 of sediment was evacuated from the area over the study period. We also estimated a 47-year half-life decay in deposit erosion and sediment supply to the river system, suggesting a longer sediment persistence in the landscape than previously reported. This sediment is being carried downstream by the Lillooet River past the communities of Pemberton, Pemberton Meadows, and Mount Currie. It is prudent to monitor the Lillooet River channel in future years to assess the risk to these communities posed by channel aggradation.
Author Contributions
Conceptualization, F.P., G.R., J.J.C., W.A., M.G. and L.P.; Investigation, F.P., G.R., W.A. and L.P.; Resources, B.W.; Data curation, F.P. and L.P.; Writing—original draft, F.P., G.R. and L.P.; Writing—review and editing, J.J.C., M.G. and L.P.; Supervision, L.P.; Project administration, B.W. and L.P.; Funding acquisition, M.G. All authors have read and agreed to the published version of the manuscript.
Funding
This research was funded under the SOCIETAL CHALLENGES—Climate Action, Environment, Resource Efficiency and Raw Materials. The project name is Global Drivers, Local Consequences: Tools for Global Change Adaptation and Sustainable Development of Industrial and Cultural Arctic “hubs”. ArcticHubs, Grant agreement ID: 869580, https://doi.org/10.3030/869580.
Data Availability Statement
The data presented in this study are available on request from the corresponding author. The data are not publicly available due to privacy restrictions.
Conflicts of Interest
Authors Gioachino Roberti and Walter Alberto were employed respectively by the companies Mount Meager Consulting and Arpa Piemonte. The remaining authors declare that the research was conducted in the absence of any commercial or financial relationships that could be construed as a potential conflict of interest.
References
- Read, P.B. Mount Meager Complex, Garibaldi Belt, Southwestern British Columbia. Geosci. Can. 1990, 17, 3. [Google Scholar]
- Read, P.B. Geology, Meager Creek Geothermal Area, British Columbia; Geological Survey of Canada: Ottawa, ON, Canada, 1979. [CrossRef] [Scilit]
- Green, N.L.; Armstrong, R.L.; Harakal, J.E.; Souther, J.G.; Read, P.B. Eruptive History and K-Ar Geochronology of the Late Cenozoic Garibaldi Volcanic Belt, Southwestern British Columbia. Geol. Soc. Am. Bull. 1988, 100, 563–579. [Google Scholar] [CrossRef] [Scilit]
- Stasiuk, M.V.; Russell, J.K. Petrography and Chemistry of the Meager Mountain Volcanic Complex, Southwestern British Columbia. Pap. Geol. Surv. Can. 1989, 189–196. [Google Scholar] [CrossRef] [Scilit]
- Russell, J.K.; Stewart, M.; Wilson, A.; Williams-Jones, G. Eruption of Mount Meager, British Columbia, during the Early Fraser Glaciation. Can. J. Earth Sci. 2021, 58, 1146–1154. [Google Scholar] [CrossRef] [Scilit]
- Mullen, E.K.; Weis, D. Sr-Nd-Hf-Pb Isotope and Trace Element Evidence for the Origin of Alkalic Basalts in the Garibaldi Belt, Northern Cascade Arc. Geochem. Geophys. Geosyst. 2013, 14, 3126–3155. [Google Scholar] [CrossRef] [Scilit]
- Mullen, E.K.; Paquette, J.-L.; Tepper, J.H.; McCallum, I.S. Temporal and Spatial Evolution of Northern Cascade Arc Magmatism Revealed by LA–ICP–MS U–Pb Zircon Dating. Can. J. Earth Sci. 2018, 55, 443–462. [Google Scholar] [CrossRef] [Scilit]
- Venugopal, S. Magmatic Sources to Volcanic Gas Emissions: Insight from the Garibaldi Volcanic Belt, Western Canada. Ph.D. Thesis, Simon Fraser University, Burnaby, BC, Canada, 2019. [Google Scholar]
- Clague, J.J.; Evans, S.G.; Rampton, V.N.; Woodsworth, G.J. Improved Age Estimates for the White River and Bridge River Tephras, Western Canada. Can. J. Earth Sci. 1995, 32, 1172–1179. [Google Scholar] [CrossRef] [Scilit]
- Andrews, G.D.M.; Russell, J.K.; Stewart, M.L. The History and Dynamics of a Welded Pyroclastic Dam and Its Failure. Bull. Volcanol. 2014, 76, 811. [Google Scholar] [CrossRef] [Scilit]
- Unnsteinsson, T.; Flowers, G.; Williams-Jones, G. An Analytical Approach to Understanding the Morphologies of Glaciovolcanic Caves and Chimneys. Geophysics 2021. [Google Scholar] [CrossRef] [Scilit]
- Warwick, R.; Williams-Jones, G.; Kelman, M.; Witter, J. A Scenario-Based Volcanic Hazard Assessment for the Mount Meager Volcanic Complex, British Columbia. J. Appl. Volcanol. 2022, 11, 5. [Google Scholar] [CrossRef] [Scilit]
- Friele, P.A.; Clague, J.J. Large Holocene Landslides from Pylon Peak, Southwestern British Columbia. Can. J. Earth Sci. 2004, 41, 165–182. [Google Scholar] [CrossRef] [Scilit]
- Friele, P.; Jakob, M.; Clague, J. Hazard and Risk from Large Landslides from Mount Meager Volcano, British Columbia, Canada. Georisk Assess. Manag. Risk Eng. Syst. Geohazards 2008, 2, 48–64. [Google Scholar] [CrossRef] [Scilit]
- Friele, P.A.; Clague, J.J.; Simpson, K.; Stasiuk, M. Impact of a Quaternary Volcano on Holocene Sedimentation in Lillooet River Valley, British Columbia. Sediment. Geol. 2005, 176, 305–322. [Google Scholar] [CrossRef] [Scilit]
- Mokievsky-Zubok, O. Glacier-Caused Slide near Pylon Peak, British Columbia. Can. J. Earth Sci. 1977, 14, 2657–2662. [Google Scholar] [CrossRef] [Scilit]
- Bovis, M.J.; Jakob, M. The July 29, 1998, Debris Flow and Landslide Dam at Capricorn Creek, Mount Meager Volcanic Complex, Southern Coast Mountains, British Columbia. Can. J. Earth Sci. 2000, 37, 1321–1334. [Google Scholar] [CrossRef]
- Guthrie, R.H.; Friele, P.; Allstadt, K.; Roberts, N.; Evans, S.G.; Delaney, K.B.; Roche, D.; Clague, J.J.; Jakob, M. The 6 August 2010 Mount Meager Rock Slide-Debris Flow, Coast Mountains, British Columbia: Characteristics, Dynamics, and Implications for Hazard and Risk Assessment. Nat. Hazards Earth Syst. Sci. 2012, 12, 1277–1294. [Google Scholar] [CrossRef] [Scilit]
- Holm, K.; Bovis, M.; Jakob, M. The Landslide Response of Alpine Basins to Post-Little Ice Age Glacial Thinning and Retreat in Southwestern British Columbia. Geomorphology 2004, 57, 201–216. [Google Scholar] [CrossRef] [Scilit]
- Roberti, G.; Ward, B.; Van Wyk De Vries, B.; Friele, P.; Perotti, L.; Clague, J.J.; Giardino, M. Precursory Slope Distress Prior to the 2010 Mount Meager Landslide, British Columbia. Landslides 2018, 15, 637–647. [Google Scholar] [CrossRef] [Scilit]
- Roberti, G.; Ward, B.C.; Van Wyk deVries, B.; Perotti, L.; Giardino, M.; Friele, P.A.; Clague, J.J.; Menounos, B.; Anderson, L.S.; Freschi, S. Structure from Motion Used to Revive Archived Aerial Photographs for Geomorphological Analysis: An Example from Mount Meager Volcano, British Columbia, Canada. Can. J. Earth Sci. 2021, 58, 1253–1267. [Google Scholar] [CrossRef] [Scilit]
- Nevin, Sadlier-Brown, Goodbrand Ltd. Report on Investigation of Geothermal Resources in Southwestern British Columbia; B.C. Hydro and Power Authority Hydro: Vancouver, BC, Canada, 1974. Available online: https://www2.gov.bc.ca/assets/gov/farming-natural-resources-and-industry/electricity-alternative-energy/geothermal/gt3_volume1.pdf (accessed on 23 April 2024).
- Lewis, T.J. Heat Generation in the Coast Range Complex and Other Areas of British Columbia. Can. J. Earth Sci. 1976, 13, 1634–1642. [Google Scholar] [CrossRef] [Scilit]
- Grasby, S.; Ansari, S.; Barendregt, R.; Borch, A.; Calahorrano-DiPatre, A.; Chen, Z.; Craven, J.; Dettmer, J.; Gilbert, H.; Hanneson, C.; et al. Garibaldi Geothermal Energy Project–Phase 1: Final Report. Geosci. BC Rep. 2021, 8, 276. [Google Scholar]
- Haley, J.P.; Friele, P.P. Landslide Risk Management for the Construction and Operation of the Upper Lillooet River Hydroelectric Facility Near Pemberton, BC; Knight Piésold Ltd.: Vancouver, BC, Canada, 2018. [Google Scholar]
- Church, M.; Ryder, J.M. Paraglacial Sedimentation: A Consideration of Fluvial Processes Conditioned by Glaciation. Geol. Soc. Am. Bull. 1972, 83, 3059–3072. [Google Scholar] [CrossRef] [Scilit]
- Church, M.; Slaymaker, O. Disequilibrium of Holocene Sediment Yield in Glaciated British Columbia. Nature 1989, 337, 452–454. [Google Scholar] [CrossRef] [Scilit]
- Friele, P.A.; Clague, J.J. Paraglacial Geomorphology of Quaternary Volcanic Landscapes in the Southern Coast Mountains, British Columbia. SP 2009, 320, 219–233. [Google Scholar] [CrossRef] [Scilit]
- Northwest Hydraulic Consultants Ltd. Lillooet River Floodplain Mapping; Northwest Hydraulic Consultants Ltd.: Vancouver, BC, Canada, 2018. [Google Scholar]
- Roberti, G.; Friele, P.; van Wyk de Vries, B.; Ward, B.; Clague, J.J.; Perotti, L.; Giardino, M. Rheological Evolution of the Mount Meager 2010 Debris Avalanche, Southwestern British Columbia. Geosphere 2017, 13, 369–390. [Google Scholar] [CrossRef] [Scilit]
- Allstadt, K. Extracting Source Characteristics and Dynamics of the August 2010 Mount Meager Landslide from Broadband Seismograms. JGR Earth Surf. 2013, 118, 1472–1490. [Google Scholar] [CrossRef] [Scilit]
- Roche, A.D.; Guthrie, R.H.; Roberts, N.J.; Ellis, E.; Friele, P. Once More into the Breach: A Forensic Analysis of the August 2010 Landslide Dam Outburst Flood at Meager Creek, BC. In Proceedings of the 5th Canadian Conference on Geotechnique and Natural Hazards, Kelowna, BC, Canada, 15–17 May 2011; pp. 15–17. [Google Scholar]
- Agisoft, Agisoft Metashape v. 2.0.2. Available online: https://agisoft.freshdesk.com/support/solutions/articles/31000153696 (accessed on 23 April 2024).
- Pix4D SA, Pix4D Capture v. 4.13.1. Available online: https://support.pix4d.com/hc/en-us/articles/202557269-Getting-Started-PIX4Dcapture (accessed on 23 April 2024).
- Westoby, M.J.; Brasington, J.; Glasser, N.F.; Hambrey, M.J.; Reynolds, J.M. ‘Structure-from-Motion’ Photogrammetry: A Low-Cost, Effective Tool for Geoscience Applications. Geomorphology 2012, 179, 300–314. [Google Scholar] [CrossRef] [Scilit]
- Borgogno Mondino, E.; Perotti, L.; Piras, M. High Resolution Satellite Images for Archeological Applications: The Karima Case Study (Nubia Region, Sudan). Eur. J. Remote Sens. 2012, 45, 243–259. [Google Scholar] [CrossRef] [Scilit]
- Kraus, K. Photogrammetry; De Gruyter: Berlin, Germany, 1997. [Google Scholar] [CrossRef] [Scilit]
- Bannister, A.; Raymond, S.; Baker, R. Surveying; Pearson: London, UK, 1998; ISBN 978-0-582-30249-5. [Google Scholar]
- Williams, R.; Brasington, J.; Vericat, D.; Hicks, M.; Labrosse, F.; Neal, M. Monitoring Braided River Change Using Terrestrial Laser Scanning and Optical Bathymetric Mapping. In Developments in Earth Surface Processes; Elsevier: Amsterdam, The Netherlands, 2011; Volume 15, pp. 507–532. [Google Scholar]
- Lane, S.N.; Westaway, R.M.; Murray Hicks, D. Estimation of Erosion and Deposition Volumes in a Large, Gravel-bed, Braided River Using Synoptic Remote Sensing. Earth Surf. Process. Landf. 2003, 28, 249–271. [Google Scholar] [CrossRef] [Scilit]
- Micheletti, N.; Lane, S.N.; Chandler, J.H. Application of Archival Aerial Photogrammetry to Quantify Climate Forcing of Alpine Landscapes. Photogramm. Rec. 2015, 30, 143–165. [Google Scholar] [CrossRef] [Scilit]
- Neugirg, F.; Stark, M.; Kaiser, A.; Vlácilová, M.; Della Seta, M.; Vergari, F.; Schmidt, J.; Becht, M.; Haas, F. Erosion Processes in Calanchi in the Upper Orcia Valley, Southern Tuscany, Italy Based on Multitemporal High-Resolution Terrestrial LiDAR and UAV Surveys. Geomorphology 2016, 269, 8–22. [Google Scholar] [CrossRef] [Scilit]
- Betz, S.; Croce, V.; Becht, M. Investigating Morphodynamics on Little Ice Age Lateral Moraines in the Italian Alps Using Archival Aerial Photogrammetry and Airborne LiDAR Data. Z. Für Geomorphol./Ann. Geomorphol./Ann. Géomorphologie 2019, 62, 231–247. [Google Scholar] [CrossRef] [Scilit]
- Adams, M.; Moore, J.; Forster, C. Fluid Flow in Volcanic Terrains-Hydrogeochemistry of the Meager Mountain Thermal System. Geotherm. Resour. Counc. Trans. 1985, 9, 377–382. [Google Scholar]
- Pearce, A.J.; Watson, A.J. Effects of Earthquake-Induced Landslides on Sediment Budget and Transport over a 50-Yr Period. Geology 1986, 14, 52–55. [Google Scholar] [CrossRef] [Scilit]
- Major, J.J.; Pierson, T.C.; Dinehart, R.L.; Costa, J.E. Sediment Yield Following Severe Volcanic Disturbance—A Two-Decade Perspective from Mount St. Helens. Geology 2000, 28, 819–822. [Google Scholar] [CrossRef] [Scilit]
- Dadson, S.J.; Hovius, N.; Chen, H.; Dade, W.B.; Lin, J.-C.; Hsu, M.-L.; Lin, C.-W.; Horng, M.-J.; Chen, T.-C.; Milliman, J. Earthquake-Triggered Increase in Sediment Delivery from an Active Mountain Belt. Geology 2004, 32, 733–736. [Google Scholar] [CrossRef] [Scilit]
- Koi, T.; Hotta, N.; Ishigaki, I.; Matuzaki, N.; Uchiyama, Y.; Suzuki, M. Prolonged Impact of Earthquake-Induced Landslides on Sediment Yield in a Mountain Watershed: The Tanzawa Region, Japan. Geomorphology 2008, 101, 692–702. [Google Scholar] [CrossRef] [Scilit]
- Hovius, N.; Meunier, P.; Lin, C.-W.; Chen, H.; Chen, Y.-G.; Dadson, S.; Horng, M.-J.; Lines, M. Prolonged Seismically Induced Erosion and the Mass Balance of a Large Earthquake. Earth Planet. Sci. Lett. 2011, 304, 347–355. [Google Scholar] [CrossRef] [Scilit]
- Huang, M.Y.-F.; Montgomery, D.R. Fluvial Response to Rapid Episodic Erosion by Earthquake and Typhoons, Tachia River, Central Taiwan. Geomorphology 2012, 175–176, 126–138. [Google Scholar] [CrossRef] [Scilit]
- Nelson, A.; Dubé, K. Channel Response to an Extreme Flood and Sediment Pulse in a Mixed Bedrock and Gravel-bed River. Earth Surf. Process. Landf. 2016, 41, 178–195. [Google Scholar] [CrossRef] [Scilit]
- Ohmori, H. Dynamics and Erosion Rate of the River Running on a Thick Deposit Supplied by a Large Landslide. Z. Für Geomorphol. 1992, 129–140. [Google Scholar] [CrossRef] [Scilit]
- Croissant, T.; Lague, D.; Steer, P.; Davy, P. Rapid Post-Seismic Landslide Evacuation Boosted by Dynamic River Width. Nat. Geosci. 2017, 10, 680–684. [Google Scholar] [CrossRef] [Scilit]

Disclaimer/Publisher’s Note: The statements, opinions and data contained in all publications are solely those of the individual author(s) and contributor(s) and not of MDPI and/or the editor(s). MDPI and/or the editor(s) disclaim responsibility for any injury to people or property resulting from any ideas, methods, instructions or products referred to in the content. |
© 2024 by the authors. Licensee MDPI, Basel, Switzerland. This article is an open access article distributed under the terms and conditions of the Creative Commons Attribution (CC BY) license (https://creativecommons.org/licenses/by/4.0/).