Article

Interannual Changes of Fire Activity in the Protected Areas of the SUN Network and Other Parks and Reserves of the West and Central Africa Region Derived from MODIS Observations

by
Jean-Marie Grégoire
* and
Dario Simonetti
Institute for Environment and Sustainability, Joint Research Centre of the European Commission, TP. 440, 21020 Ispra (VA), Italy
*
Author to whom correspondence should be addressed.
Remote Sens. 2010, 2(2), 446-463; https://doi.org/10.3390/rs2020446
Submission received: 10 December 2009 / Revised: 22 January 2010 / Accepted: 26 January 2010 / Published: 29 January 2010
(This article belongs to the Special Issue Ecological Status and Change by Remote Sensing)

Abstract

:
Time series of fire occurrence, derived from MODIS data, have been used to characterise the spatio-temporal distribution of fire events during the 2004–2009 period in 17 protected areas (PAs) of West and Central Africa, with particular attention to those of the SUN network in Senegal, Burkina Faso, Benin and Niger. The temporal distribution of the fire activity and the number of fire occurences are quite different inside the PAs and in their surrounding area. A progressive increase of the length of the burning season is observed in the West Africa PAs. Quantitatively, the general trend over the last five years is an increase of the fire density (+22%) inside the PAs and a decrease (−27%) outside. The results indicate that the capacity of the PAs to maintain the biological diversity of the region is probably decreasing due to the combined effects of the anthropic pressure inside the PAs and of an on-going isolation process.

Graphical Abstract

1. Introduction

The Sustainable Use of Natural Vegetation in West Africa project (SUN; http://www.sunproject.dk/index.asp) aims at improving the management and a sustainable use of the natural vegetation resources in the dry and semi-arid regions of West Africa. The research oriented activities of the project are concentrated on five protected areas (PAs): three national parks and two classified forests (Figure 1, Table 1).
Figure 1. Location of the three regional windows and of the protected areas (black circles) considered in the analysis.
Remotesensing 02 00446 g001
The transboundary Park W is made up of three national parks: the Park W-Benin, Park W-Burkina and Park W-Niger. Together with a set of five other protected areas, Park W forms the ecological complex known as the WAP which extends over about 30,000 km2: the faunal reserves of Arly and Singou, in Burkina Faso; the National Park Boucle de la Pendjari, in Benin; and the partial reserves of Kourtiagou and Pama, in Burkina Faso. Park W has the peculiarity to be in the transition zone between the Sudanian and Sahelian ecoregions [1]. Since November 2002, the Park W is a Transboundary Biosphere Reserve. The Patako classified forest in Senegal belongs to the Fatick administrative region, in the South of the country. It covers an area of 6,043 ha, on the border with Gambia, in the transition zone between the Guinea-Congolia/Sudanian and the Sudanian ecoregions. The Boulon classified forest in Burkina Faso is part of the Comoé province, in the SW of the country, in the border region with Côte d’Ivoire. It covers 13,523 ha in the Sudanian ecoregion.
In addition to the five PAs of the SUN network, eleven protected areas have been considered in the analysis: four faunal reserves and seven national parks. This additional set of PAs was selected to enlarge the range of ecological domains considered in the analysis, more particularly the guineo-congolian and guineo-congolia/sudanian ecoregions, and to include some PAs where we knew that a conservation project was in place, such as the Garamba and Zakouma national parks respectively in D.R.C and Chad.
Table 1. Protected areas considered in the analysis.
Protected areaIUCN category(1)EcoregionArea (ha)(2)
Region 1 inside(3)25 km(4)
Boundou - Senegalnature reserveSudanian125,088546,544
Niokolo-Koba - SenegalII-national parkSudanian (south)843,3551,049,250
Outamba-K.- Sierra LeoneII-national parkGuineo-Congolian73,137454,392
Patako - Senegalclassified forestGuineo-c./Sudanian6,043163,620
Region 2
Arly tot. - Burkina FasoIV-total faunal reserveSudanian84,457149,185
Boulon - Burkina Fasoclassified forestSudanian13,523296,109
Deux Bales - Burkina FasoII-national parkSudanian88,481487,136
Digya - GhanaII-national parkGuineo-c./Sudanian276,404761,926
Nazinga - Burkina FasoranchSudanian120,638373,314
Pendjari - BeninII-national parkSudanian282,631292,771
W Park - transnationalII-national parkSudanian1,041,723991,177
W Park - BeninII-national parkSudanian576,959665,324
W Park - Burkina FasoII-national parkSudanian243,836189,464
W Park - NigerII-national parkSudanian220,928136,389
Region 3
Bomu - R.D.CongoIb-strict nature reserveGuineo-Congolian1,066,7002,582,860
Garamba - R.D. CongoII-national parkGuineo-c./Sudanian498,0841,018,350
Zakouma - ChadII-national parkSudanian304,951731,949
1 IUCN definitions of categories. Ia-b: PA managed mainly for science and environmental monitoring. II: PA managed mainly for ecosystem protection and recreation, designated to (a) protect the ecological integrity of one or more ecosystems and (b) exclude exploitation or occupation inimical to the purposes of designation of the area. IV: Protected area managed mainly for conservation through management intervention, so as to ensure the maintenance of habitats and/or to meet the requirements of specific species.2 data source: [2]. 3 surface of the protected area. 4 surface of a 25 km buffer zone around the protected area. Remark: the 25 km buffer cannot include a portion or the totality of another protected area.
The fire monitoring programme developed on these protected areas contributes to a specific objective of the SUN project which is to analyse indicators of sustainable use of plant resources at a landscape and habitat scale with different degrees of human influence. Human influence being largely linked to the use of burning for land management purposes, it appeared indispensable to charaterise the spatio-temporal distribution of fires in the PAs. Fires are central to the ecology of African tropical protected areas. They have a direct impact on the tree-shrub-grass balance and therefore on the habitats of many species and more generally on the biodiversity level. The monitoring of fire activity is important to better understand the ecological conditions and trends in the PAs and their peculiarity compared to the surrounding zone.
Fire is a management tool commonly used in park management in tropical and sub-tropical regions of sub-Saharan Africa. The temporal aspects of the fire regimes have been largely studied to support ecological assessments of the savanna ecosystem in the Southern Africa region [3,4,5,6,7,8,9] as well as in West Africa [10,11,12,13,14]. The combine effects of fire frequency and burning intensity have a direct impact on the respective proportions of grass, shrub and tree vegetation. Knowing that the burning intensity is strongly driven by the time of the year when burning occurs, fire management depends largely on the possibility to control the fire distribution during the dry season. Consequently, there is a strong demand from park managers of improved information on the spatio-temporal distribution of fire activity and of its interannual variability or changes: in summary, where and when burning occurs in a given PA and its surroundings. Earth observations are the best source of information for characterising these distributions.
It is only rather recently that the characterisation of the seasonal patterns of fire distribution has been done in a systematic manner at continental or global scale using Earth observation techniques. Dwyer et al. [15] did it at the global level using the active fires count provided by the NOAA-AVHRR-1km data, while the first assessment at continental scale for Africa was done by Barbosa et al. [16] using NOAA-AVHRR-5km data; they derived some interesting observations on the fire return interval North and South of the equator. Schultz [17] used the night-time fires count, provided by the Along Track Scanning Radiometer (ATSR) sensor onboard the ESA/ERS-2 satellite, to assess the interannual changes in fire seasonality at global level. More recently, Giglio et al. [18] did a study of the seasonality of vegetation burning using the active fires products derived from the Moderate resolution Imaging Spectroradiometer (MODIS) instrument onboard the NASA/Terra and Aqua platforms.
At a regional level in Africa, systematic fire monitoring by Earth observations has been used in the Southern Africa region to support a range of studies related to the land-atmosphere interactions; more particularly in the context of the Southern African Regional Science Initiative: SAFARI-1992 [19] and SAFARI-2000 [20]. For the West Africa region, one could mention the work done by Langaas [21], more particularly on the diurnal fire cycle, or by Kennedy et al. [22] and Grégoire [23] on the seasonal distribution. In the specific case of the protected areas of the SUN network, Eva et al. [24] and Grégoire and Simonetti [25,26] have done a systematic monitoring of fire activity in these protected areas since 2004. For the Central Africa region, North of the equator, very few studies have been done on the fire seasonality. Eva and Lambin [27] provided some results on the diurnal fire cycle for the Central African Republic area. While Grégoire et al. [28] and Pereira et al. [29] characterised the temporal patterns of fire activity to classify the main fire regimes in the region.

2. Data and Methods

2.1. MODIS Fire Product

The present study is based on the MODIS active fire observations for the period 2004 to 2009. The MODIS instrument onboard the Terra and Aqua satellites (NASA, http://terra.nasa.gov/) provides the location of thermal anomalies at the surface of the Earth, four times a day: at 10.30 and 22.30 local time for Terra and at 13.30 and 01.30, for Aqua. These observations are well adapted for the detection of fire events active at the time of the satellite overpass [30]. The MODIS data are processed by the MODIS Rapid Response System, using the algorithm developed by Giglio et al. [31] and the resulting time series are made available for download by the Fire Information for Resource Management System (FIRMS; http://maps.geog.umd.edu/firms/) [32].

2.2. Extraction of the Active Fire Data

The Joint Research Centre (JRC) has developed an automatic procedure for the download of the fire time series from the FIRMS web server for the African continent since 2004. Fire pixels counts and locations are extracted on a weekly basis for all PAs of sub-saharan Africa. The resulting shape files and statistics are made available through a web server (http://gem.jrc.ec.europa.eu/) [26]. For a selection of PAs, including those of the SUN network, a weekly fire bulletin provides the park managers with the number and locations of the fire pixels detected during the week inside the PA and in a 25-km buffer zone outside the PA.

2.3. Analysis of the Spatio-Temporal Distribution of Fire Activity

In order to define the temporal patterns of burning activity, three variables have been used. The first one is the number of fire pixels detected during each week of the potential burning season which is set from the beginning of October to the end of March [33]. The second variable is the time expressed in number of weeks, since the start of the potential burning season, needed to reach 25% (t25) and 50% (t50) of the total number of fire pixels detected over the season. The third temporal variable is the length of the core burning season, which is expressed as the number of weeks between the first quartile (25% of the total) and the fourth quartile (75% of the total). Already proposed by Giglio [34] in his study of the diurnal fire cycle, this interquartile range provides a good indicator of the spread of the fire activity. Figure 2 shows a quite typical fire distribution for the West Africa Sudanian region.
Figure 2. Temporal distribution at a weekly time step of the fire activity in the Park W transboundary national park (Benin, Burkina Faso and Niger) for the 2006–2007 dry season. The vertical lines show from left to right when the cumulative number of fire pixels equal 25%, 50% and 75% of the seasonal total.
Remotesensing 02 00446 g002
In addition to the three variables used to characterise the temporal patterns of fire activity, two other variables have been defined for assessing the overall level of burning activity. First, the number of fire pixels per 1,000 ha detected over a given period of time; called fire density (fd) in the text, it allows comparisons between PAs. The second variable is the ratio between the fire density observed inside the PA and the one observed in a 25 km buffer zone around the area. Called Specificity Index (fsi) in the text, this ratio helps assessing how specific is a PA in terms of land cover conditions, compared to its surrounding. In fact, the fire density in the sudanian and guineo-sudanian regions is largely driven by the quantity and the spatial distribution of the fuel available for burning, essentially the grass layer. The quantity of grass biomass is much higher in the natural savannas or woodlands found in the PAs than in the surrounding area where croplands and pastures are the dominant land cover types. Moreover, numerous fire breaks prevent the development of fire events in this peripheral domain. The patterns of fire activity have been analysed for the four SUN test sites and have been compared to the fire dynamics observed in other 11 protected areas and in three large regional windows from West and Central Africa.

3. Results

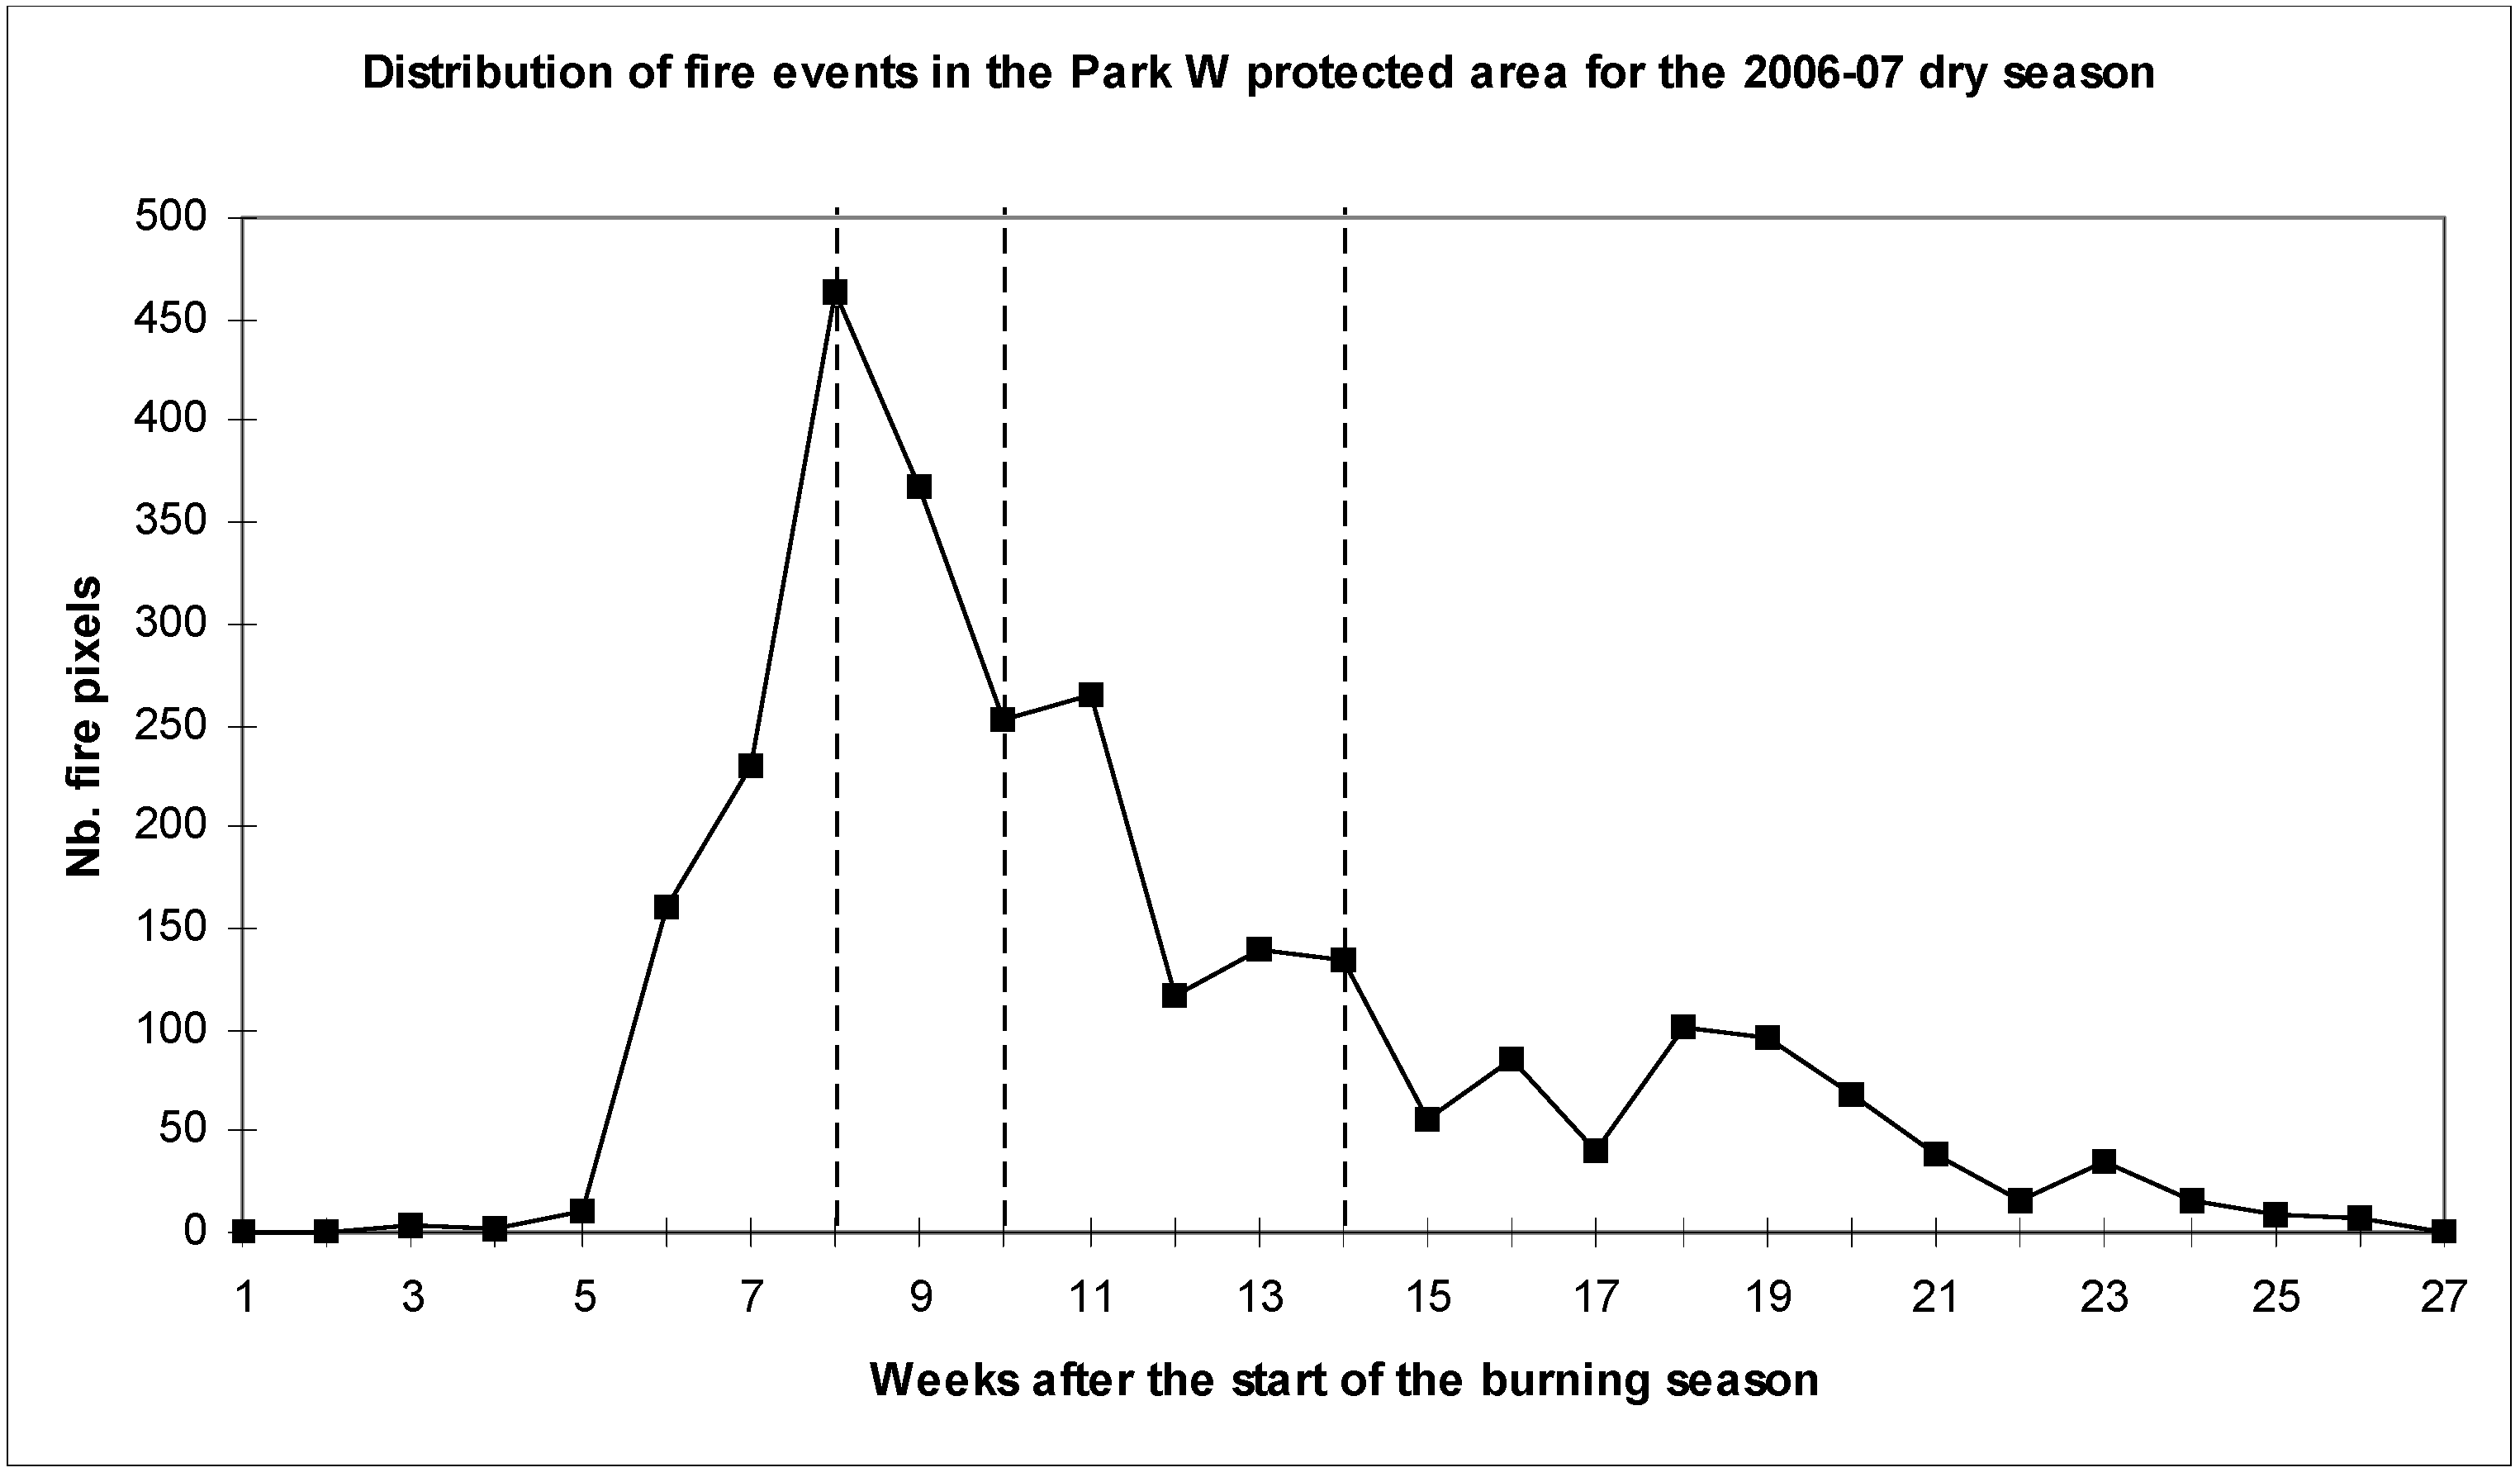
3.1. Seasonality of Fire Activity

The length of the core burning season, expressed as the number of weeks between the first quartile (25% of the total) and the fourth quartile (75% of the total), varies from a minimum of one week to a maximum of seven for all PAs, with the exception of Park W-Niger (Table 2; Figure 3). This range is quite stable over the five dry seasons considered here: 1 to 6 in 2004–05, 2005–06 and 2006–07; 1 to 7 in 2007–08 and 2008–09. The Park W-Niger tends to behave differently with a quite longer core burning season of 10 weeks in 2006–07 and 9 weeks in 2008–09.
Table 2. Fire seasonality for the 2004-09 period. st: number of fire pixels detected during the 1st week of October. t25: number of weeks, since 1st of Oct., to reach 25% of the seasonal total. t75: number of weeks between the 1st quartile (25%) and the 4th quartile (75%).
2004–052005–062006–072007–082008–09
Protected areastt25t75stt25t75stt25t75stt25t75stt25t75
Region 1
Boundou252054143062064
Niokolo-Koba01220114010401140106
Outamba-Kilimi01730183015601740167
Patako01710192014102610132
Region 2
Arly totale092065082065084
Boulon01210101010101130104
Deux Bales063065084076095
Digya01520134015201520152
Nazinga073063082065082
Pendjari192082085066096
Park W 75 64 76 56 75
ParkW-Benin076065076166085
ParkW-Burkina073062073052073
ParkW-Niger4750620710757069
Region 3
Bomu01140106010521250106
Garamba01335134215101440151
Zakouma085075084087075
all PAs (a) 52 61 6575 76
PAs window 1 (a) 8 13 1411 19
PAs window 2 (a) 32 33 4148 45
PAs window 3 (a) 12 15 1016 12
a total number of weeks of the core burning seasons in the set of Pas.
Figure 3. Fire distribution in Patako (red), Boulon (green), Park W (orange) and other 11 protected areas of West and Central Africa from 2004 to 2009. Number of weeks from the start of the burning season to reach 25% of the seasonal total (a) and 50% (b).
Remotesensing 02 00446 g003
Considering the set of 17 PAs, the cumulative number of weeks of the core burning seasons tends to increase with time: 52, 61, 65, 75 and 76 weeks for the 2004–05, 2005–06, 2006–07, 2007–08 and 2008–09 dry seasons respectively. Although not systematically observed in all PAs, this progressive increase of the spreading of the core burning season could be an indicator of an ongoing evolution of the temporal burning patterns in the West Africa region. The situation for Central Africa looks more stable. However, longer time series of fire data would be needed to confirm or not this tendency towards an increased spreading of the core burning season.
When looking at the PAs individually, one could consider two groups. In the first one, the length of the core burning season does not change much over the five year period: the transboundary Park W, the Park W-Benin, the Park W-Burkina, Bomu or Digya are in this group. In the second group, we observe the progressive increase of the spreading mentioned above: Boulon, Deux Bales, Outamba-Kilimi or Pendjari are in this category. One could think that the longer core season is associated to an earlier start of the fire activity; however the observations do not confirm this hypothesis. For instance, the Pendjari park has a core season of two and six weeks in 2004–05 and 2008–09, respectively; while the time delay to reach 25% of the total seasonal fire activity is exactly the same, nine weeks from the beginning of October, for the two dry seasons. In terms of ecological impacts, one would need to know if this trend towards a longer burning season, as observed on some PAs, is accompanied by an increase of the number of fire events. This is discussed in Section 3.2.
One could say that the assumption of the potential burning season starting during the first week of October might not reflect totally the reality on the field. The observations done during the five dry seasons considered here show that this hypothesis is quite acceptable. In fact, the cumulative number of fire pixels detected during the 1st week of October over the five year period (Table 2) is 0 for 10 PAs out of 16, less or equal to 3 for four PAs and 5 and 11 for the last two PAs. However, this assumption might not remain valid for ever. Modifications of the length of the rainy season, driven by the ongoing climate change, might in the future change the temporal characteristics of the burning seasons. Time series of satellite data should allow to detect such changes, if they become reality.

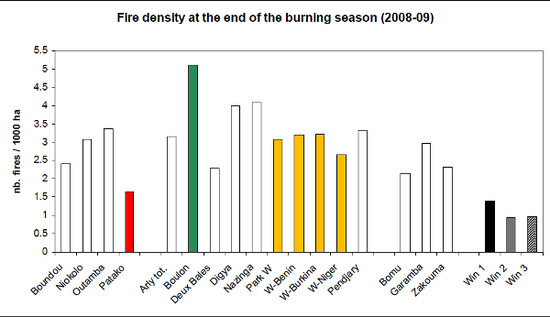
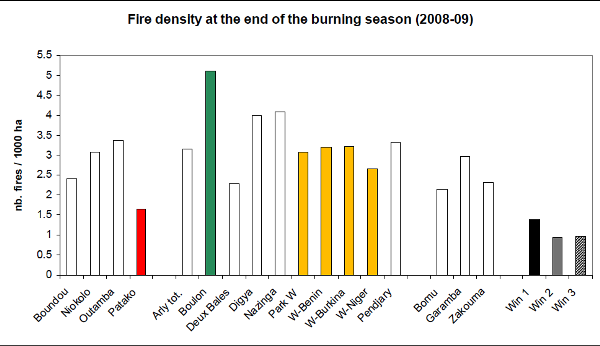
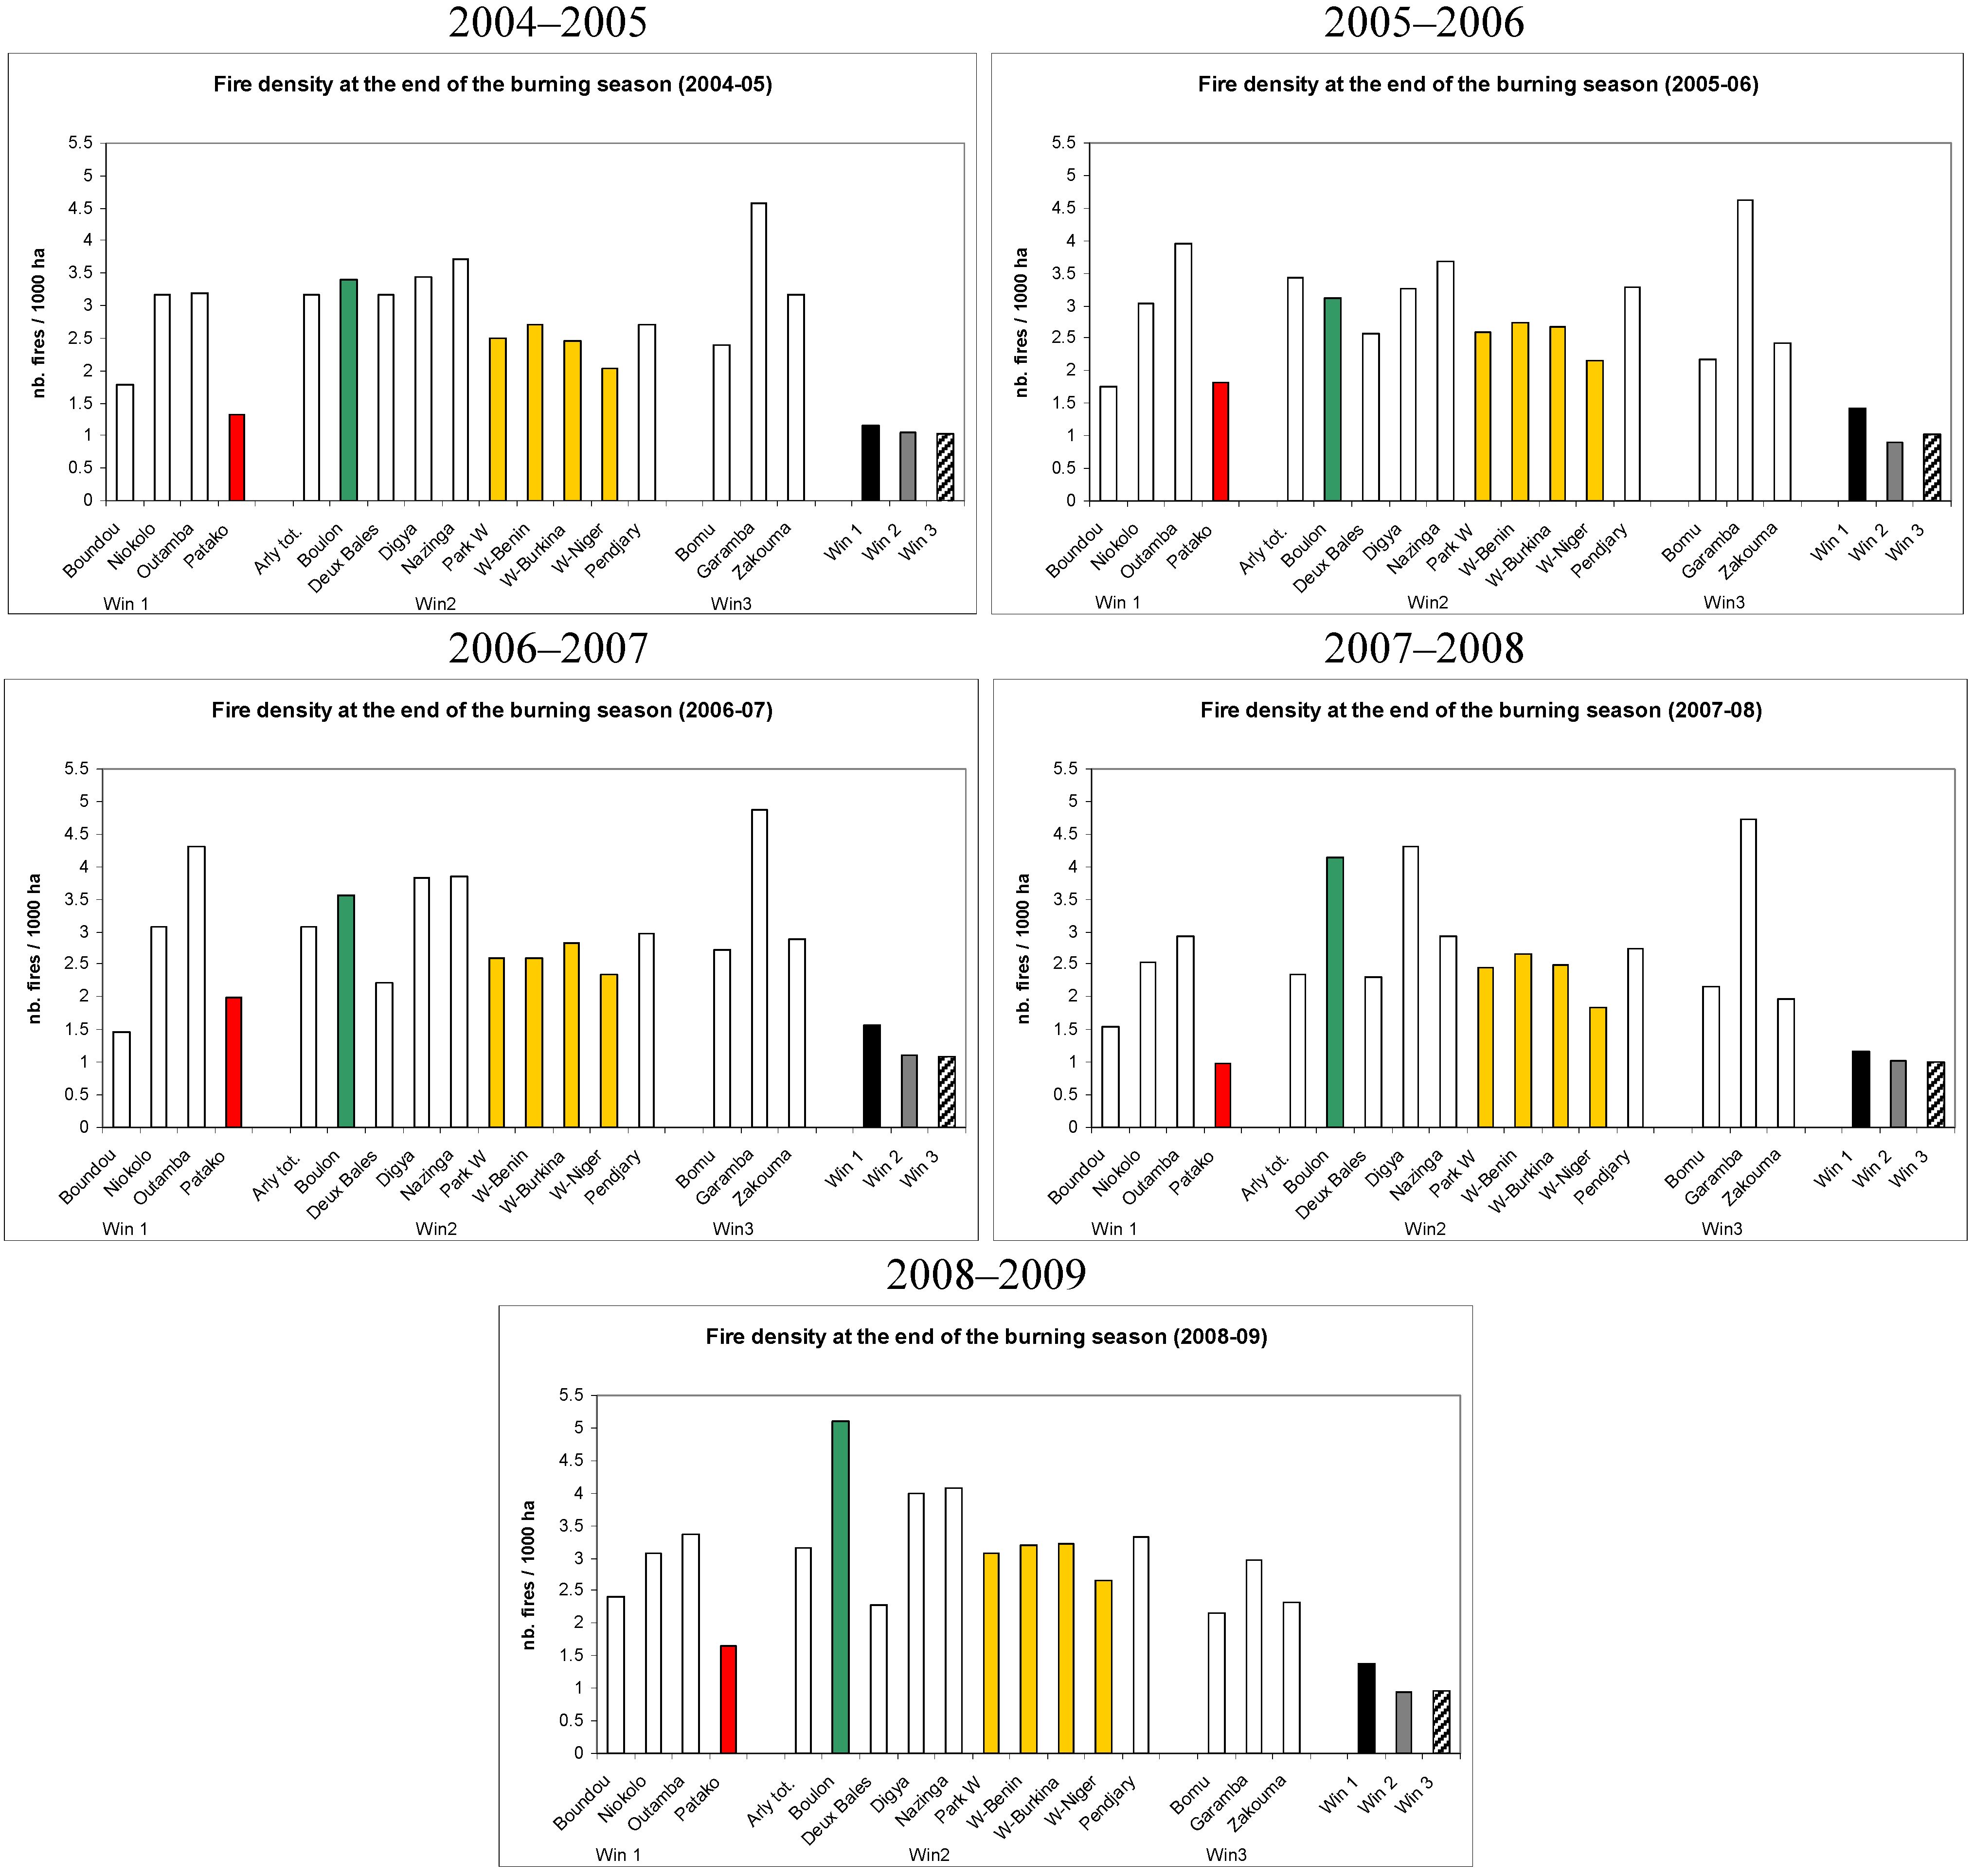
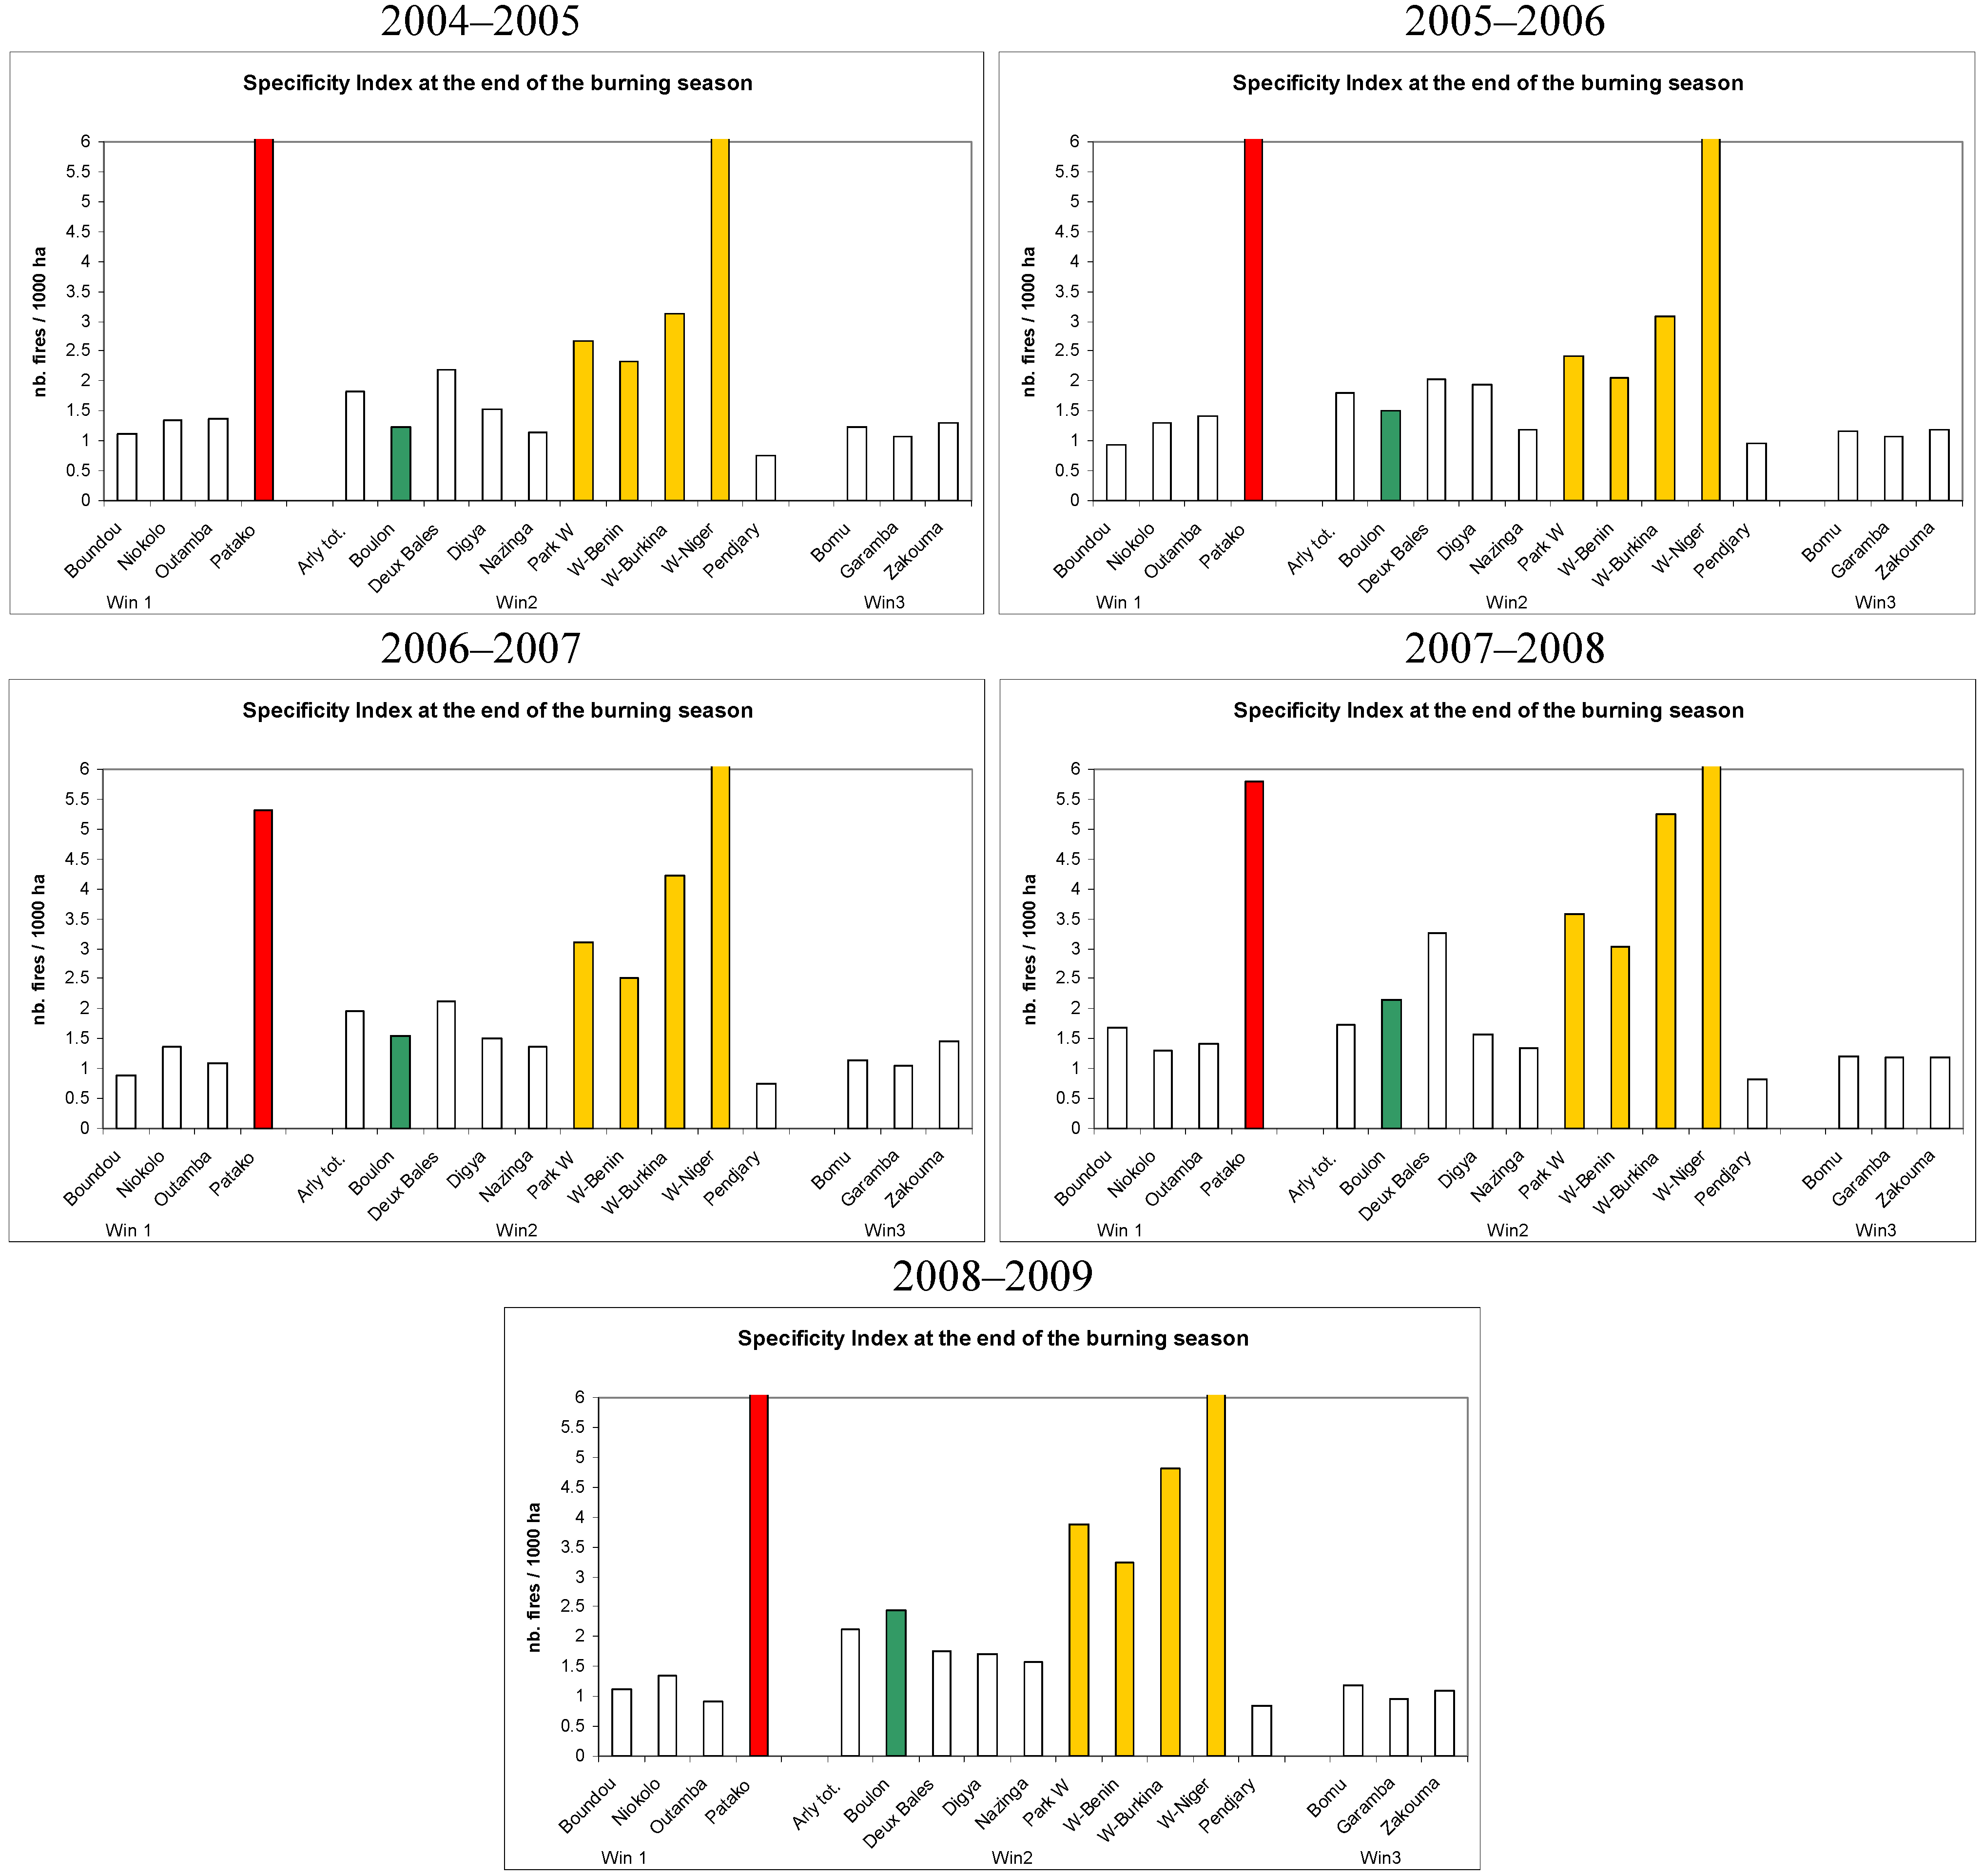
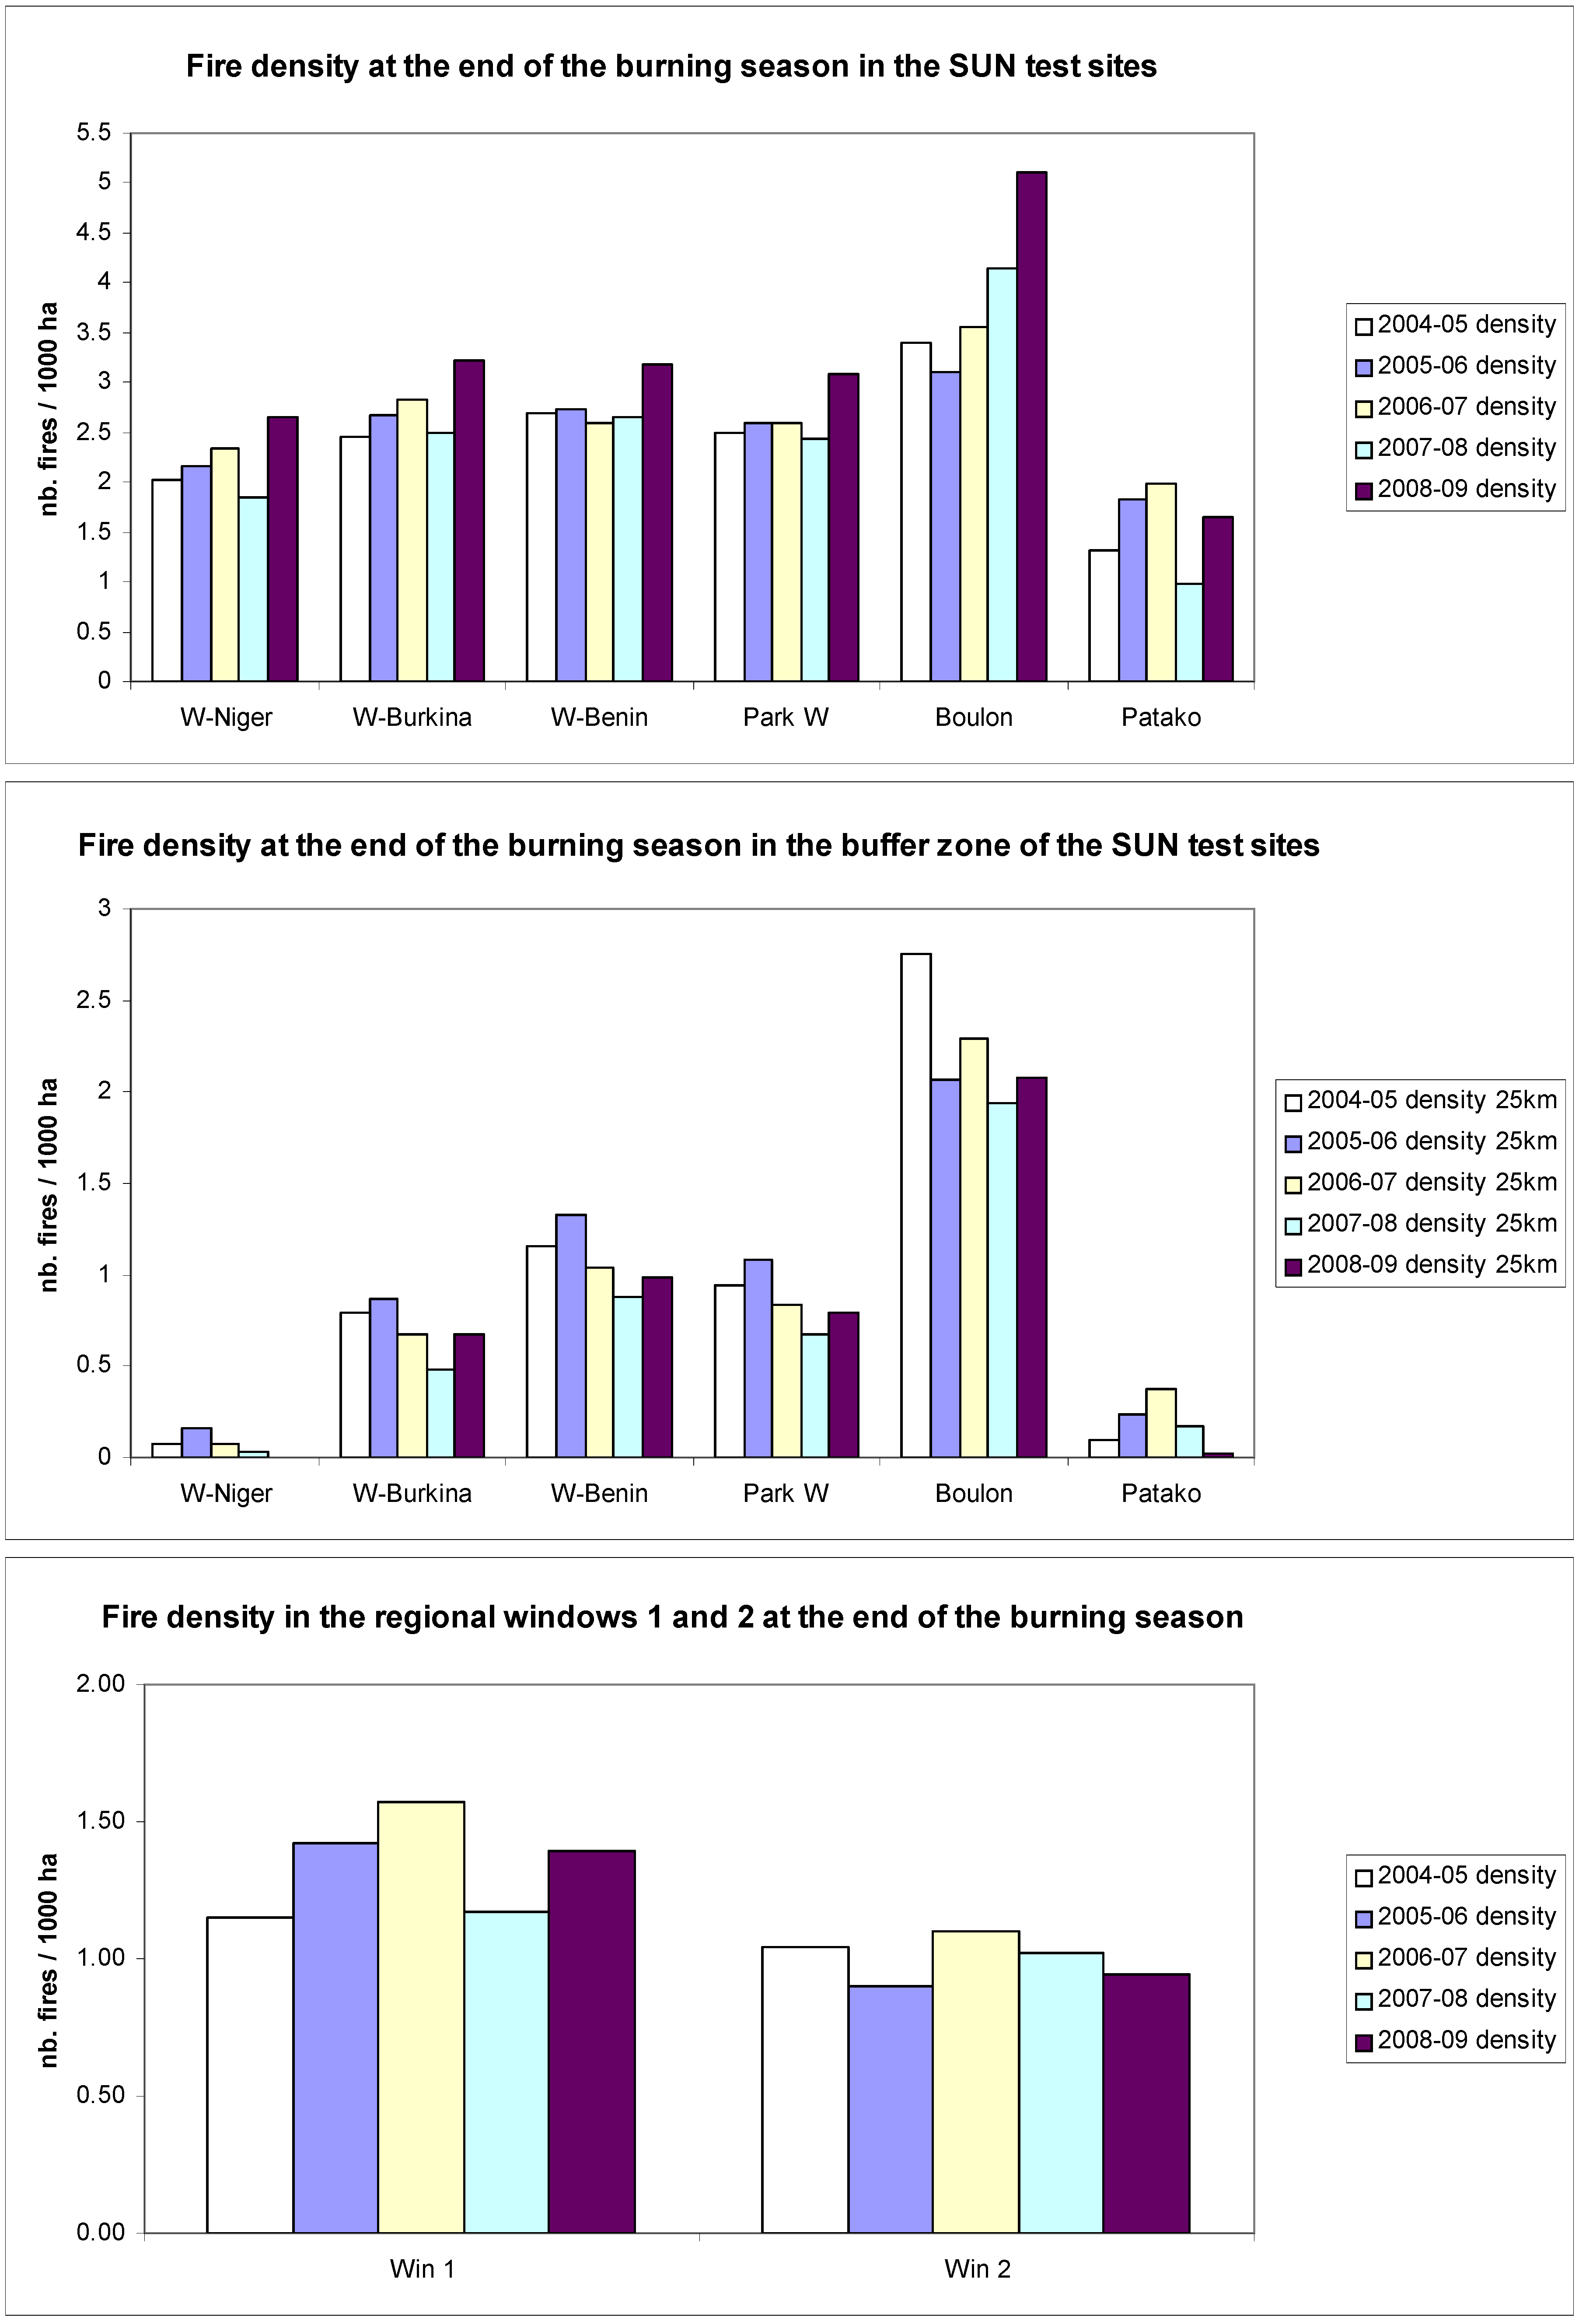
3.2. Level of Fire Activity Measured by the Fire Density

As explained in Section 2.3, the number of fire pixels per 1,000 ha, called fire density fd in the text, has been used to assess the level of the fire activity occuring in the PAs and in their buffer zones. The fire density, computed from the cumulative number of fire pixels at the end of the burning season inside the PAs, therefore excluding the fire pixels detected in the buffer zones, varies from a minimum of 1 to a maximum of 5 over the five year period (Table 3; Figure 4). The annual average value is 2.9, 2.9, 3.0, 2.7 and 3.1 for the 2004–05, 2005–06, 2006–07, 2007–08 and 2008–09 periods.
There are no evident relationships between the IUCN category and the fire density in the PAs. For instance, the PAs in Category II (National park; managed for ecosystem protection and recreation) are found in all levels of fire density: low, medium or high. One cannot say that a Category II PA is less affected by burning than a Category IV PA (Faunal reserve, for instance). In other words, the status of “protected area” which should go with an IUCN label is certainly not a guarantee of a sustainable use of burning in a given territory.
Table 3. Fire density in the 17 PAs (in) and in their 25-km buffer for five dry seasons from 2004 to 2009.
2004–052005–062006–072007–082008–092004–09 a
in-bufferin-bufferin-bufferin-bufferin-bufferin-buffer
Region 1Boundou1.78–1.581.75–1.881.46–1.651.55–0.922.41–2.151.79–1.64
Niokolo-K.3.17–2.363.04–2.323.07–2.262.54–1.973.08–2.282.98–2.24
Outamba-K.3.19–2.333.95–2.784.31–3.922.93–2.083.36–3.703.55–2.96
Patako1.32–0.101.82–0.241.99–0.370.99–0.171.65–0.021.55–0.18
Region 2Arly totale3.17–1.753.43–1.913.08–1.562.34–1.363.16–1.493.04–1.61
Boulon3.40–2.753.11–2.073.55–2.294.14–1.945.10–2.083.86–2.23
Deux Bales3.16–1.452.57–1.272.22–1.052.29–0.702.28–1.312.50–1.16
Digya3.44–2.263.26–1.673.83–2.534.31–2.743.99–2.343.77–2.31
Nazinga3.71–3.233.69–3.093.84–2.792.93–2.184.08–2.603.65–2.78
Pendjari2.71–3.653.28–3.412.96–3.882.73–3.363.32–3.953.00–3.65
Park W2.50–0.942.60–1.082.60–0.842.44–0.683.08–0.792.64–0.87
W-Benin2.70–1.162.73–1.332.60–1.042.65–0.883.19–0.992.77–1.08
W-Burkina2.46–0.792.67–0.872.83–0.672.49–0.483.22–0.672.73–0.70
W-Niger2.03–0.072.16–0.162.34–0.081.84–0.032.65–0.002.20–0.07
Region 3Bomu2.39–1.932.18–1.872.72–2.382.15–1.802.15–1.822.32–1.96
Garamba4.58–4.264.63–4.284.87–4.674.73–3.982.96–3.094.35–4.06
Zakouma3.17–2.432.43–2.042.89–1.991.96–1.662.33–2.122.56–2.05
all PAs b2.90–1.942.90–1.993.01–2.002.65–1.583.06–1.85
a computed over the 5 burning seasons; b average fire density, computed for each burning season.
The observations done in the present study indicate that the ecological conditions, which determine the amount of fuel available for burning, might be a strong driver of the fire density in the PAs. For instance, the Digya national park (Ghana, Guineo-Congolia/Sudanian ecoregion) shows over the five years an average fire density of 3.77. The Niokolo-Koba park (Senegal, Southern Sudanian ecoregion) has a value of 2.98, while the Boundou reserve (Senegal, Northern Sudanian ecoregion) has a value of 1.79. This decreasing fire density follows the decreasing amount of rainfalls, associated with a decreasing amount of grass biomass, from the Guineo-Congolia/Sudanian ecoregion in the South to the Sudanian ecoregion in the North.
It must be noted that the trend towards a longer burning season, mentioned in the previous section, is accompanied by an increase of the number of fire events for most PAs (10 out of 16), while this number decreases for 3 of them and remains more or less the same for the last 3.
Figure 4. Fire density (nb. fire pixels/1,000 ha) in Patako (red), Boulon (green), Park W (orange) and other 11 protected areas of West and Central Africa from 2004 to 2009. Fire density in the regional windows: window 1 (black), 2 (grey) and 3 (striped).
Remotesensing 02 00446 g004
If one compares the fire densities observed inside the PAs of the SUN network with those of the other PAs in a similar ecoregion, their relative situations do not change much over the 2004–2009 period (Figure 4). The Patako classified forest (Senegal) is always in the lower part of the distribution, while the Boulon classified forest (Burkina Faso) stands towards the high values of fire density; the Park W components tend to be in the average values.
If, instead, we consider the ratio between the fire density inside and in the 25 km buffer zone (Specificity Index), the situation for the SUN PAs appears quite different (Figure 5). They are clearly among the PAs for which there is a high contrast between the fire activity inside and outside the PA. The extreme situation being observed for the Patako classified forest and for the ParkW-Niger, with a Specificity Index always above 5, which means that the fire activity is 5 times higher in these PAs than in their surroundings. In fact, the average fire density in the buffer zones of Patako and of ParkW-Niger over the five year period has been extremely low: 0.2 and 0.1 for Patako and ParkW-Niger respectively.
Figure 5. Specificity Index in the Patako (red), Boulon (green), Park W (orange) and 11 other protected areas of West and Central Africa from 2004 to 2009.
Remotesensing 02 00446 g005
As discussed in Section 2.3, we hypothesize that this situation is largely due to the predominance of agriculture lands around the PA, with a low level of fuel and numerous fire breaks which would not allow the development of an intense fire activity. The GLC2000 land cover map [35] was used to assess the extent of agricultural land around the PAs. For Patako and ParkW-Niger, the GLC2000 land cover class ‘Cropland (>50% agriculture)” occupies 69% and 60% of the 25 km buffer zone; while it occupies 21%, 18% and 0% for ParkW-Benin, ParkW-Burkina and Boulon, respectively. These results, although based on satellite data acquired during the year 2000, while the fire information covers the period 2004–2009, seem to confirm that the fire activity around the PAs relates to the level of agricultural activity: increasing agriculture leads to a decrease of fire activity.
The evolution of the Boulon classified forest must be noted: its Specificity Index increases from 1.2, in 2004–05, to 2.5, in 2008–09. This means that the level of fire activity was more or less the same inside and outside the PA during the 2004–05 season, while five years later it is more than two times higher in the PA than in the surrounding buffer zone. In fact, the fire density has increased in the PA, from 3.4 to 5.1 over the five years, while it has decreased in the buffer zone, from 2.8 to 2.1. Here again, this change of the Specificity Index might be indicative of a progressive extension of the area dedicated to agriculture, at the expenses of the natural savannas, around the classified forest and consequently a progressive isolation of the Boulon protected area. A similar trend, although less pronounced, is observed for the Burkina and Benin components of Park W. If confirmed by additional observations in the coming years, this trend would be a clear indicator that these PAs are progressively loosing their capacity to conserve biodiversity. In fact, the conversion process around the PAs usually affects the structure and dynamics of the species populations inside the PAs [36,37].
In summary, for the PAs of the SUN network, we might conclude that an ecological isolation is ongoing for the Boulon forest and, to a minor extent, for the ParkW-Benin and ParkW-Burkina. For the Patako forest and ParkW-Niger, the ecological isolation is already quite high due to the extended agricultural land around these two PAs. As far as the Park W is concerned, these observations confirm the results of Clerici et al., [38] who quantified the loss of savanna habitat around Park W to be −14.5% over the 1984–2002 period.

3.3. Regional Context

It has been shown in Section 3.2 that the overall level of fire activity in many PAs, as measured by the Fire Density, has increased during the five year period considered here, while it has been stable or has decreased in the surrounding buffer zones. If we look at the regional context (Figure 6c), we observe a situation quite similar to the one observed in the buffer zones of the PAs: the overall fire activity in the West Africa region has remained stable or has slightly decreased during the 2004–2009 period. This situation is very clear for the PAs of the SUN network (Figure 6a,b) and has strong implications in terms of ecological role of the PAs. On the one hand, it shows that the land cover conditions, and therefore the habitat, of the territories included in a PA are effectively different from those observed in the surrounding lands. Such a difference is of course expected for an area which is supposed to be protected. On the other hand, the increasing fire activity observed inside the PAs is a clear indicator that the overall anthropic pressure on the PAs has increased during the last five year period. In fact, most if not all fires in the West and Central Africa savannas are man made. Fires due to lightning are an exception in these regions. We can therefore conclude that the increase of the fire activity in the PAs is an indicator of an increased anthopic pressure on these territories. One could argue that the fire activity in the PAs is part of local management plans which include prescribe burning for habitat management purposes. In such a case, fires would not be attributed to unwanted antropic activities. However, this hypothesis is not supported by the observations. For the few parks for which burning plans are existing and known, such as the three national components of Park W, the satellite observations show that there is no or very little correspondence between the burning calendar observed and the one designed in the management plans [25].
Figure 6. Fire density (nb. fire events/1,000 ha) inside the SUN test sites (a), in their 25 km buffer zone (b) and in the regional windows (c) from 2004 to 2009.
Remotesensing 02 00446 g006
Moreover, it is difficult to explain why prescribed burning should increase over time. One could understand a change in the spatial distribution of fires inside the PAs or a change in burning calendars but not an overall increase of the number of fire events. A situation such as the one observed in the Boulon classified forest, 50% increase over the five year period, cannot be attributed to prescribe burning programs. In summary, we can conclude that the PAs considered in this study appear effectively different from the surrounding lands but that the official status of National Park or Faunal Reserve is not always an insurance of protection for a particular territory, at least in the West and Central Africa regions.

4. Conclusions

The five year time series of fire occurences, derived from MODIS data, have allowed us to characterise the fire seasonality and the overall level of burning activity in the protected areas of the SUN network as well as in other 11 PAs from the West and Central Africa regions. The results show clearly that both the temporal distribution of the fire activity and the number of fire occurences are quite different inside the PAs and in their surrounding area. They show also that the general trend outside the PAs is a decrease, −27% on average in the buffer zone of 12 PAs out of 16, of burning activity measured by the fire density over the 2004-2009 period while the opposite is observed inside the PAs: the fire density has increased for 11 PAs out of 16 (+22% on average). The decrease outside the PAs is most probably associated to the conversion of natural savannas to agriculture lands, and consequently by a decrease of fuel availability. In fact, when the fuel is available, such as inside the PAs, the fire activity has increased over the same period. Moreover, the length of the core burning season tends also to increase inside the PAs.
Considering the role of the PAs to help protecting the biological diversity, these results are clear indicators of a negative trend. In fact, they show that there is an on-going process of isolation of the PAs which will have an impact on their capacity to maintain the level of biological diversity. Moreover, the overall increase of burning activity inside the PAs and the fire seasonality characteristics indicate that the anthropic pressure is high and that the official status of national park or faunal reserve is quite often purely formal and does not really protect the territories included in the PAs’ perimeter.
As shown by Buchanan et al., [39] in their analysis of threats to Important Bird Areas (IBAs) in Africa, agricultural expansion, together with deforestation, is one of the prevalent threats to bird habitats and more generally to biodiversity in Africa. Remote sensing is already used to assess land cover changes, and more specifically the conversion of natural vegetation to agriculture, as was done statistically by Brink and Eva [40]. However, these assessments require the processing and analysis of huge satellite datasets and cannot be done frequently. For instance, the most recent land cover map of the African continent was published by Mayaux et al., in 2004 [35] based on the analysis of low resolution satellite imagery from the year 2000. To bring up to date these continental scale land cover maps or the statistical assessments of agricultural expansion requires on average four to five years. In this situation, the monitoring of fire activity, at least in the non humid forest domain, could complement the direct observation of land cover conditions and greatly help to improve our capacity to identify land use and land cover changes inside and in the surrounding of the PAs, and more generally in regions of high biodiversity value.
From a management point of view, reliable and timely information on fire activity can provide the park managers with a powerful tool for planning and monitoring prescribe burning, as well as for detecting unwanted dynamics which can affect the ecological role of the PAs in the region.
Another issue is our capacity to assess quantitatively and in a timely manner the effectiveness of conservation projects and policies. Here again, the continuous monitoring of fire activity could allow, if combined with other information related to habitats and species richness, the development of a fire based indicator usable for comparisons between PAs and for temporal trends analysis. Such a Fire Based Indicator would have a large geographical domain of application. In fact, from the 142,358,031 ha occupied by the 390 national parks and reserves of sub-Saharan Africa (IUCN categories II and IV), 59% (83,498,569 ha) are included in ecoregions charaterised by a high to very high risk of fire occurrence during the dry season, 24% (33,791,210 ha) in ecoregions of medium risk of fire occurence and 17% (25,068,252 ha) in ecoregions with low to very low risk of fire occurrence. Fire monitoring is therefore a necessity if we want to improve the management of most African parks and reserves [7,8]. Last but not least, the projected climate changes will most probably have a strong impact on the distribution of habitats [41] and on the fire regimes of the African continent [42].
In this respect, the burnt area time series released recently by the MODIS team [43] is a good candidate for an extension of the present study to all PAs of sub-saharan Africa, back to the year 2000. Future work will also investigate the potential of the active fire product derived from the SEVIRI instrument onboard the Meteosat-8 geostationnary satellite. Recent work by Amraoui et al., [44] has clearly shown that such data could help characterising the diurnal and seasonal distribution of fire activity.

Acknowledgements

The authors thank Mihkel Punga and Désirée Johansson for their assistance for downloading and pre-processing of the MODIS fire time series. We also thank Minnie Wong from the FIRMS team at the University of Maryland for her assistance in accessing the MODIS fire time series. Appreciation also goes to the anonymous reviewers for their comments and suggestions for improving the manuscript. This work was supported by the EC funded SUN project.

References and Notes

  1. Dulieu, D. La végétation du Complexe WAP. In Les Grands Mammiferes Du Complexe WAP; Lamarque, F., Ed.; ECOPAS Press: Ouagadougou, Burkina Faso, 2004; pp. 16–24. [Google Scholar]
  2. UNEP-WCMC. World Database on Protected Areas; United Nations Environment Program, World Conservation Monitoring Centre: Cambridge, UK, 2005.
  3. Trollope, W.S.W.; Tainton, N.M. Effect of fire intensity on the grass and bush components of the Eastern Cape Thornveld. J. Grassl. Soc. Sth. Afr. 1986, 2, 27–42. [Google Scholar] [CrossRef]
  4. Trollope, W.S.W.; Potgieter, A.L.F.; Zambatis, N. Characterization of Fire Behaviour in the Kruger National Park; National Parks Board, Kruger National Park: Skukuza, South Africa, 1990. [Google Scholar]
  5. Brockett, B.H.; Biggs, H.C.; van Wilgen, B.W. A patch mosaic burning system for conservation areas in southern African savannas. Int. J. Wildland Fire 2001, 10, 169–183. [Google Scholar] [CrossRef]
  6. Roques, K.G.; O'Connor, T.G.; Watkinson, A.R. Dynamics of shrub encroachment in an African savanna: relative influences of fire, herbivory, rainfall and density dependence. J. Appl. Ecol. 2001, 38, 268–280. [Google Scholar] [CrossRef]
  7. Bond, W.J.; Archibald, S. Confronting complexity: fire policy choices in South African savanna parks. Int. J. Wildland Fire 2003, 12, 381–389. [Google Scholar] [CrossRef]
  8. van Wilgen, B.W.; Trollope, W.S.W.; Biggs, H.C.; Potgieter, A.L.F.; Brockett, B.H. Fire as a driver of ecosystem variability. In The Kruger Experience: Ecology and Management of Savanna Heterogeneity; Du Toit, J.T., Rogers, K.H., Biggs, H.C., Eds.; Island Press: Washington/Covelo: London, UK, 2003; pp. 149–170. [Google Scholar]
  9. van Wilgen, B.W.; Govender, N.; Biggs, H.C.; Ntsala, D.; Funda, X.N. Response of savanna fire regimes to changing fire-management policies in a large African national park. Conserv. Biol. 2004, 18, 1533–1540. [Google Scholar] [CrossRef]
  10. Menaut, J.C.; Gignoux, J.; Prado, C.; Clobert, J. Tree community dynamics in a humid savanna of the Cote-dIvoire: modelling the effects of fire and competition with grass and neighbours. J. Biogeogr. 1990, 17, 471–481. [Google Scholar] [CrossRef]
  11. Mbow, C.; Nielsen, T.T.; Rasmussen, K. Savanna fires in east central Senegal: distribution patterns, resource management and perceptions. Hum. Ecol. 2000, 28, 561–583. [Google Scholar] [CrossRef]
  12. Nielsen, T.T.; Rasmussen, K. Utilization of NOAA AVHRR for assessing the determinants of savanna fire distribution in Burkina Faso. Int. J. Wildland Fire 2001, 10, 129–135. [Google Scholar] [CrossRef]
  13. Fournier, A.; Floret, C.; Gnahoua, G.-M. Végétation des jachères et succession post-culturale en Afrique tropicale. In La Jachère en Afrique Tropicale; Floret, Ch., Pontanier, R., Eds.; John Libbey Eurotext: Paris, France, 2001; pp. 123–168. [Google Scholar]
  14. Sawadogo, L.; Tiveau, D.; Nygård, R. Influence of selective tree cutting, livestock and prescribed fire on herbaceous biomass in the savanna woodlands of Burkina Faso, West Africa. Agri. Ecosyst. Environ. 2005, 105, 335–345. [Google Scholar] [CrossRef]
  15. Dwyer, E.; Pereira, J.M.C.; Grégoire, J.-M.; Dacamara, C.C. Characterization of the spatio-temporal patterns of global fire activity using satellite imagery for the period April 1992 to March 1993. J. Biogeogr. 2000, 27, 57–69. [Google Scholar] [CrossRef]
  16. Barbosa, P.; Stroppiana, D.; Grégoire, J.-M.; Pereira, J.M.C. An assessment of vegetation fire in Africa (1981-1991): burned areas, burned biomass, and atmospheric emissions. Global Biogeochem. Cycle. 1999, 13, 933–950. [Google Scholar] [CrossRef]
  17. Schultz, M.G. On the use of ATSR fire count data to estimate the seasonal and interannual variability of vegetation fire emissions. Atmos. Chem. Phys. 2002, 2, 387–395. [Google Scholar] [CrossRef]
  18. Giglio, L.; Csiszar, I.; Justice, C.O. Global distribution and seasonality of active fires as observed with the Terra and Aqua Moderate Resolution Imaging Spectroradiometer (MODIS) sensors. J. Geophys. Res. 2006, 111, G02016. [Google Scholar] [CrossRef]
  19. Justice, C.O.; Kendall, J.D.; Dowty, P.R.; Scholes, R.J. Satellite remote sensing of fires during the SAFARI campaign using NOAA advanced very high resolution radiometer data. J. Geophys. Res. 1996, 101, 23851–23863. [Google Scholar] [CrossRef]
  20. Anyamba, A.; Justice, C.O.; Tucker, C.J.; Mahoney, R. Seasonal to interannual variability of vegetation and fires at SAFARI 2000 sites inferred from advanced very high resolution radiometer time series data. J. Geophys. Res. 2003, 108. [Google Scholar] [CrossRef]
  21. Langaas, S. Temporal and spatial distribution of savanna fires in Senegal and The Gambia, West Africa, 1989-90, derived from multi-temporal AVHRR night images. Int. J. Wildland Fire 1992, 2, 21–36. [Google Scholar] [CrossRef]
  22. Kennedy, P.J.; Belward, A.S.; Grégoire, J.-M. An improved approach to fire monitoring in West Africa using AVHRR data. Int. J. Remote Sens. 1994, 15, 2235–2255. [Google Scholar] [CrossRef]
  23. Grégoire, J.-M. Description quantitative des régimes de feu en zone soudanienne d'Afrique de l'Ouest. Sécheresse 1993, 4, 37–45. [Google Scholar]
  24. Eva, H.D.; Grégoire, J.-M.; Mayaux, P. Support for fire management in Africa’s protected areas. In JRC Scientific and Technical Research Series; Office for Official Publications of the European Communities: Luxembourg, 2004; pp. 1–63. [Google Scholar]
  25. Grégoire, J.-M.; Simonetti, D. Dynamique des brûlis dans le Parc Régional du W, le Parc National de La Boucle de la Pendjari et la Réserve d'Arly-Implications pour la gestion de ces aires protégées. In JRC Scientific and Technical Research Series; Office for Official Publications of the European Communities: Luxembourg, 2007; pp. 1–48. [Google Scholar]
  26. Grégoire, J.-M.; Simonetti, D. Dynamique des brûlis dans les aires protégées du réseau SUN [Bénin, Burkina Faso, Niger et Sénégal] Saison sèche 2007–2008: octobre 2007–mars 2008. In JRC Scientific and Technical Research Series; Office for Official Publications of the European Communities: Luxembourg, 2008; pp. 1–42. [Google Scholar]
  27. Eva, H.; Lambin, E.F. Remote sensing of biomass burning in tropical regions: sampling issues and multisensor approach. Remote Sens. Environment 1998, 64, 292–315. [Google Scholar] [CrossRef]
  28. Grégoire, J.-M.; Pinnock, S.; Dwyer, E.; Janodet, E. Satellite monitoring of vegetation fires for EXPRESSO: Outline of activity and relative importance of the study area in the global picture of biomass burning. J. Geophys. Res. 1999, 104, 30691–30699. [Google Scholar] [CrossRef]
  29. Pereira, J.M.C.; Pereira, B.S.; Barbosa, P.; Stroppiana, D.; Vasconcelos, M.J.P.; Grégoire, J.-M. Satellite monitoring of fire in the EXPRESSO study area during the 1996 dry season experiment: Active fires, burnt area, and atmospheric emissions. J. Geophys. Res. 1999, 104, 30701–30712. [Google Scholar] [CrossRef]
  30. Kaufman, Y.J.; Justice, C.O.; Flynn, L.P.; Kendall, J.D.; Prins, E.M.; Giglio, L.; Ward, D.E.; Menzel, W.P.; Setzer, A.W. Potential global fire monitoring from EOS-MODIS. J. Geophys. Res. 1998, 103, 32215–32238. [Google Scholar] [CrossRef]
  31. Giglio, L.; Descloitres, J.; Justice, C.O.; Kaufman, Y.J. An enhanced contextual fire detection algorithm for MODIS. Remote Sens. Environ. 2003, 87, 273–282. [Google Scholar] [CrossRef]
  32. Davies, D.K.; Ilavajhala, S.; Wong, M.M.; Justice, C.O. Fire information for resource management system: archiving and distributing MODIS active fire data. IEEE Trans. Geosci. Remote Sens. 2009, 47, 72–79. [Google Scholar] [CrossRef]
  33. Menaut, J.-C.; Abbadie, L.; Lavenu, F.; Loudjani, P.; Podaire, A. Biomass burning in West African savannas. In Global Biomass Burning—Atmospheric, Climatic, and Biospheric Implications; Levine, J.S., Ed.; The MIT Press: Cambridge, MA, USA, 1991; pp. 133–142. [Google Scholar]
  34. Giglio, L. Characterization of the tropical diurnal fire cycle using VIRS and MODIS observations. Remote Sens. Environ. 2007, 108, 407–421. [Google Scholar] [CrossRef]
  35. Mayaux, P.; Bartholomé, E.; Fritz, S.; Belward, A. A new land-cover map of Africa for the year 2000. J. Biogeogr. 2004, 31, 861–877. [Google Scholar] [CrossRef]
  36. Gascon, C.; Williamson, G.B.; Da Fonseca, G.A.B. Receding forest edges and vanishing reserves. Science 2000, 288, 1356–1358. [Google Scholar] [CrossRef] [PubMed]
  37. Woodroffe, R.; Ginsberg, J.R. Edge effects and the extinction of populations inside protected areas. Science 1998, 280, 2126–2128. [Google Scholar] [CrossRef] [PubMed]
  38. Clerici, N.; Bodini, A.; Eva, H.; Grégoire, J.-M.; Dulieu, D.; Paolini, C. Increased Isolation of Two Biosphere Reserves and Surrounding Protected Areas (WAP Ecological Complex, West Africa). J. Nat. Conserv. 2007, 15, 26–40. [Google Scholar] [CrossRef]
  39. Buchanan, G.M.; Donald, P.; Fishpool, L.; Arinaitwe, J.; Balman, M.; Mayaux, P. An Assessment of Land Cover and Threats in Important Bird Areas in Africa. Bird Conserv. Int. 2009, 19, 49–61. [Google Scholar] [CrossRef]
  40. Brink, A.; Eva, H.D. Monitoring 25 years of land cover change dynamics in Africa: a sample based remote sensing approach. Appl. Geogr. 2009, 29, 501–512. [Google Scholar] [CrossRef]
  41. Hole, D.G.; Willis, S.G.; Pain, D.J.; Fishpool, L.D.; Butchart, H.M.; Collingham, Y.C.; Rahbek, C.; Huntley, B. Projected impacts of climate change on a continent-wide protected area network. Ecol. Lett. 2009, 12, 420–431. [Google Scholar] [CrossRef] [PubMed]
  42. van der Werf, G.R.; Randerson, J.Y.; Giglio, L.; Gobron, N.; Dolman, A.J. Climate controls on the variability of fires in the tropics and subtropics. Global Biogeochem. Cycle. 2008, 22, GB3028. [Google Scholar] [CrossRef]
  43. Roy, D.P.; Boschetti, L.; Justice, C.O.; Ju, J. The collection 5 MODIS burned area product–Global evaluation by comparison with the MODIS active fire product. Remote Sens. Environ. 2008, 112, 3690–3707. [Google Scholar] [CrossRef]
  44. Amraoui, M.; DaCamara, C.C.; Pereira, J.M.C. Fire detection and monitoring over Africa. In Proceedings of 2008 EUMETSAT Meteorological Satellite Conference, Darmstadt, Germany, September 2008; p. 52.

