Evaluating Potential of MODIS-based Indices in Determining “Snow Gone” Stage over Forest-dominant Regions
Abstract
:1. Introduction
2. Methods
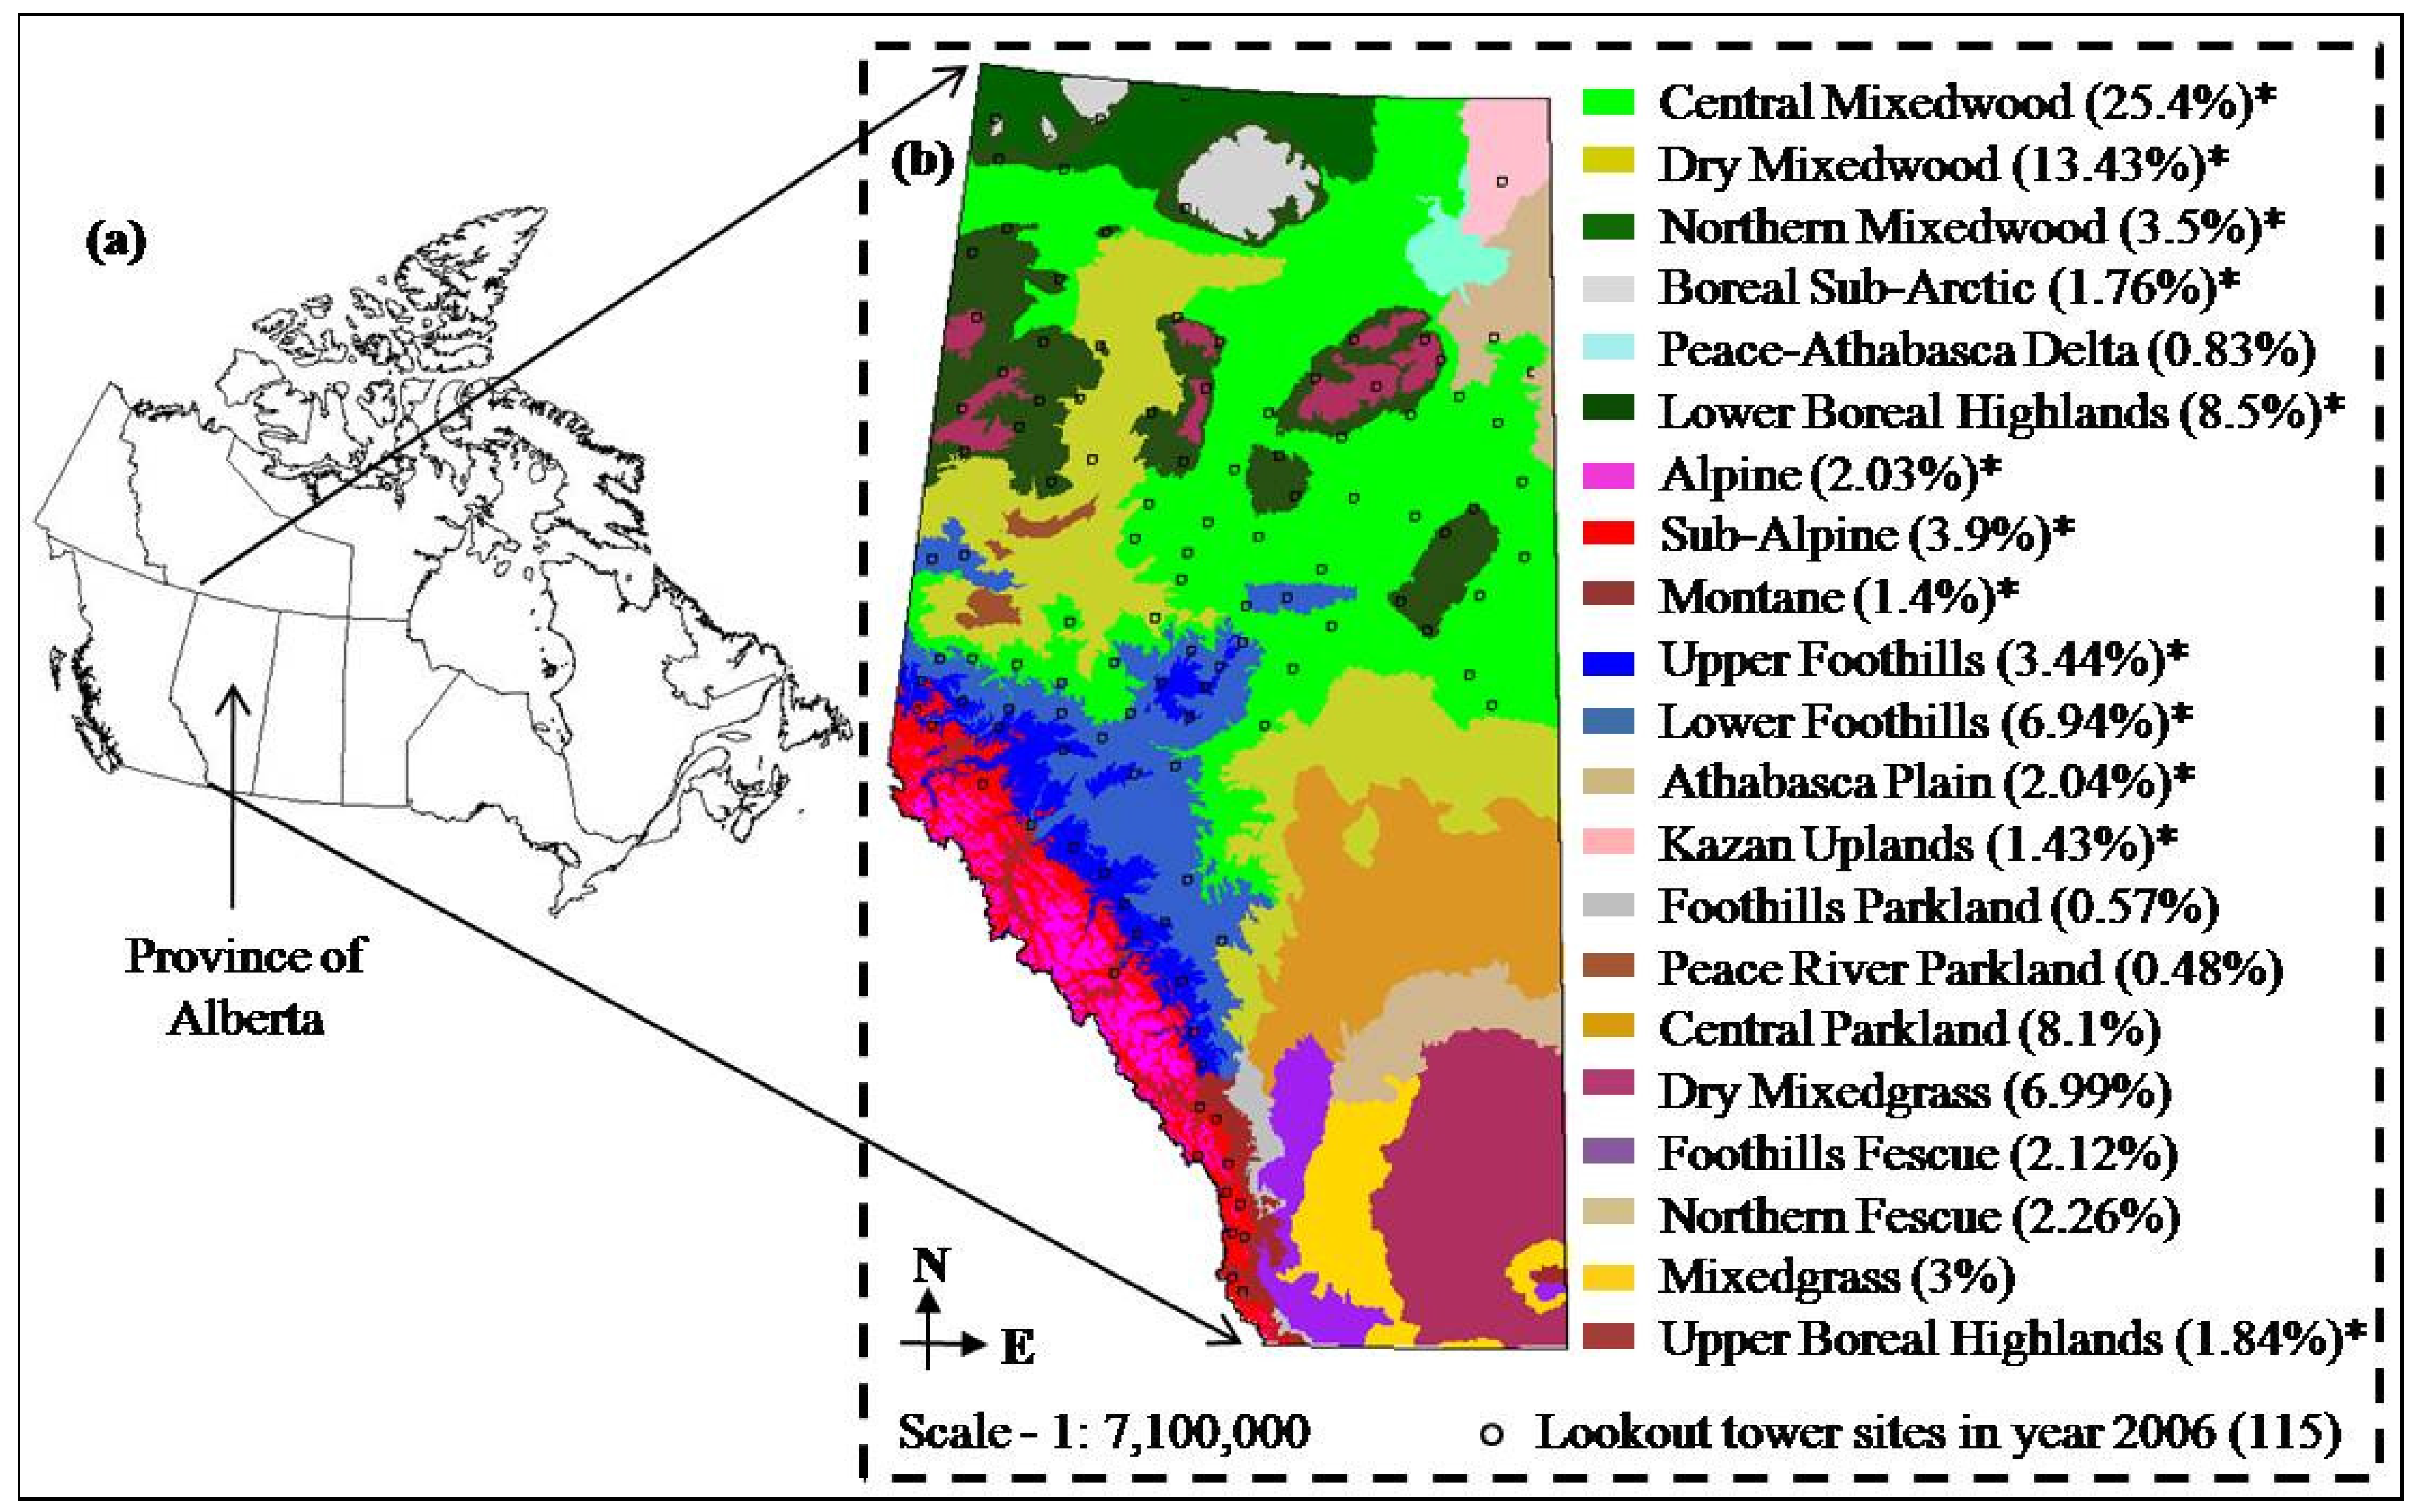
2.1. General Description of the Study Area and Data Requirement

| Natural subregion | Area (Sq. Km.) | Mean annual Temp. (°C) | Mean annual precip. (mm) | Dominant vegetation | No. of lookout towers* |
|---|---|---|---|---|---|
| Dry Mixedwood | 85,321 | 1.1 | 461 | Deciduous-dominant mixedwood | 2 |
| Central Mixedwood | 167,856 | 0.2 | 478 | Deciduous-dominant mixedwood | 24 |
| Lower Boreal Highlands | 55,615 | −1.0 | 495 | Early to mid-seral pure or mixed forests hybrids | 21 |
| Upper Boreal Highlands | 11,858 | −1.5 | 535 | Conifer dominated | 11 |
| Northern Mixedwood | 29,513 | −2.5 | 387 | Conifer dominated | 2 |
| Boreal Subarctic | 11,823 | −3.6 | 512 | Conifer dominated (Picea mariana ) | 3 |
| Upper Foothills | 21,537 | 1.3 | 632 | Conifer dominated | 15 |
| Lower Foothills | 44,899 | 1.8 | 588 | Conifer-dominant mixedwood | 15 |
| Alpine | 15,084 | −2.4 | 989 | Largely non-vegetated, shrublands | 5 |
| Sub-Alpine | 25,218 | −0.1 | 755 | Mixed Conifer | 12 |
| Montane | 8,768 | 2.3 | 589 | Populus, Pinus, Pseudotsuga, grasslands | 2 |
| Athabasca Plain | 13,525 | −1.2 | 428 | Pinus, dunes largely unvegetated | 2 |
| Kazan Uplands | 9,719 | −2.6 | 380 | Mainly rock barrens, pockets of Pinus, Betula, Populus | 1 |
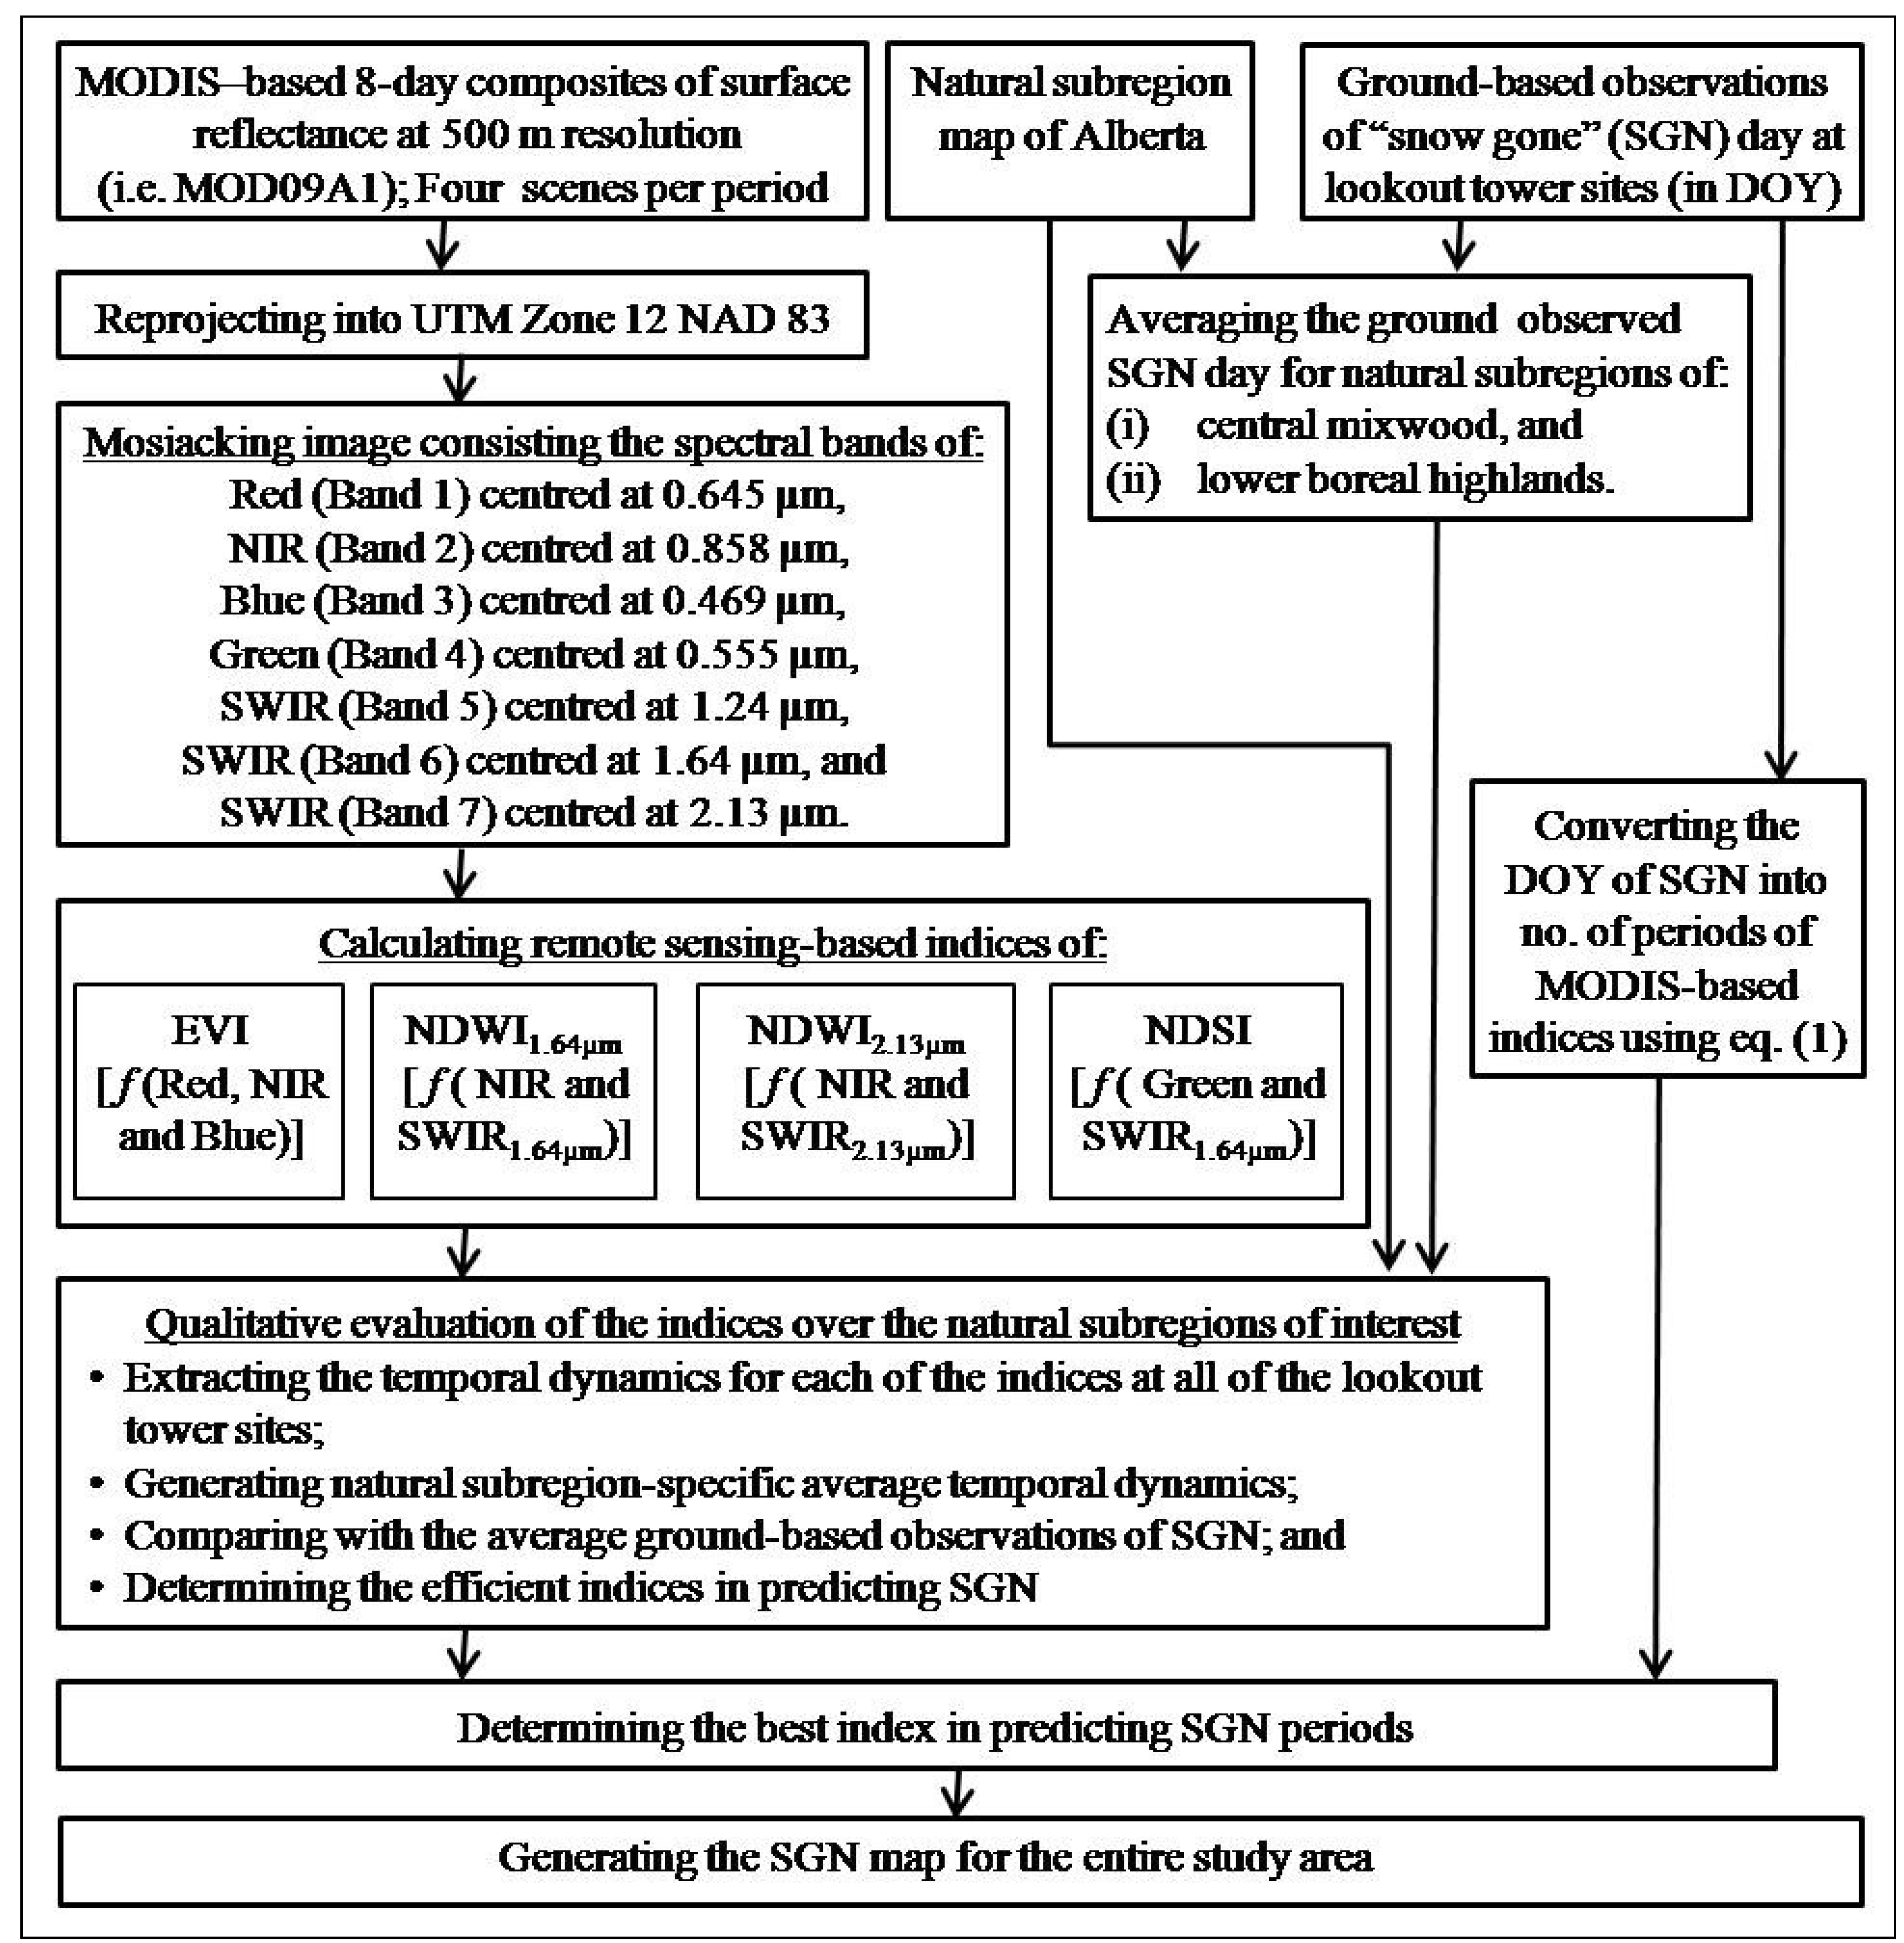
2.2. Data Processing

- extracted the temporal dynamics of each of the indices at all of the lookout tower sites; and then generated subregion-specific average temporal dynamics for each of the indices;
- calculated the natural subregion-specific average SGN day using the ground-based observations; and
- compared the values obtained from steps (i) and (iii).
3. Results and Discussion
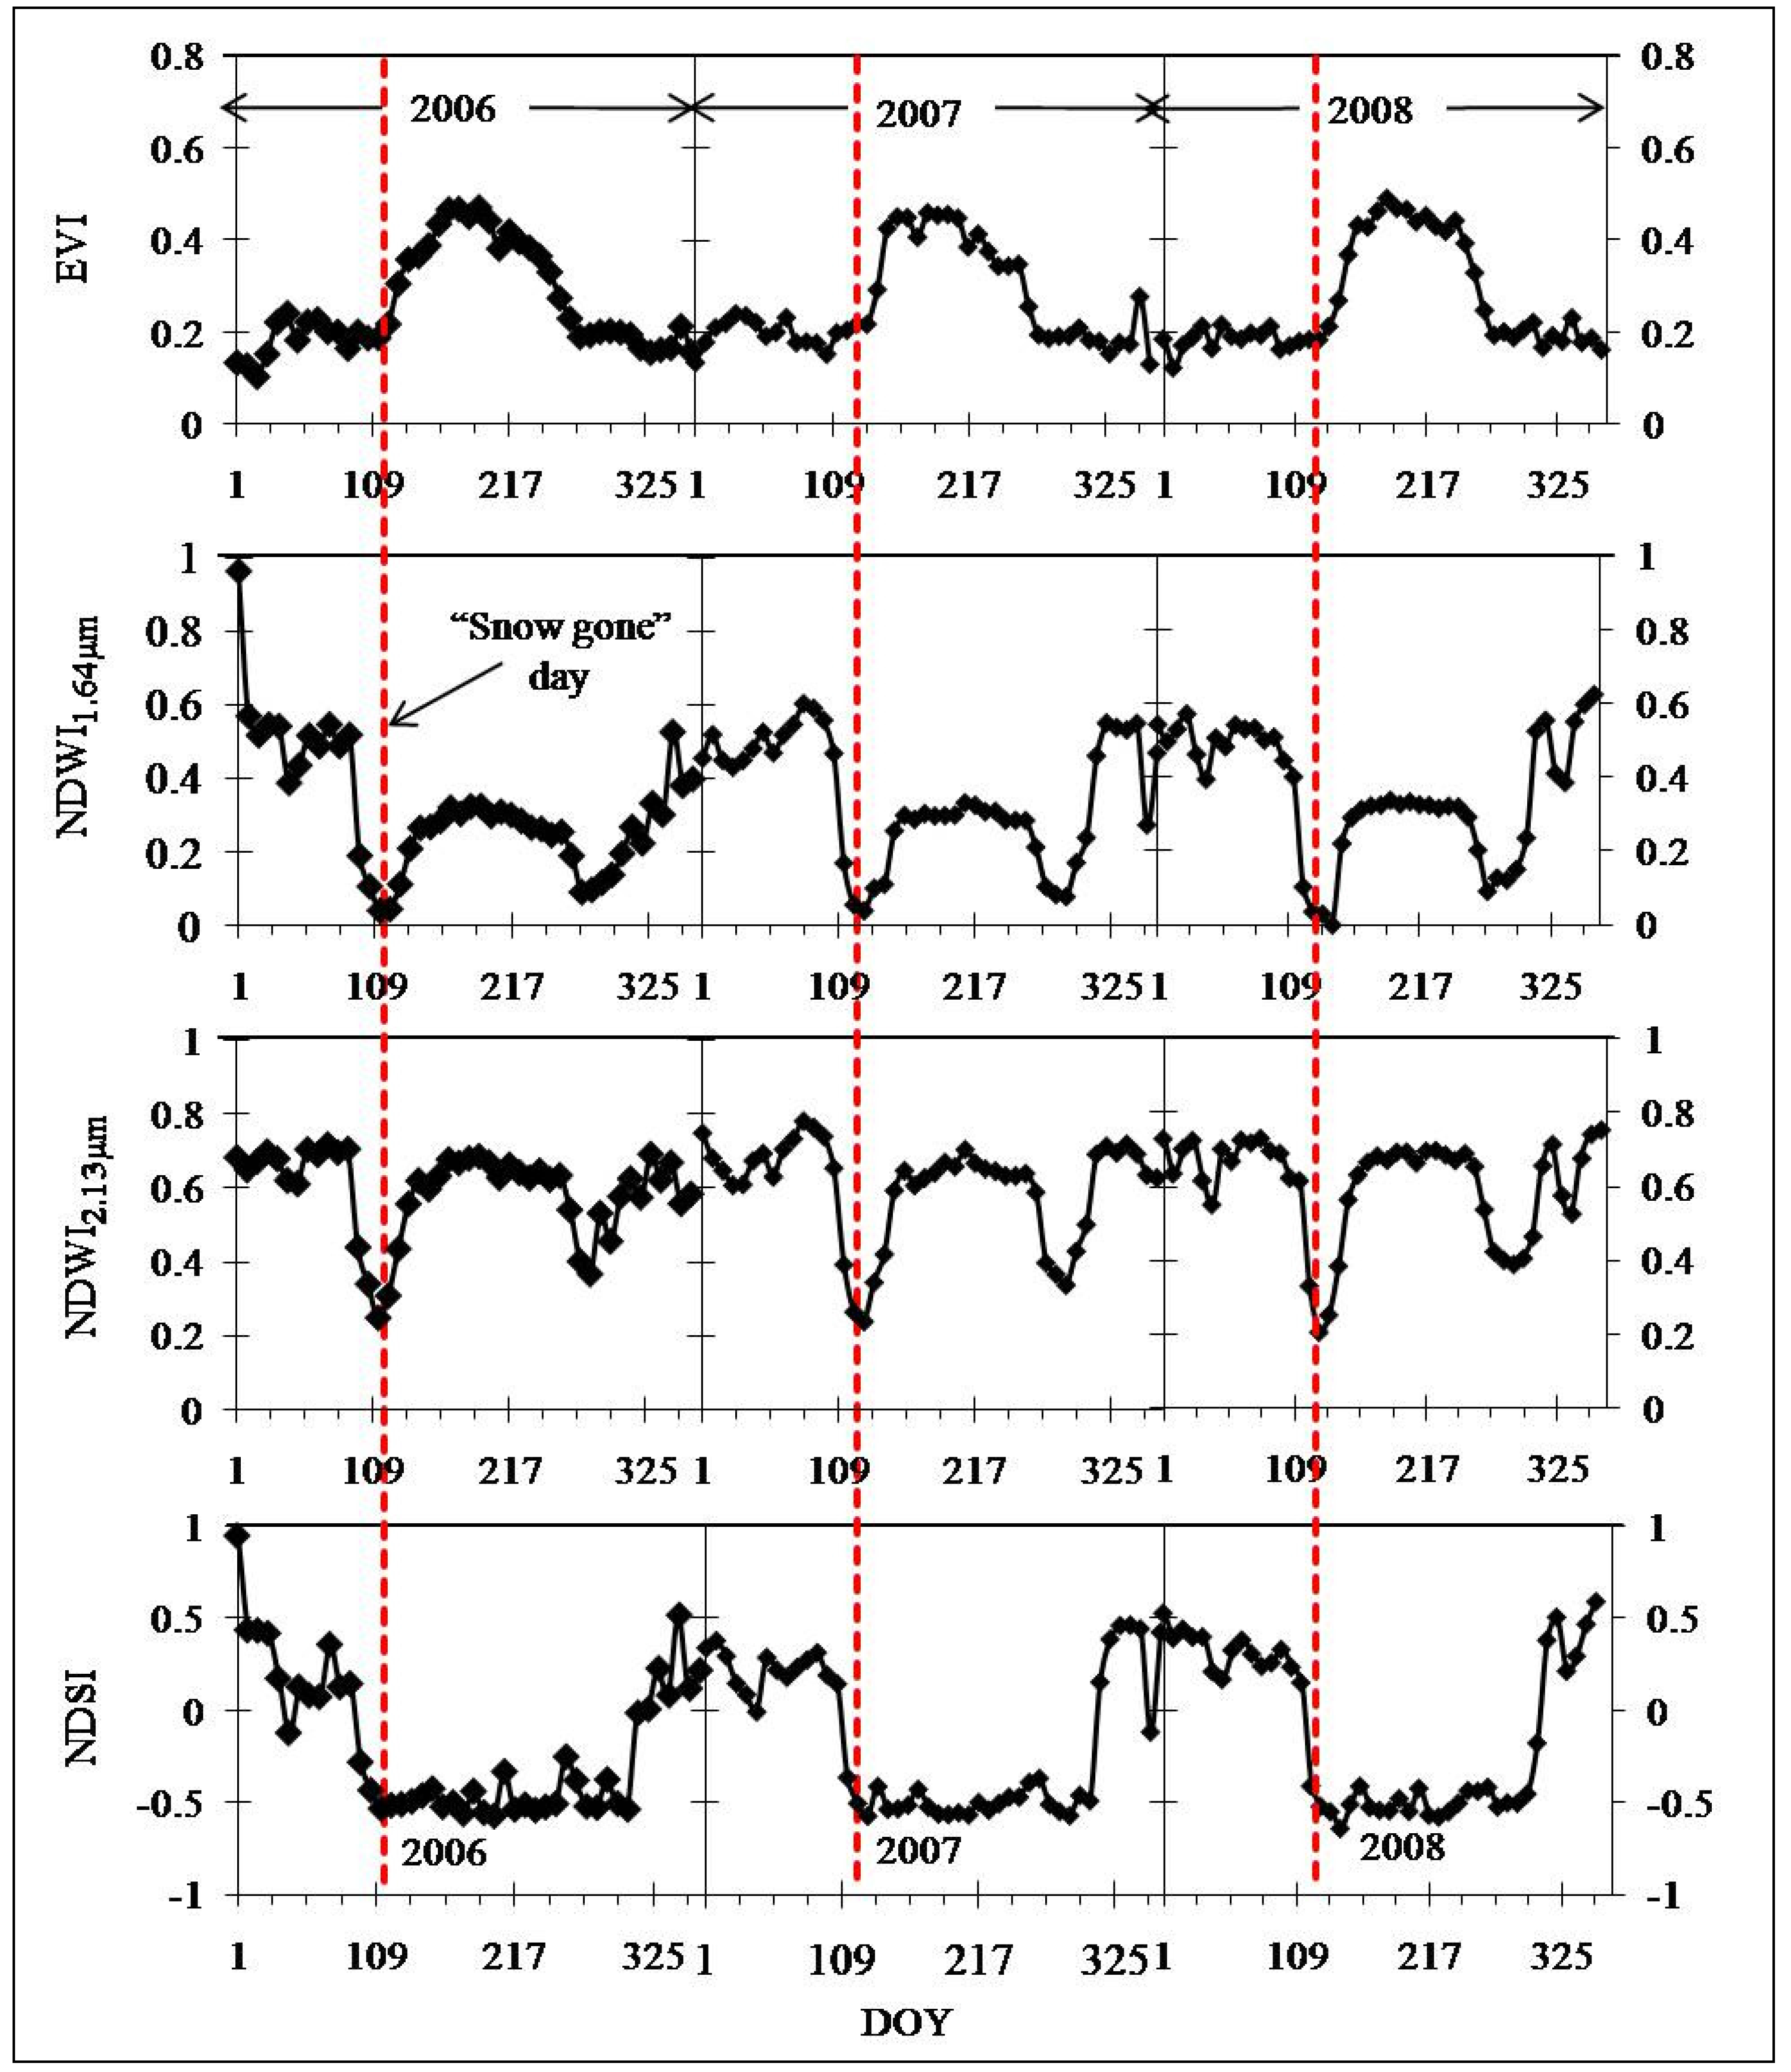
3.1. Qualitative Evaluation of the Remote Sensing-Based Indices in Predicting SGN Stage


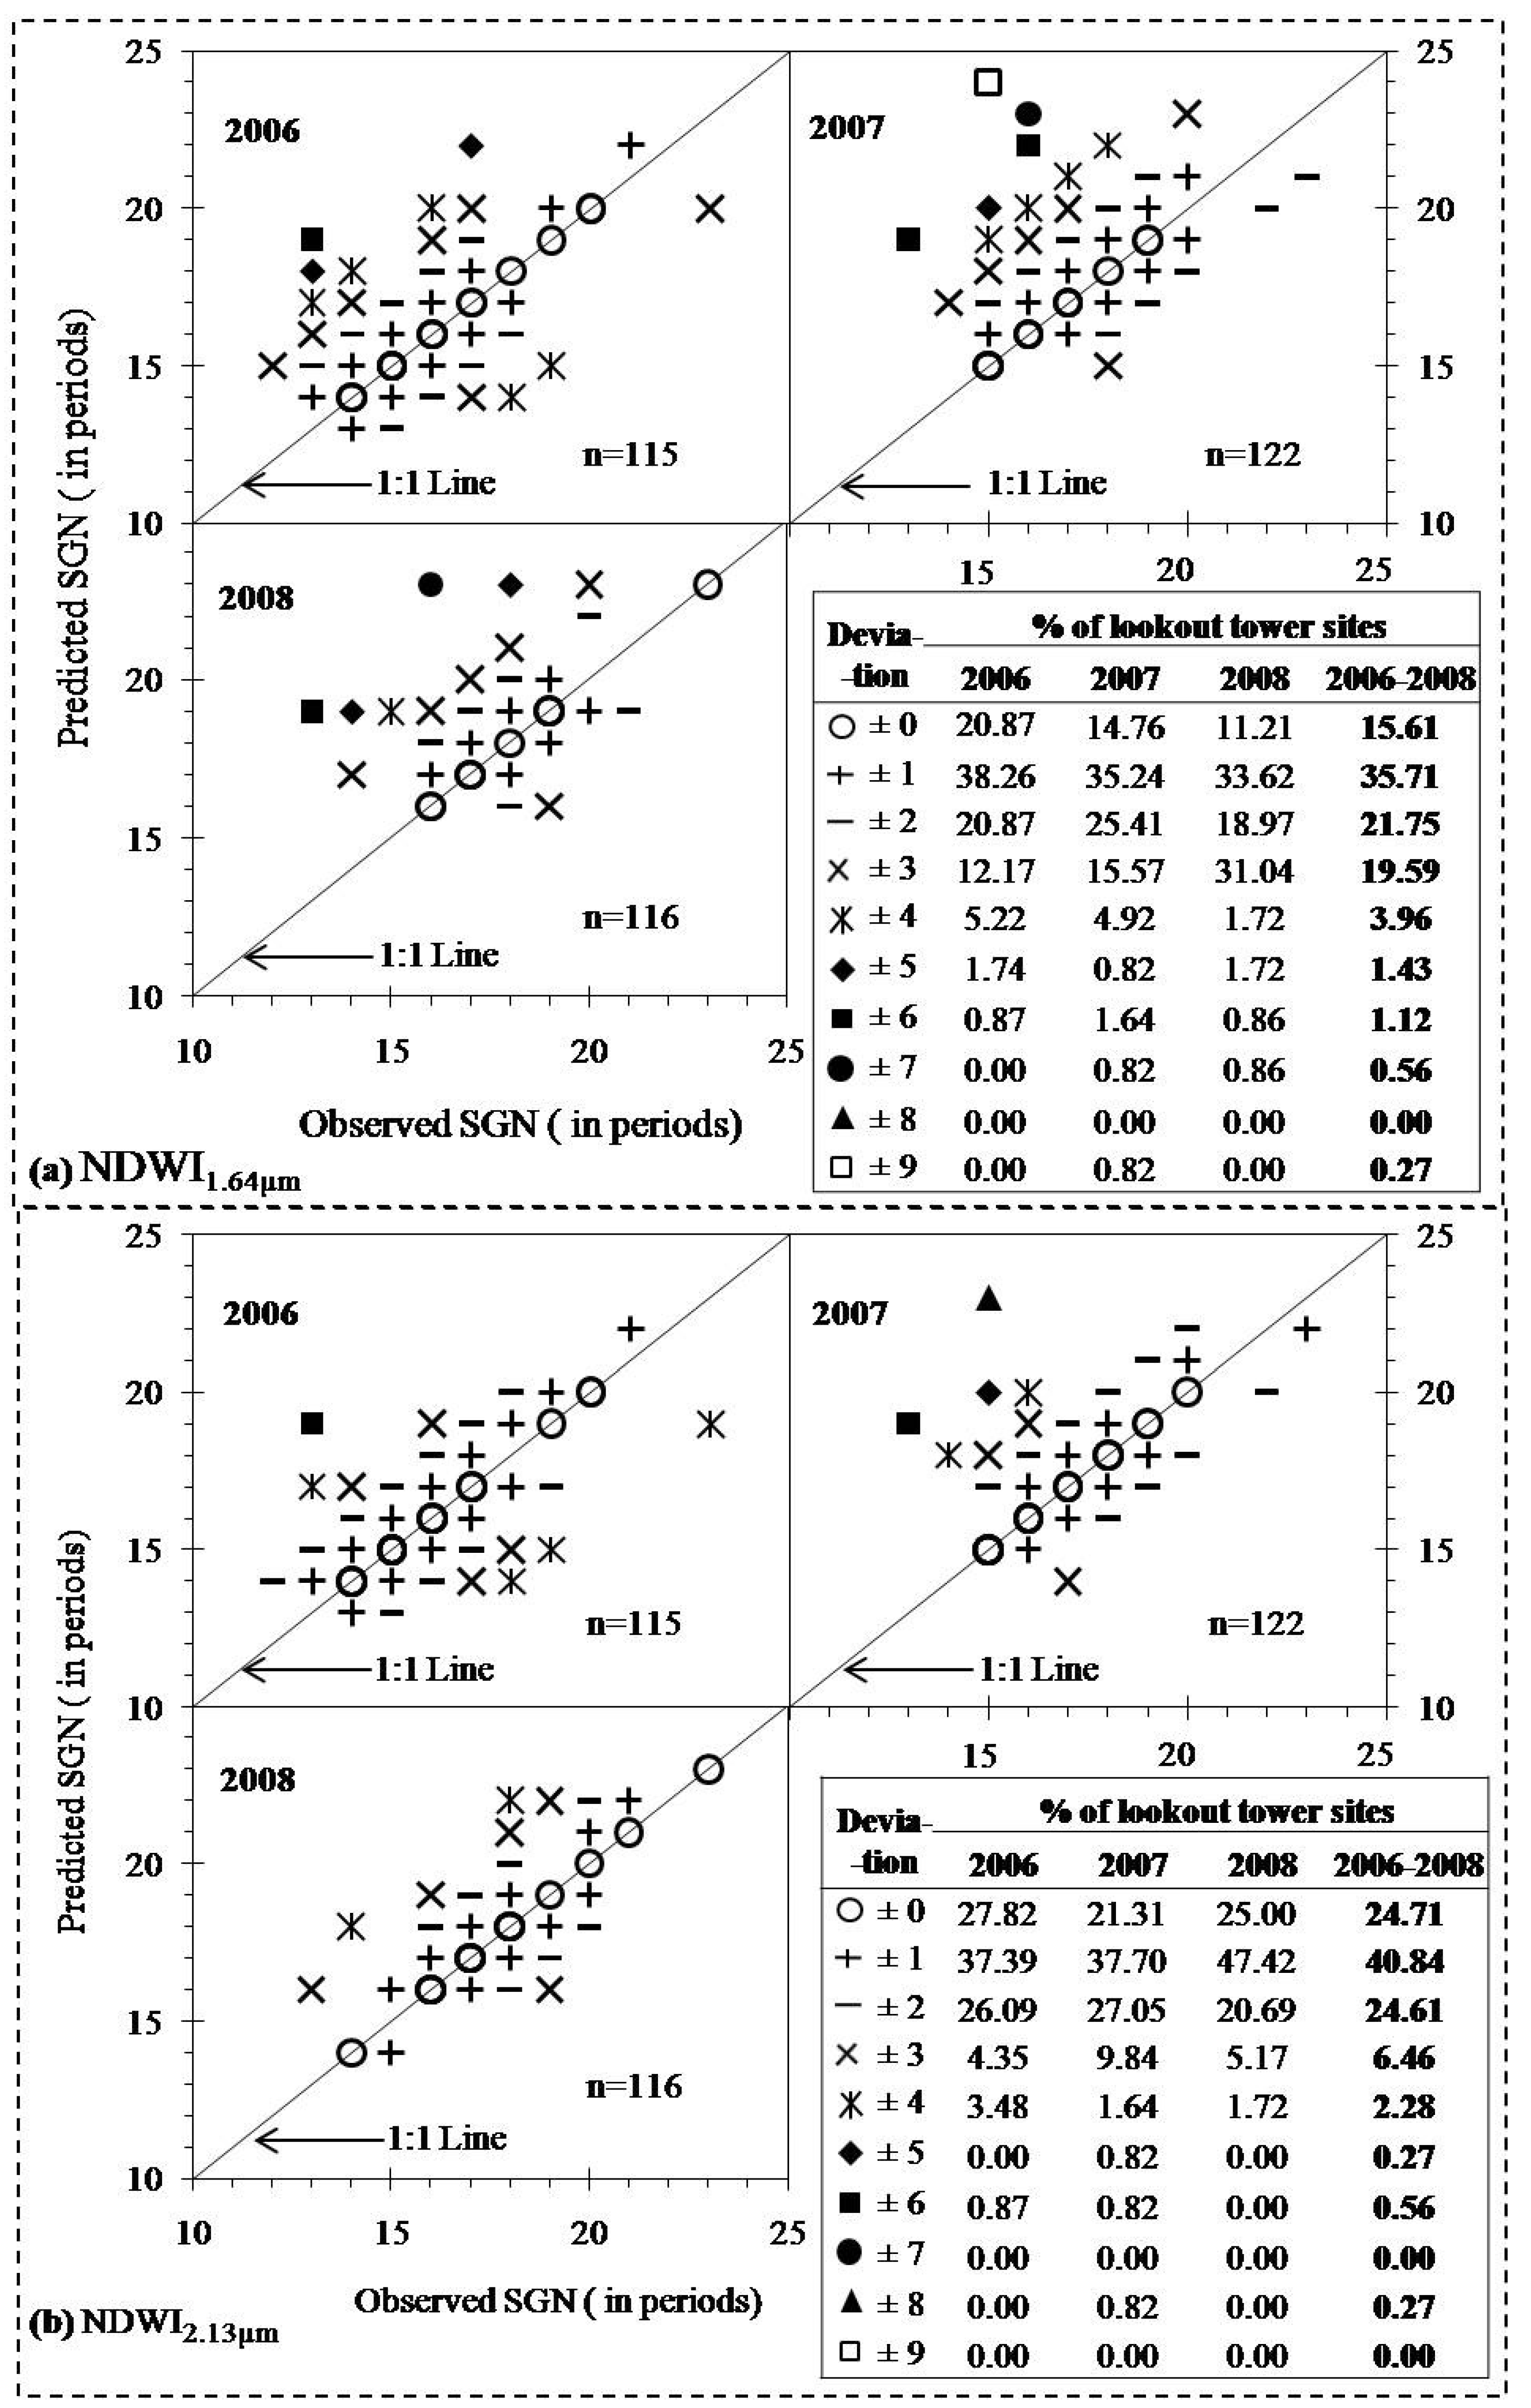
3.2. Determining the Best Index in Predicting SGN Periods
- The ground-based observations were entirely on the basis of visual inspection, thus it highly depended on the experience of an operator to interpret the situation; and
- Spatial resolution of the NDWI’s and ground-based observations might not be in agreement in some instances.

3.3. Spatial Dynamics of the SGN Map

- In general, temperature decreases northwards in the northern hemisphere [13], so that the northward increment of SGN stages in our study would be expected.
- The natural subregions in the high elevation areas (i.e., alpine and sub-alpine as shown in polygon I; montane in the middle of polygon II; upper boreal highlands in the middle of polygon III; and sub-alpine in polygon IV) experienced relatively high SGN stages (i.e., in the range of 137–200 DOY). This is reasonable as the high elevation areas experience relatively cooler temperature regime, which influences the snow to stay relatively longer period of time.
4. Concluding Remarks
Acknowledgements
References and Notes
- Linkosalo, T.; Hakkinen, R.; Hanninen, H. Models of the spring phenology of boreal and temperate trees: is there something missing? Tree Physiol. 2006, 26, 1165–1172. [Google Scholar] [CrossRef] [PubMed]
- Richardson, A.D.; Hollinger, D.Y.; Dail, D.B.; Lee, J.T.; Munger, J.W.; O’Keefe, J. Influence of spring phenology on seasonal and annual carbon balance in two contrasting New England forests. Tree Physiol. 2009, 29, 321–331. [Google Scholar] [CrossRef] [PubMed]
- Westerling, A.L.; Hidalgo, H.G.; Cayan, D.R.; Swetnam, T.W. Warming and earlier spring increase western U.S. forest wildfire activity. Science 2006, 313, 940–943. [Google Scholar] [CrossRef] [PubMed]
- Lawson, B.D.; Armitage, O.B. Weather guide for the Canadian Forest Fire Danger Rating System; Northern Forestry Centre, Canadian Forest Service, Natural Resources Canada: Edmonton, Alberta, Canada, 2008; p. 73. Available online: http://fire.ak.blm.gov/content/weather/2008%20CFFDRS%20Weather%20Guide.pdf (accessed on 11 April 2010).
- Forest Fire Management Terms; Forest Protection Division, Alberta Land and Forest Service: Alberta, Canada, 1999; p. 77. Available online: http://www.srd.alberta.ca/MapsFormsPublications/Publications/documents/ForestFireManagementTerms-AbbrevGlossary-1999.pdf (accessed on 11 April 2010).
- Hassan, Q.K.; Bourque, C.P.-A.; Meng, F.-R. Estimation of daytime net ecosystem CO2 exchange over balsam fir forests in eastern Canada: Combining averaged tower-based flux measurements with remotely sensed MODIS data. Can. J. Remote Sens. 2006, 32, 405–416. [Google Scholar] [CrossRef]
- Hassan, Q.K.; Bourque, C.P.-A. Spatial enhancement of MODIS-based images of leaf area index: Application to the boreal forest region of northern Alberta, Canada. Remote Sens. 2010, 2, 278–289. [Google Scholar] [CrossRef]
- Moulin, S.; Kerogat, L.; Viovy, N.; Dedieu, G. Global-Scale Assessment of vegetation phenology using NOAA/AVHRR satellite measurements. J. Climate. 1997, 10, 1154–1170. [Google Scholar] [CrossRef]
- Thayn, J.B.; Price, K.P. Julian dates and introduced temporal error in remote sensing vegetation phenology studies. Int. J. Remote Sens. 2008, 29, 6045–6049. [Google Scholar] [CrossRef]
- Jenkins, J.P.; Braswell, B.H.; Frokling, S.E.; Aber, J.D. Detecting and predicting spatial and inter annual patterns of temperate forest spring time phenology in eastern US. Geophys. Res. Lett. 2002, 29. [Google Scholar] [CrossRef]
- Ahl, D.E.; Gower, S.T.; Burrows, S.N.; Shabanov, N.V.; Myneni, R.B.; Knyazikhin, Y. Monitoring spring canopy phenology of a deciduous broadleaf forest using MODIS. Remote Sens. Environ. 2006, 101, 88–95. [Google Scholar] [CrossRef]
- Zhang, X.; Friedl, M.A.; Schaff, C.B.; Strahler, A.H. Climate controls on vegetation phenological patterns in northern mid- and high latitudes inferred from MODIS data. Glob. Change Biol. 2004, 10, 1133–1145. [Google Scholar] [CrossRef]
- Hassan, Q.K.; Bourque, C.P.-A.; Meng, F.-R.; Richrds, W. Spatial mapping of growing degree days: an application of MODIS-based surface temperature and enhanced vegetation index. J. Appl. Remote Sens. 2007, 1, 013511:1–013511:12. [Google Scholar] [CrossRef]
- Delbart, N.; Kergoats, L.; Toan, T.L.; Lhermitte, J.; Picard, G. Determination of phenological dates in boreal regions using normalized difference water index. Remote Sens. Environ. 2005, 97, 26–38. [Google Scholar] [CrossRef]
- Delbart, N.; Toan, T.L.; Kergoats, L.; Fedotava, V. Remote sensing of spring phenology in boreal regions: a free of snow effect method using NOAA-AVHRR and SPOT-VGT data (1982–2004). Remote Sens. Environ. 2006, 101, 52–62. [Google Scholar] [CrossRef]
- Gao, B.C. NDWI a normalized difference water index for remote sensing of vegetation liquid water from space. Remote Sens. Environ. 1996, 58, 257–266. [Google Scholar] [CrossRef]
- Xiao, X.; Boles, S.; Liu, J.; Zhuang, D.; Liu, M. Characterization of forest types in north eastern China, using multi-temporal SPOT-4 VEGETATION sensor data. Remote Sens. Environ. 2002, 82, 335–348. [Google Scholar] [CrossRef]
- Delbart, N.; Picard, G.; Toan, T.L.; Kergoats, L.; Quengan, S.; Woodwand, I.; Dye, D.; Fedotava, V. Spring phenology in Boreal Eurasia over a nearly century time scale. Glob. Change Biol. 2008, 14, 603–614. [Google Scholar] [CrossRef]
- Picard, G.; Quegan, S.; Delbart, N.; Lomes, M.R.; Toan, T.L.; Woodward, F.I. Bud-burst modelling in Siberia and its impact on quantifying the carbon budget. Glob. Change Biol. 2005, 11, 2164–2176. [Google Scholar] [CrossRef]
- Jackson, T.J.; Chen, D.; Cosh, M.; Li, F.; Anderson, M.; Walthall, C.; Doriaswamy, P.; Hunt, E.R. Vegetation water content mapping using Landsat data derived normalized difference water index for corn and soybeans. Remote Sens. Environ. 2004, 92, 475–482. [Google Scholar] [CrossRef]
- Trombetti, M.; Riaño, D.; Rubio, M.A.; Cheng, Y.B.; Ustin, S.L. Multi-temporal vegetation canopy water content retrieval and interpretation using artificial neural networks for the continental USA. Remote Sens. Environ. 2008, 112, 203–215. [Google Scholar] [CrossRef]
- Wilson, E.H.; Sader, SA. Detection of forest harvest type using multiple dates of Landsat TM imagery. Remote Sens. Environ. 2002, 80, 385–396. [Google Scholar] [CrossRef]
- Yilmaz, M.T.; Hunt, E.R., Jr.; Jackson, T.J. Remote sensing of vegetation water content from equivalent water thickness using satellite imagery. Remote Sens. Environ. 2008, 112, 2514–2522. [Google Scholar] [CrossRef]
- Fensholt, R.; Sandholt, I. Derivation of a shortwave infrared water stress index from MODIS near- and shortwave infrared data in a semiarid environment. Remote Sens. Environ. 2003, 87, 111–121. [Google Scholar] [CrossRef]
- Chen, D.; Huang, J.; Jackson, T.J. Vegetation water content estimation for corn and soybeans using spectral indices derived from MODIS near- and short-wave infrared bands. Remote Sens. Environ. 2005, 98, 225–236. [Google Scholar] [CrossRef]
- Gu, Y.; Brown, J.F.; Verdin, J.P.; Wardlow, B. A five-year analysis of MODIS NDVI and NDWI for grassland drought assessment over the central Great Plains of the United States. Geophys. Res. Lett. 2007, 34. [Google Scholar] [CrossRef]
- Yi, Y.; Yang, D.; Huang, J.; Chen, D. Evaluation of MODIS surface reflectance products for wheat leaf area index (LAI) retrieval. ISPRS J. Photogram. Remote Sens. 2008, 63, 661–677. [Google Scholar] [CrossRef]
- Gyllenstrand, N.; Clapham, D.; Källman, T.; Lagercrantz, U. Norway spruce flowering Locus T Homolog is implicated in control of growth in conifers. Plant Physiol. 2007, 144, 248–257. [Google Scholar] [CrossRef] [PubMed]
- Hall, D.K.; Riggs, G.A.; Salomonson, V.V.; DiGirolamo, N.E.; Bayr, K.J. MODIS snow-cover products. Remote Sens. Environ. 2002, 83, 181–194. [Google Scholar] [CrossRef]
- Rinne, J.; Aurela, M.; Manninen, T. A simple method to determine the timing of snow melt by remote sensing with application to the CO2 balances of northern Mire and Heath ecosystems. Remote Sens. 2009, 1, 1097–1107. [Google Scholar] [CrossRef]
- Dankers, R.; De Jong, S.M. Monitoring snow-cover dynamics in Northern Fennoscandia with SPOT VEGETATION images. Int. J. Remote Sens. 2004, 25, 2933–2944. [Google Scholar] [CrossRef]
- Natural Regions and Subregions of Alberta; Downing, D.J.; Pettapiece, W.W. (Eds.) Pub. No. T/852; Natural Regions Committee: Government of Alberta, Alberta, Canada, 2006; Available online: http://tpr.alberta.ca/parks/heritageinfocentre/docs/NRSRcomplete%20May_06.pdf (accessed on 11 April 2010).
- MODIS Reprojection Tool; Version 4.0; USGS: Sioux Falls, SD, USA, February 2008. Available online: https://lpdaac.usgs.gov/lpdaac/tools/modis_reprojection_tool (accessed on 7 September 2009).
- Huete, A.; Didan, K.; Miura, T.; Rodriguez, E.P.; Gao, X.; Ferreira, L.G. Overview of the radiometric and biophysical performance of the MODIS vegetation indices. Remote Sens. Environ. 2002, 83, 195–213. [Google Scholar] [CrossRef]
- Klien, A.G.; Hall, D.K.; Riggs, G.A. Improving snow cover mapping in forests through the use of canopy reflectance model. Hydrol. Process. 1998, 12, 1723–1744. [Google Scholar] [CrossRef]
© 2010 by the authors; licensee MDPI, Basel, Switzerland. This article is an Open Access article distributed under the terms and conditions of the Creative Commons Attribution license (http://creativecommons.org/licenses/by/3.0/).
Share and Cite
Sekhon, N.S.; Hassan, Q.K.; Sleep, R.W. Evaluating Potential of MODIS-based Indices in Determining “Snow Gone” Stage over Forest-dominant Regions. Remote Sens. 2010, 2, 1348-1363. https://doi.org/10.3390/rs2051348
Sekhon NS, Hassan QK, Sleep RW. Evaluating Potential of MODIS-based Indices in Determining “Snow Gone” Stage over Forest-dominant Regions. Remote Sensing. 2010; 2(5):1348-1363. https://doi.org/10.3390/rs2051348
Chicago/Turabian StyleSekhon, Navdeep S., Quazi K. Hassan, and Robert W. Sleep. 2010. "Evaluating Potential of MODIS-based Indices in Determining “Snow Gone” Stage over Forest-dominant Regions" Remote Sensing 2, no. 5: 1348-1363. https://doi.org/10.3390/rs2051348
APA StyleSekhon, N. S., Hassan, Q. K., & Sleep, R. W. (2010). Evaluating Potential of MODIS-based Indices in Determining “Snow Gone” Stage over Forest-dominant Regions. Remote Sensing, 2(5), 1348-1363. https://doi.org/10.3390/rs2051348


