1. Introduction
Starting from the beginning of civilization, human-beings have deliberately managed and converted the landscape to utilize and exploit natural resources mainly to derive basic needs such as food, shelter, fresh water, and pharmaceutical products [
1]. However, the increase in population has proportionally increased the demand for resources for centuries; leading to the conversion of natural environmental conditions. Ecological processes and human interventions are facilitating ecosystem changes as a whole and land cover change (LCC) in particular. In particular term, LCC is a dynamic phenomenon occurring within the interface between human agricultural and ecological systems [
2]. In most parts of the world, agriculture is the primary driver of land use change. The main pressure is to convert forests to agricultural uses in order to meet the increasing demands caused by human population growth. Scholes and Breeman [
3] indicated that in addition to fossil fuels, the conversion of natural vegetation to agriculture is partially responsible for changes in the atmospheric composition and climate conditions. Despite the importance of landscape conversion to fulfill basic needs of humankind, LCCs such as deforestation have been recognized as major problems in the world and are drivers of global warming [
4,
5], which result in negative consequences for life on earth.
LCC may be the most significant agent of global change influencing hydrology, climate, and global biogeochemical cycles. The negative consequences of LCC are changes of global and regional climates, the global biogeochemical cycles such as carbon, nitrogen and water, biodiversity as well as a change of the ecosystem functions as a whole [
1,
6,
7,
8]. It is a continuing process, a challenging consequence and an environmental problem, especially in tropical regions where deforestation is occurring at an alarming rate [
3].
Information on LCC induced by population pressure and other external factors is required as a basis for counter measures. Up-to-date global land cover data sets are necessary for various global change research studies, including climate change, biodiversity conservation, ecosystem assessment and environmental modeling [
9]. Since land cover is the actual distribution of physical and biological features of the land surface, up-to-date information on the status of the land surface is crucial for environmental planning and management reasons [
10]. The resource managers can superimpose the land cover map to existing management and conservation zone maps and use it as a planning tool for the optimization of protection sites (e.g., in SMNP) by providing information on the status of wildlife and natural resources [
11]. Remotely sensed image data are widely used in terrestrial, oceanographic and atmospheric applications such as land cover mapping, environmental modeling and monitoring, updating of geographical databases of the specific area,
etc. [
12]. Satellite remote sensing (RS) and Geographical Information System (GIS) have been widely applied in identifying and analyzing LCC for different purposes [
13].
For sustainable management and decision making processes related to natural resources, knowledge about the ecosystem on both the temporal and the spatial scale is required [
14]. This managerial decision on resources has to be based on change analysis, which is the comparison of the current status with past events.
The physical, social and economic situations in Ethiopia have contributed to the degradation of resources. There are different types of land cover formed by both human activities and natural factors over the last centuries. Population pressure accompanied by sedentary agriculture, extensive animal husbandry (livestock herding), settlement and socio-political instability have resulted in heavy deforestation, forest fragmentation, loss of biodiversity and undesirable changes in the natural ecosystem, including LCC [
15].
Tatem
et al. [
16] noted that accurate information on land cover is required for both scientific research and undertaking management interventions. The assessment of conversion of the land cover types due to socio-economic and ecological factors helps to qualify and quantify its (Land cover change determines or has an implication on the potential of the resource change) status with respect to resource changes. Particularly, for SMNP, it is necessary to know which kind of land conversion is a threat to the wildlife habitat so that further decision making processes can be initiated to undertake management intervention for biodiversity conservation. If changes are assessed both quantitatively and qualitatively, the management intervention as well as the decision making process can be planned to meet the main objectives of the SMNP.
The general objective of the study was to generate spatially and temporally quantified information on land cover dynamics and provide basic information for policy/decision makers and for resource managers to undertake mitigation measures in areas at risk where the wildlife habitat is threatened. This includes, primarily, biodiversity conservation and management of the park. The specific objective of this study was to identify and quantify the rate of spatio-temporal LCC between 1984 and 2003. The study also helps to produce land cover map to show the overall situation of the heritage site and provides basic information for further study.
3. Results and Discussion
3.1. Results
The results of classification accuracy assessment are shown in
Table 2. The overall accuracy and the Kappa value of field data
versus automated classification results were 88 and 85%, respectively. The accuracy level of each true LC category is indicated in
Table 3.
Table 2.
Error matrix of field data versus ETM+ 2003 showing classification accuracy of the true land cover (LC).
Table 2.
Error matrix of field data versus ETM+ 2003 showing classification accuracy of the true land cover (LC).
| Automated Classification Result | Field data | Total |
|---|
| Agriculture | Mixed forest | Pure forest | Shrubland | Grassland |
|---|
| Agriculture | 29 | – | 1 | – | 3 | 33 |
| Mixed forest | 0 | 19 | – | – | – | 19 |
| Pure forest | 1 | – | 16 | – | – | 17 |
| Shrubland | 1 | – | 2 | 7 | 1 | 11 |
| Grassland | – | – | 3 | - | 21 | 24 |
| Total Observations | 31 | 19 | 22 | 7 | 25 | 104 |
Table 3.
The accuracy level of each true LC category.
Table 3.
The accuracy level of each true LC category.
| Land Cover Classes | Producer’s accuracy (%) | User’s accuracy (%) |
|---|
| Agriculture | 93.6 | 87.9 |
| Mixed natural forest | 100.0 | 100.0 |
| Pure forest | 72.7 | 94.1 |
| Shrubland/young trees | 100.0 | 63.6 |
| Grassland | 84.0 | 87.5 |
The overall accuracy and Kappa values were 88 and 85%, respectively. The classification of shrubland and mixed natural forest showed that 100% producer’s accuracy, which means no pixel was incorrectly excluded from its category. However, agriculture, pure forest and grassland showed the omission of 6.4, 17.3 and 16%, respectively. Mixed natural forest showed 100% user’s accuracy indicating accurately automated classification was carried out, whereas shrubland is less accurately classified (63%) in automated classification.
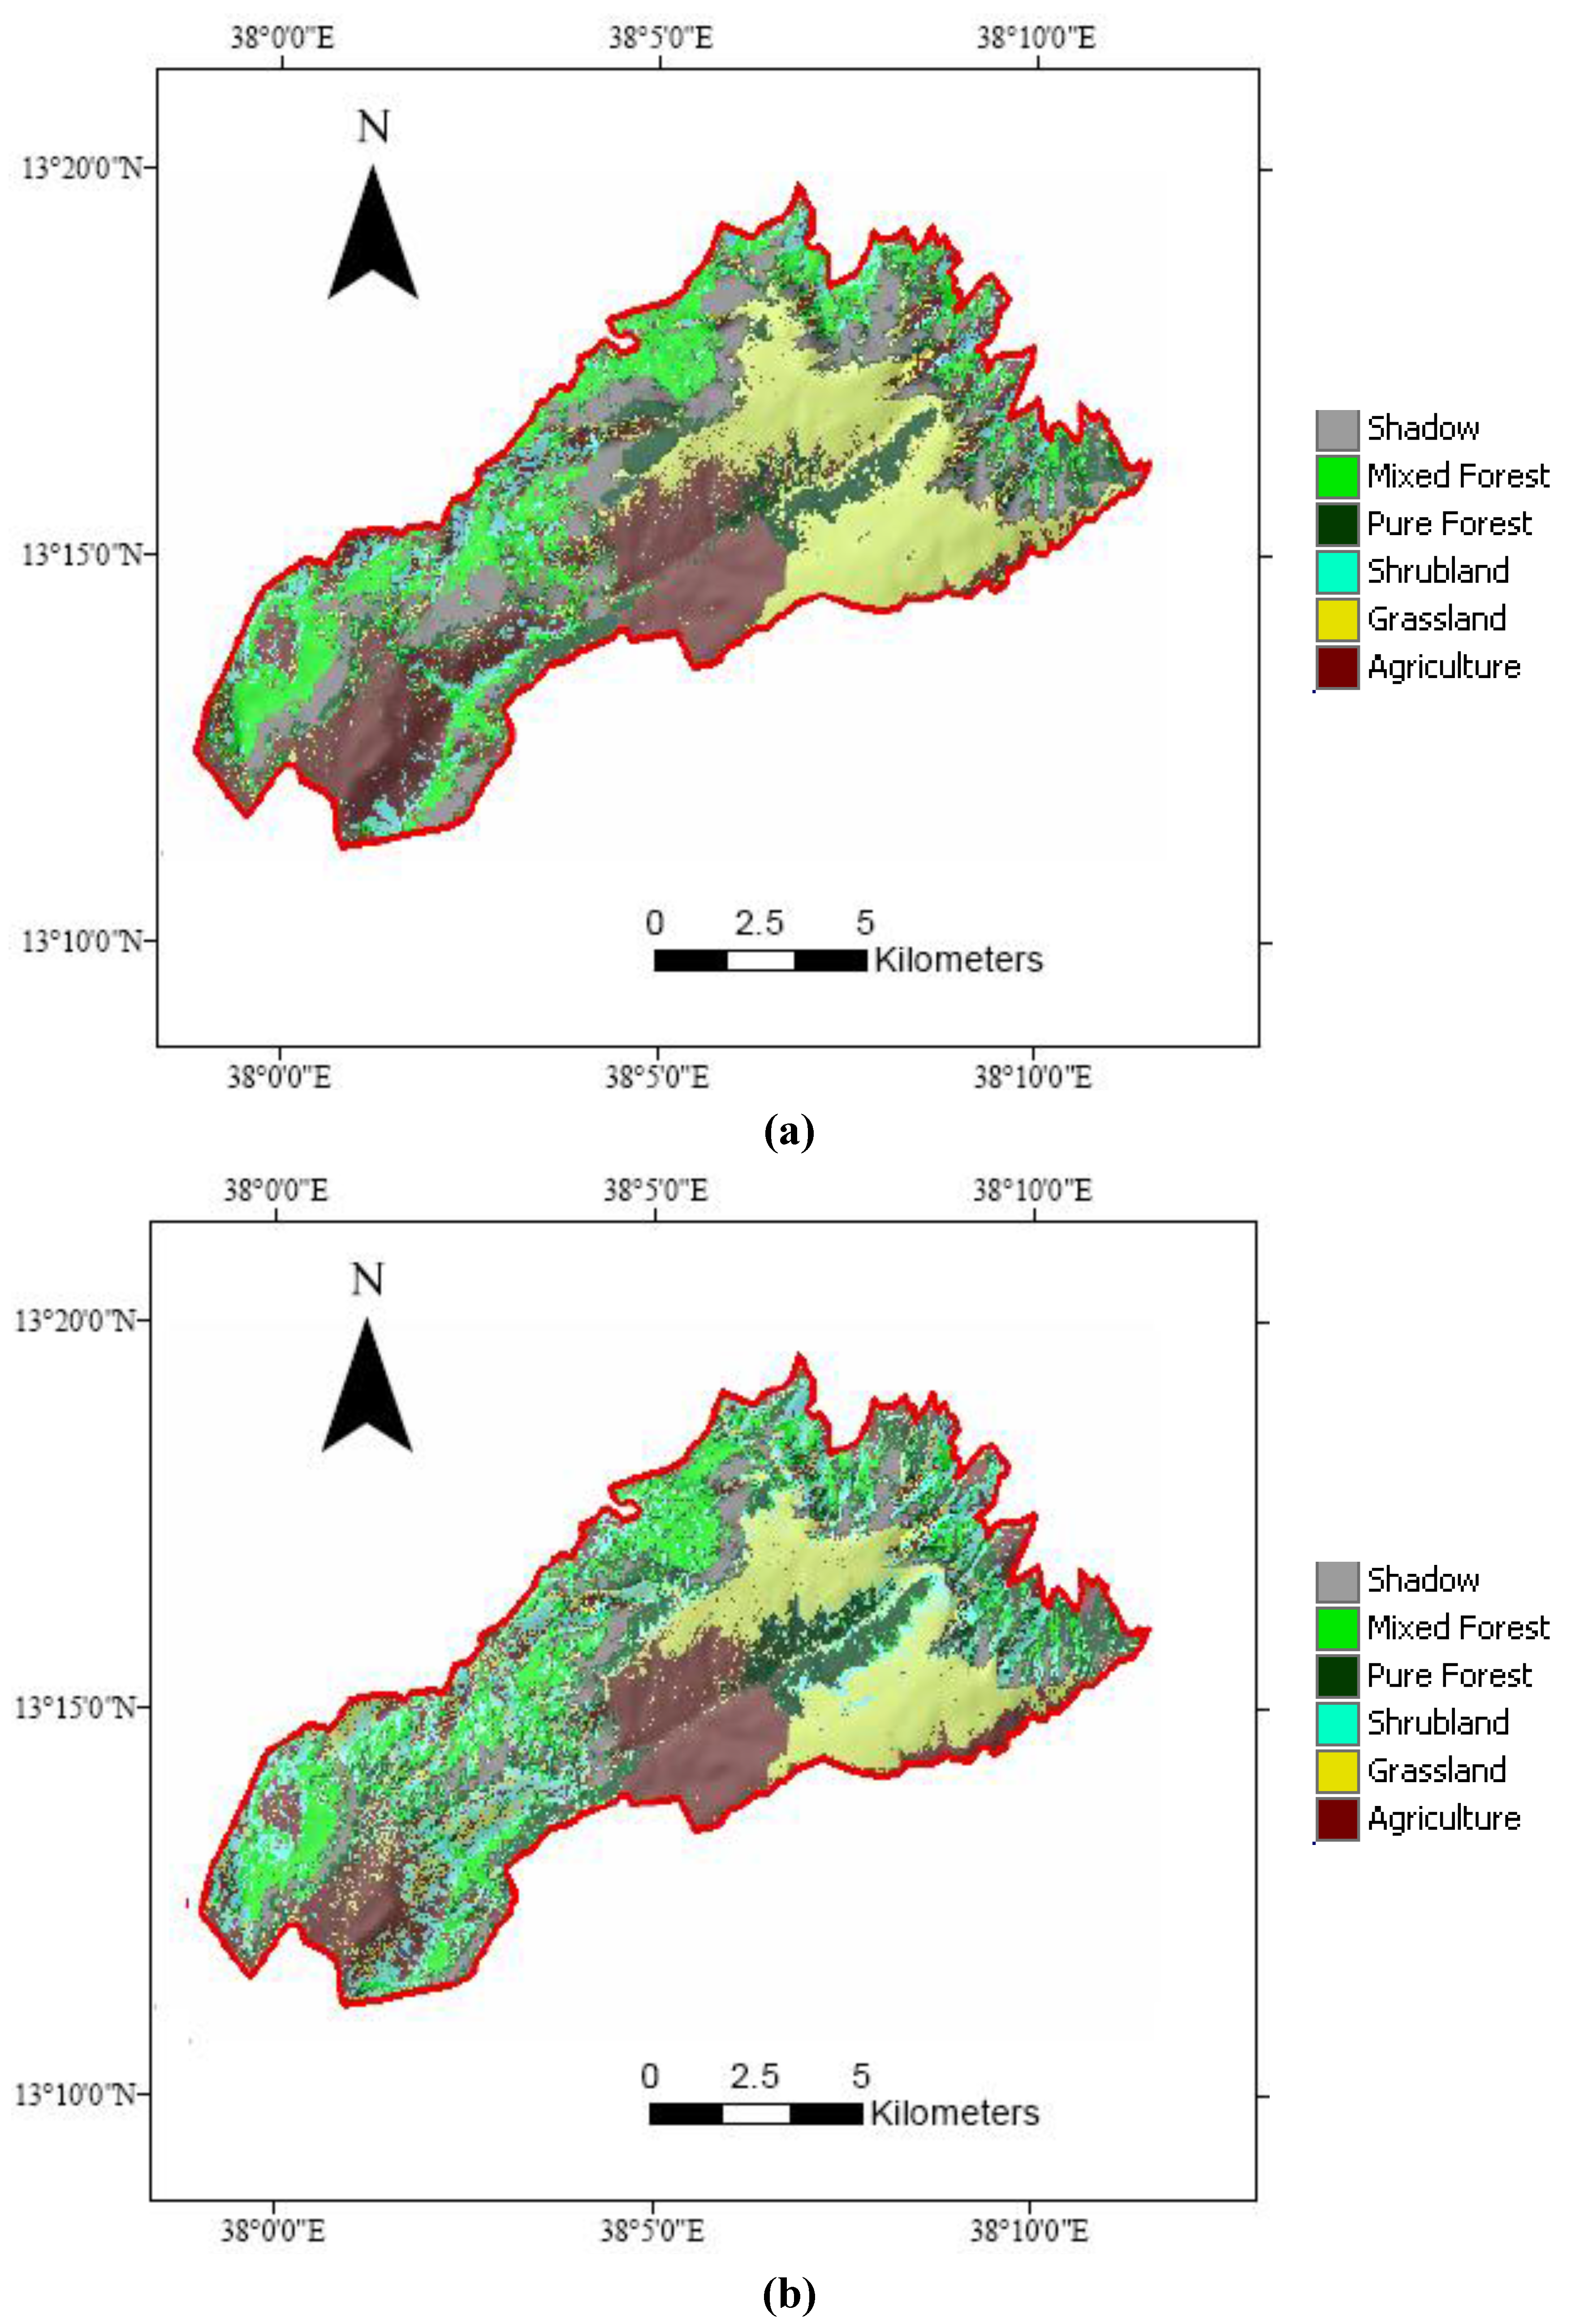
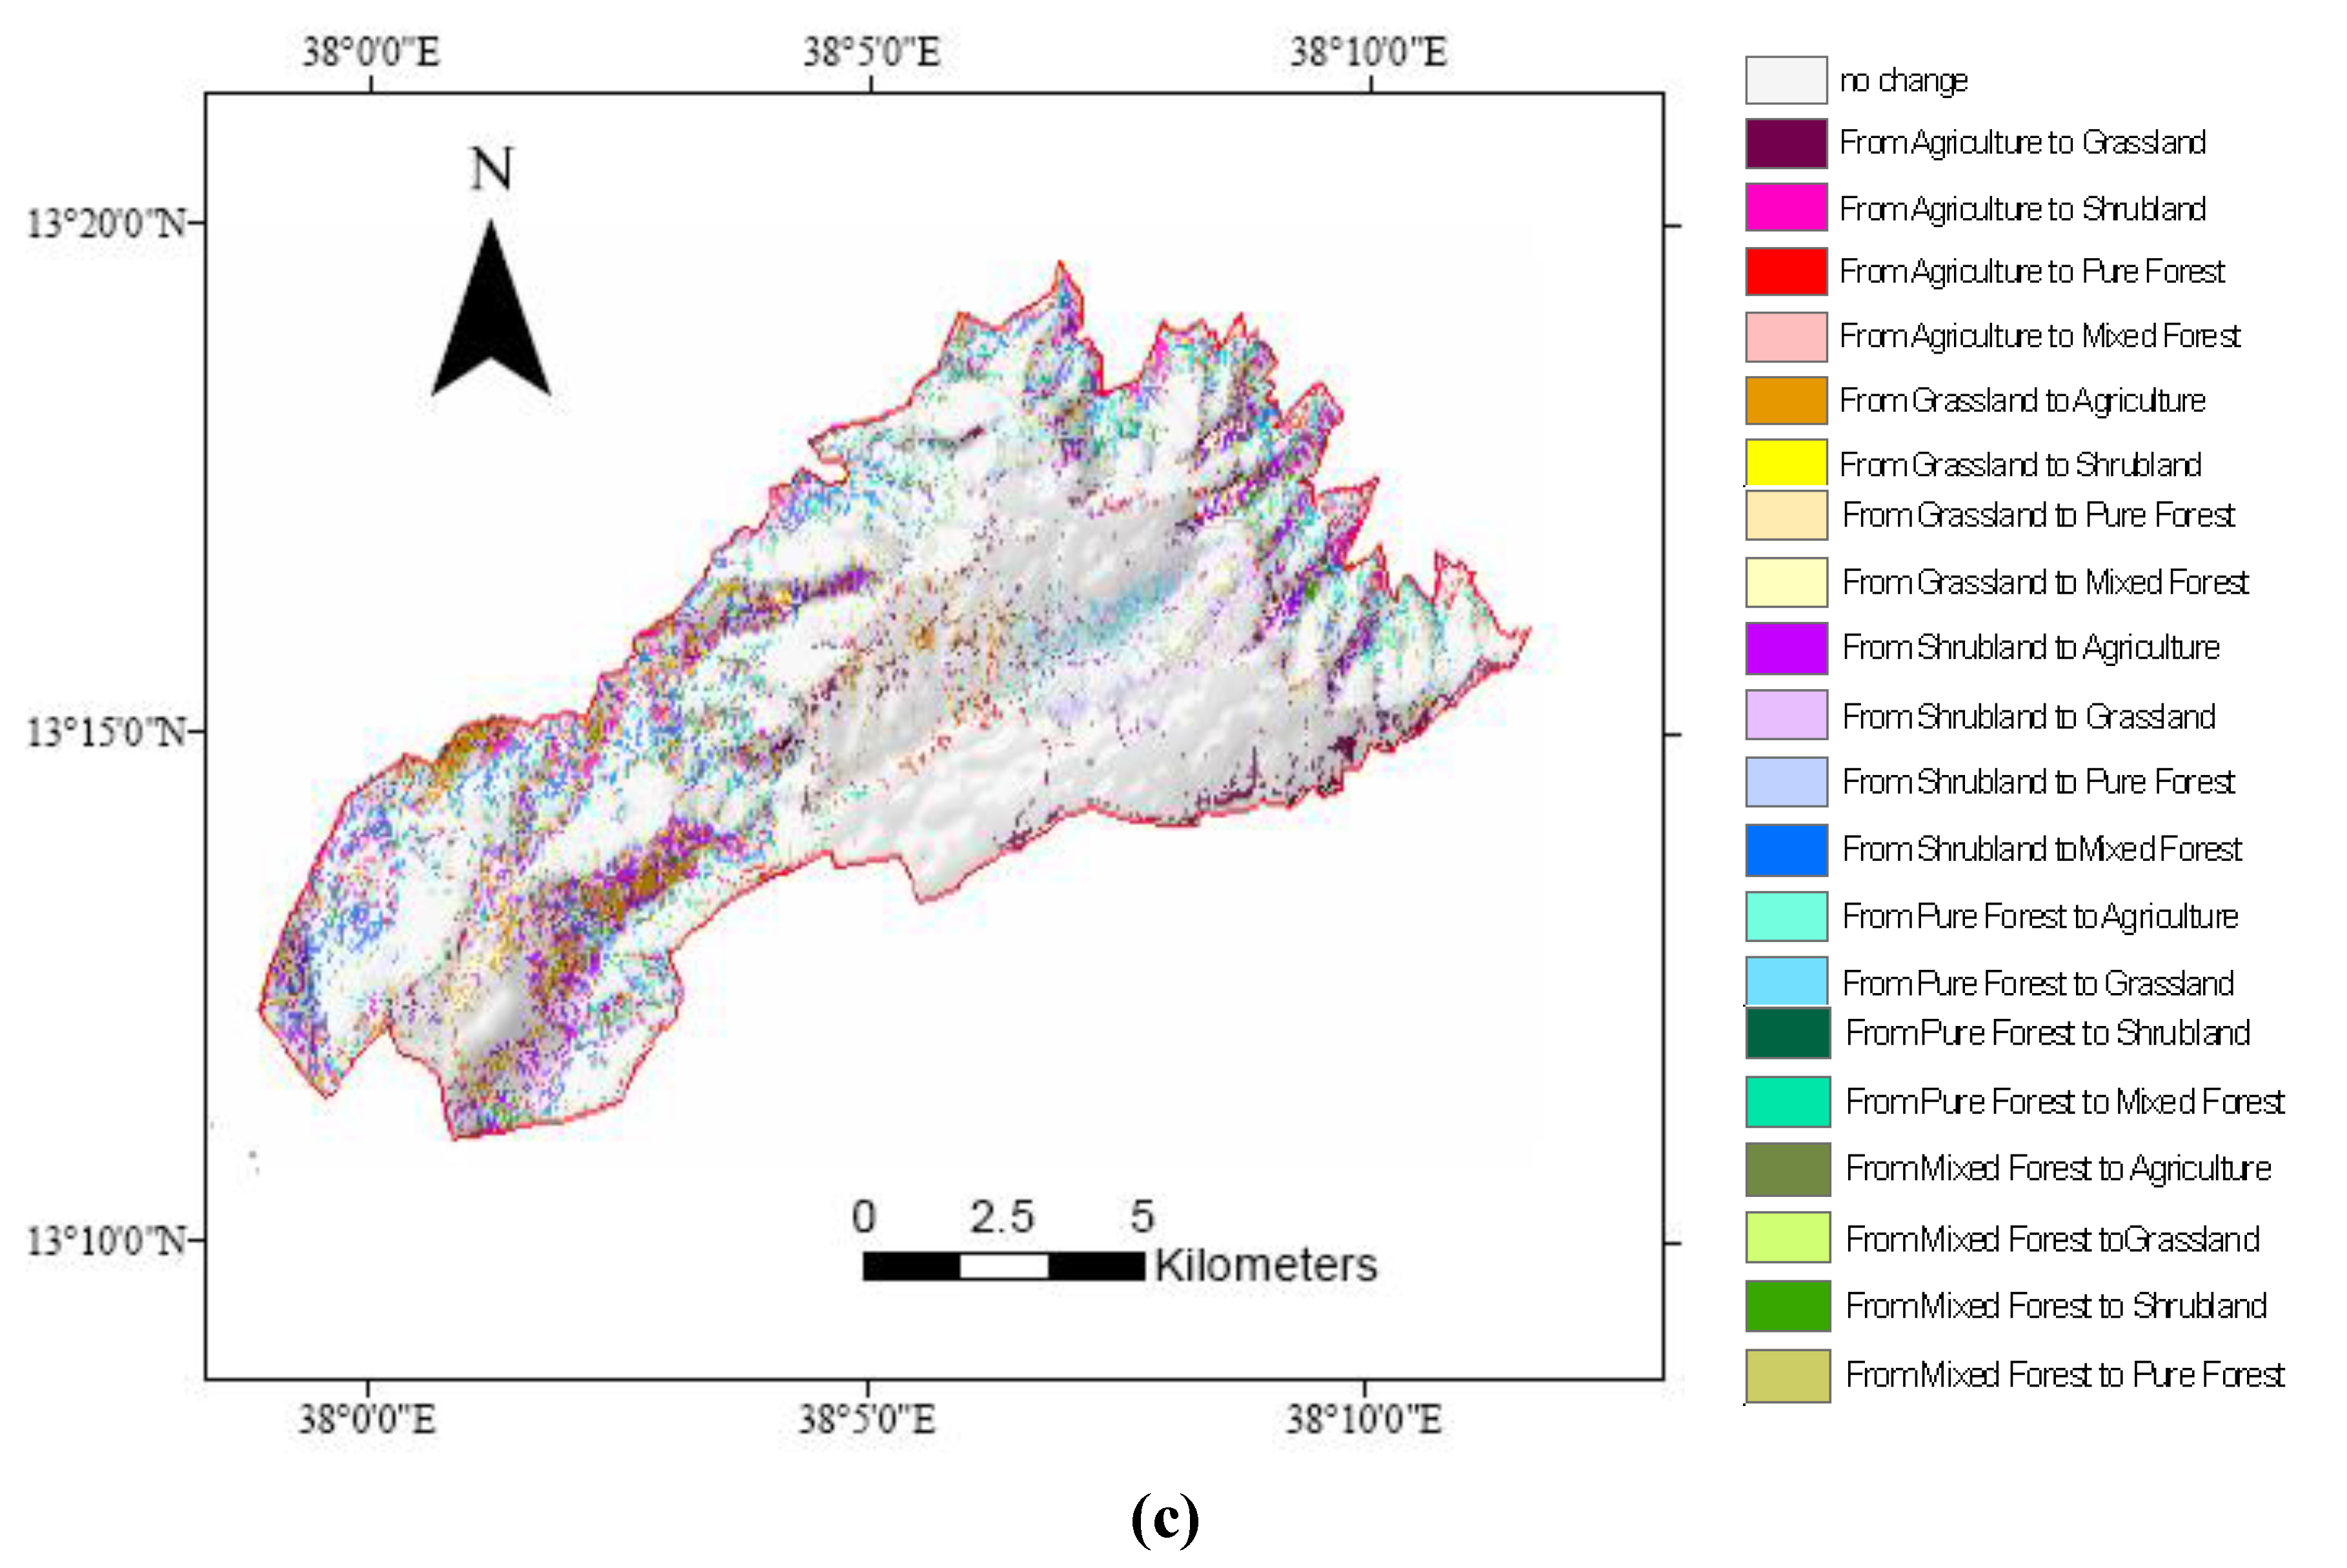
Two LC maps and one change map were produced for visual display of different LC categories (
Figure 2). On the classified map of TM 1984 and ETM+ 2003 images, the shadow/unclassified part was included as a separate class in
Figure 2a and
Figure 2b. In the LCC map, the shadow/unclassified category was excluded, because the focus of the study was LCC,
i.e., the change of true land cover.
Six categories were identified in each of the images of the two acquisition dates. Five categories can be regarded as true LC classes, namely: mixed forest, pure forest, shrubland, grassland and agriculture. One category was stated as shadow (unclassified) category. All the six categories (five true LC classes and one unclassified category) generated a total of 36 possible combinations or transformations, including the six identity transformations (no change). The total area of the SMNP under this study was estimated at about 13,907 ha (154,526 pixels). From the total area of the park, 90,331 pixels (58.5% of the area) remained unchanged and 41.5% of the area changed from one category to another within 20 years (
Figure 2(c)).
Figure 2.
LC maps of: (a) 1984, (b) 2003 and (c) land cover change (LCC).
Figure 2.
LC maps of: (a) 1984, (b) 2003 and (c) land cover change (LCC).
3.2. Discussion
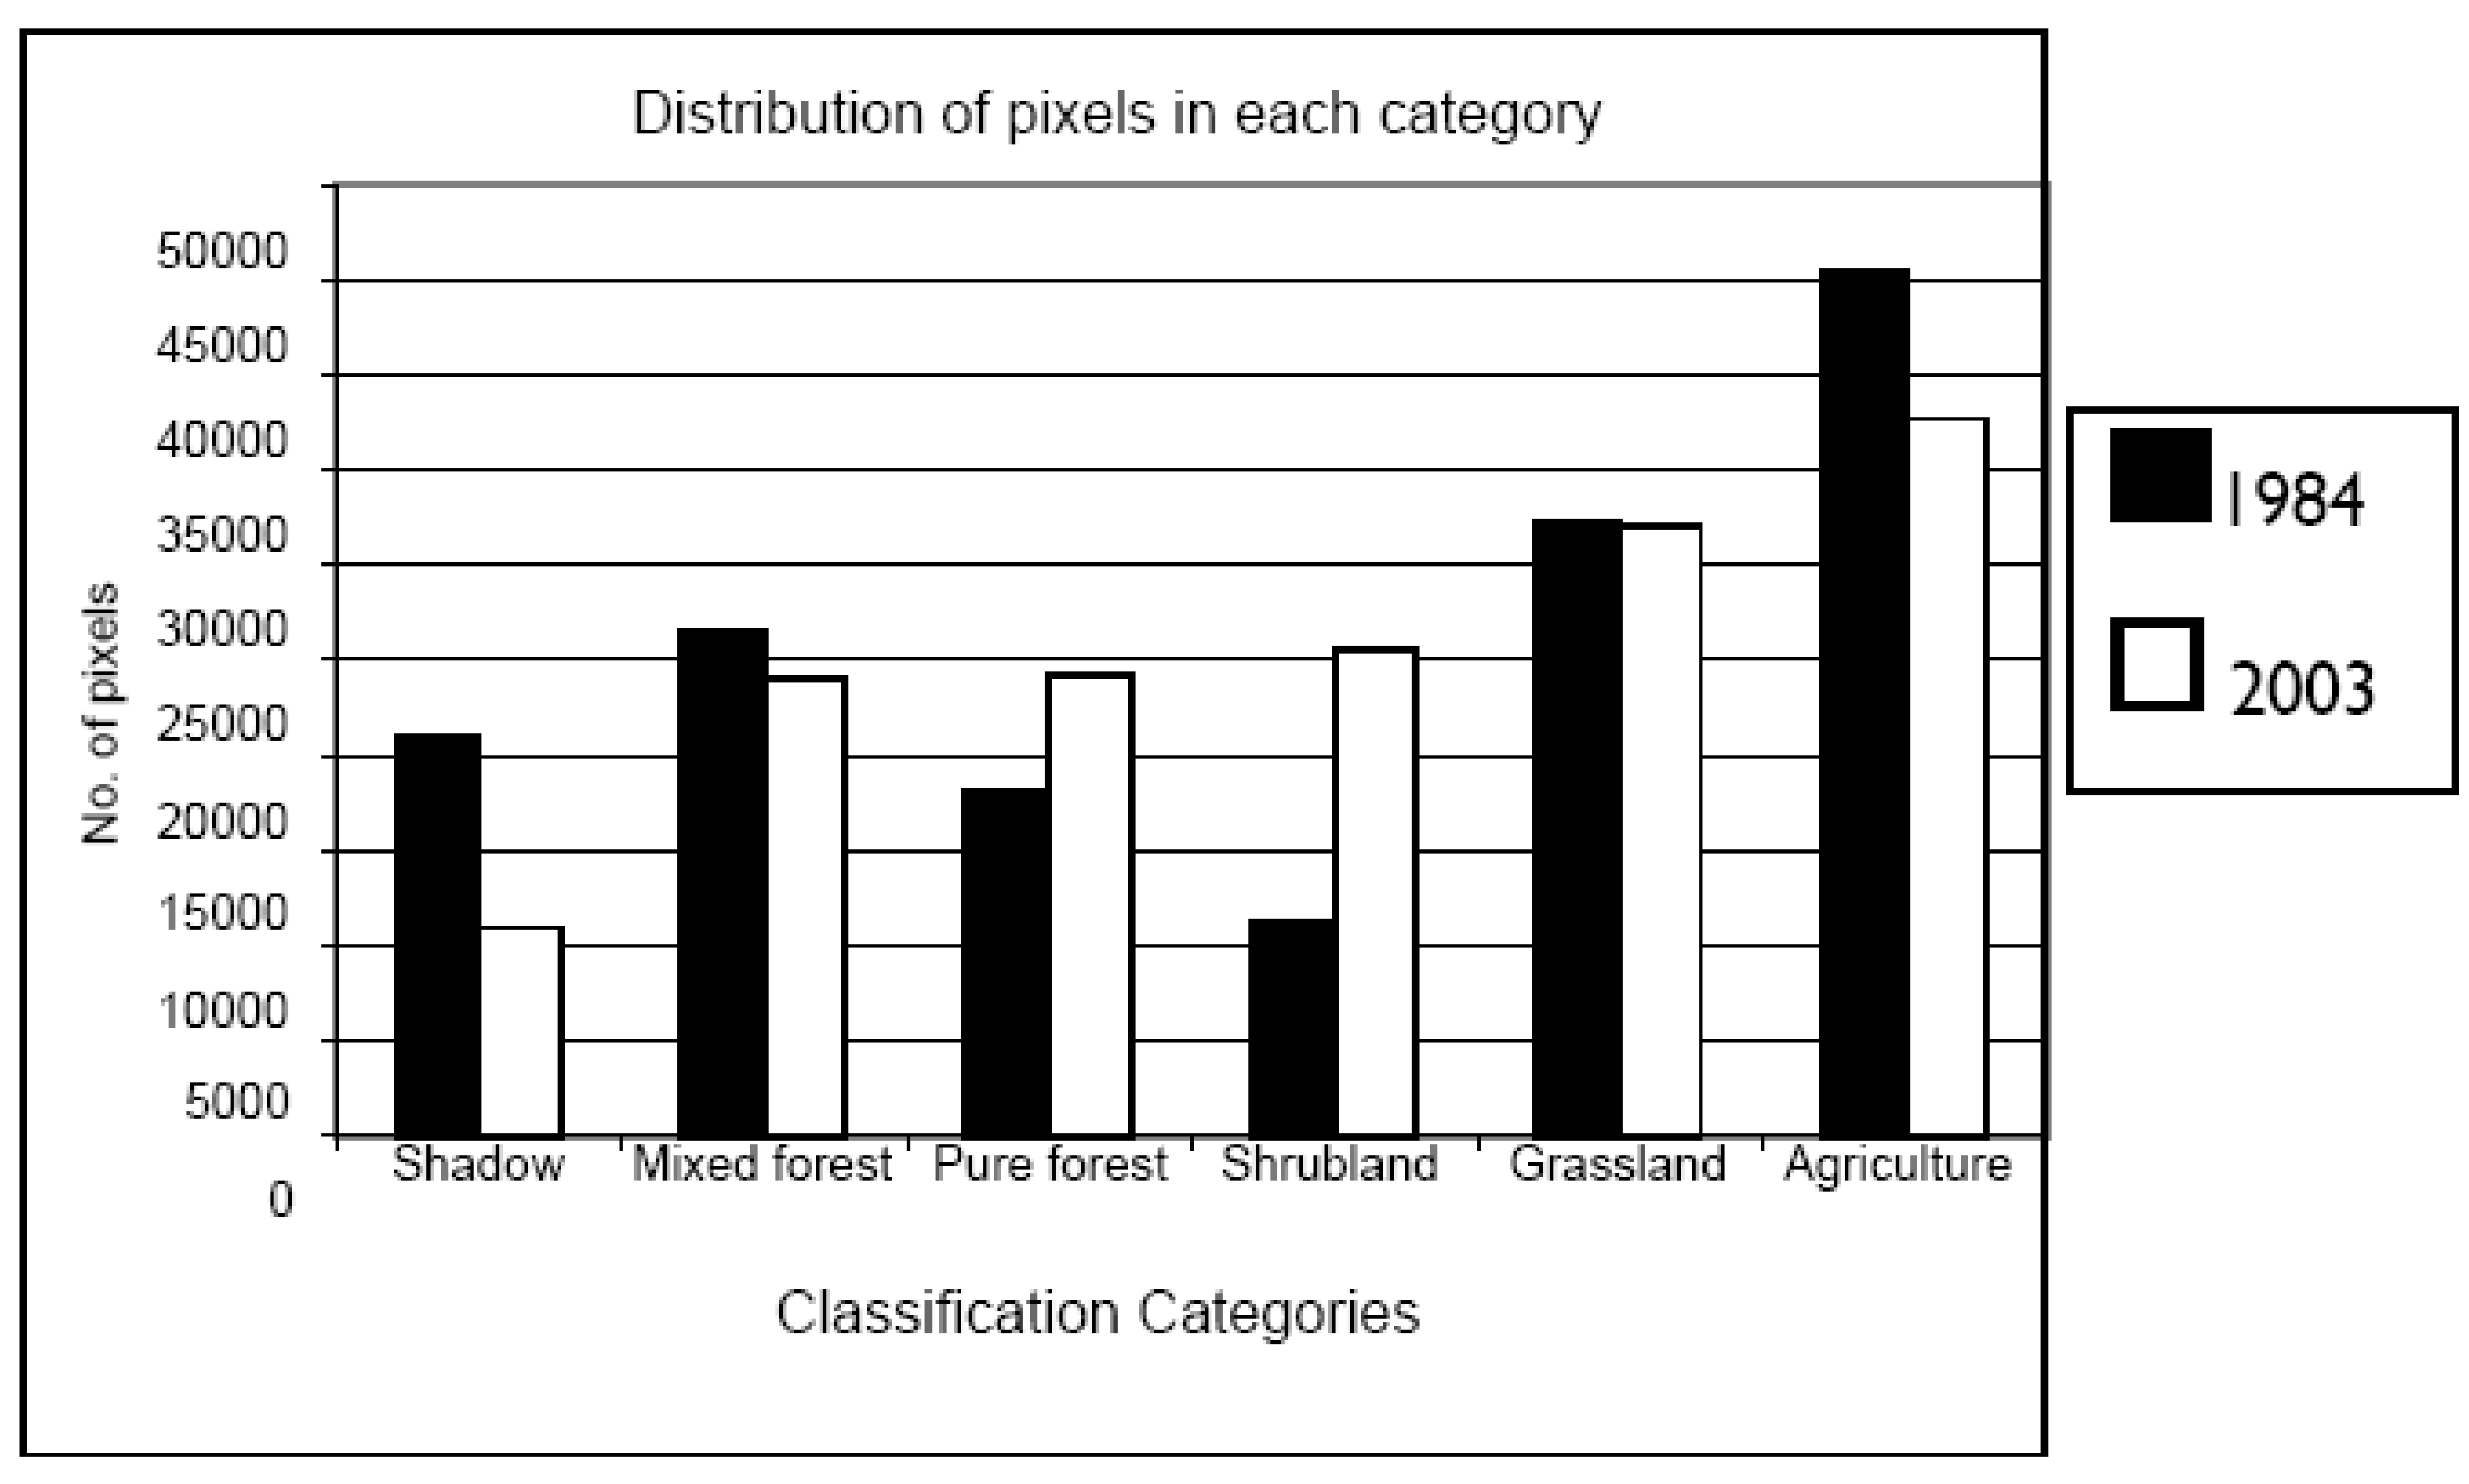
In the year 1984, the LC categories arranged in order of increase in extent were the shrubland, pure forest, shadow, mixed natural forest, grassland and agricultural land. But, in the 2003 categorization, the result changed due to shift of one category to another,
i.e., mixed forest, pure forest, shrubland, grassland and agriculture land (in the order of increase). This shift showed dynamicity of LC categories over time. It is known that agriculture and grazing are the main livelihood strategies of the population living in and around the SMNP. In 1984, grassland and agriculture in combination covered 50.26% of the SMNP. Agriculture followed by grassland were the top two dominant LC classes of the SMNP both in 1984 and in 2003 (
Figure 3). The overall area of forest and shrubland increased in spite of the intensive management of the park by agriculture and grazing (
Figure 4). The increase may be due to the decrease of the shadow area from 1984 to 2003, regulations of the abandonment of the land from agriculture through government intervention and land fallowing due to decline of the soil fertility.
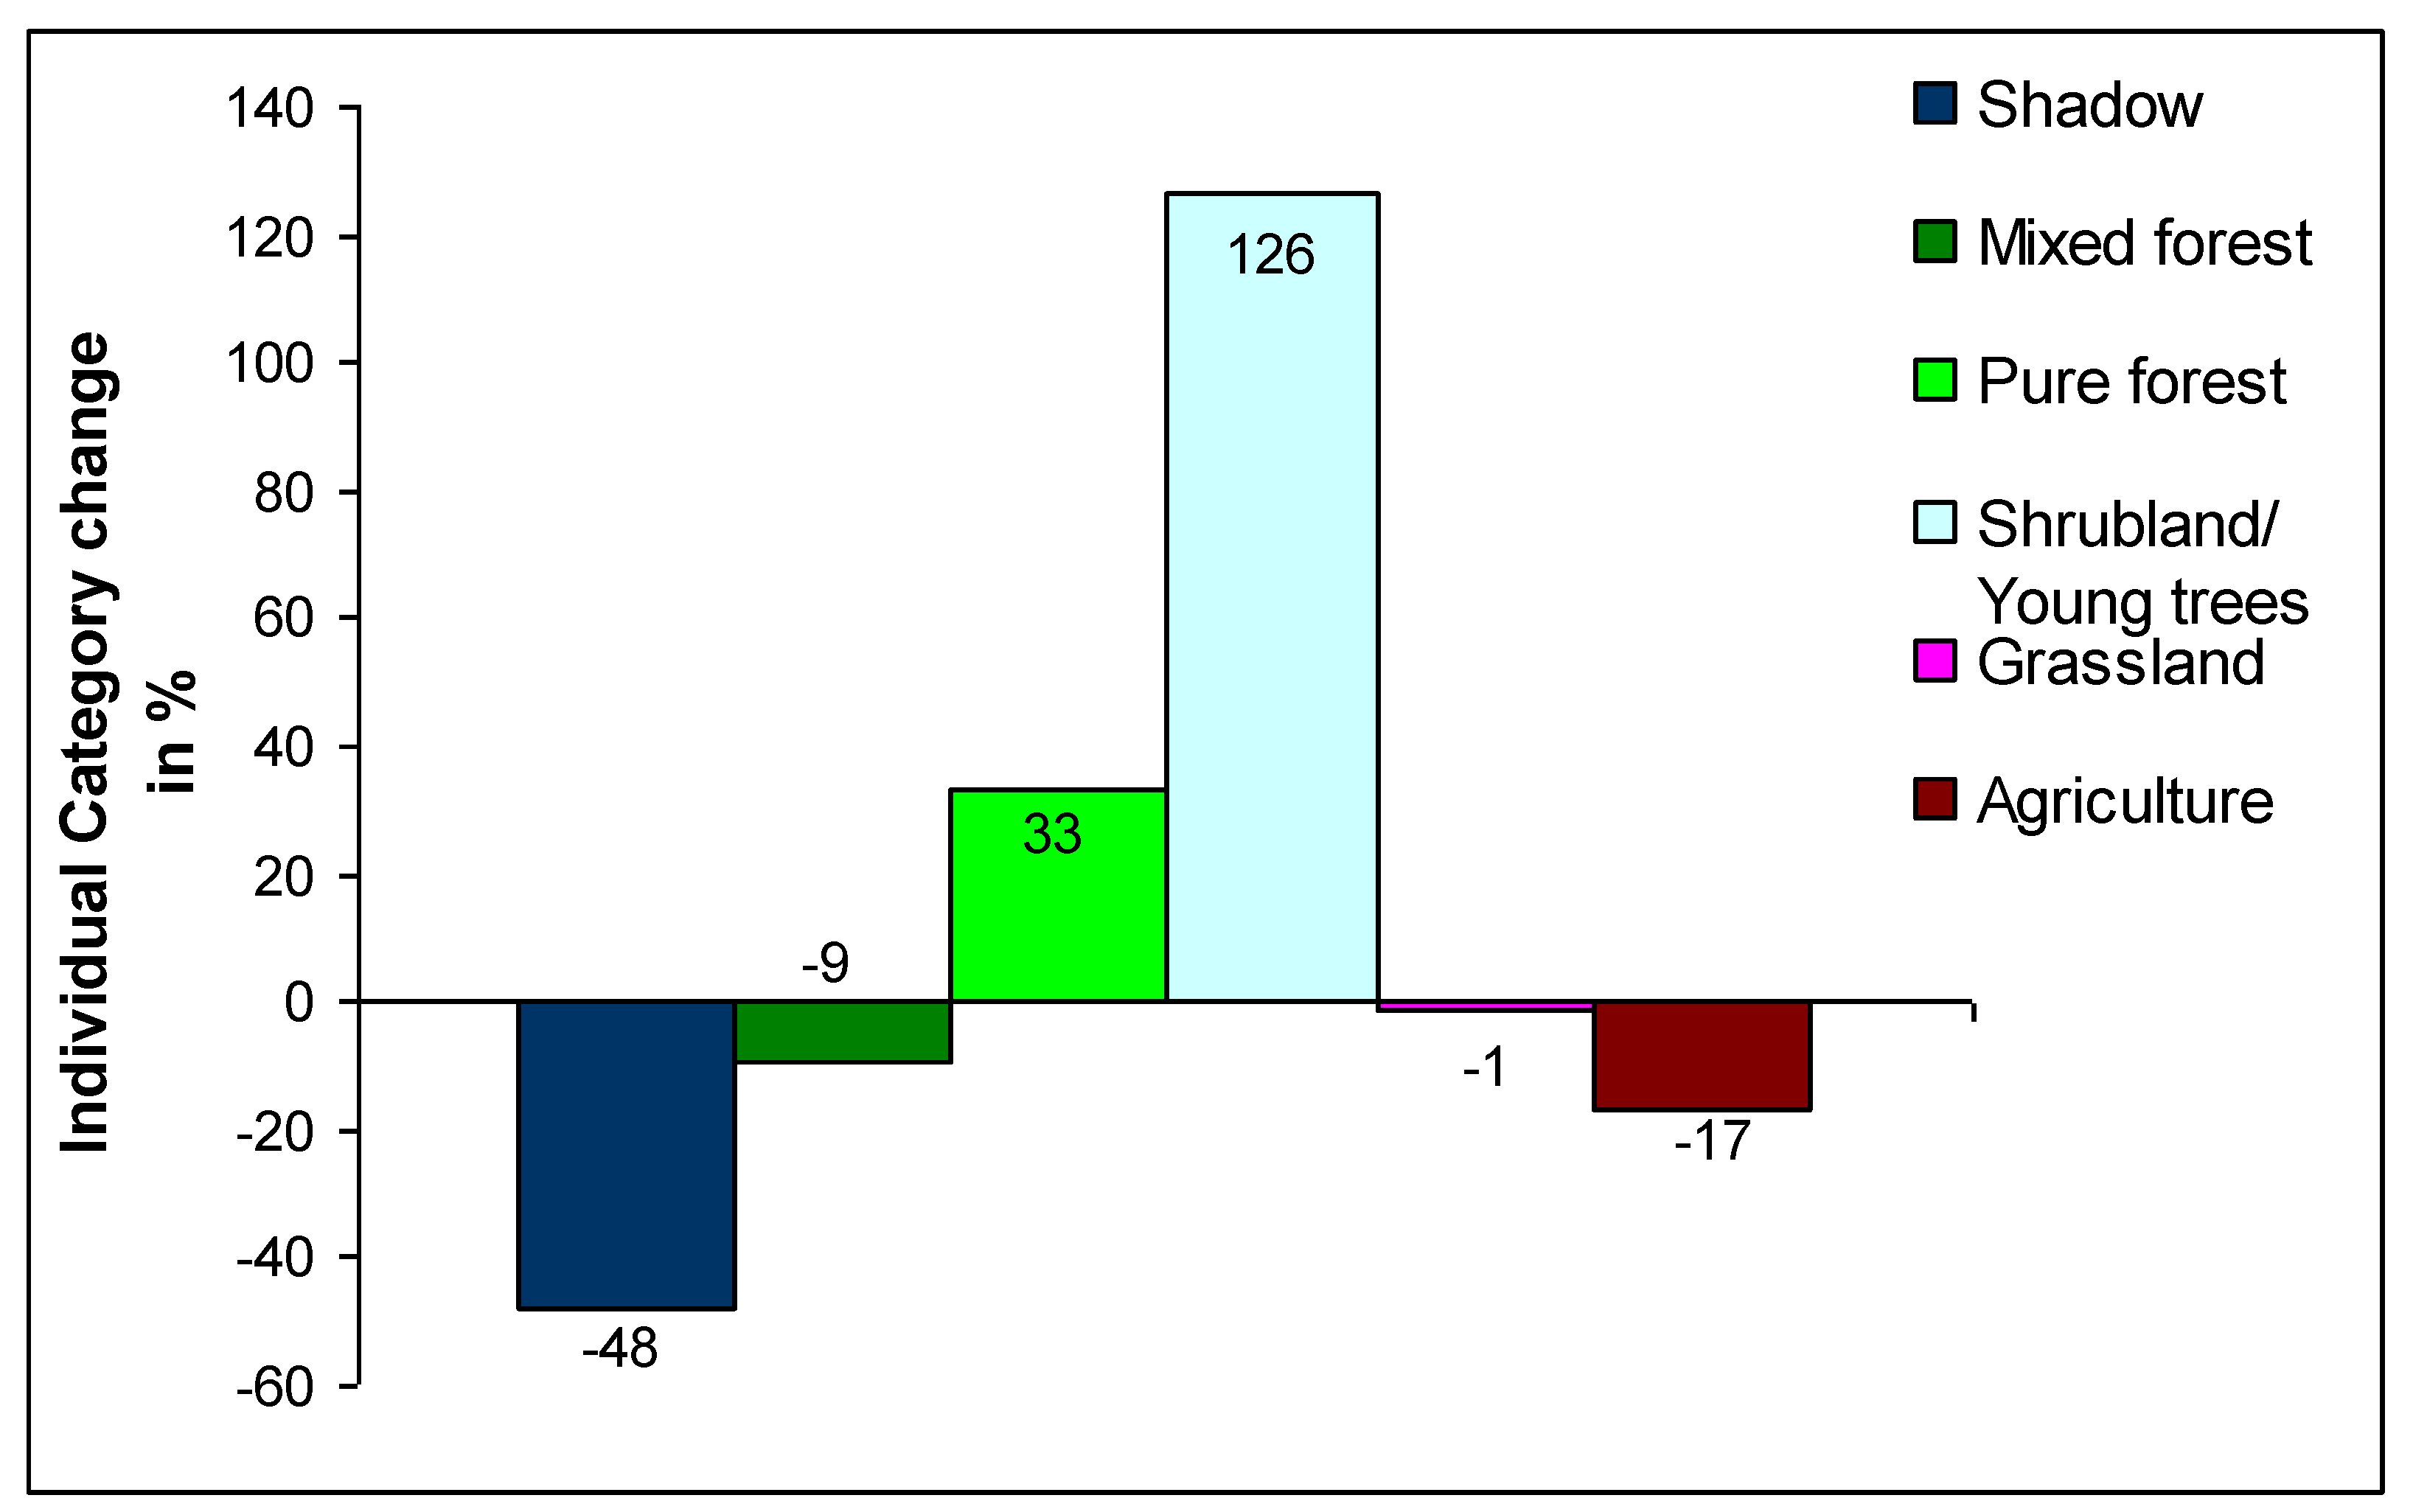
The percentage of the study area covered by pure forest and shrubland increased from 1984 to 2003. Pure forest increased from 11.71 to 15.63% of the total cover area, which means increase by 33% of 1984 cover (
Figure 4).
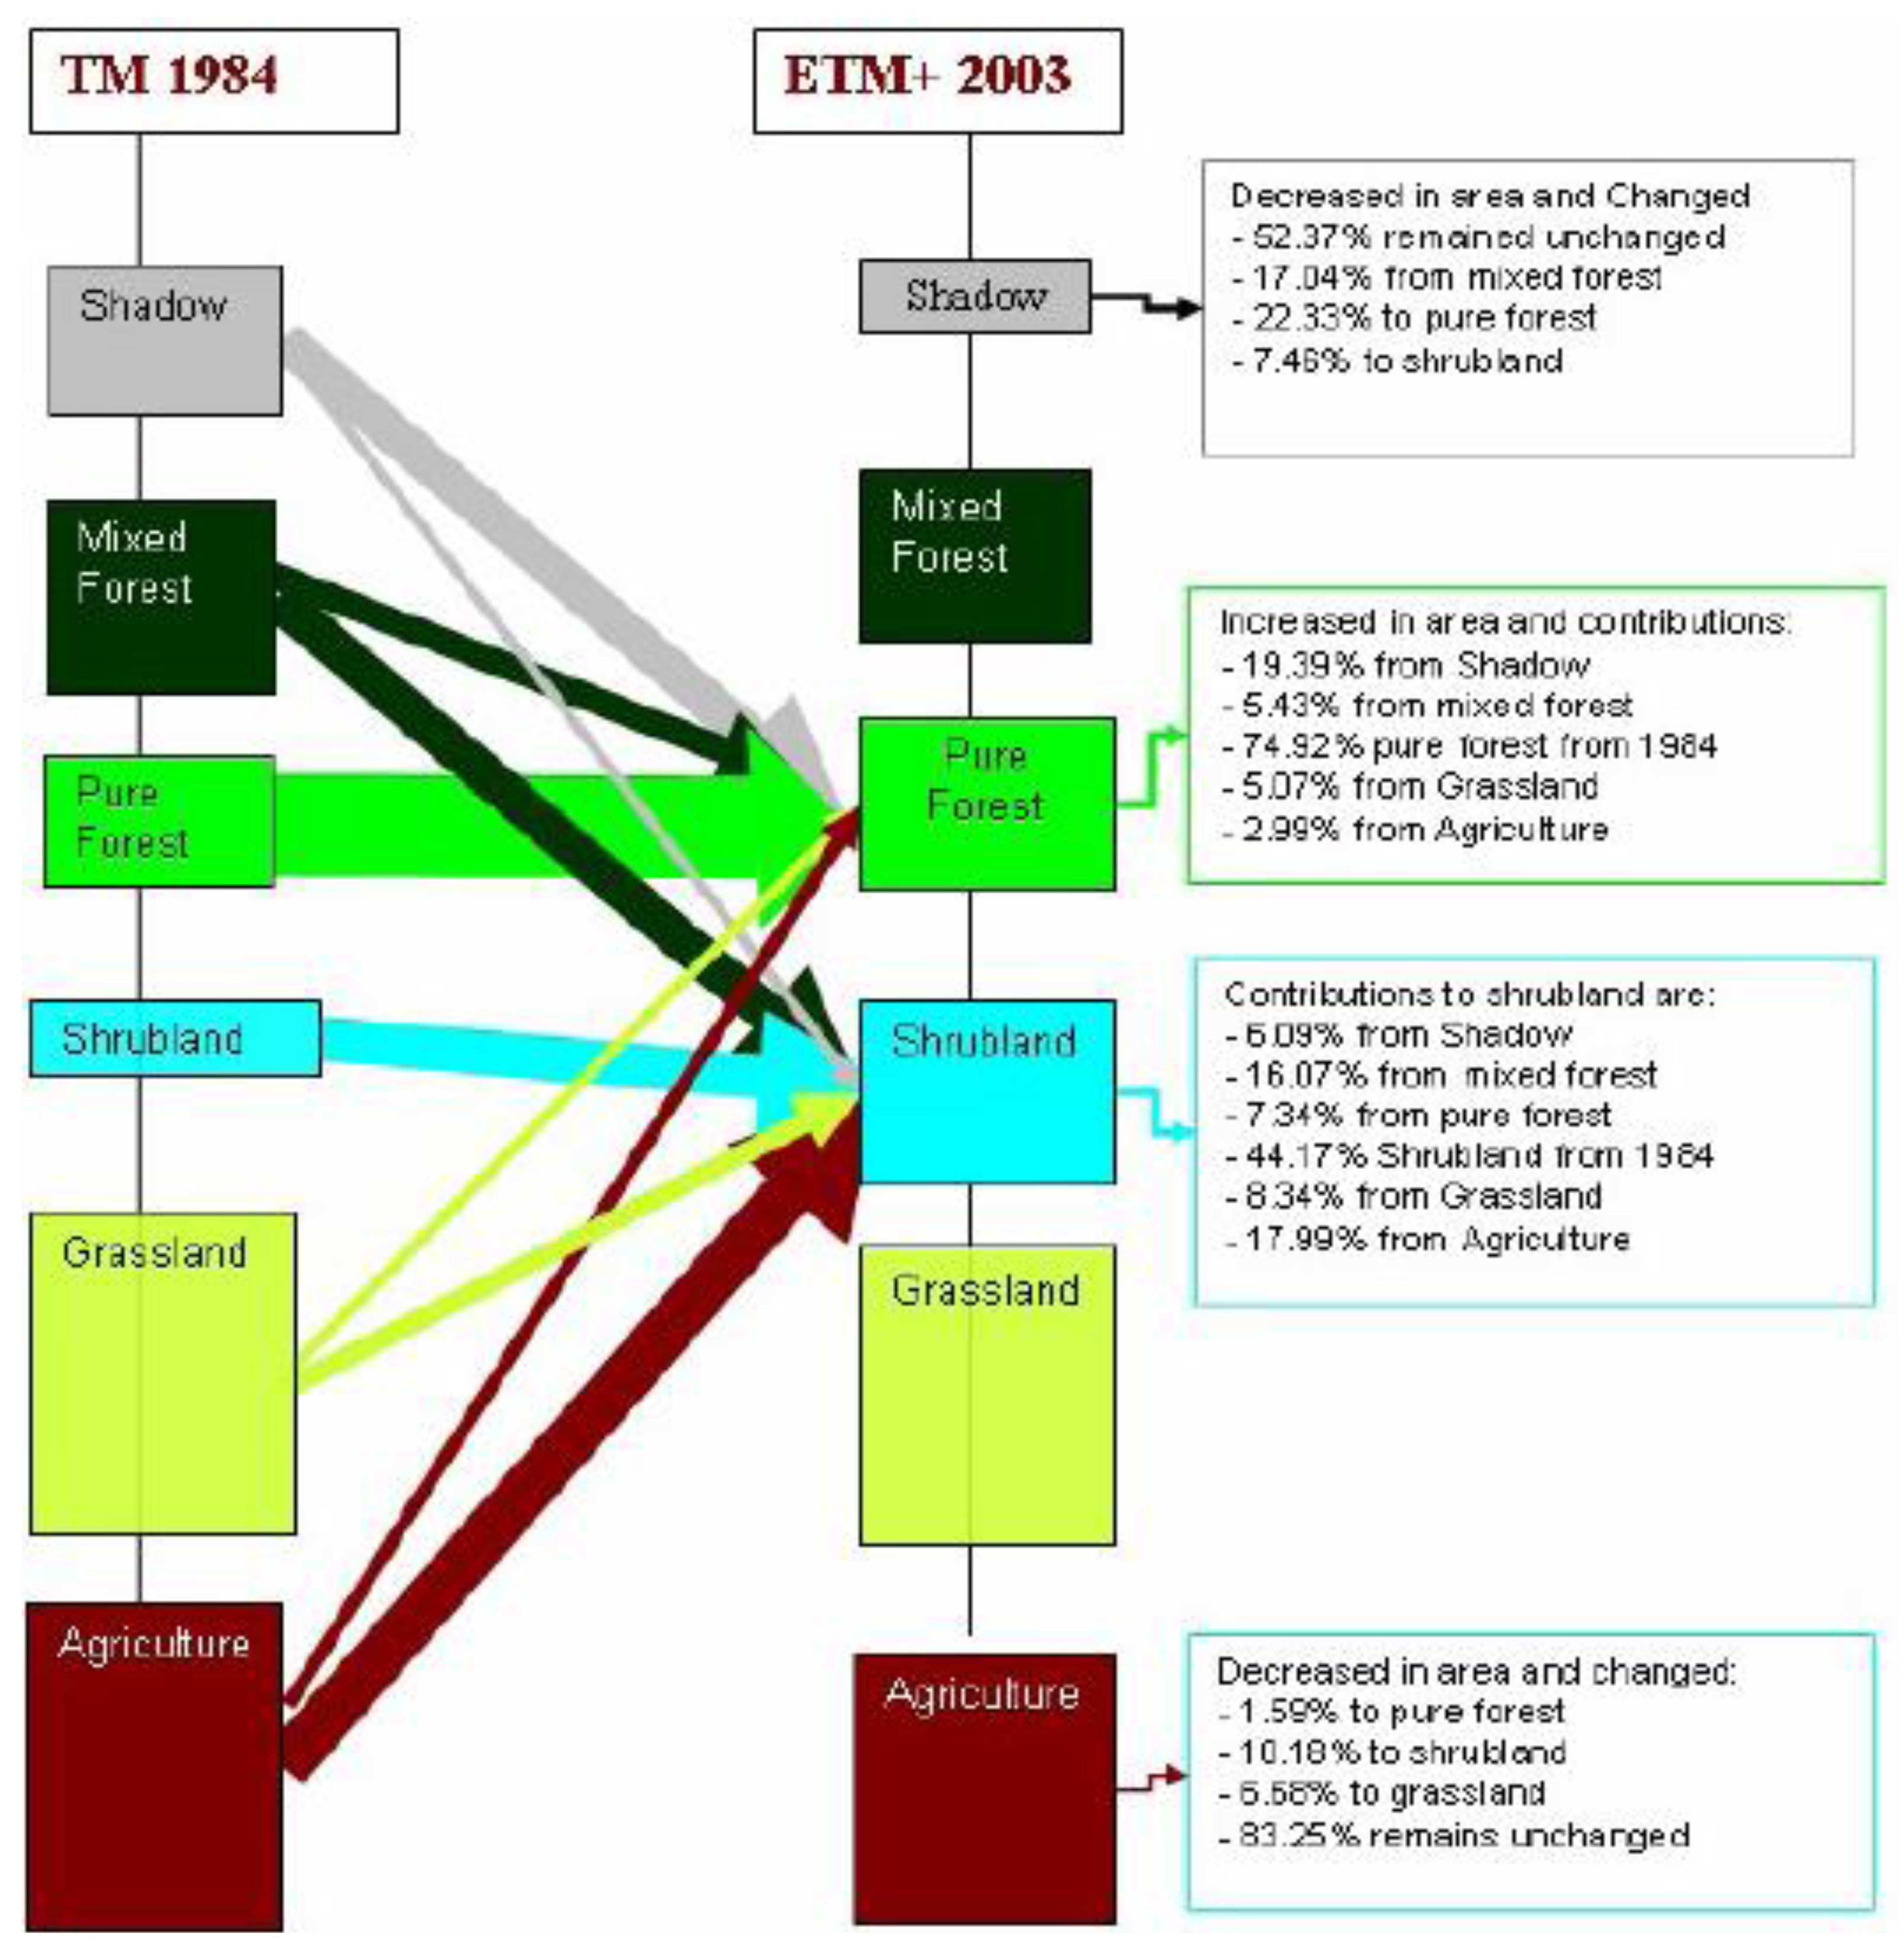
Erica species dominated forest increased particularly at the “Gich” plateau due to protection of the forest of the park and limited disturbance. The largest expansion was observed in the category of shrubland/young forest. It covered 7.34% of the total area of the park in 1984. In 2003, it expanded to 16.61% which is more than twice the cover of the year 1984. The net gain of shrubland was 126% of that in the year 1984. The overall percentage of grassland remained relatively unchanged. But, agricultural land decreased with a net loss of 683.82 ha between 1984 and 2003. The increases in forest cover and diminishing of agricultural land have positive contribution to wildlife habitat and protection of the natural resources. The conversion of one land cover to another is indicated in
Figure 5.
Figure 3.
Land cover classes of the Simen Mountains National Park (SMNP) in 1984 and 2003.
Figure 3.
Land cover classes of the Simen Mountains National Park (SMNP) in 1984 and 2003.
Figure 4.
Trend (gain or loss) of the land cover.
Figure 4.
Trend (gain or loss) of the land cover.
Agriculture, mixed natural forest and grassland are the major contributors for the increase of shrubland coverage. Agriculture contributed 18% for the increase of the shrubland/young forest.
The Landsat images proved notably useful in analysis of the ecological changes on a time-series basis and can be used for planning measures for restoration of the SMNP ecosystem. To meet the objectives of the SMNP, wildlife habitats, conservation sites, and management units can be identified and delineated with the help of GIS and RS to set up development strategies, design management activities and make decision on natural resources management. The output can be used as a basis for future conservation, management and land development strategies.
Figure 5.
Direction of change of one LC to another.
Figure 5.
Direction of change of one LC to another.
Using Landsat TM 1984 and ETM+ 2003 datasets, LCC was detected to understand the trend/direction of the natural resources mainly of the land cover. The result showed that integration of GIS and RS is effective in monitoring the overall status of the SMNP. The quantitative evidence of land cover dynamics showed that the forest cover increased from 1984 to 2003 in spite of the increase of human and animal population of the SMNP. The human and animal population is said to have increased in the last five decades. However, the result of the study indicated that agricultural areas and grassland, which form the economic basis for the people, have decreased and relatively remained unchanged, respectively, between 1984 and 2003. This can be attributed to the biophysical nature of the SMNP, regulatory rules of both National Regional and Federal Governments, international organizations and, probably, land fallowing due to decline of the soil fertility. Therefore, it is not only the socio-economic situation that has a direct impact on the dynamics of the LC, but also the biophysical nature of the area. In general, the spatial distribution of the individual LC classes is the result of human intervention and biophysical influences.
4. Conclusions
Five land cover categories are successfully classified and the shadow remained unclassified. The classified categories were shown with their spatial distribution over time. Our results provide a springboard to identify the LCC and an overall picture of the SMNP, which can serve as a hint to anticipate the trend of land cover, mainly the forest cover. LCC also has an impact on the Afroalpine ecosystem, which is the most important part of the national park as a habitat for the endangered species. However, the shadow was stated as unclassified category. Further investigation on the unclassified land cover categories, such as the shadow areas have to be incorporated in further research and development programs designed for the park. These areas could be hot spot areas as wildlife habitats, mainly, of birds, mountain climbing animals and highland forest species. Although settlements have direct correlation to LCC, they were not successfully classified due to the limited spatial resolution of the Landsat images and the pattern of settlements. Similarly, cliffs or the land cover class of so-called “unusable land” as discussed in the study of Hurni and Ludi [
18] could not be recognized in the present study. There is a limitation to comparative study of the land cover change using aerial photos and Landsat images owing to time and resource constraints. It was difficult to address long term changes from the year in which SMNP was gazetted up to the present time. Therefore, inclusion of all these data would help to show the long time trend of the resources and to predict and model the future status of the SMNP. Trend information is recommended from the year 1969 to the present time in order to have a clearer and continuous database to further facilitate policy decisions.
Analysis and display of LC and LCC in this study indicate the overall situation and highlight the trends of the SMNP in terms of the LC. Therefore, our results can provide basic information for efficient and effective monitoring of LC in relation to wildlife habitat conditions. The resource managers can superimpose the land cover map to existing management and conservation zone maps and use it as a planning tool for the optimization of protection sites within the park, providing information on the status of wildlife and natural resources. Furthermore, the LC map can provide information as an indicator of the overall environmental quality and direction of change of the SMNP over the given time. Environmental parameters may be used as hints to plan the restoration of the park and to support strategic decisions for conservation and development policy.
Remotely sensed data have a limitation: they provide information on land cover, but they cannot provide information on ‘land use’, which relates to the human (economic and cultural) activities utilizing and influencing land cover. Combined analyses of field observations, socio-economic and remotely sensed data are recommended to have a better output in terms of land use (LU) information. This can provide better information on the inherent characteristics of LC and LU classes and give a better overview on the status of the SMNP.
Although the energy source of the local people is wood-based, the overall annual rate of forest increased, which is different from the general situation in Ethiopia. This figure might mask the ecological status of different endangered species. LC map can be used to visualize the status of the SMNP by both local people and policy makers so that they can feel the changes and suggest the possible solutions. RS, with Landsat images, can detect the coarse scale status and change. However, it may overlook fine-scale changes, e.g., a fine-scale fragmentation of the ecosystem. Grazing cattle can have significant impact on vegetation, birds, mammals, and water, without being recognized by the remote sensing methods applied here. Therefore, it is recommended to identify the status of the habitat of wildlife, trend of the numbers of endemic and rare species as well as management and conservation strategies in relation to LCC with terrestrial methods.
The change detection showed that shrubland/young forest area has increased. This may be due to the abandonment of agricultural and grazing land. This evidence, in turn, indicates that the government restrictions on agricultural practice within the park have been important in mitigating the pressures of wildlife conservation and management over the last two decades: There is a reduction of agricultural land, and almost no expansion of grazing land. But, the LCC should correlate with the objective of SMNP related to conservation of endangered wildlife and endemic species and conservation of biodiversity. Furthermore, off farm activities should be considered to improve the livelihood of farmers so that the fragile ecosystem is maintained and the situation of natural resources is improved.
Land use activities could not be explained by image analysis in this study. Only the physical features of the park are displayed and analyzed mainly cover categories. Therefore, further investigations on the inherent characteristics of different LC classes have to be carried out. Further investigations of the combination of remote sensing with data on the trend of human and animal populations, economic activities, the social and cultural importance of the region, and policy issues would be helpful in solving conservation and management problems and designing future development strategies.
It is important to prevent or take measures against further expansion of settlements, which might have a negative impact on wildlife habitats. Limiting settlement expansion may help to manage and conserve the wildlife and the fragile ecosystem. Consensus-based compromises are needed among the stakeholders to facilitate both policy issues and management strategies in relation to land and land cover changes in SMNP.


