Characterizing Post-Drainage Succession in Thermokarst Lake Basins on the Seward Peninsula, Alaska with TerraSAR-X Backscatter and Landsat-based NDVI Data


 and
and
Abstract
:1. Introduction
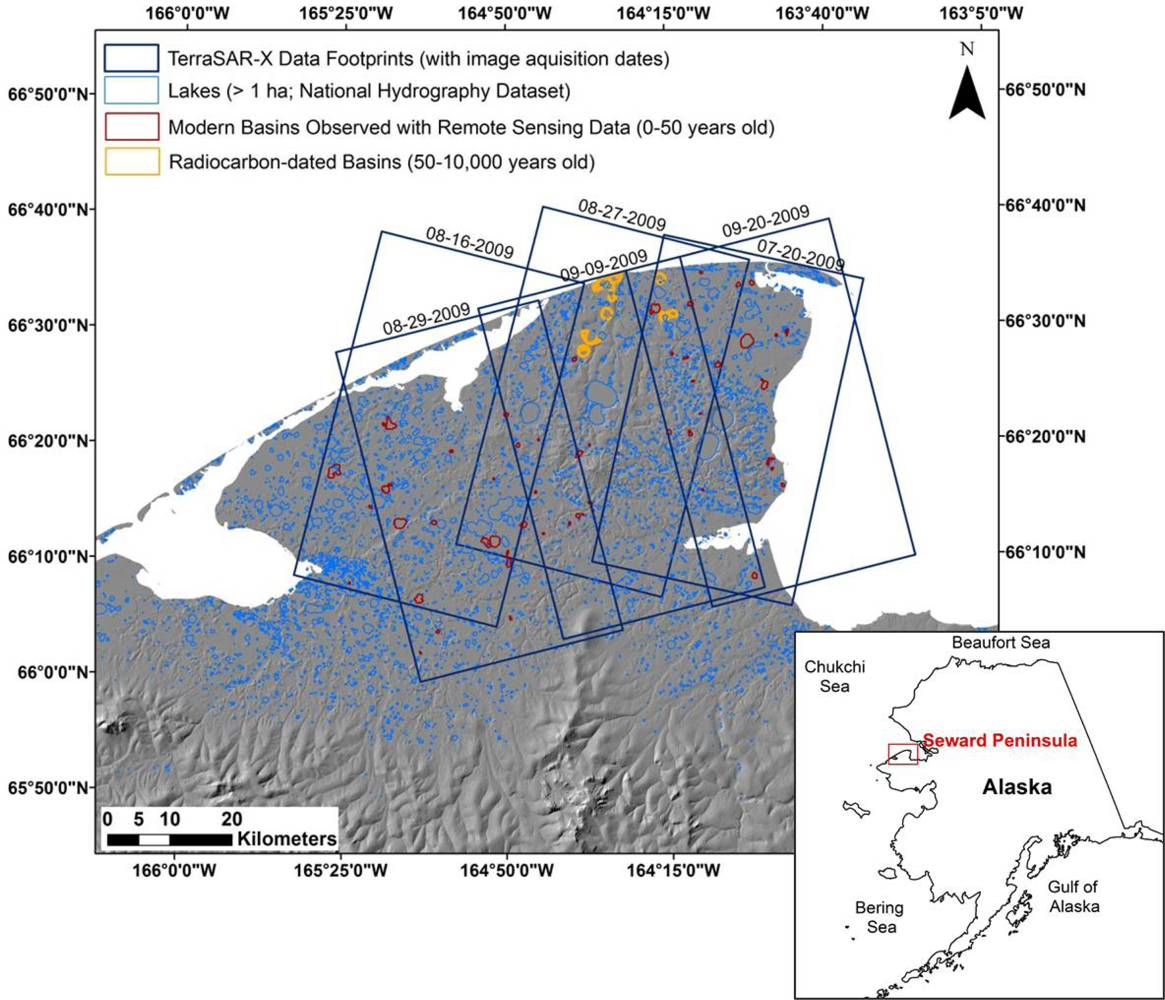
2. Study Area
3. Data
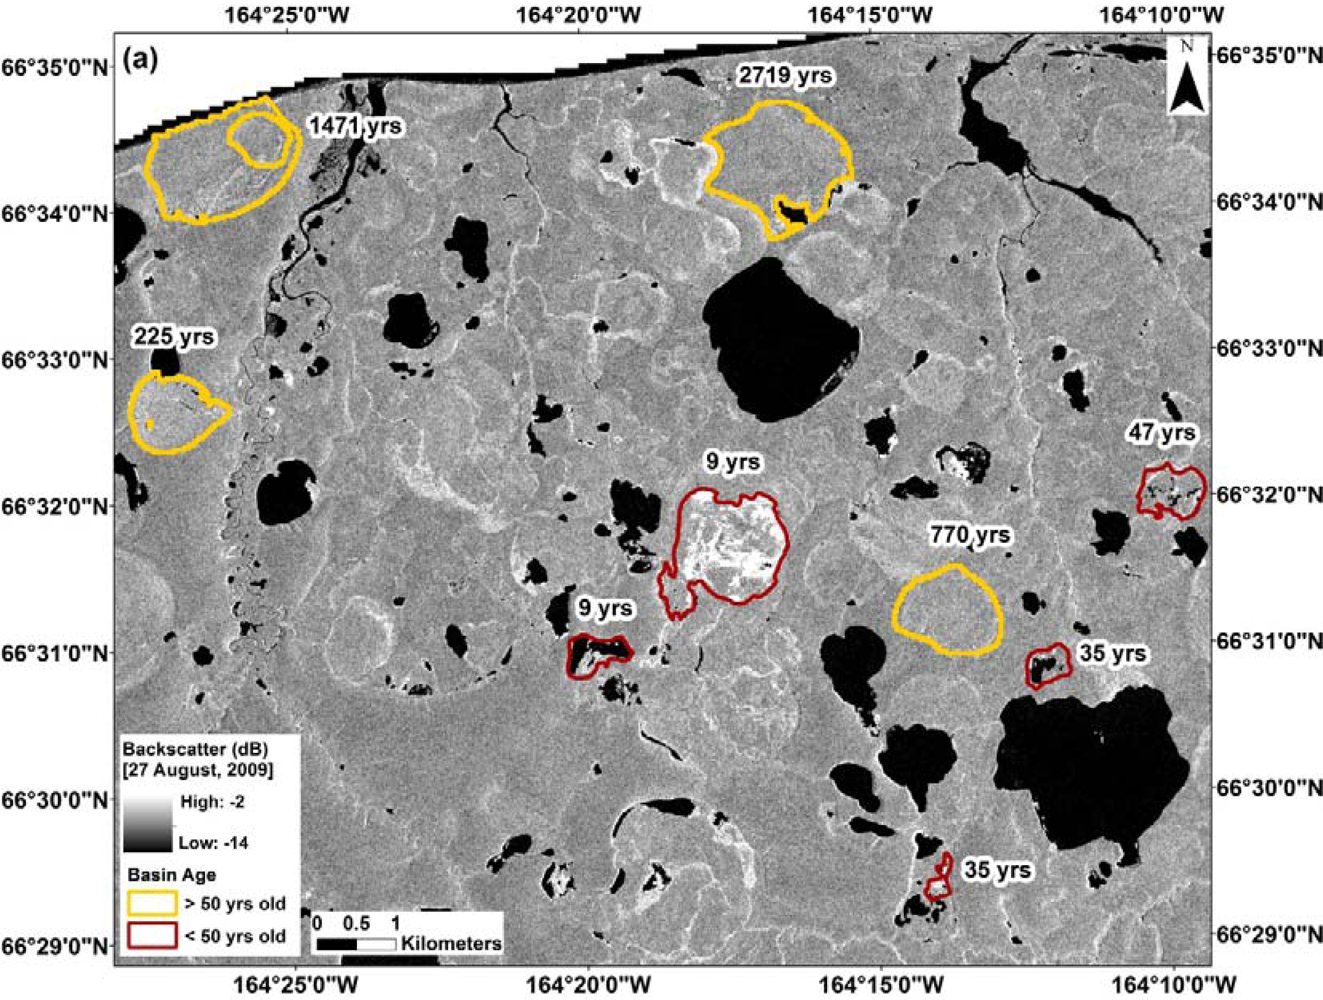
3.1. Remotely Sensed Data
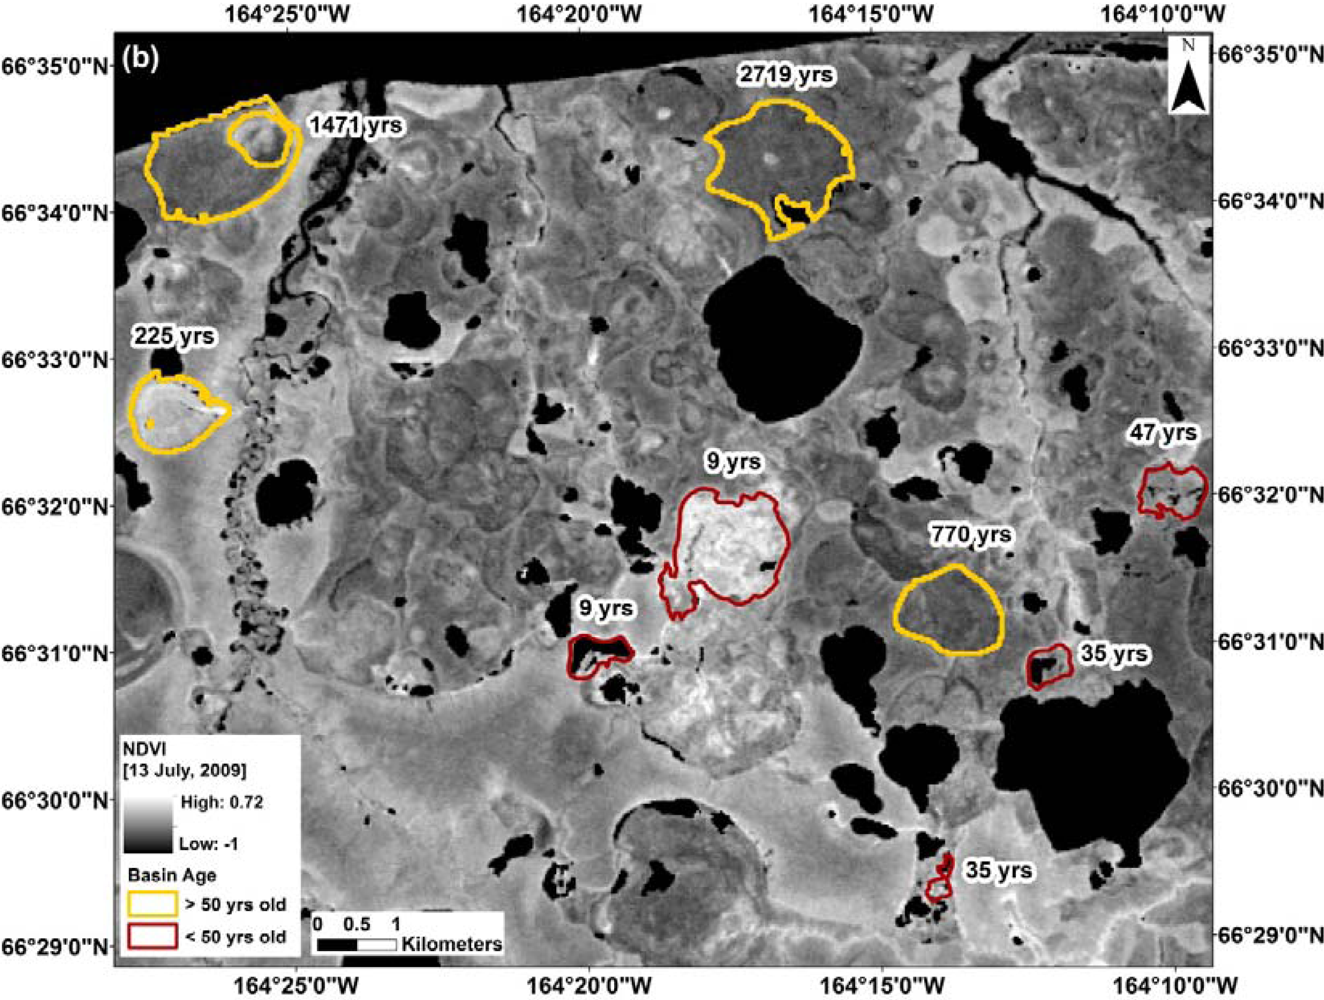
3.2. DTLB Data Layer
4. Methods
4.1. Image Processing
4.2. TSX Backscatter and NDVI of DTLBs
5. Results
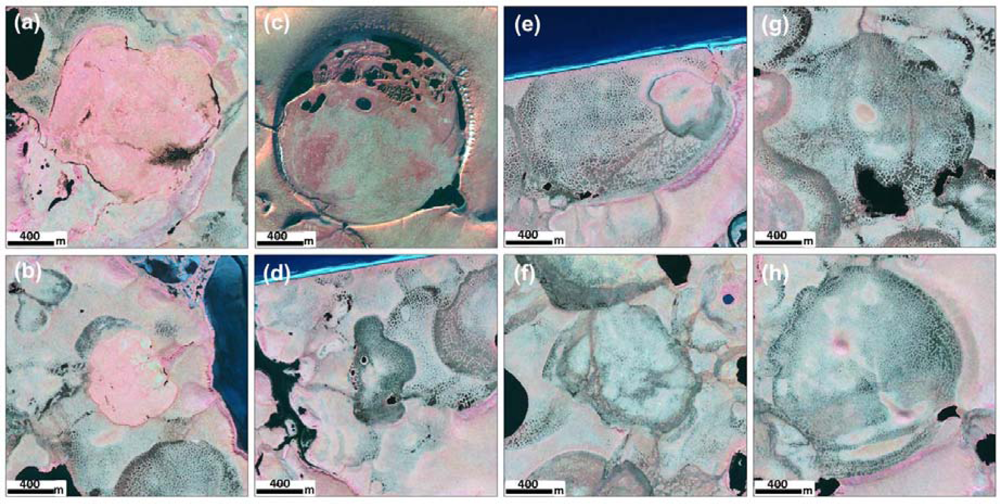
5.1. TSX backscatter and NDVI Properties of Modern DTLBs (0–50 Years since Drainage)
5.2. TSX Backscatter and NDVI Properties of Radiocarbon-Dated DTLBs (50–10,000 Years since Drainage)
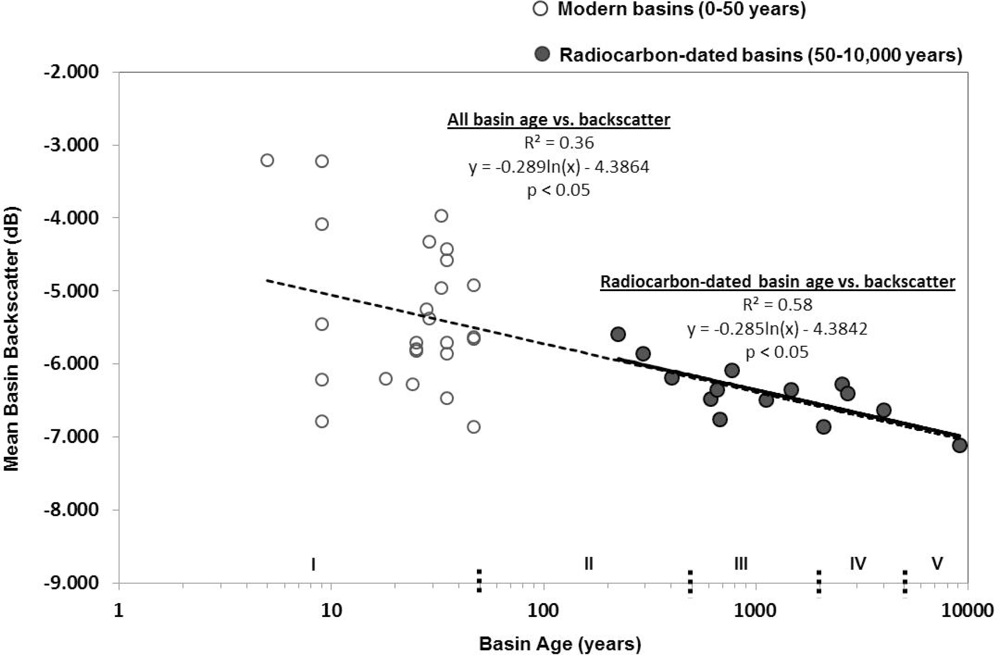
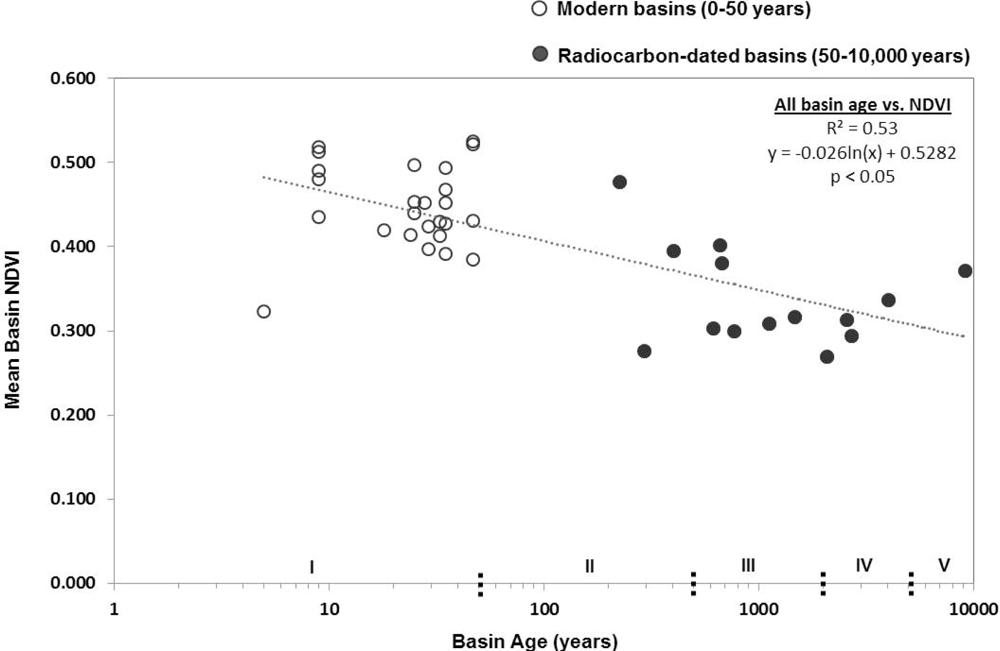
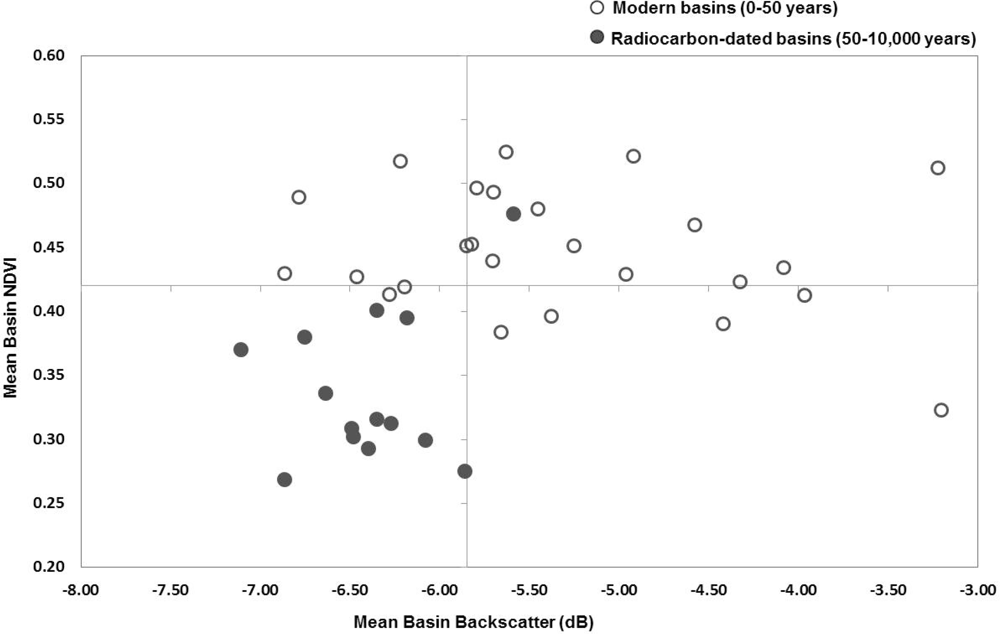
5.3. TSX Backscatter and NDVI Properties of Modern and Radiocarbon-Dated DTLBs (0–10,000 Years since Drainage)
6. Discussion
6.1. Uncertainties
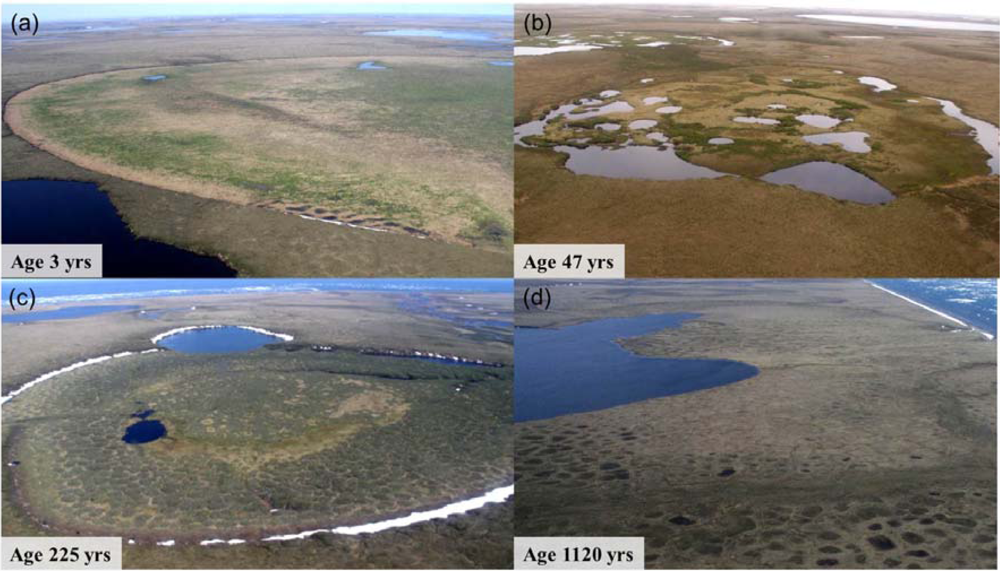
6.2. Surface Characteristics of Modern DTLBs (0–50 Years since Drainage)
6.3. Surface Characteristics of Modern and Radiocarbon-Dated DTLBs (0–10,000 Years since Drainage)
6.4. Discussion of Long-Term DTLB Development
7. Conclusion
Acknowledgments
References
- Czudek, T.; Demek, J. Thermokarst in Siberia and its influence on the development of lowland relief. Quaternary Res 1970, 1, 103–120. [Google Scholar]
- Soloviev, P.A. Thermokarst phenomena and landforms due to frost heaving in central Yakutia. Biul. Peryglacjalny 1973, 23, 135–155. [Google Scholar]
- Burn, C.R.; Smith, M.W. Development of thermokarst lakes during the Holocene at sites near Mayo, Yukon territory. Permafrost Periglac. Process 1990, 1, 161–175. [Google Scholar]
- Morgenstern, A.; Grosse, G.; Günther, F.; Fedorova, I.; Schirrmeister, L. Spatial analyses of thermokarst lakes and basins in Yedoma landscapes of the Lena Delta. Cryosphere 2011, 5, 849–867. [Google Scholar] [Green Version]
- Grosse, G.; Jones, B.; Arp, C. Thermokarst Lakes, Drainage, and Drained Basins. In Treatise in Geomorphology; Elsevier: New York, NY, USA, 2012; in press. [Google Scholar]
- Livingstone, D.A.; Bryan, K.; Leahy, R.G. Effects of an arctic environment on the origin and development of fresh-water lakes. Limnol. Oceanogr 1958, 3, 192–214. [Google Scholar]
- Sellmann, P.V.; Brown, J.; Lewellen, R.I.; McKim, H.; Merry, C. The Classification and Geomorphic Implications of Thaw Lakes on the Arctic Coastal Plain, Alaska; US Army CRREL Research Report 344; US Army Cold Regions Research and Engineering Laboratory: Hanover, NH, USA, 1975; p. 21. [Google Scholar]
- Hopkins, D.M.; Kidd, J.G. Thaw Lake Sediments and Sedimentary Environments. Proceedings of the 5th International Permafrost Conference, Trondheim, Norway, 2–5 August 1988; pp. 790–795.
- Frohn, R.C.; Hinkel, K.M.; Eisner, W.R. Satellite remote sensing classification of thaw lakes and drained thaw lake basins on the North Slope of Alaska. Remote Sens. Environ 2005, 97, 116–126. [Google Scholar]
- Jones, M.C.; Grosse, G.; Jones, B.M.; Walter Anthony, K. Peat accumulation in drained thermokarst lake basins in continuous, ice-rich permafrost, northern Seward Peninsula, Alaska. J. Geophys. Res 2012, 117, 1–16. [Google Scholar]
- Wang, J.; Shen, Y.; Hinkel, K.M.; Lyons, E.A. Drained thaw lake basin recovery on the western Arctic Coastal Plain of Alaska using high resolution digital elevation models and remote sensing imagery. Remote Sens. Environ 2012, 119, 325–336. [Google Scholar]
- Hinkel, K.M.; Eisner, W.R.; Bockheim, J.G.; Nelson, F.E.; Peterson, K.M.; Dai, X. Spatial extent, age, and carbon stocks in drained thaw lake basins on Barrow Peninsula, Alaska. Arctic Antarct. Alpine Res 2003, 35, 391–300. [Google Scholar]
- Bockheim, J.G.; Hinkel, K.M.; Eisner, W.R.; Dai, X.Y. Carbon pools and accumulation rates in an age-series of soils in drained thaw-lake basins, Arctic Alaska. Soil Sci. Soc. Am. J 2004, 68, 697–704. [Google Scholar]
- Gorham, E. Northern peatlands: Role in the carbon cycle and probable responses to climatic warming. Ecol. Appl 1991, 1, 182–195. [Google Scholar]
- Walter, K.M.; Smith, L.C.; Chapin, F.S., III. Methane bubbling from northern lakes: Present and future contributions to the global methane budget. Phil. Trans. R. Soc. Lond. B 2007, 365, 1657–1676. [Google Scholar]
- Zimov, S.A.; Davydov, S.P.; Zimova, G.M.; Davydova, A.I.; Schuur, E.A.G.; Dutta, K.; Chapin, F.S., III. Permafrost carbon: Stock and decomposability of a globally significant carbon pool. Geophys. Res. Lett 2006, 33, L20502. [Google Scholar]
- Schuur, E.A.G.; Bockheim, J.; Canadell, J.G.; Euskirchen, E.; Field, B.F.; Goryachkin, S.V.; Hagemann, S.; Kuhry, P.; Lafleur, P.M.; Lee, H.; et al. Vulnerability of permafrost carbon to climate change: Implications for the global carbon cycle. BioScience 2008, 58, 701–714. [Google Scholar]
- Sitch, S.; McGuire, A.D.; Kimball, J.; Gedney, N.; Gamon, J.; Engstrom, R.; Wolf, A.; Zhuang, Q.; Clein, J.; McDonald, K.C. Assessing the carbon balance of circumpolar Arctic tundra using remote sensing and process modeling. Ecol. Appl 2007, 17, 213–234. [Google Scholar]
- Eisner, W.R.; Peterson, K.M. Pollen, Fungi and Algae as Age Indicators of Drained Lake Basins near Barrow, Alaska. In Proceedings of the 7th International Permafrost Conference, Yellowknife, NWT, Canada, 23–27 June 1998; Lewkowicz, A.G., Allard, M., Eds.; Centre d’études nordiques de l’Université Laval: Quebec, QC, Canada, 1998; pp. 790–795. [Google Scholar]
- Yoshikawa, K.; Hinzman, L.D. Shrinking thermokarst ponds and groundwater dynamics in discontinuous permafrost near Council, Alaska. Permafrost Periglac. Process 2003, 14, 151–160. [Google Scholar]
- Jorgenson, M.T.; Shur, Y. Evolution of lakes and basins in northern Alaska and discussion of the thaw lake cycle. J. Geophys. Res 2007, 112, 1–12. [Google Scholar]
- Hopkins, D.M. Thaw lakes and thaw sinks in the Imuruk Lake area, Seward Peninsula, Alaska. J. Geol 1949, 57, 119–131. [Google Scholar]
- Carson, C.E.; Hussey, K.M. The oriented lakes of Arctic Alaska. J. Geol 1962, 70, 417–439. [Google Scholar]
- Billings, W.D.; Peterson, K.M. Vegetational change and ice wedge polygons through the thaw-lake cycle in Arctic Alaska. Arctic Alpine Res 1980, 1, 413–432. [Google Scholar]
- West, J.J.; Plug, L.J. Time-dependent morphology of thaw lakes and taliks in deep and shallow ground ice. J. Geophys. Res 2008, 113, 1–14. [Google Scholar]
- Kokelj, S.V.; Lantz, T.C.; Kanigan, J.; Smith, S.L.; Coutts, R. Origin and polycyclic behaviour of tundra thaw slumps, Mackenzie Delta region, Northwest Territories, Canada. Permafrost Periglac. Process 2009, 20, 173–184. [Google Scholar]
- Jones, B.; Grosse, G.; Arp, C.D.; Jones, M.C.; Walter Anthony, K.M.; Romanovsky, V.E. Modern thermokarst lake dynamics in the continuous permafrost zone, northern Seward Peninsula, Alaska. J. Geophys. Res.-Biogeosci. 2011, 116, G00M03. [Google Scholar]
- Mackay, J.R. Catastrophic lake drainage, Tuktoyaktuk Peninsula area, District of Mackenzie. Curr. Res.-Bull. Geol. Surv. Can. 1988, 88–1D, 83–90. [Google Scholar]
- Bliss, L.C.; Peterson, K.M. Arctic Ecosystems in a Changing Climate. In Plant Succession, Competition, and the Physiological Constraints of Species in the Arctic: An Ecophysiological Perspective; Chapin, F.S., III, Jefferies, R.L., Reynolds, J.F., Shaver, G.R., Svoboda, J., Chu, E.W., Eds.; Academic Press: San Diego, CA, USA, 1992; pp. 111–136. [Google Scholar]
- Hinkel, K.M.; Frohn, R.C.; Nelson, F.E.; Einser, W.R.; Beck, R.A. Morphometric and spatial analysis of thaw lakes and drained thaw lake basins in the western Arctic Coastal Plain, Alaska. Permafrost Periglac. Process 2005, 16, 327–341. [Google Scholar]
- Ling, F.; Zhang, T.J. Modeling study of talik freeze-up and permafrost response under drained thaw lakes on the Alaskan Arctic Coastal Plain. J. Geophys. Res. 2004, 109, D01111.32. [Google Scholar]
- Zona, D.; Oechel, W.C.; Peterson, K.M.; Clements, R.J.; Paw, U.K.T.; Ustin, S.L. Characterization of the carbon fluxes of a vegetated drained lake basin chronosequence on the Alaskan Arctic Coastal Plain. Global Change Biol 2010, 16, 1870–1882. [Google Scholar]
- Mackay, J.R.; Burn, C.R. The first 20 years (1978–1979 to 1998–1999) of ice-wedge growth at the Illisarvik experimental drained lake site, western Arctic coast, Canada. Can. J. Earth Sci 2002, 39, 95–111. [Google Scholar]
- Carson, C.E. Radiocarbon dating of lacustrine strands in Arctic Alaska. Arctic 1968, 21, 12–26. [Google Scholar]
- Kessler, M.A.; Plug, L.; Walter Anthony, K. Simulating the decadal to millennial scale dynamics of morphology and sequestered carbon mobilization of two thermokarst lakes in northwest Alaska. J. Geophys. Res. 2012, 117, GM00M06. [Google Scholar]
- Zulueta, R.C.; Oechel, W.C.; Loescher, H.W.; Lawrence, W.T.; Paw U, K.T. Aircraft-derived regional scale CO2 fluxes from vegetated drained thaw-lake basins and interstitial tundra on the Arctic Coastal Plain of Alaska. Global Change Biol 2011, 17, 2781–2802. [Google Scholar]
- Newton, R.W.; Rouse, J.W., Jr. Microwave radiometer measurements of soil moisture content. IEEE Trans. Antenn. Propag 1980, 28, 680–686. [Google Scholar]
- Shi, J.; Wang, J.; Hsu, A.Y.; O’Neill, P.E.; Engman, E.T. Estimation of bare surface soil moisture and surface roughness using L-band SAR image data. IEEE Trans. Geosci. Remote Sens 1997, 35, 1254–1266. [Google Scholar]
- Baghdadi, N.; Aubert, M.; Cerdan, O.; Franchistéguy, L.; Viel, C.; Martin, E.; Zribi, M.; Desprats, L.F. Operational mapping of soil moisture using Synthetic Aperture Radar data: Application to the Touch Basin (France). Sensors 2007, 7, 2458–2483. [Google Scholar]
- Baghdadi, N.; Cresson, R.; Todoroff, P.; Moinet, S. Multitemporal observations of sugarcane by TerraSAR-X images. Sensors 2010, 10, 8899–8919. [Google Scholar]
- Bindlish, R.; Barros, A.P. Parameterization of vegetation backscatter in radar-based, soil moisture estimation. Remote Sens. Environ 2001, 76, 130–137. [Google Scholar]
- Stow, D.; Daeschner, S.; Boynton, W.; Hope, A. Arctic tundra functional types by classification of single-date and AVHRR bi-weekly NDVI composite datasets. Int. J. Remote Sens 2000, 21, 1773–1779. [Google Scholar]
- Grosse, G.; et al. Personal Communication. November 2012.
- Arp, C.D.; Jones, B.M. Geography of Alaska Lake Districts: Identification, Description, and Analysis of Lake- Rich Regions of a Diverse and Dynamic State; US Geological Survey Scientific Investigations Report 2008–5215; USGS National Center: Reston, VA, USA, 2009; p. 40. [Google Scholar]
- Charron, S.D. Surficial Mapping of the Cape Espenberg-Devil Mountain Region and Lake Core Analyses from North Killeak Lake, Bering Land Bridge National Preserve, Western Alaska. University of Massachusetts, Amherst, MA, USA, 1995. [Google Scholar]
- Smith, S.L.; Romanovsky, V.E.; Lewkowicz, A.G.; Burn, C.R.; Allard, M.; Clow, G.D.; Yoshikawa, K.; Throop, J. Thermal state of permafrost in North America: A contribution to the International Polar Year. Permafrost Periglac. Process 2010, 21, 117–135. [Google Scholar]
- Hopkins, D.M.; Karlstrom, T.N.V.; Black, R.; Pewe, T.L.; Fernold, A.T.; Muller, E.H. Permafrost and Ground Water in Alaska; US Geological Survey Professional Paper 264-F; USGS: Washington, DC, USA, 1955; p. 70. [Google Scholar]
- Burn, C.R.; Kokelj, S.V. The environment and permafrost of the Mackenzie Delta area. Permafrost Periglac. Process 2009, 20, 83–105. [Google Scholar]
- Rupp, T.S.; Chapin, F.S., III; Starfield, A.M. Response of subarctic vegetation to transient climatic change on the Seward Peninsula in north-west Alaska. Global Change Biol 2000, 6, 541–555. [Google Scholar]
- Roth, A.; Hoffmann, J.; Esch, T. TerraSAR-X: How can High Resolution SAR Data Support the Observation of Urban Areas? Proceedings of the ISPRS WG VII/1 “Human Settlements and Impact Analysis”, 3rd International Symposium Remote Sensing and Data Fusion Over Urban Areas (URBAN 2005) and 5th International Symposium Remote Sensing of Urban Areas (URS 2005), Tempe, AZ, USA, 14–16 March 2005.
- Stow, D.A.; Hope, A.; McGuire, D.; Verbyla, D.; Gamon, J.; Huemmrich, F.; Houston, S.; Racine, C.; Sturm, M.; Tape, K.; et al. Remote sensing of vegetation and land-cover change in Arctic tundra ecosystems. Remote Sens. Environ 2004, 89, 281–308. [Google Scholar]
- Riedel, S.M.; Epstein, H.E.; Walker, D.A. Biotic controls over spectral reflectance of arctic tundra vegetation. Int. J. Remote Sens 2005, 26, 2391–2405. [Google Scholar]
- Tucker, C.J. Red and photographic infrared linear combinations for monitoring vegetation. Remote Sens. Environ 1979, 8, 127–150. [Google Scholar]
- Parsekian, A.D.; Jones, B.M.; Jones, M.C.; Grosse, G.; Walter Anthony, K.M.; Slater, L. Geometry of floating vegetation mats on the expanding margins of thermokarst lakes, Northern Seward Peninsula, Alaska, USA. Earth Surf. Process. Landf 2011, 36, 1889–1897. [Google Scholar]
- Li, S. Summer environmental mapping potential of a large-scale ERS-1 SAR mosaic of the state of Alaska. Int. J. Remote Sens 1999, 20, 387–401. [Google Scholar]
- Costa, M.P.F.; Niemann, O.; Novo, E.; Ahern, F. Biophysical properties and mapping of aquatic vegetation during the hydrological cycle of the Amazon floodplain using JERS-1 and Radarsat. Int. J. Remote Sens 2002, 23, 1401–1426. [Google Scholar]
- Wang, Y.; Hess, L.L.; Filoso, S.; Melack, J.M. Understanding the radar backscattering from flooded and non-flooded Amazonian Forests: Results from canopy backscatter modeling. Remote Sens. Environ 1995, 54, 324–332. [Google Scholar]
- Töyrä, J.; Pietroniro, A.; Lawrence, W.M. Multisensor hydrologic assessment of a freshwater wetland. Remote Sens. Environ 2001, 75, 162–173. [Google Scholar]
- Svoray, T.; Shoshany, M.; Curran, P.J.; Foody, G.M.; Perevolotsky, A. Relationship between green leaf biomass volumetric density and ERS-2 SAR backscatter of four vegetation formations in the semi-arid zone of Israel. Int. J. Remote Sens 2001, 22, 1601–1607. [Google Scholar]
- Baghdadi, N.; Camus, P.; Beaugendre, N.; Issa, O.M.; Zribi, M.; Desprats, J.F.; Rajot, J.L.; Abdallah, C.; Sannier, C. Estimating surface soil moisture from TerraSAR-X data over two small catchments in the Sahelian Part of Western Niger. Remote Sens 2011, 3, 1266–1283. [Google Scholar]
- Aubert, M.; Baghdadi, N.; Zribi, M.; Douaoui, A.; Loumagne, C.; Baup, F.; Hajj, M.E.; Garrigues, S. Analysis of TerraSAR-X data sensitivity to bare soil moisture, roughness, composition and soil crust. Remote Sens. Environ 2011, 115, 1801–1810. [Google Scholar] [Green Version]
- Brewer, M.C.; Carter, L.D.; Glenn, R. Sudden Drainage of a Thaw Lake on the Alaskan Arctic Coastal Plain. Proceedings of Sixth International Conference on Permafrost, Beijing, China, 5–9 July 1993; South China University of Technology Press: Guangzhou, China, 1993; 1, pp. 48–53. [Google Scholar]
- Marsh, P.; Russell, M.; Pohl, S.; Haywood, H.; Onclin, C. Changes in thaw lake drainage in the western Canadian Arctic from 1950 to 2000. Hydrol. Process 2009, 23, 145–158. [Google Scholar]


| Scenes | Acquisition Date | Spatial Resolution | Incidence Angle | Orbit Direction | Polarization |
|---|---|---|---|---|---|
| TerraSAR-X 1 | 07/20/2009 | 3 m | 35.3° | Descending | HH |
| TerraSAR-X 2 | 08/16/2009 | 3 m | 31.0° | Descending | HH |
| TerraSAR-X 3 | 08/27/2009 | 3 m | 28.8° | Descending | HH |
| TerraSAR-X 4 | 08/29/2009 | 3 m | 31.1° | Ascending | HH |
| TerraSAR-X 5 | 09/09/2009 | 3 m | 33.2° | Ascending | HH |
| TerraSAR-X 6 | 09/20/2009 | 3 m | 35.3° | Ascending | HH |
| Landsat-5 TM | 07/13/2009 | 30 m | - | - | - |
| Basin Class* | Modern (0–50 years) | Young (50–500 years) | Medium (500–2,000 years) | Old (2,000–5,000 years) | Ancient (>5,000 years) |
|---|---|---|---|---|---|
| Number of basins studied | 60 | 3 | 6 | 4 | 1 |
| Mean late summer (27 August) | −5.3 ± 0.99 | −5.88 ± 0.24 | −6.42 ± 0.20 | −6.54 ± 0.23 | −7.11 |
| TSX backscatter (dB) | |||||
| Mean mid-summer (13 July) | 0.45 ± 0.05 | 0.38 ± 0.08 | 0.33 ± 0.04 | 0.30 ± 0.02 | 0.37 |
| NDVI | |||||
| Vegetation | High average gross primary productivity with dominating plant species* Calamagrostis canadensis, Dupontia fisherii, Carex aquatilis. | Low average gross primary productivity with dominating plant species* Carex bigelowii, Eriophorum angustifolium and Sphagnum fuscum, Betula nana, Salix sp., and prostrate ericaceous shrubs. However, low-centered polygonal ponds in older basins contain productive species such as Carex aquatilis. | |||
| Permafrost aggradation | Lake sediment starts to refreeze after drainage over several years to decades as a result of exposed lake bottom. | Frost heave occurs due to refreezing of lake sediments and taliks and ground ice accumulation. Frost cracking occurs; in basins that only had very shallow lakes, not thawedout ice wedge networks, may become reactivated. | Low-center ice-wedge polygonal networks are largely well developed. | Basins have very well developed low-center ice-wedge polygonal networks. Some basins have fully developed hydrostatic pingos. In some basins, ground ice is sufficient to allow development of new thermokarst ponds and expansion of small remnant lakes. | |
| Basin wetness | High soil moisture and standing water in most lowland basins, low soil moisture in upland basins where steeper topographic gradient allows better drainage. | Beginning development of polygonal networks creates micro-mosaic of wetter and drier areas in basins, polygonal ponds develop. | Polygonal ponds appear widely in low center polygons. Ponded polygons are more distinct in older medium aged basins (>1,000 years). | Long-term frost heave, including pingo formation, results in drying of central basin areas. Some basins have increased number of polygonal and ice wedge through ponds, whereas basins with a steep topographic gradient become drier. | |
| Peat carbon stocks* (kg·C·m−2) | <10 | 11.8 ± 2.4 | 17.3 ± 7.8 | 34 ± 8.9 | 83.3 |
Share and Cite
Regmi, P.; Grosse, G.; Jones, M.C.; Jones, B.M.; Anthony, K.W. Characterizing Post-Drainage Succession in Thermokarst Lake Basins on the Seward Peninsula, Alaska with TerraSAR-X Backscatter and Landsat-based NDVI Data. Remote Sens. 2012, 4, 3741-3765. https://doi.org/10.3390/rs4123741
Regmi P, Grosse G, Jones MC, Jones BM, Anthony KW. Characterizing Post-Drainage Succession in Thermokarst Lake Basins on the Seward Peninsula, Alaska with TerraSAR-X Backscatter and Landsat-based NDVI Data. Remote Sensing. 2012; 4(12):3741-3765. https://doi.org/10.3390/rs4123741
Chicago/Turabian StyleRegmi, Prajna, Guido Grosse, Miriam C. Jones, Benjamin M. Jones, and Katey Walter Anthony. 2012. "Characterizing Post-Drainage Succession in Thermokarst Lake Basins on the Seward Peninsula, Alaska with TerraSAR-X Backscatter and Landsat-based NDVI Data" Remote Sensing 4, no. 12: 3741-3765. https://doi.org/10.3390/rs4123741
APA StyleRegmi, P., Grosse, G., Jones, M. C., Jones, B. M., & Anthony, K. W. (2012). Characterizing Post-Drainage Succession in Thermokarst Lake Basins on the Seward Peninsula, Alaska with TerraSAR-X Backscatter and Landsat-based NDVI Data. Remote Sensing, 4(12), 3741-3765. https://doi.org/10.3390/rs4123741