Object-Based Classification of Urban Areas Using VHR Imagery and Height Points Ancillary Data

1
Department of Geodesy and Geomatics Engineering, University of New Brunswick, 15 Dineen Dr., Fredericton, NB E3B 5A3, Canada
2
Department of Civil Engineering, University of New Brunswick, 15 Dineen Dr., Fredericton, NB E3B 5A3, Canada
*
Author to whom correspondence should be addressed.
Remote Sens. 2012, 4(8), 2256-2276; https://doi.org/10.3390/rs4082256
Submission received: 10 June 2012
/
Revised: 20 July 2012
/
Accepted: 26 July 2012
/
Published: 3 August 2012
Abstract
:Land cover classification of very high resolution (VHR) imagery over urban areas is an extremely challenging task. Impervious land covers such as buildings, roads, and parking lots are spectrally too similar to be separated using only the spectral information of VHR imagery. Additional information, therefore, is required for separating such land covers by the classifier. One source of additional information is the vector data, which are available in archives for many urban areas. Further, the object-based approach provides a more effective way to incorporate vector data into the classification process as the misregistration between different layers is less problematic in object-based compared to pixel-based image analysis. In this research, a hierarchical rule-based object-based classification framework was developed based on a small subset of QuickBird (QB) imagery coupled with a layer of height points called Spot Height (SH) to classify a complex urban environment. In the rule-set, different spectral, morphological, contextual, class-related, and thematic layer features were employed. To assess the general applicability of the rule-set, the same classification framework and a similar one using slightly different thresholds applied to larger subsets of QB and IKONOS (IK), respectively. Results show an overall accuracy of 92% and 86% and a Kappa coefficient of 0.88 and 0.80 for the QB and IK Test image, respectively. The average producers’ accuracies for impervious land cover types were also 82% and 74.5% for QB and IK.
1. Introduction
With the availability of VHR satellite imagery (spatial resolution ≤ 1 m) since 1999, urban land cover classification using this type of data has become an emerging field of research in the remote sensing community. Because of the sub-meter spatial resolution, VHR imagery has a very high potential in more detailed and accurate mapping of urban areas [1]. However, the high spectral variation within the same land cover type (within-class) and the low spectral variation between different land cover types (between-class) in urban areas make the classification very challenging if the classifier relies solely on spectral information of the image [2–4].
To differentiate impervious urban land covers such as buildings, roads, and parking and paved areas additional information should be incorporated into the classification process. Additional information could be the spatial measures extracted either from the image, in the forms of textural, morphological, and contextual measures, or from ancillary data [5]. Over the past decade, a significant amount of research has employed spatial measures extracted from the image (i.e., texture, context, and morphology) in the classification process of VHR imagery over urban areas [6–12].
The incorporation of ancillary data such as LiDAR data, digital elevation models extracted from stereo optical imagery, and vector data together with VHR imagery, which is often called multisource classification [13], has received increasing attention in the remote sensing community in recent years. A bibliographic review of multisource data fusion for urban remote sensing applications is presented in [14]. Examples of integrating LiDAR data and VHR imagery for urban land cover mapping are provided in [13] and [15,16]. In recent years some studies have benefited from vector data for land cover classification of VHR imagery over urban areas. An example is the work carried out by [17] in which some spatial modelling techniques of vector data (road centre lines and parcel layers) were developed to deal with the problem of confusion between spectrally similar classes. Another example is [18] who employed road maps and building footprints in segmenting high resolution aerial photographs for monitoring urban tree cover.
A problematic issue in multisource image analysis is the misregistration between layers from different sources (e.g., VHR image and vector data). A precise geometric registration of corresponding data layers is often very difficult to achieve, particularly in VHR imagery. Because of the sub-meter pixel size of VHR imagery, a pixel-by-pixel co-registration between vector data and VHR imagery is near to impossible. For this, pixel-based classification approaches do not yield promising results for multisource classification. Object-based approaches, on the other hand, facilitate the use of ancillary data [19] and since they require less precise registration of data, object-based approaches are highly desirable for multisource image analysis [20]. In object-based classification the basic element is a group of pixels (segments) instead of a single pixel. Consequently, it is not required that each pixel is exactly co-registered with the corresponding pixel in another layer. Indeed, if the objects of two different layers have reasonable overlap, a small shift between different data layers can be ignored during the classification process. In addition, the basic processing unit of object-based classification is an aggregated group of pixels forming a semantically meaningful object polygon which thus can effectively be integrated and analyzed with vector data [16].
Object-based image analysis also facilitates the incorporation of spectral and spatial information inherent in the VHR imagery into the classification process. By segmenting the image, several spectral, textural, and morphological (e.g., shape and size) features of objects can be incorporated into the classification process. These objects’ features help the classifier to distinguish spectrally similar land cover types (e.g., buildings and roads). In addition, object-based classification reduces high spatial frequency noise present in VHR images by exploiting the spectral and spatial dependency of neighboring pixels, in the form of objects, and thus increasing the classification accuracy.
The primary objective of this research was to develop an object-based classification framework using the integration of VHR imagery and vector data such as Spot Height (SH) layer to classify an urban environment comprised of large buildings, small houses, parking lots, roads/streets, and vegetation including grass and trees. The second objective was to assess the general applicability and transferability of the framework to different areas and different VHR imagery. Finally, the third objective was to evaluate the effect of possible misregistration between the vector data and VHR images of various geometric accuracies (e.g., IK and QB) on object-based classification.
To do this, a hierarchical rule-based object-based classification framework was developed using the Cognition Network Language available in the eCognition® software package. The rule-set was developed using a small subset of QB imagery by combining different spectral, morphological (geometry and extent), contextual, and class-related features of objects, resulting from the segmentation step, together with the information of a SH layer. To assess the transferability of the developed rule-set to different areas and images, the same and similar rule-set was applied to a different and larger area of the QB and IK image, respectively. QB and IK image have different misregistration with the SH layer. To evaluate the effect of misregistration on classification accuracy, misregistration of these images was deliberately left uncorrected.
This paper is structured as follows: Section 2 describes data used and the study area. The proposed methodology is presented in Section 3. Sections 4 and 5 present results and discussion, respectively. Finally, section 6 provides the conclusion of this study.
2. Datasets and Study Areas
2.1. Study Area
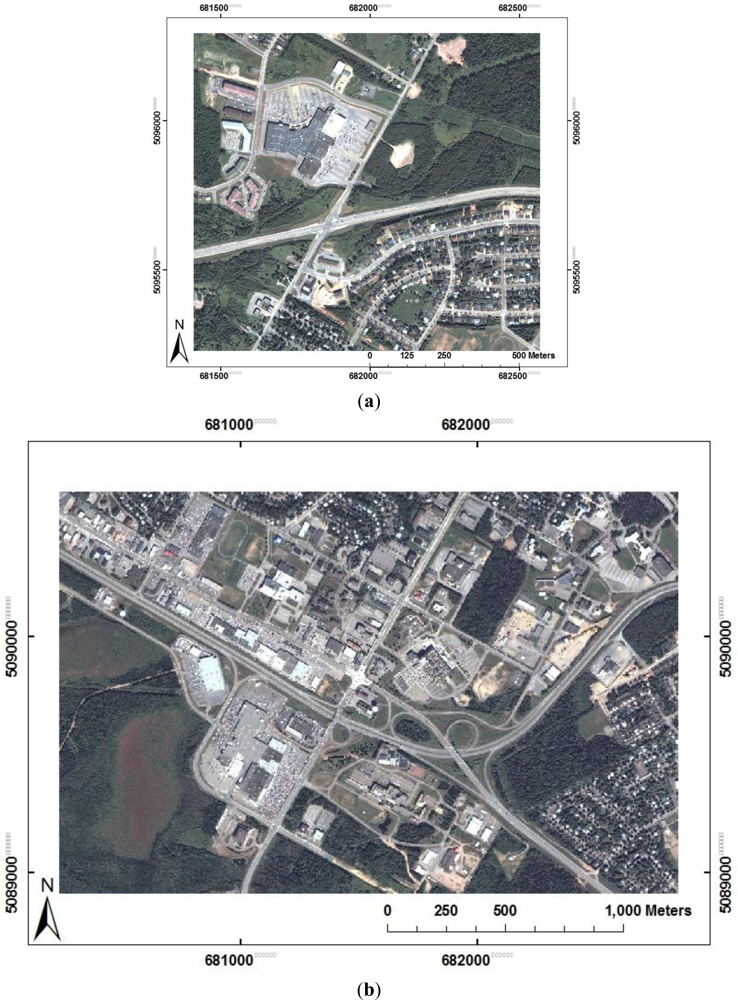
Two different parts of the city of Fredericton in New Brunswick, Canada were chosen as the study areas in this research. These include a small part of the city on the north side (Figure 1(a)) that was used for developing the rule-set and a larger part of the city on the south side that was used for testing the proposed method (Figure 1(b)). The city contains a variety of urban land cover types including vegetation areas (grass and trees), water, large buildings, small houses, parking and paved areas (with various sizes, shapes, and colors), narrow streets, and highways. Classification of such areas is challenging due to the complexity of land cover types. There are many buildings and small houses with a variety of roof colors such as white, gray and black. In residential areas, small houses and narrow streets are partially covered by trees foliage since the images were collected in mid and late summer, when the trees have reached their maximum growth. Trees are mainly deciduous with many different species. Shadows cast by tall buildings are another source of land cover complexity.
2.2. Datasets
Two sets of data covering the same area are used in this study. These are (a) subsets of QB and IK and (b) a vector layer of height points called Spot Height (SH).
2.2.1. The QB and IK Image
The IK and QB images were acquired on 19 June and 31 August 2002, respectively. Both QB and IK imagery possess a panchromatic band (Pan) and four multispectral (MS) bands including blue (B), green (G), red(R), and near infrared (NIR). The middle wavelengths of QB multispectral bands are 487.5, 543, 650, and 816.5 nm for B, G, R, NIR bands, respectively, while those of IK are 480.5, 550, 665, and 805 nm. The spatial resolution of pan band is 0.65 m (QB) and 0.82 m (IK) at nadir, while for MS bands, it is 2.62 m for QB and 3.28 m for IK [21,22]. As the preprocessing step (for both VHR imagery), the four multispectral bands were fused with the panchromatic band introduced by [23] resulting in four pan-sharpened bands with a spatial resolution of 0.7 m and 1 m for QB and IK. Figure 1(a) shows the portion of the QB image used for developing the rule-set (QB Pilot), and Figure 1(b) shows the QB Test image.
2.2.2. Spot Height Vector Data
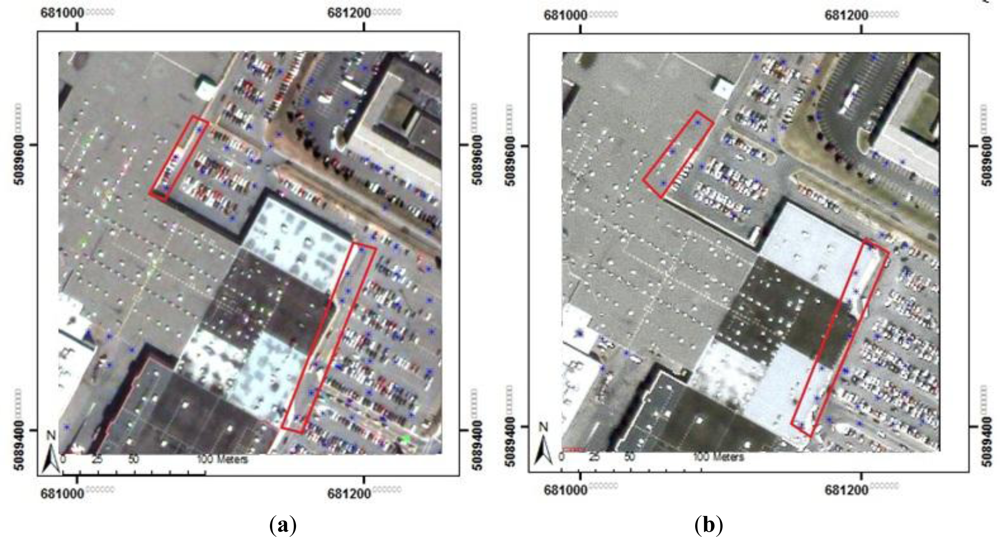
The SH data was a by-product of a digital elevation model (DEM) generation project conducted by the City of Fredericton in 2002. The spot heights were collected from 2002 stereo aerial photography in which the photo scale was approximately 1:10,000. The points were collected photogrammetrically as a series of irregularly spaced points with spacing of approximately 20 m in both dimensions and vertical accuracy of ±0.40 m at a confidence level of 90%. These points were extracted using stereo plotters in which a clear view of the ground was possible (e.g., no points in dense forest areas). In addition, the points mainly lie in non-built-up areas. The geometrical shift (misregistration) between the SH layer and QB and IK poses a challenge when they are integrated for the subsequent image analysis (e.g., classification). These data were collected in 2002 and, unfortunately, we could not find the statistical information about the misregistration between these data layers. However, visual inspection reveals a slight misregistration between the SH layer and QB (Figure 2(a)), and a significant misregistration between the SH layer and IK. A number of points were manually collected over both QB and IK image to determine the approximate shift between these two images. A misregistration shift of approximately 10 m between the QB and IK image was calculated. Although this amount of shift is relatively high and can be mitigated by a few ground control points, no effort was made to mitigate it as one of the primary objectives of this study is to assess the effect of misregistration on classification. It should be noted that only the locations of Spot Heights were used and no elevation information of SH layer was used in this study.
3. Methodology
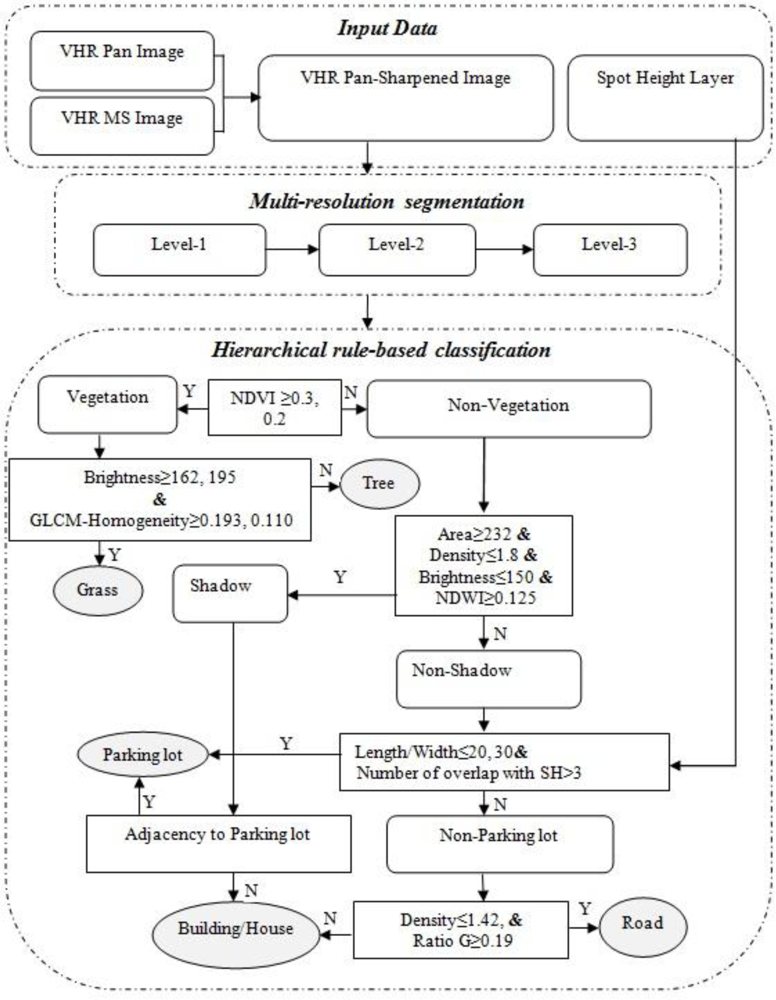
The proposed methodology is illustrated in Figure 3. The rule-based expert system starts by segmenting the Pan-sharpened image followed by a four-step hierarchical classification. First, the entire image is classified to vegetation and non-vegetation. Second, vegetation areas are further broken down to grass and trees. Non-vegetation areas are also classified to shadows and non-shadow in this step. Third, non-shadows are divided to parking lots and non-parking lots. Finally, non-parking lots are classified to buildings and roads. The remainder of this section describes the details of the flowchart in Figure 3.
3.1. Image Segmentation
The first step in object-based image analysis is segmentation. In general, image segmentation is defined as the process of partitioning an image into separated regions based on parameters specified [3]. These parameters often consider the homogeneity/heterogeneity of regions [24]. Depending on how homogeneity/heterogeneity is evaluated as well as how the pixels are aggregated (e.g., edge contour-based and region-based) there exists a large number of image segmentation techniques [25]. One of the widely used techniques is region-based, which includes both region growing and merging and splitting [26]. The region growing method starts from seed pixels, a bottom-up approach, and regions grow until a homogeneity/heterogeneity criterion is satisfied.
In this study, multiresolution segmentation, a region-based technique [27] available in eCognition, which combines both region growing and region merging techniques [28], was used. In multiresolution segmentation both spectral (color) and spatial (shape) homogeneity of objects are considered. In fact, adjacent regions are merged based on a weighted homogeneity criterion of object shape and color [29]. Three key parameters, namely scale, shape, and compactness need to be set in multiresolution segmentation [30]. Scale, which is considered the most crucial parameter, controls the average size of objects and the two other parameters control the homogeneity of objects [29]. Finding the optimal parameters for segmentation is a trial and error process, which is very time consuming and directly depends on the analyst’s experience [31]. Instead of trial and error, we used the Fuzzy-based Segmentation Parameter optimizer (FbSP optimizer) developed by [31,32] to get proper parameters in different levels of segmentation. FbSP optimizer is a supervised approach for automatic estimation of the three optimal segmentation parameters (scale, shape, and compactness) using the spectral and spatial information of training objects utilized in a fuzzy interface system. It is based on the idea of discrepancy evaluation to control the merging of sub segments to reach a target segment [32].
To use the FbSP optimizer, an initial segmentation is carried out by manually selecting the parameters (level 1). Normally the eCognition defaults are used for shape and compactness, and the scale parameter is set in such a way that the resulting objects are smaller than the real objects (small scale). After the first level of segmentation, a few sub-objects (e.g., sub-objects that form a building object) are selected as training objects (similar concept to selecting training pixels in traditional supervised classification). The information of training objects such as texture, brightness, area, and rectangular fit [31] are used to train the FbSP optimizer. After the training, the FbSP optimizer gives the optimal parameter for the second level of segmentation. Again, objects in the second level are used as training objects for calculating the parameters for the third level, and this process is iterated until the software gives objects which are close to the real objects. The full description of the FbSP optimizer can be found in [31].
3.2. Image Classification
The second step in object-based image analysis is classification. Initially, five land covers were defined: vegetation, shadows (excluding the shadow of trees), parking lots, roads (including wide and narrow roads, highways, and streets), and buildings (including large buildings and small houses). Vegetation was then broken down to trees and grass. Also, shadows were later assigned to either parking lots or buildings and thus the final classification map contains five land cover types including three impervious land covers, grass, and trees. A hierarchical rule-based classifier was developed to assign each object to a land cover class. The object-based approach allows the analyst to combine spectral, textural, morphological (geometry and extent), contextual, and class-related features of objects in order to assign a class membership degree (between 0 and 1) to each object based on a fuzzy membership function or strict thresholds [27,33]. As seen in Figure 3, the membership functions used in this study are based on the logical operator AND (&) and thresholds. Furthermore, it has a hierarchical capability to classify the entire scene into general classes (e.g., vegetation and non-vegetation areas). These general classes are called parent classes. Then, each parent class is divided to sub classes (child class) containing more detailed land cover types (e.g., buildings and roads). This hierarchical capability allows the developer to incorporate objects in different levels of segmentation for individual levels of class hierarchy.
Table 1 reports image object features employed in the hierarchical rule-set for classifying the Pilot image into the aforementioned five classes. These features were mostly selected by visual examination of different features available in eCognition. The criteria used for each class will be described in more detail in the following subsections.
3.2.1. Vegetation
The first step in the proposed hierarchical expert rule-based system is to extract vegetation. Active vegetation can be identified in the near infrared spectrum due to the rise reflectance value compared to the red spectrum. Reflectivity rises sharply at 0.75 μm, the so called red-edge region [34].The normalized difference vegetation index (NDVI) has been widely used in the literature to separate vegetation from non vegetation areas. It is calculated by:
where NIR and R are the mean values of all pixels (within the boundary of each object) in band near infrared and red for a given object in each level of segmentation. Based on our experience the threshold for classifying vegetation areas was set to 0.3 in the Pilot image. Since the spectral properties of the original image (e.g., NDVI) are better preserved in smaller objects than in larger ones, the lowest level of segmentation (L1) is preferred for extracting vegetation.
3.2.2. Grass and Trees
Having extracted the vegetation areas, they were further classified into grass and trees. These two classes are distinguishable from their textural characteristics. The grey level co-occurrence matrix (GLCM) introduced by [35] is the most commonly used texture measure for the urban land cover classification of VHR imagery. After visually examining different GLCM texture measures, we found that the Homogeneity measure can effectively separate grass and trees. Grass is more homogenous than trees and thus has higher Homogeneity values. This measure can be calculated for individual objects in each band. Since the spectral reflectance of vegetation is larger in NIR than in any other band, NIR was selected for the GLCM texture calculation. In addition, shadows of trees cast on grass have a texture close to that of trees. Hence, the Brightness values of objects were also employed in the rule-set to distinguish shaded grass from trees. The Brightness value is calculated as the average mean values of all bands over each object [28]:
GLCM texture measure is more meaningful for objects in level 2 than level 1 and thus second level of segmentation is preferred for grass and trees classification.
3.2.3. Shadows
Shadows are dark features in optical imagery, and because the segmentation of such imagery is mainly based on the spectral structure of the image [36], shadow influences the segmentation of surrounding areas. Furthermore, shadow is an important factor that reduces the spectral values of the shaded objects and thus influences the land cover classification [37]. For this, it should first be extracted and excluded from the subsequent classification. Later, the area under shadow will be assigned to parking lots or buildings based on its adjacency to these classes. As mentioned, we only considered the shadow of buildings and not those from trees, since trees’ shadows were included in the class of either trees or grass.
Regarding the spectral and spatial properties of shadow, two spectral (NDWI and Brightness) and two morphological features (Density and Area) of image objects were used in classifying the shadow areas.The normalized difference water index (NDWI) [38] is a metric used for masking out black bodies (water and shadow) in VHR imagery [39] and is defined as follows [38]:
where G is the mean value of all pixels (within the boundary of each object) in each level of segmentation for the band green. If only the spectral features of objects are utilized for extraction of shadow areas, some buildings, and especially small black roofed houses, are also misclassified as shadow. Thus, shadows extracted by spectral measures, must be refined to exclude spectrally similar non-shadow areas. This is feasible by employing the morphological features in the classification decision. As mentioned, Density and Area of objects were used as the morphological features to refine the shadow areas. In eCognition, the Density feature describes the distribution, in space, of the pixels of an object and is calculated by the Area of the object divided by the approximated average of the major and minor axes of the ellipse fitted to the object [28]. Area is the number of pixels forming an image object. The size of shadows in optical imagery depends primarily on the height of objects but also on the sun elevation angle [40].In our study area (a typical North American small city), majority of buildings are two to three stories high. Therefore, shadows are normally small features compared to surrounding features such as buildings and parking lots, and thus objects in the first level of segmentation better represent shadow areas.
3.2.4. Parking Lots
Having extracted vegetation and shadows, they are excluded from the subsequent processes in the rule-set hierarchy. Objects in the first level of segmentation do not represent the boundaries of impervious land cover types. Because of the relatively large size of parking lots, objects in the third level were chosen for the subsequent classification process. Parking lots and roads are spectrally similar because the same materials (e.g., asphalt, gravel, etc.) are used in their construction. Parking lots and buildings are also similar in terms of their morphological features such as shape and extent. Therefore, extracting the parking lots solely based on the information of the image does not yield promising results. The SH layer which contains points in areas other than those with roads and buildings was utilized to help the classifier in distinguishing parking lots from roads and buildings. For classifying parking lots, the SH layer was intersected with the objects in level 3. A threshold of three points within each object was set (by visual inspection) to extract objects containing three or more height points and to classify them as parking lots. Furthermore, due to the misregistration between the VHR imagery and SH layer, roads which are neighboring parking lots may be misclassified as parking lots. Therefore, another criterion was defined based on the Extent feature of objects to reduce the possible misclassification of roads as parking lots. The ratio between the length and width of the main line of each object’s skeleton [28],which has a high value for roads and a low value for parking lots, was considered as an Extent feature for parking lot classification as seen in the flowchart of the method in Figure 3.
3.2.5. Roads and Buildings
The last step in the hierarchical rule-based classifier is to classify roads and buildings. Separation of these two impervious land covers is feasible with the employment of proper object features and level of segmentation. Visual inspection of different segmentation levels confirms that roads and buildings are well represented in the third level of segmentation (L3). Moreover, the linear structure of roads, compared to the compact structure of buildings, helps the classifier to distinguish between these two classes. After visually examining several spectral features of objects including the Brightness and Ratios of all four bands, we found that Ratio G, a spectral feature, together with Density, a shape feature, can effectively distinguish between roads and buildings. Ratio G describes the amount that band G contributes to the total brightness for an object and is calculated as follows [28]:
Having classified roads, the remaining unclassified areas are assigned to the class of buildings. The diversity in shape and color of buildings is relatively higher than of any other class in the scene. For this, we left buildings as the last class to be extracted in the hierarchical classification system.
3.2.6. Classifying Shadows
After extracting shadow areas, they should be assigned to the corresponding land cover class. Visual inspection of the image reveals that shadows cast by tall buildings belong to either parking lots or buildings. A few buildings have multi level roofs and the shadow of the top roof covers part of the lower roofs. The rest of the shadows cover part of the parking lots surrounding the buildings. Shadow areas can possibly cover the road, but since the majority of shadows in the image are cast by large and tall buildings, which are normally encompassed by parking lots, most of the shadow areas belong to parking lots. Therefore, in the rule-set shadows were assigned to either buildings or parking lots. The assignment of shadows was carried out through the employment of class-related features. The class-related feature used in this study is the existence of neighbor objects. In other words, if the shadow is adjacent to parking lot object(s), it is assigned to parking lots; otherwise it is assigned to the class of buildings. It should be noted that this rule is hardly transferable to areas with different urban structure. For instance, shadows may belong to road as well. However, in our study area, shadow does not cover a large area and missing some shadow does not have a significant effect on the classification accuracy of the entire image. Moreover, further development of rules for shadow will lead to a more complex rule-set and thus affect the transferability of the entire rule-set to other areas.
4. Results
4.1. Segmentation Results
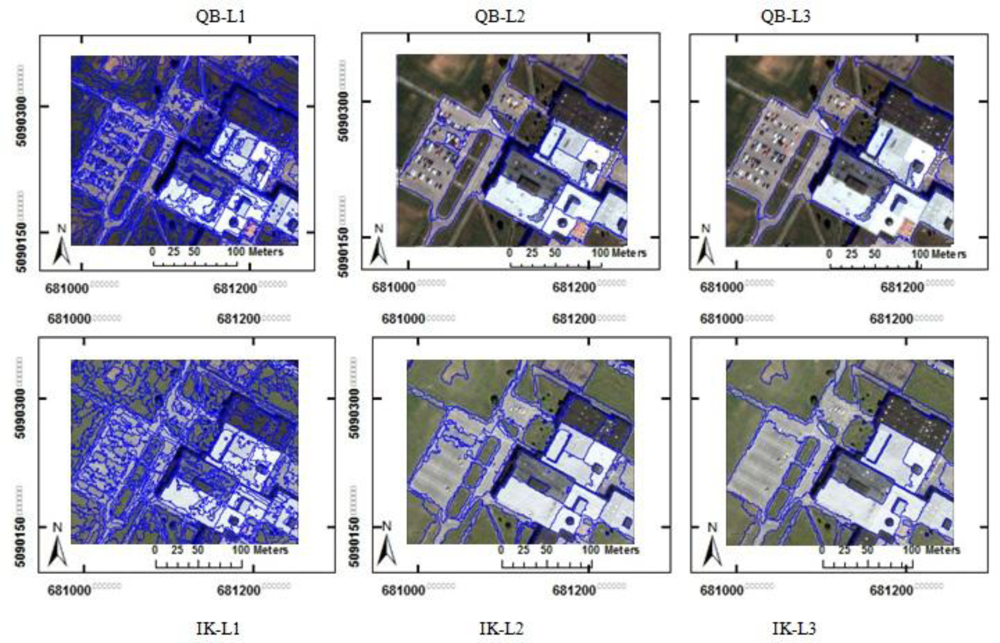
The segmentation results of the three images, using the FbSP optimizer, are reported in Table 2. The visual results of a portion of the QB and IK Test image are also depicted in Figure 4. The three segmentation parameters (i.e., scale, shape, and compactness) are different for QB and IK image. This is mainly because of the slight difference between the spatial resolution, the wavelength coverage of each multispectral band, and the acquisition date of QB and IK image (see Section 2.2).
Objects in the first level of segmentation are not meaningful for any of the land covers. However, since the original spectral properties of the image are better preserved in lower levels than in higher levels of segmentation, the lower levels (i.e., L1) preferred for classifying land covers in which the spectral features are employed (e.g., shadow and vegetation).
For the classification of impervious land covers, larger objects (level 3) proved to be more effective than smaller objects. This is because of two main reasons: First, morphological features such as size and shape play a more important role than spectral features for the classification of such land covers. Furthermore, shape and size of impervious land covers are better modeled in higher levels of segmentation where objects are more meaningful. Second, the error of misregistration between different data layers (e.g., vector data and the VHR image) is less effective for larger objects than for smaller objects. In fact, if the object of interest has a reasonable overlap in the two layers, which is more likely for larger objects, the misregistration could be ignored.
4.2. Classification Results
In order to evaluate the quality of land cover classification, accuracy assessment is often required. The conventional pixel-based error matrix [41,42] was used for accuracy assessment of the results. Different elements of the error matrix including overall accuracy, kappa coefficient, user’s and producer’s accuracy were calculated for both QB and IK Test images. For each dataset, the Z-test was also performed to test the significance of the error matrix. The Z-test checks whether the classification is meaningful and significantly better than a random classification [42]. For each Test image, the result of object-based land cover classification was exported in raster and was compared with reference data. The reference dataset was generated through a precise manual digitizing of many samples (60% of the entire image) of five land cover types on both the QB Pilot, and the QB and IK Test image.
4.2.1. Classification of the Pilot Image
As mentioned earlier, the QB Pilot image was used to develop the hierarchical expert rule-based classification system. Figure 5 shows the classification results of the Pilot image. The confusion matrix and its measures including overall accuracy, producers’ accuracy, users’ accuracy, and the kappa coefficient are reported in Table 3. For the purpose of transferability and the general applicability of the rule-set to other areas and images, few spectral and spatial features of the objects were utilized in the classification of the Pilot image. The fewer number of objects’ features leads to a less complex rule-set, and consequently it better guarantees the transferability of the same rule-set to other images. Notwithstanding the low complexity of the developed rule-set, the classification result of the Pilot image is very promising. An overall accuracy of 95% and a Kappa coefficient of 0.92 were achieved for this image (Table 3). Trees, grass, and roads were classified with producer accuracies of more than 92%. Although there are a few misclassifications between buildings and parking lots, the majority of these two classes were correctly classified. The accuracies for buildings and parking lots were 84% and 89%, respectively.
4.2.2. Classification of the Test Images
The rule-set that was used for the segmentation and classification of the QB Test image was identical to the one used for the Pilot image. The same workflow and object features were also used for the IK Test image. However, due to the difference between QB and IK image in terms of spatial resolution, wavelength range of multispectral bands, the date of acquisition, and also the segmentation results, different thresholds for object’s features were used in classifying the IK Test image. A small portion of IK image was used to determine the segmentation parameter using FbSP parameter optimizer and then the same parameters applied to the entire image. The same portion of the IK image was also used to visually determine the threshold values of classification. The confusion matrices and their measures are reported in Tables 4 and 5. The results are also displayed in Figure 6.
At the 99.9 % confidence level, the critical value for Z statistic would be 3.3. Therefore, if the Z value of the classification results is greater than 3.3, the results are significant and better than random. The Z values for QB and IK are far greater than the critical value (5434 for QB and 2731 for IK) showing that the classification is significantly better than a random classification. The kappa coefficient of 0.88 and 0.80 for the QB and IK Test image represent a strong agreement between reference data and classification results. The overall classification accuracy of QB is 91.6%, confirming the high potential of transferability of the developed rule-set to different areas of the same image. For IK, however, a lower overall accuracy of 85.6% was achieved. The comparison of error matrices between IK and QB shows that the big difference is between the accuracies of the impervious land covers, especially parking lots. This is mainly because of the large misregistration between the SH layer and the IK image (Figure 2), since this layer is the key feature in classifying the impervious land covers. Nevertheless, this level of accuracy for IK shows the efficiency of the proposed method in classifying urban areas of different VHR imagery.
The highest producer’s accuracy for both images was achieved for the class of trees and grass with 98.8% and 93.9%for QB and 95.3% and 91.2% for IK. These indicate the very high potential of object-based classification of VHR imagery for extracting vegetation areas using the well known index of NDVI and segmentation in lower levels (L1 and L2). The selection of the threshold values for NDVI is critical in classifying vegetation areas. In this study, the thresholds of 0.30 and 0.20 were selected for QB and IK, respectively.
The average producer’s accuracy for impervious land covers for QB is 82%, while for IK it is 74.5%. Among the three impervious land covers, roads achieved the highest producer’s accuracy in both images (90% for QB and 87% for IK). Roads are elongated features and they are distinguishable from buildings and parking lots using the morphological features of objects. Additionally the within-class spectral heterogeneity of the class of road is far less than those of buildings and parking lots. The comparison of the original image (Figure 1(b)) with the classification results (Figure 6) reveals that all major roads and the majority of minor roads, with a few mis-classifications of road intersections, were properly classified in both images.
Parking lots are typically spectrally similar to roads and morphologically similar to building roofs. Therefore, the separation of parking lots from the two other classes is quite problematic. In this study, however, the key feature for extracting parking lots was the SH layer. Although there is a slight misregistration between QB and the SH layer (Figure 2(a)), utilizing the objects instead of the individual pixels in the classification process effectively mitigates this negative effect of multisource classification. The producer’s accuracy of parking lots is 77% in QB. For IK Test image, however, the larger misregistration between the image and the SH layer, together with the smaller objects in level 3, leads to a lower producer’s accuracy of 64% for parking lots. The FbSP optimizer resulted in a larger number of objects in level 3 for IK than for QB (Table 2). This means that objects in level 3 are smaller in IK compared to QB. Consequently, the possibility of overlapping three spot heights with an object (the key criteria that is used for extracting parking lots) is greater for the QB than for the IK Test image. As a result, more parking lots are missed during classification in IK than in QB Test image leading to lower producer’s accuracy.
The last step in rule-set hierarchy is the classification of buildings. Almost all large buildings and most of the small houses in the lower left and upper part of the images were classified correctly in QB but not in the IK. The producer’s accuracy for buildings in IK is 72.6%, while for QB it is 79.4%. This difference can also be interpreted based on the larger misregistration and smaller objects in IK compared to QB.
5. Discussion
As mentioned, the segmentation parameters and classification rule-set of the QB Pilot image is identical to those used for QB Test image. A small discrepancy of 3% and 0.04 of overall accuracy and kappa coefficient, respectively, between the QB Pilot and Test images demonstrates the great potential of the transferability of the rule-set to other areas of the same VHR imagery. This suggests that for a large dataset, the rule-set needs to be developed using a small portion of the image and then can be applied directly to the entire dataset.
For IK Test image, however, segmentation is conducted independently of QB Pilot image. Indeed, FbSP optimizer needs to be trained for each VHR image separately. Nonetheless, the segmentation parameters of a portion of the VHR image are identical to those of the entire VHR image. For classification, the rule-set developed using the QB Pilot image is very similar to the one used for IK Test image. In other words, all the rules and features are the same but some thresholds (see Figure 3) are slightly different. The discrepancy of overall accuracy and kappa coefficient between QB Pilot image and IK Test image is about 9% and 0.12, respectively. These two images are different in terms of spatial resolution, date of acquisition, the wavelength range of each band, and more importantly the misregistration with SH layer. These factors all contribute in the existence of discrepancies between the classification results of the two images. Especially, the misregistration between SH layer and IK image is significantly larger (about 10 m) than that between SH layer and QB image (see Figure 2). Checking the confusion metrics of QB Pilot and IK test images shows that the largest discrepancy is between the producers’ accuracies for parking lots in two matrices (about 25%). In addition, SH layer plays a critical role in classifying parking lots and thus larger misregistration between SH layer and the VHR image leads to worse classification result for parking lots than for any other classes.
Regardless of the misregistration effect, morphological features (e.g., density, area, etc.) prove to be more effective for standardization (transferability) of the rule-set. Most of the morphological features in the developed rule-set use the same threshold in QB and IK images. Therefore, for the general applicability of the rule-set to other images, more attention should be directed to the use of morphological features rather than spectral and/or textural features, especially for classifying impervious land cover types. However, spectral and textural features play an important role in classifying vegetation areas.
This study demonstrates the usefulness of ancillary data in conjunction with object-based image analysis for urban land cover classification of VHR imagery. The ancillary data that was used is a Spot Height data layer, which was employed for separating parking lots from buildings and roads. This layer, however, may not be available for many urban areas. Alternatively, the SH layer can be created from a relatively inaccurate digital elevation/surface model (DEM/DSM)(e.g., from stereo satellite imagery) of an urban area since the proposed method only uses the locations of Spot Height points in the rule-set but not the elevation of points. Therefore, an accurate DEM/DSM of the area which is often acquired by LiDAR data, and thus is expensive, is not required. Moreover, most VHR satellites offer stereo imagery from which DEM/DSM information can be extracted. This is a topic for future research.
6. Conclusion
This research presented a novel multisource object-based image analysis framework based on VHR imagery and Spot Height vector data for detailed classification of complex urban environments to five major land cover types consisting of buildings, roads, parking lots, grass, and trees. The framework was developed using the Cognition Network Language available in eCognition software package. The framework consists of multiresolution segmentation followed by hierarchical rule-based classification.
The method offers a practical, fast, and easy to use (within eCognition) framework for classifying VHR imagery of small urban areas. Despite the spectral and spatial complexity of land cover types, the method resulted in the overall accuracy of up to 92%. This level of accuracy is very promising and shows the great potential of combining vector data, VHR imagery, and object-based image analysis for classification of small urban areas.
Current literature often ignores two important issues of multisource object-based classification: the transferability of the rule-set to different areas and different VHR images (e.g., transferring a rule-set developed using a QuickBird image to an IKONOS image) and the possible misregistration between different data layers (e.g., between VHR images and vector data). This research mainly investigated the aforementioned issues.
To assess the transferability of the rule-set, the classification rule-set was developed using a small portion of a QuickBird image (Pilot image) and then the same and similar (i.e., all rules and features remain unchanged with slight changes in some thresholds) rule-sets were applied to larger areas of QuickBird and IKONOS imagery, respectively. The small discrepancy of 3% between the classification overall accuracies of QuickBird Pilot and QuickBird Test images and the relative small discrepancy of 9% between the classification overall accuracies of QuickBird Pilot and IKONOS Test images demonstrates the general applicability of the method to different areas and different VHR images. The method also mitigates the effect of misregistration between different datasets (which is inevitable in multisource classification) on classification by incorporating objects of higher levels of segmentation into classification.
The proposed framework, though it is not applicable to all urban areas, provides guidelines on the types of features (e.g., texture, shape, size, brightness) and ranges of thresholds which are suitable for classifying specific land cover types. However, ancillary data used in this study (Spot Height) may not be available for many urban areas. Utilizing more available ancillary data such as digital elevation models/digital surface models extracted from stereo VHR imagery, is especially desirable and will be the focus of our future research.
Acknowledgments
The authors would like to thank the City of Fredericton for providing the data used in this work. This research is supported by the NSERC (Natural Science and Engineering Research Council of Canada) Strategic Project Grants and NSERC Discovery Grants Programs.
References
- Pacifici, F.; Chini, M.; Emery, W.J. A neural network approach using multi-scale textural metrics from very high-resolution panchromatic imagery for urban land-use classification. Remote Sens. Environ 2009, 113, 1276–1292. [Google Scholar]
- Mohapatra, R.P.; Wu, C. High resolution impervious surface estimation: An integration of IKONOS and Landsat-7 ETM+ imagery. Photogramm. Eng. Remote Sensing 2010, 76, 1329–1341. [Google Scholar]
- Myint, S.W.; Gober, P.; Brazel, A.; Clark, S.G.; Weng, Q. Per-pixel vs. object-based classification of urban land cover extraction using high spatial resolution imagery. Remote Sens. Environ 2011, 115, 1145–1161. [Google Scholar]
- Blaschke, T.; Hay, G.J.; Weng, Q.; Resch, B. Collective sensing: Integrating geospatial technologies to understand urban systems—An overview. Remote Sens 2011, 3, 1743–1776. [Google Scholar]
- Salehi, B.; Zhang, Y.; Zhong, M.; Dey, V. A review of the effectiveness of spatial information used in urban land cover classification of VHR imagery. Int. J. GeoInf 2012, 8, 35–51. [Google Scholar]
- Shackelford, A.K.; Davis, C.H. A hierarchical fuzzy classification approach for high-resolution multispectral data over urban areas. IEEE Trans. Geosci. Remote Sens 2003, 41, 1920–1932. [Google Scholar]
- Binaghi, E.; Gallo, I.; Pepe, M. A cognitive pyramid for contextual classification of remote sensing images. IEEE Trans. Geosci. Remote Sens 2003, 41, 2906–2922. [Google Scholar]
- Puissant, A.; Hirsch, J.; Weber, C. The utility of texture analysis to improve per-pixel classification for high to very high spatial resolution imagery. Int. J. Remote Sens 2005, 26, 733–745. [Google Scholar]
- Carleer, A.P.; Wolff, E. Urban land cover multi-level region-based classification of VHR data by selecting relevant features. Int. J. Remote Sens 2006, 27, 1035–1051. [Google Scholar]
- Xu, H.; Li., P. Urban land cover classification from very high resolution imagery using spectral and invariant moment shape information. Can. J. Remote Sens 2010, 36, 248–260. [Google Scholar]
- Salehi, B.; Zhang, Y.; Zhong, M. Combination of Object-Based and Pixel-Based Image Analysis for the Classification of VHR Imagery over Urban Areas. Proceedings of ASPRS 2011 Annual Conference, Milwaukee, WI, USA, 1–5 May 2011.
- Salehi, B.; Zhang, Y.; Zhong, M. Object-Based Land Cover Classification of Urban Areas Using VHR Imagery and Photogrammetrically-Derived DSM. Proceedings of ASPRS 2011 Annual Conference, Milwaukee, WI, USA, 1–5 May 2011.
- Watanachaturaporn, P.; Arora, M.K.; Varshney, P.K. Multisource classification using support vector machines: An empirical comparison with decision tree and neural network classifiers. Photogramm. Eng. Remote Sensing 2008, 74, 239–246. [Google Scholar]
- Gamba, P.; Dell’Acqua, F.; Dasarathy, B. Urban remote sensing using multiple datasets: Past, present, and future. Information Fusion 2005, 6, 319–326. [Google Scholar]
- Matikainen, L.; Karila, K. Segment-based land cover mapping of a suburban area—Comparison of high-resolution remotely sensed datasets using classification trees and test field points. Remote Sens 2011, 3, 1777–1804. [Google Scholar]
- Zhang, J. Multi-source remote sensing data fusion: status and trends. Int. J. Image Data Fusion 2010, 1, 5–24. [Google Scholar]
- Thomas, N.; Hendrix, C.; Congalton, R.G. A comparison of urban mapping methods using high-resolution digital imagery. Photogramm. Eng. Remote Sensing 2003, 69, 963–972. [Google Scholar]
- Moskal, M.; Styers, D.M.; Halabisky, M. Monitoring urban tree cover using object-based image analysis and public domain remotely sensed data. Remote Sens 2011, 3, 2243–2262. [Google Scholar]
- Kim, M.; Madden, M.; Xu, B. GEOBIA vegetation mapping in general smoky mountains national park with spectral and non-spectral ancillary information. Photogramm. Eng. Remote Sensing 2010, 76, 137–148. [Google Scholar]
- Zhou, W.; Huang, G.; Troy, A.; Cadenasso, M.L. Object-based land cover classification of shaded areas in high spatial resolution imagery of urban areas: A comparison study. Remote Sens. Environ 2009, 113, 1769–1777. [Google Scholar]
- DigitalGlobe. DigitalGlobe Core Imagery Products Guide. 2009. Available online: http://www.digitalglobe.com/index.php/6/DigitalGlobe+Products (accessed on 7 May 2012).
- GeoEye. GeoEye Product Guide v1.0.1. 2009. Available online: http://www.geoeye.com/CorpSite/assets/docs/brochures/GeoEye_Product_Guide.pdf (accessed on 7 May 2012).
- Zhang, Y. Standard and colour enhanced pansharpening of Quickbird imagery—Sydney, Australia. Photogramm. Eng. Remote Sensing 2004, 70. The Front Cover. [Google Scholar]
- Pal, N.R.; Pal, S.K. A review on image segmentation techniques. Pattern Recog 1993, 26, 1277–1294. [Google Scholar]
- Gonzalez, R.C.; Woods, R.E. Digital Image Processing, 2nd ed; Prentice Hall: Upper Saddle River, NJ, USA, 2002. [Google Scholar]
- Blaschke, T.; Burnett, C.; Pekkarinen, A. Image Segmentation Methods for Object Based Analysis and Classification. In Remote Sensing Image Analysis: Including the Spatial Domain; de Jong, S.M., van der Meer, F.D., Eds.; Springer-Verlag: Dordrecht, The Netherlands, 2006; pp. 211–236. [Google Scholar]
- Benz, U.C.; Hofmann, P.; Willhauck, G.; Lingenfelder, I.; Heynen, M. Multi-resolution, object-oriented fuzzy analysis of remote sensing data for GIS-ready information. ISPRS J. Photogramm 2004, 58, 239–258. [Google Scholar]
- eCognition, eCognition Developer (8.64.0) Reference Book; Trimble Germany GmbH: Munich, Germany, 2010.
- Baatz, M.; Schape, A. Multiresolution Segmentation: An Optimization Approach for High Quality Multi-Scale Image Segmentation. In Angewandte Geographische Informations-Verarbeitung XII; Strobl, J., Blaschke, T., Griesbner, G., Eds.; Wichmann Verlag: Karlsruhe, Germany, 2000; pp. 12–23. [Google Scholar]
- eCognition, eCognition Developer (8.64.0) User Guide; Trimble Germany GmbH: Munich, Germany, 2010.
- Zhang, Y.; Maxwell, T.; Tong, H.; Dey, V. Developement of Supervised Software Tool for Automated Determination of Optimal Segmentation Parameters for Ecognition. Proceedings of ISPRS TC VII symposium-100 Years ISPRS, Vienna, Austria, 5–7 July 2010.
- Tong, H.; Maxwell, T.; Zhang, Y.; Vivek, D. A supervised and fuzzy-based approach to determine optimal multi-resolution image segmentation parameters. Photogramm. Eng. Remote Sensing 2012. accepted. [Google Scholar]
- Walker, J.S.; Blaschke, T. Object-based land cover classification for the Phoenix metropolitan area: optimization vs. transportability. Int. J. Remote Sens 2008, 29, 2021–2040. [Google Scholar]
- Mather, P.M. Computer Processing of Remotely-Sensed Images: An Introduction, 2nd ed; John Wiley and Sons: Chichester, UK, 1999. [Google Scholar]
- Haralick, R.M. Statistical and structural approaches to texture. Proc. IEEE 1979, 67, 786–804. [Google Scholar]
- Smith, G.M.; Morton, R.W. Real world objects in GEOBIA through the exploitation of existing digital cartography and image segmentation. Photogramm. Eng. Remote Sensing 2010, 76, 163–170. [Google Scholar]
- Lu, D.; Hetrick, S.; Moran, E. Land cover classification in a complex urban-rural landscape with Quickbird imagery. Photogramm. Eng. Remote Sensing 2010, 76, 1159–1168. [Google Scholar]
- Mcfeeters, S.K. The use of the Normalized Difference Water Index (NDWI) in the delineation of open water features. Int. J. Remote Sens 1996, 17, 1425–1432. [Google Scholar]
- Chen, Y.; Su, W.; Li, J.; Sun, Z. Hierarchical object-oriented classification using very high resolution imagery and LIDAR data over urban areas. Adv. Space Res 2009, 43, 1101–1110. [Google Scholar]
- Dare, P.M. Shadow analysis in high-resolution satellite imagery of urban areas. Photogramm. Eng. Remote Sensing 2005, 71, 169–177. [Google Scholar]
- Foody, G.M. Status of land-cover classification accuracy assessment. Remote Sens. Environ 2002, 80, 185–201. [Google Scholar]
- Congalton, R.G.; Green, K. Assessing the Accuracy of Remotely Sensed Data: Principles and Practices, Boca Raton, FL, USA; CRC Press, Taylor & Francis Group, 2009.
Figure 1.
(a) Pan-sharpened QuickBird (QB) Pilot image used for developing the rule-set. (b) QB Test image in true color composite.
Figure 1.
(a) Pan-sharpened QuickBird (QB) Pilot image used for developing the rule-set. (b) QB Test image in true color composite.

Figure 2.
Misregistration between the Spot Height (SH) layer and the QB (a) and IKONOS (IK) (b) image. Asterisks represent the Spot Heights. Spot Heights were collected over non built-up areas; however, due to misregistration, some points lie on building roofs as shown in this Figure. As seen, misregistration is larger in IK than in QB.

Figure 3.
Flowchart of the developed rule-based expert system. Final classification results are shown in oval shape. The first and second thresholds for some features represent the threshold for QB and IK, respectively. When the threshold is identical for both images only one value is provided.
Figure 3.
Flowchart of the developed rule-based expert system. Final classification results are shown in oval shape. The first and second thresholds for some features represent the threshold for QB and IK, respectively. When the threshold is identical for both images only one value is provided.

Figure 4.
Multi-resolution segmentation results of level 1 (L1), level 2 (L2), and level 3(L3) for a sample area of QB (top) and IK (bottom) Test images.
Figure 4.
Multi-resolution segmentation results of level 1 (L1), level 2 (L2), and level 3(L3) for a sample area of QB (top) and IK (bottom) Test images.

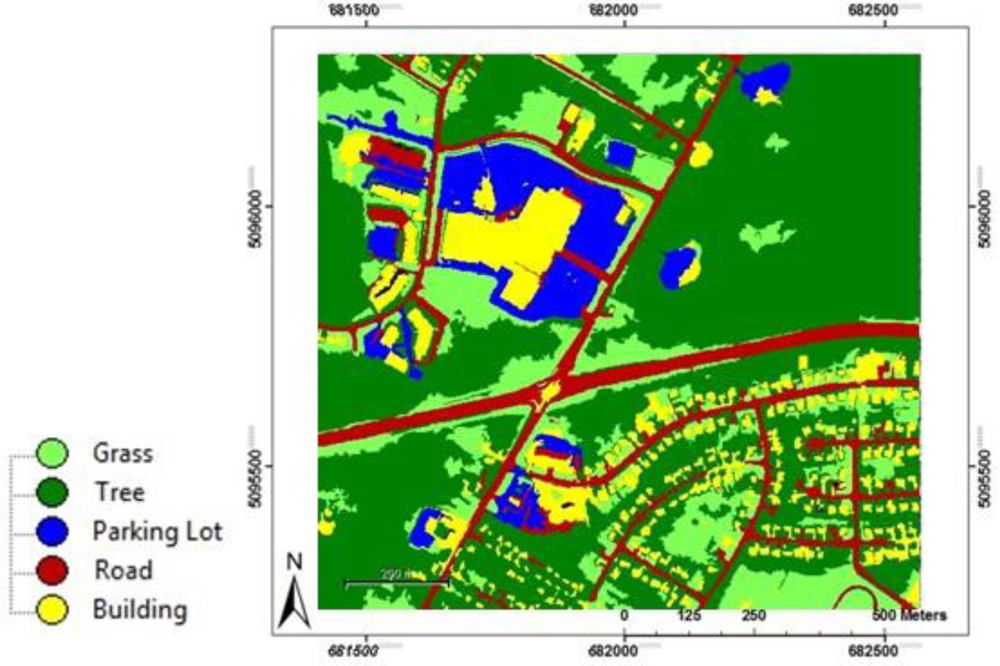
Figure 5.
Hierarchical object-based classification results of the QB Pilot image.

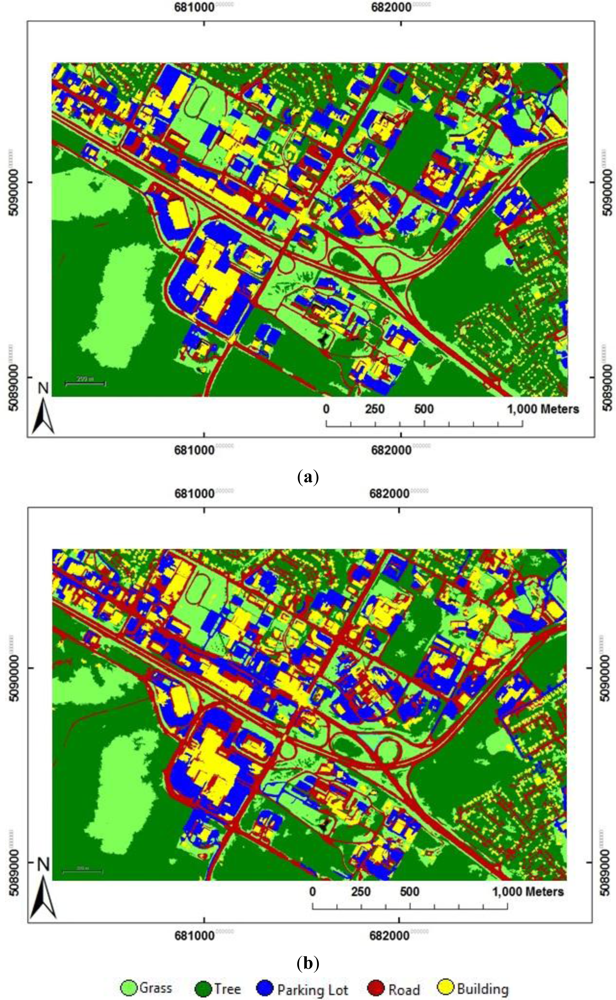
Figure 6.
Hierarchical object-based classification results of (a) QB and (b) IK Test images.


| Class | Segmentation Level | Feature |
|---|---|---|
| Vegetation | L1 | NDVI |
| Shadow | L1 | Brightness, Area, Density, NDWI |
| Grass and Trees | L2 | Brightness, GLCM-Homogeneity |
| Parking lot | L3 | Number of SH points laid within the boundary of objects, Length/width of main axis, Existence to shadow |
| Road/Street | L3 | Density and Ratio G |
| Building/House | L3 | Unclassified Objects, Existence to shadow |
| Level | Scale | Shape | Compactness | No of Objects | |
|---|---|---|---|---|---|
| QB-Pilot Image | 1 | 30.00 | 0.10 | 0.50 | 18,204 |
| 2 | 77.83 | 0.64 | 0.81 | 2,190 | |
| 3 | 131.33 | 0.50 | 0.81 | 1,890 | |
| QB-Test Image | 1 | 30.00 | 0.10 | 0.50 | 64,481 |
| 2 | 77.83 | 0.64 | 0.81 | 7,634 | |
| 3 | 131.33 | 0.50 | 0.81 | 6,103 | |
| IK-Test Image | 1 | 40.0 | 0.10 | 0.50 | 69,102 |
| 2 | 82.0 | 0.57 | 0.80 | 10,810 | |
| 3 | 142.0 | 0.59 | 0.80 | 7,375 | |
| Class Name | Reference Data (No. of Pixels) | ||||||
|---|---|---|---|---|---|---|---|
| Tree | Grass | Building | Road | Parking Lot | User’s Acc.(%) | ||
| Classification Results | Tree | 778,395 | 10,887 | 12,427 | 6,600 | 1,313 | 92.9 |
| Grass | 9,587 | 18,9105 | 1,634 | 1,837 | 1,327 | 96.1 | |
| Building | 184 | 1,065 | 141,261 | 1,530 | 11,366 | 90.9 | |
| Road | 225 | 2,107 | 8,254 | 152,881 | 3,362 | 91.6 | |
| Parking lot | 102 | 567 | 4,274 | 2,534 | 140,175 | 94.9 | |
| Prod’s Acc. (%) | 98.7 | 92.8 | 84.2 | 92.4 | 89.0 | ||
Overall Accuracy: 94.53% Kappa Coefficient : 0.92 Z Statistic: 3251
| Class Name | Reference Data (No. of Pixels) | ||||||
|---|---|---|---|---|---|---|---|
| Tree | Grass | Building | Road | Parking Lot | User’s Acc. (%) | ||
| Classification Results | Tree | 2,087,435 | 56,242 | 16,343 | 14,856 | 2,441 | 95.87 |
| Grass | 20,517 | 1,177,125 | 3,552 | 14,956 | 1,310 | 96.69 | |
| Building | 1,991 | 2,355 | 497,277 | 15,799 | 70,516 | 84.58 | |
| Road | 3,407 | 15,531 | 83,770 | 499,652 | 78,238 | 73.41 | |
| Parking lot | 251 | 2,775 | 25,530 | 7,815 | 503,632 | 93.26 | |
| Prod’s Acc. (%) | 98.76 | 93.87 | 79.38 | 90.34 | 76.76 | ||
Overall Accuracy: 91.58% Kappa Coefficient : 0.88 Z Statistic: 5434
| Class Name | Reference Data (No. of Pixels) | ||||||
|---|---|---|---|---|---|---|---|
| Tree | Grass | Building | Road | Parking lot | User’s Acc.(%) | ||
| Classification Results | Tree | 930,657 | 30,395 | 3,599 | 7,919 | 1,705 | 95.5 |
| Grass | 35,590 | 400,240 | 8,587 | 3,275 | 1,967 | 89.0 | |
| Building | 3,374 | 697 | 243,902 | 6,966 | 51,631 | 79.6 | |
| Road | 6,701 | 6,984 | 51,041 | 246,458 | 76,816 | 63.5 | |
| Parking lot | 262 | 644 | 28,974 | 19,587 | 235,271 | 82.6 | |
| Prod’s Acc.(%) | 95.3 | 91.2 | 72.6 | 86.7 | 64.1 | ||
Overall Accuracy: 85.6% Kappa Coefficient : 0.80 Z Statistic: 2731
Share and Cite
MDPI and ACS Style
Salehi, B.; Zhang, Y.; Zhong, M.; Dey, V. Object-Based Classification of Urban Areas Using VHR Imagery and Height Points Ancillary Data. Remote Sens. 2012, 4, 2256-2276. https://doi.org/10.3390/rs4082256
AMA Style
Salehi B, Zhang Y, Zhong M, Dey V. Object-Based Classification of Urban Areas Using VHR Imagery and Height Points Ancillary Data. Remote Sensing. 2012; 4(8):2256-2276. https://doi.org/10.3390/rs4082256
Chicago/Turabian StyleSalehi, Bahram, Yun Zhang, Ming Zhong, and Vivek Dey. 2012. "Object-Based Classification of Urban Areas Using VHR Imagery and Height Points Ancillary Data" Remote Sensing 4, no. 8: 2256-2276. https://doi.org/10.3390/rs4082256