1. Introduction
Land cover describes the physical cover of the Earth’s surface including vegetation, non-vegetation and man-made features, while land use is characterized by anthropogenic activities to modify, manage and use certain types of land cover [
1–
5]. Detailed knowledge of land cover and land use is a key parameter for sustainable planning in the context of agriculture, urban development, and nature conservation. Land cover (LC) and land use (LU) are two examples of value added information, which can be derived from Earth Observation (EO) data.
Land cover information from satellite imagery is a widely-used tool for large area environmental monitoring and analyses of change processes on the Earth’s surface [
6–
9]. Global networks for the assessment of the impact of climate change (e.g., GTOS (Global Terrestrial Observing System), GCOS (Global Climate Observing System),
etc.) consider land cover as one of 13 essential climate variables beside biomass, leaf area index, fire disturbance, water use,
etc. [
10]. Additionally, land cover products form a major input for further modeling and analysis, e.g., in hydrologic modeling, and trend analysis [
11–
15], biomass and energy modeling [
16–
20], population density modeling [
21,
22], risk and hazard analysis [
23–
25], or ecosystem assessment [
26,
27]. Innovative environmental planning and management tools, such as Decision Support Systems, also require high-quality land cover and land use information derived from high and very high resolution data at a regional scale [
6]. With the expanding community of scientific and non-scientific users not necessarily experts in remote sensing image analysis techniques (e.g., hydrologists, socio-economists, or political stakeholders and decision makers), the requirements for simplified, automated processing environments yielding the above mentioned LC and LU products are increasing.
During the last decades, new sensors and easily accessible data archives have increased the amount of available remote sensing data. This development necessitates robust, transferable and automated methods and processing services for the derivation of accurate information that can be produced within a short period of time [
8,
28]. Furthermore, LULC change analyses based on remote sensing data require comparable and stable methods for the initial generation of classification products [
29–
33].
In general, comprehensive and well-known image processing software packages require a large amount of knowledge about the utilization of the specific software and are mostly limited to single date image classification. Standard software also generally requires high cost software licenses. However, to support classification of large amounts of datasets a comprehensive processing environment is required.
Despite this, very common classification procedures with a large amount of user interaction (e.g., by visual interpretation using local knowledge, image classification followed by manual post-processing and correction in GIS, etc.) are still advantageous for solutions that aim for a single derivation of a high accuracy land use map for a small area.
In this paper we introduce the concept and implementation of a methodology to classify image data within an automated processing environment called TWOPAC—TWinned Object and Pixel based Automated classification Chain. The objective is to present a framework to derive LULC products independent from known image classification software packages to allow for large scale data processing. The TWOPAC process chain aims at semi-automated processing of the full classification chain (including sampling, classification, post-processing) to provide a framework for image classification and to reduce user interaction possibilities.
In a nutshell, TWOPAC is a software tool that consists of defined modules for data pre-processing, image classification and validation of the results. The processing steps are conducted in a standardized procedure and implemented in an open source-based software solution. TWOPAC’s functionality and processing is built as Open Spatial Consortium (OGC) compliant web services to process geospatial raster or vector data via web resources (server, network).
In the first step TWOPAC is introduced thereby presenting separately the aspects of data pre-processing and preparation, classification, and validation. Secondly, several example applications utilizing the TWOPAC classification chain are presented, including the presentation of classification results, accuracy assessment, and discussion. The paper closes with a conclusion, followed by a comprehensive outlook on further developments.
2. Method
2.1. TWOPAC Overview
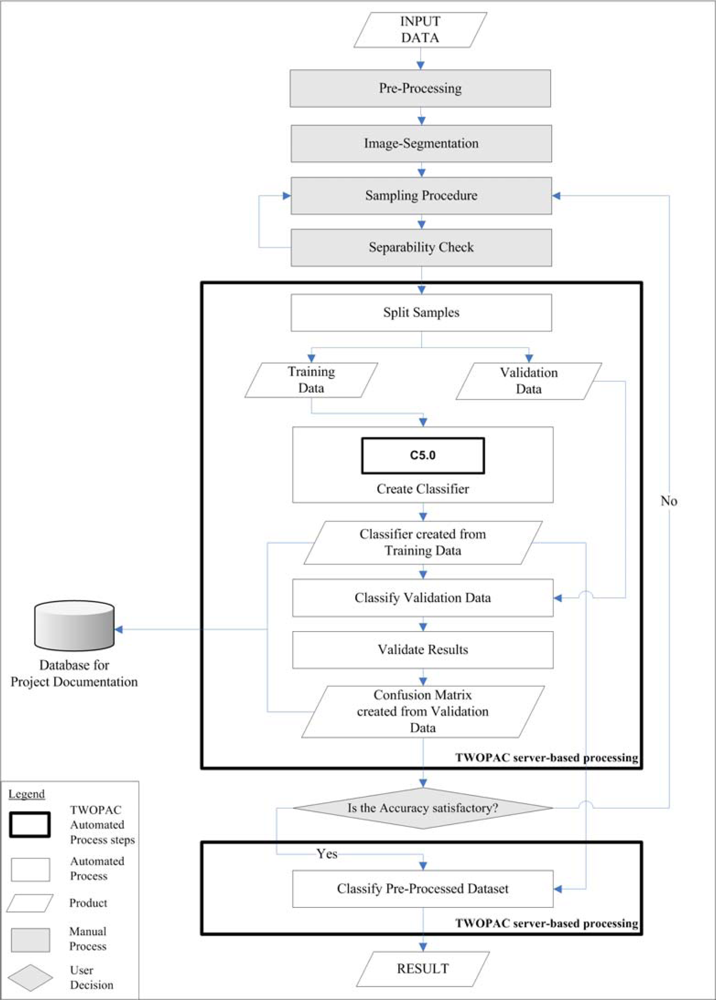
The basic classification methodology of TWOPAC is a supervised decision tree classification where the tree is derived using representative training areas of each land cover type of interest [
34,
35]. Currently, required pre-processing and data input preparation such as image segmentation and feature space generation, are not yet included in the TWOPAC environment. An extensive training and validation data set, which we call “sampling data”, is selected from the imagery. The only manual process is the analyst-based assignment of LC and LU classes to these samples. Supervised classification is then performed automatically in the TWOPAC environment with a certain user-defined split percentage of training and validation samples. For the Decision Tree based Classification, (DTC) the well-known C5.0 [
36] code has been implemented within TWOPAC, which builds up a set of decision rules based on the concept of entropy. TWOPAC enables not only pixel-based classification, but also allows classification based on object-based characteristics, such as shape parameter and object statistics. Furthermore, classification results are automatically validated using set aside validation data.
The main steps of the TWOPAC approach are presented in detail in the following paragraphs (for an overview, also see
Figure 1).
2.2. Data
TWOPAC can analyze multi-spectral and multi-temporal remote sensing data of various spatial resolutions, such as very high resolution data (e.g., Worldview and Quickbird imagery), high resolution data (e.g., Rapid Eye), medium resolution data (e.g., Landsat, SPOT, and Aster), as well as coarse resolution data (e.g., MODIS or AVHRR). Hence, usage of TWOPAC does not depend on spatial resolution or satellite sensor.
For reference data a number of auxiliary information types can be optionally used in order to enhance the identification of samples. These auxiliary datasets could be ground truth data collected during field campaigns, selected vector data, or topographic maps.
2.3. Input Data Generation
The first step in data pre-processing includes geo-referencing and atmospheric correction of the imagery. These work steps generally required by all image classification tools are not yet included in the TWOPAC environment. In our work, geo-referencing has been conducted with ground control points collected in the field as well as in spatially highly accurate TerraSAR-X Stripmap images, which are geo-referenced with high accuracy [
37]. For atmospheric correction we utilized the well-known ATCOR-2 atmospheric correction software based on MODTRAN, which allows the derivation of surface reflectance for each pixel [
38]. Atmospheric correction results are preferably validated comparing image spectra of pseudo invariant surfaces with spectral reflectance information collected
in-situ.
Pre-processing in advance of TWOPAC includes the generation of a segmentation layer from an extended image layer stack. Currently, this step is still outside of the TWOPAC framework, realized through the commercial software eCognition Developer. It is envisaged to create these segmentation layers by self-developed or freely accessible segmentation algorithms and to integrate this pre-processing step into the TWOPAC processing environment, in the near future.
Segmentation layers are derived from the geo- and atmospherically corrected images, as the aim is to not classify on pixel basis exclusively, but also to consider the feature information of segments, enabling classification on an object basis as well. ECognition considers the spatial and spectral properties of neighboring pixels of a multi-spectral image stack to group them in homogeneous regions, so called objects or segments [
39]. The adjustment of the segmentation layer which is parameterized by scale, color, and shape can be considered as a rather subjective process. However, some measures for objective image segmentation evaluation were proposed by Möller
et al. and Neubert
et al. [
40,
41]. The image objects have to be subsequently checked for their suitability for classification by visual interpretation.
Dependent on the classification approach selected,
i.e., pixel- or object-based classification, small methodological differences, related to the segment size and the feature space generation, have to be considered. For the object-based approach segmentation aims for the depiction of real world objects, e.g., channels and river objects are represented by long, thin polygons; agricultural fields are preferably compact objects separated along field borders or irrigation channels,
etc. (depending on the study region). The feature space which is generated for each segment contains several geometry features such as
length-to-width,
shape index,
area,
compactness,
etc. as well as several segment features that describe spectral information (e.g., band statistics such as reflectance
mean values of all pixels per segment). Features related to spatial information between objects can provide supplementary information for classification [
42]. Distance and topological neighboring properties of objects are possible to be used as well, which were not applied for the test cases presented in this study.
For pixel-based classification a segmentation layer which is characterized by strong over-segmentation is generated. The aim is not to represent real world objects (as e.g., rice fields for object-based classification,
etc.) but to group neighboring pixels together according to their spectral similarity as it is performed in region growing approaches [
43]. Within the sampling procedure (see next subsection) assigning classes to small segments is considered easier than based on single pixels, and is expected to support and accelerate sampling. To ensure the elimination of mixed pixel information from the border of segments, the user applies an inner buffer using a sensor specific buffer size of 1–2 times the pixel size. The pixel-based classification is related to the spectral information of single pixels only. However, additional spectral features/indices are generated to enlarge the feature space. We have typically processed Principal Components (usually PC 1,2,3) as well as Tasselled Cap Components (TCC: Brightness, Greenness, Wetness), and selected indices (e.g., Normalized Difference Vegetation Index (NDVI), Enhanced Vegetation Index (EVI)) as they have been shown to increase classification accuracy [
2,
5,
34,
44–
49].
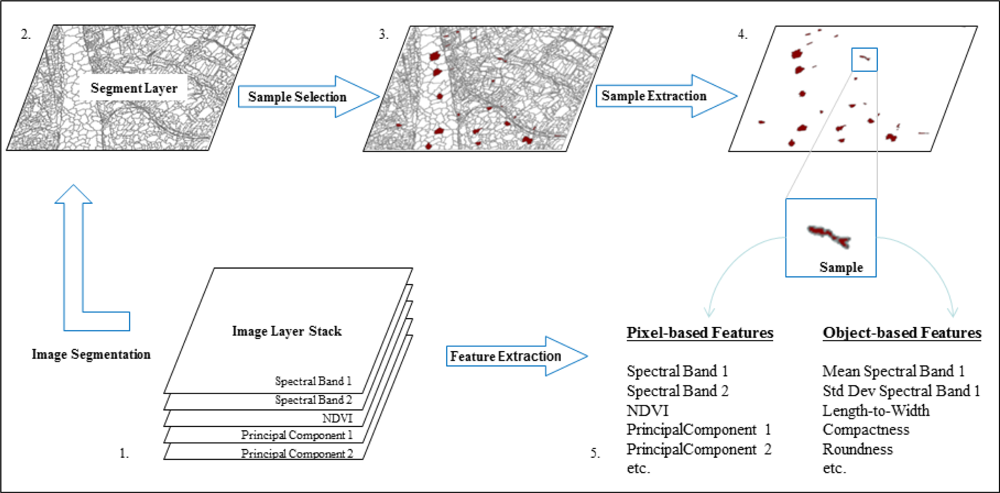
To sum up, the data input generation comprises a segment layer for object-based classification, or a segment layer plus a multi-spectral image layer for pixel-based classification. The object-based feature space is described by attributes such as shape and statistical parameters which characterize the spectral values within a segment. The feature space for pixel-based classification is defined by the spectral information of the dataset’s multi-spectral bands, and the additionally generated bands (PC, TCC, Indices, etc.). The feature space for both, pixel or object-based classification can also be increased with additional information from pre-classification results, information generated from radar imagery, topographical information, etc., depending on the availability and suitability of such additional information.
2.4. Sampling Data Generation
In supervised classification, image data are classified based on the analyses of training data, which describe the statistical characteristics (min, max, mean, variability
etc.) of selected LC and LU types. Unsupervised methods subdivide the image data into a predefined number of spectral classes based on spectral characteristics without requiring analyst-specific training information. The accuracy of unsupervised classification can increase with increasing spectral separability of the classes [
34], which however, usually still not lead to sufficient results [
35,
49]. For this reason, TWOPAC rather follows supervised classification approaches.
Samples for training and validation are selected by the user. Samples are required in ESRI Shapefile format and can be either polygon features, marking the boundaries of a training/validation area, or point features located at the center of the training/validation pixels.
For the sample selection procedure Quantum GIS [
50] is used. In general, any GIS software supporting ESRI Shapefiles can be used, but we prefer Quantum GIS since it is a free and easy to handle software with several features supporting such sample data selection. For the sampling procedure the image layer stack is overlaid with the generated segment layer and auxiliary vector layers (if available). In the case of pixel-based classification the segmentation layer is very useful though not mandatory for the sampling process. The segments are selected by the user aiming at an even distribution over the image, and are automatically weighted according to their areal proportion of the classes to avoid over- or under prediction [
51]. Selected samples are assigned to a land cover class. The class scheme has to be created according to the intended applications of the classification result. TWOPAC does not depend on specific classification scheme types. The selection of samples requires a certain amount of knowledge about the satellite image and geographic region. Besides, the reference data need to be of comparable quality to the envisaged features intended to be derived from the imagery.
According to Congalton and Green [
52] it is advisable to collect at least 50 samples per class when covering 1 million acres (about 4,050 km
2 = coverage of one SPOT scene) and less than 12 classes. It is advisable to stick to this rule, but modifications are possible, depending on the data variance within individual classes. Heterogeneous classes for instance, such as the “settlement” or “fruit orchards”, require more samples for successful classification than the rather homogeneous class “water”.
The result of the sampling procedure (see
Figure 2) should be an ESRI Shapefile, which contains the sample segments, enriched with their segment features, and class labels as attributes. This dataset is the input for the automated steps of the TWOPAC classification chain.
2.5. TWOPAC Automated Processing Steps
At this point the manual steps outside of the TWOPAC framework are completed and all subsequent processes are conducted in an automated manner. The graphical user interface (GUI) of TWOPAC allows for stepwise, iterative, and interactive implementation of the classification process, comprising the modification of the sample splitting percentage (see Section 2.5.1), the selection between pixel and object-based approaches, as well as the monitoring of intermediate results.
2.5.1. Preparation of the Classification
TWOPAC starts with the division of samples into training and validation data. The percentage of samples used for training and validation can be set by the user (usually 2/3:1/3), but the optimal ratio is not a widely published parameter and is recommended to be tested by the user. The next decision of the user is whether classification will be processed pixel-based or object-based. For pixel-based classification the ID of the originating sample segment is automatically incorporated into separation process to avoid usage of training and validation sample points from the same segment.
The subsequent TWOPAC work step is the creation of the classifier based on the training samples. Following, the term classifier is used for the generated rules for separation of training data into predefined classes.
2.5.2. Classification Algorithm
The current implementation of TWOPAC features the C5.0 based decision tree classification [
36]. This automatic tree building software conducts data mining and decision tree estimation. The algorithm searches through a given set of training cases to find the best feature for separation into pre-defined classes. The statistical measure
information gain ratio is used as a splitting criterion to estimate how well a selected feature separates the training cases according to their class membership [
36,
53,
54]. In general, decision tree algorithms are fast, relatively insensitive to noise in the training data, and therefore suitable for classifying large volumes of data [
55]. Non-parametric methods, such as decision tree algorithms are not based on the assumption of normality within the training statistics, and hence can handle non-normal, non-homogenous data sets [
28,
56]. They can also reveal non-linear and hierarchical relationships between training variables. In decision trees, the hierarchical nature of splits, their interactions and their importance for different classes is explicit. This structure can help to understand the classification procedure [
56] and allows further interpretation and analysis of the samples and their features.
According to Quinlan [
54] the C5.0 algorithm produces classifiers either represented as decision trees or as rule sets. In our work, we prefer rule sets due to the often complex decision trees that are produced, compared to rule sets which are more simple and easier to understand. For example, rules are of the form “if A and B and C,…, then class X” [
57,
58]. For a complete description of the algorithm behind C5.0 the reader is referred to Quinlan [
36,
53,
54], and for an overview description of decision tree classification as well as further algorithms, to DeFries and Chan [
28], Friedl and Brodley [
59], and Rokach and Maimon [
60].
The classification algorithm C5.0 was chosen to be implemented for two reasons: it has been well documented that it provides very good results for remote sensing applications [
9,
28,
55,
56,
61,
62] and the automatic building of the decision tree eliminates the need for user interaction in contrast to knowledge-based decision tree approaches. Stepwise generation of the decision tree by the user utilizing gathered knowledge from the image about separation boundaries of specific class category definitions is a strong drawback of such knowledge-based decision tree approaches.
The TWOPAC framework is in general not limited to the C5.0 classification method implemented so far. New classification algorithms such as random forest, support vector machines, and maximum likelihood can be integrated as well.
2.5.3. Validation Method
Classification and feature extraction are not complete without quantitative error estimation. Within TWOPAC GUI the result of the automatic accuracy assessment is visualized as a confusion matrix or error matrix, which displays the quality of the classification result compared with the reference information [
63]. Moreover, the overall accuracy, the producer’s and user’s accuracy, and the Kappa values are given [
52,
64,
65]. The validation of the classifier directly after creation from the training samples avoids unnecessary, time-consuming processing of the complete raster image or segment layer in case the classifier turns out to deliver low accuracies and needs further improvement. This is a noticeable advantage of TWOPAC in comparison to the regular procedures in most of the existing image processing software packages.
Furthermore, direct validation of the classifier facilitates effective and efficient testing of several parameters to find the best classifier. If the result of the accuracy assessment is not satisfying the training data can be modified, enlarged, etc., and a new selection of randomly chosen training data can be used for performing a new classification run. Additionally, the implementation of several classification runs under the modification of the training/validation percentage can provide information about the stability of the training data. Moreover, the feature space can be modified very easily with TWOPAC in order to assess the influence of several features on the classification accuracy.
2.5.4. Classification of Pre-Processed Dataset
After the classifier is tested the best variant can be applied to the entire dataset, i.e., to the raster image or to the segment layer. The output is a single band raster image with class categories as pixel values in the case of pixel-based classification, or a shape file with an additional feature holding the respective class labels in the case of object-based classification. The classification result can then immediately be displayed in Quantum GIS.
2.6. Technical Implementation
The TWOPAC processing environment is installed on a virtual machine on a UNIX server environment. To allow for the automated standardized processing of TWOPAC, several process steps are implemented as Web Processing Services (WPS). The choice of WPS that facilitate standardized interfaces for process control enables the integration of OGC conform clients, and the services can potentially be published for other users [
66].
The introduction of data processing methods following the standards of the OGC allows implementation to be easily understood, reproduced, and integrated into other applications [
67]. This specific technology to process geospatial raster or vector data via web resources (server, network) was introduced by the OGC in 2007. So far it was mainly used to perform simple processing steps such as intersection of vector datasets. New to the field of geospatial processing techniques is the usage of WPS for complex processes such as the implementation of image classification algorithms. The WPS interface technology used to wrap the single sub-processes of the classification procedure is available for the main steps of the TWOPAC classification process (as described in Section 2.5). Technical implementation is realized using PyWPS—the Python implementation of the WPS 1.0.0 standard [
68]. The single process steps of TWOPAC—preparation of the classification, classification, and validation, are implemented in the Python language as a plug-in for Quantum GIS and the interface is available as a graphical user interface (GUI). The easy-to-handle TWOPAC GUI allows the user to implement the classification processed in a comfortable manner.
3. Results
Several datasets from different sensors and spatial resolutions were processed with the presented TWOPAC framework. Selected classifications are presented to illustrate and directly compare results regarding different aspects.
3.1. Object-Based Classification of Large Mosaic Data Set
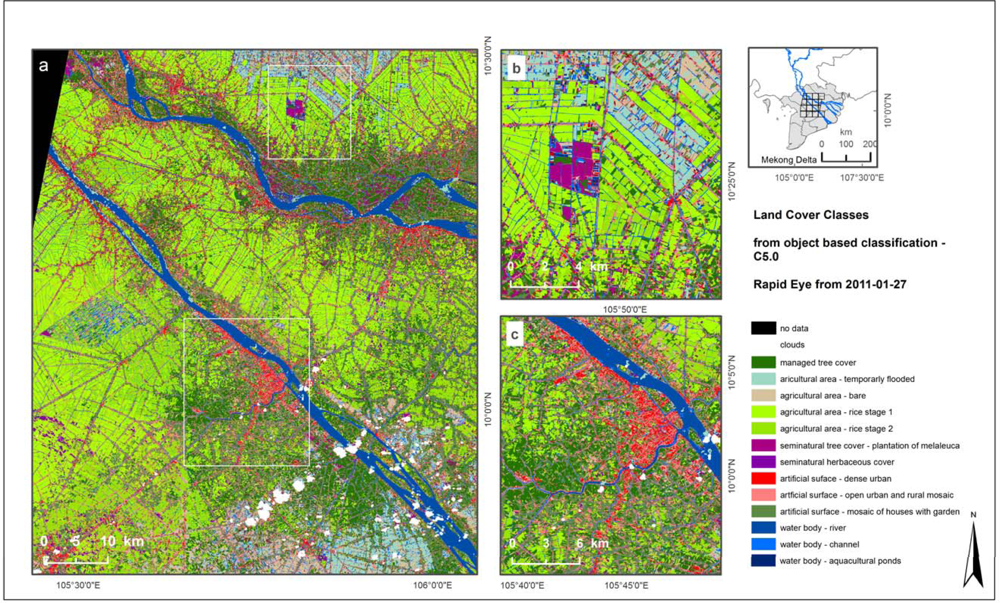
We first present the classification of a Rapid Eye data mosaic from 2011. In general, one Rapid Eye image tile has a size of 25 × 25 km whereas the presented 4 × 4 tile mosaic covers an area of 100 × 100 km with spatial resolution of 6.5 m. As can be seen in
Figure 3 the final classification map covers most of the central part of the Mekong Delta in southern Vietnam. Paddy rice cultivation is the dominant land use type in the area. Furthermore, the area is characterized by small scale distribution of cover types, such as tree orchards. The Mekong Delta undergoes rapid changes in vegetation coverage, resulting from the strongly varying precipitation due to pronounced dry and wet seasons.
Object-based classification was conducted. The segmented image mosaic contains about 500,000 objects. To characterize 17 spectral classes which could be combined into 14 thematic classes 3,188 segments were chosen as samples. For the delineation of the defined classes 21 features, such as
length to width,
compactness,
mean of red band,
etc., were selected on the basis of experience with object-based classification. The classification of the mosaic was conducted with one C5.0 rule set that was built using the sample data combined from all 16 tiles of one acquisition date. The overall accuracy of the classification is 93.7% while Kappa is 0.93. Producer’s and user’s accuracies of the single classes can be found in
Table 1.
3.2. Comparison of Pixel- and Object-Based Classification
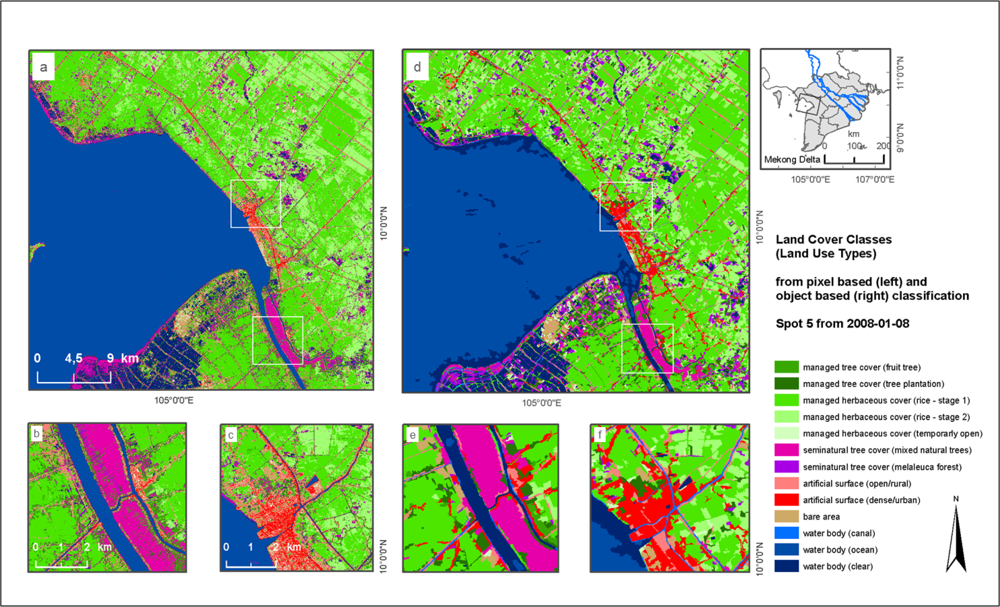
The second example is the classification of a SPOT5 single scene from 2008. The dataset has a spatial resolution of 10 m and covers an area of 60 × 60 km located at the west coast of the Mekong Delta. The classification was conducted with both pixel-based and object-based approaches. For the pixel-based classification 7 features including spectral information from the four bands and three spectral indices (Normalized Differenced Vegetation Index (NDVI) [
69], Greenness Index (GI) [
70], and Modified Triangular Vegetation Index (MTVI) [
71]) were generated. For the object-based classification 20 features were chosen, mostly comparable to features chosen for the Rapid Eye scene. The map in
Figure 4 shows subsets of the whole scene to allow for the visual comparison of the two approaches. Producer’s and user’s accuracies of the pixel- and object-based approach are presented in
Table 2. For the pixel-based approach checking the class separability led to the combination of sampling data into 9 final classes resulting in an overall classification accuracy of 94.2% and Kappa value of 0.93. For the object-based approach using 12 classes achieved an overall accuracy of 90.8% and a Kappa of 0.90.
3.3. Comparison of C5.0 TWOPAC Classification with Maximum Likelihood Classification
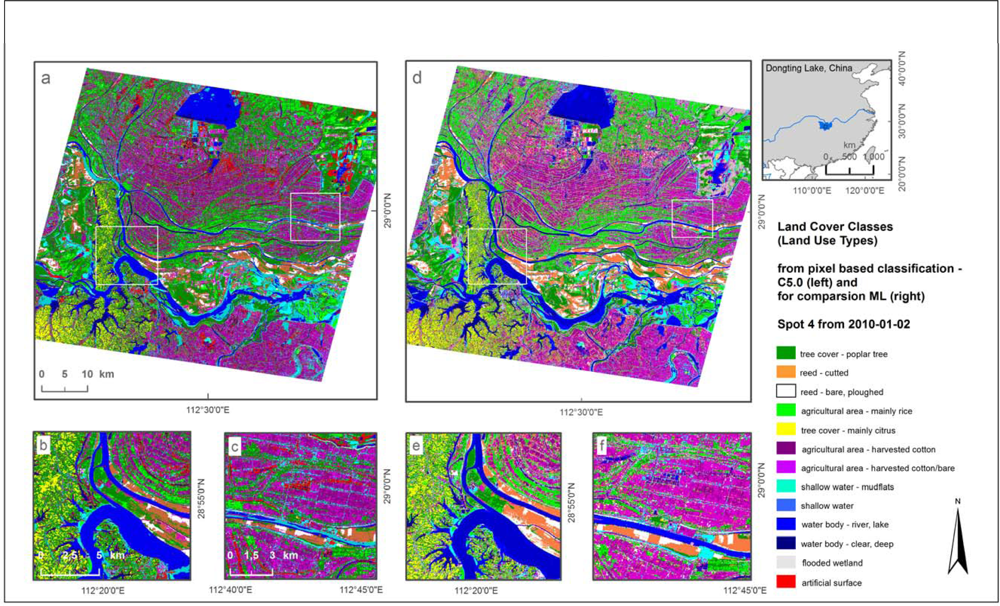
Thirdly, we present a classification result of a SPOT4 single scene from 2010 for the Dongting Lake region in Hunan Province of China (
Figure 5). The area is characterized by continental, subtropical climatic conditions, and is dominated by agricultural fields for rice and cotton with a small scale distribution similar to the Mekong Delta. Furthermore, managed areas of poplar and reed production are located close to the lake shore as well as wetlands represented by temporarily flooded wetland vegetation and mudflats. Moreover, hilly areas west of Dongting Lake are used for cultivating fruit trees. The classification scheme comprised 12 land use classes and included poplar tree cover, citrus tree cover, reed, and areas used for agricultural production of rice and cotton,
etc.
For independent comparison of the TWOPAC classification with other approaches commercial image processing software was used to generate a maximum likelihood (ML) classification. The classification was conducted selecting about 120 regions of interest (so-called ROIs). These samples were separated in two even parts as performed for the TWOPAC classifications, by using external GIS software. The maximum likelihood classification also consists of 12 classes.
Accuracy values can be found in
Table 3. The overall accuracy of the TWOPAC C5.0 classification result derived from pixel-based approach is 97.8% whereas the ML classification results in 85.9%.
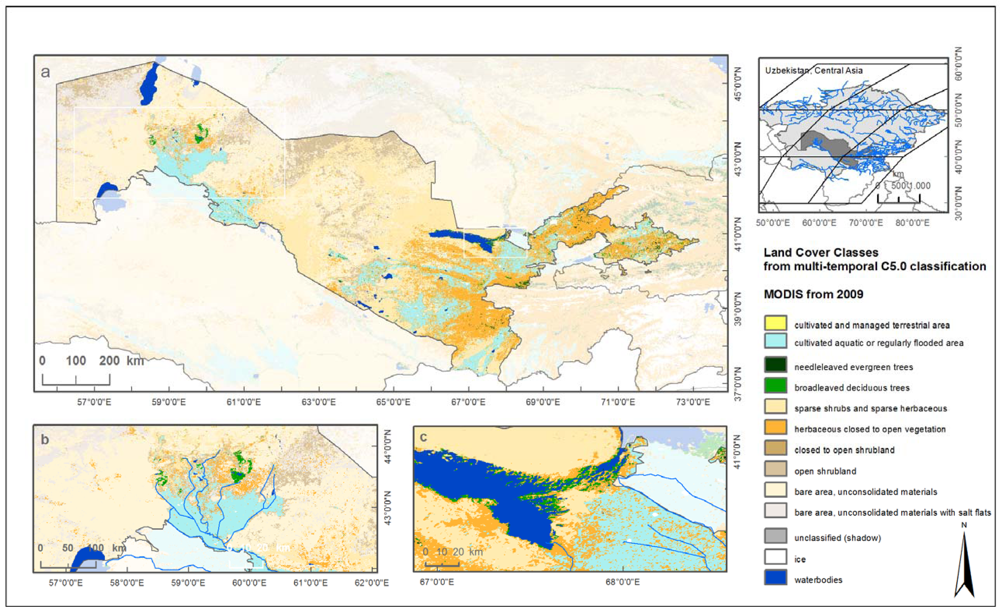
3.4. Classification of Large MODIS Time Series Data Set
Finally, we present a classification for Central Asia using MODIS time series data from 2009 with a spatial resolution of 250 m (see
Figure 6) processed with TWOPAC. Pre-processing of multi-temporal data which differs substantially from multi-spectral data preparation will not be explained in this study. TWOPAC was used to classify 8 MODIS tiles for Central Asia. Feature space generation resulted in 42 feature parameters, such as maximum and minimum of NDVI in summer, to describe the seasonal phenology of different vegetation types. Sample data were selected with the help of 20 Landsat image datasets which had been segmented as described before. Twelve class categories were selected which exist in Central Asia comprising an area of 7,920,000 km
2. The single MODIS tiles were classified using the same C5.0 rule set generated from all training samples. The overall accuracy obtained with this TWOPAC classification is 91.2% and the Kappa coefficient is 0.89. Producer’s accuracies range from 60.5% for close shrubs to 100% for ice and snow, whereas user’s accuracies resulted in values between 41.1% for closed shrubs and 96.1% for bare area with salt. Details on this classification related to pre-processing, confusion matrices,
etc., can be found in [
72].
4. Discussion
Four different classification examples were presented to underline the ability of TWOPAC for handling different data set types and sizes, spatial resolutions, and classification approaches (pixel- and object-based). In general, TWOPAC classification results show very high accuracies.
The object-based classification of a large Rapid Eye mosaic results in an overall accuracy of 93.7%. The range of the producer’s accuracy is from 66.67% for bare agricultural area to 100% for certain water bodies and vegetated agricultural areas, while the user’s accuracies range from 75.0% for certain managed tree cover classes to 100% for certain vegetated agricultural areas and semi-natural herbaceous cover classes (see
Table 1). The lower accuracies mark classes which are prone to misclassifications due to high similarities in their spectral class characteristics, e.g., two different tree cover classes, or classes which represent bare surfaces.
The comparison shows that the classifications also result in very good accuracy of 94.2% when using the object-based and of 90.8% when using the pixel-based approach. Although the overall accuracy of the pixel-based classification is unexpectedly higher than for the object-based approach, the results do not differ substantially. The difference could be caused by the significant smaller number of samples for the object-based classification. The comparison of the two TWOPAC classification approaches demonstrate that both object- as well as pixel-based classification of the same dataset can result in high and comparable accuracies as already reported by Duro
et al. [
73]. To underline this, the artificial surface class with a producer’s accuracy of 88.1% (pixel-based) is separated into two subclasses using specific object-based characteristics for distinction of dense urban and sparse urban areas. The object-based approach results in a producer’s accuracy of 87.5% for dense urban and 81.8% for sparse urban (see
Table 2).
For the comparison of a decision-tree-based TWOPAC classification with a maximum likelihood classification based on existing image classification software, a single scene classification was implemented. As can be seen from
Table 3, the two classification outputs show significant accuracy differences. Misclassification amongst vegetation classes, as well as amongst water classes are much lower for the non-parametric classification algorithm used in TWOPAC. This could be caused by the insensitivity of decision tree algorithms towards noise in the training data already documented by Friedl
et al. [
55].
The classification of MODIS time series data is presented to underline TWOPAC’s capacity to classify large datasets. Creation of one classifier from the complete sample data set was not feasible using common classification systems. The MODIS data set for instance, presented in the section above, required 15 GB storage space after mosaicking and feature creation. Tests had to be interrupted due to the impossibility of reading data larger than 4 GB into a common software system. Hence, the MODIS classification only could have been implemented separately for 4 single MODIS tiles of maximum 4 GB marking the limit of commonly used image classification software. It is anticipated that the overall result would be different since not all envisaged classes occur in every single MODIS tile. Furthermore, the effort for applying the classification process separately to every MODIS tile (including pre-processing, classifier creation, and results harmonization) would be higher than using the TWOPAC approach.
The same applies to the presented object-based Rapid Eye classification. For segmentation, feature creation, and sample selection the mosaic with a dataset size of more than 4 gigabytes had to be split in 4 subsets due to memory problems of the software used. For the large, high resolution dataset mosaic covering 10,000 km2 an object-based TWOPAC classification is implemented at once. In addition, outsourcing the processing of large datasets to the TWOPAC server environment is advantageous compared to usage of processing capacity on desktop computers.
5. Conclusion and Outlook
The TWOPAC framework presented in this paper shows great potential for large scale data processing. As proposed in various publications [
6,
8,
9,
28], there is a high demand for automation of image classification processes due to,
i.e., increasing volumes of accessible data, and the need to process reliable results in a shorter time. As presented in this paper, classification with TWOPAC allows for the fast generation of comparable and standardized results, utilizing server processing capabilities. This is especially advantageous for calculation of memory-intensive data (e.g., mosaics of high resolution data, time series data sets). The TWOPAC classification framework has already been used for several applications and projects in different regions of the world which resulted in overall accuracies of between 85.9% and 97.8%.
TWOPAC features open source-based implementation of the well-known decision tree estimation software C5.0, for automatic building of decision trees from training data. This is considered as a remarkable advantage compared to known commercial image processing software.
Moreover, an expanding community of scientific and non-scientific users, who are increasingly interested in “easily” generated LC and LU products, are given the opportunity to perform image classification in a simplified way. Besides a priori local knowledge of the land cover types of the selected geographical region, which is a basic requirement, the user should be aware of necessary pre-processing for data input generation. Additionally, the user needs to have some experience in image interpretation for conducting the sampling procedure. However, the envisaged user of TWOPAC should also have some basic expertise in remote sensing image analysis for evaluation of the classification results, and for understanding the validation tables. In summary, TWOPAC is a very easy-to-use classification system which only requires well-founded basic knowledge of remote sensing image classification.
A further key advantage of the proposed approach is that it is almost fully independent of commercial clients or desktop software for remote sensing image analysis. The utilization of OGC compliant Web Processing Services offers the technical opportunity to integrate the framework into existing processing environments. To fully exploit the possibilities of TWOPAC on an open source basis, the segmentation and spatial feature extraction currently achieved by using eCognition Developer has to be replaced by a freely available segmentation algorithm.
Further enhancements and extensions are focusing on the successive integration of individual pre-processing steps such as geo-rectification and atmospheric correction. Here, we envisage connecting the TWOPAC framework to the already existing automatic pre-processing environment, CATENA (Latin: chain), which has been developed by the Remote Sensing Technology Institute of the German Aerospace Centre (DLR) [
74] and enables the fully automatic geo-rectification and atmospheric correction of optical imagery.
Furthermore, the sampling procedure shall undergo modification, as it is the most time-consuming part of the classification procedure and still includes subjective interpretation and user interaction. Predefinition of classes requires a lot of knowledge of the various classes and their appearance within the satellite image data. Subjective evaluation of class appearance leads to the definition of classes that might not be separable by the classifier. Therefore, supported sampling could include statistical clustering over the feature space and the subsequent selection of samples on the basis of this pre-classification result. Additionally, we envisage improvements in spatial and temporal transferability. Multi-temporal data stacks could be analyzed for pseudo-invariant objects to provide stable sample objects over time. These could easily be found in water bodies, built-up surfaces, areas with evergreen trees, or sandy shore areas. A statistical analysis on the stored sample data regarding sample quality and the re-usability of samples would utilize the comprehensive sampling database approach at the envisaged scale. Sample quality could even be flagged and proposed for reuse.
Finally, the implementation of further sophisticated classification algorithms, such as the random forest classifier [
75] or support vector machines [
76], would provide the user greater flexibility in their specific classification exercises.
The ultimate goal is then to make TWOPAC available to a larger user community, once the framework is fully based on open source technology.


