Estimation of Supraglacial Dust and Debris Geochemical Composition via Satellite Reflectance and Emissivity

Abstract
:
1. Context
2. Study Areas
3. Data Collection and Methods
3.1. Field Sampling and Geochemical Analysis
3.2. Spectral Satellite Data and Analysis
4. Results and Discussion
4.1. Use of Multispectral Reflectance Response Patterns
4.2. Use of Hyperspectral Reflectance Response Patterns
4.3. Use of Emissivity to Measure Silica Content
4.4. Use of Emissivity to Calculate Surface Temperature and Explore Mineral Influences
5. Conclusions
Acknowledgments
References
- Dyurgerov, M.; Meier, M. Glaciers and the Changing Earth System: A 2004 Snapshot; Occassional Paper 58; Institute of Arctic and Alpine Research, University of Colorado: Boulder, CO, USA, 2005; p. 117. [Google Scholar]
- Thompson, L. Climate change: The evidence and our options. Behav. Anal 2010, 33, 1153–1170. [Google Scholar]
- Kang, S.; Wake, C.; Dahe, Q.; Mayewski, P.; Tandong, Y. Monsoon and dust signals recorded in Dasuopu glacier, Tibetan Plateau. J. Glaciol 2000, 46, 222–226. [Google Scholar]
- Fischer, H.; Siggaard-Andersen, M.L.; Ruth, U.; Röthlisberger, R.; Wolff, E. Glacial/interglacial changes in mineral dust and sea-salt records in polar ice cores: Sources, transport, and deposition. Rev. Geophys 2007, 45. [Google Scholar] [CrossRef] [Green Version]
- Thevenon, F.; Anselmetti, F.; Bernasconi, S.; Schwikowski, M. Mineral dust and elemental black carbon records from an Alpine ice core (Colle Gnifetti glacier) over the last millennium. J. Geophys. Res 2009, 114. [Google Scholar] [CrossRef]
- Kaspari, S.; Schwikowski, M.; Gysel, M.; Flanner, M.; Kang, S.; Hou, S.; Mayewski, P. Recent increase in black carbon concentrations from a Mt. Everest ice core spanning 1860–2000 AD. Geophys. Res. Lett 2011, 38. [Google Scholar] [CrossRef]
- Hansen, J.; Nazarenko, L. Soot climate forcing via snow and ice albedos. Proc. Natl. Acad. Sci. USA 2004, 101, 423–428. [Google Scholar]
- Xu, B.; Cao, J.; Hansen, J.; Yao, T.; Joswia, D.R.; Wang, N.; Wu, G.; Wang, M.; Zhao, H.; Yang, W.; Liu, X.; He, J. Black soot and the survival of Tibetan glaciers. Proc. Natl. Acad. Sci. USA 2009, 106, 22114–22118. [Google Scholar]
- Oerlemans, J.; Giesen, R.; van den Broeke, M. Retreating alpine glaciers: Increased melt rates due to accumulation of dust (Vadret da Morteratsch, Switzerland). J. Glaciol 2009, 55, 729–736. [Google Scholar]
- Kok, J.F. A scaling theory for the size distribution of emitted dust aerosols suggests climate models underestimate the size of the global dust cycle. Proc. Natl. Acad. Sci. USA 2011, 108, 1016–1021. [Google Scholar]
- McKendry, I.; Strawbridge, K.; O’Neill, N.; Macdonald, A.; Liu, P.; Leaitch, W.; Anlauf, K.; Jaegle, L.; Fairlie, T.; Westphal, D. Trans-Pacific transport of Saharan dust to western North America: A case study. J. Geophys. Res 2007, 112. [Google Scholar] [CrossRef]
- Uno, I.; Eguchi, K.; Yumimoto, K.; Takemura, T.; Shimizu, A.; Uematsu, M.; Liu, Z.; Wang, Z.; Hara, Y.; Sugimoto, N. Asian dust transported one full circuit around the globe. Nat. Geosci 2009, 2, 557–560. [Google Scholar]
- Gangale, G.; Prata, A.; Clarisse, L. The infrared spectral signature of volcanic ash determined from high-spectral resolution satellite measurements. Remote Sens. Environ 2010, 114, 414–425. [Google Scholar]
- Brenning, A. The Impact of Mining on Rock Glaciers and Glaciers: Examples from Central Chile. In Darkening Peaks: Glacier Retreat, Science and Society; Orlove, B., Wiegandt, E., Luckman, B., Eds.; University of California Press: Berkeley, CA, USA, 2008; Chapter 14; pp. 196–205. [Google Scholar]
- Crusius, J.; Schroth, A.; Gasso, S.; Moy, C.; Levy, R.; Gatica, M. Glacial flour dust storms in the Gulf of Alaska: Hydrologic and meteorological controls and their importance as a source of bioavailable iron. Geophys. Res. Lett 2011, 38. [Google Scholar] [CrossRef]
- Gleeson, D.F.; Pappalardo, R.T.; Grasby, S.E.; Anderson, M.S.; Beauchamp, B.; Castaño, R.; Chien, S.A.; Doggett, T.; Mandrake, L.; Wagstaff, K.L. Characterization of a sulfur-rich Arctic spring site and field analog to Europa using hyperspectral data. Remote Sens. Environ 2010, 114, 1297–1311. [Google Scholar]
- Kääb, A.; Paul, F.; Maisch, M.; Hoelzle, M.; Haeberli, W. The new remote-sensing-derived Swiss glacier inventory: II. First results. Ann. Glaciol 2002, 34, 362–366. [Google Scholar]
- Schneider, C.; Schnirch, M.; Acuña, C.; Casassa, G.; Kilian, R. Glacier inventory of the Gran Campo Nevado Ice Cap in the Southern Andes and glacier changes observed during recent decades. Glob. Planet. Chang 2007, 59, 87–100. [Google Scholar]
- Bolch, T.; Menounos, B.; Wheate, R. Landsat-based inventory of glaciers in western Canada, 1985–2005. Remote Sens. Environ 2010, 114, 127–137. [Google Scholar]
- Raup, B.; Racoviteanu, A.; Khalsa, S.; Helm, C.; Armstrong, R.; Arnaud, Y. The GLIMS geospatial glacier database: A new tool for studying glacier change. Glob. Planet. Chang 2007, 56, 101–110. [Google Scholar]
- Paul, F.; Barry, R.; Cogley, J.; Frey, H.; Haeberli, W.; Ohmura, A.; Ommanney, C.; Raup, B.; Rivera, A.; Zemp, M. Recommendations for the compilation of glacier inventory data from digital sources. Ann. Glaciol 2009, 50, 119–126. [Google Scholar] [Green Version]
- Escher, A.; Beaumont, C. Formation, burial and exhumation of basement nappes at crustal scale: A geometric model based on the Western Swiss-Italian Alps. J. Struc. Geol 1997, 19, 955–974. [Google Scholar]
- Reid, H. The mechanics of glaciers. I. J. Geol 1896, 4, 912–928. [Google Scholar]
- Machguth, H.; Paul, F.; Hoelzle, M.; Haeberli, W. Distributed glacier mass-balance modelling as an important component of modern multi-level glacier monitoring. Ann. Glaciol 2006, 43, 335–343. [Google Scholar]
- Wei, Z. Chemical Evolution at Surface Condition in the Zermatt-Saas Area (Swiss Alps): A Geo-Hydrochemistry Study on Surface Water-Rock Interaction. Ph.D. Thesis, Universität Freiburg, Freiburg, Germany. 2010. [Google Scholar]
- Gruber, S.; Hoelzle, M. Statistical modelling of mountain permafrost distribution: Local calibration and incorporation of remotely sensed data. Permafr. Periglac. Process 2001, 12, 69–77. [Google Scholar]
- Tartari, G.; Verza, G.; Bertolami, L. Meteorological data at the Pyramid Observatory Laboratory (Khumbu Valley, Sagarmatha National Park, Nepal). Mem. Ist. Ital. Idrobiol 1998, 57, 23–40. [Google Scholar]
- Hambrey, M.; Quincey, D.; Glasser, N.; Reynolds, J.; Richardson, S.; Clemmens, S. Sedimentological, geomorphological and dynamic context of debris-mantled glaciers, Mount Everest (Sagarmatha) region, Nepal. Quat. Sci. Rev 2008, 27, 2361–2389. [Google Scholar]
- de Woul, M.; Hock, R.; Braun, M.; Thorsteinsson, T.; Jóhannesson, T.; Halldórsdóttir, S. Firn layer impact on glacial runoff: A case study at Hofsjökull, Iceland. Hydrol. Process 2006, 20, 2171–2185. [Google Scholar]
- Gudmundsson, S.; Magnússon, E.; Björnsson, H.; Pálsson, F.; Gudmundsson, M.; Högnadóttir, D.; Berthier, E.; Jóhannesson, T.; Sigurdsson, O.; Dorsteinsson, D.; Dall, J. Volume and Mass Balance Changes of Ice Caps in Iceland Deduced from Elevation Data and in situ Mass Balance Observations. Proceedings of SPIRIT Workshop, Toulouse, France, 29–30 April 2010.
- Searle, M.; Simpson, R.; Law, R.; Parrish, R.; Waters, D. The structural geometry, metamorphic and magmatic evolution of the Everest massif, High Himalaya of Nepal-South Tibet. J. Geol. Soc 2003, 160, 345–366. [Google Scholar]
- Scherler, D.; Bookhagen, B.; Strecker, M. Spatially variable response of Himalayan glaciers to climate change affected by debris cover. Nat. Geosci 2011, 4, 156–159. [Google Scholar]
- Luo, R.; Cao, J.; Liu, G.; Cui, Z. Characteristics of the subglacially-formed debris-rich chemical deposits and related subglacial processes of Qiangyong Glacier, Tibet. J. Geogr. Sci 2003, 13, 455–462. [Google Scholar]
- De Ruyter de Wildt, M.; Oerlemans, J.; Björnsson, H. A method for monitoring glacier mass balance using satellite albedo measurements: Application to Vatnajökull, Iceland. J. Glaciol 2002, 48, 267–278. [Google Scholar]
- Gudmundsson, A. Dynamics of volcanic systems in Iceland: Example of tectonism and volcanism at juxtaposed hot spot and mid-ocean ridge systems. Ann. Rev. Earth Planet. Sci 2000, 28, 107–140. [Google Scholar]
- Thordarson, T.; Larsen, G. Volcanism in Iceland in historical time: Volcano types, eruption styles and eruptive history. J. Geodyn 2007, 43, 118–152. [Google Scholar]
- Haflidason, H.; Eiriksson, J.; Kreveld, S. The tephrochronology of Iceland and the North Atlantic region during the Middle and Late Quaternary: A review. J. Quat. Sci 2000, 15, 3–22. [Google Scholar]
- Dibble, R. Volcanic Seismology and Accompanying Activity of Ruapehu Volcano, New Zealand. In Physical Volcanology; Elsevier: New York, NY, USA, 1974; pp. 49–85. [Google Scholar]
- Hackett, W.; Houghton, B. A facies model for a quaternary andesitic composite volcano: Ruapehu, New Zealand. Bull. Volcanol 1989, 51, 51–68. [Google Scholar]
- Chinn, T. Distribution of the glacal water resources of New Zealand. J. Hydrol. (NZ) 2001, 40, 139–187. [Google Scholar]
- NZDOC. Tongariro Parkmap 273-04. In New Zealand Department of Conservation, 6th ed.; GeoSmart: North Shore, New Zealand, 2004. [Google Scholar]
- Hurst, A.; Bibby, H.; Scott, B.; McGuinness, M. The heat source of Ruapehu crater lake: Deductions from the energy and mass balances. J. Volcanol. Geotherm. Res 1991, 46, 1–20. [Google Scholar]
- Werner, C.; Christenson, B.; Hagerty, M.; Britten, K. Variability of volcanic gas emissions during a crater lake heating cycle at Ruapehu Volcano, New Zealand. J. Volcanol. Geotherm. Res 2006, 154, 291–302. [Google Scholar]
- Williams, K. Volcanoes of the South Wind: A Field Guide to the Volcanoes and Landscape of Tongariro National Park; Tongariro Natural History: Turangi, New Zealand, 2001; p. 146. [Google Scholar]
- Keys, H. Lahars of Ruapehu Volcano, New Zealand: Risk mitigation. Ann. Glaciol 2007, 45, 155–162. [Google Scholar]
- Keys, H.; Green, P. Ruapehu Lahar New Zealand 18 March 2007: Lessons for hazard assessment and risk mitigation 1995–2007. J. Disaster Res 2008, 3, 284–296. [Google Scholar]
- Christenson, B.; Reyes, A.; Young, R.; Moebis, A.; Sherburn, S.; Cole-Baker, J.; Britten, K. Cyclic processes and factors leading to phreatic eruption events: Insights from the 25 September 2007 eruption through Ruapehu Crater Lake, New Zealand. J. Volcanol. Geotherm. Res 2010, 191, 15–32. [Google Scholar]
- Kilgour, G.; Manville, V.; Pasqua, F.D.; Graettinger, A.; Hodgson, K.; Jolly, G. The 25 September 2007 eruption of Mount Ruapehu, New Zealand: Directed ballistics, surtseyan jets, and ice-slurry lahars. J. Volcanol. Geotherm. Res 2010, 191, 1–14. [Google Scholar]
- Manville, V.; Hodgson, K.; Houghton, B.; Keys, H.; White, J. Tephra, snow and water: Complex sedimentary responses at an active snow-capped stratovolcano, Ruapehu, New Zealand. Bull. Volcanol 2000, 62, 278–293. [Google Scholar]
- Casey, K.; Kääb, A.; Benn, D. Geochemical characterization of supraglacial debris via in situ and optical remote sensing methods: A case study in the Khumbu Himalaya, Nepal. Cryosphere 2012, 6, 85–100. [Google Scholar]
- Gislason, S.; Hassenkam, T.; Nedel, S.; Bovet, N.; Eiriksdottir, E.; Alfredsson, H.; Hem, C.; Balogh, Z.; Dideriksen, K.; Oskarsson, N.; Sigfusson, B.; Larsen, G.; Stipp, S. Characterization of Eyjafjallajökull volcanic ash particles and a protocol for rapid risk assessment. Proc. Natl. Acad. Sci 2011, 108, 7307–7312. [Google Scholar]
- Clark, R.; Roush, T. Reflectance spectroscopy: Quantitative analysis techniques for remote sensing applications. J. Geophys. Res 1984, 89, 6329–6340. [Google Scholar]
- Hook, S.J.; Gabell, A.; Green, A.; Kealy, P. A comparison of techniques for extracting emissivity information from thermal infrared data for geologic studies. Remote Sens. Environ 1992, 42, 123–135. [Google Scholar]
- Box, J.; Fettweis, X.; Stroeve, J.; Tedesco, M.; Hall, D.; Steffen, K. Greenland ice sheet albedo feedback: Thermodynamics and atmospheric drivers. Cryosphere 2012, 6, 821–839. [Google Scholar]
- Iwasaki, A.; Tonooka, H. Validation of a crosstalk correction algorithm for ASTER/SWIR. IEEE Trans. Geosci. Remote Sens 2005, 43, 2747–2751. [Google Scholar]
- Markham, B.; Barker, J. Landsat MSS and TM Post-Calibration Dynamic Ranges, Exoatmospheric Reflectances and at-Satellite Temperatures; EOSAT Landsat Tech. Notes 1; NASA/GSFC: Greenbelt, MD, USA, 1986; pp. 3–8. [Google Scholar]
- Barry, P. EO-1 Hyperion Science Data User’s Guide, Level 1_B; NASA Tech. Doc.; TRW: Redondo Beach, CA, USA, 2001; p. 52. [Google Scholar]
- Watanabe, H.; Matsuo, K. Rock type classification by multi-band TIR of ASTER. Geosci. J 2003, 7, 347–358. [Google Scholar]
- Barsi, J.; Schott, J.; Palluconi, F.; Hook, S. Validation of a web-based atmospheric correction tool for single thermal band instruments. Proc. SPIE 2005, 5882, 58820E–58820E-7. [Google Scholar]
- Hall, D.; Box, J.; Casey, K.; Hook, S.; Shuman, C.; Steffen, K. Comparison of satellite-derived and in-situ observations of ice and snow surface temperatures over Greenland. Remote Sens. Environ 2008, 112, 3739–3749. [Google Scholar]
- Zeng, Q.; Cao, M.; Feng, X.; Liang, F.; Chen, X.; Sheng, W. A Study of Spectral Reflection Characteristics for Snow, Ice and Water in the North of China. In Hydrological Applications of Remote Sensing and Remote Data Transmission: Proceedings of the Hamburg Symposium; Goodison, B., Ed.; IAHS Publ. No. 145; IAHS: Oxford, UK, 1985; pp. 451–462. [Google Scholar]
- Price, J. Comparing MODIS and ETM+ data for regional and global land classification. Remote Sens. Environ 2003, 86, 491–499. [Google Scholar]
- Gupta, R.P. Remote Sensing Geology, 2nd ed.; Springer: Berlin/Heidelberg, Germany, 2003; p. 655. [Google Scholar]
- Kääb, A. Remote Sensing of Mountain Glaciers and Permafrost Creep; Volume 48, Schriftenreihe Physische Geographie: Zurich, Switzerland, 2005; p. 266. [Google Scholar]
- Vincent, R.; Thomson, F. Rock-type discrimination from ratioed infrared scanner images of Pisgah Crater, California. Science 1972, 175, 986–988. [Google Scholar]
- Ninomiya, Y. Rock type mapping with indices defined for multispectral thermal infrared ASTER data: Case studies. Proc. SPIE 2003. [Google Scholar] [CrossRef]
- Kruse, F.; Boardman, J.; Huntington, J. Comparison of airborne hyperspectral data and EO-1 Hyperion for mineral mapping. IEEE Trans. Geosci. Remote Sens 2003, 41, 1388–1400. [Google Scholar]
- Chan, J.C.W.; Ophem, J.V.; Huybrechts, P. Estimation of Accumulation Area Ratio of a Glacier from Multi-Temporal Satellite Images Using Spectral Unmixing. Proceedings of the IEEE Geoscience and Remote Sensing Symposium, Cape Town, South Africa, 12–17 July 2009; 2, pp. II–606–II–609.
- Painter, T.; Rittger, K.; McKenzie, C.; Slaughter, P.; Davis, R.; Dozier, J. Retrieval of subpixel snow covered are, grain size, and albedo from MODIS. Remote Sens. Environ 2009, 113, 868–879. [Google Scholar]
- Clark, R.; Lucey, P. Spectral properties of ice-particulate mixtures and implications for remote sensing 1. Intimate mixtures. J. Geophys. Res 1984, 89, 6341–6348. [Google Scholar]
- Mars, J.; Rowan, L. ASTER spectral analysis and lithologic mapping of Khanneshin carbonatite volcano, Afghanistan. Geosphere 2011, 7, 276–289. [Google Scholar]
- Hook, S.; Dmochowski, J.; Howard, K.; Rowan, L.; Karlstrom, K.; Stock, J. Mapping variations in weight percent silica measured from multispectral thermal infrared imagery—Examples from the Hiller Mountains, Nevada, USA and Tres Virgenes-La Reforma, Baja California Sur, Mexico. Remote Sens. Environ 2005, 95, 273–289. [Google Scholar]


| Study Region, Glacier (Latitude, Longitude) | Glacier Type, Influences | Mean Annual Temp., Precipitation Elevation (m.a.s.l.) |
|---|---|---|
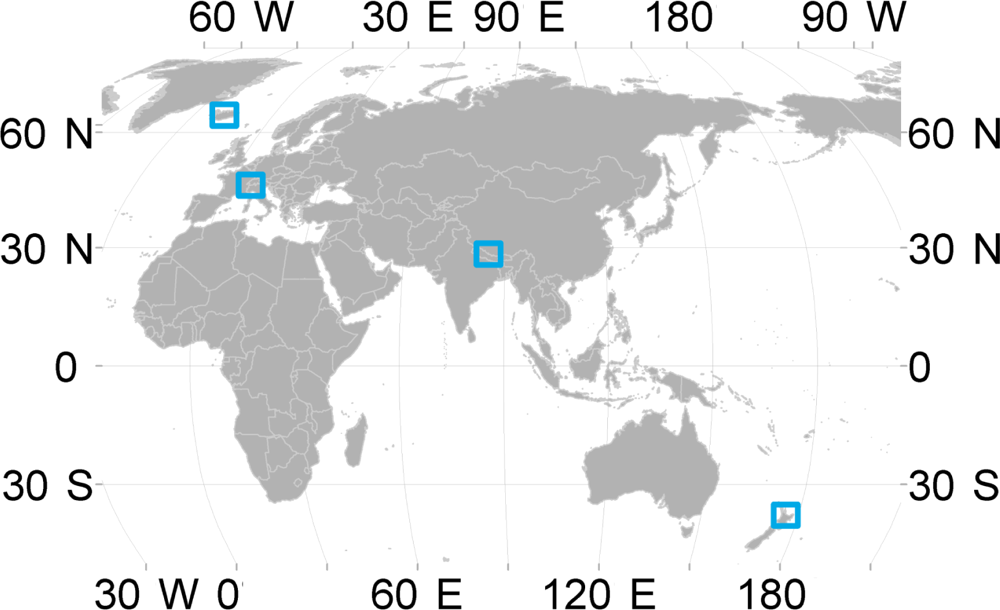
| Zermatt Area, Switzerland (46.00 N 7.65 E) | Mid-latitude, valley glaciers dust and debris covered | 3.5 °C, 700 mm 2,240–4,450 m |
| Khumbu, Ngozumpa, Nepal (27.98 N 86.84 E) | Debris covered continental valley glaciers. | −2.4 °C, 470 mm |
| Temperate, summer accumulation | 4,900–8,848 m | |
| central ice caps, Iceland (64.30 N, 18.05 W) | Near-Arctic, maritime ice caps, volcanic influences | −0.4°C, 740 mm 0–2,100 m |
| Mt. Ruapehu area, New Zealand (39.27 S 175.56 E) | Cirque glaciers, volcanic influences | 6.1 °C, 1,100 mm 2,200–2,797 m |
| Location | Date | Latitude/Longitude | Elevation (m a.s.l.) | Debris type |
|---|---|---|---|---|
| Mid-Findelen | 3 October 2010 | 46.0108°N 7.8267°E | 2,675 | silt, gravel, rock |
| Lower Findelen | 29 September 2010 | 46.0109°N 7.8237°E | 2,590 | silt, gravel, rock |
| Northern Zmutt | 2 October 2010 | 46.0023°N 7.6528°E | 2,345 | gravel, rock |
| Mid-Zmutt | 7 October 2010 | 46.0026°N 7.6560°E | 2,255 | silt, gravel, rock |
| Southern Zmutt | 7 October 2010 | 45.9989°N 7.6560°E | 2,279 | rock |
| Upper Ngozumpa | 27 November 2009 | 27.9568°N 86.6980°E | 4,760 | silt, sand, gravel, rock |
| Mid-Ngozumpa | 29 November 2009 | 27.9537°N 86.6992°E | 4,750 | gravel, rock |
| Lower Ngozumpa | 26 November 2009 | 27.9511°N 86.7020°E | 4,790 | soil, gravel |
| Upper Khumbu | 6 December 2009 | 27.9998°N 86.8511°E | 5,280 | gravel |
| Mid-Khumbu | 5 December 2009 | 27.9874°N 86.8405°E | 5,180 | sand, rock |
| Lower Khumbu | 4 December 2009 | 27.9763°N 86.8304°E | 5,100 | silt, rock |
| Eyjafjallajökull | 15 April 2010 | 55 km east of crater | 100 | ash |
| Mangatoetoenui | 5 March 2010 | 39.275°S 175.590°E | 2,450 | fine and gravel sized tephra |
| Region, Glacier | Principal Minerals | Na2O | MgO | Al2O3 | SiO2 | CaO | MnO | Fe2O3 |
|---|---|---|---|---|---|---|---|---|
| Switzerland | ||||||||
| Findelen (n=9) | quartz, amphibole, plagioclase | 2.42 | 8.10 | 13.70 | 54.34 | 5.11 | 0.13 | 7.82 |
| Zmutt (n=15) | quartz, plagioclase, serpentine | 2.5 | 5.96 | 13.65 | 53.91 | 5.92 | 0.10 | 5.96 |
| Nepal | ||||||||
| Khumbu (n=14) | feldspar, mica, quartz | 2.60 | 1.76 | 13.68 | 60.76 | 5.82 | 0.08 | 4.43 |
| Ngozumpa (n=8) | quartz, feldspar, mica | 2.64 | 1.30 | 11.93 | 56.05 | 10.67 | 0.07 | 3.48 |
| Iceland | ||||||||
| Eyjafjallajökull [after 51] | cristobalite, anorthite, pyroxene | 5.01 | 2.3 | 14.87 | 57.98 | 5.5 | 0.24 | (FeO 9.75) |
| New Zealand | ||||||||
| Mangatoetoenui (n=2) | plagioclase, pyroxene | 2.89 | 4.23 | 15.00 | 55.54 | 7.07 | 0.12 | 7.69 |
| Study Region | Sensor, Product | Date, Method / Use |
|---|---|---|
| Switzerland | ASTER, AST_07XT | 29 July 2004, reflectance |
| ASTER, AST_05 | 21 July 2006, TIR SiO2 | |
| ASTER, AST_08 | 7 July 2010, surface temperature | |
| Landsat TM | 1 September 2010, imagery | |
| Nepal | ALI | 4 October 2010, imagery |
| ASTER, AST_07XT, AST_05, AST_08 | 29 November 2005, reflectance, TIR SiO2, surface temperature | |
| Hyperion | 13 May 2002, hyperspectral reflectance | |
| Iceland | ASTER, AST_07XT, AST_05, AST_08 | 25 August 2010, reflectance, TIR SiO2, surface temperature |
| Hyperion | 24 September 2001, hyperspectral reflectance | |
| Landsat ETM+ | 25 August 2010, surface temperature | |
| MODIS, MOD09GA | 28 August 2010, reflectance | |
| New Zealand | ASTER, AST_07XT, AST_05, AST_08 | 9 January 2008, reflectance, TIR SiO2 surface temperature |
| Hyperion | 13 September 2009, hyperspectral reflectance |
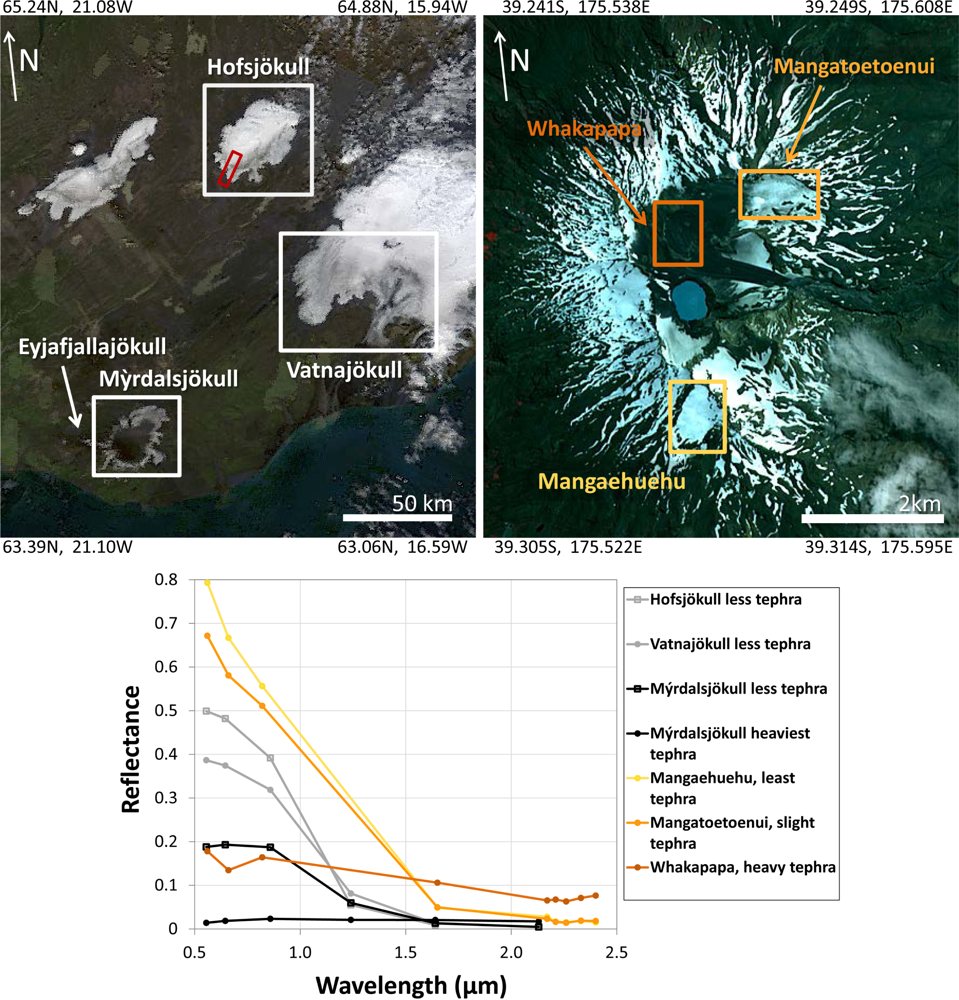
| Region, Date | Glacier | Satellite Reflectance per Spectral Band, (Band median wavelength shown directly below band number (μm)) | ||||||||
|---|---|---|---|---|---|---|---|---|---|---|
| MOD1 0.469 | MOD2 0.555 | MOD3 0.645 | MOD4 0.859 | MOD5 1.24 | MOD6 1.64 | MOD7 2.13 | ||||
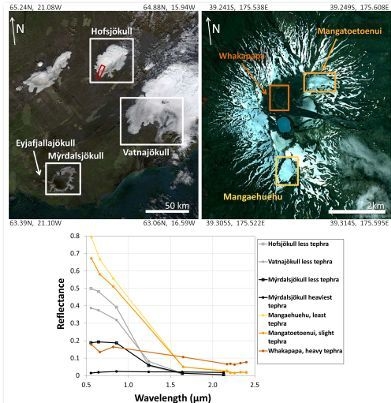
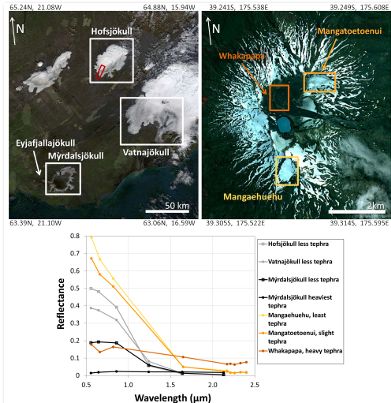
| Iceland 28 August 2010 | Hofsjökull, less tephra n=35pts @ 500m | 0.469 (0.054) | 0.499 (0.059) | 0.482 (0.057) | 0.392 (0.042) | 0.055 (0.008) | 0.009 (0.003) | |||
| Vatnajökull, less tephra n=419pts @ 500m | 0.380 (0.047) | 0.387 (0.050) | 0.374 (0.047) | 0.319 (0.034) | 0.081 (0.053) | 0.013 (0.004) | 0.005 (0.002) | |||
| Mỳradalsjökull, less tephra n=42pts @ 500m | 0.172 (0.013) | 0.188 (0.014) | 0.193 (0.015) | 0.187 (0.015) | 0.060 (0.009) | 0.013 (0.001) | 0.005 (0.002) | |||
| Mỳradalsjökull, heavy tephra n=203pts @ 500m | 0.014 (0.005) | 0.019 (0.005) | 0.023 (0.005) | 0.021 (0.024) | 0.021 (0.002) | 0.017 (0.002) | ||||
| AST1 0.56 | AST2 0.66 | AST3 0.82 | AST4 1.65 | AST5 2.17 | AST6 2.21 | AST7 2.26 | AST8 2.33 | AST9 2.40 | ||
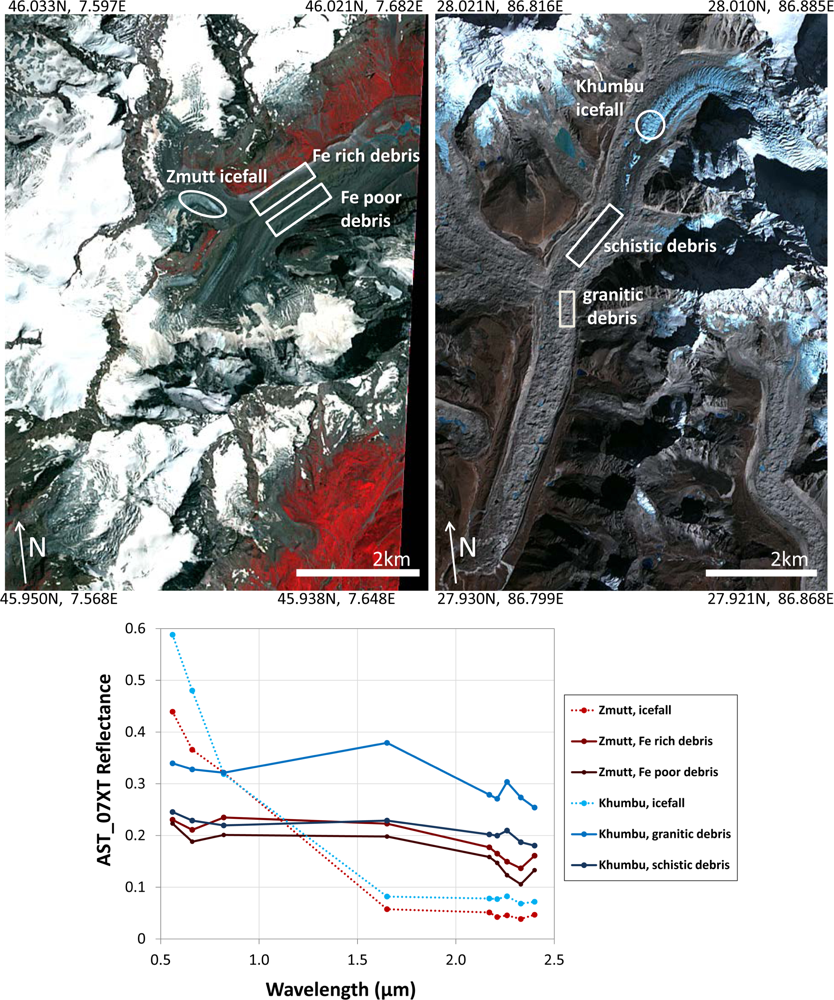
| Switzerland 29 July 2004 | Zmutt, icefall n=65 @ 15m, 16 @ 30m | 0.439 (0.087) | 0.366 (0.075) | 0.321 (0.056) | 0.058 (0.006) | 0.051 (0.005) | 0.042 (0.004) | 0.046 (0.003) | 0.038 (0.006) | 0.047 (0.002) |
| Zmutt, northern debris n=106 @ 15m, 28 @ 30m | 0.230 (0.008) | 0.211 (0.011) | 0.235 (0.011) | 0.223 (0.004) | 0.178 (0.004) | 0.165 (0.004) | 0.149 (0.003) | 0.137 (0.003) | 0.161 (0.005) | |
| Zmutt, southern debris n=354 @ 15m, 84 @ 30m | 0.223 (0.014) | 0.188 (0.014) | 0.201 (0.011) | 0.198 (0.006) | 0.158 (0.007) | 0.147 (0.006) | 0.123 (0.006) | 0.106 (0.006) | 0.133 (0.007) | |
| Nepal 29 November 2005 | Khumbu, bare ice n=475@15m,144@30m | 0.588 (0.132) | 0.480 (0.103) | 0.319 (0.055) | 0.082 (0.008) | 0.078 (0.008) | 0.077 (0.008) | 0.082 (0.008) | 0.068 (0.008) | 0.072 (0.007) |
| Khumbu, heavy schistic debris n=1052 @ 15m, 270 @ 30m | 0.245 (0.038) | 0.229 (0.036) | 0.219 (0.033) | 0.229 (0.028) | 0.202 (0.020) | 0.200 (0.021) | 0.210 (0.022) | 0.187 (0.022) | 0.180 (0.021) | |
| Khumbu, heavy granitic debris n=652 @ 15m, 165 @ 30m | 0.339 (0.061) | 0.328 (0.063) | 0.321 (0.058) | 0.379 (0.053) | 0.279 (0.038) | 0.271 (0.039) | 0.304 (0.041) | 0.274 (0.040) | 0.254 (0.039) | |
| New Zealand 9 January 2008 | Mangaehuehu, least tephra n=433 @ 15m, 108 @ 30m | 0.793 (0.042) | 0.667 (0.038) | 0.557 (0.029) | 0.049 (0.004) | 0.028 (0.014) | 0.017 (0.011) | 0.015 (0.012) | 0.018 (0.010) | 0.015 (0.016) |
| Mangatoetoenui, slight tephra n=419 @ 15m, 104 @ 30m | 0.672 (0.058) | 0.581 (0.049) | 0.511 (0.034) | 0.050 (0.004) | 0.023 (0.011) | 0.016 (0.013) | 0.014 (0.009) | 0.019 (0.010) | 0.018 (0.017) | |
| Whakapapa, heavy tephra n=333 @ 15m, 77 @ 30m | 0.178 (0.015) | 0.135 (0.013) | 0.164 (0.011) | 0.106 (0.009) | 0.065 (0.015) | 0.067 (0.014) | 0.063 (0.013) | 0.071 (0.014) | 0.076 (0.017) | |
| Region, Date | Glacier | Temp (°C) | Std. Dev. | No. pixels | Δ Tdebris – Tbareice (°C) |
|---|---|---|---|---|---|
| Switzerland 7 July 2010 | Gornergletscher, upper, slight dust | 2.2 | (0.5) | 42 | 26.6 |
| Gornergletscher, lower, bare ice | 3.5 | (0.5) | 23 | ||
| Zmuttgletscher, heavy debris | 28.8 | (1.4) | 40 | ||
| Nepal 29 November 2005 | Khumbu, bare ice | −4.9 | 1.8 | 19 | 12.7 |
| Khumbu, heavy schistic debris | 6.2 | 2.4 | 40 | ||
| Khumbu, heavy granitic debris | 7.8 | 2.1 | 14 | ||
| Iceland 25 August 2010 | Vatnajökull*, light tephra | −3.3 | (0.3) | 6915 | 5.9 |
| Mỳradalsjökull, light tephra | 1.3 | (0.3) | 68 | ||
| Mỳradalsjökull, moderate tephra | 1.8 | (0.4) | 119 | ||
| Mỳradalsjökull, heavy tephra | 2.6 | (0.5) | 455 | ||
| New Zealand 9 January 2008 | Mangaehuehu, least tephra | 3.2 | 0.5 | 14 | 15.2 |
| Mangatoetoenui, slight tephra | 3.8 | 1.1 | 12 | ||
| Whakapapa, heavy tephra | 18.4 | 2.8 | 10 |
Share and Cite
Casey, K.; Kääb, A. Estimation of Supraglacial Dust and Debris Geochemical Composition via Satellite Reflectance and Emissivity. Remote Sens. 2012, 4, 2554-2575. https://doi.org/10.3390/rs4092554
Casey K, Kääb A. Estimation of Supraglacial Dust and Debris Geochemical Composition via Satellite Reflectance and Emissivity. Remote Sensing. 2012; 4(9):2554-2575. https://doi.org/10.3390/rs4092554
Chicago/Turabian StyleCasey, Kimberly, and Andreas Kääb. 2012. "Estimation of Supraglacial Dust and Debris Geochemical Composition via Satellite Reflectance and Emissivity" Remote Sensing 4, no. 9: 2554-2575. https://doi.org/10.3390/rs4092554