Article

FUEGO — Fire Urgency Estimator in Geosynchronous Orbit — A Proposed Early-Warning Fire Detection System

1
Space Sciences Lab, UC Berkeley, 7 Gauss Way, Berkeley, CA 94720, USA
2
Physics Division, Lawrence Berkeley National Laboratory, Berkeley, CA 94720, USA
3
College of Natural Resources, UC Berkeley, Berkeley, CA 94720, USA
4
Cooperative Institute for Meteorological Satellite Studies, UW-Madison, Madison, 1225 W. Dayton St., Madison, WI 53706, USA
*
Author to whom correspondence should be addressed.
Remote Sens. 2013, 5(10), 5173-5192; https://doi.org/10.3390/rs5105173
Submission received: 12 July 2013 / Revised: 27 September 2013 / Accepted: 9 October 2013 / Published: 17 October 2013

Abstract

:
Current and planned wildfire detection systems are impressive but lack both sensitivity and rapid response times. A small telescope with modern detectors and significant computing capacity in geosynchronous orbit can detect small (12 m2) fires on the surface of the earth, cover most of the western United States (under conditions of moderately clear skies) every few minutes or so, and attain very good signal-to-noise ratio against Poisson fluctuations in a second. Hence, these favorable statistical significances have initiated a study of how such a satellite could operate and reject the large number of expected systematic false alarms from a number of sources. Here we present both studies of the backgrounds in Geostationary Operational Environmental Satellites (GOES) 15 data and studies that probe the sensitivity of a fire detection satellite in geosynchronous orbit. We suggest a number of algorithms that can help reduce false alarms, and show efficacy on a few. Early detection and response would be of true value in the United States and other nations, as wildland fires continue to severely stress resource managers, policy makers, and the public, particularly in the western US. Here, we propose the framework for a geosynchronous satellite with modern imaging detectors, software, and algorithms able to detect heat from early and small fires, and yield minute-scale detection times.

1. Introduction

1.1. Overview

Fire managers have to make difficult decisions about the allocation of resources for fire suppression. Consideration of the number of fires, their location, and potential to damage homes, impact human life, and harm natural resources are used in the allocation of suppression resources. In the US, this is done at the Boise National Interagency Fire Center (NIFC) for all federal agencies. The ability to provide fast, reliable information on fire locations, especially when they are very small (<0.2 acres) would enhance fire management greatly, and potentially lower fire suppression costs. Currently fire managers rely on a diverse set of information to assess the location of fires. These include information on lightning strike locations, observations of fires from aircraft and fire lookouts, and on the ground observations from field personnel observations and the public. This network of data is not ideal for catching small, nascent fires, and the US federal government spends approximately one billion dollars annually on fire suppression (two billion dollars in anticipated in 2012, a record amount) and this does not include the losses of property such as homes and other structures (see, e.g., http://www.NIFC.gov). The current system for fire detection would be significantly enhanced by a platform that could detect the location of small, nascent fires across very large areas. In this paper we describe a first study of aspects of a next-generation technique of fire detection that holds the potential to give an immediate quantitative measure of intensity and rate of growth of every fire within the field of view. We use California as an example. We intend this paper to help open a broader discussion which will lead to more detailed and quantitative set of measurements that will illuminate the exact applicability and viability of these ideas.

1.2. Technological Enablers and Challenges

Over the last decade, advances in infrared imagers, particularly in Mercury-Cadmium-Telluride (“HgCdTel”), enables the regular use and implementation of arrays of multiple 2 K × 2 K pixel2 (or larger) imagers. Such arrays allow larger areas to be studied for small changes in brightness, which may be due to a new fire. Fire signatures can be distinguished from a number of backgrounds and characterized by algorithms we discuss here. These algorithms and tests are essential, as the statistical or systematic fluctuations due to small changes could lead to a small excess (∼2% to 3%) in the 3.9 micron band that could swamp our signal. Hence here we describe designs and algorithms that hold promise for suppressing the quantity and quality of false alarms. We also describe a number of other techniques that should assure our satellite works as desired.
We planned, at UC Berkeley’s Hopland Field Station, a period of measurements of background and fire, and observed same, to test our algorithms with a more immediate and well-controlled data set.

1.3. Fire in California

The western United Sates and California in particular have specific and urgent need to assess fire outbreaks. Fire has long been a part of Californian landscapes. In many fire-adapted ecosystems, fire promotes vegetation and wildlife diversity, releases nutrients into the soil, and eliminates heavy accumulation of underbrush that can fuel catastrophic fires. However, a century of fire suppression has left some areas of the state prone to catastrophic fires, especially in forests that once experienced frequent, low-moderate intensity fire regimes [1]. Large, high intensity fires also occur almost every year in southern California chaparral. These fires are pushed by severe Santa Ana winds placing thousands of homes at risk annually. Additionally, projected California climate changes are likely to have large consequences on the amount and type of fire in the state [24].
Indeed, California provides an example in the American West of extremes in fire extent and predicted change with a changing climate. Figure 1 displays one scenario of increased fire in California with increases in temperature. Here the projected increase in potential area burned is given by one Intergovernmental Panel on Climate Change climate model (called the Geophysical Fluid Dynamics Laboratory (GFDL) model), under one emission scenario (called the A2 scenario, which calls for regionally oriented economic development and high emissions). In Figure 1, darker oranges and reds suggest up to a 10-fold increase in potential area burned in 2020, 2050 and 2085. These data are modeled solely on climate projections and do not take changes in landscape and fuel sources into account; newer fire risk projections are currently being produced that take more landscape information into account. Despite this shortcoming, the extent and severity of fire will clearly continue to be of critical importance to Californian landscapes. Forest and chaparral landscapes are particularly at risk in the future [5].
Currently, California, like other western states, has field crews, some fire-retardant bombers, and firefighting personnel but lacks a reliable deployed method for the very early (seconds or minutes after threshold) detection of the initial phase of fire outbreak.

1.4. Current Wildland Fire Detection

Fire detection in the US was once based on people staged in lookouts that were dispersed throughout the wildlands in the US. This practice continued for over 50 years but has diminished in the last 10–20 years. Today many forest managers have access to a lightning detection network (Vaisala Inc., see http://www.vaisala.com/nldn30/). This system estimates the location of lightning discharges and provides a map of their locations. With this map, forest managers can dispatch aircraft to determine if lightning fires occurred or field personnel can be sent to the locations to determine if a fire started. In some areas fire lookouts are still used, especially in areas with high fire incidence. With the rapid increase in cell phones, many fires are also reported by the public. There is a time lag for all of these systems in their ability to accurately report fire locations. Thus, early fires are often undetected, and the current fire detection system could be improved. A system that could do this for large geographical areas and in short time frames would significantly enhance fire management.

1.5. Fire Spreading Rate

Wildland or near-urban fire spread rates vary by more than two orders of magnitude. Figure 2 shows the diversity of spread rates, from less than a foot per minute to more than a 100 feet per minute. Some of the variables in the models include wind speed, fuel, and moisture content. A fire starting in an area with abundant dry fuel and Santa Ana winds would tend to spread quickly, and there also are definite changes within one fire of the spread rate. For example, the Oakland Fire smoldered overnight, at a very slow spread rate (with a potentially detectable FUEGO signal), and then erupted into a catastrophe driven by Diablo Winds. Detection on minute scales would be useful in many cases. However, the response time of airborne fire-retardant bombers is probably about 15 min for fires relatively near such bomber airports, so this response time factor sets a lower floor in many cases on how quickly we can react. If a fire spreads at 100 feet or more per minute (such as might occur in grass during Santa Ana conditions,) responding on minutes time scales gives times for fire retardant bombers to respond on their time scale, and the fire is still manageable by the time they arrive. If the alert arrives in 15 min or (worst case) half hour until fire-retardant bombers reach the fire, under such conditions, the fire can approach km-scale sizes or larger, and would be much more difficult to manage, compared to the 500-yard size with a one minute alert. On the other hand, if FUEGO detects a fire and can monitor how large it is and how fast it is spreading, such data will be useful in planning and managing the fire-fighting efforts.

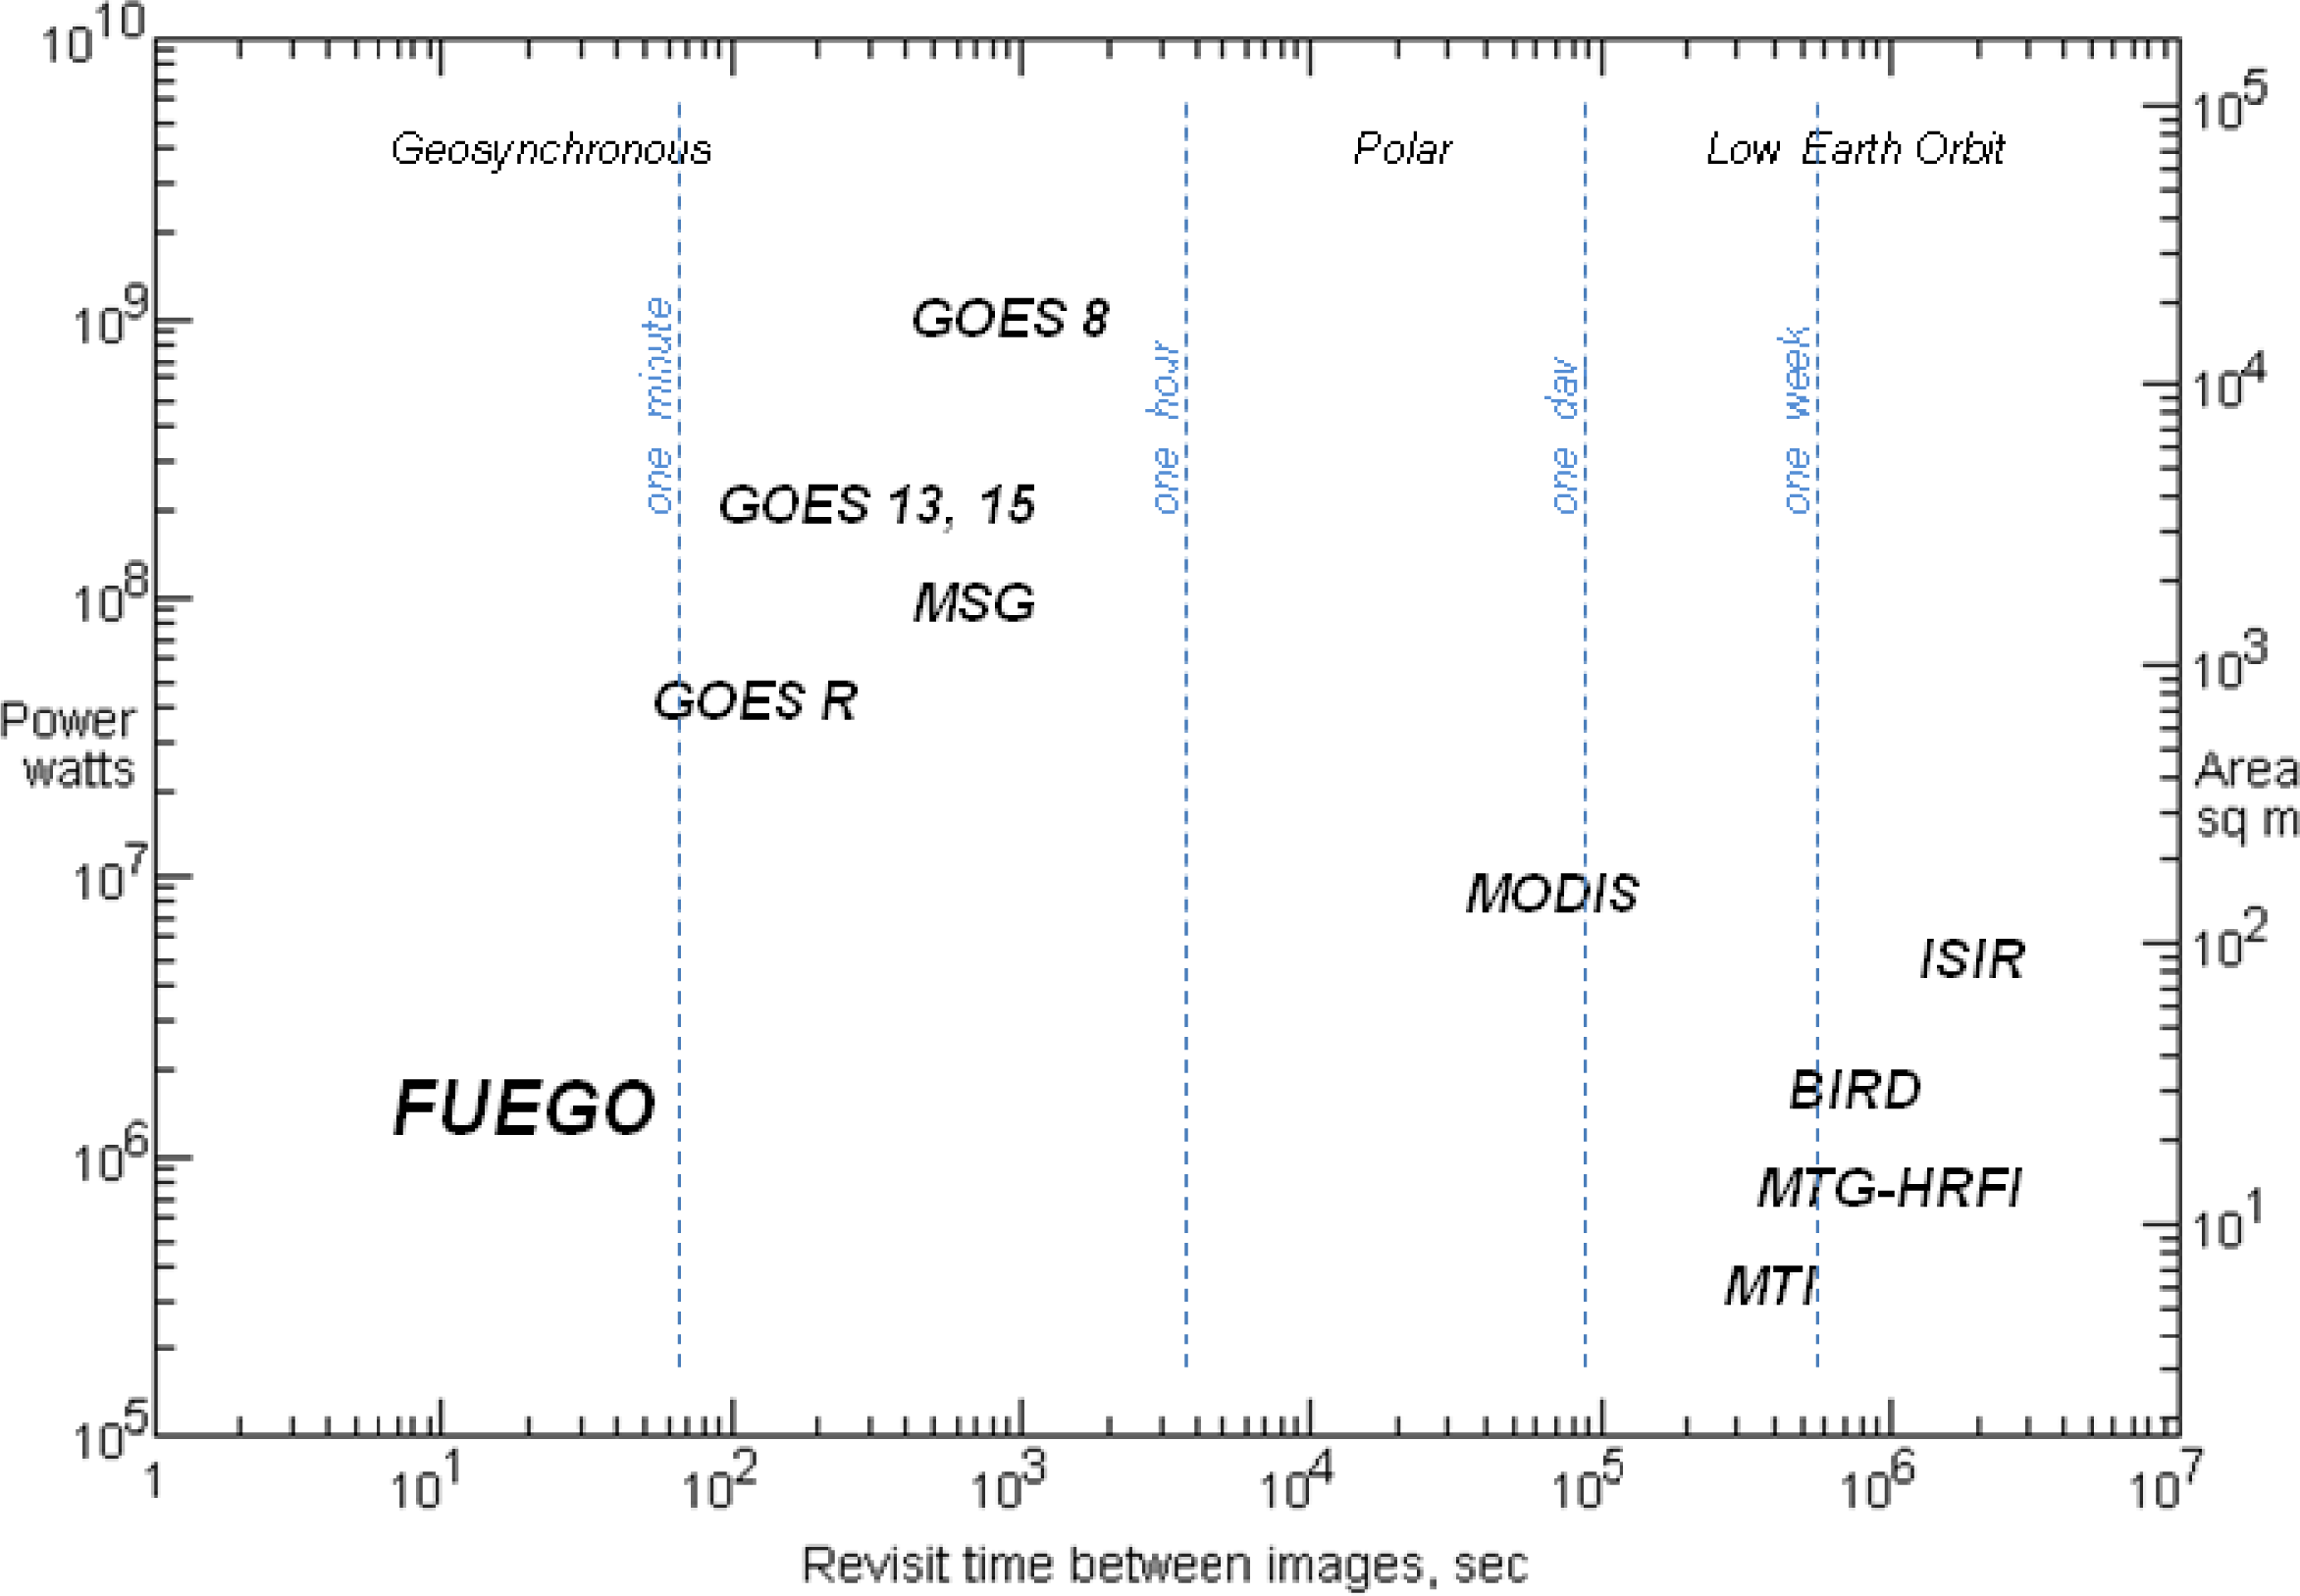
1.6. Fire Detection with Remote Sensing

Atmospheric transmission windows in the near and mid-infrared are adequate for detecting fires. Fires cannot be seen under heavy cloud cover, and can be detected with reduced sensitivity under smoke and thin clouds, depending on the wavelength of the detectors, smoke particulate size, and moisture content of the atmospheric column. The most serious conditions for California are the autumnal Santa Ana winds, which are persistent, clear, and very dry. Under these conditions our proposed satellite detection and warning system might soon pay for itself in savings of lives, property, and fire-fighting costs.

1.6.1. Fire Detection from Low Earth Orbit

The past fifty years of earth observation from satellite imagery has shown the value of space based detection and measurement of fire outbreaks. For example, the MODIS instruments ( http://modis.gsfc.nasa.gov/about/) on the Aqua and Terra satellites routinely maps fires, with 1 km size pixels. MODIS surveys any given region on Earth approximately once every one to two days. MODIS has 36 bands, and its data from several of its bands were used to derive and inform our algorithms described later. Because of the poor time resolution of the MODIS sensors, such detection does not help in early warning.
ASTER is one of the five state-of-the-art instrument sensor systems on-board the Terra satellite launched in December 1999. A consortium of Japanese government, industry, and research groups built it. ASTER monitors cloud cover, glaciers, land temperature, land use, natural disasters, sea ice, snow cover and vegetation patterns at a spatial resolution of 15 to 90 m. The multispectral images obtained from this sensor have 14 different bands, including near infrared, short wave infrared and thermal infrared. An ASTER image of the Grand Prix Fire in San Bernardino National Forest, California in October, 2003, is shown in Figure 3. The Grand Prix fire is a typical California fire. It began in dense brush, and burned through foothills, over mountain tops into a number of canyons that are surrounded by homes. It destroyed 13 homes (including two mobile homes) and damaged nine others in Alta Loma, CA. Such fires have routinely caused hundreds of millions of dollars in damages a year over the past 20 years, with some major fires causing over a billion dollars of damage in lost housing.
Such low-earth orbit satellites as ASTER and MODIS can find fires, but a given area of interest can only be viewed on the sensor’s return schedule, and the target fires are typically large. The BIRD Satellite of the German DLR (e.g., [79]) was launched as an optimized fire detection satellite in 2002, in a 568 km altitude orbit. With its pixels projected to a linear dimension of 185 m on earth, it could detect a 4-meter radius, hot fire on the ground with no other false alarms in the background. BIRD used HgCDTel 2 × 512 pixel2 (nearly) linear array. “Easter Fires” across Austria were easily detected. Bush fires in Australia proved to be a source of signal. This satellite was a potential pathfinder as part of an ESA FUEGO Satellite [10] but this proposed satellite was never realized.

1.6.2. Fire Visibility from Geosynchronous Orbit

The outstanding work done by the team at the Cooperative Institute for Meteorological Satellite Studies (CIMSS) at UW-Madison, and in particular Elaine Prins, who started doing geostationary fire detection using Geostationary Operational Environmental Satellites (GOES)-8 data in 1995, was the seminal effort to introduce regular geostationary detection of fires from space [11]. That work led to an operational fire detection and characterization product for current GOES as well as Eumetsat’s Meteosat Second Generation (MSG) and Japan’s Multi-function Transport SATellite (MTSAT). Support for another GOES-like geostationary platform, Korea’s Communication, Ocean and Meteorological Satellite (COMS), has also been implemented. The fire detection and characterization data provided by CIMSS’ WildFire Automated Biomass Burning Algorithm (WFABBA) has found use in a variety of applications, from real time monitoring of wildland and agricultural fires to use as emission source information for air quality models. The algorithm provides information about the fires, including detection confidence level, and in cases where it appears appropriate the instantaneous fire power, size, and temperature estimates. It corrects for atmospheric attenuation and attempts to identify opaque clouds and viewing conditions that hamper or prevent fire detection. The algorithm’s primary strength is its ability to quickly process real-time data from a variety of satellite platforms, though it is limited by the sensitivity and optical properties of the data acquisition instrument and the size of the pixel footprint (4 km × 4 km = 16 km2—at the sub-satellite point to ∼20–25 km2 over much of the United States), of which fires often represent a very small fraction.
Other groups have succeeded at fire detection with geostationary platforms as well. As noted earlier, [12] using MSG data, presents and analyzes time sequence 3.9 micron heat data and performs change detection using a Kalman filter. This group could detect fires of 75 MW.
Previous work, including [13] demonstrated the potential for utility of images from MSG2-SEVIRI in fire detection and fire-fighting management. During the summer of 2007, a number of severe fires consumed 6% of Greece’s vegetated land Images. This group used existing fire-detection algorithms for SEVIRI and was able to detect 82% of wildfires in Greece at this epoch, with a 1% false alarm rate.
Our aim is to develop one or more on-orbit continuous sensors keeping the Continental United States (CONUS) or a more restricted region such as the Southern California Fire Critical Region under nearly continuous study. The goal of FUEGO is to lower the hundreds of megawatts of fire radiative power sensitivity of GOES and other current geostationary platforms down to megawatts with a dedicated system. GOES was designed as a general-purpose climatological and weather monitoring system, and was not specifically designed to detect fires, and thus does not have the false candidate mitigation, the exposure cadence, the re-imaging, and other aspects of a dedicated fire detection instrument.

1.6.3. GOES R and Fires

While the Imager on the current GOES was not designed with fire detection in mind, the Advanced Baseline Imager (ABI) on the next generation GOES, known as GOES-R, had requirements for fire detection from the beginning of its development. ABI has a nominal resolution of 2 km at its subpoint and will scan the full disk every 15 min. Every 5 min it will provide coverage of CONUS, and “mesoscale” sectors will be available as often as every 30 s. The WFABBA team from CIMSS developed the ABI Fire Detection and Characterization Algorithm (FDCA). The FDCA takes advantage of the improved temporal and spatial coverage of ABI, and studies with proxy data suggest that, like the work by Van den Bergh, the typical minimum detectable power output is 75 MW. Like MSG, MTSAT, and the older GOES satellites that have been stationed over South America in recent years, ABI data will be remapped to a perfect geostationary projection. That remapping, in combination with the multi-purpose nature of GOES, does limit the ability of ABI to detect fires. While ABI can scan a region every 30 s, the FDCA was not specified as a product to be produced when “mesoscale” scans are made, so fire detections may not be available from NOAA on that schedule. Additionally, the “mesoscale” scan mode will primarily be used for thunderstorms, hurricanes, and other major events, and, at least as currently specified, will infrequently be used to monitor fires. As the next generation WFABBA the FDCA is expected to provide better fire detection and characterization, but ABI is still a multi-purpose instrument of which fire detection is just one of dozens of products.

2. The Proposed FUEGO System

In this paper, we describe the framework for a next-generation technique of remotely sensed fire detection that will give an immediate quantitative measure of intensity and rate of growth of every fire within the field of view. The FUEGO system combines several new technologies:
  • Multi-spectral sensing using newly available large format HgCdTe sensors;
  • Rapid mathematical classification of trends using subtraction of images from a few seconds to minutes before, dithering of images to improve resolution, and other spectral and time domain algorithms to reject false alarms;
  • Onboard software and computational hardware that can yield calibrated decisions;
  • Time-sensitive autonomous, multi-spectral adjustment of detection thresholds that deliver robust detections with low false alarm rates in the face of constantly varying conditions; and
  • Precision space craft pointing and replicability for robust image acquisition.
A comparison of a dedicated instrument such as FUEGO compared to the multi-purpose GOES satellites is shown in Figure 4. FUEGO can approach such sensitivity levels because of its near monopoly of the beam—the satellite does nothing other than search and study fires:
In this paper we present preliminary calculations and tests with real data of the design of a system to advance fire detection efficiency. By “efficiency” we mean not just a sensitive detection threshold, but also a low probability of false alarm rate, because without controlling false alarms, detections would be worthless. Here we specifically target the “first minute”—the initial outbreak during which a rapid remedial action could materially bring an outbreak (natural—or caused by arsonists) under early control where costs of life and property can best be controlled.
A systems-engineering description of fire detection urgency estimation criteria can be organized in terms of three factors: (1) the probability that an early detection event will become a fire; (2) the potential impact on lives and property loss of a fire at a location and time; and (3) the ability of a system to provide early outbreak warnings to responders. In this paper, we discuss factor 3. We have created a baseline concept for an early-warning satellite, and then, using existing archival images of relevant background scenes and fires, have tested our algorithms and systems for detecting a fire while ruling out false alarms.
The core of the proposed FUEGO system involves on-satellite calculations that utilize matched filters and/or successive least-square fittings of candidate fires to expected fire signatures. Each candidate single pixel then evolves into comparisons against tens or even hundreds of adjacent (in time and space) pixels, using the multi-spectral, multiple time sequences of images. That is, both the record of images (and previously detected false candidates) taken long before and almost immediately before the outbreak are compared to images taken at the outbreak. Such image acquisition strategy will mitigate against slowly varying noise in the background and troublesome areas that produce more false alarms. The proposed FUEGO system involves three necessary components: (1) signal to noise calculations, (2) rejection of false alarms, and (3) real-time treatment and follow-up of candidates.

2.1. Signal to Noise Calculations

Even a relatively small fire signal can yield a large signal to noise ratio against the solar background. Table 1 below indicates some of the supporting calculations that demonstrate this. Here we review the rationale for identifying payload elements that offer a minute-by-minute data harvest from which initial fire alerts can be obtained, with sufficient ancillary data to control the false alarm rate. The central concept we apply is to image the surveillance zone (assumed here to be the continental USA) in several wavebands that include the visible (for identifying daylight clutter) and in the near and/or mid-infrared where thermal emission from typical fires reaches its peak.
Four scenarios apply to this objective:
  • Fire detection at night; clear or lightly overcast sky;
  • Fire detection at night, heavy cloud cover and/or smoke;
  • Fire detection during daytime, clear or lightly overcast sky; and
  • Fire detection during daytime, heavy cloud cover and/or smoke.
Traditional fire detection from ground, air, and space uses smoke trail detection in the visible during daytime hours because such trails much larger than the fire and are highly visible in the 0.4–0.6 micron waveband. At night, the smoke trail is invisible and spaceborne fire sensing techniques use infrared wavebands, particularly the 3.9-micron band, when the highest sensitivity is needed.
Any spaceborne fire sensor system will face a far more challenging detection situation in cases 3 and 4 above, compared to the nighttime fire cases, owing to the Earth’s reflected sunlight. This radiation spectrum covers the visible and IR bands with a sufficiently high flux as to make the IR fire signal detection a challenge, especially from the 36,000 km distance of a geosynchronous satellite location. There are several components to this daytime interference: structural variation in albedo spectrum owing to spatial gradients in ground cover and terrain slopes; time variation in albedo owing to local wind, foliage motion, cloud motion and shadowing; and the enhanced noise level for a sensor system exposed to a bright foreground flux. For these reasons, we explore a simplified version of case 3 above, which is demanding enough to constrain the payload properties and detection planning issues, and (unlike scenario 4) is quantitative enough to allow a concrete basis for moving forward.
A key ratio is the observed signal from the fire divided by the signal from midday Earth. This ratio must be large enough that the fire detection can take place with a high probability of detection and a very low probability of false alarm. There are three principal contributors to this ratio: (a) the aperture of the telescope (which determines its light gathering power—and equally significant, its diffraction pattern size), (b) the waveband in which the image will be created, and finally (c) the finesse with which the image is pixelated. It is a common requirement in remote sensing (and in astronomy) that to recover the information in an image, the image should be sampled with at least two pixels across the diffraction pattern diameter.
Our experience teaches us that the noise in subtracting a reference image from a new image yields artifacts that are not distributed according to Poisson statistics, but these calculations are interesting and show a noise floor we hope to approach. That is, we have a signal that is about three percent of the background. We recognize that Table 1 portrays a highly simplified picture of any real fire situation. In reality a fire is parameterized by a number of important factors: smoke, visible emission, infrared opacity, etc., each of which modify its spectrum. We adopt our Planck spectrum formulation as a convenient way to explore alternative mission configurations, while planning, if funded, to extend this work to include a more realistic family of fire spectra, day illumination spectra, and clutter distributions. The positive results of the BIRD satellite finding 4 m × 4 m fires gives us some hope for this system.
The algorithms we describe in the following must then discover how signals that are a fraction of the background can be discovered against this background of Poisson and systematic noise.
To proceed towards a detailed detection strategy, we note that any moment we have many distinct evidence trails available onboard the sensor spacecraft: for example, we have (a) a succession of visible images from which a pixel-by-pixel variability index can be reliably estimated, to establish the effective noise level originating from glints, glare, cloud cover, and local wind-driven color and brightness changes; and (b) a succession of IR images whose statistical variability indicates the recent history and stability of the IR noise level. We also have the capability of making very small pointing (sub-resolution element) to dither the image and mitigate against artifacts of under-sampling. These IR data are of course also affected by local conditions but—in addition—they (unlike the visible) are highly sensitive to the outbreak of a small-scale fire.
A fire is detected at a position in the field when several conditions exist: (a) the visible noise level determined for that location is small and its trend line has only a small derivative; (b) the IR noise level for that same location is small and its trend line has only a small derivative; and (c) a new IR frame shows a statistically significant brightening at that location with no concomitant disturbance in its visible signature; (d) the candidate survives dithering and multiple image acquisition, to rule out subtraction artifacts.
For example if the previous dozen frames show a consistent noise level due to scene variability of 1%, and if a new IR frame shows a consistent 3% rise in signal for a highly localized region, the detection will be highly significant and the false alarm rate will be correspondingly low.

2.2. Rejection of False Positives

2.2.1. Utilizing Inherent Information in the Signal to Reject False Alarms

The proposed FUEGO method relies on finding critical differences between a pixel at various times and itself and its neighbors through a series of tests. That is, key art of FUEGO is to convert a single pixel event into dozens of independent confirmatory tests, with minimal re-imaging. First, the inherent background flux of each pixel needs to be determined. The pixel in its 3.9 micron band must be rising above the average of its 100 (or other number) previous trend points: its day/night pattern, for brightening and darkening, and shadows, and variations in land cover. The previous day/night trends and any standard hourly variations should be taken into account, as well as the variance of signals in itself through time. This we call the “self-test” since it depends only on the historical flux from the target spatial pixel.
Second, the pixel in its 3.9 micron band must depart from its eight immediately surrounding pixels at 3.9 microns. This is called the “Laplacian test” since the 2D Laplace operator is proportional to the difference I(center)—(1/8)*Sum(all eight surrounding pixels), and finds a spatial location that is starting to be anomalous from its neighbors.
Third, the Laplacian pixel flux in visible or NIR wavelengths should not be doing anything out of the ordinary. This eliminates false alarms from cloud cover changes and things that change the exterior illumination from sunlight.
Fourth, the cost-benefit test: Does a fire in this region cause significant damage to wildlands or civilization? What are the immediate and long-term costs that arise from this fire? Such a test is too complex to describe here, but could be created after some research.

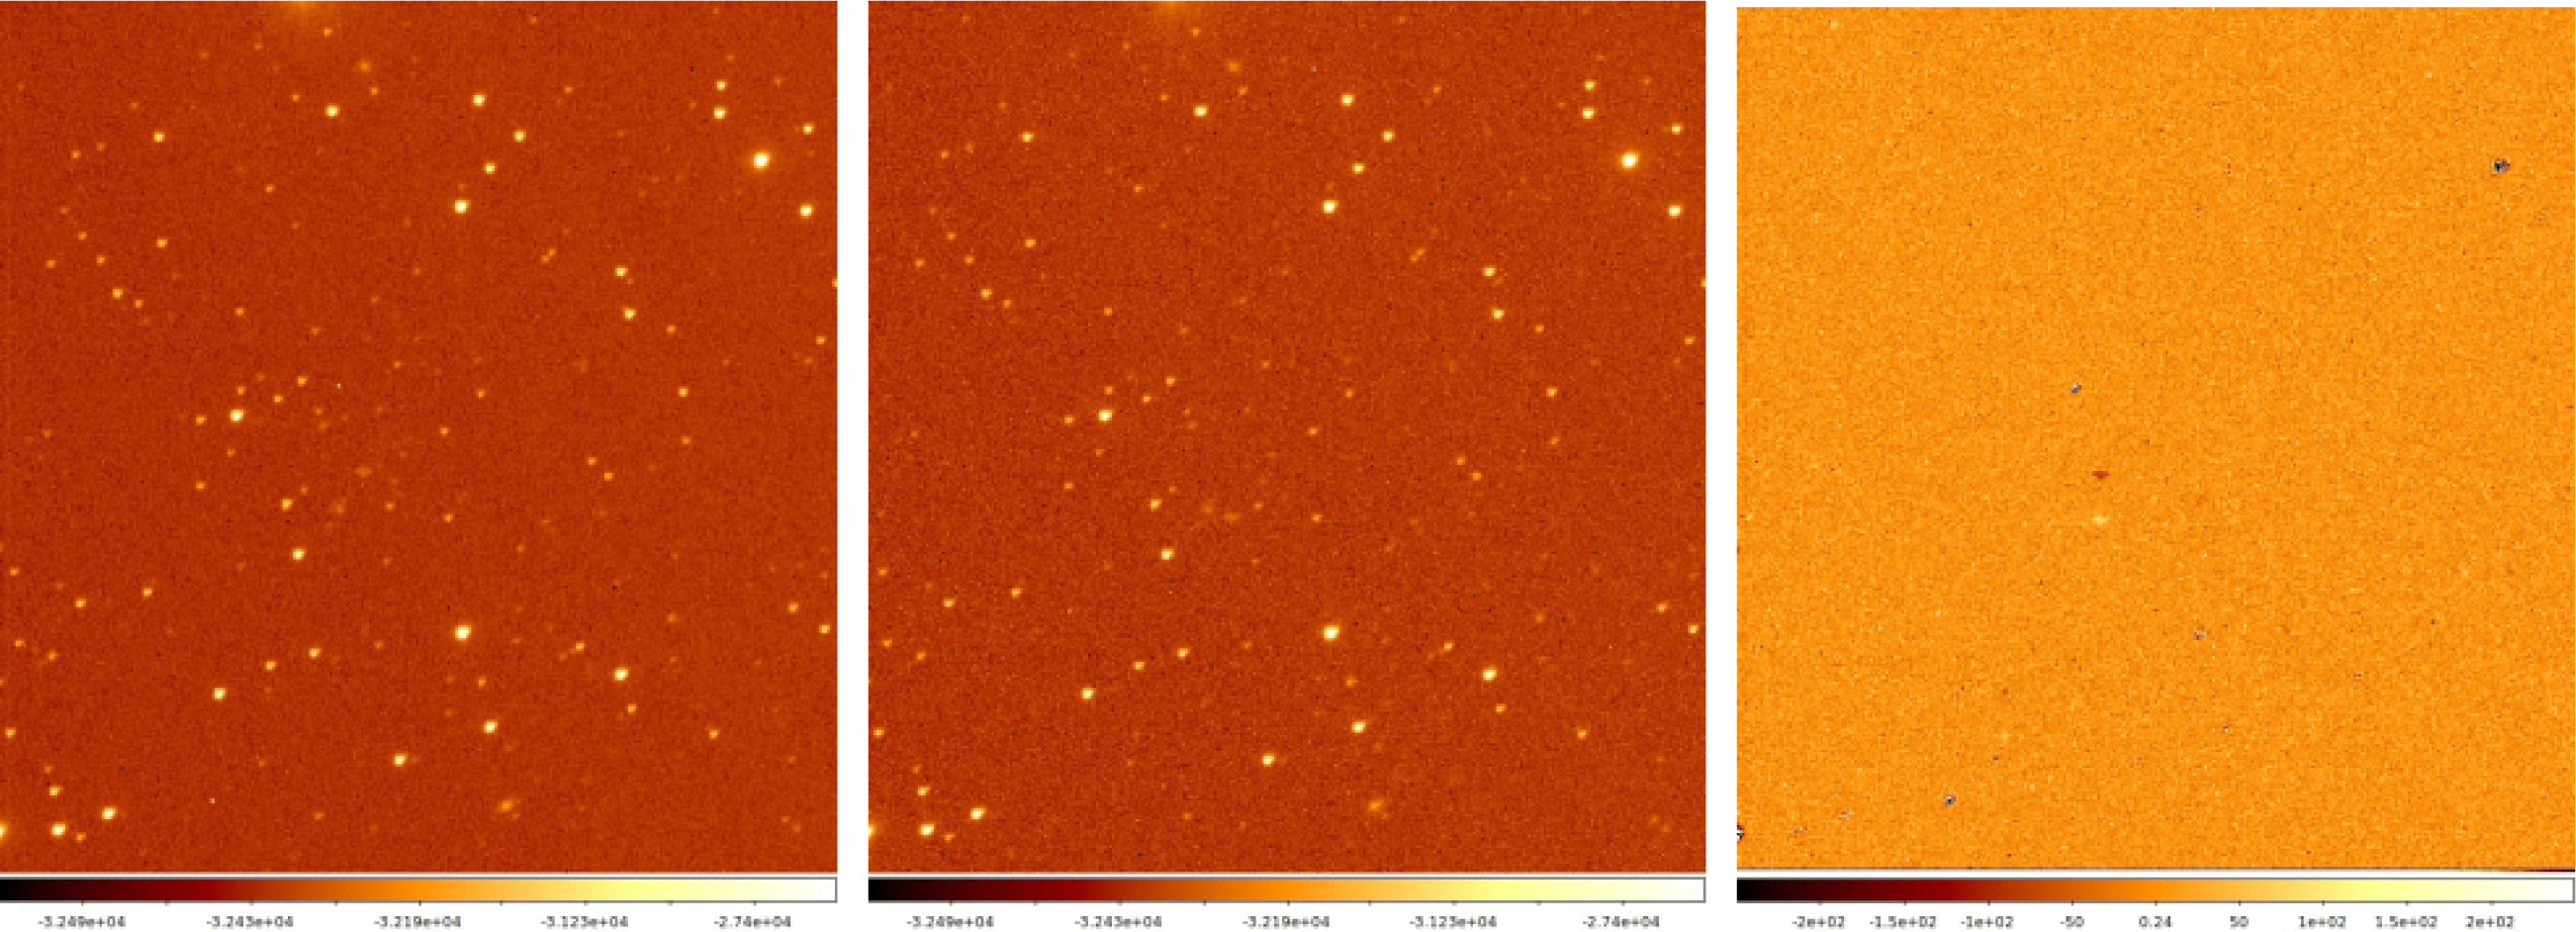
2.2.2. Image Subtraction and Related Algorithms

We describe below algorithms that hold potential for reducing the false alarm rate due to systematic and random effects in FUEGO images. As noted earlier, the power of FUEGO is its capabilities to compare many images of an event to rule out false alarms, by various algorithms. Pixel by pixel optimal subtractions of reference (images without fires) from newly acquired images gives tremendous power, and candidate fires must survive the subtraction process. For example, we plan a system where successive images, combinations of images, are subtracted from each other, and false alarms and candidates are characterized and tracked. Specifically, one embodiment is candidates are found from successive subtractions, and then must increase their signal through successive images, indicative of real fires. An initial statistical significance of at least 10 sigma above the noise in the subtracted image, might be the threshold before the next test. With modern databases and candidate handling protocols, such images may be archival and calculated from algorithms (more than ten minutes earlier) from previous images or may be as short as images from shorter than a few seconds or longer, compared to previous images. At this time, we have not specifically characterized the point spread function (PSF) stability between images or across images, but maintain more complex PSF fitting schemes (“Optimal Image Subtraction) described later in Section 3.3. In addition, rapid methods to create high quality reference images will be explored with future work, so small differences between new and reference images can be more readily detected.

2.2.3. Follow-Up of Candidates

We realize that fires can be single or adjacent pixel events. If for example, more than one spatially non-contiguous pixel lights up significantly above the noise, such an event is characterized as a false alarm. The “Laplacian” test above would be applied here. More capabilities for “drilling down” through the noise are available. For candidates that survive subtraction algorithms, we use the ratio of signal in the infrared wavelengths compared to optical signals to rule out changes in the background due to changes in solar irradiance. In addition, measurement of energy from the target in multiple bands, as a function of time, and fitting the time evolution of the difference signal to a template expected for fires in that region. That is, we measure the fire in Visual, and infrared K, and L band, for example, and monitor the evolution of the signal from first detection. Fires will have a definite signature and if they do not fit this signature, we ignore them.
With real time candidate handling, and precision space craft control, FUEGO has the capability of taking multiple images where each image is shifted by a small fraction of a pixel, and then measuring and analyzing the behavior of the candidate at slightly different pointings. The FUEGO camera would be moved by a fraction of a pixel, and a new image is acquired. This could rule out slower spreading fires. Other algorithms may be useful, such as subtracting a smoothed version (smoothing over, for example, four x four pixels) of the new image from itself (the “treated new image”), and then a smoothed image of the reference image from the reference images (the “treated reference image”), and then subtracting the treated reference image from the treated new image. This will eliminate noise due to low frequency changes in the background illumination. Finally, if necessary, the use of a ground system of lasers (infrared in bandwidths of interest) that point at the satellite (telescope has no moving parts), and allow images to be precisely aligned over successive pointings.

3. Exploring the Proposed FUEGO System

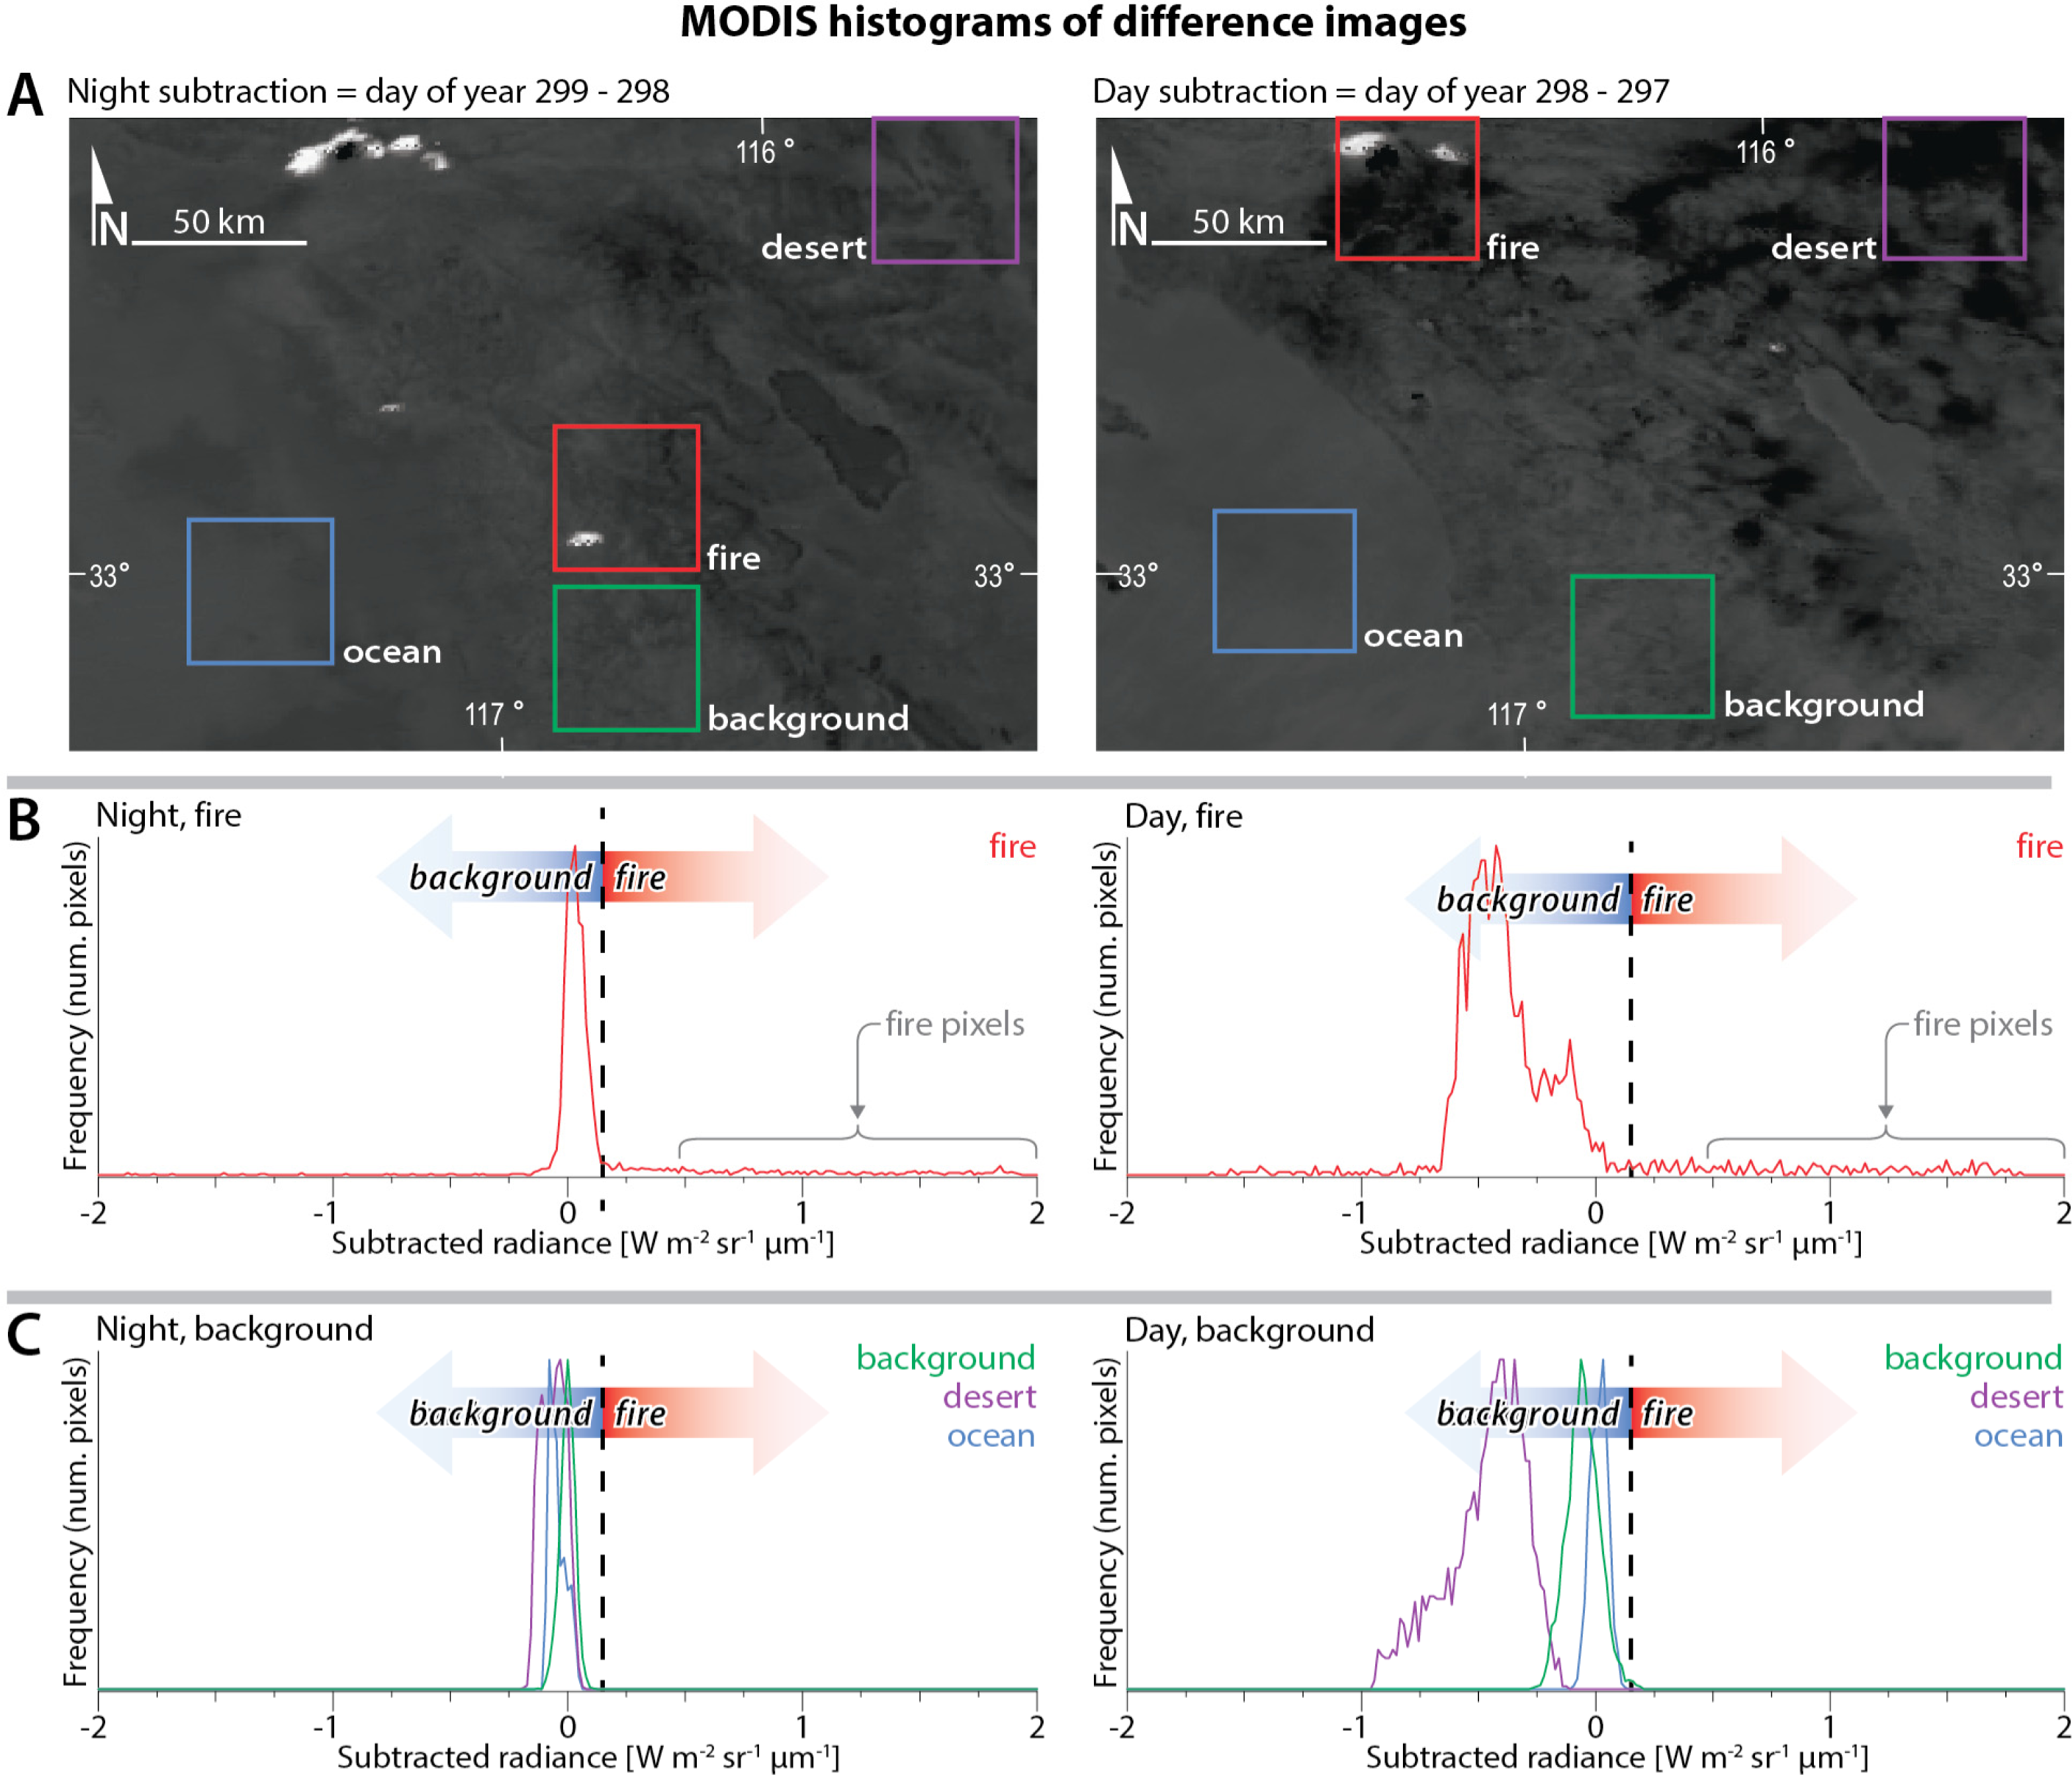
3.1. Examples of Fire Detection with MODIS

We used mid-wave infrared (4.05 μm) images from the MODIS instrument over the Cedar Fire to test our system. The Cedar Fire was a human-caused wildfire that burned out of control through a large area of San Diego County, CA, in October 2003. Below we present two scenarios (day and night) in which we detect fires. The first is a worst-case detection scenario, in which we detected fires within imagery collected in the middle of a clear day. All following dates will be reported in local time: Pacific Standard Time. The Cedar Fire was first reported on 24 October at 17:37, while the two day images were captured on 24 October at 11:50 and 25th at 12:30 (before and after the start of fire). We present the subtraction image and its histogram below in Figure 5. It is very apparent that the fire pixels fall far outside of the typical distribution of the background pixels despite the large time difference between the two exposures (approximately 24 h). In the second scenario, we detect a smaller nearby fire during the night (Figure 5A). The two images were captured on 23 October at 23:35 and October 24th at 22:50. In this case, the distribution of the background pixels is much narrower and thus the target fire pixels are clearly differentiated from the rest of the image.
Our calculations indicate that a 12 m2 fire at a temperature of 1,100° K is about 100 standard deviations larger than fluctuations against Poisson noise from subtractions of images immediately preceding outbreak, against the solar background light in a few second exposure. (A 12 m2 fire has at 1,100° K an energy output of one megawatt.) Work over the next two years will quantify and understand false alarm sources and their time dependence whose signal is 100 standard deviations above background fluctuations. In particular, how do the false alarms scale from, say “zero” for the subtraction of the same image from itself, with zero time delay, to the wider distribution of pixel residuals we see on subtraction of images from successive days. The next section explores subtractions with different time intervals between images. Figure 6 below shows the results of subtractions of images between successive days from the MODIS satellite.

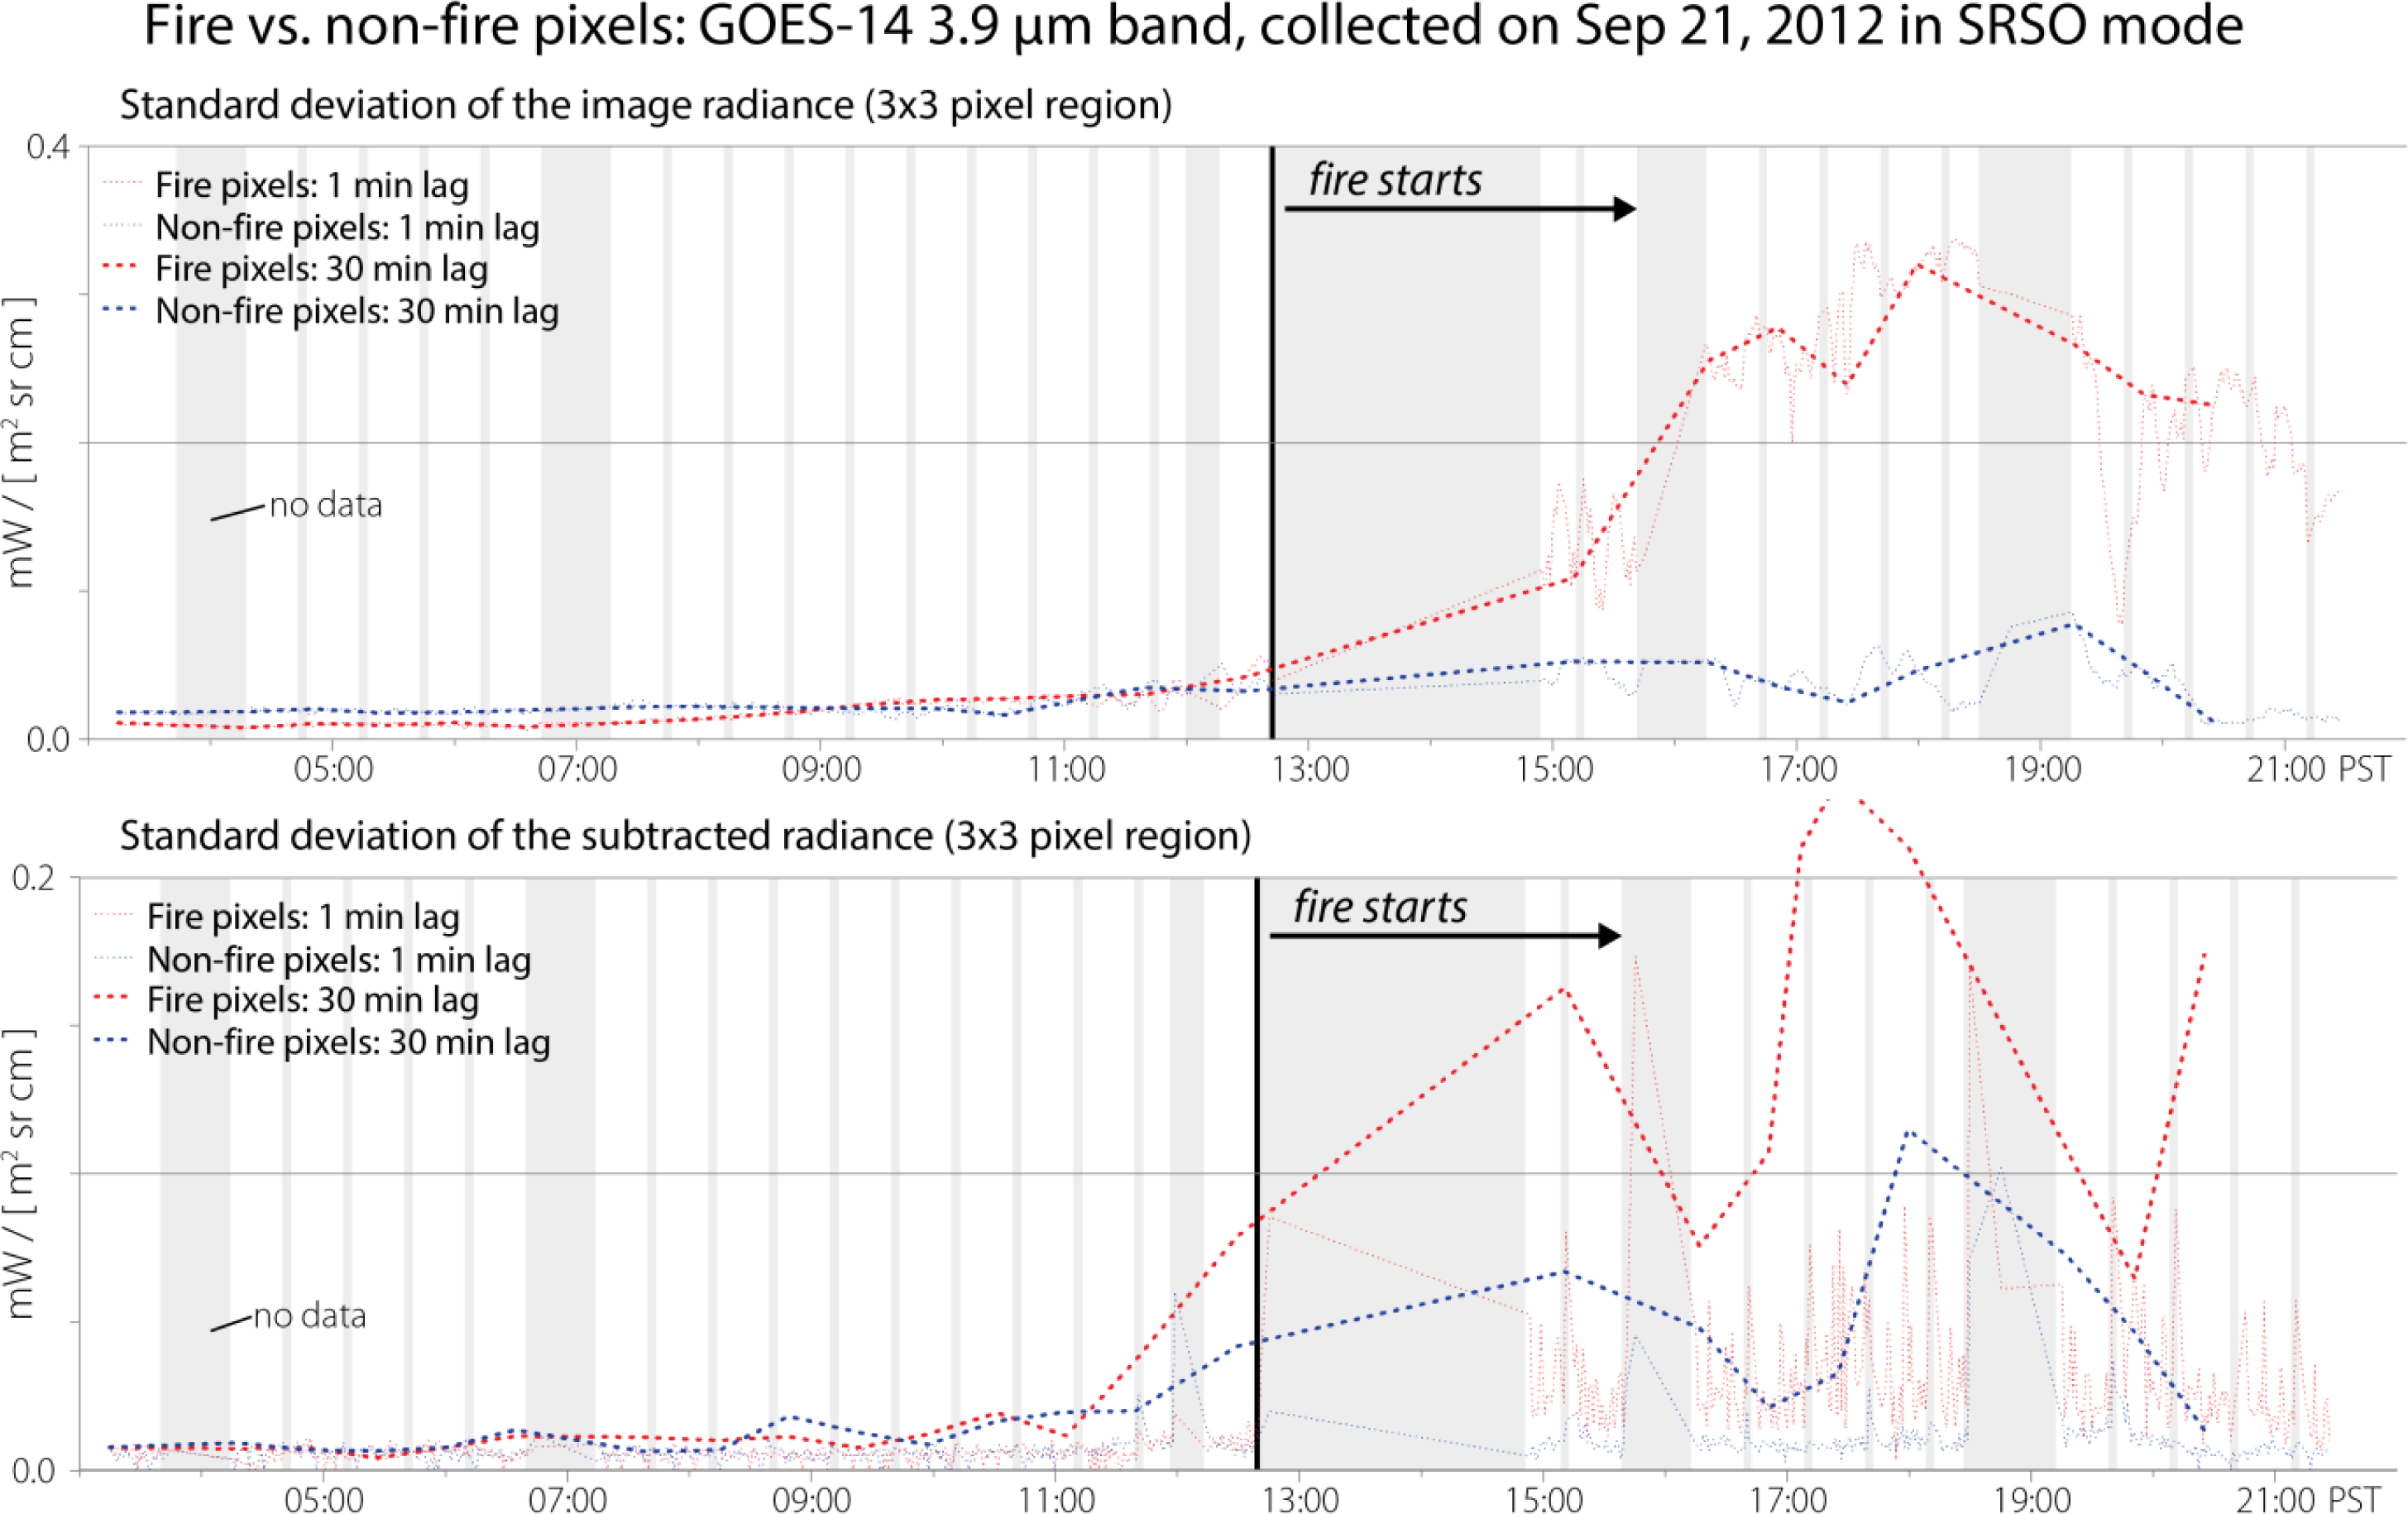
3.2. Shorter Time Gaps between Images Reduce Standard Deviation of the Background in Subtracted Images

We used GOES imagery to test whether background in subtraction images could be effectively eliminated by decreasing the time delta between image acquisitions. The temporal frequency of the GOES imager can be programmed to a special schedule known as Super Rapid Scan Operation (SRSO), during which an area of about 1,500 by 1,500 km is scanned every minute. We analyzed band 2 (3.9 μm) of the SRSO data collected by GOES-14 to study how the temporal frequency affects image subtraction, and in particular, how it affects the non-fire background pixels. In total, we analyzed a total of 714 images that span approximately 19 hours of the day: from 3:14 to 21:26 Pacific Standard Time. By eliminating a subset of these images, we simulated a temporal resolution of 10, 30, 60, and 120 min. The standard deviations of the background in the subtracted images were two to three times larger for the longer gap images, especially in areas where there was cloud movement (Figure 7). Image subtractions captured at faster frequency were less affected by the radiance variation throughout the day: the subtracted radiance at 12:00 is nearly the same as that at 5:00 and 21:00. Further, once a fire started within the scene, the subtracted radiance was easily discernible from adjacent non-fire pixels (Figure 8), not only because of the fire signal’s significantly higher variability, but also because the fire signal was over ten times the magnitude of the non-fire pixels. These points indicate that rapid scanning, as designed in FUEGO, will help further in separating the target fire pixels from the background.

3.3. Reduction of False Alarms with Optimal Subtractions

We plan to understand in future work how fast the background variation is, and how well we can match backgrounds between exposures, and how the PSF changes across exposures and between exposures. If PSF changes are seen, we will test the modified Alard-Lupton [14] algorithm developed by Miller, Hartung, and Pennypacker [15] to undertake optimal subtractions, where artifacts from misalignment, for example, can be made smaller [15,16]. These methods have been developed for optical astronomy, and are good in crowded fields. An example [17] is shown in Figure 9.

4. Opportunities for FUEGO Instrumentation and Computing

The need for such a system is well known. Why then has this type of satellite not been successfully deployed before? We identify several potential barriers in instrumentation and software that only recently have been overcome: (1) infrared detector size and areal coverage, (2) computational power, and (3) quality of design and usability of device. We further review recent improvements in these areas.
It has only been within the past several years that large, fast arrays of infrared detectors have become available. Such devices now can be as large as 4,000 × 4,000 pixels, which means a mosaic of such detectors can view significant portions of the United States in one image. Readout rates for existing 2,000 × 2,000 HgCdTel detectors can be as short as 8 milliseconds, so pixels will not saturate on the solar background at noon when using these arrays. If we assume pixels view 100 m on a side (somewhat oversampling the PSF at 4 microns), then a 4,000 × 4,000 detector can survey a 400 km by 400 km area in five seconds (including multiple exposures and repointing time—almost certainly with a servo-controlled mirror), and if it is surveying a region comparable to the Western United states with successive images, it can cover a 2,000 km × 2,000 km region of interest in about two minutes. A possible NOAA satellite, to be deployed upon success of the pathfinder mission, could have a bigger array, and have proportionately shorter return times to frames. During periods of intense fire danger, such as in California when the Santa Anna winds are active, certain areas could be imaged more frequently, to decrease the time of detection.
Another possible barrier to the development of a real-time fire detection sensor is the large number of computations that must be executed to rule out false positives, and to perform rapid comparisons between new images (with a fire) and old images (without a fire). The algorithm, above mentioned Allard-Lupton Algorithm, can involve up to 100 arithmetic operations per pixel—hence, a 4,000 × 4,000 pixel detector with 0.001 s exposures would require a computer to undertake approximately 1012 calculations per second, which exceeds all but super computers. However, flight-proven FPGA (Field Programmable Gate Array) devices have been flown that can reach this performance level. Our own tests with only 2,000 core GPU’s and cheap commercial boards have already achieved a arithmetic rate of 3 × 10¹² calculations with OIS already, so in the five years before a FUEGO launch, we are confident such calculation rates can be significantly improved and are not an obstacle.
Certainly if the 1991 Oakland fire could have been seen long before it became critical, a billion dollars of house infrastructure in the Bay Area might have been saved.

5. Preliminary FUEGO Satellite Design Concepts

We have studied various existing satellites, and have developed ideas on the satellite and optical payload configurations. One such configuration is shown in Figure 10. An artist’s conception of FUEGO on orbit detecting a fire is shown in Figure 11.

6. Conclusions

We have demonstrated, for the first time, a compelling case for future study and explorations of a small geosynchronous satellite with minute-scale response times, equipped with both modern detectors and computing power. The system would be of novel design, having: a large matrix array of infrared detectors, good sensitivity to small fires, onboard computing capabilities, reduction of background false positives by real-time processing, and implementation of algorithms described here. We have shown here that such a system would have: (i) ample power to see small fires shortly after they ignite; (ii) could reject backgrounds by rapid image acquisition and comparisons; (iii) is a feasible design for current space mission capabilities. Such detections from FUEGO can take place in a few minutes after ignition with this proposed FUEGO system, and alert fire-fighting responders.

Acknowledgments

This work was kindly supported by the Office of the Vice-Chancellor of Research, University of California at Berkeley.

Conflict of Interest

The authors declare no conflict of interest.

References

  1. Stephens, S.L.; McIver, J.D.; Boerner, R.E.J.; Fettig, C.J.; Fontaine, J.B.; Hartsough, B.R.; Kennedy, P.; Schwilk, D.W. The effects of forest fuel-reduction treatments in the United States. BioScience 2012, 62, 549–560. [Google Scholar]
  2. Westerling, A.; Bryant, B. Climate change and wildfire in California. Clim. Chang 2008, 87, 231–249. [Google Scholar]
  3. Hayhoe, K.; Cayan, D.; Field, C.B.; Frumhoff, P.C.; Maurer, E.P.; Miller, N.L.; Moser, S.C.; Schneider, S.H.; Cahill, K.N.; Cleland, E.E. Emissions pathways, climate change, and impacts on California. Proc. Natl. Acad. Sci. USA 2004, 101, 12422–12427. [Google Scholar]
  4. Millar, C.I.; Stephenson, N.L.; Stephens, S.L. Climate change and forests of the future: Managing in the face of uncertainty. Ecol. Appl 2007, 17, 2145–2151. [Google Scholar]
  5. Sugihara, N.; Wagtendonk, J.; Shaffer, K.; Fites-Kaufman, J.; Thode, A. Fire in California’s Ecosystems; Univ of California Press: Berkeley, CA, USA, 2006; p. 596. [Google Scholar]
  6. Rothermal, R.C. How to Predict the Spread and Intensity of Forest and Range Fires; National Advanced Resource Technology Center: Marana, AZ, USA, 1983; p. 3. [Google Scholar]
  7. Wooster, M.J.; Zhukov, B.; Oertel, D. Fire radiative energy for quantitative study of biomass burning: Derivation from the BIRD experimental satellite and comparison to MODIS fire products. Remote Sens. Environ 2003, 86, 83–107. [Google Scholar]
  8. FUEGOSAT. Demonstration Satellite, European Space Agency’s Living Planet Program; European Space Agency: Noordwijk, The Netherlands, 2006. [Google Scholar]
  9. FUEGOSAT. Exploitation of BIRD Data and Preparation for Risk Management Concept Validation (FIREBIRD); European Space Agency Publications Division: Noordwijk, The Netherlands, 2002; p. 4423. [Google Scholar]
  10. FUEGOTEC. Technology Demonstration Small Mission—FUEGOTEC. Available online: http://www.esa.int/About_Us/GSP/Infrastructure_br_96_N21 (accessed on 30 September 2013).
  11. Prins, E.M.; Feltz, J.M.; Menzel, W.P.; Ward, D.E. An overview of GOES-8 diurnal fire and smoke results for SCAR-B and the 1995 fire season in South America. J. Geophys. Res 1998, 103, 821–835. [Google Scholar]
  12. van den Bergh, F.; Frost, P.E. A Multi-Temporal Approach to Fire Detection Using MSG Data. Proceedings of the 2nd IEEE International Workshop on the Analysis of Multitemporal Remote Sensing Images, Biloxi, MS, USA, 16–18 May 2005; pp. 156–160.
  13. Sifakis, N.I.; Iossifidis, C.; Kontoes, C.; Keramitsoglou, I. Wildfire detection and tracking over Greece using MSG-SEVIRI satellite data. Remote Sens 2011, 3, 524–538. [Google Scholar]
  14. Alard, C.; Lupton, R.H. A method for optimal image subtraction. Astrophys. J 1998, 503, 325. [Google Scholar]
  15. Hartung, S.; Shukla, H.; Miller, J.P.; Pennypacker, C. GPU Acceleration of Image Convolution Using Spatially-Varying Kernel. Proceedings of IEEE International Conference on Image Processing (ICIP), Orlando, FL, USA, 30 September 2012; pp. 1685–1688.
  16. Miller, J.P.; Pennypacker, C.R.; White, G.L. Optimal image subtraction method: Summary derivations, applications, and publicly shared application using IDL. Publ. Astron. Soc. Pac 2008, 120, 449–464. [Google Scholar]
  17. Hartung, S.H. Personal Communication. 30 September 2012. [Google Scholar]
Figure 1. Projected ratio of additional fire risk for an area, as compared to the expected burned area for each grid cell. The ratio of additional risk was calculated for 30 year averaged periods ending 2020, 2050, and 2085, for one climate change model (GFDL) and one scenario (A2). Darker oranges and reds suggest up to a 10-fold increase in potential area burned in 2020, 2050 and 2085. Data source: http://cal-adapt.org. More detailed information about these data can be found in [2].
Remotesensing 05 05173f1
Figure 2. Fire spreading rates, from [6].
Remotesensing 05 05173f2
Figure 3. Imagery collected during the Grand Prix fire on 26 October 2003 by the ASTER sensor, rendered in color near-infrared (left) and mid-wave infrared (right) spectral regions. The smoke emitted by the fire is nearly transparent in the MWIR image.
Remotesensing 05 05173f3
Figure 4. Comparison of FUEGO performance vs. existing and planned satellites. BIRD: Bi-spectral IR Detection; FUEGO: Fire Urgency Estimator in Geosynchronous Orbit; GOES: Geostationary Operational Environmental Satellites; ISIR: Infrared Spectral Imaging Radiometer; MODIS: Moderate Resolution Imaging Spectroradiometer; MSG: Meteosat Second Generation; MTG_HRFI: Meteosat Third Generation High Resolution Fast Imagery; MTI: Multispectral Thermal Imager.
Remotesensing 05 05173f4
Figure 5. MODIS (4.05-micron) images of the Southern California region acquired on consecutive days (day 297 (A) and 298 (B)) (left). The 2003 Grand Prix fire is clearly visible in the northwest of the difference image (right). The difference image histogram indicates that most of the image is well-behaved surrounding zero, and the fire pixels fall outside of the non-fire data distribution.
Remotesensing 05 05173f5
Figure 6. All figure elements on the left correspond to night imagery; all elements on the right correspond to images captured during the day. Histograms are calculated over the square areas indicated on the images (A). The histograms were calculated from subtraction of image pairs (night image without fire subtracted from night image with fire; similar operation for the day images). The first set of histograms (B) corresponds to residual radiance of fire pixels (red squares and graph lines). The second set of graphs (C) shows residual radiance histograms of the background areas: background (green), desert (purple) and the ocean (blue). The background histograms are nearly Gaussian and completely flat beyond a narrow range of residual radiance indicating nearly identical before and after images. The fire histograms contain fire pixels far outside of the normal background pixel distribution.
Remotesensing 05 05173f6
Figure 7. Standard deviation of two 10 × 10 pixel regions of land extracted from 3.9 micron bands of the GOES-14 sensor: one region with clear skies (top) and another with clouds moving across (bottom)—ideal and worst-case scenario, respectively. In both cases, the standard deviation of residuals is reduced as the time lag between the subtracted images decreases (from 120 to 1 min lag).
Remotesensing 05 05173f7
Figure 8. Standard deviation of the radiance (top) and radiance of sequentially subtracted images (bottom). The standard deviations were calculated for two small (3 × 3 pixels) regions: one directly over a fire (red) and another immediately adjacent with no fire (blue). The subtracted and raw radiance of both regions is nearly identical until the fire start between 12:45 and 14:53 PST, at which time the subtracted radiance standard deviation of the fire pixels is over 10 times higher than that of the non-fire pixels.
Remotesensing 05 05173f8
Figure 9. A reference image (left), a new image (middle), and a subtracted image (right) are shown here, with a reasonably small number of artifacts from the subtraction. An asteroid, which moves between the two images, is apparent in the subtraction on the right image above. This asteroid is at the center as a dark object and then a neighboring bright object.
Remotesensing 05 05173f9
Figure 10. Conceptual layout of the FUEGO satellite, with major components labeled.
Remotesensing 05 05173f10
Figure 11. Artist’s Concept of FUEGO on Orbit during a fire alert (FUEGO Concept Art by R. E. Lafever, LBNL).
Remotesensing 05 05173f11
Table 1. FUEGO Parameters.
Proposed/Suggested System ParameterValue
  Wave Band3.4 to 4 microns
  Diameter of Primary Mirror0.5 m
  Infrared Detector and PixelsTeledyne H4RGT 4,096 × 4,096 pixels2
  Areal Coverage in One Field295 km × 295 km
  Projected Pixel Size at Nadir Viewing72 m
Projected Diffraction Diam @ 2 microns72 m
Projected Diffraction Diam @ 4 microns144 m
Signal detected from a 3 m × 3 m 1100 K fire (assume 10% system efficiency) at FUEGO1.2 × 106 photons/second detected
Noon Background per Resolution Element (assume a 290 m resolution element)4 × 10⁷ photons/second detected
Noon Signal/noise in One second integration (assuming Poisson counting statistics)387
CommentsNoise will almost certainly arise from artifacts of subtraction of image.

