1. Introduction
Agriculture in river basins of semi-arid regions revels that available water has been creating a boost for the rural economy; however, one of the biggest consequence of this development is that, other water users will call for an appropriate share of the fresh water resources [
1]. On the other hand, agricultural activity through photosynthesis and biomass production can act as carbon sinks [
2]. The municipalities of Petrolina (Pernambuco State) and Juazeiro (Bahia State), situated in the semi-arid region of the Brazilian Northeast, are good examples, where intensification of irrigated crops has caused widespread replacement of the natural vegetation (“Caatinga”), affecting the energy exchanges between the vegetated surfaces and the lower atmosphere. Under this dynamic situation, the use of tools for estimations of water productivity (WP) components on a large scale are strongly relevant for supporting policy planning and decision-making about the natural resources uses.
For WP analyses based on actual evapotranspiration (ET), besides this last parameter, one has also to quantify biomass production (BIO). Distinctions are made between reference crop evapotranspiration (ET
0), potential evapotranspiration (ET
p) and actual evapotranspiration (ET). ET
0 is the evapotranspiration rate from a reference surface, not short of water, which can be a hypothetical grass surface with specific characteristics. ET
p may be referred as the water flux from crops that are grown in large fields under optimum soil moisture, excellent management and environmental conditions, and achieving full production under the given climatic conditions. ET involves all conditions of the vegetated surface. Due to sub-optimal crop management and environmental constraints that affect crop growth and limit evapotranspiration, ET is generally smaller than ET
p [
3].
From field measurements, the calculation of ET has been carried out in the Brazilian semiarid mixed agro-ecosystems by using energy balance techniques [
4,
5]. However, the spatial variability is significant and extrapolation of data directly from flux tower to mixed agro-ecosystems can lead to inaccurate large-scale estimates [
6]. These difficulties brought remote sensing by satellite images as a valuable application, what has been used in distinct climate regions [
7–
10]. Aiming to increase the spatial scales from field measurements in the Brazilian semiarid region, ET was acquired by means of Landsat images with application of the SEBAL (Surface Energy Balance Algorithm for Land) algorithm following processes of calibration and validation [
11,
12]. Although SEBAL performed well with Landsat images, there are some problems regarding to its operational application with this satellite. On one hand, it is not reasonable to neglect ET from dry pixels for all periods of the year, because inside the rainy season, the large-scale moisture status in the mixed ecosystems is homogeneous. On the other hand, although having a good spatial resolution, the difficult of Landsat use is the poor temporal re-visit period of 16 overpass days.
Other problem in relation to the applicability of the large-scale remote sensing energy balance models, aiming at the end users, is the need of background knowledge in radiation physics. The suitability of applying the Penman-Monteith (PM) equation has been shown by using remotely-sensed vegetation indices, such as the Normalized Difference Vegetation Index (NDVI) and the Enhanced Vegetation Index (EVI), together with weather data [
13,
14]. The use of PM equation is also highlighted by the use of the crop coefficient approach [
15]and by the model named Mapping Evapotranspiration with High Resolution and Internalized Calibration—METRIC [
16], which applies the ratio of ET to ET
0 for extrapolating satellite overpass ET values to larger time-scales.
Considering the simplicity of application, and its needing neither crop classification nor extreme conditions, the algorithm SAFER (Simple Algorithm For Evapotranspiration Retrieving) for acquiring ET has been developed and validated with field data from four flux stations and Landsat images. The model elaboration and validation involved irrigated crops and natural vegetation, under different thermo-hydrological conditions in the Brazilian semi-arid region [
17,
18]. SAFER can be also applied with MODIS images, which sensor, although with a worse spatial resolution than that for Landsat, views the entire surface of the Earth every one to two days.
BIO is a key indicator for any agro-ecosystem [
19], being its values highly variable in both space and time [
12,
20,
21]. In water-limited environments, particularly in semi-arid and arid regions, the challenge is BIO improvements through optimized management practices [
20]. For BIO quantification, the light-use efficiency concept (LUE) devised, based on radiation interception, can be applied [
22,
23]. This interception is variable throughout the year and during the crop growing periods [
4,
24]. The LUE Monteith's model proposes a direct proportional relation between biological production and the amount of photosynthetically active radiation absorbed by the vegetation canopies (APAR) [
25]. Although uncertainties arising on LUE values, due to their spatiotemporal variations [
26], the model accuracy has been considered acceptable for large-scale applications with satellite data [
12,
27,
28].
BIO field measurements were done in oilseed crop under the semi-arid conditions of India [
20], showing spatial variations due to microclimate conditions. In France, field measurements were coupled with high-resolution Formasat satellite images in irrigated maize and rain fed sunflower, where the authors attributed the main spatial differences in BIO parameters to precipitation conditions in the second crop [
22]. Satellite remote sensing is a powerful tool for BIO estimates, overcoming the lack of extensive observations and/or measurements over large areas [
19,
29]. MODIS data were processed in combination with precipitation, temperature and elevation for mapping BIO in forest from California [
30]. BIO was also estimated from MODIS images in Guandong, China, to evaluate the feasibility of setting up new biomass power plants and to optimize the locations of plants [
31]. In Brazil, BIO estimations have been made in São Francisco [
6] and Amazon [
32] hydrological basins by using Landsat images.
Water productivity (WP) may be defined as the ratio of the net benefits from crop, forestry, fishery, livestock and mixed agricultural systems to the amount of water required to produce those benefits. Considering vegetation, WP can be BIO per water consumed, including water that originates from rainfall, irrigation, seepage and changes in soil water storage [
33]. Taking WP as the ration of BIO by ET, when multiplied by a harvest index (HI) in case of agriculture, information on crop water productivity (CWP) is retrieved [
34]. Examples of field measurements to quantify CWP in oats, sunflower, legumes and potato were given under the semi-arid conditions of Mongolia [
35]. Also under semi-arid conditions but in Northern India, CWP was quantified in oilseed crop [
20]. In the Brazilian semi-arid, this task was realized in vineyards [
4] and mango orchards [
36]. Considering large-scale acquirements by satellite images, CWP mapping based on remote sensing parameters can be found for several agro-ecosystems, combining these parameters with weather variables [
12,
28,
37].
Despite these site specific and large-scale studies, research is still needed to further evaluate the combined ET and BIO models, especially for operational applications in different agro-ecosystems with high temporal and spatial thermo-hydrological inhomogeneity. The objective of this paper is to combine the SAFER algorithm [
18] and the Monteith’s BIO model [
25] to demonstrate that MODIS satellite measurements, together with agro-meteorological data, can be used for water productivity assessments on a large scale. A third model for the surface resistance to water fluxes (r
s), the SUREAL (Surface Resistance Algorithm), is used to classify the vegetation into irrigated crops and natural ecosystems [
38] to retrieve the incremental values of ET, BIO and WP for subsidizing the rational water resources management. The municipalities of Petrolina and Juazeiro, respectively Pernambuco (PE) and Bahia (BA) states, located at the main agricultural growing regions in the semi-arid conditions of the Northeastern Brazil, are the reference study areas. After successfully testing these models, they can be used with more confidence in other parts of the world, with probably only the need of adjustments in the original equation coefficients.
2. Material and Methods
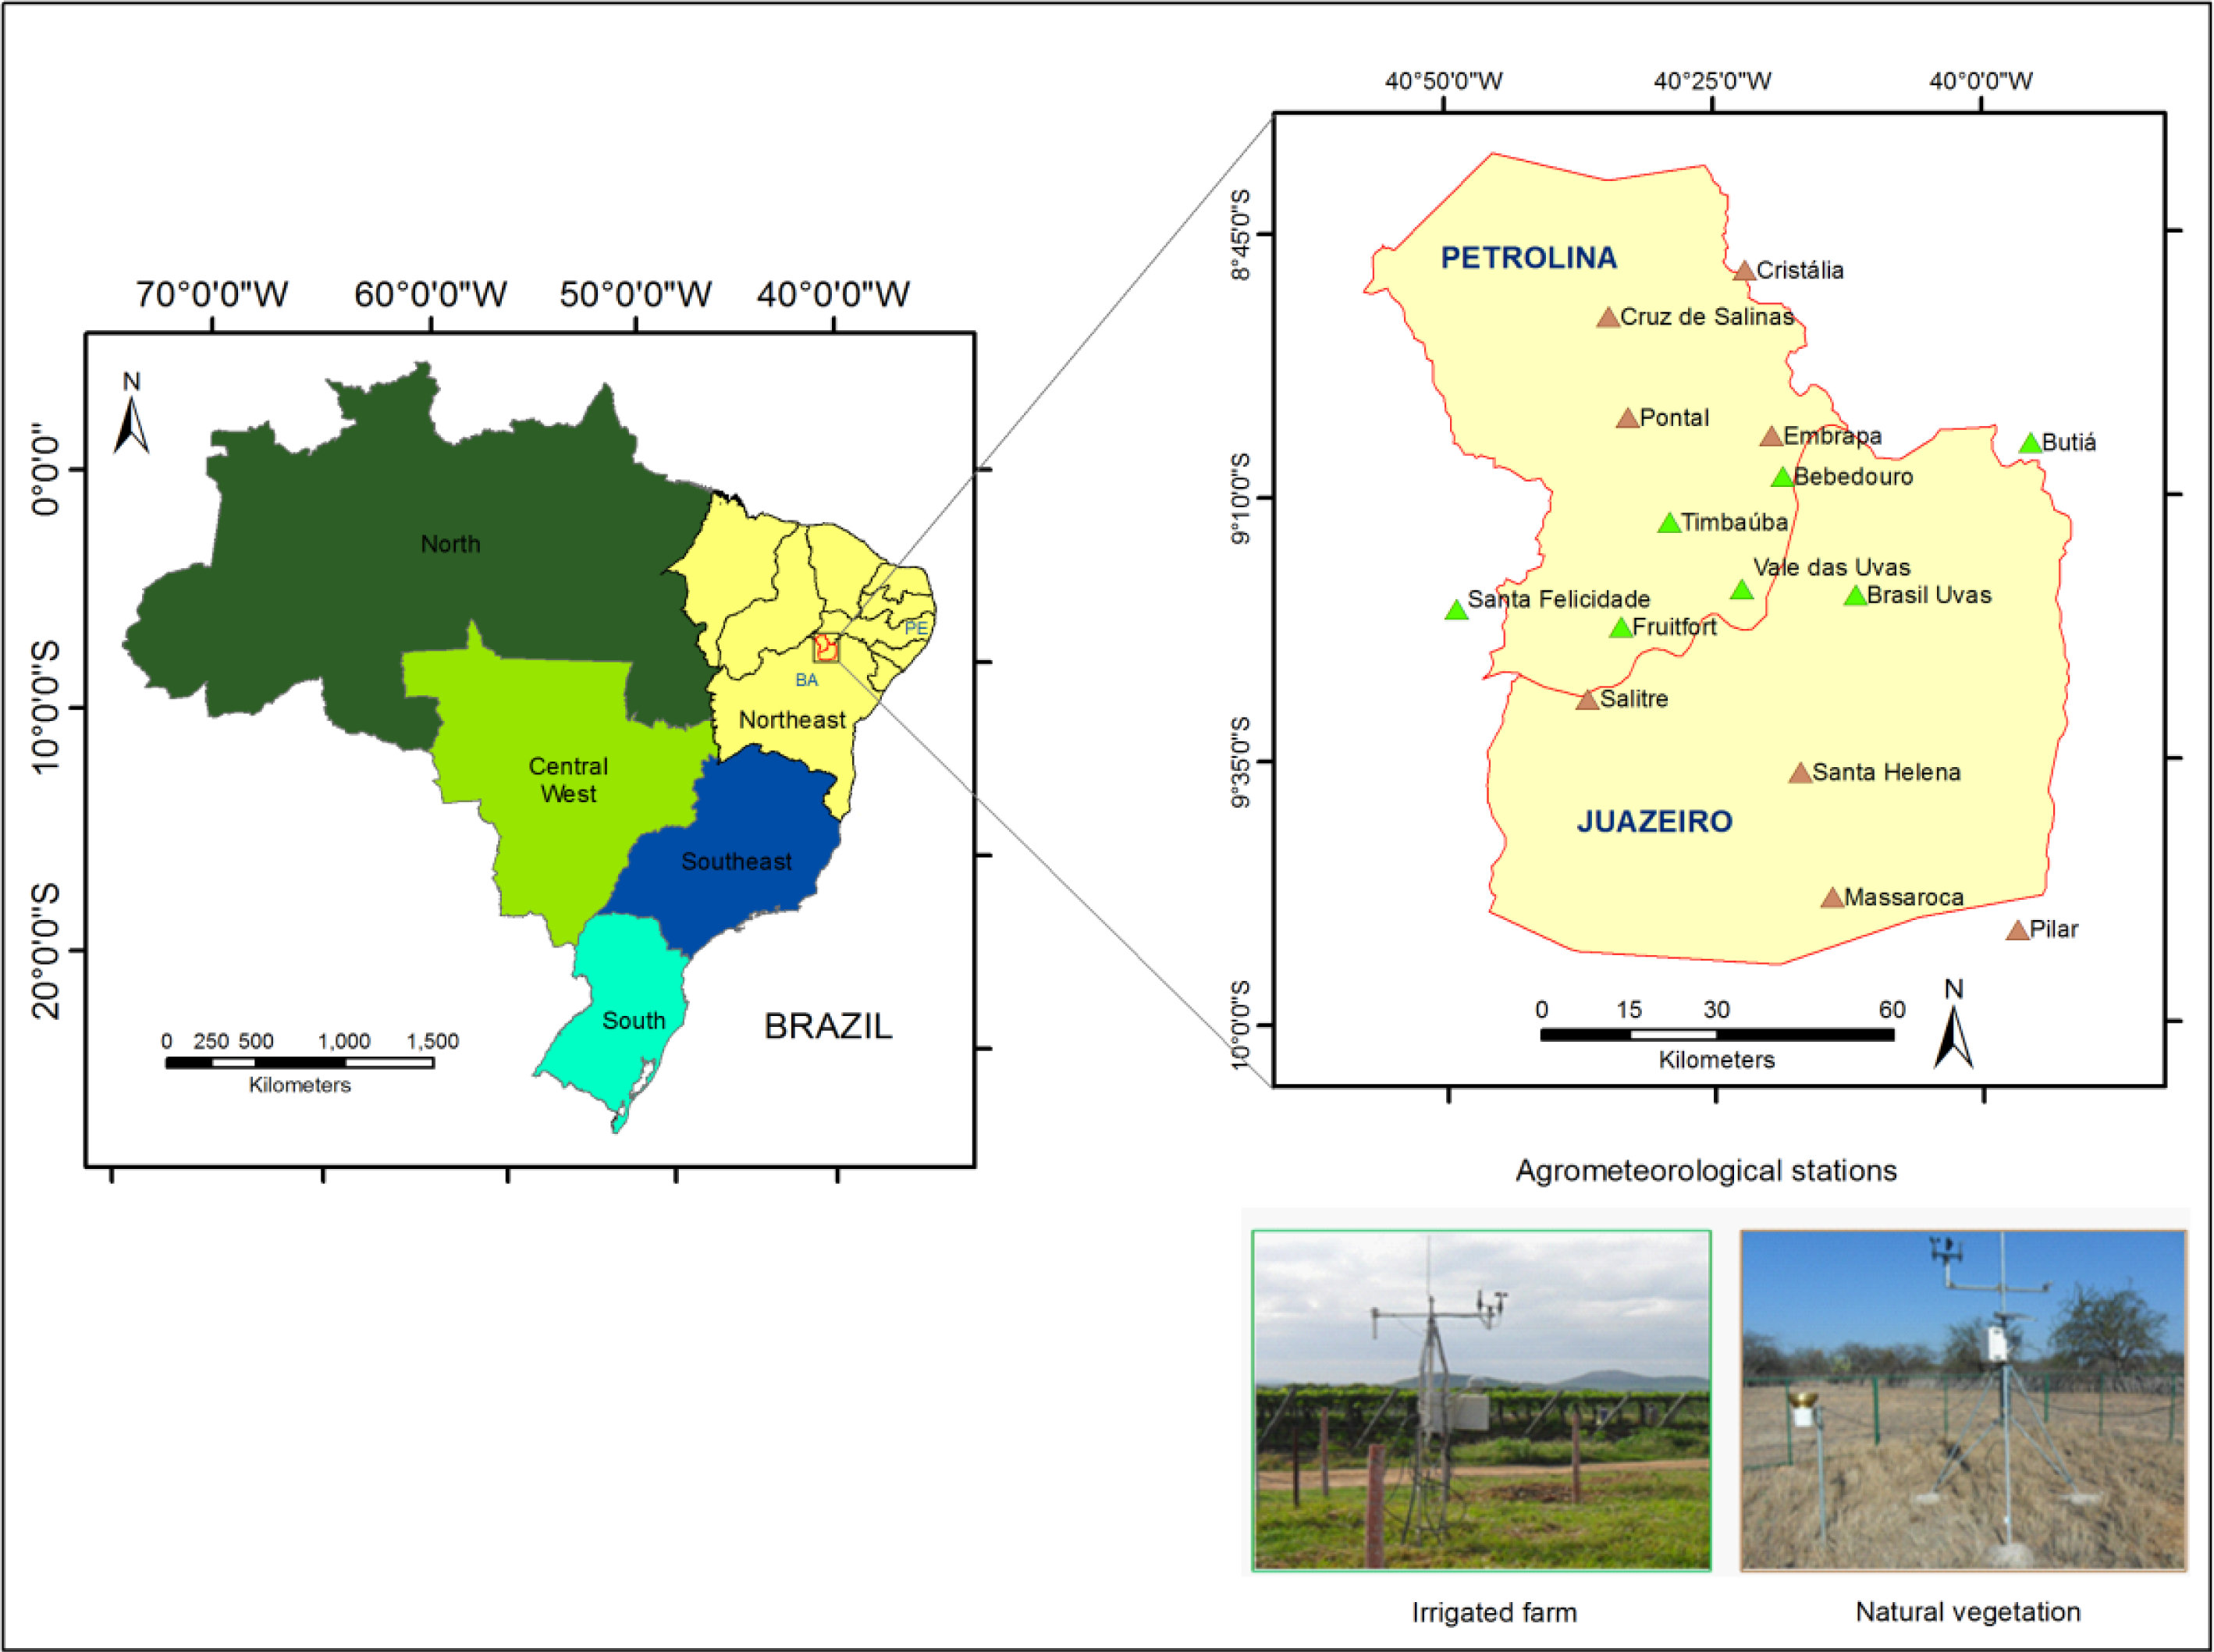
Figure 1 shows the locations of the Petrolina and Juazeiro municipalities, respectively in Pernambuco (PE) and Bahia (BA) states in the Brazilian Northeast, together with the agro-meteorological stations used for the interpolation processes inside irrigated areas and natural vegetation.
Petrolina and Juazeiro municipalities are located respectively at the left and right bank of the São Francisco River, in the Brazilian Northeastern semi-arid region, in respectively Pernambuco (PE) and Bahia (BA) states. Excluding the areas of high altitude of this semi-arid region, annual averaged air temperatures (T
a) are higher than 24 °C, even larger than 26 °C in the depressions at 200 to 250 m of altitude. The warmest months are October and November (21 °C–29 °C) when the sun is close to the zenith position and the coldest ones are between June and July (19 °C–25 °C) around the winter solstice time in the Southern hemisphere. The long term large-scale annual precipitation (P) is in average 693 mm with 70% of the rainy period concentrated during the months from January to April. March (50 mm–230 mm) and August (0 mm–50 mm) are the wettest and the driest months of the year, respectively [
6].
As a result of high thermal conditions and temporal variability of rainfall, there are water deficits in the climatic water balance along the year, with the exception of March, when the soil are rarely dry. Sandy soil predominates in Petrolina while in Juazeiro the majority is clay. Although the first soil type having lower water retention capacity than the second one, natural species in Petrolina have the possibility of extracting more water at deeper layers than those from Juazeiro [
34].
MODIS images, with 6 being for 2010 and 9 for 2011, together with a net of 15 automatic agro-meteorological stations were used in the current research, following field calibrations and interpolations. From energy balance measurements in irrigated crops and natural vegetation, during 2002 and 2004 in the Brazilian semi-arid region [
17], regression equations for surface albedo (α
0) and for surface temperature (T
0) were developed (R
2 > 0.90) and applied to MODIS images.
MODIS is an instrument on-board Terra and Aqua platforms with 36 spectral bands between 0.405 and 14.385 μm, acquiring data at three spatial resolutions (250 m, 500 m and 1,000 m). The land product used was Level-1B (L1B) data set from Terra, which contains radiances for these bands. Only four (two reflectance and two thermal bands) were used. These are reflective solar bands (Bands 1 and 2, red and near infrared) with a spatial resolution of 250 m and the thermal emissive bands (Bands 31 and 32) with a spatial resolution of 1,000 m.
For α
0 calculations, the reflectance values for Band 1 and 2 were used, according to the following linear model [
39]:
where α
1 and α
2 are the reflectances for the Bands 1 and 2 from MODIS satellite measurements, and a, b, and c are regression coefficients obtained comparing remote sensing with field measurements [
17], thus including the atmospheric effects throughout the radiation path. The values found for the Brazilian semiarid conditions were, respectively, 0.08, 0.41 and 0.14.
For T
0 large-scale estimations, the thermal emissive Bands 31 and 32 were used. After trying the split technique, comparing the MODIS radiometric satellite data for these bands with field aerodynamic T
0 from the same energy balance experiments as for α
0 [
17], it was observed that several terms of the model tested [
40] could be neglected. Thus, under the semi-arid conditions of the current study, a simpler regression equation could be applied with good accuracy:
where T
31 and T
32 are the brightness temperature from the Bands 31 and 32 and the regression coefficients d and e were equally 0.50, also including already the atmospheric effects throughout the radiation path.
For both ET and BIO estimations, NDVI was one of the input parameters, because it is a measure of the amount and structure of the vegetation at the surface, capturing its seasonal dynamics [
41]:
With the images of α
0, T
0 and NDVI as the remote sensing input parameters, together weather data, ET was obtained by the SAFER algorithm [
18]:
where ET
0 is the reference evapotranspiration calculated by the Penman-Monteith method [
3] with the interpolated values from the net of agro-meterological stations (see
Figure 1) and f and g are regressions coefficients, which for the Brazilian semiarid conditions were found to be 1.8 and −0.008, respectively.
Daily net radiation (R
n) can be described by the 24-h values of net shortwave radiation, with a correction term for net longwave radiation for the same time scale [
6,
8,
11,
17]:
where RG is the incident global solar radiation and a
l is the regression coefficient of the relationship between net long wave radiation and atmospheric transmissivity (τ
sw) at the daily scale. Values of RG were interpolated from the 15 agro-meteorological stations presented in
Figure 1.
Because of the thermal influence on longwave radiation via the Stephan Boltzmann equation, previous study investigated whether the variations of the a
l coefficient from
Equation (5) could be explained by variations in 24 h T
a values [
17]:
where h and i are regression coefficients found to be 6.99 and 39.93, respectively for the Brazilian semi-arid conditions. Interpolated T
a data from the agro-meteorological stations from
Figure 1 were used with
Equation (6).
Grids of RG daily values were used to estimate the large scale Photosyntetically Active Radiation (PAR) for the same time scale:
where j = 0.44 is the constant of the regression equation found under the Brazilian semiarid conditions that reflects the portion of RG that can be used by leaf chlorophyll for photosynthesis [
11].
The values of Absorbed Photosyntetically Active Radiation (APAR) can be approximated directly from PAR:
The factor k was estimated from the NDVI values [
12,
27]:
The coefficients l and m of 1.257 and −0.161, respectively, reported for a mixture of arable crop types [
27] were considered and BIO was quantified as:
where E
F is the evaporative fraction represented by the ratio of the latent heat flux (λE) to R
n. This fraction incorporates the soil moisture status and vegetation development, being λE acquired by transforming ET into energy units; ε
max is the maximum light use efficiency, which was taken as 2.5 g·MJ
−1 for the majority c4 species in the study area; and 0.864 is a unit conversion factor [
6,
12].
For water productivity (WP) analyses, involving both irrigated crops and natural vegetation, the following equation was used [
1]:
For classifying irrigated crops and natural vegetation at the municipality level, the SUREAL model was applied by using a selected MODIS image during the naturally driest period of the year [
38].
where n and o are regressions coefficients, which were found to be respectively 0.04 and 2.72 for the Brazilian semi-arid conditions.
The SUREAL model was applied to MODIS images by considering the threshold rs values of 1,500 s·m−1 and 15,000 s·m−1 together with logical functions in a GIS environment. Bellow or equal to the left end of this range and NDVI higher than zero should be irrigated crops and above this limit and bellow the right end of the range, was considered natural vegetation. The rs values above the superior limit were considered not vegetation features, while NDVI lower than zero should be water.
When along the analysed year of 2011 there were no cloud free images, the ET/ET
0 and NDVI from the images of 2010 together with weather data for 2011 were used to fill the gaps and successive interpolations were done until there were 3 images for each month. The average image for each month was then used together with the monthly grids of RG, T
a and ET
0 from the 15 agro-meteorological stations showed in
Figure 1. Although using some images of the input remote sensing parameters for 2010, the effects on the final ET and BIO results for 2011 are expected to be minimal. This is because the annual trend of weather parameters are similar, and differences on precipitation, solar radiation and ET
0 between the two years were, on a large-scale, only 8%, 1% and 3%, respectively.
3. Results and Discussion
3.1. Weather Drivers
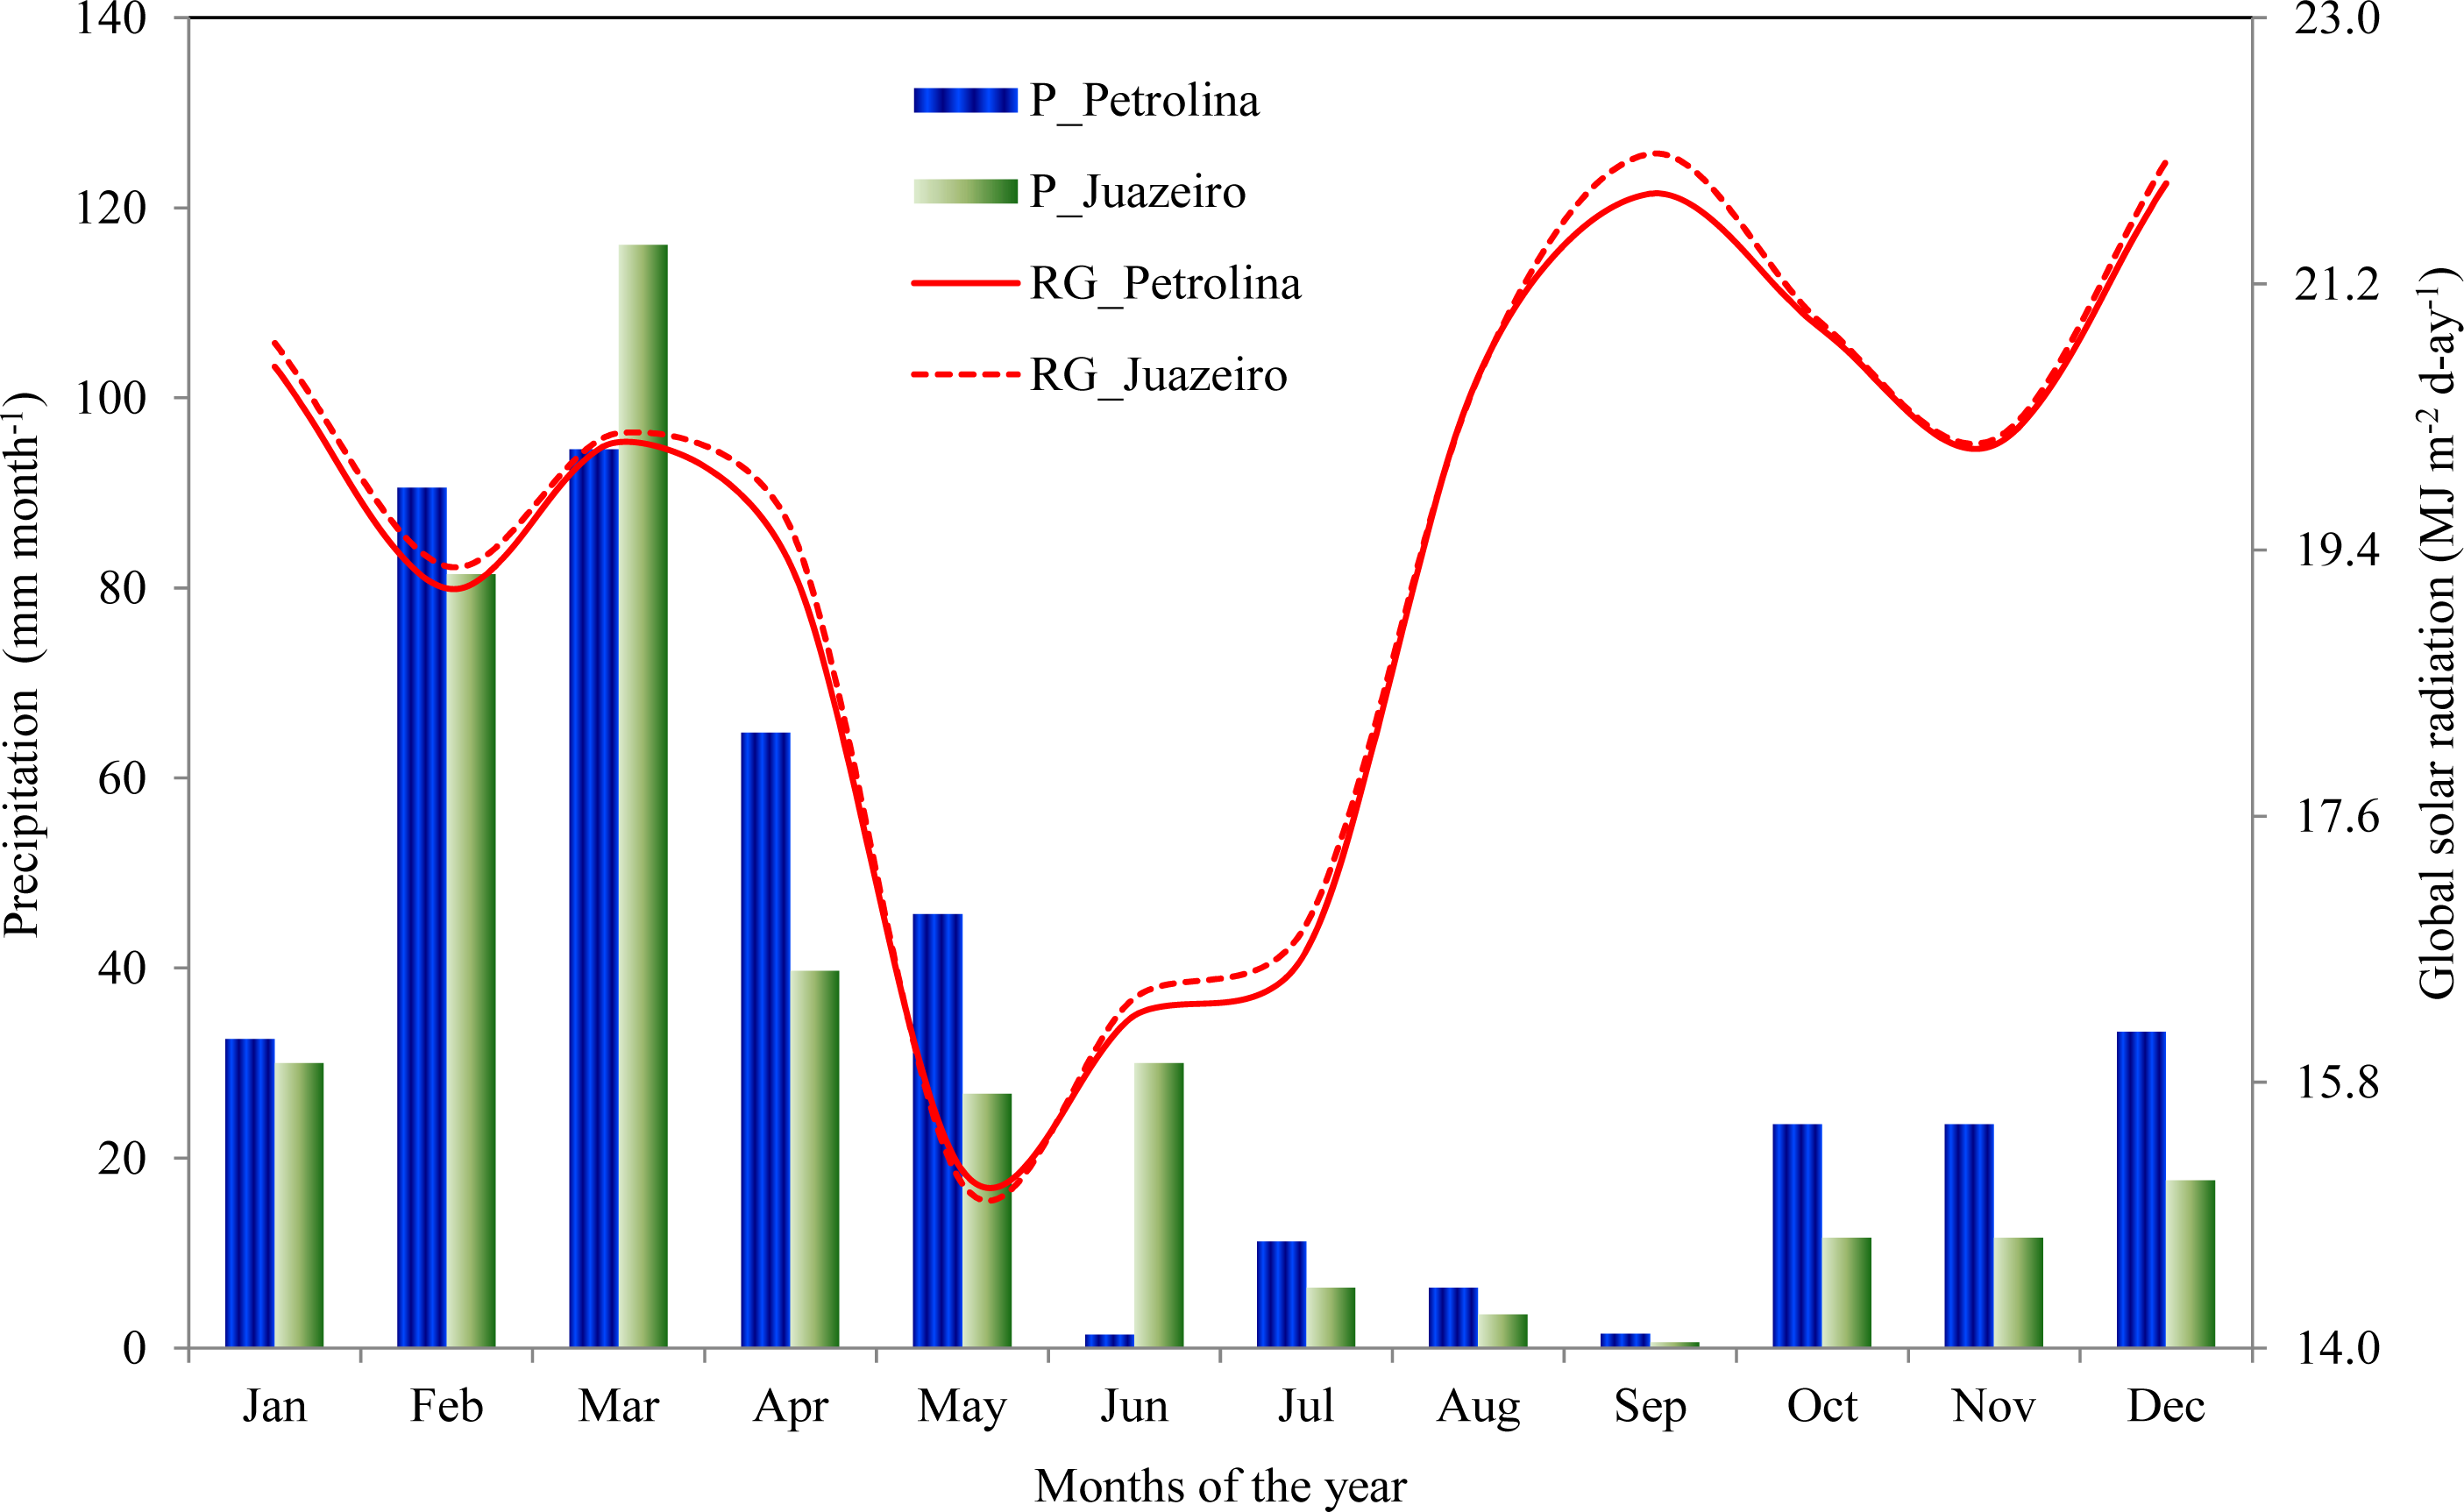
As the weather main driving forces for water fluxes and vegetation development are solar radiation and precipitation, firstly, the monthly trends of these parameters were analysed, during the study reference year of 2011 (
Figure 2).
For constructing
Figure 2, averaged pixel values were used from the agro-meteorological stations inside the municipalities of Petrolina and Juazeiro, separately (see
Figure 1). Having sufficient solar radiation and soil moisture, all agro-ecosystems will have large water fluxes and vegetation development. Considering both municipalities, the best ET and BIO conditions for natural vegetation occur in March, while for irrigated crops these conditions are in September as their developments are not dependent on rainfall amounts. Higher RG levels happen during the first and the last four months of the year, when the Sun is around its zenith positions in the study region. During the second semester, the amount of rainfall is lower and the quick RG rise is appropriate for starting the growing seasons of irrigated crops. In the middle of the year, winter solstice time for the South hemisphere, the naturally driest conditions and the lowest solar energy availability are less favourable for ET and BIO rates, considering both, irrigated crops and natural vegetation.
Comparing the two municipalities, there are no significant differences in RG levels; however, the amounts of precipitation in Petrolina (P_Petrolina) are higher, with an annual value of 429 mm, 14% larger than the corresponding total of 376 mm for Juazeiro (P_Juazeiro). With similar radiation levels and higher rainfall amount, the first municipality is favoured by the climate for larger both, ET and BIO.
3.2. Evapotranspiration
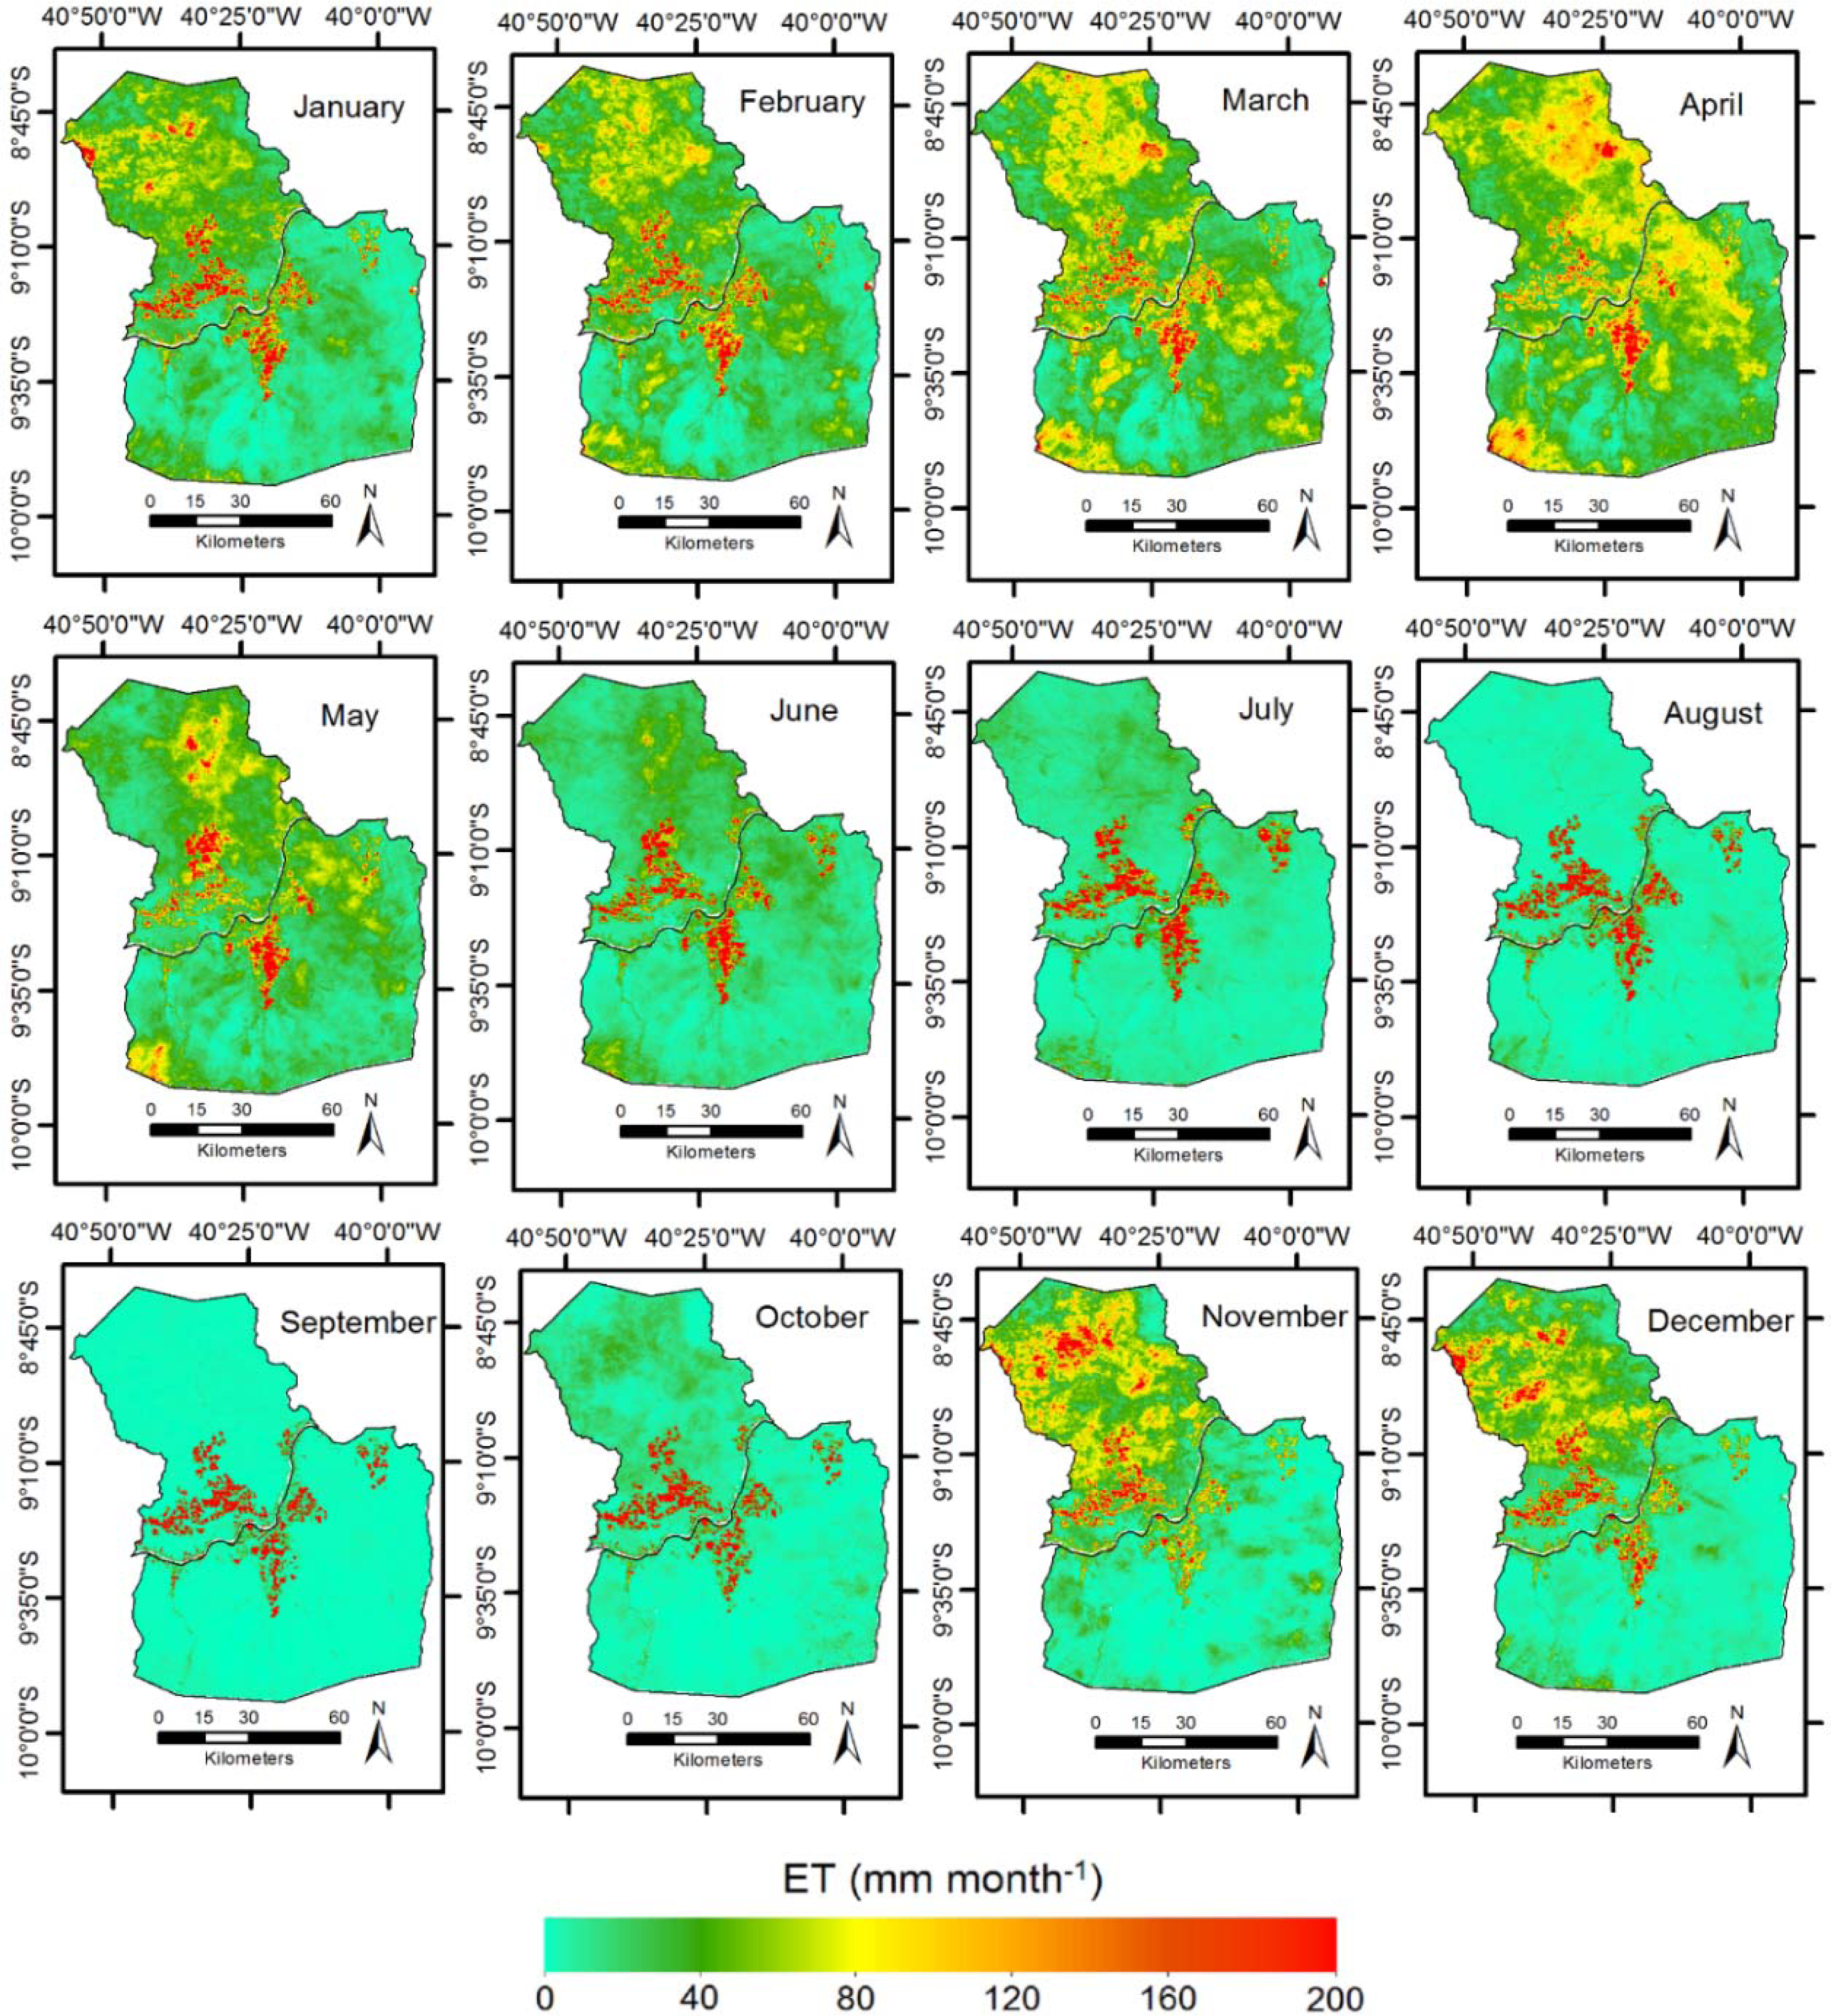
Figure 3 presents the spatial distribution of the monthly ET values in the mixed Brazilian semi-arid agro-ecosystems of Petrolina (PE) and Juazeiro (BA) municipalities, respectively Pernambuco (PE) and Bahia (BA) states, along the year of 2011.
ET spatial and temporal variations along the year are evident, mainly when observing the wettest period from February to April with the driest one, from August to October. During the rainy season, the ET maximums are verified in April, with averages of 61 and 45 mm·month−1 for Petrolina and Juazeiro, respectively. However, the highest pixel values, reaching to 200 mm·month−1 are for November to December in both municipalities, representing well-irrigated crops.
Intermediate ET values in natural vegetation occurred just after the rainy season, from May to June, because antecedent precipitation from January to April still keeps the natural vegetation brushes wet and green. During this time of the year, the hydrological large-scale uniformity makes “Caatinga” species having ET rates similar to those from irrigated crops and even higher, confirming the sensibility of the SAFER model.
Because the highest fractions of the available energy used as sensible heat fluxes (H), during the driest period of the year, from August to October, the natural vegetation presented the lowest ET pixel values (bluish pixels), while the irrigated fields showed the highest ones (reddish pixels). Stomata of “Caatinga” species close under these conditions, limiting transpiration and photosynthesis, and, in general, irrigation intervals in crops are short (daily irrigation), with a uniform water supply, reducing the heat losses to the atmosphere. The lowest ET pixel values, in both municipalities, were in September, with those lower than 1.0 mm·month−1 in vegetated areas representing the natural ecosystems.
Table 1 shows the ET monthly average values and the standard deviations (SD) for irrigated crops (IC) and natural vegetation (NV) in Petrolina and Juazeiro, respectively Pernambuco (PE) and Bahia (BA) states, Brazil, along the year of 2011.
Considering only irrigation conditions, differences between the municipalities can be seen, with November presenting the highest crop ET rates in Petrolina, while in Juazeiro they happened in April. In natural vegetation, the largest ET values were in April for both municipalities. The lowest ET rates occurred in September for both ecosystems and municipalities. Water fluxes from irrigated crops in Juazeiro were 79% of those for Petrolina, while in natural vegetation this ratio was only 50%. In relation to the annual incremental ET, irrigated crops consumed 553 mm·yr−1 more water than “Caatinga” species in Petrolina, while in second municipality this extra consumption was 545 mm·yr−1. Considering both municipalities and agro-ecosystems, the lowest Standard Deviation (SD) values were during the driest period.
Figure 4 presents the spatial distribution of the annual ET pixel values, together with the histograms, for the Petrolina and Juazeiro municipalities, respectively, Pernambuco (PE) and Bahia (BA) states, Brazil, for the year of 2011.
Taking into account the whole year, the average annual ET values for the mixture of agro-ecosystems were 438 and 234 mm·yr
−1, for Petrolina and Juazeiro, respectively, with the rates in the second municipality representing 53% of those from the first one. However, for both agricultural growing regions, irrigated crops consumed more than 800 mm·yr
−1 as can be seen by the reddish areas in
Figure 4. These maximums water consumptions are in agreement with previous study in the semiarid conditions of the Brazilian Northeast, being the largest ET rates for table grapes and mango orchards, and those for natural vegetation closely related to the annual rainfall [
12].
The ET distribution in Juazeiro was skewed and tended towards to the lower values, in comparison to that for Petrolina. The most frequent pixel values in the last municipality were between 300 and 500 mm·yr−1 while in Juazeiro this range was from 50 to 300 mm·yr−1. The reason for these differences can be explained mainly by different rainfall amounts between the municipalities, increasing the ET values for natural vegetation in Petrolina. However, one have to consider the higher ability of the “Caatinga” species for using moisture from their deeper root zones in the Petrolina sandy soils, in comparison with the clay soil conditions in Juazeiro.
3.3. Biomass Production
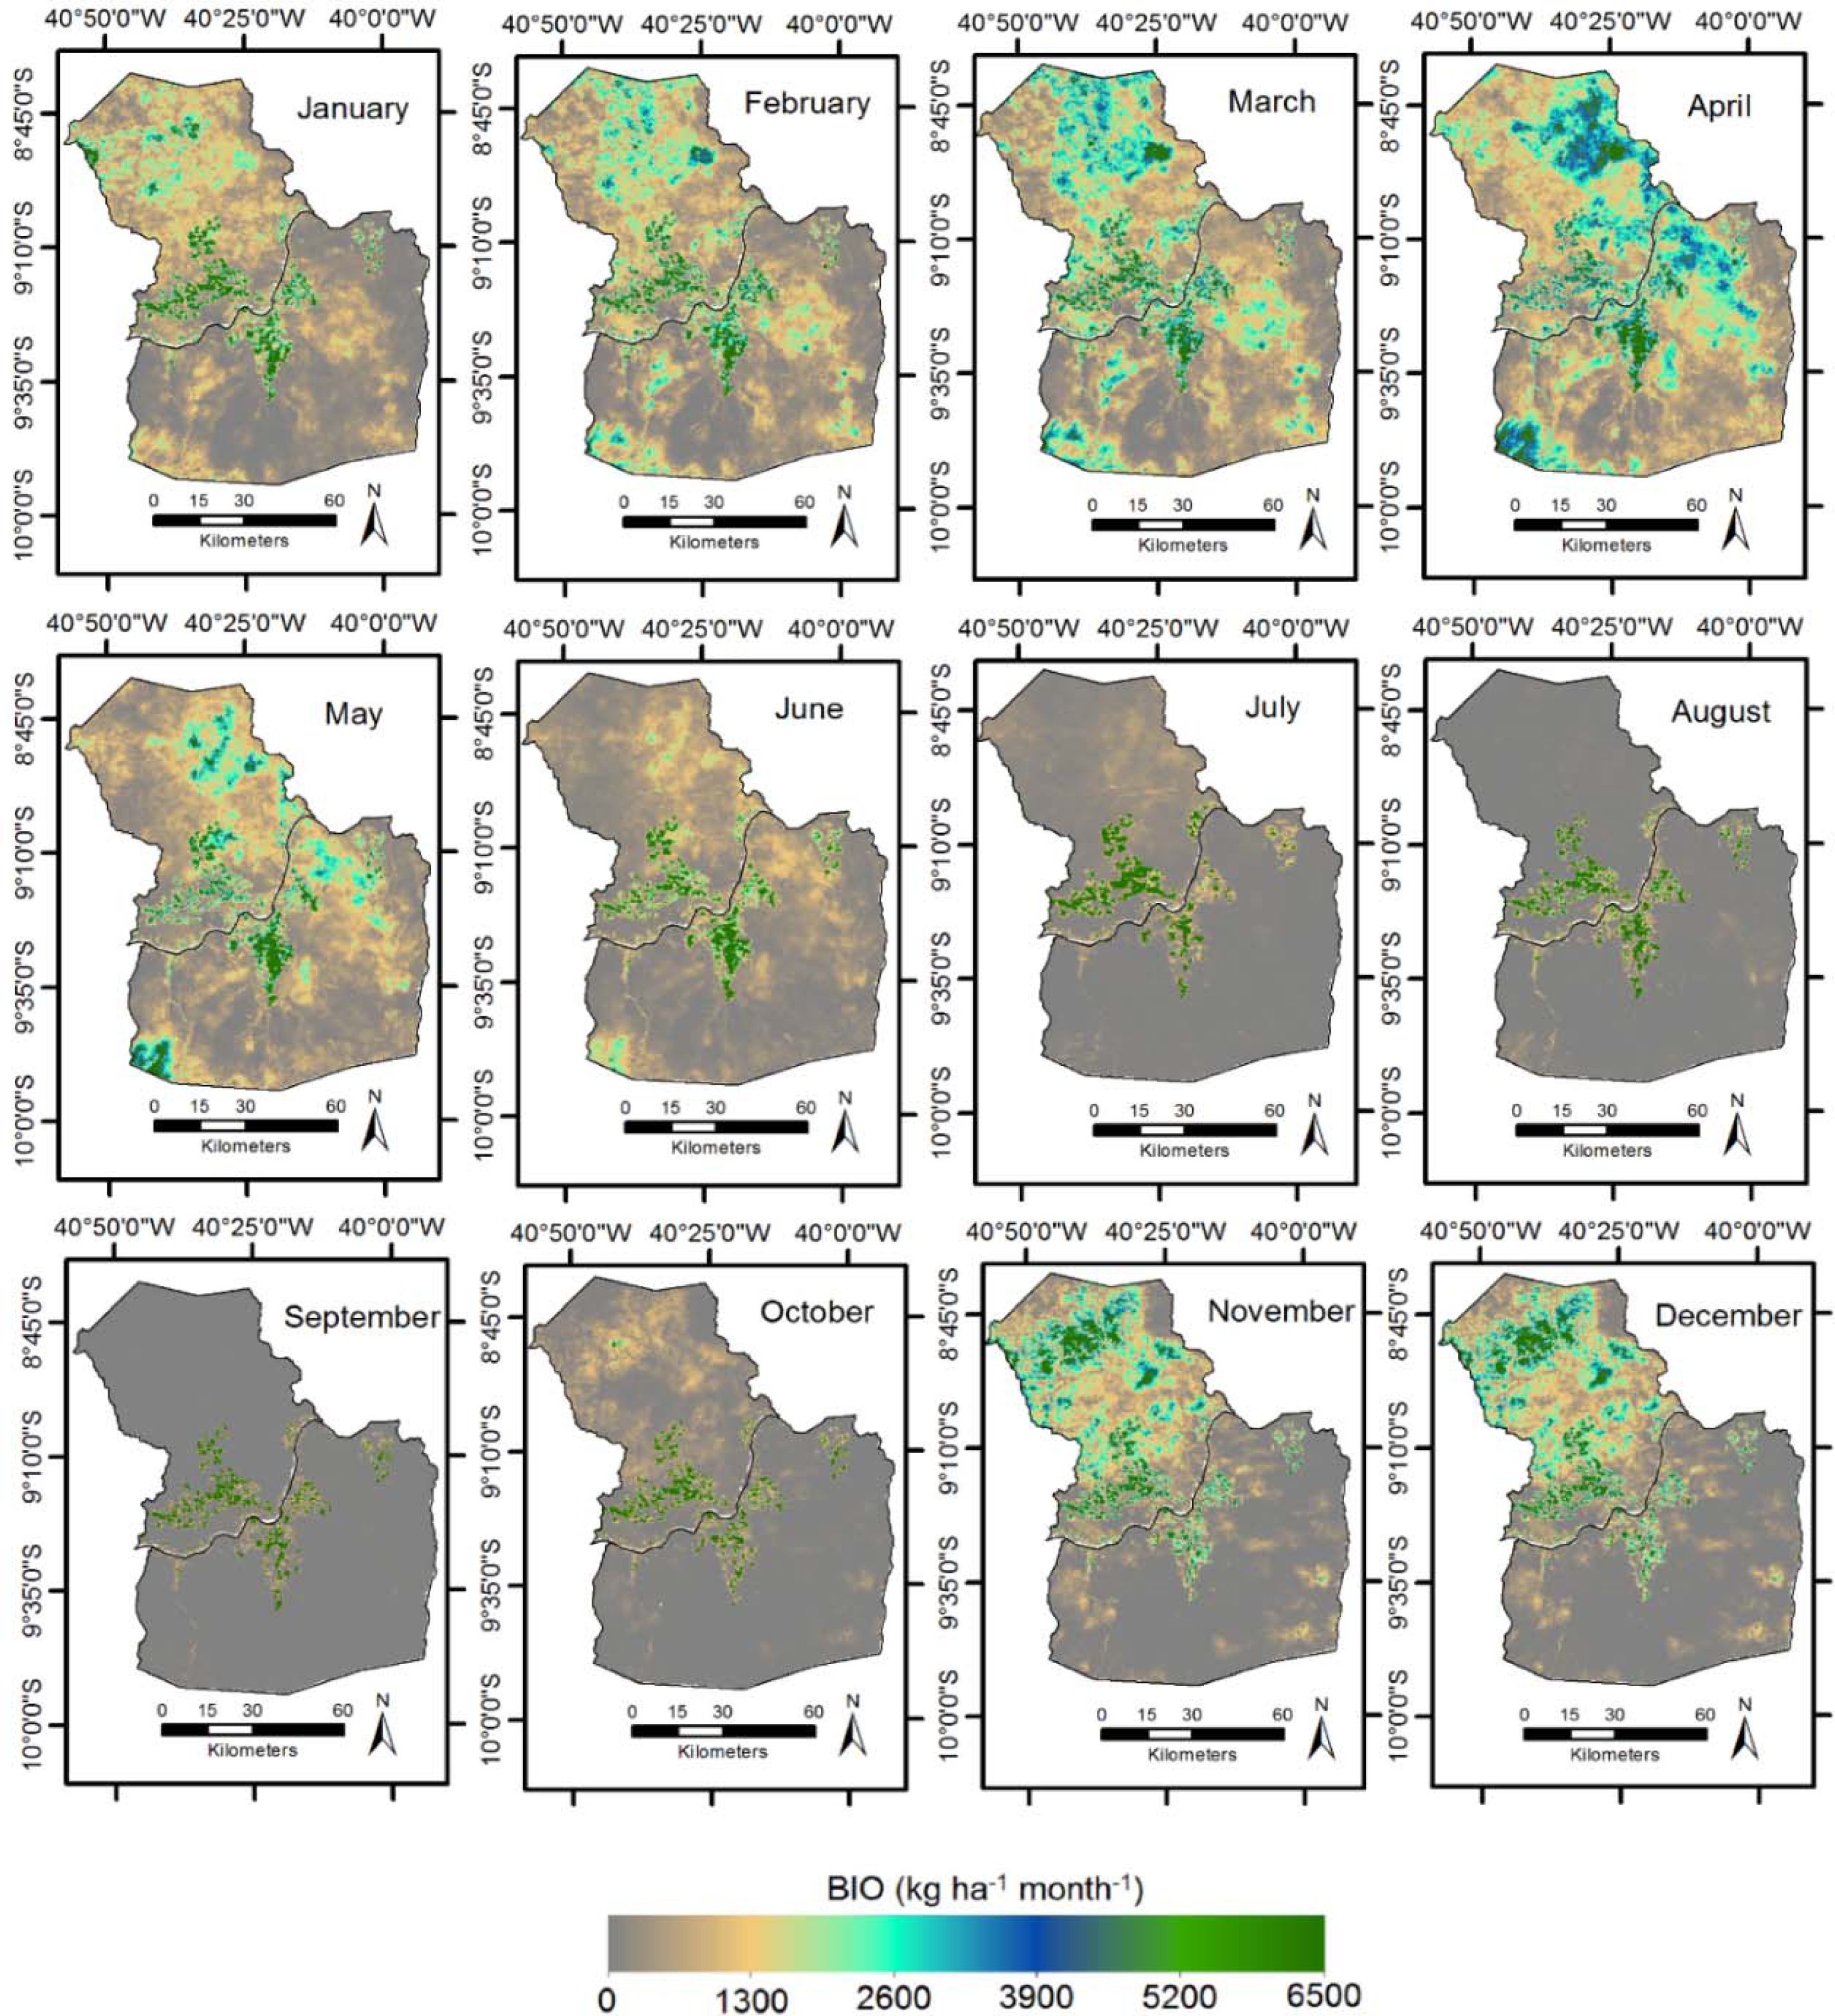
Figure 5 presents the spatial variation of the BIO monthly values in the mixed Brazilian semi-arid agro-ecosystems of Petrolina and Juazeiro municipalities, respectively Pernambuco (PE) and Bahia (BA) states, along the year of 2011.
As there is a relation between water consumption and BIO [
35,
42,
43], the spatial and temporal variations off this last vegetation parameter are also strong along the year, with the highest large-scale BIO values during the rainy season from February to April, and the lowest ones in the driest period, from July to September. The maximums occurred in April, with averages of 1,817 and 1,306 kg·ha
−1·month
−1 for respectively Petrolina and Juazeiro. During this last month, several areas presented rates higher than 4,000 kg·ha
−1·month
−1, including both natural vegetation and irrigated crops. The lowest BIO happened in September, with the corresponding pixel values of 142 and 92 kg·ha
−1·month
−1.
Precipitation from January to April provides enough water storage in the root zones of the “Caatinga” species to keep their continuous vegetative developments, while during the second semester, irrigated crops present larger BIO, as with absence of rains, the soil moisture is close to the field capacity due to the general daily irrigation. Under these last conditions, irrigated crops are very well visible, confirming the effectiveness of coupling SAFER and the radiation Monteith models. Similarly, irrigated maize crop presented the double of BIO values when comparing with natural alpine meadow in the Heihe River basin [
41], being irrigation considered the main reason for these strong differences.
Table 2 presents the BIO monthly average values and the standard deviations (SD) for irrigated crops (IC) and natural vegetation (NV) in Petrolina and Juazeiro, respectively Pernambuco (PE) and Bahia (BA) states, Brazil, along the year of 2011.
In general, Petrolina presented higher BIO than Juazeiro for both, natural vegetation and irrigated crops. However, under irrigation conditions, the difference was only 33%, while considering “Caatinga” species it doubled. For all agro-ecosystems, the period with the highest BIO values were from March to April. Considering irrigated crops, the lowest values were from September to October and for natural vegetation, they happened from August to September. The annual incremental BIO rates were in average 18.61 and 16.69 t·ha−1·yr−1, for respectively Petrolina and Juazeiro. As in the case of ET, the lowest SD values were during the driest period, independently of the agro-ecosystem, however, Petrolina presenting slightly larger BIO spatial variation when comparing with Juazeiro.
On one hand, under rain fed or irrigated conditions, the plants are strongly sensitive to the spatial distribution of precipitation and soil water content [
22]. On the other hand, during the naturally driest periods, the higher BIO and SD values for irrigated crops are mainly caused by different levels of fertilization, crop stages and irrigation [
19,
43].
Figure 6 presents the spatial distribution of the annual BIO pixel values, together with the histograms, for the Petrolina and Juazeiro municipalities in, respectively, Pernambuco (PE) and Bahia (BA) states, Brazil, for the year of 2011.
The average large-scale annual BIO values for the mixture of agro-ecosystems were 11.7 and 5.9 t·ha
−1·yr
−1, for Petrolina and Juazeiro, respectively, with the ones for the second municipality representing 50% of those for the first. According to previous studies with Landsat images in Petrolina, the most frequent BIO values were between 14.0 and 34.0 t·ha
−1·yr
−1 [
12]. The lower vegetation development for these municipalities in 2011 indicates a probability of a year-to-year variation in the thermo-hydrological conditions.
Irrigated crops are well identified by BIO above 20 t·ha−1·yr−1 by the greener pixels at the vicinities of the São Francisco River, in both municipalities. As for ET, in Petrolina, the histogram is more symmetric than that for Juazeiro, where the frequency distribution tended towards the lower values. The most frequent annual BIO values in this last municipality were between 1 and 7 t·ha−1·yr−1, while in the first one this range was from 5 to 11 t·ha−1·yr−1. The differences between the municipalities can also be explained by different rainfall amounts and the ability of water extraction by natural species in the Petrolina sandy soil, increasing the BIO annual values for natural vegetation in relation to Juazeiro.
3.4. Water Productivity
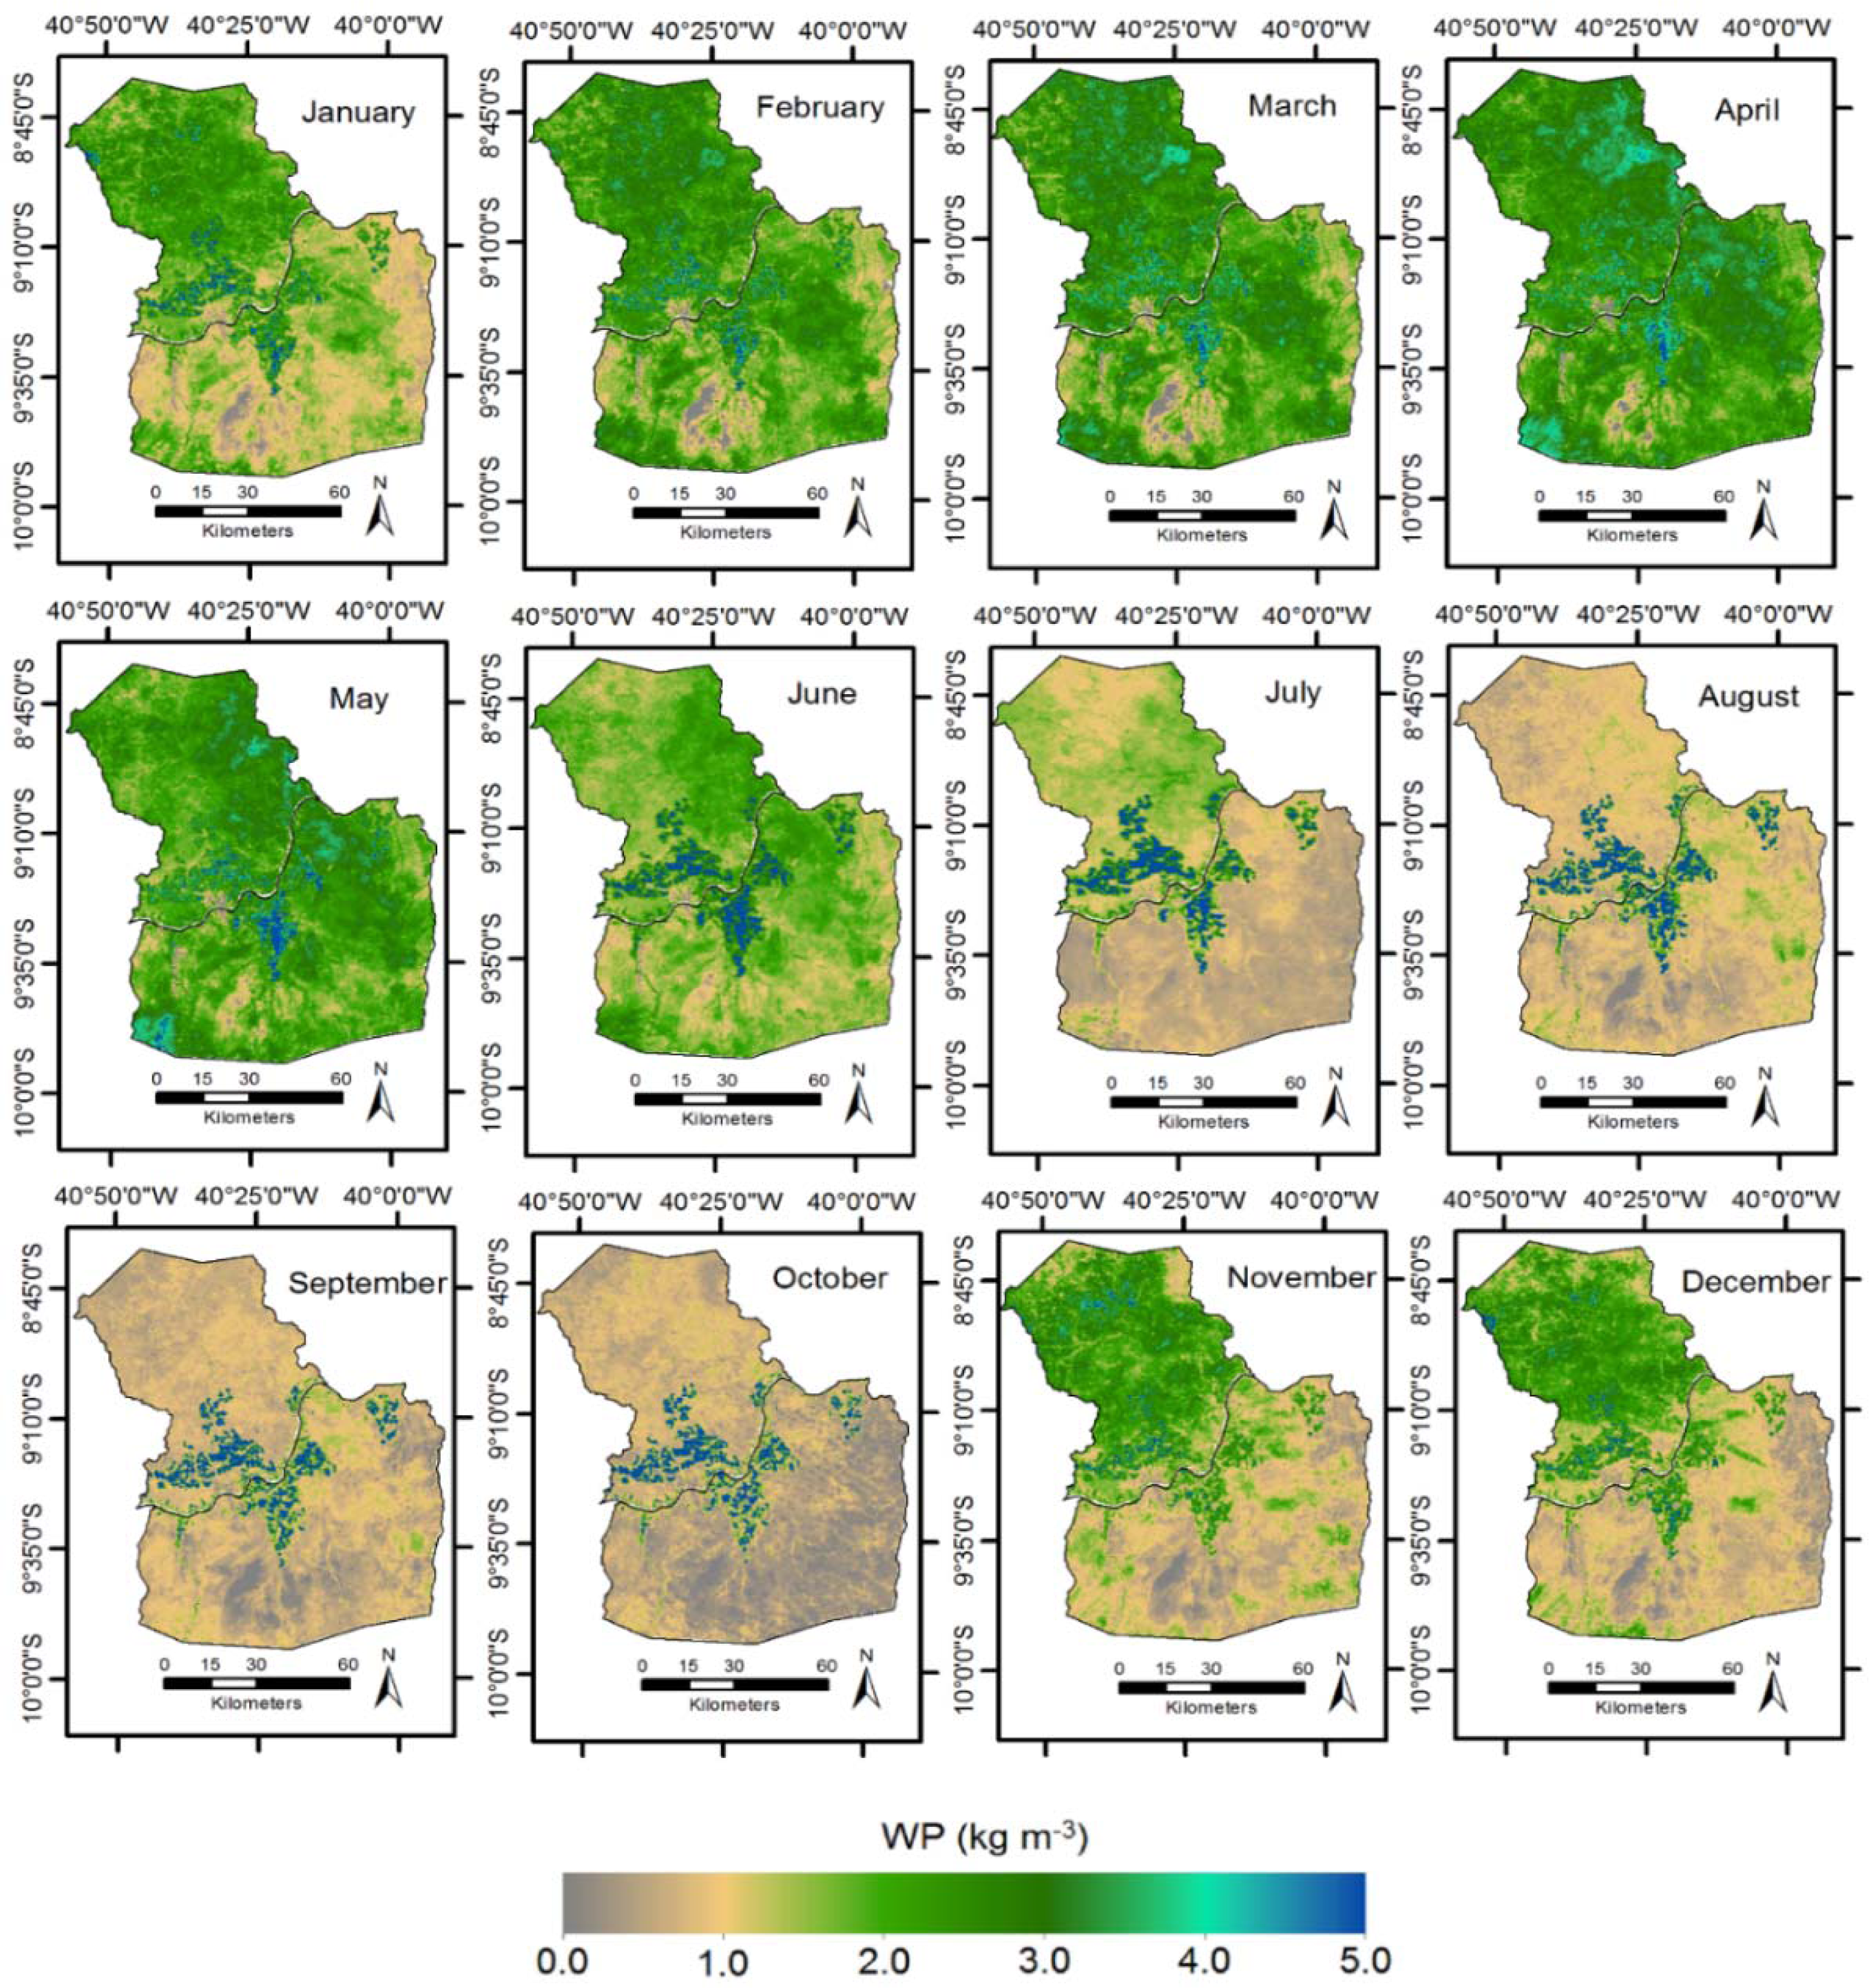
Figure 7 presents the spatial variation of the WP monthly values in the mixed Brazilian semi-arid agro-ecosystems of Petrolina (PE) and Juazeiro (BA) municipalities, respectively Pernambuco (PE) and Bahia (BA) states, along the year of 2011.
The maximum WP values happened in March for Petrolina and in April for Juazeiro, with averages of 2.7 and 2.4 kg·m−3, respectively. However, some areas presented WP higher than 4.5 kg·m−3 including both, irrigation and natural conditions (bluish pixels). The corresponding lowest WP mean pixel values were 0.9 and 0.6 kg·m−3, respectively in September and October, because the naturally driest soil moisture conditions of the year and the smaller irrigated areas in relation to those for natural vegetation.
Table 3 shows the WP monthly average values and the standard deviations (SD) for irrigated crops (IC) and natural vegetation (NV) in Petrolina and Juazeiro, respectively Pernambuco (PE) and Bahia (BA) states, Brazil, along the year of 2011.
Analysing only irrigated crops, although less strongly than in the case of ET and BIO, WP differences between the municipalities can also be identified. In this case, March presented the highest values in Petrolina, while in Juazeiro they happened in May. For natural vegetation, the highest mean pixel values were in April while the lowest ones occurred in October for both municipalities. WP from irrigated crops in Juazeiro was 86% of that for Petrolina while this percentage for natural vegetation was 74%, re-enforcing the effect of the differences in rainfall and soil water storage conditions between the municipalities.
The smaller BIO values compensated the lower ET rates in Juazeiro in WP calculation (see
Equation (11)). Considering the annual incremental WP, it was in average 1.0 kg·m
−3 for both municipalities, with the spatial variation in Juazeiro slightly higher. Although the lowest SD values being during the driest period, as they were for ET and BIO, the monthly spatial differences are lower, showing compensation when taking into account the spatial variations of BIO and ET together.
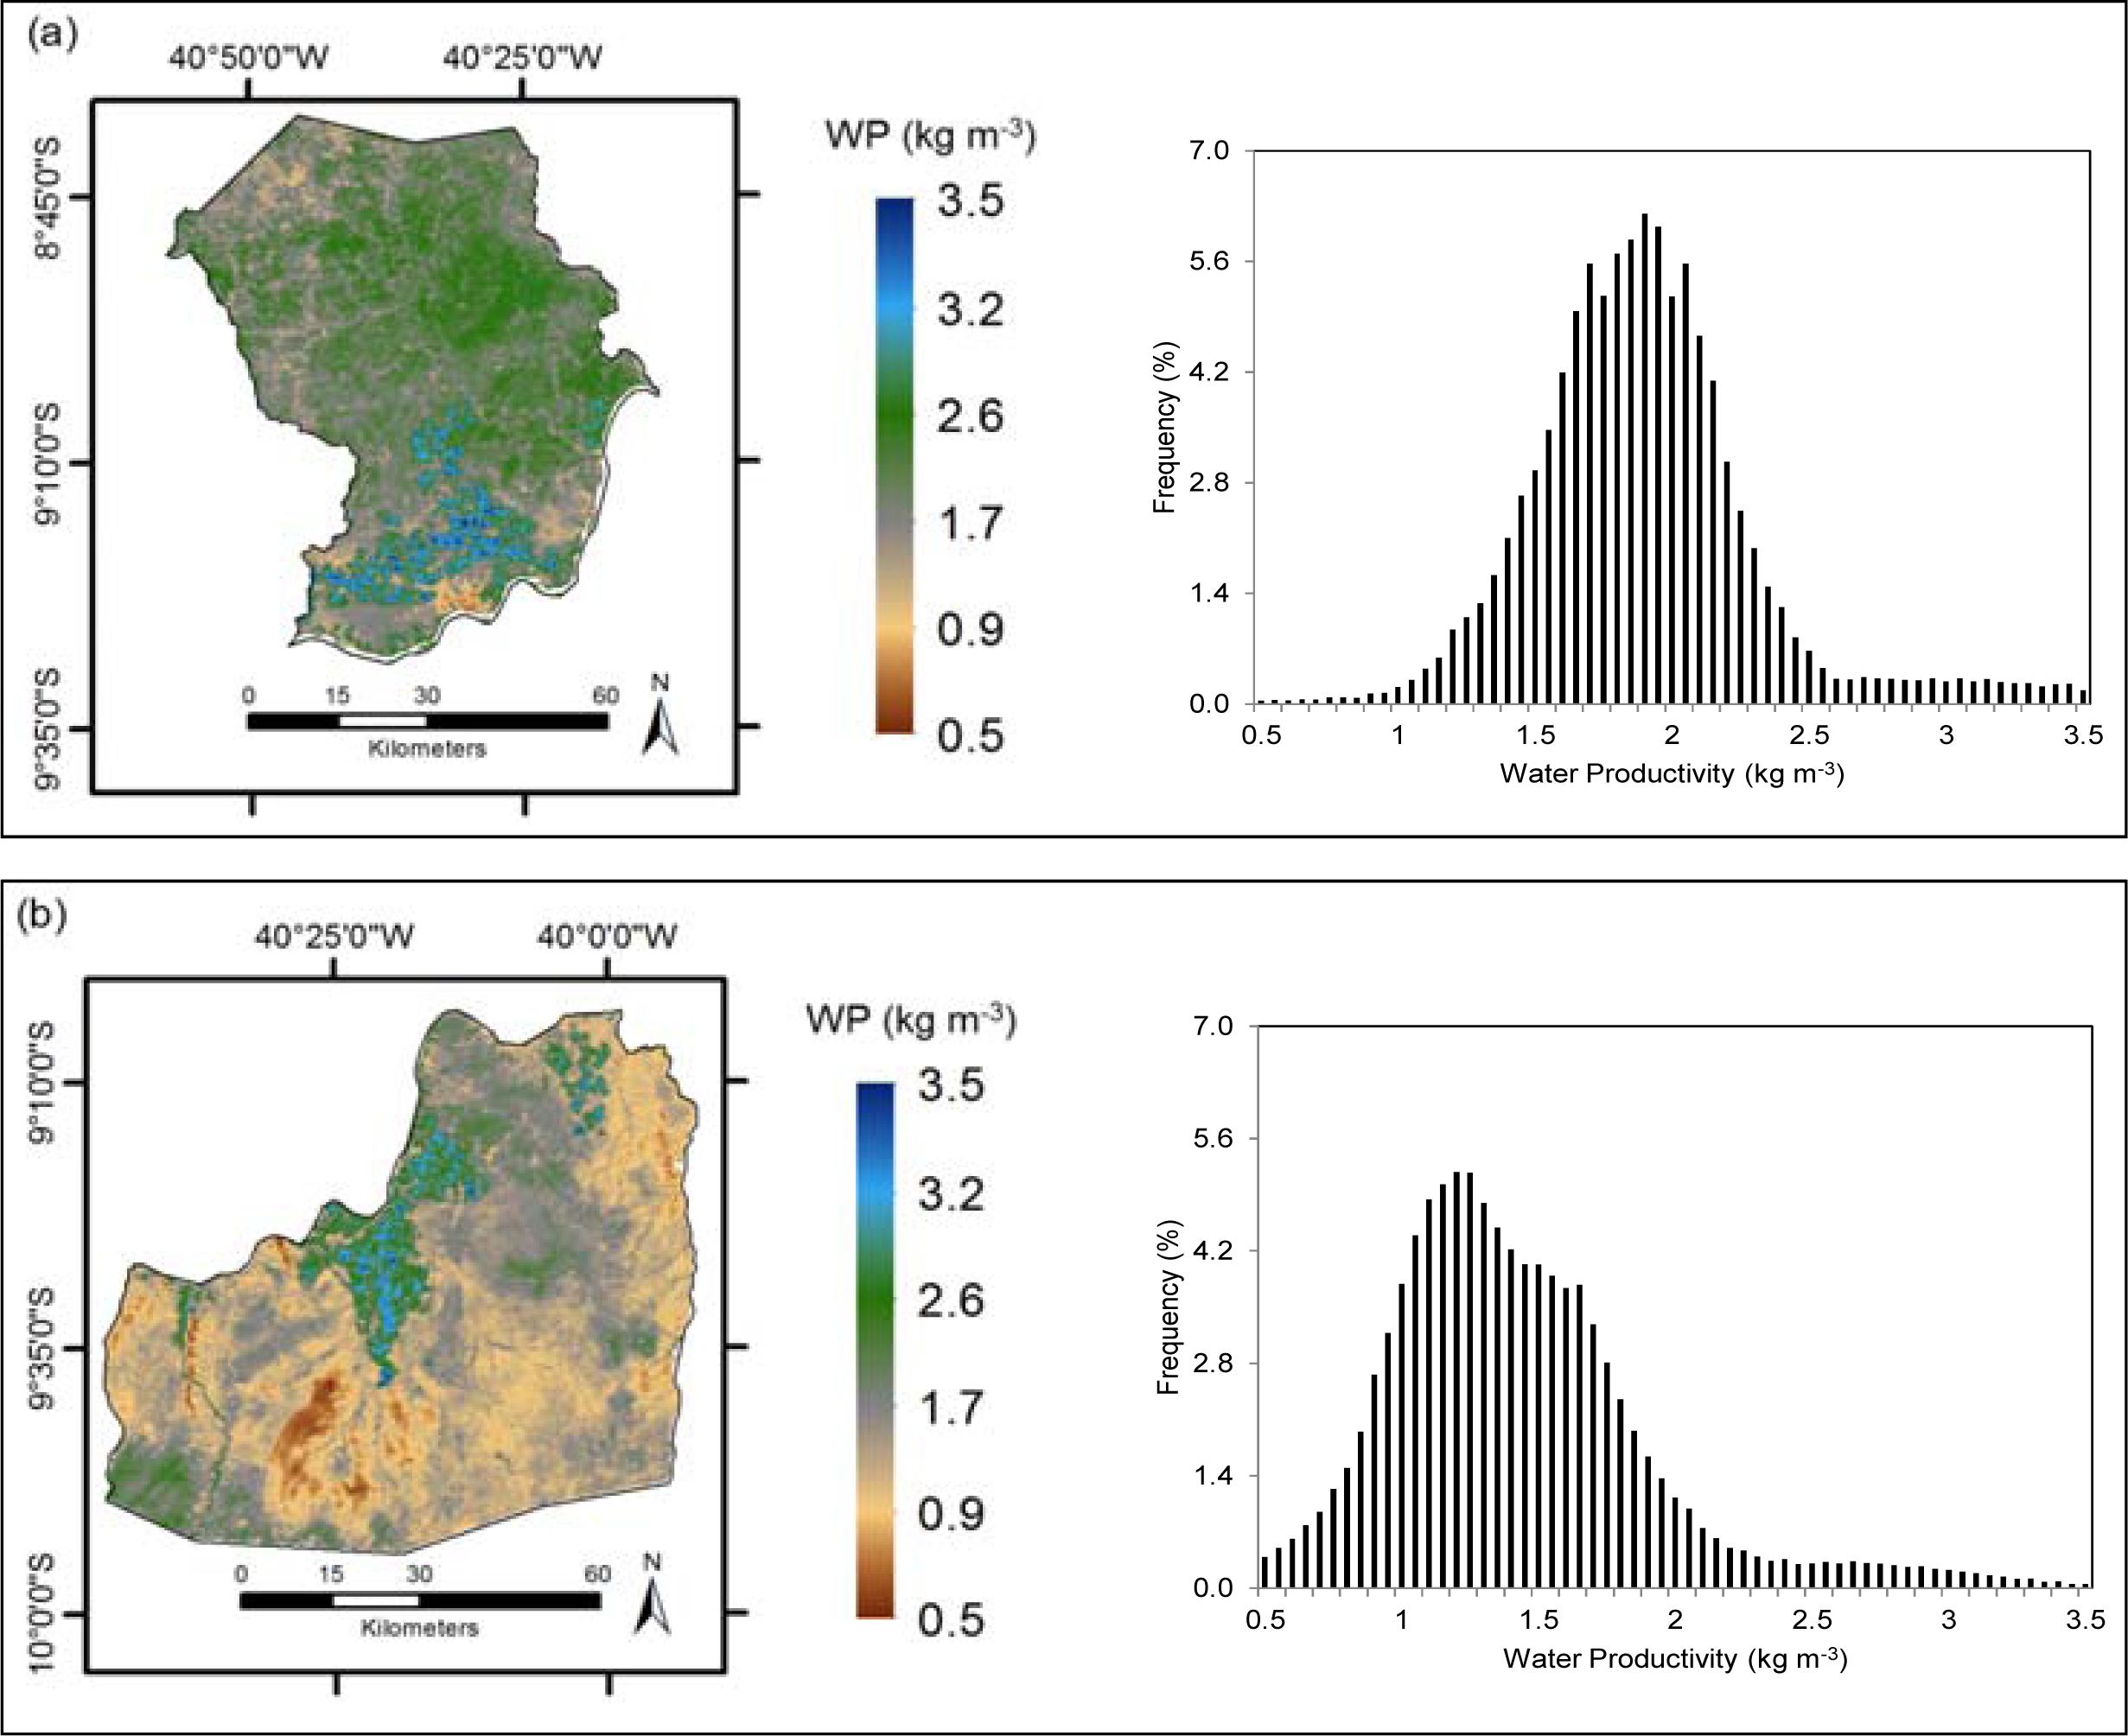
Figure 8 presents the spatial distribution of the annual WP pixel values, together with the histograms, in Petrolina and Juazeiro Municipalities, respectively Pernambuco (PE) and Bahia (BA) states, Brazil, for the year of 2011.
The WP annual averages for the mixture of agro-ecosystems were 1.7 and 1.4 kg·m−3, in Petrolina and Juazeiro, respectively, with the values for the second municipality representing 75% of those from the first one. In both municipalities, irrigated crops were well identified by WP above 2.5 kg·m−3, represented by the bluish pixels.The symmetric histograms from both municipalities showed that WP normalized the lower ET and BIO in Juazeiro. The most frequent WP values in Petrolina were between 1.6 and 2.2 kg·m−3 while for Juazeiro this range was from 1.0 to 1.6 kg·m−3. Although slighter than in the cases of ET and BIO, the different large-scale annual WP values between the municipalities can be mainly explained by differences in rainfall and soil water storages amounts, increasing the rainfall use efficiency by the natural vegetation in Petrolina in comparison with Juazeiro.
Multiplying BIO by the harvest index (HI) make it possible to estimate the crop water productivity (CWP) [
1,
6,
34], which corresponds to the bluish highest WP pixels at the vicinities of the São Francisco River in
Figure 8. HI values were found to be around 0.60 for vineyards and 0.80 for mango orchards under the semi-arid conditions of the Brazilian Northeast [
12]. In Southwest France, HI values were 0.25 for rain fed sunflower and 0.48 for irrigated maize [
22], while for wheat, an average of 0.35 was reported, resulted from several experiments around the word [
28].
In the semi-arid Inner Mongolia, CWP values of 1.1 to 1.3 kg·m
−3 for oats; 1.5 to 2.6 kg·m
−3 for sunflower; 0.5 to 1.1 kg·m
−3 for legumes; and 3.1 to 4.4 kg·m
−3 for potato, were reported [
35]. For oil seed crop, under the semi-arid conditions of India, CWP ranged from 1.9 to 2.3 kg·m
−3 [
20]. For wheat, analyses of CWP around the world resulted in a range of 0.52 to 1.42 k·m
−3 [
28]. However, previous studies with Landsat images in Petrolina [
12], application of the HI values to BIO images, retrieved table grapes and mangoes with higher CWP values, around 2.8 kg·m
−3 and 3.4 kg·m
−3, respectively. These last previous results are confirmed by the current highest bluish WP pixel values under irrigation conditions showed in
Figure 8, obtained from MODIS images processing, which are in majority irrigated grapes and mangoes plots.
Some uncertainties in the current MODIS results, considering irrigated areas and natural vegetation, are mainly in the use of the thermal band of 1 km during the ET and BIO calculations. This implies that several pixels cover a large mixture of land use, reducing the accuracy of the vegetation classification. To minimize this problem, a new methodology is being elaborated for retrieving T0 from the residual emitted long wave radiation, after the acquirements of all other radiation balance components. The method increases the resolution for a pixel size of 250 m and will be presented in future papers.
4. Conclusions
The SAFER, Monteith and SUREAL models have been applied to demonstrate the feasibility of computing the changes in water and vegetation variables when natural vegetation is being replaced by irrigated crops in the Brazilian semi-arid region. Surface albedo, surface temperature and NDVI acquired from MODIS satellite images together with agro-meteorological data were the input parameters for the modelling. This combination allowed the large-scale water productivity assessments in a mixture of agro-ecosystems located in the agricultural growing regions of Petrolina, Pernambuco state and Juazeiro, Bahia state. The analyses may subsidize better understandings of the biophysical parameters dynamics, important for appraising the land-use change impacts, key information when Federal and Municipal Governments plan expansions of the irrigated areas with rational criteria.
In relation to evapotranspiration, the SAFER model followed well the thermo-hydrological conditions along the year. It could be concluded that, taking 2011 as a reference, the period with the highest water productivity values were from March to April. This happened during the rainy season for both irrigated and natural ecosystems. Although with variation along the year, the incremental values resulted from the introduction of irrigated crops were 553 and 545 mm·yr−1 for evapotranspiration; 18.61 and 16.69 t·ha·yr−1 for biomass production; respectively for Petrolina and Juazeiro. Considering the water productivity as the ratio of biomass production by evapotranspriration, the incremental value was 1.0 kg·m−3 for both municipalities.
Water productivity (WP) from irrigated crops in Juazeiro was 86% of that for Petrolina while this percentage for natural vegetation was only 74%. The most frequent WP values in Petrolina were between 1.6 and 2.2 kg·m−3 while in Juazeiro this range was from 1.0 to 1.6 kg·m−3. The differences between the municipalities can be mainly explained by different precipitation and soil water storages amounts, increasing the rainfall use efficiency by the natural vegetation in Petrolina, when comparing with Juazeiro.
It was demonstrated that the large-scale water productivity parameters can be analysed from instantaneous measurements of the visible and thermal radiations by using only four MODIS bands. This was possible by modelling the ratio of the actual to reference evapotranspiration at the satellite overpass time, and with the availability of daily weather variables. These approaches provide large-scale temporal information on growth rates as well plant responses to dynamic weather and irrigation conditions, being useful for monitoring vegetation and water parameters. In the specific case of Brazil, this is particularly relevant, because there is an on-going water transfer action in the São Francisco river basin by the Brazilian Federal Government, being the analyses in this study highly relevant to apply concepts of evidence-proofed decision-making.
The available tolls tested here can be operationally implemented to monitor the intensification of agriculture and the adverse impact on downstream water users in changing environments. They can be used with more confidence in other parts of the world, with probably only the need of adjustments in the original equation coefficients. The limitations of the MODIS images use should be the spatial resolution of the thermal resolution of 1 km, with several pixels covering a mixture of land use. To overcome this problem, a new methodology is being developed to retrieve the surface temperature from the residual emitted long wave radiation after having all other radiation balance components acquired, downscaling the energy and water parameters to a better spatial resolution of 250 m.


