1. Introduction
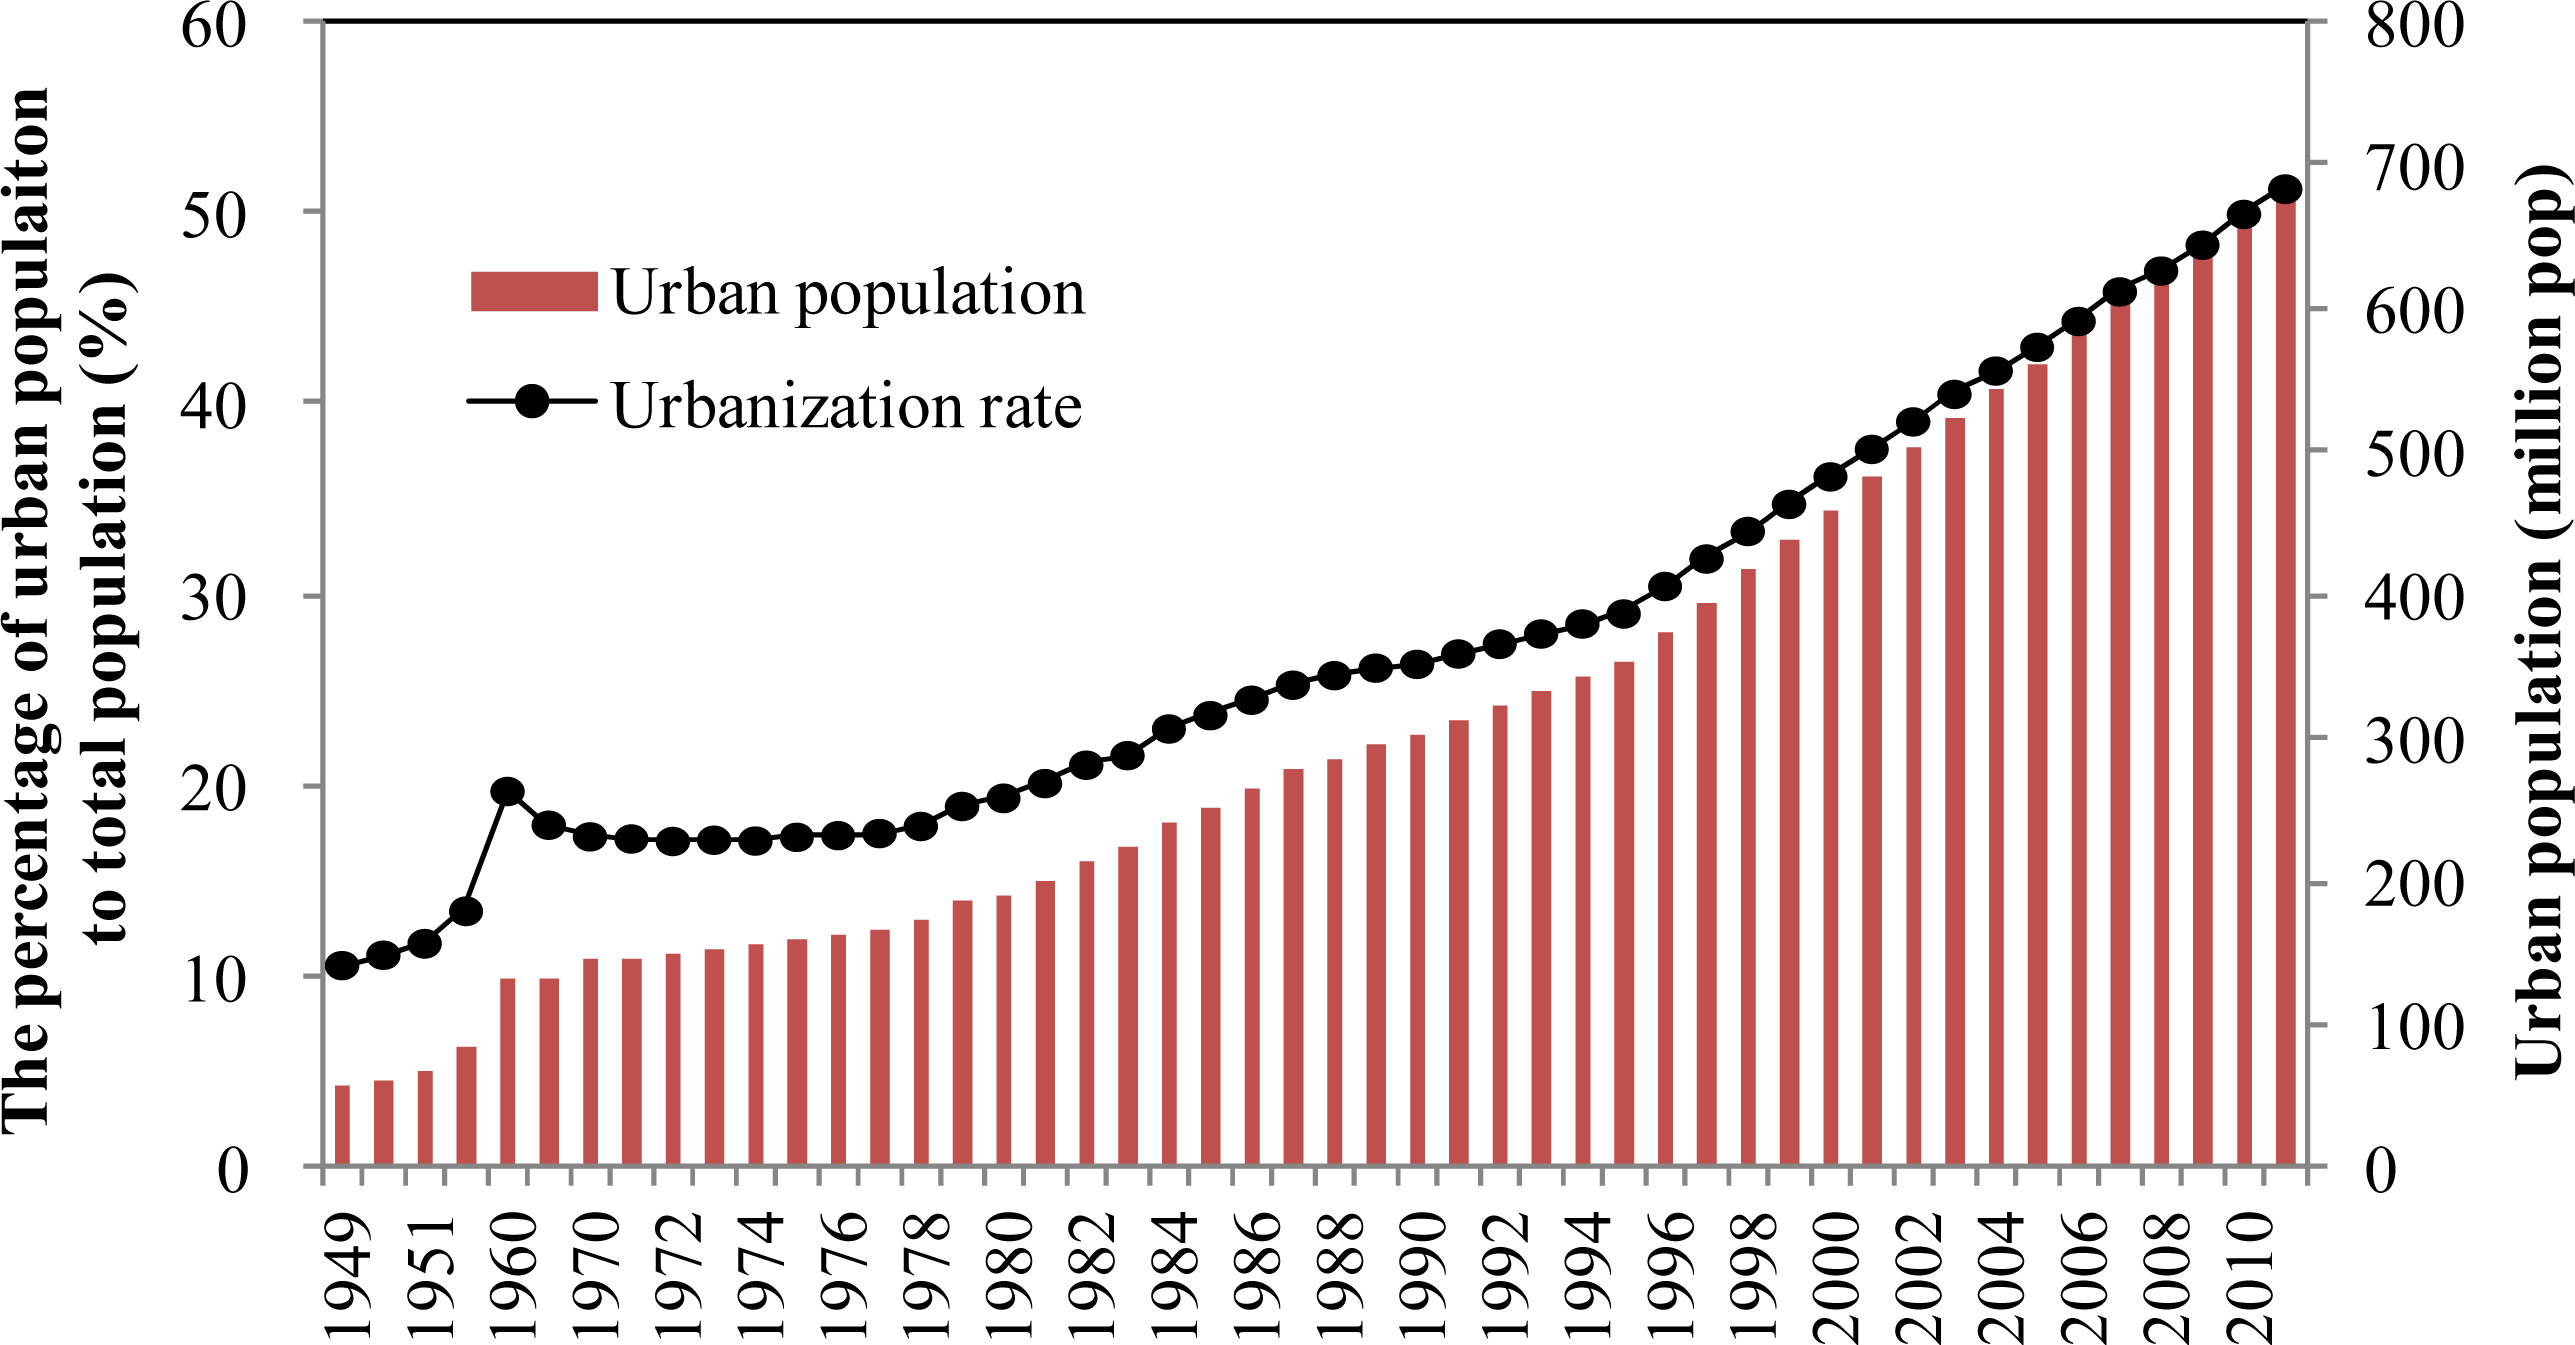
Since the late 1990s, the process of urbanization in China has accelerated. The annual average rate of urbanization in this period is three times as rapid as that from 1949 to 1990 (
Figure 1, [
1]). This rapid urbanization could affect the national food supply and has attracted great concern from the Chinese government, due to the combination of a vast population and a scarcity of available cropland per capita. Since the 1990s, the government has promulgated a series of strict policies to respond to these impacts, including basic farmland protection regulation in 1994 and a dynamic balance of total farmland policy in 1998. Although these policies have alleviated national cropland loss, according to statistics from the Ministry of Land and Resources, cropland in China has decreased by 69.31 × 10
4 ha per year since the late 1990s [
2]. Several factors have caused this loss, including rapid economic development, population growth and migration, urbanization, ecological restoration project, natural disaster, and land degradation, among which urbanization is a prime contributor [
3,
4]. The loss of cropland may further reduce regional agricultural productivity [
5]. Although with globalization of food and agriculture, this reduction may be offset to a certain extent, the availability to food is largely affected by global food price and accessibility to global market [
6]. For China, with nearly 20% of the global population, it is extremely important to keep the ability to feed itself. Thus, tracking the impacts of urbanization on cropland and agricultural productivity is a prerequisite to better guarding the food supply, especially as China is predicted to continue its rapid urbanization over the next few decades.
Recent studies have investigated the characteristics of urban sprawl, induced cropland and agricultural production loss at the regional and national scales. For example, Wang
et al. [
2] used land survey data from the Ministry of Land and Resources to investigate the changes of urban land and cropland. Nevertheless, these data are at the county level and could not capture the spatial patterns of land use change in detail. Due to the geographic dependence of agricultural productivity, different conversion of the same amount of cropland may cause different losses of agricultural production [
7]. From this perspective, remote sensing provides an especially valuable tool to capture land use changes in a spatially explicit and frequent updated manner [
8,
9]. Based on Landsat-TM derived land use data, Tan
et al. [
10] have investigated the characteristics of urban expansion and consequent loss of cropland of 145 major cities in China. Yan
et al. [
11], and Deng
et al. [
7], analyzed the impact of land use change, especially cropland dynamics, on agricultural productivity in China from 1990 to 2000. However, few studies have focused on the impact of urbanization on agricultural productivity at the national scale.
In the present study, the spatiotemporal patterns of the transformation of cropland into urban land were characterized based on reliable land use change data derived from Landsat TM/ETM+ images, and the impact of these changes on agricultural productivity during China’s rapid urbanization period from 1990 to 2010 was revealed. The study addressed the following questions: (1) what is the spatiotemporal pattern of the transformation of cropland into urban land; (2) how has this conversion affected agricultural productivity; and (3) what causes have induced the transformations. The results can provide useful information for the development of land use policy and urban development plans in China.
2. Materials and Methods
2.1. Land Use Data
To characterize the spatiotemporal patterns of the conversion of cropland land into built-up land, land use data derived from Landsat TM/ETM+ images were collected from the National Resources and Environmental Scientific Data Center (RESDC) of the Chinese Academy of Sciences (CAS). Since the late 1980s, CAS has organized more than 100 geographers to produce land use data and has monitored land use change based on satellite images for every five years. These data were manually interpreted from Landsat TM/ETM+ images and corrected and validated through a large amount of fieldwork. The overall accuracy of the land use data exceeded 92%, and the accuracy of the land use change data exceeded 95% [
12,
13]. These data have proven to be one of the most reliable data sets for characterizing land use change at the national scale in China, and include six land classes: cropland, forest, grassland, water bodies, built-up land, and unused land [
14]. In this study, the data from 1990, 2000, and 2010, over mainland China (Hong Kong, Macao, and Taiwan were not included), were collected. The present study only focused on the conversion of cropland into built-up land. The land use and change data used in this study were raster data, which were produced by a 1 km area proportion model [
7,
12]. Each grid of the data includes the area proportion information of the land use class or its changes. To facilitate the calculations, the value of the grid was multiplied by 100.
2.2. Meteorological Data
To estimate potential agricultural productivity, the duration of the season without frost over the past two decades were calculated. Frostless season is one of the most important thermal factors impacting crop growth and is defined as the number of days when the daily minimum temperature exceeds 0 °C. Daily temperature data for 671 meteorological stations were collected from the China Meteorological Administration. The frostless season was calculated based on these daily records for each year from 1990 to 2010.
As this research aimed to reveal the impact of the conversion of cropland into urban land on agricultural productivity, it was necessary to eliminate the impact of climate change. Therefore, the duration of the season without frost over the past two decades were averaged for each station and further interpolated into a 1 km by 1 km grid, using thin-plate smoothing splines (ANUSPLIN software) [
15]. ANUSPLIN allows for the involvement of multiple covariates in the surface simulation and performs fairly well in the interpolation of climate data [
16,
17]. In this study, the elevation factor was used as a covariate to improve the interpolation of frostless season.
Solar radiation data were collected from RESDC CAS. These data were derived from Geostationary Meteorological Satellite (GMS-5) images using the radiative transfer model.
2.3. Estimation of Potential Agricultural Productivity
Potential agricultural productivity (PAP) is the capacity of crops to transform solar radiation into biochemical energy under certain climate, moisture and soil conditions and with optimal management practices and crop varieties. Many models have been developed, such as the environmental factor attenuation coefficient model (EFACM) [
18], the agro-ecological zone (AEZ) [
19], and the CERES maize model [
20]. EFACM emphasizes environmental factors and estimates PAP assuming no biological or human management constraints. This model further hypothesizes that the impact of environmental factors on agricultural productivity is linear.
Equation (1) demonstrates the model, which indicates that the maximum agricultural productivity is determined by environmental factors. The core of the model estimates the attenuation coefficients of light, temperature, moisture, and soil factors. This model is simple, but it explicitly characterizes the mechanism of crop growth. Many researchers have used this model to estimate regional PAP in China [
21–
23], and in this study, the model was employed to estimate PAP in China during the past two decades. Due to the limits of the data, the potential light-temperature agricultural productivity (PLTAP) was calculated.
where
YL is land productivity,
Q is total solar radiation and
f(
P),
f(
T),
f(
M) and
f(
S) are the effective coefficients of photosynthesis, temperature, moisture, and soil, respectively.
In
Equation (3),
C expresses the energy conversion coefficient (kcal/kg), which is the chemical energy contained in 1 kg dry matter.
Q (kcal/ha) represents the total solar radiation.
F is the light utilization rate and E is the economic coefficient. The values of
C,
F, and
E were taken from previous literature [
18,
22].
f(
T) is given by
Equation (4):
where
n represents the annual frostless season days.
All data were projected onto an Albers Conical Equal Area Projection with a central meridian of 105°E and two standard parallels of 25°N and 47°N.
3. Results
In the following two subsections, the spatiotemporal patterns of urban land developed from cropland are depicted in detail, and how this conversion has impacted agricultural productivity potential is analyzed. Detailed descriptions regarding the spatial distribution and changes of PLTAP can refer to our previous results [
22,
24].
3.1. Changes in Urban Development from Cropland
3.1.1. Total Amount of the Conversions
According to our estimates, approximately 4.18 Mha of cropland has been developed in China over the past two decades. From 1990 to 2000, approximately 1.50 Mha were converted, while approximately 1.8 times this amount (2.68 Mha) was converted from 2000 to 2010. Nevertheless, when compared to the total cropland in 1990, the total conversion accounts for 2.26% of the total cropland. This indicates that the annual conversion rate has averaged approximately 0.11% during the past two decades.
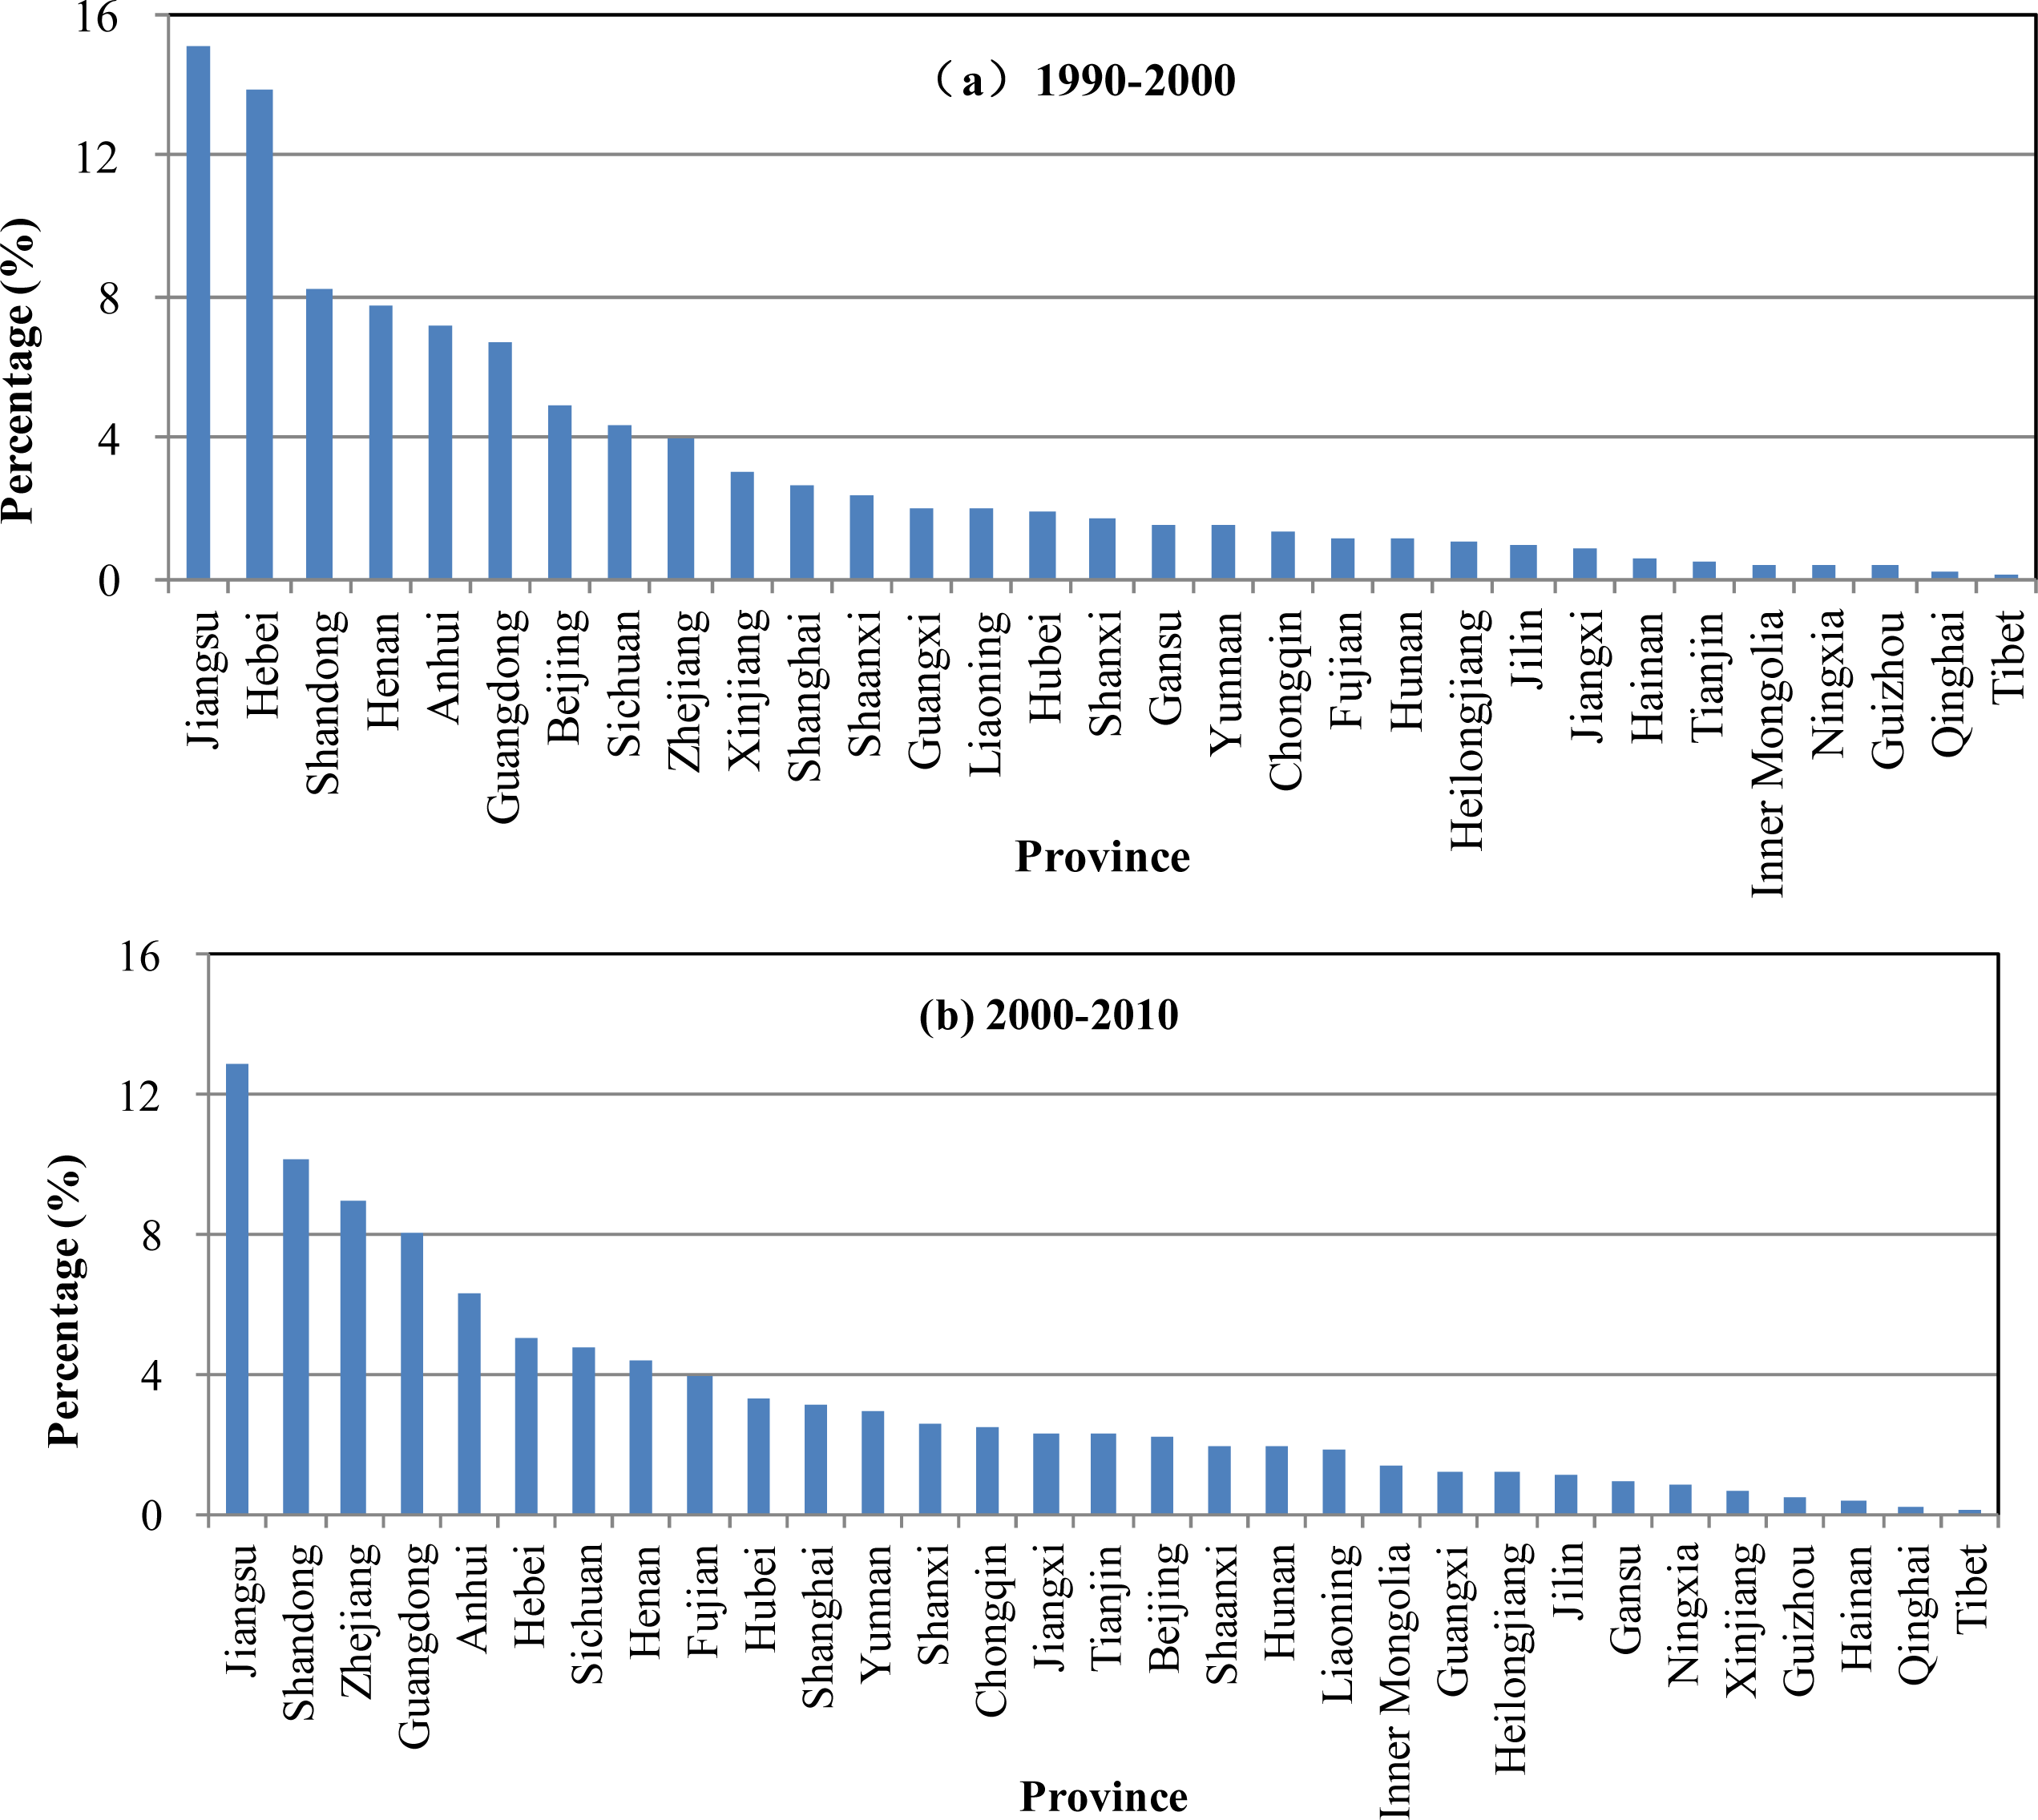
To identify the major conversion areas in China, the conversions in each province were compared with the total conversion across the country,
Figure 2. From 1990 to 2000, the provinces of Jiangsu, Hebei, Shandong, Henan, Anhui, and Guangdong were the major areas of conversion; urban use transformed a total of 0.88 Mha of cropland in these provinces. Approximately 58.7% of the total conversion in the country, thus, took place in these six provinces. In the period of 2000 to 2010, Zhejiang joined these provinces as a significant contributor to total conversion, comprising 9% of the total. Among all provinces, Jiangsu had the largest percentage of conversion: approximately 57.13 × 10
4 ha of cropland in the province has been used for urban development, accounting for approximately 14% of the total conversion in China. It should be noted that these regions are mainly located in the Huang-Huai-Hai Plain region and the lower and middle Yangtze River drainage basin, which have favorable light, temperature, and moisture conditions for crop growth [
22] and usually allow multiple cropping.
3.1.2. Spatial Distribution of the Conversions
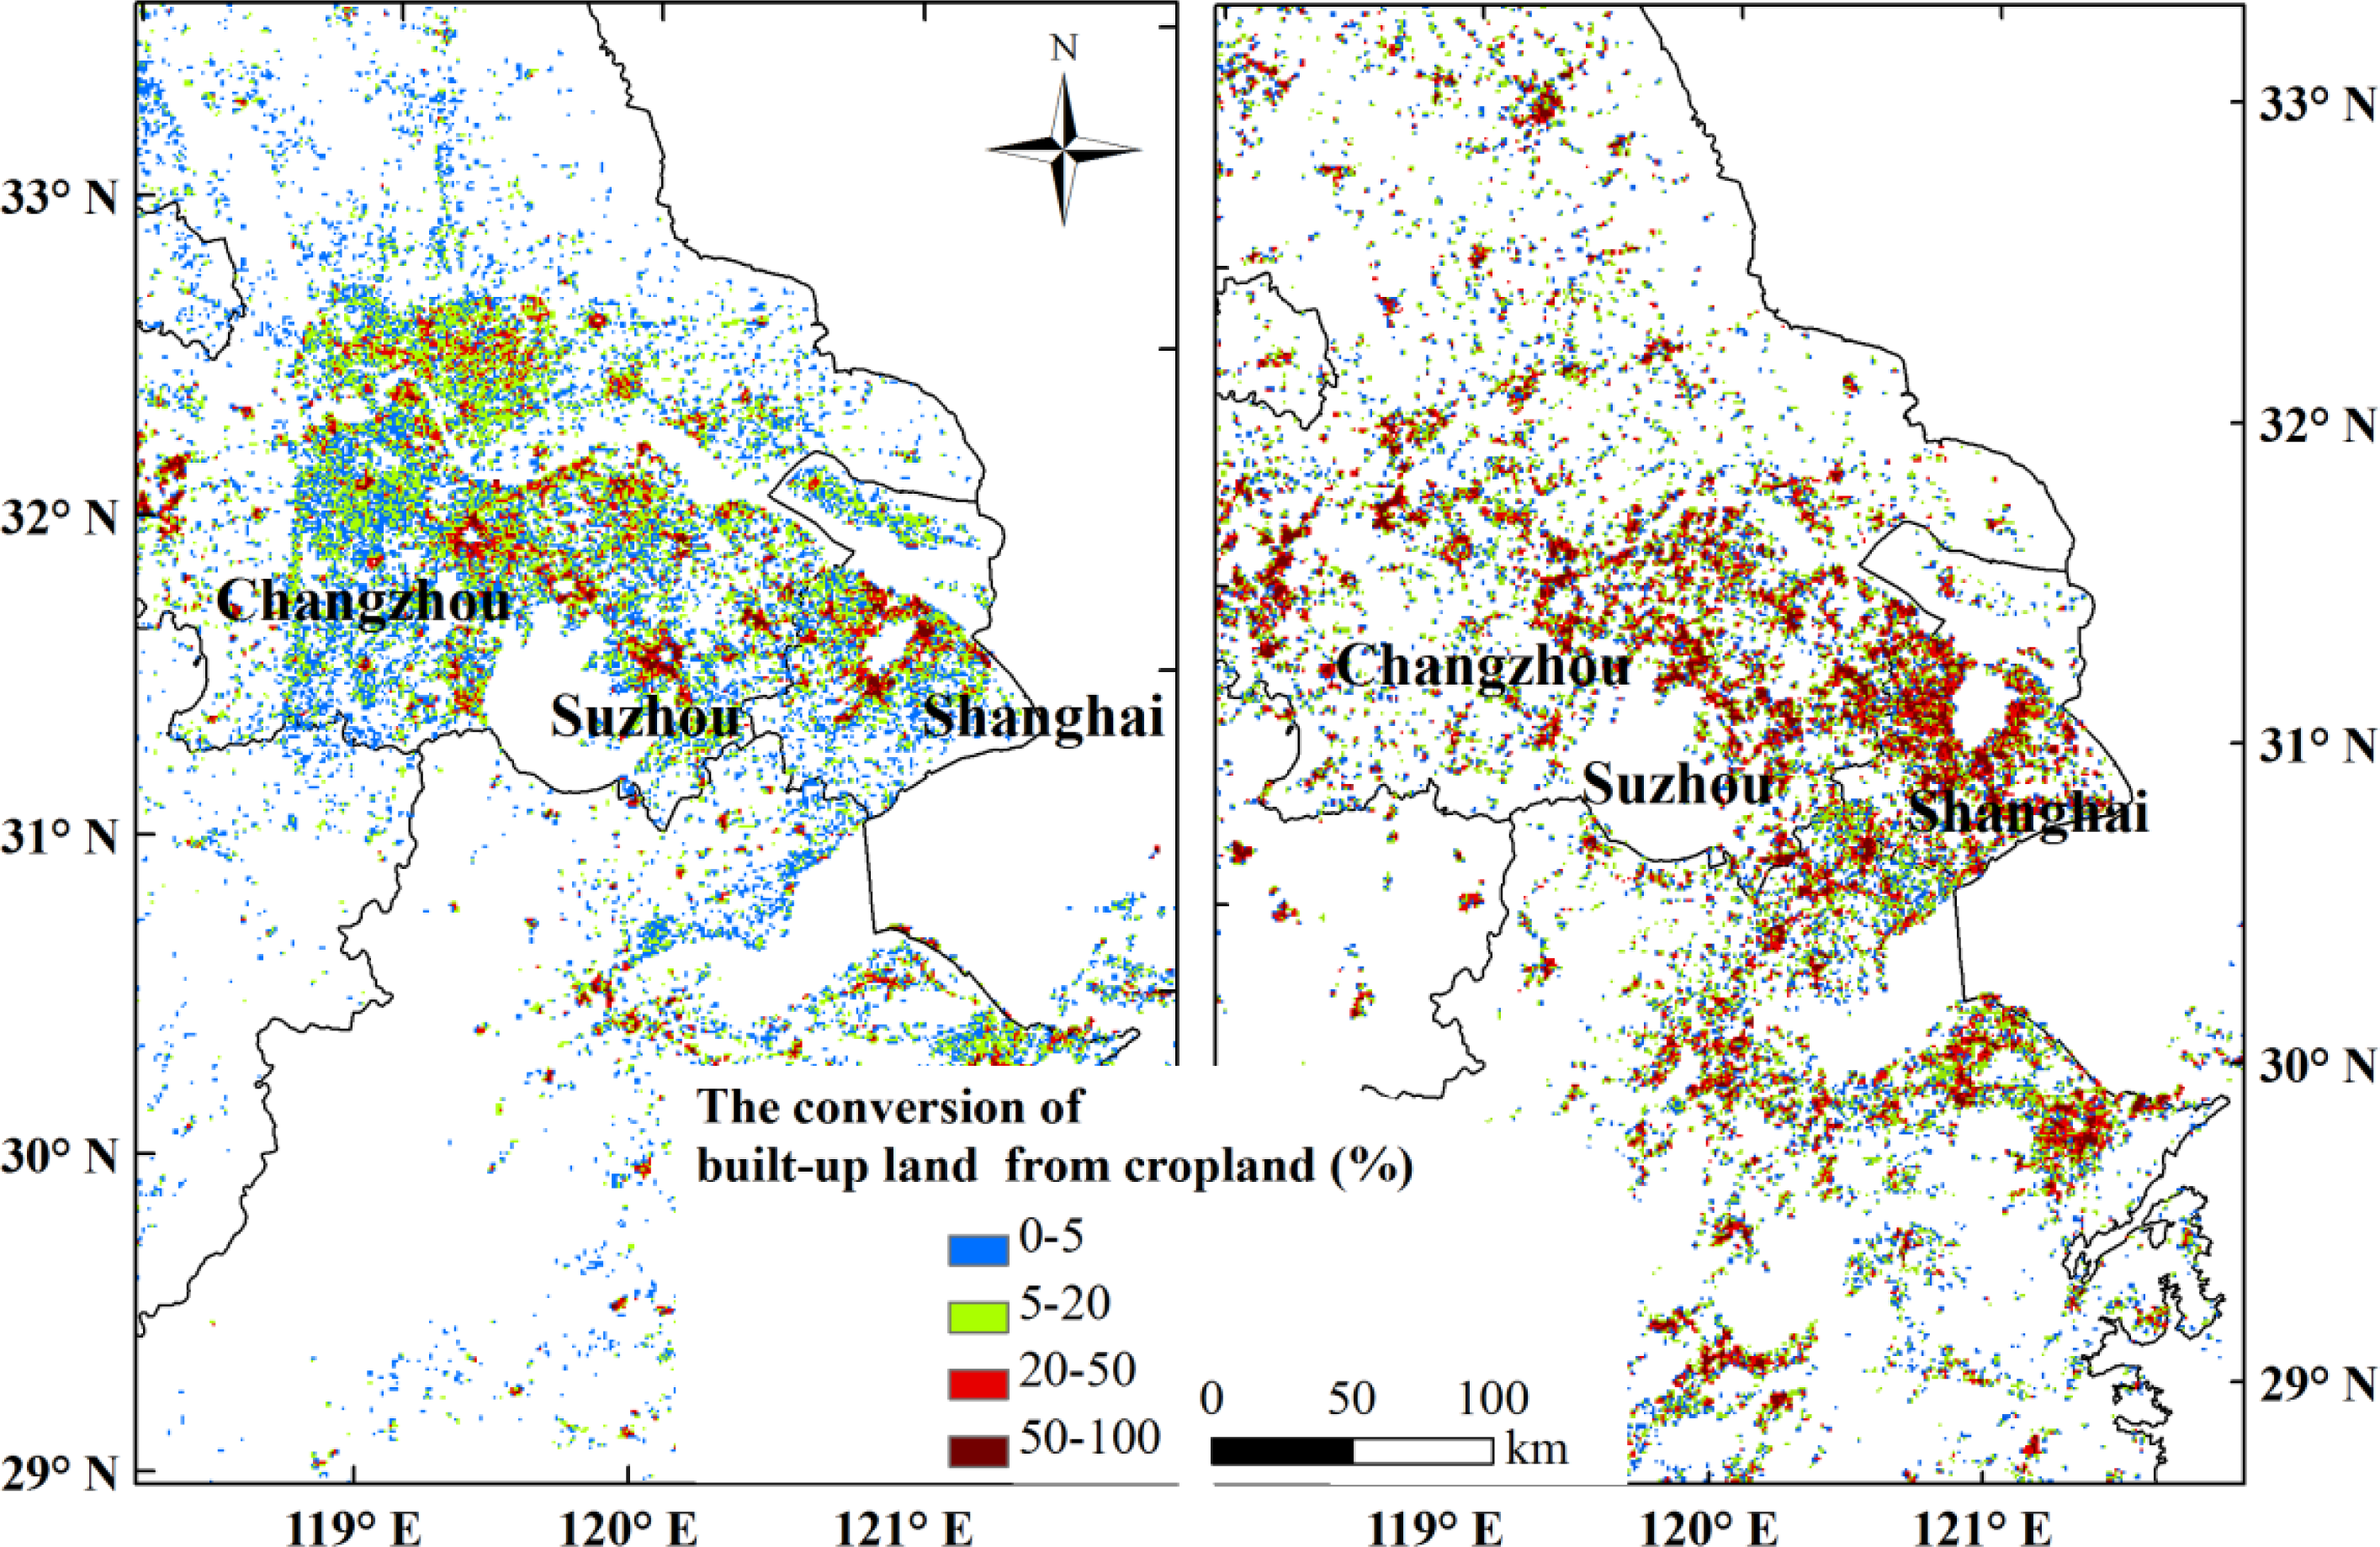
The spatial patterns of the conversions of cropland into built-up land in China over the past two decades are shown in
Figure 3. In the period of 1990 to 2000, most of the newly developed land was located in Central and Eastern China. Large conversions were mainly found on the periphery of major cities, such as Beijing-Tianjin-Tangshan in the North Plain and Shanghai-Suzhou-Changzhou in the Yangtze River Delta.
Figures 4 and
5 provide detailed descriptions of the conversions in these two regions.
From 2000 to 2010, conversion increased in most central and eastern regions and extended to the southeastern coast. In these areas, cropland on the periphery of large urban areas has been largely developed due to urban sprawl. In addition to the changes in the Beijing and Shanghai regions, intensive conversions were also observed in the regions of Haerbin-Changchun-Shenyang in the northeast, Zhengzhou-Wuhan-Guangzhou in the east and Chengdu and Xi’an cities in Central China. Further small conversion patches were extensively scattered across most of the central and eastern regions. This pattern is mainly related to national urban development planning during this period. Since 1955, the Chinese government has drawn up national development plans every five years. These plans provide the national development emphases for the following five years, involving industrial structure, urbanization, education and several other socio-economic aspects. In the 10th Five-Year plan (2001–2005), the government emphasized the urbanization of the belts of the Yangtze River, Haerbin-Beijing-Guangzhou and the Lianyungang-Lanzhou railways. The government also promoted urbanization in middle-sized and small cities and towns [
25]. In 2006, the government proposed the further development of urban clusters along the coast and the previously mentioned belts through the 11th Five-Year plan [
26]. At same time, the strategies of “Western Development”, “Northeast Revitalization”, and “The Rising of Central China” were sequentially implemented. These policies and development strategies greatly promoted urban extension in these areas.
3.2. Impact of Urban Development on PLTAP
3.2.1. Impact of the Conversion on Cropland Loss
As mentioned above, from 1990 to 2010, approximately 4.18 Mha of cropland were developed, while cropland loss over the same period was approximately 7.85 Mha. This indicates that approximately half of cropland loss could be attributed to urban development. The conversions of cropland into forest and grassland accounted for about 34.54% of the loss, and the residual was attributed to the conversion into water bodies (about 9.53%) and unused land (about 4.28%). The percentage of cropland loss due to urban development was 47.63% in the period 1990–2000 and increased to 56.91% in the period 2000–2010.
Figure 6 displays the percentages of cropland loss attributable to conversion into urban land in each province over the two periods. From 1990 to 2000, there were seven provinces, mainly located in central and eastern China, where the transformation of cropland to urban use accounted for over 75% of total cropland loss: Shanghai, Hebei, Anhui, Jiangsu, Henan, Shandong, and Beijing. From 2000 to 2010, the number of regions in which conversion accounted for over 75% of cropland loss increased to eleven provinces and extended to Southeastern China, concentrated on the eastern and southeastern coast. The percentages of cropland loss due to conversion in these provinces—Tibet, Shandong, Guangdong, Zhejiang, Jiangsu, Fujian, Hebei, Anhui, Tianjin, Beijing, and Shanghai—range from 81% to 97%.
3.2.2. PLTAP Losses Induced by Urban Development
According to our estimates, from 1990 to 2010, the transformation of cropland to urban use has caused a PLTAP loss of 71.45 Tg, of which approximately 24.33 Tg was lost from 1990 to 2000, and nearly twice that amount (approximately 47.12 Tg) from 2000 to 2010. When compared with the total PLTAP in 1990, the PLTAP loss over the past two decades accounts for 2.65% of the total PLTAP. This percentage is higher than the total percentage of converted cropland (2.26%), mainly because the cropland transformed to urban use is of higher quality than that converted to other land use classes. As indicated by Liu
et al. [
14], the conversions of cropland to forest and grassland were the major land use changes besides urbanization causing cropland loss in China. The average PLTAP per km
2 values of the major cropland conversions were further calculated. According to our statistics, the average PLTAP per km
2 of cropland developed to urban use is approximately 2,236 t/km
2, while that of cropland converted to forest and grassland is approximately 1,798 t/km
2. In the early 21st century, the Chinese government began to implement the “Returning Cropland to Forest and Grassland Project” in the southern and western regions. This project largely promotes the conversion of cropland to forest or grassland in these areas. As opposed to urban development in Eastern China, where climate and soil conditions are suitable for crop growth, most of these regions have either limited water resources or poor soil fertility.
The PLTAP loss caused by urban development was analyzed at the provincial scale (
Table 1). In
Table 1, the provinces are ranked by percentage loss of PLTAP over the study period from the province’s total PLTAP in 1990. An obvious percentage gradient can be seen among the provinces. In the developed provinces, such as Shanghai and Beijing, the PLTAP loss induced by urban development accounted for large percentages of the total agricultural potential. In the eastern coastal provinces, such as Fujian, Guangdong, Jiangsu, Tianjin, and Zhejiang, approximately 6% to 11% of PLTAP loss was caused by urban development. For the other provinces, the percentages of PLTAP loss from the total agricultural potential were all less than 4%.
4. Discussion
4.2. Future Conversion of Urban Development from Cropland
According to the urban development plan in China, the Chinese government will put the emphasis of urbanization in the central, eastern, and coastal regions in the near future [
29]. Due to the high correlation of spatial patterns of urban land and cropland, the cropland will be still major source of urban expansion [
30]. If it maintains current urban development mode in the Beijing-Tianjin-Hebei Metropolitan region, urban land in the next two decades will expand 2.47 × 10
5 ha, among which nearly 88% of this amount will be converted from cropland [
31]. In the coastal areas, besides cropland, coastal water will become another contributor of urban expansion [
32]. Nevertheless, with the optimization of urban land structure, the loss of cropland caused by urban development will be mitigated in the future.
4.3. Implications for Land Use Policy
In China, cropland protection has always held high priority in national development. Since the 1990s, the central government has promulgated several strict cropland reservation regulations, such as the dynamic balance of total farmland policy in 1998. This policy stipulates that local governments should reclaim the same amount of cropland as becomes occupied by construction use. This study found that the conversion of cropland to built-up land was largely located in the central and eastern regions, especially in eastern developed provinces such as Beijing, Shanghai, Jiangsu, Zhejiang, and Guangdong. According to the estimations of the Ministry of Land and Resources in China, these provinces are lacking in cultivated land reserves [
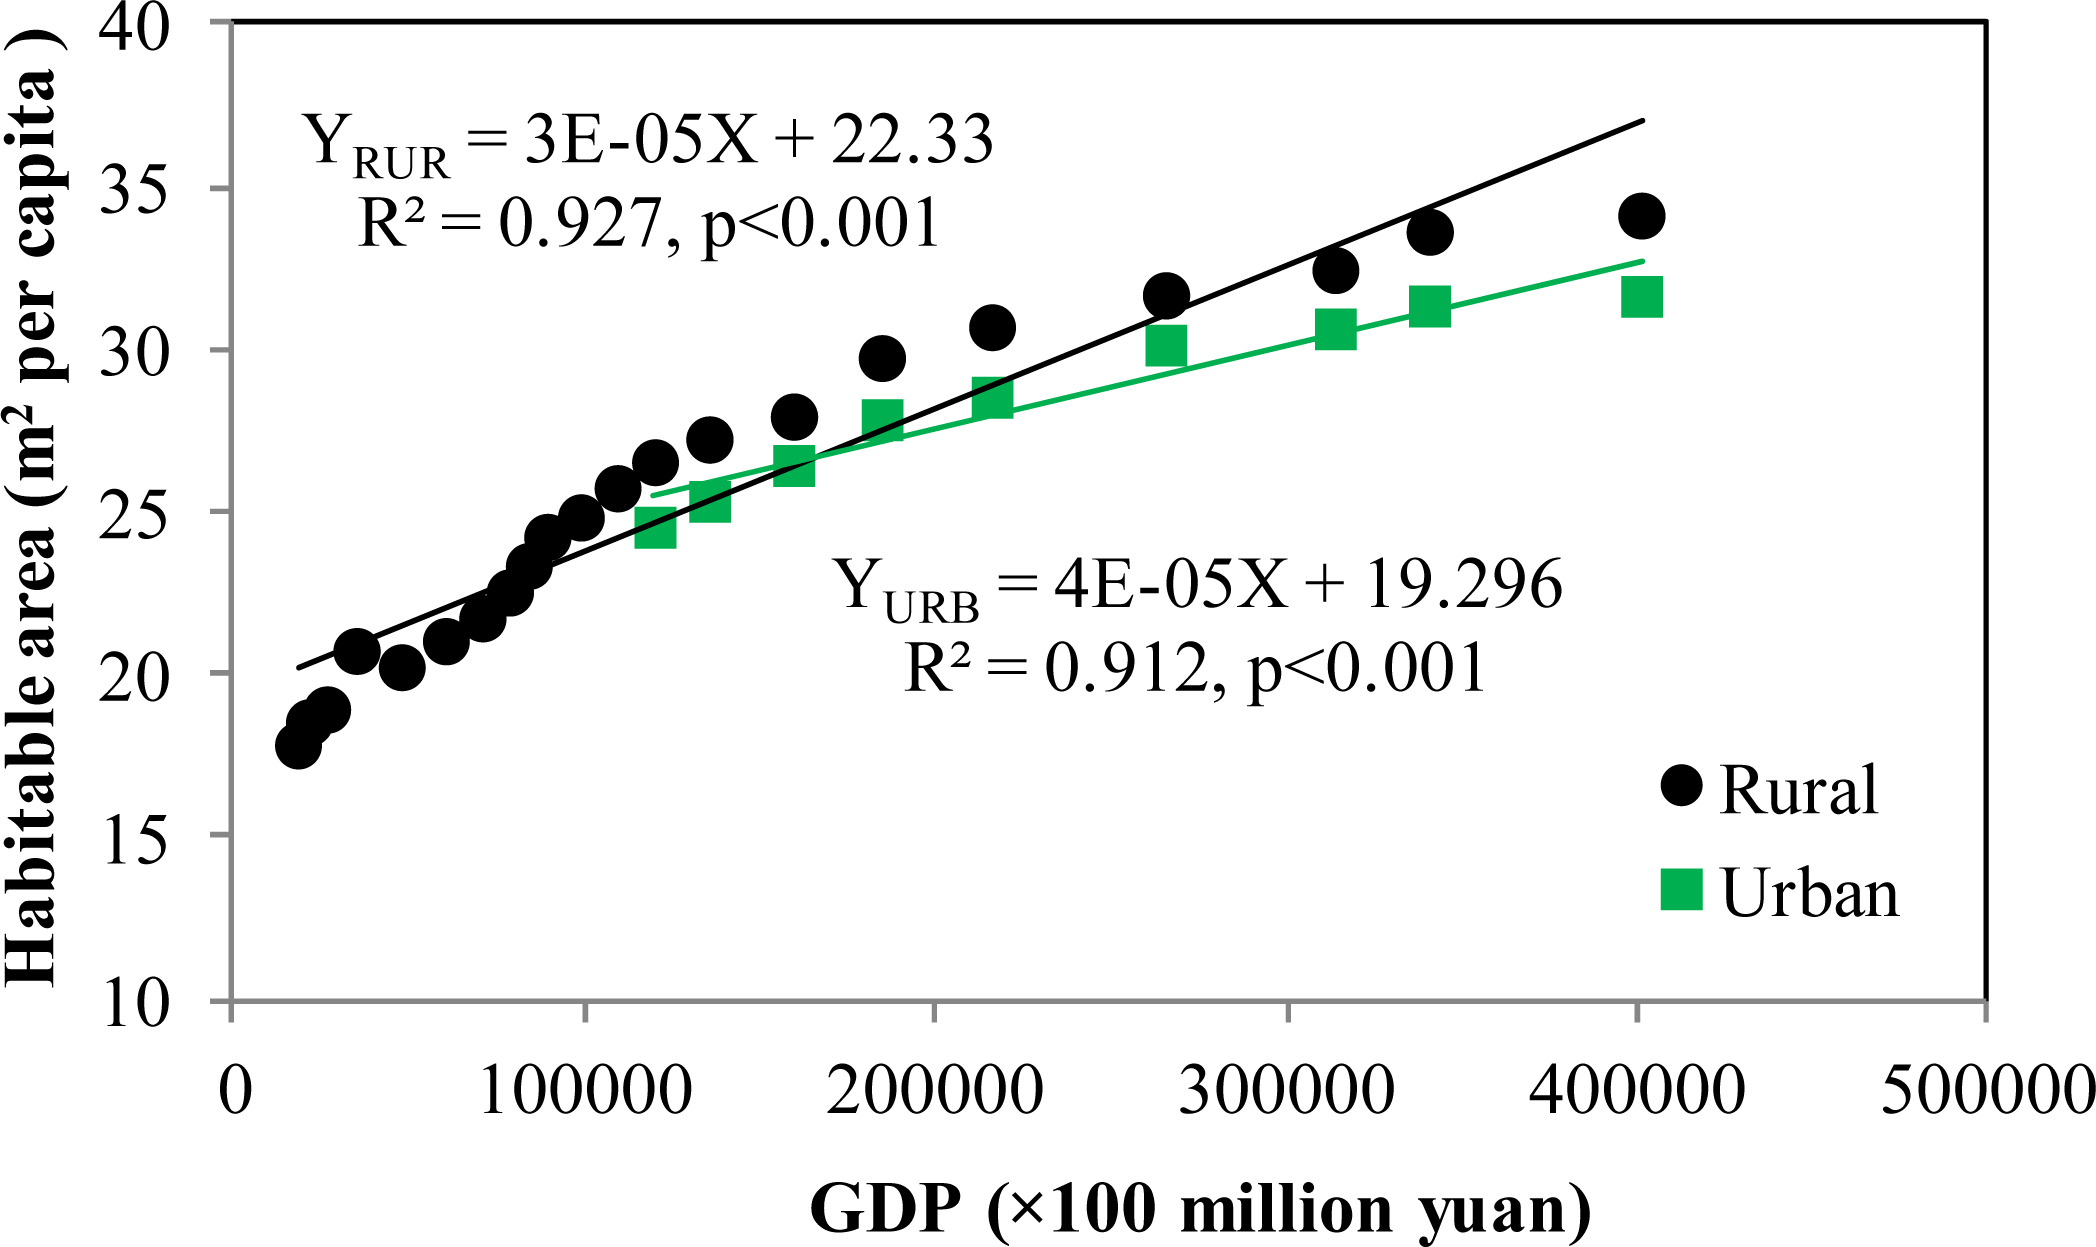
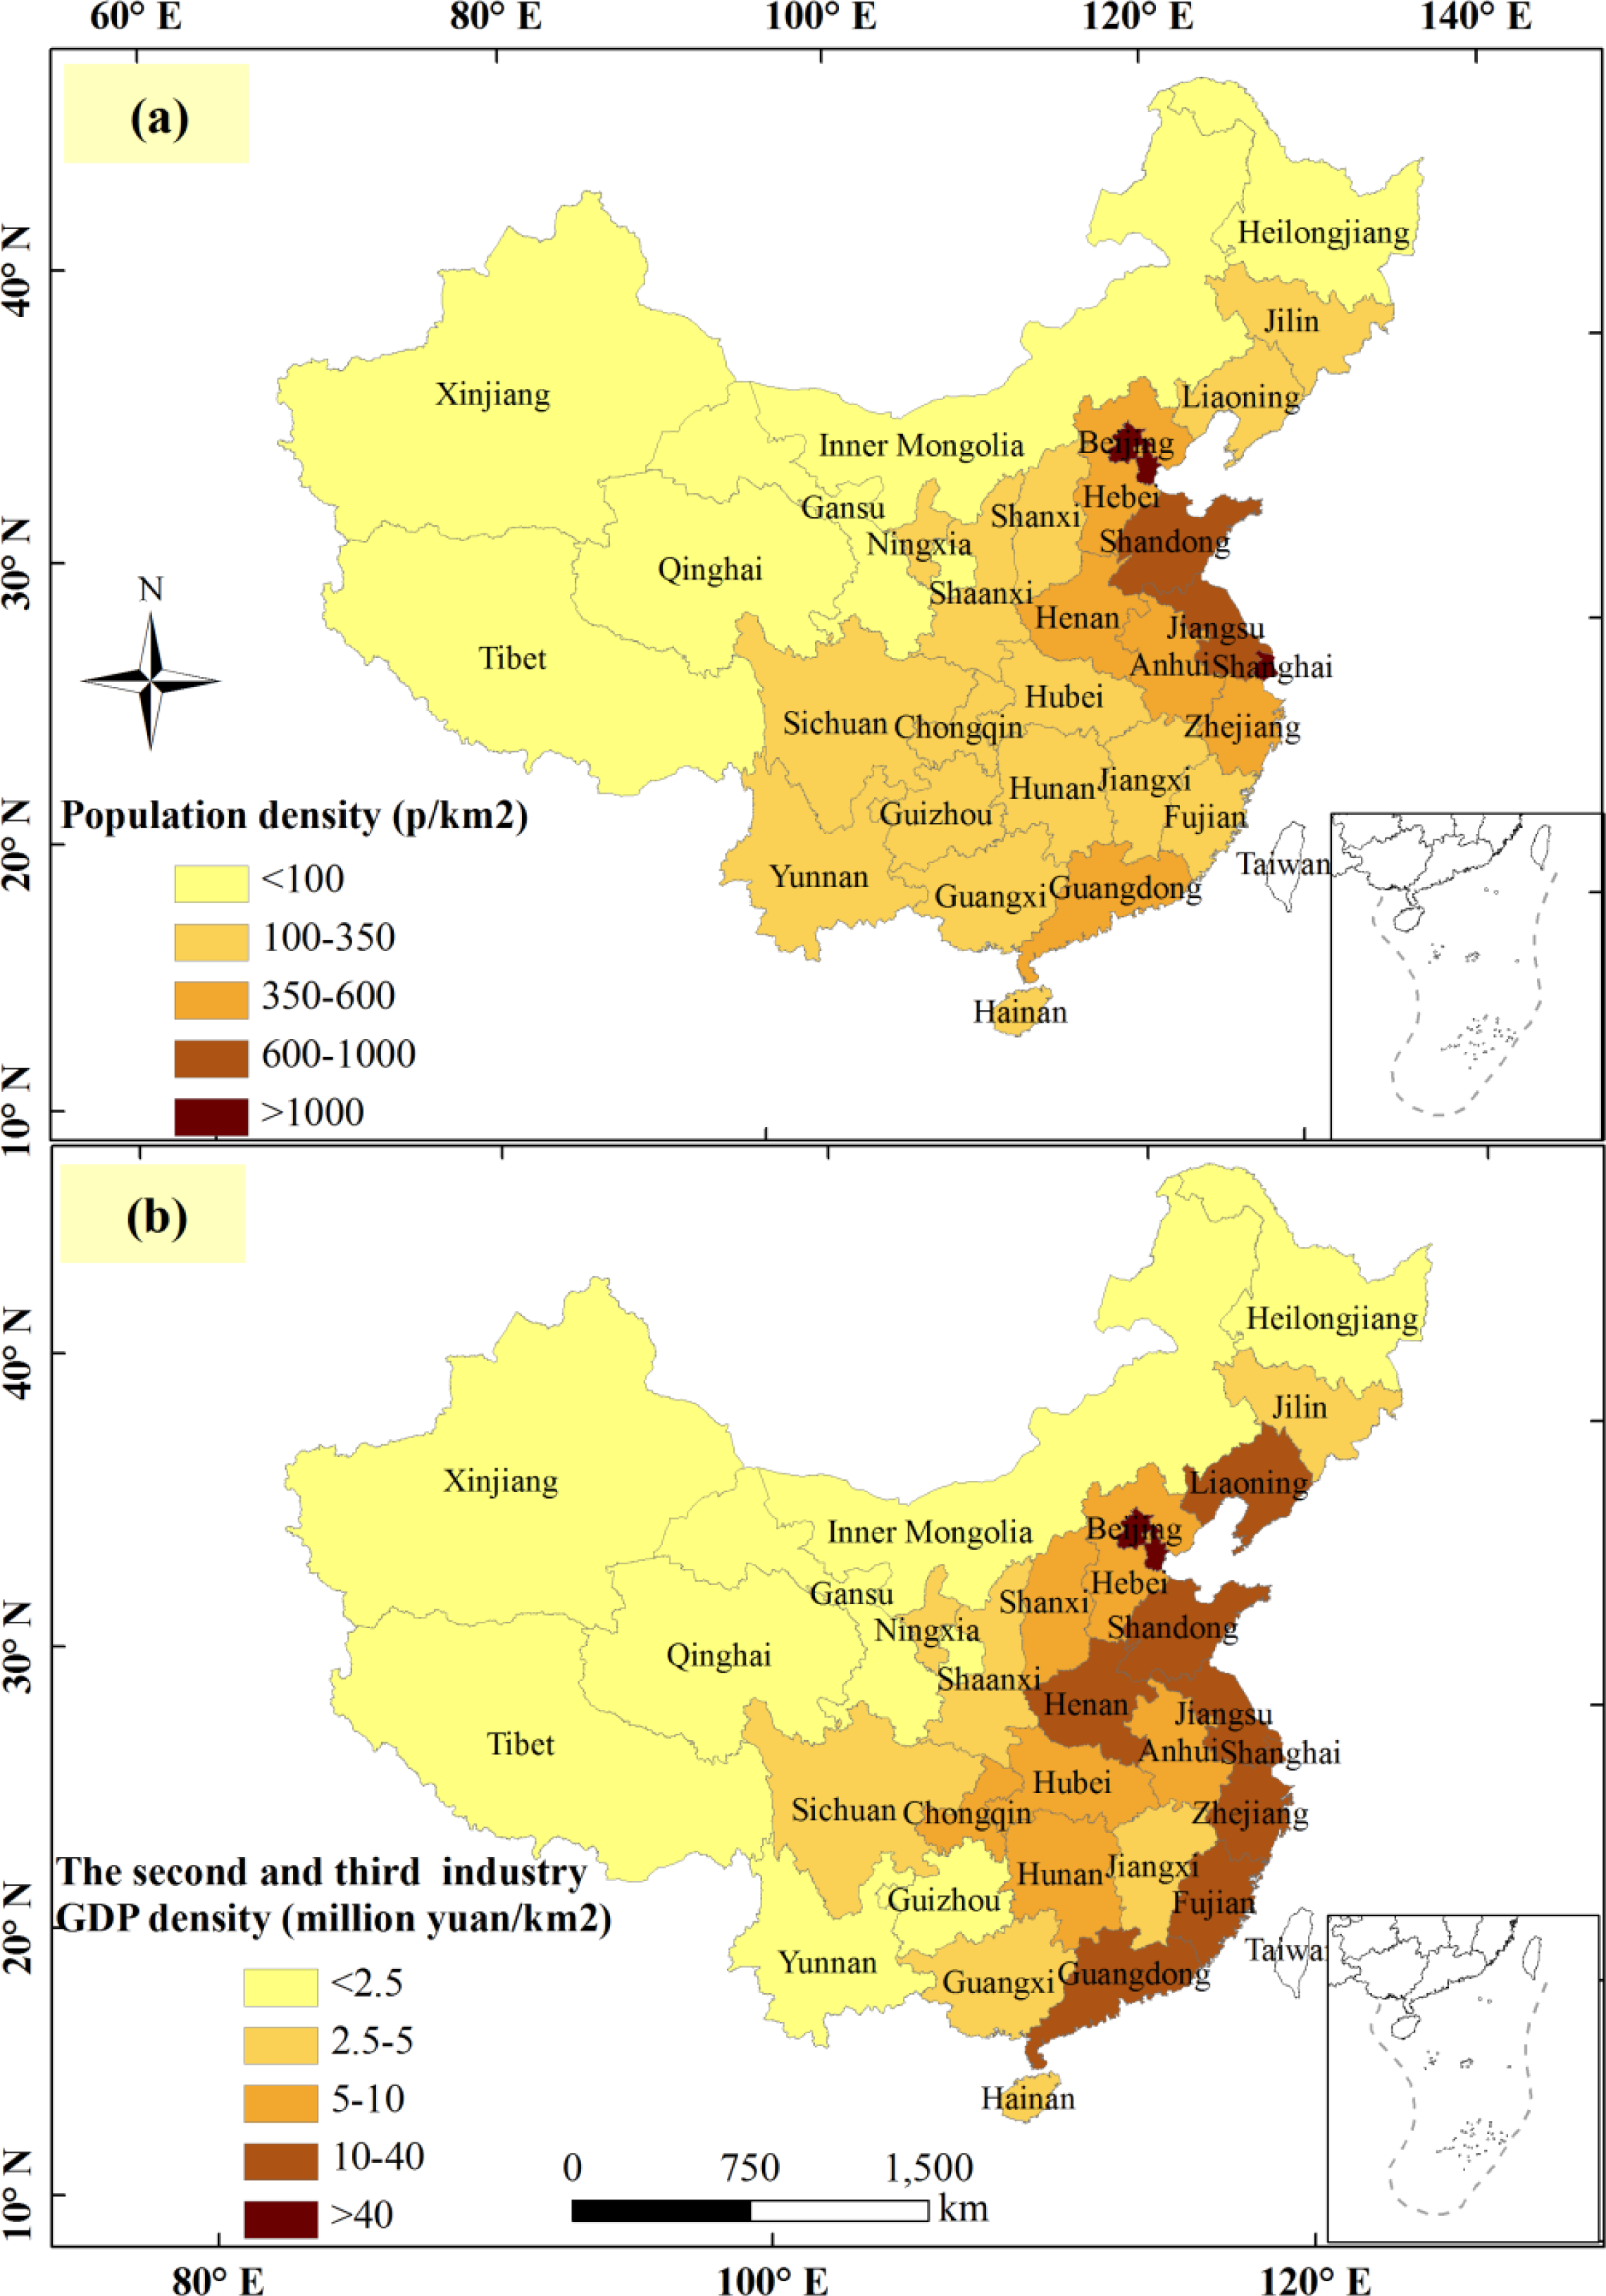
33]. It is rather difficult for these provinces to accomplish the requisition and compensation balance of cropland. Furthermore, these provinces produce higher economic output and accommodate many more people (
Figure 9). It indicates that the cropland protection policy should be varied across regions with different major functions [
34]. In addition, this study demonstrated that the agricultural potential per unit area of the cropland converted into built-up land was much higher than that converted to other uses. In light of this result, cropland compensation should focus not only on total area but also on quality of agricultural potential.
The conversion of cropland into urban land is the main land use change causing cropland loss, accounting for half of the total cropland loss during the past two decades. However, as indicated by Liu
et al. [
35], the rate of land urbanization was much higher than that of population urbanization, further leading to the extensive waste of urban land. It alerts us to the importance of optimizing land use structure in urban areas and transferring the focus of urbanization from land to people. In the 12th Five-Year plan, the central government has clearly indicated that the core of urbanization is population and emphasizes the quality of urbanization [
29]. This policy may, to a certain extent, ease the urban occupation of cropland in the future.
5. Conclusions and Policy Recommendation
Employing satellite-based land use data and an agricultural production estimation model, this study captured the spatiotemporal pattern of urban development from cropland in a spatially explicit way and revealed how the extent of these conversions has impacted China’s agricultural potential from 1990 to 2010. Our results may provide valuable insights that could help improving China’s land use policy.
Urbanization is the prime factor causing cropland loss, and approximately 4.18 Mha, or 2.26%, of total cropland has been developed during the past two decades. Most of the developed lands are located in the central and coastal provinces and are mainly concentrated on the periphery of major urban areas such as the Beijing-Tianjin-Tangshan, Shanghai-Suzhou-Changzhou, Haerbin-Changchun-Shenyang, and Zhengzhou-Wuhan-Guangzhou regions. In addition, a good deal of conversion has taken place in small cities and towns in Central and Eastern China. The spatial and temporal patterns of conversion are subject to the national development plans and impacted by other factors such as economic development, population growth, and migration. Furthermore, the spatial adjacency of urban land and cropland facilitates the encroachment of development during urban extension.
Due to urban encroachment on cropland, approximately 71.45 Tg of potential light-temperature agricultural productivity has been lost, and the loss in the second decade of the study (approximately 47.12 Tg) was nearly twice that of the first (approximately 24.33 Tg). The total loss accounts for 2.65% of the national agricultural potential. When compared with the percentage of cropland loss, agricultural potential loss has exceeded the loss of cropland. It may be attributed to the fact that cropland converted to urban use is of higher quality than that converted to other uses.
As to national land use policy, the dynamic balance of total farmland policy is the strictest cropland protection policy in China, and according to our analysis, it should not be applied uniformly across all provinces. The policy should be varied according to the different major orientated functions of each province, which will help maximize the utilization efficiency of the land. It also should be noted that new-type urbanization in China has emphasized population urbanization, and this trend may, to a certain extent, ease the loss of cropland in the future.
Acknowledgments
This research was supported by the National Science & Technology Pillar Program during the “12th Five-Year” Plan Period (Grant No. 2012BAI32B06 and 2012BAI32B07) and the National Natural Science Foundation (Grant No. 41301155 and 41271173). We would like to thank the research team led by Jiyuan Liu for providing the data on the land use change in China. We also thank the editor and all the reviewers for their helpful suggestions and comments on this paper.
Conflicts of Interest
The authors declare no conflict of interest.
References
- 2011 China Statistical Yearbook (In Chinese). Available online: http://www.stats.gov.cn/tjsj/ndsj/2011/indexch.htm (accessed on 16 October 2013).
- Wang, J.; Chen, Y.Q.; Shao, X.M.; Zhang, Y.Y.; Cao, Y.G. Land-use changes and policy dimension driving forces in China: Present, trend and future. Land Use Policy 2012, 29, 737–749. [Google Scholar]
- Liu, J.Y.; Tian, H.Q.; Liu, M.L.; Zhuang, D.F.; Melillo, J.M.; Zhang, Z.X. China’s changing landscape during the 1990s: Large-scale land transformations estimated with satellite data. Geophys. Res. Lett. 2005. [Google Scholar] [CrossRef]
- Lichtenberg, E.; Ding, C.G. Assessing farmland protection policy in China. Land Use Policy 2008, 25, 59–68. [Google Scholar]
- Yan, H.; Liu, J.; Huang, H.; Dong, J.; Xu, X.; Wang, J. Impacts of cropland transformation on agricultural production under urbanization and grain for green project in China (In Chinese). Acta. Geogr. Sin 2012, 67, 579–588. [Google Scholar]
- Godfray, H.C.J.; Beddington, J.R.; Crute, I.R.; Haddad, L.; Lawrence, D.; Muir, J.F.; Pretty, J.; Robinson, S.; Thomas, S.W.; Toulmin, C. Food security: The challenge of feeding 9 billion people. Science 2010, 327, 812–818. [Google Scholar]
- Deng, X.Z.; Huang, J.K.; Rozelle, S.; Uchida, E. Cultivated land conversion and potential agricultural productivity in China. Land Use Policy 2006, 23, 372–384. [Google Scholar]
- Thapa, R.B.; Murayama, Y. Examining spatiotemporal urbanization patterns in Kathmandu Valley, Nepal: Remote sensing and spatial metrics approaches. Remote Sens 2009, 1, 534–556. [Google Scholar]
- Zhang, Q.; Seto, K.C. Can night-time light data identify typologies of urbanization? A global assessment of successes and failures. Remote Sens 2013, 5, 3476–3494. [Google Scholar]
- Tan, M.; Li, X.; Lu, C. Urban land expansion and arable land loss of the major cities in China in the 1990s. Sci. China Ser. D 2005, 48, 1492–1500. [Google Scholar]
- Yan, H.; Liu, J.; Huang, H.; Tao, B.; Cao, M. Assessing the consequence of land use change on agricultural productivity in China. Glob. Planet. Chang 2009, 67, 13–19. [Google Scholar]
- Liu, J.; Liu, M.; Zhuang, D.; Zhang, Z.; Deng, X. Study on spatial pattern of land-use change in China during 1995–2000. Sci. China Ser. D 2003, 46, 373–384. [Google Scholar]
- Liu, J.; Zhang, Z.; Xu, X.; Kuang, W.; Zhou, W.; Zhang, S.; Li, R.; Yan, C.; Yu, D.; Wu, S.; et al. Spatial patterns and driving forces of land use change in China during the early 21st century. J. Geogr. Sci 2010, 20, 483–494. [Google Scholar]
- Liu, J.Y.; Liu, M.L.; Tian, H.Q.; Zhuang, D.F.; Zhang, Z.X.; Zhang, W.; Tang, X.M.; Deng, X.Z. Spatial and temporal patterns of China’s cropland during 1990–2000: An analysis based on Landsat TM data. Remote Sens. Environ 2005, 98, 442–456. [Google Scholar]
- Hutchinson, M. ANUSPLIN Version 4.3 User Guide; The Australian National University: Canberra, ACT, Australia, 2004. [Google Scholar]
- New, M.; Lister, D.; Hulme, M.; Makin, I. A high-resolution data set of surface climate over global land areas. Clim. Res 2002, 21, 1–25. [Google Scholar]
- Price, D.T.; McKenney, D.W.; Nalder, I.A.; Hutchinson, M.F.; Kesteven, J.L. A comparison of two statistical methods for spatial interpolation of Canadian monthly mean climate data. Agric. For. Meteorol 2000, 101, 81–94. [Google Scholar]
- Deng, G.; Feng, X. Light-temperature resources and climatic productivity potential in China (In Chinese). Resour. Sci. 1980, 11–16. [Google Scholar]
- Agro-Ecological Zoning System. Available online: http://www.fao.org/nr/land/databasesinformation-systems/aez-agro-ecological-zoning-system/en/ (accessed on 13 September 2013).
- Jones, C.A.; Kiniry, J.R. CERES-Maize: A Simultiaon Model of Maize Growth and Development; Texas A&M University Press: College Station, TX, USA, 1986. [Google Scholar]
- Xu, X.L.; Liu, J.Y.; Cao, M.K.; Zhang, S.W. Impact of recent climate fluctuation and LUCC process on potential productivity for crops in Northeast China (In Chinese). Sci. Geogr. Sin 2007, 27, 318–324. [Google Scholar]
- Yang, X.H.; Cheng, C.Z.; Li, Y.J. Effect of cropland occupation and supplement on light-temperature potential productivity in China from 2000 to 2008. Chin. Geogr. Sci 2010, 20, 536–544. [Google Scholar]
- Cheng, C.; Yang, X.; Li, Y.; Wang, T. Calculation and analysis of cropland potential productivity in Shandong Province with different models (In Chinese). Resour. Sci 2010, 32, 2165–2171. [Google Scholar]
- Wang, J.; Yang, X.; Cai, H.; Li, Y. Spatio-temporal characteristics of light-temperature potential productivity on cropland occupation and supplement in China in the last 20 years (In Chinese). J. Nat. Resour 2013, 28, 126–136. [Google Scholar]
- 10th Five-Year Plan for National Economy and Social Development, 2001–2005 (In Chinese). Available online: http://www.npc.gov.cn/wxzl/gongbao/2001-03/19/content_5134505.htm (accessed on 16 September 2013).
- 11th Five-Year Plan for National Economy and Social Development, 2006–2010 (In Chinese). Available online: http://www.gov.cn/gongbao/content/2006/content_268766.htm (accessed on 16 September 2013).
- Su, S.L.; Jiang, Z.L.; Zhang, Q.; Zhang, Y. Transformation of agricultural landscapes under rapid urbanization: A threat to sustainability in Hang-Jia-Hu region, China. Appl. Geogr 2011, 31, 439–449. [Google Scholar]
- Zou, X. Analysis of population movement and distribution based on Sixth Census (In Chinese). Popul. Econ 2011, 33, 23–27. [Google Scholar]
- 12th Five-Year Plan for National Economy and Social Development, 2011–2015 (In Chinese). Available online: http://www.gov.cn/2011lh/content_1825838.htm (accessed on 16 September 2013).
- Zhang, K.; Peng, J.; Zhang, D.; Li, X.; Yu, Z.; Wei, Y. Simulation of land use change based on urbanization rate and GDP of China in next 30 years (In Chinese). China Land Sci 2007, 21, 58–64. [Google Scholar]
- Xu, X.; Tong, L.; Zheng, K.; Zhang, X. Spatial-temporal characteristics and scenario prediction of urban expansion in Beijing-Tianjin-Hebei Metropolitan region (In Chinese). China Popul. Resour. Environ 2012, 22, 256–261. [Google Scholar]
- Ma, J.; Wu, X.; Zhou, D.; Wang, Z. Scenario simulation of urban spatial expansion and its ecological risks assessment in coastal zones (In Chinese). Resour. Sci 2012, 34, 185–194. [Google Scholar]
- Wen, M.; Tang, C. Datasets of Reserve Cultivated Land Resource in China (In Chinese); Geological Publishing House: Beijing, China, 2005; p. 59. [Google Scholar]
- Fan, J.; Tao, A.; Ren, Q. On the historical background, scientific intentions, goal orientation, and policy framework of major function-oriented zone planning in China. J. Resour. Ecol 2010, 1, 289–299. [Google Scholar]
- Liu, X.; Zhang, D.; Chen, B. Characteristics of China’s town-level land use in rapid urbanization stage (In Chinese). Acta. Geogr. Sin 2008, 63, 30–310. [Google Scholar]
© 2013 by the authors; licensee MDPI, Basel, Switzerland This article is an open access article distributed under the terms and conditions of the Creative Commons Attribution license ( http://creativecommons.org/licenses/by/3.0/).


