Assessing Land Degradation/Recovery in the African Sahel from Long-Term Earth Observation Based Primary Productivity and Precipitation Relationships

Abstract
: The ‘rain use efficiency’ (RUE) may be defined as the ratio of above-ground net primary productivity (ANPP) to annual precipitation, and it is claimed to be a conservative property of the vegetation cover in drylands, if the vegetation cover is not subject to non-precipitation related land degradation. Consequently, RUE may be regarded as means of normalizing ANPP for the impact of annual precipitation, and as an indicator of non-precipitation related land degradation. Large scale and long term identification and monitoring of land degradation in drylands, such as the Sahel, can only be achieved by use of Earth Observation (EO) data. This paper demonstrates that the use of the standard EO-based proxy for ANPP, summed normalized difference vegetation index (NDVI) (National Oceanic and Atmospheric Administration (NOAA) Advanced Very High Resolution Radiometer (AVHRR) Global Inventory Modeling and Mapping Studies 3rd generation (GIMMS3g)) over the year (ΣNDVI), and the blended EO/rain gauge based data-set for annual precipitation (Climate Prediction Center Merged Analysis of Precipitation, CMAP) results in RUE-estimates which are highly correlated with precipitation, rendering RUE useless as a means of normalizing for the impact of annual precipitation on ANPP. By replacing ΣNDVI by a ‘small NDVI integral’, covering only the rainy season and counting only the increase of NDVI relative to some reference level, this problem is solved. Using this approach, RUE is calculated for the period 1982–2010. The result is that positive RUE-trends dominate in most of the Sahel, indicating that non-precipitation related land degradation is not a widespread phenomenon. Furthermore, it is argued that two preconditions need to be fulfilled in order to obtain meaningful results from the RUE temporal trend analysis: First, there must be a significant positive linear correlation between annual precipitation and the ANPP proxy applied. Second, there must be a near-zero correlation between RUE and annual precipitation. Thirty-seven percent of the pixels in Sahel satisfy these requirements and the paper points to a range of different reasons why this may be the case.1. Introduction
The development and prosperity of the African Sahel, a semi-arid transition zone between the Sahara desert to the north and the humid tropical savanna to the south, depends strongly on the precipitation regime. The grasslands of the Sahel-zone constitute the basis for livestock production, an important component of the economies of several Sahelian countries and the livelihoods of millions of people. Since the ‘Sahel drought’ of the 1970s and early 80s this zone has been described as a hotspot of land degradation, threatened both by recurrent droughts [1] and by human overuse, e.g., through overgrazing [1–3]. In recent years a ‘counter-narrative’ has emerged, claiming that the Sahel is undergoing a ‘greening’ [4–10].
The relationship between precipitation and aboveground net primary productivity (ANPP) in the West-African Sahel-Sudanian zone has been discussed extensively since the drought of the early 70s [4,8,11–17]. It is beyond doubt that the productivity of the semi-natural grasslands of the Sahel is to a considerable extent controlled by precipitation. Recent analyses of trends in precipitation [18], as well as global precipitation data-sets [19], show that, taken as a whole, precipitation has increased in the Sahel since the mid-80s, and the greening, observed in the field and by use of time-series of satellite images, is therefore not surprising. However, if the ‘greening’ (supposedly associated with an increase in above-ground net primary productivity (ANPP)) is predominantly an effect of increased precipitation, this may disguise continued ‘degradation’ caused by other factors, such as overgrazing.
This is sought to be captured by the concept of ‘rain use efficiency’ (RUE), defined as the ratio of ANPP to annual precipitation [4,9,20]. Temporal changes in RUE are supposed to reflect degradation—or the reverse—of the vegetation cover, because it ‘normalizes’ for the effects of precipitation change. If a separation of precipitation change impacts from other causes for productivity changes could be achieved, it would allow us to better assess the (non-precipitation) causes of productivity change. Consequently, changes in RUE have been suggested as an integral measure for evaluating land degradation and desertification and a number of authors have attempted to assess non-precipitation related land degradation—or the reverse—in the Sahel by use of time-series of RUE estimated wholly or partly by use of satellite remote sensing or using only ground measurements [4,9,21,22]. However, as noted by Fensholt and Rasmussen [10] as well as Hein et al.[21], the results are not consistent.
The basic assumption involved in the use of RUE is that ANPP, where no non-precipitation related land degradation is taking place, is proportional to (or at least linearly related to, see below) precipitation. If this assumption does not hold, the ‘normalization for precipitation’, which is the basis for the use of RUE, cannot function properly. In this case use of RUE to detect non-precipitation related land degradation will be meaningless. Several papers have questioned this proportionality. Using ground data from a variety of semi-arid rangelands in the Sahel and elsewhere Hein et al.[21], Hein & de Ridder [23], as well as Hein [24] argue that at high precipitation levels RUE will tend to decrease, among other things because other production factors than water availability become limiting, while at very low precipitation levels RUE will also decrease because most of the precipitation will evaporate and thus not be available for vegetation growth. The exact interval of annual precipitation in which proportionality may be assumed is debated. Hein et al.[21] cites Breman & Dewit [25] for the statement that the proportionality breaks down already at a precipitation of 300 mm per year. They further suggest that a quadratic or cubic relationship might replace the assumption of proportionality when going beyond 200–300 mm precipitation. Other publications based on in situ measurements suggest that biome-specific RUE values should be applied depending on the rainfall regime [26–28]. However [28] concludes that inter-annual variation in RUE is not correlated with precipitation at the site level.
One of the most widely used approaches for EO-based monitoring of vegetation productivity is based on the use of the ‘normalized difference vegetation index’ (NDVI), which may be derived from several satellite/sensor systems including the National Oceanic and Atmospheric Administration (NOAA) Advanced Very High Resolution Radiometer (AVHRR), covering the period back to 1981. Daily NDVI-values may be summed over the growing season to give ΣNDVI, which is often assumed to be a proxy for ANPP in semi-arid areas like the Sahel [4,29–34]. The data on annual precipitation, used in the calculation of RUE, may come from either rain gauges or from data-sets derived from satellite data, in some cases calibrated with rain gauge data. The latter option is preferable due to the high spatial variability of precipitation. Fensholt & Rasmussen [10] working with satellite-based ΣNDVI and annual precipitation, demonstrate that for most pixels in Sahel there is no proportionality, but sometimes a linear relation, between ΣNDVI and annual precipitation, and they argue that this undermines the general use of satellite-based RUE time-series as a means of identifying non-precipitation related land degradation. Yet for pixels for which a high linear correlation between ΣNDVI and annual precipitation exists, a meaningful estimation of RUE, based on the Residual Trends (RESTREND) technique suggested by Wessels et al.[35], is feasible. RESTREND includes regressing ΣNDVI from annual precipitation and subsequently calculating the residuals (the difference between observed ΣNDVI and ΣNDVI as predicted from precipitation). Instead of assuming proportionality or linearity as being criticised by Hein et al.[21] we suggest to restrict the analysis to regions or pixels for which linearity can be shown to exist. This allows us to maintain the basic simple notion of RUE as means of normalizing for the effect rainfall on vegetation productivity. Introducing non-linear growth models (even though this might have a theoretical justification) causes an unnecessary complication to the use of RUE or RESTREND for land degradation assessment if a strong per-pixel linearity from Earth Observation data can be documented.
Another important difference between studies of NDVI and RUE trends in the Sahel is related to which NDVI-related measure is used as a proxy for ANPP. Above we have referred to ΣNDVI, but alternative methods of representing the annual/seasonal NDVI variation have been suggested. Peak-values of NDVI during then growing season have been used [6,15] and also NDVI integrated only for the Sahelian growing season months [4,10,17]. NDVI does not necessarily reach zero during the dry season, this may either be caused by the presence of green vegetation even in this period of the year, or it may be the effect of reflectance properties of soils and the dead vegetation canopy. In the latter case it makes sense to remove the effect by subtracting non-cyclic fraction when calculating ΣNDVI.
Using NDVI as a proxy for ANPP in land degradation assessment is therefore not without problems and should be done with caution [4,10,23]. In the present paper we study the relevance and use of the concept of RUE to the current discussion on ‘greening’ and land degradation in the African Sahel. We test the importance of the specific method applied in EO-based land degradation monitoring when based upon time series of productivity and precipitation estimates. The impact of the specific data preprocessing of EO-based vegetation productivity on the degradation/recovery assessment results obtained is analyzed to study the RUE approach sensitivity to the EO-based proxies used and finally preconditions to be fulfilled in order to obtain meaningful results from the RUE per-pixel trend analysis are suggested.
2. Theoretical Aspects of RUE
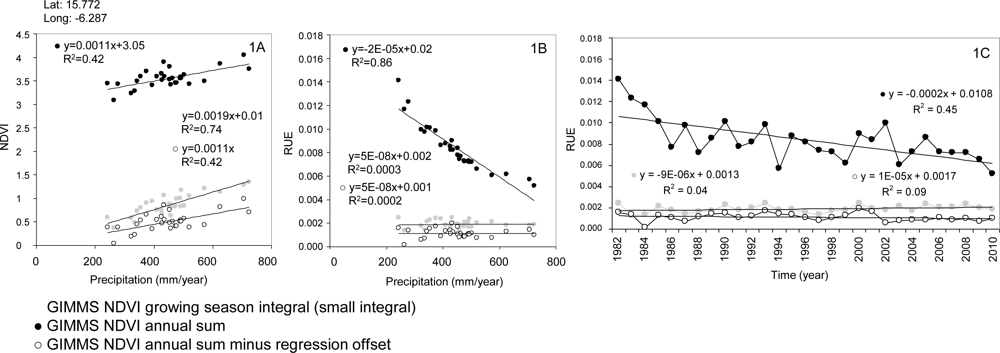
The principles of the RUE concept and the impact from different vegetation productivity proxy estimates on RUE are illustrated in Figure 1 based on pixels extracted from the Global Inventory Modeling and Mapping Studies (GIMMS) normalized difference vegetation index (NDVI) and CMAP precipitation time series. The relationship between ΣNDVI and annual precipitation may be approximately linear, but the regression line does not normally pass through (0,0) (Figure 1(A) black dots; offset value = 3.05). If RUE is calculated simply as ΣNDVI/precipitation, this obviously implies that RUE will depend on precipitation (Figure 1(B) black dots; r2 = 0.86). In the case that precipitation increases over time, this will imply that RUE will decrease over time (Figure 1(C) black dots; r2 = 0.45). Thus, if RUE is interpreted as an indicator of non-climate land degradation we will observe ongoing land degradation, while the opposite would happen if precipitation decreased over time. This problem may be remedied by subtracting the intercept (of the regression line on the ΣNDVI-axis) from the observed ΣNDVI-values (Figure 1(A) hollow dots), or by using the RESTREND method, in which a non-biased temporal development of ‘RUE’ is obtained (Figure 1(B) hollow dots; r2 = 0.00) by regressing it against time (Figure 1(C) hollow dots) showing no trend (r2 = 0.09). Using the NDVI growing season integral (only the cyclic part) (Figure 1(a) gray dots) produces a regression offset close to zero (offset value = 0.01), thereby like the RESTREND approach, produces RUE observations independent of precipitation (Figure 1(B), gray dots; r2 = 0.00) showing no trend (Figure 1(C), gray dots; r2 = 0.04).
The use of summed ‘effective precipitation’ rather than summed precipitation has been stated by Prince et al.[4] to be a better input variable for RUE-calculation since soil evaporation, run-off, infiltration and drainage from and storage in the rooting zone (all dependent on crusting and soil retention) have impacts on the amount of plant available water. The above-mentioned variables will have different impacts, depending on precipitation amount and intensity. However, calculation of the effective precipitation requires spatially distributed information on soil properties and terrain, as well as high temporal resolution (daily at minimum) precipitation data.
If a certain amount of annual precipitation is required to generate any productivity as discussed in Fensholt and Rasmussen [10], this could cause an offset to be generated on x-axis in Figure 1(A) which will potentially also create precipitation dependency in Figure 1(B) and a RUE slope of opposite (positive) trend in Figure 1(C). The only way to assess whether the parameterization of both vegetation and precipitation variables does not conflict with the general RUE assumption of a constant ratio is to check for correlation between RUE and precipitation as illustrated in Figure 1(B).
Low correlation between ANPP and annual precipitation (for a region or a pixel), invalidating the use of RUE for detection of non-precipitation related land degradation, may be due to a number of causes that can be grouped into influence on the individual input variable (NDVI or precipitation) or the relation between the two:
Precipitation:
Annual precipitation, here derived from the CMAP data set, may be a poor proxy for in situ plant water availability: The same annual precipitation will have very different impacts on ANPP, depending on whether it falls in few heavy showers or evenly distributed over the growing season. Taking this into account will require higher temporal resolution of the EO-based precipitation data (daily satellite/gauge blended products only available from 1996 to present). Precipitation will be re-distributed within each pixel/grid-cell, depending on terrain, soils and vegetation cover as well as the intensity of precipitation. As much as 80% of the precipitation may run-off in extreme cases [36]. This will obviously imply that the impact on ANPP may differ greatly, which will add noise to the annual precipitation relationship (ANPP).
NDVI:
In the driest parts of the Sahel, estimation of ANPP on the basis of EO-data is made difficult by the dominance of the effects of spatial and temporal variations in soil reflectance properties. Again this adds noise to the ANPP—precipitation relation at low precipitation values.
Temporal sums or integrals of NDVI are used as proxies for ANPP in this study. Such proxies are not perfect. Species and ecosystems may differ considerably with respect to their ANPP—NDVI relation, implying that interpretation of spatial patterns and temporal trends in RUE may be hampered, especially when species distributions change in time and space, as they are known to do in the Sahel [5,37,38].
NDVI and Precipitation:
NDVI as a proxy for ANPP may not be related to precipitation in the same year if the root system draws on water resources that depend on precipitation over a longer period. Certain woody species in the Sahel have very deep root systems.
While annual CMAP precipitation data is resampled to the same 1/12-degree resolution grid as the GIMMS3g NDVI the original CMAP data have a much coarser spatial resolution blurring the high spatial variability of precipitation in the Sahel. This ‘scale mismatch’ will add noise to the per-pixel annual precipitation relation and result in lower correlations (ANPP).
The exact minimum correlation between vegetation and precipitation, by which making use of RUE becomes meaningful, is difficult to specify, since the per-pixel estimation of both ANPP and precipitation is hampered by many sources of errors/noise as listed above. We have chosen to use the significance of the correlation as a criterion, demanding p ≤ 0.05.
3. Study Area
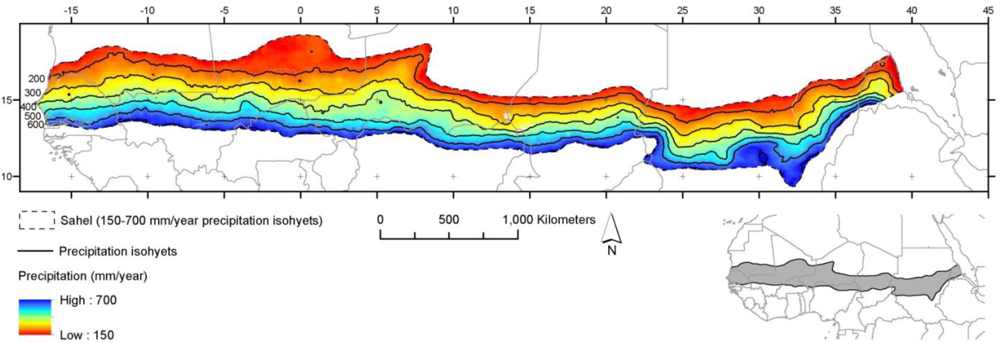
The Sahel stretches from the Atlantic Ocean in the West to the Red Sea in the East (Figure 2) forming a transition zone between the arid northern and the humid southern eco-regions. In the current study the Sahel is demarcated according to the average annual precipitation and covers the area between the 150–700 mm isohyets (Figure 2).
The northern parts of the Sahel are primarily dominated by open and sparse grasslands and shrublands, while cropland, open woody vegetation and deciduous shrubland characterize the southern parts [39,40]. The region is dominated by C4 type plants, accounting for roughly 80% of the herbaceous layer on average [38].
The dynamics of the Intertropical Convergence Zone (ITCZ) is the primary driving force controlling the amount, timing and distribution of the Sahelian precipitation [18]. Large scale convection, carrying moisture to great heights, is associated with the location of the ITCZ and forms the basis for the seasonal precipitation regime [1,41]. The Sahelian rainy season is directly linked to the West African Monsoon (WAM), with a length of 1–4 months and an annual peak in precipitation intensity in August. The length of the rainy season decreases with increasing latitude, and lasts approximately 1–2 months in the north and 4 months in the south [1].
4. Data and Method
4.1. GIMMS 15-Day Composite NDVI Product (GIMMS3g)
Currently, the GIMMS3g data archive is the only global coverage dataset spanning 1981 to the present day that is subject to continuous validation. At present the GIMMS3g archive is considered the best dataset available for long-term NDVI trend analysis [42]. The GIMMS NDVI dataset is based on the GAC 1B product [43]. No atmospheric correction is applied to the GIMMS data except for volcanic stratospheric aerosol periods (1982–1984 and 1991–1994) [44]. A satellite orbital drift correction is performed using the empirical mode decomposition/reconstruction (EMD) method of Pinzon et al.[45], minimizing effects of orbital drift by removing common trends between time series of Solar Zenith Angle (SZA) and NDVI. The GIMMS3g NDVI data is provided in 1/12-degree resolution.
4.2. Système Pour l'Observation de la Terre (SPOT) VEGETATION (VGT) Net Primary Productivity (NPP)
The NPP dataset derived from the SPOT VGT has been processed by VITO (Flemish Institute for Technological Research). The methodology of estimating NPP is based on the light use efficiency approach originally defined by Monteith [46]. The detailed formulation adopted for this SPOT VGT NPP data set [47] has been modified to input daily meteorological data (air temperature and irradiance). This daily data set is used to estimate the daily maximum NPP with Fraction of Absorbed Photosynthetically Active Radiation (fAPAR) equal to 1. The average value of these daily NPPmax values over the compositing period is then multiplied by the 10-day fAPAR product (estimated directly from 10-day composites using a neural network approach [48]). The 10-day NPP product is subsequently averaged into a monthly dataset covering a 12-year time series of monthly observations (1999–2010).
4.3. Precipitation Data
The precipitation data selected for the current study is CMAP. The CMAP data-set consists of global monthly precipitation estimates produced in a 2.5° latitude-longitude grid for the period 1979–present. Estimates are based on a combination of gauge station measurements and a variety of different satellite observations [49]. The number of rain gauge stations used for calibration varies considerably in space on a global scale with an average of 11 stations for the 2.5°pixels covering the Sahelian zone. The absolute values given are generally less worthy of confidence than the variability and global averages appear to be accurate to within 5%–10% [49].
4.4. Data Post-Processing
The original GIMMS 15-day NDVI composite data covering the period from January 1982 to December 2010 were aggregated to monthly data using a maximum value composite approach to further reduce the influence from clouds and to match the temporal resolution of the SPOT VGT NPP data. The conversion of the GIMMS NDVI into NPP was done from per-pixel correlations between overlapping years of GIMMS NDVI and SPOT VGT NPP. The per-pixel strength of linear association between the two datasets was determined by calculating the Pearson product moment correlation coefficient (r) for the 12-year time series of monthly observations (1999–2010). The outputs of the regression correlation analyses (per-pixel regression slope and offset values) were used for the conversion of NDVI into NPP. The per-pixel significance of the NDVI-NPP relation was assessed from the per-pixel correlation coefficient (Figure 3).
Precipitation data is resampled to match the GIMMS data using a bilinear resampling algorithm to preserve the 1/12 degree spatial resolution of the NDVI data (as in Herrmann et al.[8]).
4.5. Calculation of ΣNDVI
The ΣNDVI was calculated in different ways to study the implications of the selected method on the derived trends in RUE. (1) Annual ΣNDVI was calculated as the sum of the 12 monthly composites. (2) Annual sums of NPP were produced from the 12 monthly composites of GIMMS NDVI transformed into NPP (using GIMMS NDVI/SPOT VGT NPP correlation regression output). (3) The GIMMS NDVI growing season integral is defined as sum of “greenness” appearing within the growing season (referred to as the “small integral” or the cyclic fraction). The growing season NDVI small integral is computed from time series parameterization using a Savitsky–Golay filter available in the TIMESAT software package (designed for analyzing time-series of satellite sensor data) [50,51]. The onset and end of growing season is determined for individual years from the per-pixel polynomial fit based on a parameterization of the fitted seasonal NDVI curve. The parameters applied in the TIMESAT analysis are: seasonal parameter = 0.5, Number of envelope iterations = 1, adaptation strength = 2, Savitzky–Golay window size = 2. The onset and end of growing season are defined in two different ways (a) as the points in time where the seasonal NDVI curve reaches 30% of the annual maximum for any given year and (b) using fixed threshold of NDVI. In method (a) the seasonality is calculated from percentage values of NDVI relative to the maximum of a given year and in (b) the small integral is calculated from absolute values of NDVI irrespective of the maximum of a given year. The threshold of optimal seasonal parameterization in (b) varies as a function of vegetation intensity. Therefore, the Sahelian zone was subdivided into five zones according to the dry-season NDVI base-level (0.10–0.15, 0.15–0.20, etc.). Both (a) and (b) were tested to study the importance of the threshold when calculating the NDVI small integral. Thirty percent of the maximum NDVI value as defining the onset/end of growing season was selected as the optimal value when performing a curve fitting to a North-South transect of Sahelian pixels (characterized by relatively low NDVI values during the dry season). Using a percentage threshold (a) tends to reduce inter-annual integral variability since a lower/higher maximum NDVI value will force the base level of the integral also to be lower/higher and therefore also (b) was tested despite the challenge of finding a fixed NDVI value being above the dry season level but low enough to enable the integral to capture the major part of the signal inherent to the recurrent vegetation (annual grasses).
A precondition for the seasonal parameterization, as based on per-pixel polynomial fitting, to work is that a certain level of seasonality (phenology) must be present. Pixels for which a parameterized using TIMESAT is not possible have been used to create a mask excluding pixels from further analysis. This mask (applied in Figures 3–9) corresponds well with areas with annual NDVI standard deviations < 0.02 used as masking criteria in Fensholt and Proud [19]. In either case, pixels with very low NDVI that are known to be most susceptible to soil background contamination will be excluded from further analysis.
4.6. Trend Analysis
Temporal trends in the datasets were examined by applying the Theil–Sen (TS) median slope trend analysis which is a robust trend statistical method [52–54] calculating the median of the slopes between all n(n − 1)/2 pair wise combinations over time. The TS trend analysis is known to be resistant to the impact of outliers (noise) and was used to quantify the NDVI and RUE trend (magnitude of change over time) with time as the independent variable and NDVI, RUE as the dependent variable. This method is based on nonparametric statistics and is particularly effective for the estimation of trend in small and noisy series. Because it is based on the median, approximately 29% of the samples can be unrelated noise and have no impact on the statistic [52]. Non-parametric trend indicators have been used in several recent studies analyzing consistency between various long term NDVI dataset [55–57]. The outputs of the trend analyses are maps of correlation coefficients (r-values) and regression slope values, indicating the strength and magnitude of the calculated trend.
Statistical significance was tested using a Mann-Kendall significance test producing z scores providing information on both the significance and direction of the trend. The Mann-Kendall significance test is measuring the significance (z-scores) of a monotonic trend (a non-linear trend indicator) but is commonly used as a trend test for the TS median slope operator. A positive slope (z ≥ 1.96) represents a significant increase (α > 0.05) and a negative slope (z ≤ −1.96) indicates a significant decrease (α < −0.05) over time.
5. Results
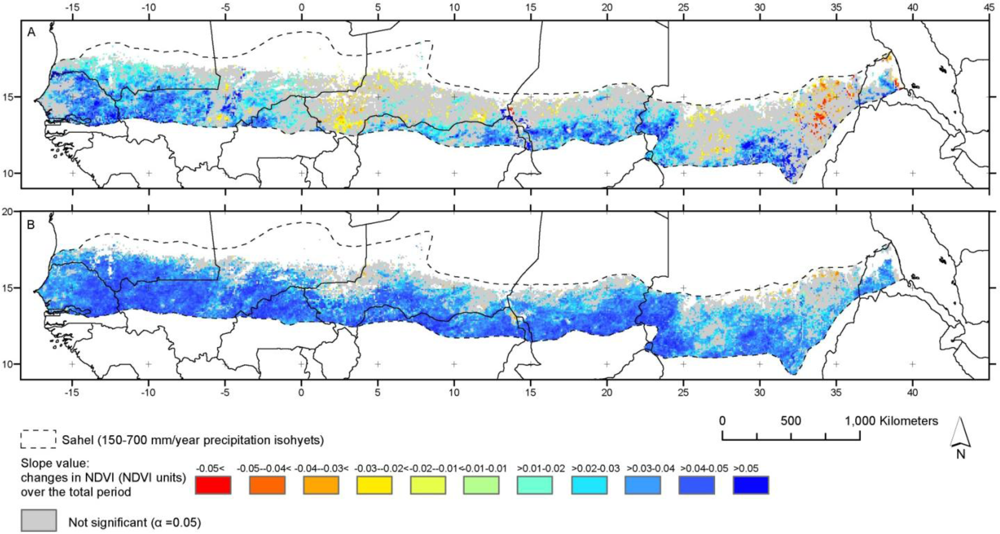
The per-pixel temporal trend (slope values) in NDVI for the Sahel 1982–2010 was calculated based on the annual NDVI sum (Figure 4(A)) and the growing season integral (Figure 4(B)) using method (a) (small integral; calculated from percentage values of NDVI relative to the maximum of a given year). Units are NDVI over the total period of analysis and only NDVI slope values significant at the 95% level (p < 0.05) are shown. Slopes based on annual NDVI sums (Figure 4(A)) generally show a positive trend with an average NDVI slope for Sahel of 0.01 (Table 1) with 33.7% of the Sahelian pixels being analyzed showing a significant trend (30.7% positive and 3.0% negative). Only smaller areas in Mali, Niger, Chad and Sudan are characterised by negative slope values. The average NDVI slope, for pixels showing a significant trend (p < 0.05), is 0.029. NDVI trend values (slopes) based on the seasonal integral (Figure 4(B)) show a more pronounced positive trend in NDVI. 75% of the Sahelian pixels analyzed show a significant trend (74.6% positive and 0.4% negative) with an average NDVI slope of 0.035 over the period 1982–2010. The NDVI slope based upon only pixels of a significant trend (p < 0.05) is 0.046. Only few pixels in Niger and Sudan are characterised by negative slope values.
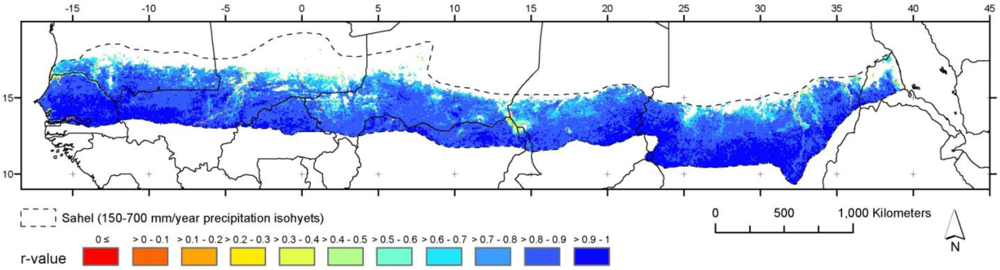
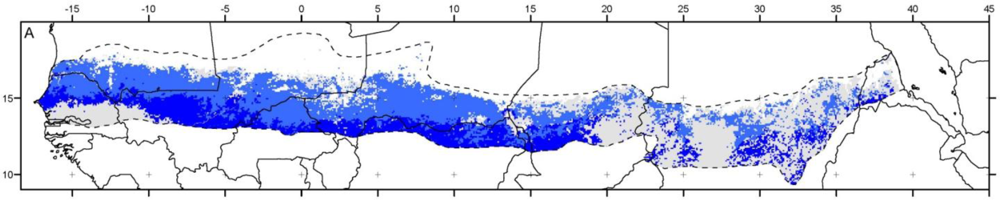
Linear regression analysis of GIMMS NDVI against the CMAP precipitation was conducted for the period 1982–2010 (Figure 5) based on annual NDVI sums (Figure 5(A)) and the growing season NDVI integral (Figure 5(B)). An overall strong linear correlation between NDVI and precipitation is observed for the Sahel with 66.4% (annual NDVI sum) and 65.1% (seasonal NDVI integral) of the pixels analyzed being significantly correlated (p < 0.05) (Table 2). When conducting the linear regression analysis as based on growing season NDVI integrals a marked shift in the number of pixels being highly significant (p < 0.01) is obtained (47.7% of all pixels) as compared to 40.7% when using annual NDVI sum as input. There is a clear tendency towards larger areas of pixels being characterized by a more significant relation (p < 0.01) in the Western Sahel when using the growing season NDVI integral as compared to the annual NDVI sum. In Eastern Sahel (primarily Sudan and Eritrea) the opposite is the case with annual sums of NDVI yielding higher correlations with precipitation. Regional differences in the NDVI/precipitation correlation are observed with low values in the southernmost Western Sahel (areas of significant negative correlation can be observed), around the Niger delta, Northern and Eastern Chad and larger parts of Sudan).
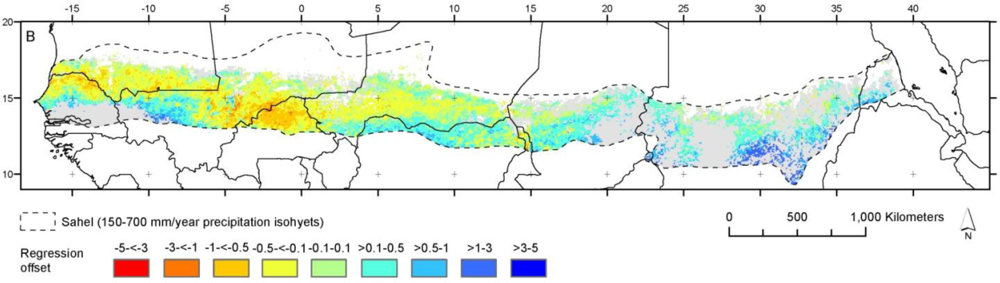
The per-pixel regression offsets from the linear regression analysis (Figure 6) reveal large differences depending on the two different NDVI integration approaches with important consequences for the use in RUE calculations (as explained in Figure 1). When using annual NDVI sums the per-pixel offset values from the NDVI/precipitation linear regression are positive (Figure 6(A)) with an average of 2.83 (and std. dev. of 2.50) for the pixels of analysis within the Sahelian zone (Table 2). For the northern part of Sahel the pixel offset values are generally in the interval 1–3 whereas for the pixels in Southern Sahel the offset values increases to the interval 3–5. Converting NDVI into NPP from the per-pixel correlation (Figure 3) does not eliminate the offset on productivity for zero precipitation (Sahel NPP/precipitation linear regression NPP offset average of 516.8 kg/ha, figure not shown). Using the growing season NDVI integral (small integral) for the linear regression produces per-pixel regression offset values with an average of 0.01 (and std. dev. of 0.46) (Figure 6(B)). There is a tendency towards a spatial zonation with moderately positive values in the southern and northern periphery of the pixels being analyzed whereas the pixels in central Sahel are characterized by moderately negative values with the exception of Burkina Faso where negative offset values are also observed in the Southern Sahel.
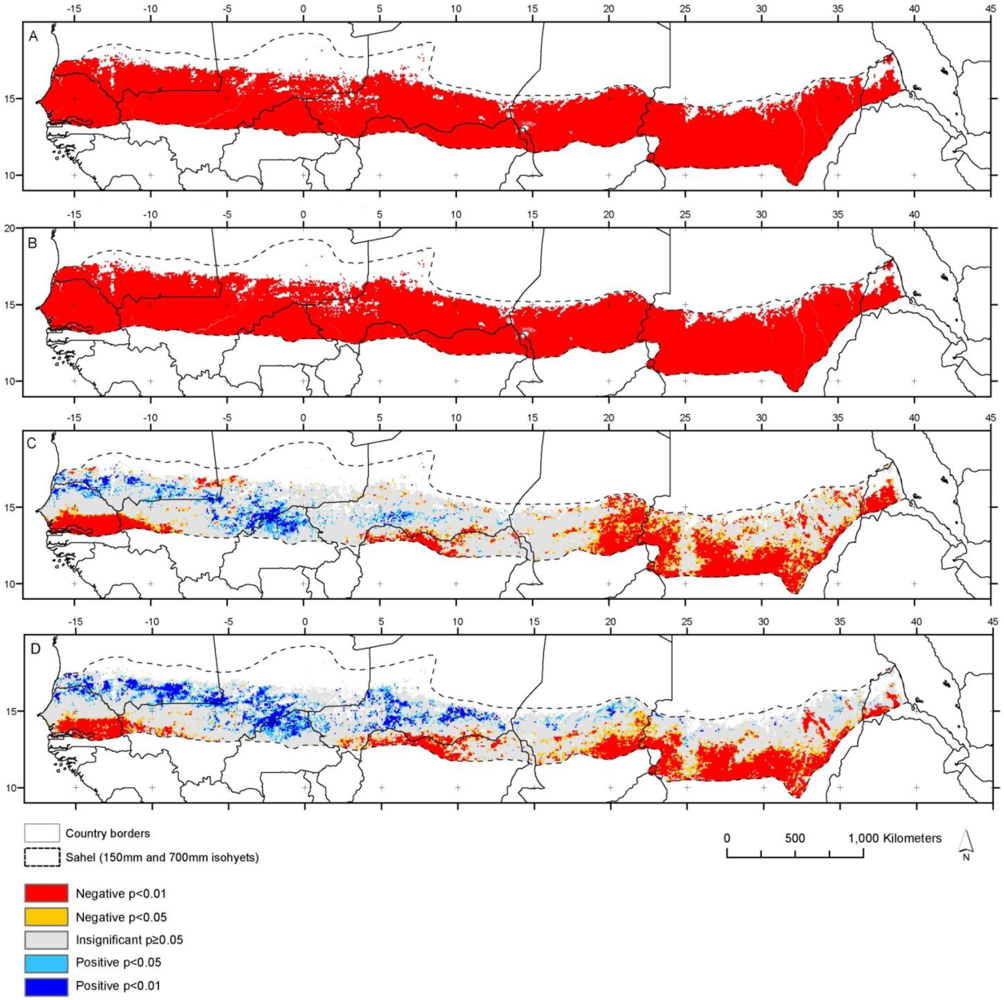
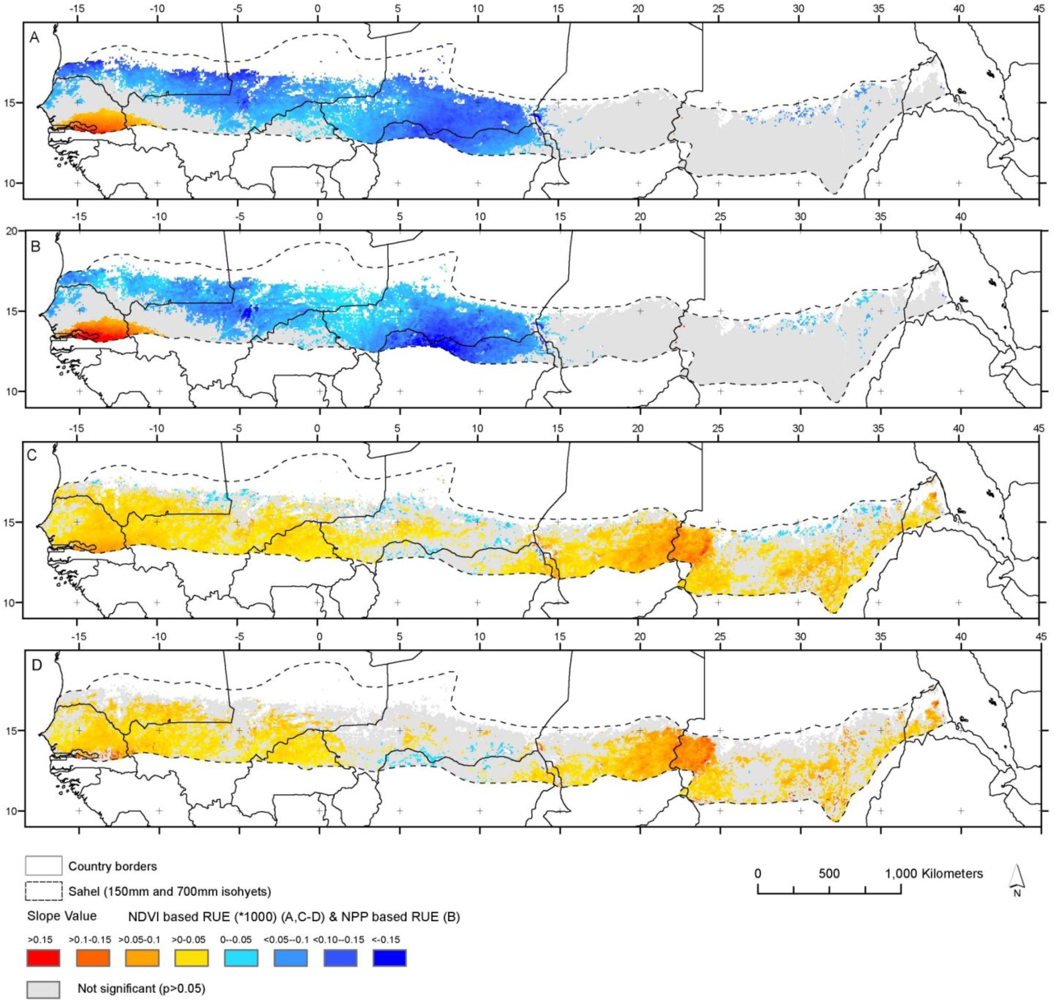
Calculation of linear trends in RUE for the Sahel using different vegetation productivity parameterization (Figure 7) produces markedly different results. Using annually summed AVHRR GIMMS NDVI (Figure 7(A)) and NPP (Figure 7(B)) (obtained from per-pixel correlation between GIMMS NDVI and SPOT VGT NPP) produces similar trend outputs. The overall trend is negative with primarily the Western and Central Sahel being characterized by significant (p < 0.05) trends. The exception from the negative trends is the southernmost Western Sahel (Senegal and Mali) where an area of positive trends is visible. The RUE mean value (Figure 7(A); RUE × 1,000) of the Sahelian pixel analyzed is −0.058 for the GIMMS NDVI based analysis and −0.047 for the NPP based analysis. 41.0% of the pixels are showing significantly negative trends whereas only 2.8% of pixels show positive trends (p < 0.05) regardless of whether NDVI or NPP is used as input for RUE. Average slope values for Sahelian pixels analyzed are −0.058 (Figure 7(A)) and −0.047 (Figure 7(B)) (Table. 3). The RUE linear trend analysis based on input from growing season NDVI integration (Figure 7(C,D)) from determination of onset and end of growing season calculated as a per-pixel relative fraction of the annual NDVI maximum (Figure 7(C)) and constant (but regional-specific) thresholds of NDVI (Figure 7(D)) show very different results as compared to Figure 7(A,B). The majority of pixels with a significant RUE trend (p < 0.05) are characterized by positive trends (55.5% and 41.5% in Figure 7(C,D) respectively) and positive trends are found across the entire Sahelian belt. The average RUE trend (RUE × 1,000) for pixels analyzed in Sahel is 0.029 and 0.039 for Figure 8(C,D) respectively. Only a limited number of pixels show negative trends (2.3%) when based on per-pixel relative fraction of the annual NDVI maximum (primarily located in the northern part of Sahel; Figure 7(C)) and 0.9% when using constant thresholds of NDVI for the growing season integral (primarily in the Southern Niger; Figure 7(D)).
Annual RUE based on the different productivity estimates (Figure 7(A–D)) was correlated against annual CMAP precipitation to check for the ability of RUE estimates to correctly normalise for variability in precipitation (Figure 8(A–D)). For a successful normalisation there should be no significant correlation between RUE and precipitation during the period 1982–2010. Using annually summed AVHRR GIMMS NDVI and NPP as input for RUE (Figure 8(A,B)) produces a strong negative correlation (p < 0.05) for all (99.9%) Sahelian pixels analyzed (average r value of −0.91) (Table 3). The strong correlation found is identical to the AVHRR GIMMS NDVI pixels (black dots) illustrated in Figure 1. When correlating precipitation and RUE using growing season NDVI integrals (determined from NDVI relative fraction and NDVI constant threshold) as input (Figure 8(C,D)) produce very different results with areas of both significant negative and positive correlations and large areas without significant correlation. 34%, 57% and 9% of the Sahelian pixels were found to have significant negative, not significant and significant positive correlation respectively for the correlation analysis based on NDVI relative fraction integrals as input for RUE (average r value of −0.149). For the correlation analysis based on NDVI constant threshold integrals as input to RUE the numbers are 28%, 57% and 15% with an average r value of −0.079. The two integration approaches thereby produce an equal amount of pixels (57%) characterized by a successful normalization of precipitation variability.
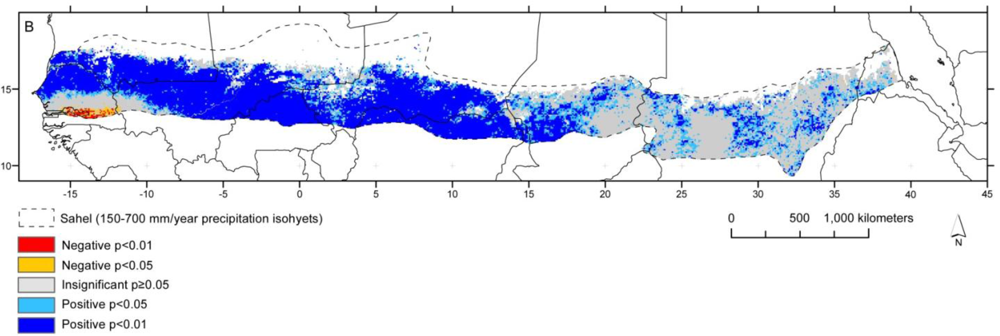
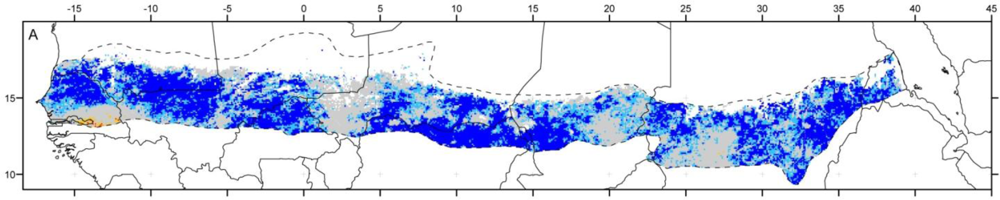
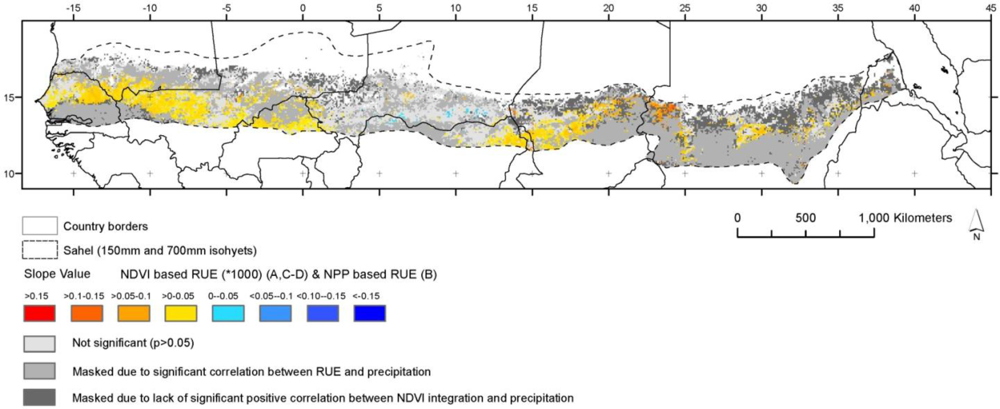
RUE trends based on growing season NDVI integration (Figure 7(C,D)) for pixels where no significant correlation between RUE and precipitation is present (Figure 8(C,D)) and at the same time with a significant positive correlation between precipitation and growing season NDVI integral (Figure 5(B)) are combined (Figure 9). The RUE trend analysis using a per-pixel absolute threshold (regionally graduated) of the annual NDVI maximum was selected for Figure 9 since this integration approach produces the same amount of pixels of non-significant correlation between RUE and precipitation but an r value (Sahel average) closer to zero (−0.079) indicating the most successful normalization for precipitation. This combined masking of RUE trends based on the growing season NDVI integration approach provides the basis for correct interpretation of magnitude and extent of potential land degradation/recovery as inferred from significantly negative and positive trends. Pixels not masked by either RUE/precipitation correlation or lack of seasonal NDVI integral/precipitation correlation constitute 37% of the Sahelian pixels being analyzed (10350/27903). Out of these pixels 0.6%, 56.7% and 42.8% (Table 3) were found to be characterized by significant negative, not significant and significant positive trends in RUE respectively.
6. Discussion
The general greening of the Sahel (1982–2010) (Figure 4) is in accordance previous findings reported from earlier AVHRR based datasets [6–8,10,14,16,17,58]. However, the magnitude of the average slope (0.011, Table 1) from the annually summed NDVI values (Figure 4(A)) is considerably smaller than what has reported as based on earlier versions of the GIMMS NDVI dataset. Fensholt and Rasmussen [10] reported an average annual slope of Sahel=0.025 for the period 1982–2007. The average slope value as produced from linear trend analysis of seasonally integrated NDVI (Figure 4(B)), claimed to be a more accurate representation of the greening/browning [6,8–10,58] produce a much higher average slope value (0.035).
The per-pixel linear regression analysis of GIMMS NDVI against CMAP precipitation showed a strong linear correlation for the majority of Sahelian pixels (Figure 5 and Table 2) including both the drier and wetter parts of the Sahel. This supports the bulk of scholars studying the spatio-temporal relation between NDVI and precipitation from rain gauges [4,10–17,59] all suggesting a linear relation to exist until precipitation amounts of 700–1,000 mm/year. Time series of air temperature was tested by [60,61] as explanatory variable for NDVI variability but only small areas of Sahel was characterized by significant correlations. A lower fraction of the pixels in the Sahel was found to be characterized by a significant correlation between NDVI and precipitation as compared to [10] based on data covering the period 1982–2007. The larger area of pixels with a significant correlation reported here is likely to be caused by the use of a newer re-processed precipitation dataset (also including more years) and a different NDVI seasonal integration approach. However, other findings suggest that this precipitation threshold from where linearity disappears is reached at considerably lower values of app 300 mm/year [21,23,24]. This threshold has important implications for the use of the RUE approach (Figure 1) based on both linearity and a constant ratio between productivity and precipitation. Much of the disagreement found on the use and interpretation of RUE [9,21,23,35] in fact stems from whether the relation can be described as linear, since it is argued that if a non-linear relation exists also for dryland areas a constant values of RUE over time could indicate ongoing land degradation [21,23]. The EO-based results as reported here nevertheless show a highly significant linear relation (Table 2) for large areas of Sahel (as defined by the 150–700 mm precipitation isohyets) as also supported by other EO-based analyses [8,10,17] suggesting no violation in the interpretation of RUE as suggested by Prince et al.[4,9]. Hein et al.[21] discuss the implication of spatial variability in the relation between productivity and precipitation and thereby RUE (caused by relief, soil type, runoff and run-on, plant communities, woody biomass cover, grazing and burning history) for the interpretation of remote sensing data. They argue that the assumptions of a uniform relation between productivity and precipitation will lead to an overestimation of the RUE in some areas, and an underestimate of RUE in other areas. This argument however, neglect that satellite based RUE analyses are conducted as per-pixel trend analyses thereby rendering the above concern irrelevant unless it can be shown that these variables have changed over time for a given pixel.
The offset in the regression between NDVI and precipitation (Sahel average of 2.83) does lead to a non-constant ratio between NDVI and precipitation (Figure 6(A)) (as also illustrated in Figure 1) for all pixels in the Sahel. This causes the calculated RUE to remain highly correlated with precipitation (Figure 8(A,B)) and the negative trends in rain use efficiency (RUE) (Figure 7(A,B)) may therefore be caused by a general increase in precipitation. The negative trends could be interpreted as land degradation, as has been done in Hountondji et al.[62], but we would claim that precipitation variability has not been properly normalized for in the RUE calculation, thereby rendering RUE inappropriate for the purpose of assessing land degradation. The conversion of the GIMMS NDVI into NPP using per-pixel linear correlation between SPOT VGT NPP/GIMMS NDVI 1999–2010 monthly observations (Figure 3) does not produce RUE time series data that are uncorrelated with precipitation time series due to a considerable per-pixel NPP offset when correlating NPP and precipitation; hence also RUE using this vegetation parameterization is deemed unsuitable for land degradation assessment. When applying the growing season integration of the NDVI signal (NDVI small integral) as input for RUE a much better normalization for the precipitation variability is obtained. Independent on the integration approach (relative fraction of NDVI or absolute threshold NDVI values) 56% of the pixels (Table 3, residual of pixels with a significant correlation) analyzed meet the criteria of RUE observations being uncorrelated to precipitation. This is also apparent in the growing season NDVI/precipitation linear regression offset (Figure 6(B)) (Sahel average of 0.009, Table 2) being close to zero which is a requirement for the adequate use and interpretation of trends in RUE.
From the combined use of these criteria (Figure 10) 37% of the Sahelian pixels are remaining for degradation assessment and it becomes clear that analysis of RUE-trends provides little evidence of widespread land degradation in the Sahel (0.6% of pixels show negative RUE trends), if land degradation is defined as a non-precipitation related loss in ANPP. It should be noted, however, that many other definitions and interpretations of the concept of land degradation exist, which are not covered by the present analysis. Further, the analysis does not tell us anything about possible land degradation in the 63% of the area for which the conditions of the present analysis were not fulfilled. Finally, land degradation, even in the specific meaning used here, may well take place at sub-pixel level.
7. Conclusions
The main findings of our analysis can be summarized as follows:
The use of rain use efficiency (RUE)-trends to identify land degradation (or the opposite) is based on the assumption that annual precipitation is the primary factor controlling above-ground net primary productivity (ANPP). Our analyses confirm earlier findings that a high (and statistically significant) linear correlation exists between annual precipitation and seasonally integrated normalized difference vegetation index (NDVI) (derived from the Climate Prediction Center Merged Analysis of Precipitation (CMAP) data-set) for 65% of the pixels in the Sahel. Only for these pixels is it meaningful to use RUE as a means of normalizing for precipitation variations.
The calculation of RUE is very sensitive to the choice of proxy for ANPP, and widely different conclusions concerning land degradation in the Sahel may be obtained depending on the vegetation parameterization approach.
The high positive offsets observed when calculating the per-pixel linear relationships between annual precipitation and annual ΣNDVI imply that in the case of a positive temporal trend in annual precipitation (as experienced in the Sahel over the period studied) RUE will decrease, as we observe. Yet this cannot be interpreted as an indication of land degradation; it must be seen as an artifact.
Conversion of ΣNDVI into ANPP, using the statistically significant (p ≤ 0.05) per-pixel linear relationship between ΣNDVI and the Système Pour l'Observation de la Terre (SPOT)-based net primary productivity (NPP) estimate, does not solve the problem associated with the large offset.
The large positive offset may be removed by using some version of the ‘small NDVI integral’, e.g., by applying the TIMESAT NDVI parameterization approach. The RUE calculated from this ‘small integral’ comes out as statistically weakly related to annual precipitation.
For the pixels fulfilling both conditions (high correlation between the ‘small NDVI integral’ and annual precipitation and low correlation between RUE and annual precipitation), the trend in RUE is on average positive, and pixels with negative trends are few. Thus RUE-based analysis does not indicate widespread non-precipitation related land degradation in the Sahel over the period studied.
Acknowledgments
The authors thank the NASA Global Inventory Modelling and Mapping Studies (GIMMS) group for producing and sharing the AVHRR GIMMS3g NDVI dataset. NOAA/National Weather Service, National Centers for Environmental Prediction, Climate Prediction Center is thanked for sharing the CMAP precipitation data. Finally, Jonsson, P., Center for Technology Studies, Malmö University and Eklundh, L., Department of Physical Geography and Ecosystem Science, Lund University are thanked for sharing the TIMESAT software. This research is part of the project entitled Earth Observation based Vegetation productivity and Land Degradation Trends in Global Drylands. The project is funded by the the Danish Council for Independent Research (DFF) Sapere Aude programme.
References
- Nicholson, S.E. The nature of rainfall variability over Africa on time scales of decades to millenia. Global Planet. Change 2000, 26, 137–158. [Google Scholar]
- Lamb, P.J. Persistence of Sub-Saharan drought. Nature 1982, 299, 46–48. [Google Scholar]
- Hulme, M. Climatic perspectives on Sahelian desiccation: 1973–1998. Global Environ. Change 2001, 11, 19–29. [Google Scholar]
- Prince, S.D.; de Colstoun, E.B.; Kravitz, L.L. Evidence from rain-use efficiencies does not indicate extensive Sahelian desertification. Global Change Biol. 1998, 4, 359–374. [Google Scholar]
- Rasmussen, K.; Fog, B.; Madsen, J.E. Desertification in reverse? Observations from northern Burkina Faso. Global Environ. Change 2001, 11, 271–282. [Google Scholar]
- Eklundh, L.; Olsson, L. Vegetation index trends for the African Sahel 1982–1999. Geophys. Res. Lett 2003, 30, 1430. [Google Scholar]
- Anyamba, A.; Tucker, C.J. Analysis of Sahelian vegetation dynamics using NOAA-AVHRR NDVI data from 1981–2003. J. Arid Environ 2005, 63, 596–614. [Google Scholar]
- Herrmann, S.M.; Anyamba, A.; Tucker, C.J. Recent trends in vegetation dynamics in the African Sahel and their relationship to climate. Global Environ. Change 2005, 15, 394–404. [Google Scholar]
- Prince, S.D.; Wessels, K.J.; Tucker, C.J.; Nicholson, S.E. Desertification in the Sahel: A reinterpretation of a reinterpretation. Global Change Biol 2007, 13, 1308–1313. [Google Scholar]
- Fensholt, R.; Rasmussen, K. Analysis of trends in the Sahelian ‘rain-use efficiency’ using GIMMS NDVI, RFE and GPCP rainfall data. Remote Sens. Environ 2011, 115, 438–451. [Google Scholar]
- Malo, A.R.; Nicholson, S.E. A Study of rainfall and vegetation dynamics in the African Sahel using normalized difference vegetation index. J. Arid Environ 1990, 19, 1–24. [Google Scholar]
- Nicholson, S.E.; Davenport, M.L.; Malo, A.R. A comparison of the vegetation response to rainfall in the Sahel and East-Africa, using normalized difference vegetation index from NOAA AVHRR. Climatic Change 1990, 17, 209–241. [Google Scholar]
- Davenport, M.L.; Nicholson, S.E. On the Relation between rainfall and the normalized difference vegetation index for diverse vegetation types in East-Africa. Int. J. Remote Sens 1993, 14, 2369–2389. [Google Scholar]
- Hickler, T.; Eklundh, L.; Seaquist, J.W.; Smith, B.; Ardo, J.; Olsson, L.; Sykes, M.T.; Sjostrom, M. Precipitation controls Sahel greening trend. Geophys. Res. Lett 2005, 32, L21415–L21419. [Google Scholar]
- Olsson, L.; Eklundh, L.; Ardo, J. A recent greening of the Sahel—Trends, patterns and potential causes. J. Arid Environ 2005, 63, 556–566. [Google Scholar]
- Hellden, U.; Tottrup, C. Regional desertification: A global synthesis. Global Planet. Change 2008, 64, 169–176. [Google Scholar]
- Huber, S.; Fensholt, R.; Rasmussen, K. Water availability as the driver of vegetation dynamics in the African Sahel from 1982 to 2007. Global Planet. Change 2011, 76, 186–195. [Google Scholar]
- Lebel, T.; Ali, A. Recent trends in the Central and Western Sahel rainfall regime (1990–2007). J. Hydrol 2009, 375, 52–64. [Google Scholar]
- Fensholt, R.; Proud, S.R. Evaluation of earth observation based global long term vegetation trends—Comparing GIMMS and MODIS global NDVI time series. Remote Sens. Environ 2012, 119, 131–147. [Google Scholar]
- Le Houérou, H.N. Rain Use Efficiency—A unifying concept in Arid-Land ecology. J. Arid Environ 1984, 7, 213–247. [Google Scholar]
- Hein, L.; de Ridder, N.; Hiernaux, P.; Leemans, R.; de Wit, A.; Schaepman, M. Desertification in the Sahel: Towards better accounting for ecosystem dynamics in the interpretation of remote sensing images. J. Arid Environ 2011, 75, 1164–1172. [Google Scholar]
- Bai, Z.G.; Dent, D.L.; Olsson, L.; Schaepman, M.E. Proxy global assessment of land degradation. Soil Use Manag 2008, 24, 223–234. [Google Scholar]
- Hein, L.; de Ridder, N. Desertification in the Sahel: A reinterpretation. Global Change Biol 2006, 12, 751–758. [Google Scholar]
- Hein, L. The impacts of grazing and rainfall variability on the dynamics of a Sahelian rangeland. J. Arid Environ 2006, 64, 488–504. [Google Scholar]
- Breman, H.; Dewit, C.T. Rangeland productivity and exploitation in the Sahel. Science 1983, 221, 1341–1347. [Google Scholar]
- Huxman, T.E.; Smith, M.D.; Fay, P.A.; Knapp, A.K.; Shaw, M.R.; Loik, M.E.; Smith, S.D.; Tissue, D.T.; Zak, J.C.; Weltzin, J.F.; et al. Convergence across biomes to a common rain-use efficiency. Nature 2004, 429, 651–654. [Google Scholar]
- Ruppert, J.C.; Holm, A.; Miehe, S.; Muldavin, E.; Snyman, H.A.; Wesche, K.; Linstädter, A. Meta-analysis of rain-use efficiency confirms indicative value for degradation and supports non-linear response along precipitation gradients. J. Veg. Sci 2012, 23, 1035–1050. [Google Scholar]
- Hu, Z.M.; Yu, G.R.; Fan, J.W.; Zhong, H.P.; Wang, S.Q.; Li, S.G. Precipitation-use efficiency along a 4500-km grassland transect. Global Ecol. Biogeogr 2010, 19, 842–851. [Google Scholar]
- Tucker, C.J.; Vanpraet, C.; Boerwinkel, E.; Gaston, A. Satellite remote-sensing of total dry-matter production in the Senegalese Sahel. Remote Sens. Environ 1983, 13, 461–474. [Google Scholar]
- Tucker, C.J.; Vanpraet, C.L.; Sharman, M.J.; Vanittersum, G. Satellite remote-sensing of total herbaceous biomass production in the Senegalese Sahel: 1980–1984. Remote Sens. Environ 1985, 17, 233–249. [Google Scholar]
- Diallo, O.; Diouf, A.; Hanan, N.P.; Ndiaye, A.; Prevost, Y. AVHRR monitoring of savanna primary production in Senegal, West Africa: 1987–1988. Int. J. Remote Sens 1991, 12, 1259–1279. [Google Scholar]
- Paruelo, J.M.; Epstein, H.E.; Lauenroth, W.K.; Burke, I.C. ANPP estimates from NDVI for the central grassland region of the United States. Ecology 1997, 78, 953–958. [Google Scholar]
- Rasmussen, M.S. Developing simple, operational, consistent NDVI-vegetation models by applying environmental and climatic information: Part I. Assessment of net primary production. Int. J. Remote Sens 1998, 19, 97–117. [Google Scholar]
- Diouf, A.; Lambin, E.F. Monitoring land-cover changes in semi-arid regions: Remote sensing data and field observations in the Ferlo, Senegal. J. Arid Environ 2001, 48, 129–148. [Google Scholar]
- Wessels, K.J.; Prince, S.D.; Malherbe, J.; Small, J.; Frost, P.E.; van Zyl, D. Can human-induced land degradation be distinguished from the effects of rainfall variability? A case study in South Africa. J. Arid Environ 2007, 68, 271–297. [Google Scholar]
- Claude, J.; Grouzis, M.; Milleville, P. Un Espace Sahélien: La Mare d’Oursi (Burkina Faso) (1976–1981); ORSTOM: Paris, France, 1991. [Google Scholar]
- Mbow, C.; Fensholt, R.; Diop, D.; Rasmussen, K. Can vegetation productivity be derived from greenness in a semi-arid environment? Evidence from ground-based measurements. J. Arid Environ. 2013. in review.. [Google Scholar]
- Hiernaux, P.; Mougin, E.; Diarra, L.; Soumaguel, N.; Lavenu, F.; Tracol, Y.; Diawara, M. Sahelian rangeland response to changes in rainfall over two decades in the Gourma region, Mali. J. Hydrol 2009, 375, 114–127. [Google Scholar]
- Nicholson, S.E. Sahel, West Africa. Encyclopedia of Environmental Biology 1995, 3, 261–275. [Google Scholar]
- Mayaux, P.; Bartholomé, E.; Massart, M.; Van Cutsem, C.; Cabral, A.; Nonguierma, A.; Diallo, O.; Pretorius, C.; Thompson, M.; Cherlet, M.; et al. A Land-Cover Map of Africa; Office for Official Publications of the European Communities: Luxembourg, 2003. [Google Scholar]
- Brown, M.E. The Famine Early Warning Systems and Remote Sensing Data; Springer Verlag: Berlin/Heidelberg, German, 2008; p. 313. [Google Scholar]
- Beck, H.E.; McVicar, T.R.; van Dijk, A.I.J.M.; Schellekens, J.; de Jeu, R.A.M.; Bruijnzeel, L.A. Global evaluation of four AVHRR-NDVI data sets: Intercomparison and assessment against Landsat imagery. Remote Sens. Environ 2011, 115, 2547–2563. [Google Scholar]
- Goward, S.N.; Dye, D.G.; Turner, S.; Yang, J. Objective assessment of the NOAA global vegetation index data product. Int. J. Remote Sens 1993, 14, 3365–3394. [Google Scholar]
- Tucker, C.J.; Pinzon, J.E.; Brown, M.E.; Slayback, D.A.; Pak, E.W.; Mahoney, R.; Vermote, E.F.; El Saleous, N. An extended AVHRR 8-km NDVI dataset compatible with MODIS and SPOT vegetation NDVI data. Int. J. Remote Sens 2005, 26, 4485–4498. [Google Scholar]
- Pinzon, J.; Brown, M.E.; Tucker, C.J. Satellite Time Series Correction of Orbital Drift Artifacts Using Empirical Mode Decomposition. In Hilbert-Huang Transform: Introduction and Applications; Huang, N., Ed.; World Scientific Publishing Company: Singapore, 2005; pp. 167–186. [Google Scholar]
- Monteith, J.L. Solar-radiation and productivity in tropical ecosystems. J. Appl. Ecol 1972, 9, 747–766. [Google Scholar]
- Veroustraete, F.; Sabbe, H.; Eerens, H. Estimation of carbon mass fluxes over Europe using the C-Fix model and Euroflux data. Remote Sens. Environ 2002, 83, 376–399. [Google Scholar]
- Weiss, M.; Baret, F.; Eerens, H.; Swinnen, E. fAPAR over Europe for the Past 28 Years: A Temporally Consistent Product Derived from AVHRR and VEGETATION Sensors. Proceedings of 3rd International Symposium “Recent Advances in Quantitative Remote Sensing”, Valencia, Spain, 27 September–1 October 2010.
- Xie, P.; Arkin, P.A. Global precipitation: A 17-year monthly analysis based on gauge observations, satellite estimates and numerical model outputs. Bull. Am. Meteorol. Soc 1997, 78, 2539–2558. [Google Scholar]
- Jonsson, P.; Eklundh, L. Seasonality extraction by function fitting to time-series of satellite sensor data. IEEE Trans. Geosci. Remote Sens 2002, 40, 1824–1832. [Google Scholar]
- Jonsson, P.; Eklundh, L. TIMESAT—A program for analyzing time-series of satellite sensor data. Comput. Geosci 2004, 30, 833–845. [Google Scholar]
- Hoaglin, D.C.; Mosteller, F.; Tukey, J.W. Understanding Robust and Exploratory Data Analysis; Wiley: New York, NY, USA, 2000. [Google Scholar]
- Sen, P.K. Estimates of the regression coefficient based on Kendall’s tau. J. Am. Stat. Assoc 1968, 63, 1379–1389. [Google Scholar]
- Theil, H. A rank-invariant method of linear and polynomial regression analysis. I, II, III. Nederl. Akad. Wetensch. Proc. Ser. A 1950, 53. [Google Scholar]
- de Beurs, K.M.; Henebry, G.M. Land surface phenology and temperature variation in the International Geosphere-Biosphere Program high-latitude transects. Globle Change Biol 2005, 11, 779–790. [Google Scholar]
- Alcaraz-Segura, D.; Chuvieco, E.; Epstein, H.E.; Kasischke, E.S.; Trishchenko, A. Debating the greening vs. browning of the North American boreal forest: differences between satellite datasets. Globle Change Biol 2010, 16, 760–770. [Google Scholar]
- de Jong, R.; de Bruin, S.; de Wit, A.; Schaepman, M.E.; Dent, D.L. Analysis of monotonic greening and browning trends from global NDVI time-series. Remote Sens. Environ 2011, 115, 692–702. [Google Scholar]
- Heumann, B.W.; Seaquist, J.W.; Eklundh, L.; Jonsson, P. AVHRR derived phenological change in the Sahel and Soudan, Africa, 1982–2005. Remote Sens. Environ 2007, 108, 385–392. [Google Scholar]
- Lind, M.; Fensholt, R. The spatio-temporal relationship between rainfall and vegetation development in Burkina Faso. Dan. J. Geogr 1999, 2, 43–55. [Google Scholar]
- Fensholt, R.; Langanke, T.; Rasmussen, K.; Reenberg, A.; Prince, S.D.; Tucker, C.J.; Scholes, R.J.; Le, Q.G.; Bondeau, A.; Eastman, E.; et al. Greenness in semi-arid areas across the globe 1981–2007—An Earth Observing Satellite based analysis of trends and drivers. Remote Sens. Environ 2012, 121, 144–158. [Google Scholar]
- Kaspersen, P.; Fensholt, R.; Huber, S. A spatio-temporal analysis of climatic drivers for observed changes in Sahelian vegetation productivity 1982–2007. Int. J. Geophys. 2011. [Google Scholar] [CrossRef]
- Hountondji, Y.C.; Sokpon, N.; Ozer, P. Analysis of the vegetation trends using low resolution remote sensing data in Burkina Faso (1982–1999) for the monitoring of desertification. Int. J. Remote Sens 2006, 27, 871–884. [Google Scholar]


| Slope (Avg. All Pixels Analyzed) (n = 27902) | Slope (Pixels of Significant Trend (p < 0.05)) | Pixels of Positive Trend (p < 0.05) (% of All Pixels Analyzed) (n = 27902) | Pixels of Negative Trend (p < 0.05) (% of All Pixels Analyzed) (n = 27902) | |
|---|---|---|---|---|
| Annual summed NDVI | 0.011 | 0.029 (n = 9399) | 30.7 | 3.0 |
| Seasonally integrated NDVI | 0.035 | 0.046 (n = 20930) | 74.6 | 0.4 |
| Number of Pixels of Significant Correlation (p < 0.05) (% of All Pixels Analyzed) (n = 27902) | Number of Pixels of Significant Correlation (p < 0.01) (% of All Pixels Analyzed) (n = 27902) | Linear Regression Offset (Avg. All Pixels Analyzed) (n = 27902) | Std. Dev. of Offset (Avg. All Pixels Analyzed) (n = 27902) | |
|---|---|---|---|---|
| GIMMS NDVI (annual sum)/CMAP precipitation correlation | 66.4 | 40.7 | 2.832 | 2.497 |
| GIMMS NDVI (Seasonally integrated)/CMAP precipitation correlation | 65.1 | 47.7 | 0.009 | 0.462 |
| Average (All Pixels Analyzed) (n = 27902) | Std. Dev. (All Pixels Analyzed) | Pixels of Positive Trend (p < 0.05) (% of All Pixels Analyzed) | Pixels of Negative Trend (p < 0.05) (% of All Pixels Analyzed) | |
|---|---|---|---|---|
| RUE Slope (RUE ×1,000) | ||||
| (GIMMS NDVI (annual sum)/CMAP precipitation) | −0.058 | 0.043 | 2.8 | 41.0 |
| (NPP/CMAP precipitation) | −0.047 | 0.052 | 2.8 | 41.0 |
| RUE slope (GIMMS NDVI (seasonal integral; relative threshold values)/CMAP precipitation) | 0.029 | 0.019 | 55.5 | 2.3 |
| (GIMMS NDVI (seasonal integral; absolute threshold values)/CMAP precipitation) | 0.039 | 0.021 | 41.5 | 0.9 |
| Masked data (n = 10350)* (GIMMS NDVI (seasonal integral; absolute threshold values)/CMAP precipitation) | 0.03* | 0.0175* | 42.9* | 0.6* |
| Rue/Precipitation Correlation | ||||
| RUE based on GIMMS NDVI (annual sum) | −0.908 | 0.048 | 0.0 | 99.9 |
| RUE based on NPP | −0.907 | 0.059 | 0.0 | 99.9 |
| RUE based on GIMMS NDVI (seasonal integral; relative threshold values) | −0.149 | 0.333 | 9.1 | 34.4 |
| RUE based on GIMMS NDVI (seasonal integral; absolute threshold values) | −0.079 | 0.349 | 15.1 | 28.3 |
Share and Cite
Fensholt, R.; Rasmussen, K.; Kaspersen, P.; Huber, S.; Horion, S.; Swinnen, E. Assessing Land Degradation/Recovery in the African Sahel from Long-Term Earth Observation Based Primary Productivity and Precipitation Relationships. Remote Sens. 2013, 5, 664-686. https://doi.org/10.3390/rs5020664
Fensholt R, Rasmussen K, Kaspersen P, Huber S, Horion S, Swinnen E. Assessing Land Degradation/Recovery in the African Sahel from Long-Term Earth Observation Based Primary Productivity and Precipitation Relationships. Remote Sensing. 2013; 5(2):664-686. https://doi.org/10.3390/rs5020664
Chicago/Turabian StyleFensholt, Rasmus, Kjeld Rasmussen, Per Kaspersen, Silvia Huber, Stephanie Horion, and Else Swinnen. 2013. "Assessing Land Degradation/Recovery in the African Sahel from Long-Term Earth Observation Based Primary Productivity and Precipitation Relationships" Remote Sensing 5, no. 2: 664-686. https://doi.org/10.3390/rs5020664