Article

A Texture-Based Land Cover Classification for the Delineation of a Shifting Cultivation Landscape in the Lao PDR Using Landscape Metrics

1
Department of Integrative Geography (DIG), Institute of Geography, and Centre for Development and Environment (CDE), University of Bern, Hallerstrasse 10, CH-3012 Bern, Switzerland
2
Centre for Development and Environment (CDE), University of Bern, Hallerstrasse 10, CH-3012 Bern, Switzerland
*
Author to whom correspondence should be addressed.
Remote Sens. 2013, 5(7), 3377-3396; https://doi.org/10.3390/rs5073377
Submission received: 3 June 2013 / Revised: 9 July 2013 / Accepted: 9 July 2013 / Published: 15 July 2013

Abstract

:
The delineation of shifting cultivation landscapes using remote sensing in mountainous regions is challenging. On the one hand, there are difficulties related to the distinction of forest and fallow forest classes as occurring in a shifting cultivation landscape in mountainous regions. On the other hand, the dynamic nature of the shifting cultivation system poses problems to the delineation of landscapes where shifting cultivation occurs. We present a two-step approach based on an object-oriented classification of Advanced Land Observing Satellite, Advanced Visible and Near-Infrared Spectrometer (ALOS AVNIR) and Panchromatic Remote-sensing Instrument for Stereo Mapping (ALOS PRISM) data and landscape metrics. When including texture measures in the object-oriented classification, the accuracy of forest and fallow forest classes could be increased substantially. Based on such a classification, landscape metrics in the form of land cover class ratios enabled the identification of crop-fallow rotation characteristics of the shifting cultivation land use practice. By classifying and combining these landscape metrics, shifting cultivation landscapes could be delineated using a single land cover dataset.

1. Introduction

In many tropical forest regions, including Montane Mainland Southeast Asia and, especially, the Lao People’s Democratic Republic (PDR), hereafter Laos, shifting cultivation is still widespread and an important subsistence agriculture system [14]. Two methodological challenges are encountered in delineating the landscapes where shifting cultivation is practiced. The first is the classification of different forest classes in mountainous regions using remote sensing imagery. Both land cover and topography determine the spectral value of the remote sensing images, which, in turn, affects the classification accuracy [5]. Second, an appropriate set of landscape metrics is required to delineate shifting cultivation landscapes using land cover data [6,7].
The land cover in a shifting cultivation landscape is characterized by a spatial pattern of currently cultivated plots and various fields showing different stages of fallow vegetation and forest [2]. To detect these spatio-temporal patterns of shifting cultivation using remote sensing, most studies have analyzed time series of satellite images [3,811]. By classifying the cultivated areas and the vegetated areas of each image of the time series and performing a post-classification comparison, the plots under shifting cultivation and their crop-fallow rotation cycles can be assessed [3]. Such an approach, however, also has disadvantages: for an assessment of the spatial extent of shifting cultivation, a long time series of images needs to be analyzed, which is time-consuming. Additionally, the observable area is limited by the availability of time series images, as well as cloud cover and haze issues in each image.
Other approaches, e.g., Hett et al. [2] or Messerli et al. [12], used the spatial pattern characteristic of shifting cultivation to derive the areas where this land use system is practiced. Both approaches used landscape metrics and are considered to provide credible estimates of the shifting cultivation landscapes, but their analyses relied upon information on the land use in those areas. The datasets they based the landscape metrics on separated between the currently cultivated shifting cultivation plots and the plots used for permanent agriculture, making the delineation of areas under shifting cultivation less complex. Using remote sensing for the classification of land use requires, in most cases, the use of auxiliary information, visual interpretation or spatial assessments of the key land elements [13,14]. Classification of land use is, thus, also more time-consuming than a land cover classification and can be user biased when involving visual interpretation [15,16]. There is also a loss in detail when using a land cover classification instead of land use data. Nevertheless, delineating shifting cultivation landscapes by using landscape metrics based on a supervised land cover classification could be less laborious and, thus, easier to replicate than classifying land use.
Different forest classes occurring in a shifting cultivation landscape can be classified based on the canopy shades of mature forests, which affect the spectral reflectance of remote sensing images [1719]. While this information can be useful for mapping forest classes in flat areas, its application is limited in mountainous regions. When the terrain is more rugged, topography also determines the spectral value of the remote sensing imagery, resulting in strong variability in the reflectance from canopies in a forest class, due to direct shadows, as well as cast shadows [5].
The inclusion of texture in the classification can help to overcome this problem. Texture measures quantify the spatial variation of the image tone values of neighboring pixels [20]. They are, thus, less affected by the variability in the reflectance due to terrain shadows and increase the accuracy of classes related to forests [2125]. However, there are limitations when performing a pixel-based classification using texture measures. First, the kernel size used to calculate the texture measure affects the classification accuracy. Depending on the land cover type, different kernel sizes are appropriate. Additionally, the between class texture tends to degrade the overall classification performance when calculating the texture measure using a kernel [23].
Image segmentation to produce image objects (or segments) prior to the calculation of the texture measures can resolve these issues. Between class texture is, thus, eliminated due to the texture calculation within the image objects, and the texture measure is no longer limited to a single scale, but to the image object size. In a flat study region, this approach increased the accuracy of the object-oriented classification by 4% [23]. In an area with rugged topography, the inclusion of texture measures in a pixel-based classification nearly doubled the accuracy of the land cover classification [24]. We therefore assume that the classification accuracy can be increased substantially in a mountainous region when using image objects and texture measures.
Based on these premises, this study has two objectives:
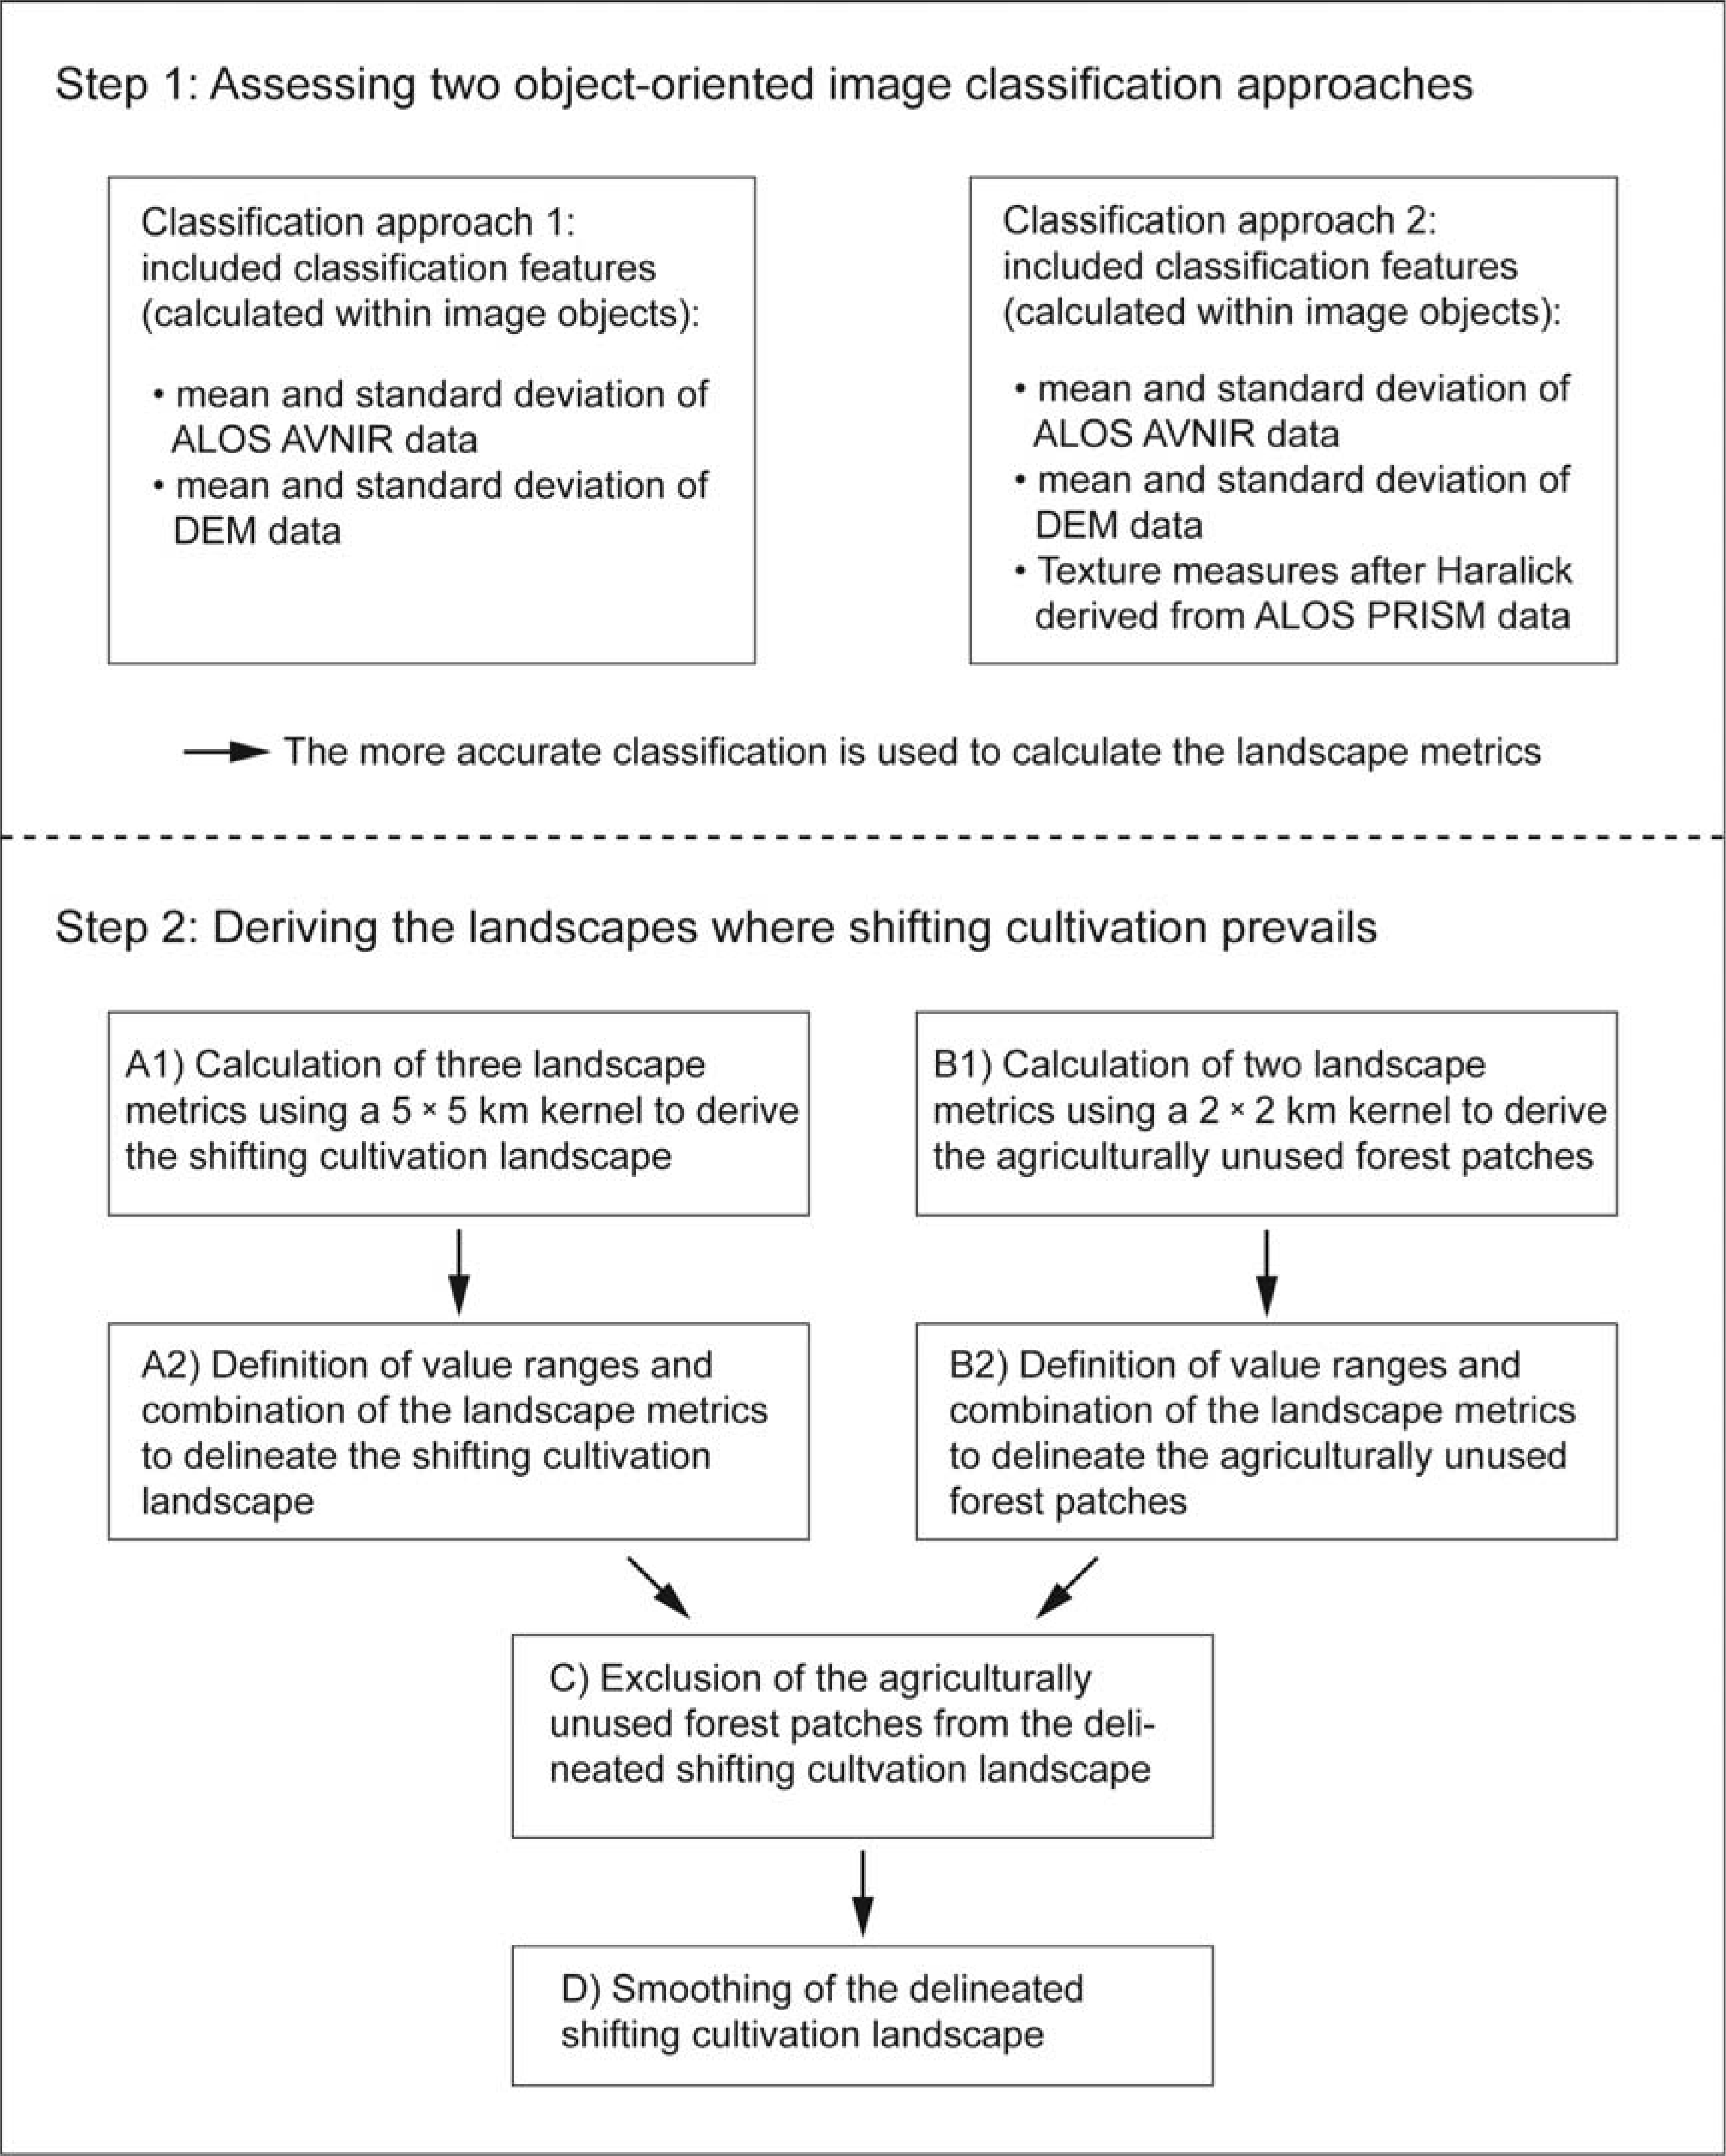
  • To determine the influence of the texture measures on the accuracy of an object-oriented land cover classification in a mountainous region;
  • To assess the potential of such a classification to delineate the landscapes where shifting cultivation is practiced using landscape metrics.
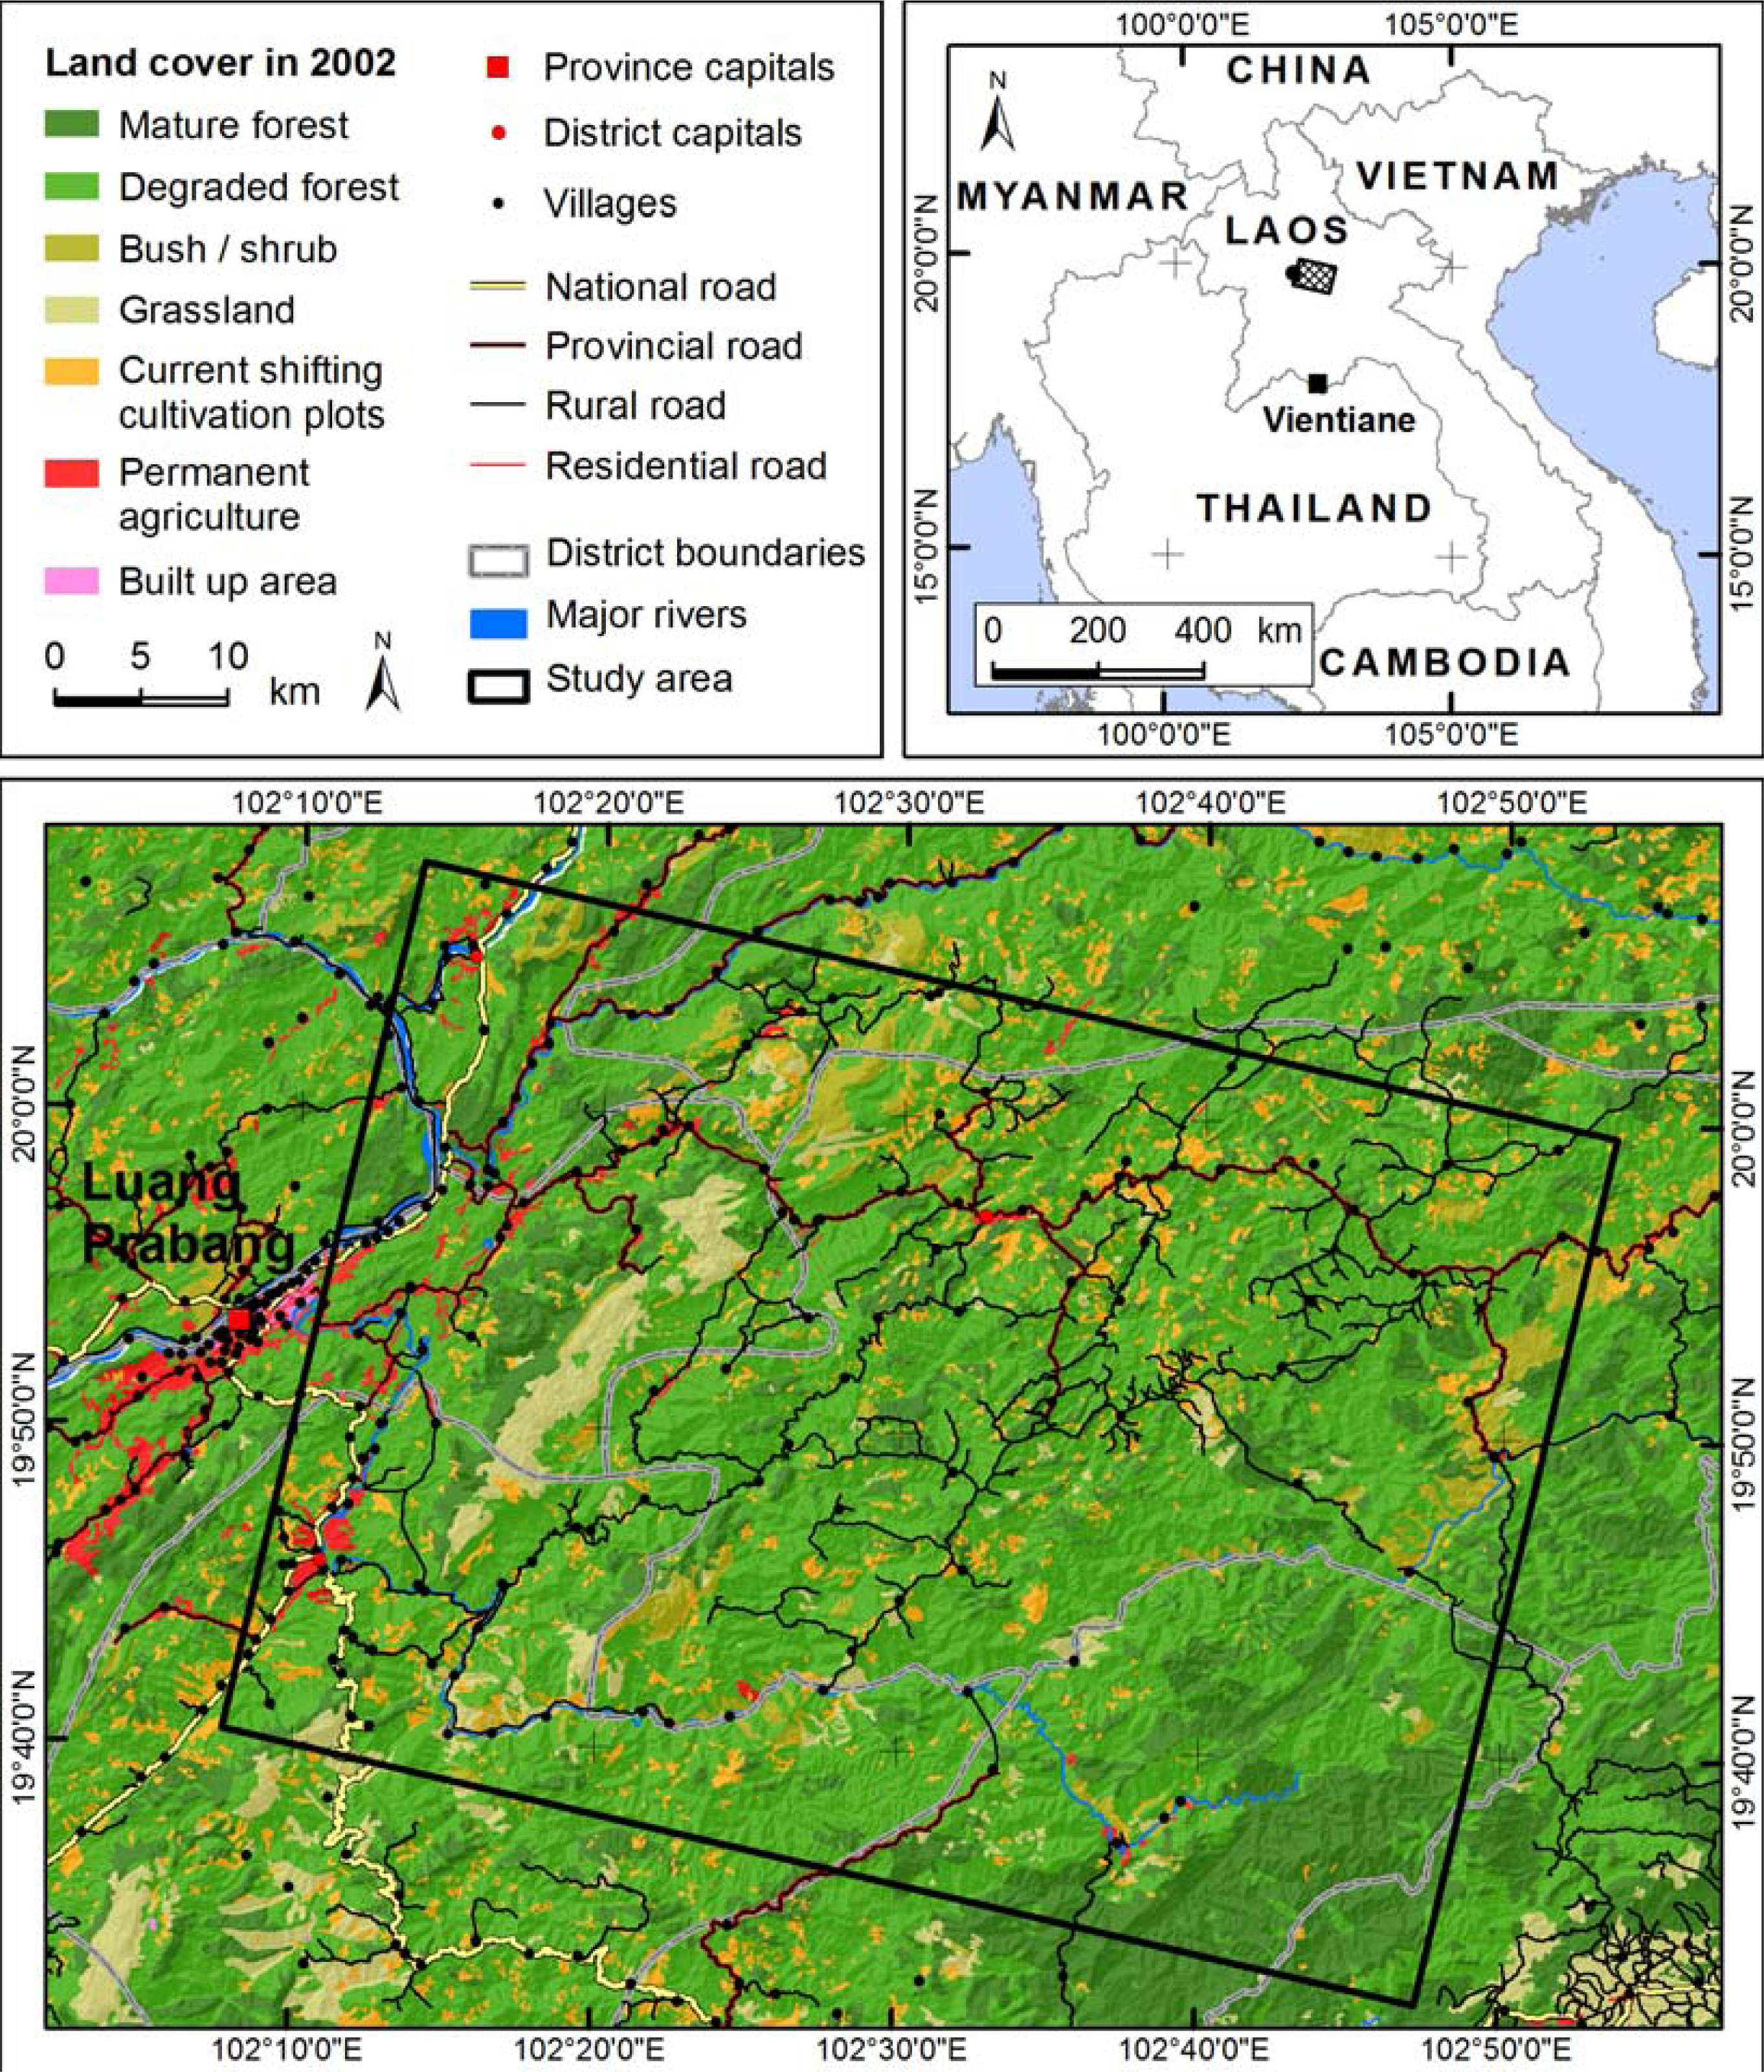
2. Study Site

The study site lies in the northern uplands of Laos, extending from the outskirts of the province capital, Luang Prabang, towards the east and covering approximately 3,500 km2. The topography of the whole area is rugged, showing steep slopes and narrow river valleys with altitudes ranging from 140 to 2,120 m above sea level. Accessibility in terms of travel time from the province capital, Luang Prabang, decreases rapidly from the west to the east, as only one unpaved road connects Luang Prabang to Phonxay district [26]. As shown in Figure 1, this gradient in accessibility parallels a change in the land use practices between the western and the eastern part of the study region. In the western part, around Luang Prabang, the prevailing land use categories are permanent agriculture and rotational agriculture on three fixed plots (a production system introduced in the 1990s by the Government of Laos in an effort to reduce poverty and stabilize shifting cultivation) [27,28]. Travelling eastwards, a degraded mountain ridge is encountered, showing mainly imperata grassland with patches of bare land or secondary forest [29]. Behind that mountain ridge, traditional shifting cultivation with fallow lengths of more than three years prevails [30]. We refer to this as traditional shifting cultivation, because it has not yet been affected by the Lao policy limiting farmers to three fixed plots. Patches of mature forest occur all over the study region, with larger patches in the less densely populated western part of the study region [26].

3. Data

3.1. Satellite Imagery

This study used one georeferenced ALOS AVNIR (Advanced Land Observing Satellite, Advanced Visible and Near Infrared Spectrometer) and two georeferenced ALOS PRISM (Panchromatic Remote-sensing Instrument for Stereo Mapping) level 1b2 scenes. The acquisition date of the images is 30 November 2008, which is after the harvest when the cultivated plots are bare and easily detectable [3]. The ALOS AVNIR data has a resolution of 10 m and the ALOS PRISM data a resolution of 2.5 m. The overlapping area of the AVNIR and PRISM data resulted in the extent of the study area of 50 × 70 km. We found the quality of the images to be satisfactory; thus, no atmospheric calibration had to be applied. We did not perform a topographic correction, due to the differences in the resolution between the ALOS AVNIR/PRISM scenes and the available Digital Elevation Model [19,31].

3.2. Topographic Data
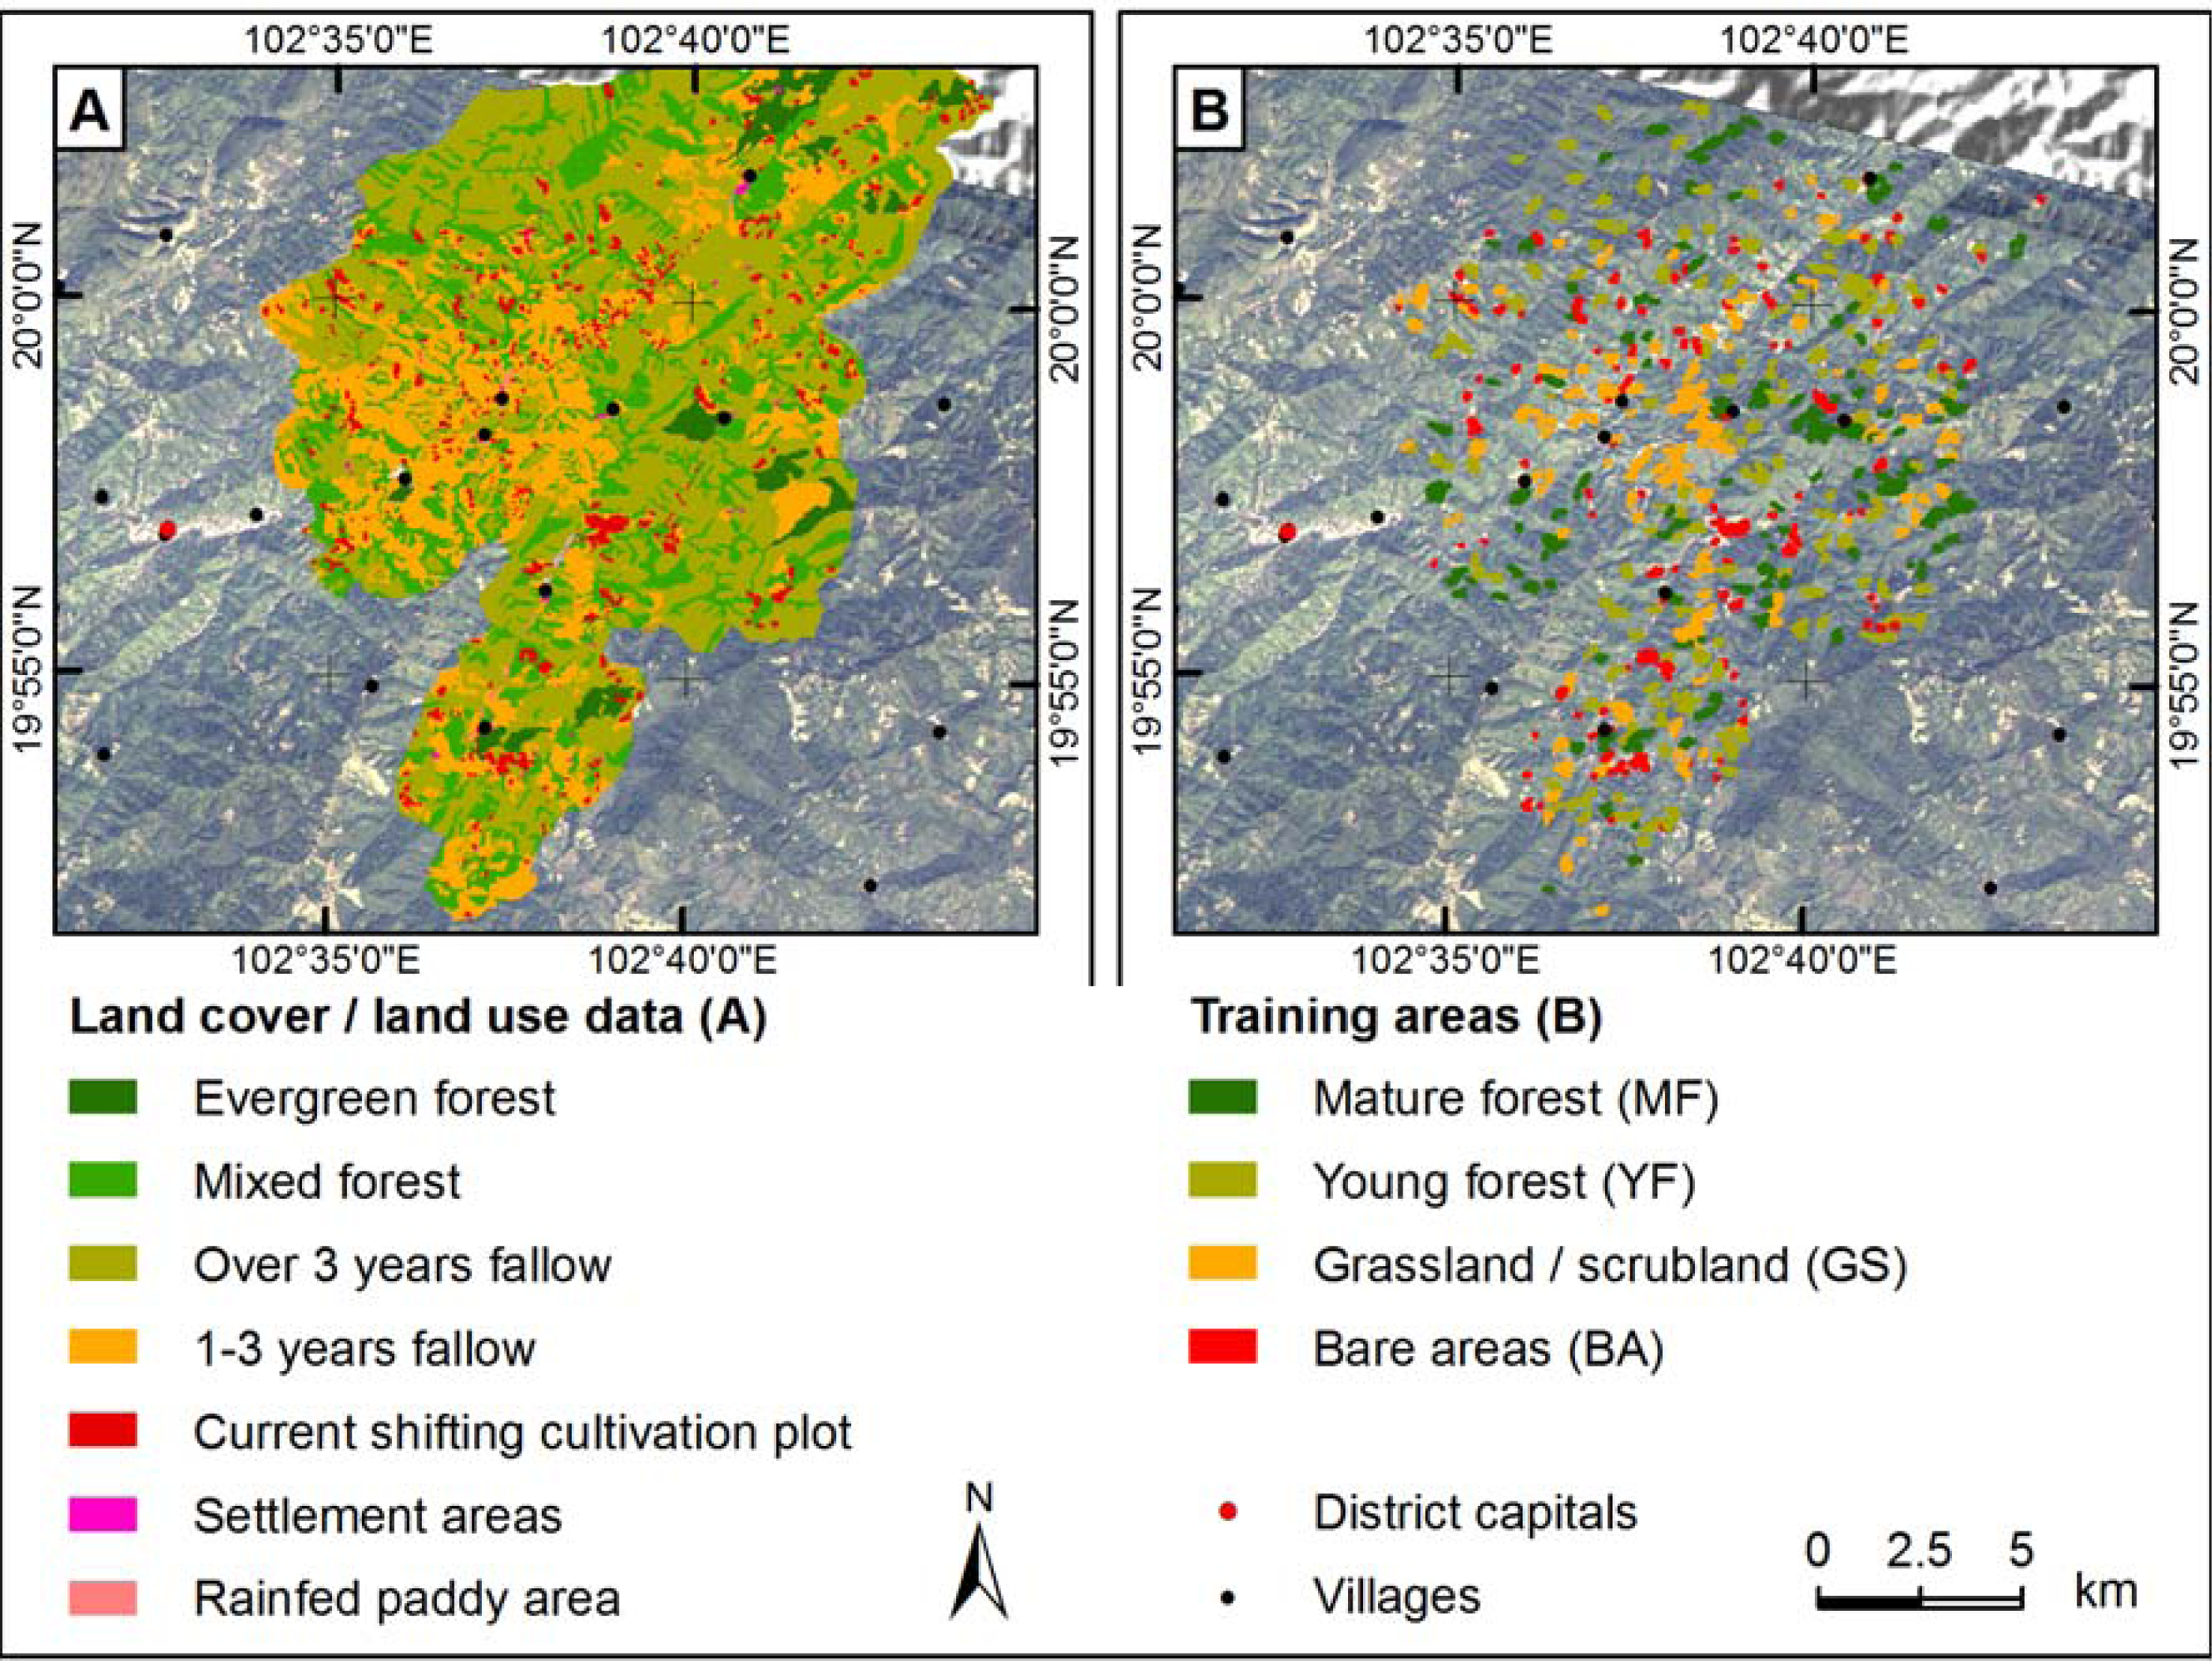
A Digital Elevation Model was included in the object-oriented image classification to achieve higher classification accuracy [5,32]. We used ASTER GDEM data (Advanced Spaceborne Thermal Emission and Reflection Radiometer Global Digital Elevation Map), provided by the Ministry of Economy, Trade and Industry (METI) of Japan and the United States National Aeronautics and Space Administration (NASA). The ASTER GDEM data is provided as a georeferenced product and has a resolution of 30 m. No shifts were found between the ASTER GDEM data and the ALOS AVNIR and PRISM satellite imagery; thus, no further co-registration of the data was performed. We included elevation, slope and aspect in the classification.

3.3. Training Data

The training areas for the land cover classification were based on village level land cover and land use data assessed for a village cluster in the study region where shifting cultivation with fallow periods of six to ten years is practiced [30]. Based on the pan sharpened ALOS satellite image, land cover units (polygons) were manually digitized and classified with the participation of the village population.
Not all land uses can be classified directly from remote sensing imagery (e.g., distinguishing between a permanently cultivated plot and a currently cultivated shifting cultivation plot) [13,14]. Thus we reclassified the land use data into four land cover classes: “bare areas” (BA)—currently cultivated shifting cultivation plots (after harvest), areas of permanent agriculture (after harvest) and the area of villages and hamlets; “grassland/scrubland” (GS)—up to three years old fallow land, grassland and scrubland; “young forest” (YF)—fallow land older than three years and secondary forest; and “mature forest” (MF)—mature evergreen and mixed (evergreen and deciduous) forest classes. The geometries of the village level land cover polygons differed from the geometries of the image objects derived by the segmentation process. We therefore only used the land cover data to train the classifier if both polygons (village level land cover data and the image objects) overlapped by more than 95%. Figure 2A shows the participatory assessed land use and land cover data and Figure 2B, the training data. The training areas consisted of 160 polygons per class and only covered a part of the study area.

4. Approach and Methodology

We used two steps to derive the landscape where the shifting cultivation land use practice prevails. Figure 3 provides an overview of the entire approach.
In the first step, we tested two different object-oriented image classification approaches. One was based on the spectral reflectance of the satellite imagery and ASTER GDEM data, while the other also included texture measures. In the second step, we used a set of landscape metrics to delineate shifting cultivation landscapes. We considered a shifting cultivation dominated landscape as those regions where the traditional shifting cultivation land use practice with fallow lengths longer than three years prevailed.

4.1. Image Segmentation and Classification

In the first step of the presented approach, we performed the two object-oriented image classifications as shown in Figure 3, Step 1. To perform the object oriented image analysis, the image is segmented to produce image objects (or segments), which consist of relatively homogenous groups of pixels. The image classification is then based on these image objects [23]. To group the pixels into image objects, we performed multiresolution segmentation in the eCognition 8.7 software. Multiresolution segmentation is an optimization procedure, which for a given number of image objects, minimizes their average heterogeneity and maximizes their respective homogeneity [33,34]. Following Kim et al. [35], we determined the appropriate scale parameter for the image objects by calculating the local variance and Moran’s I index using the NIR band for a range of scale parameters. The image objects were calculated using the four ALOS AVNIR bands, with the shape and compactness criteria set to 0.1 and 0.5, respectively. Image objects were calculated with scale parameters ranging from 30 to 110 with an interval of five. We found an image object scale parameter of 55 to be appropriate, which resulted in an average image object size of 2 ha. As the classification was based on these image objects, we could include datasets of different spatial resolution (namely ALOS PRISM (2.5 m), ALOS AVNIR (10 m) and ASTER GDEM (30 m) data) without further processing.
Prior to the classification of the land cover, we masked the areas with extreme terrain shadows by applying a threshold classification. We performed two different classification approaches to assess their effect on accuracy when including texture measures in the image classification within mountainous areas. The first classification approach used ALOS AVNIR data and ASTER GDEM topographic data. Within the image objects, we calculated the mean and the standard deviation of the layer values (the four multispectral bands of the ALOS AVNIR data and the elevation, slope and aspect calculated from the ASTER GDEM data). In the second classification approach, we also included grey level co-occurrence matrix (GLCM) texture measures [36], calculated using the ALOS PRISM data. We then computed the texture measures within the image objects. Such object-specific texture has the advantage that the kernel size for the calculation of the texture measures does not need to be defined, and problems related to the between class texture are eliminated [23]. We included multiple texture measures, as they were not found to produce a notable increase in classification accuracy when individually employed [23]. The texture measures used were: homogeneity, contrast, dissimilarity, entropy, angular second moment, mean, standard deviation and correlation. Each of them was calculated in all directions.
The image objects were classified into the four classes: “bare areas” (BA)—currently cultivated shifting cultivation plots (after harvest), areas of permanent agriculture (after harvest) and the area of villages and hamlets; “grassland/scrubland” (GS)—up to three years old fallow land, grassland and scrubland; “young forest” (YF)—fallow land older than three years and secondary forest; and “mature forest” (MF)—evergreen forests and mixed (evergreen and deciduous) forests. The classification was performed with the support vector machines classifier in eCognition. Based on the training areas (with 160 sample polygons per class), the classifier was trained using normalized feature values and a linear kernel type. We tested the classification accuracy using 50 randomly selected control points for each of the four land cover classes, verified on the pan sharpened satellite image based on the authors’ knowledge from various visits to the study site [37].

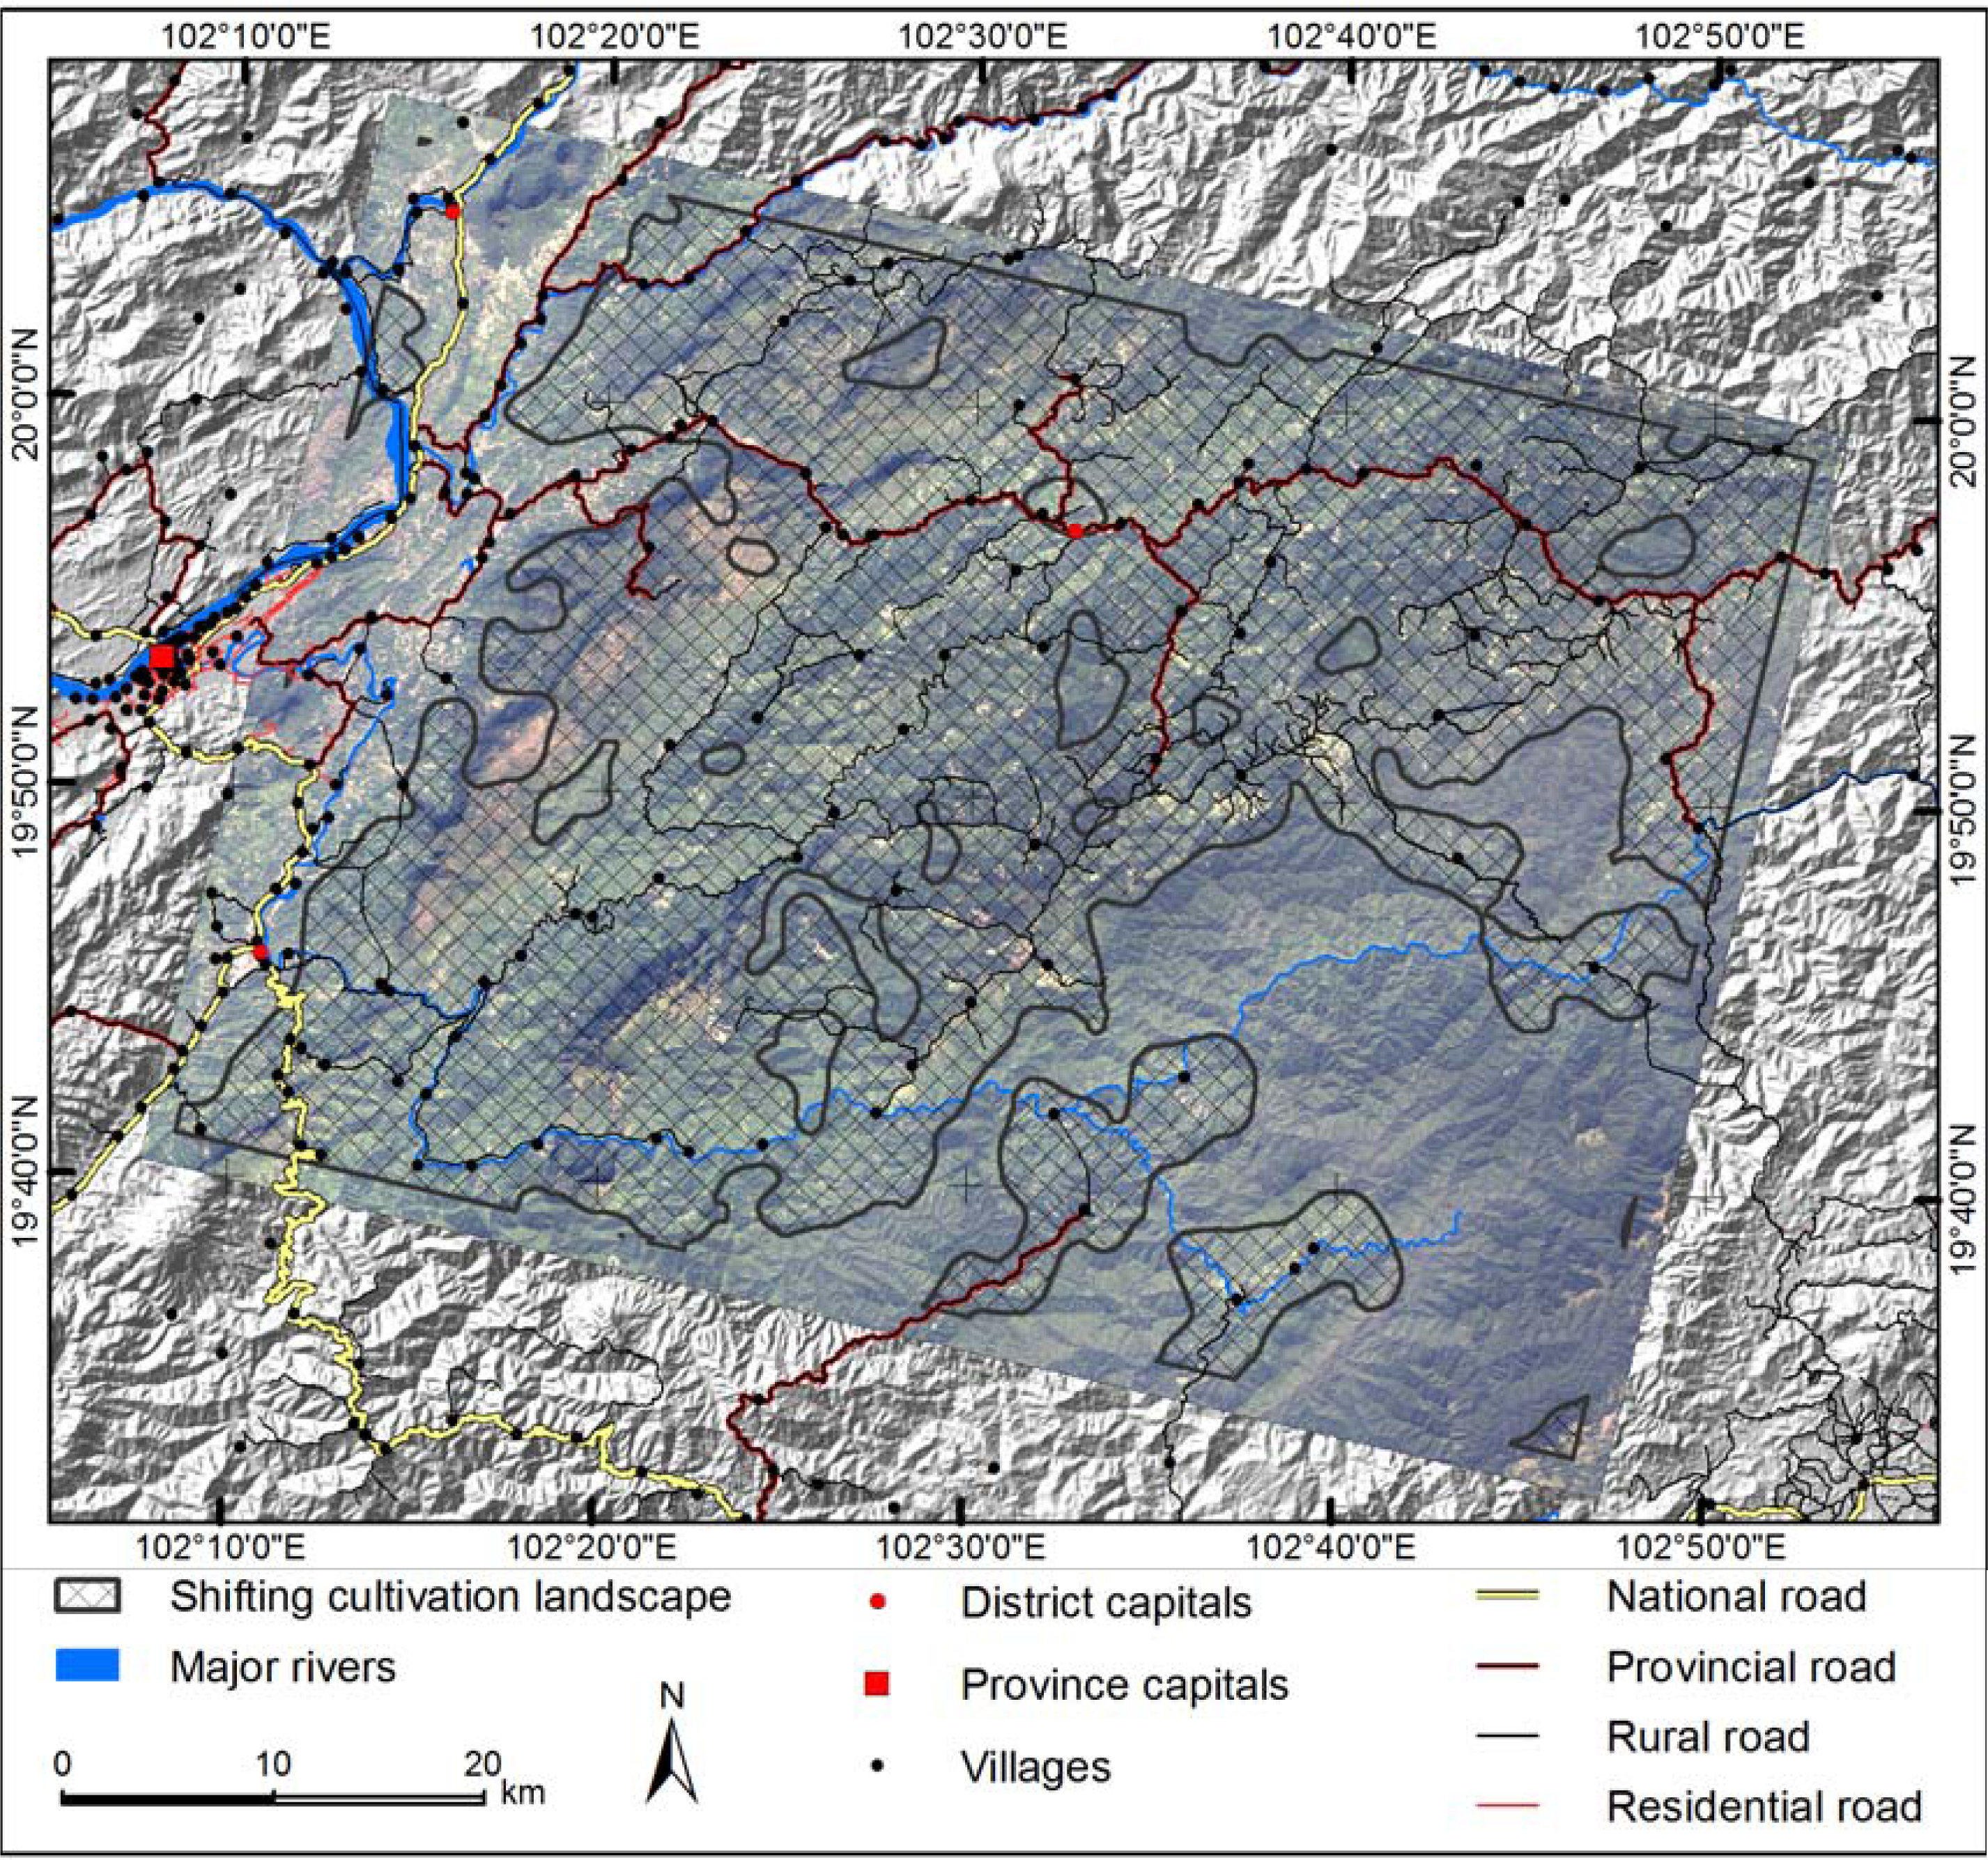
4.2. Delineation of the Shifting Cultivation Landscape

To delineate the landscapes dominated by shifting cultivation, we used different landscape metrics. A determinant of the accuracy of landscape metrics is the dataset they are based on. Shao and Wu [38] present a way to determine the relative degree of reliability of landscape metrics by assessing map quality, error balance and spatial resolution. When using the land cover data from the second classification approach (including the spectral reflectance of the ALOS AVNIR bands, ASTER GDEM data and texture measures), the reliability of the landscape metrics was supposed to lie between acceptable and high:
  • The overall accuracy of the land cover classification was 89% and, thus, according to Shao and Wu [38], acceptable (but close to high, as the threshold is at 90%);
  • The error balance between user and producer accuracy was acceptable, as the difference between the two was not bigger than 15 for all the classes;
  • The reliability of the spatial resolution criterion was high. As we show in the following section, the minimum mapping unit of the landscape metrics exceeded two times the pixel size of the remotely sensed data.
Additionally, the landscape metrics used to detect certain processes or land use practices need to have a close association with the spatio-temporal pattern that the considered process or land use practice produces [7]. A way to separate these landscapes is through an assessment of the land use intensity by calculating Ruthenberg’s [39] R value, indicating the proportion of the area under cultivation in relation to total arable land [39,40]. The calculation of the R value, however, requires information on the land use: the farmed areas, as well as the total arable land need to be known [4,3941]. A land cover classification does not provide this information, so we used three ratios based on the land cover classes as landscape metrics: GS/BA, YF/BA and YF/GS. Each of these three ratios is associated with different aspects of the cultivation/fallow pattern of shifting cultivation. For the calculation of these ratios, we had to find an appropriate extent of the kernel. For their landscape assessment using landscape metrics, Messerli et al. [12] used a kernel size of 5 × 5 km. This kernel was determined by evaluating the average reach of rural farmers and, thus, was considered appropriate for delineating the area of a land use practice. Focusing on land use intensities, the study of Hett et al. [2] used a kernel size of 2 × 2 km. In our study region, sometimes small patches of agriculturally unused mature and/or re-growing forest occur. This smaller kernel size allowed a more accurate delineation of forest patches not used for agriculture. An overview of the approach is provided in Figure 3 (Step 2).
In the classified image, we masked the major rivers and water bodies using auxiliary data. We then calculated the ratios of GS/BA, YF/BA and YF/GS within a 5 × 5 km kernel (Figure 3, Step 2, A1), the percentage of the classes, MF and YF, and the cover of class BA within a 2 × 2 km kernel (Figure 3, Step 2, B1). Subsequently, we had to find thresholds for these landscape metrics that allowed a delineation of the shifting cultivation landscape (Figure 3, Step 2, A2 and B2). We assessed the value range of the three ratios calculated using the 5 × 5 km kernel covered within the area of the sample village cluster. Within these sample villages, where the traditional shifting cultivation with fallow lengths of six to ten years is practiced, the three ratios showed the following value ranges:
  • Ratio GS/BA: 2 to 11
  • Ratio YF/GS: 1 to 12
  • Ratio YF/BA: 3 to 50
Based on the definition of the land cover classes (BA: currently cultivated plots, built up areas; GS: up to three years fallow, grassland, and scrubland; YF: more than three years fallow, secondary forest), we could approximate the minimum fallow length within these villages. Considering the spatial representation of the crop fallow rotation within a traditional shifting cultivation system, for each currently cultivated plot (BA) there should be three plots showing one to three years of fallow (GS) and, depending on the fallow length, one or more plots showing more than three years of fallow (YF). The ratio GS/BA shows that for each currently cultivated plot (BA), there are at least two plots showing one to three years of fallow (GS). This is less than the expected ratio of 3/1, as the class, BA, also includes built up areas and permanent paddy fields. Both occur to some extent in almost every village in Laos, even if their main land use practice is shifting cultivation. The minimum value of the ratio YF/GS indicates that for each plot showing a fallow length of one to three years (GS), there is at least one plot showing a fallow length of more than three years (YF), suggesting a minimum fallow length of six years. The minimum value of the ratio YF/BA indicates a fallow length of around six years, as for each currently cultivated plot (BA), there are three plots showing a fallow length of more than three years (YF). This approximation of the fallow lengths corresponds with information obtained from the village population of the sample village cluster [30].
As described in the introduction, we aimed to delineate only areas under traditional rotational shifting cultivation with fallow periods longer than three years. While the policy-induced rotational agriculture on three fixed plots is also a type of shifting cultivation, it was not of particular interest here. We therefore defined the minimum threshold of the three ratios to fit a fallow length of around five years, while keeping the maximum value of the ratios as defined by the assessment of the sample village cluster. Based on this, the thresholds for the ratios were set as follows:
  • Ratio GS/BA: the minimum threshold was set at 3, and the upper limit of this ratio was set at 11;
  • Ratio YF/GS: the minimum was set at 0.5, and the maximum value was set at 12;
  • Ratio YF/BA: the minimum was set at 2, and the upper limit was set at 50.
Shifting cultivation landscapes with fallow periods of more than three years consist of the currently cultivated plots and plots at different stages of fallow vegetation, represented by the three land cover classes BA, GS, and YF. Each ratio, however, is based on only two of the three land cover classes, thus even after the definition of thresholds, the individual ratios did not allow for a final delineation of the shifting cultivation landscapes. For example, the ratio YF/GS could include areas where no currently cultivated plots occurred.
We overcame this problem by combining the landscape metrics. First, we delineated the shifting cultivation landscape using the metrics calculated in the 5 × 5 km window: an area was only considered to be a shifting cultivation landscape if at least two of the three ratios showed values within the defined range (Figure 3, Step 2, A3). Through this combination, the delineation of shifting cultivation landscapes was always based on the three land cover classes BA, GS, and YF. Second, we identified patches of agriculturally unused mature forest or secondary forest following the approach of Hett et al. [2]. Using the landscape metrics from the 2 × 2 km kernel analysis, areas with a share of more than 80% of the classes YF and MF together and less than 1% of the class BA were not considered as being used for shifting cultivation at the moment (Figure 3, Step 2, B2 and B3). Subsequently, we excluded the agriculturally unused forest patches from the delineated shifting cultivation landscape (Figure 3, Step 2, C).
Finally, to remove single pixels and artefacts stemming from the definition of thresholds and the combination of the landscape metrics, we smoothed the output using a majority filter, and isolated areas smaller than 2 km2 were removed (Figure 3, Step 2, D).

5. Results

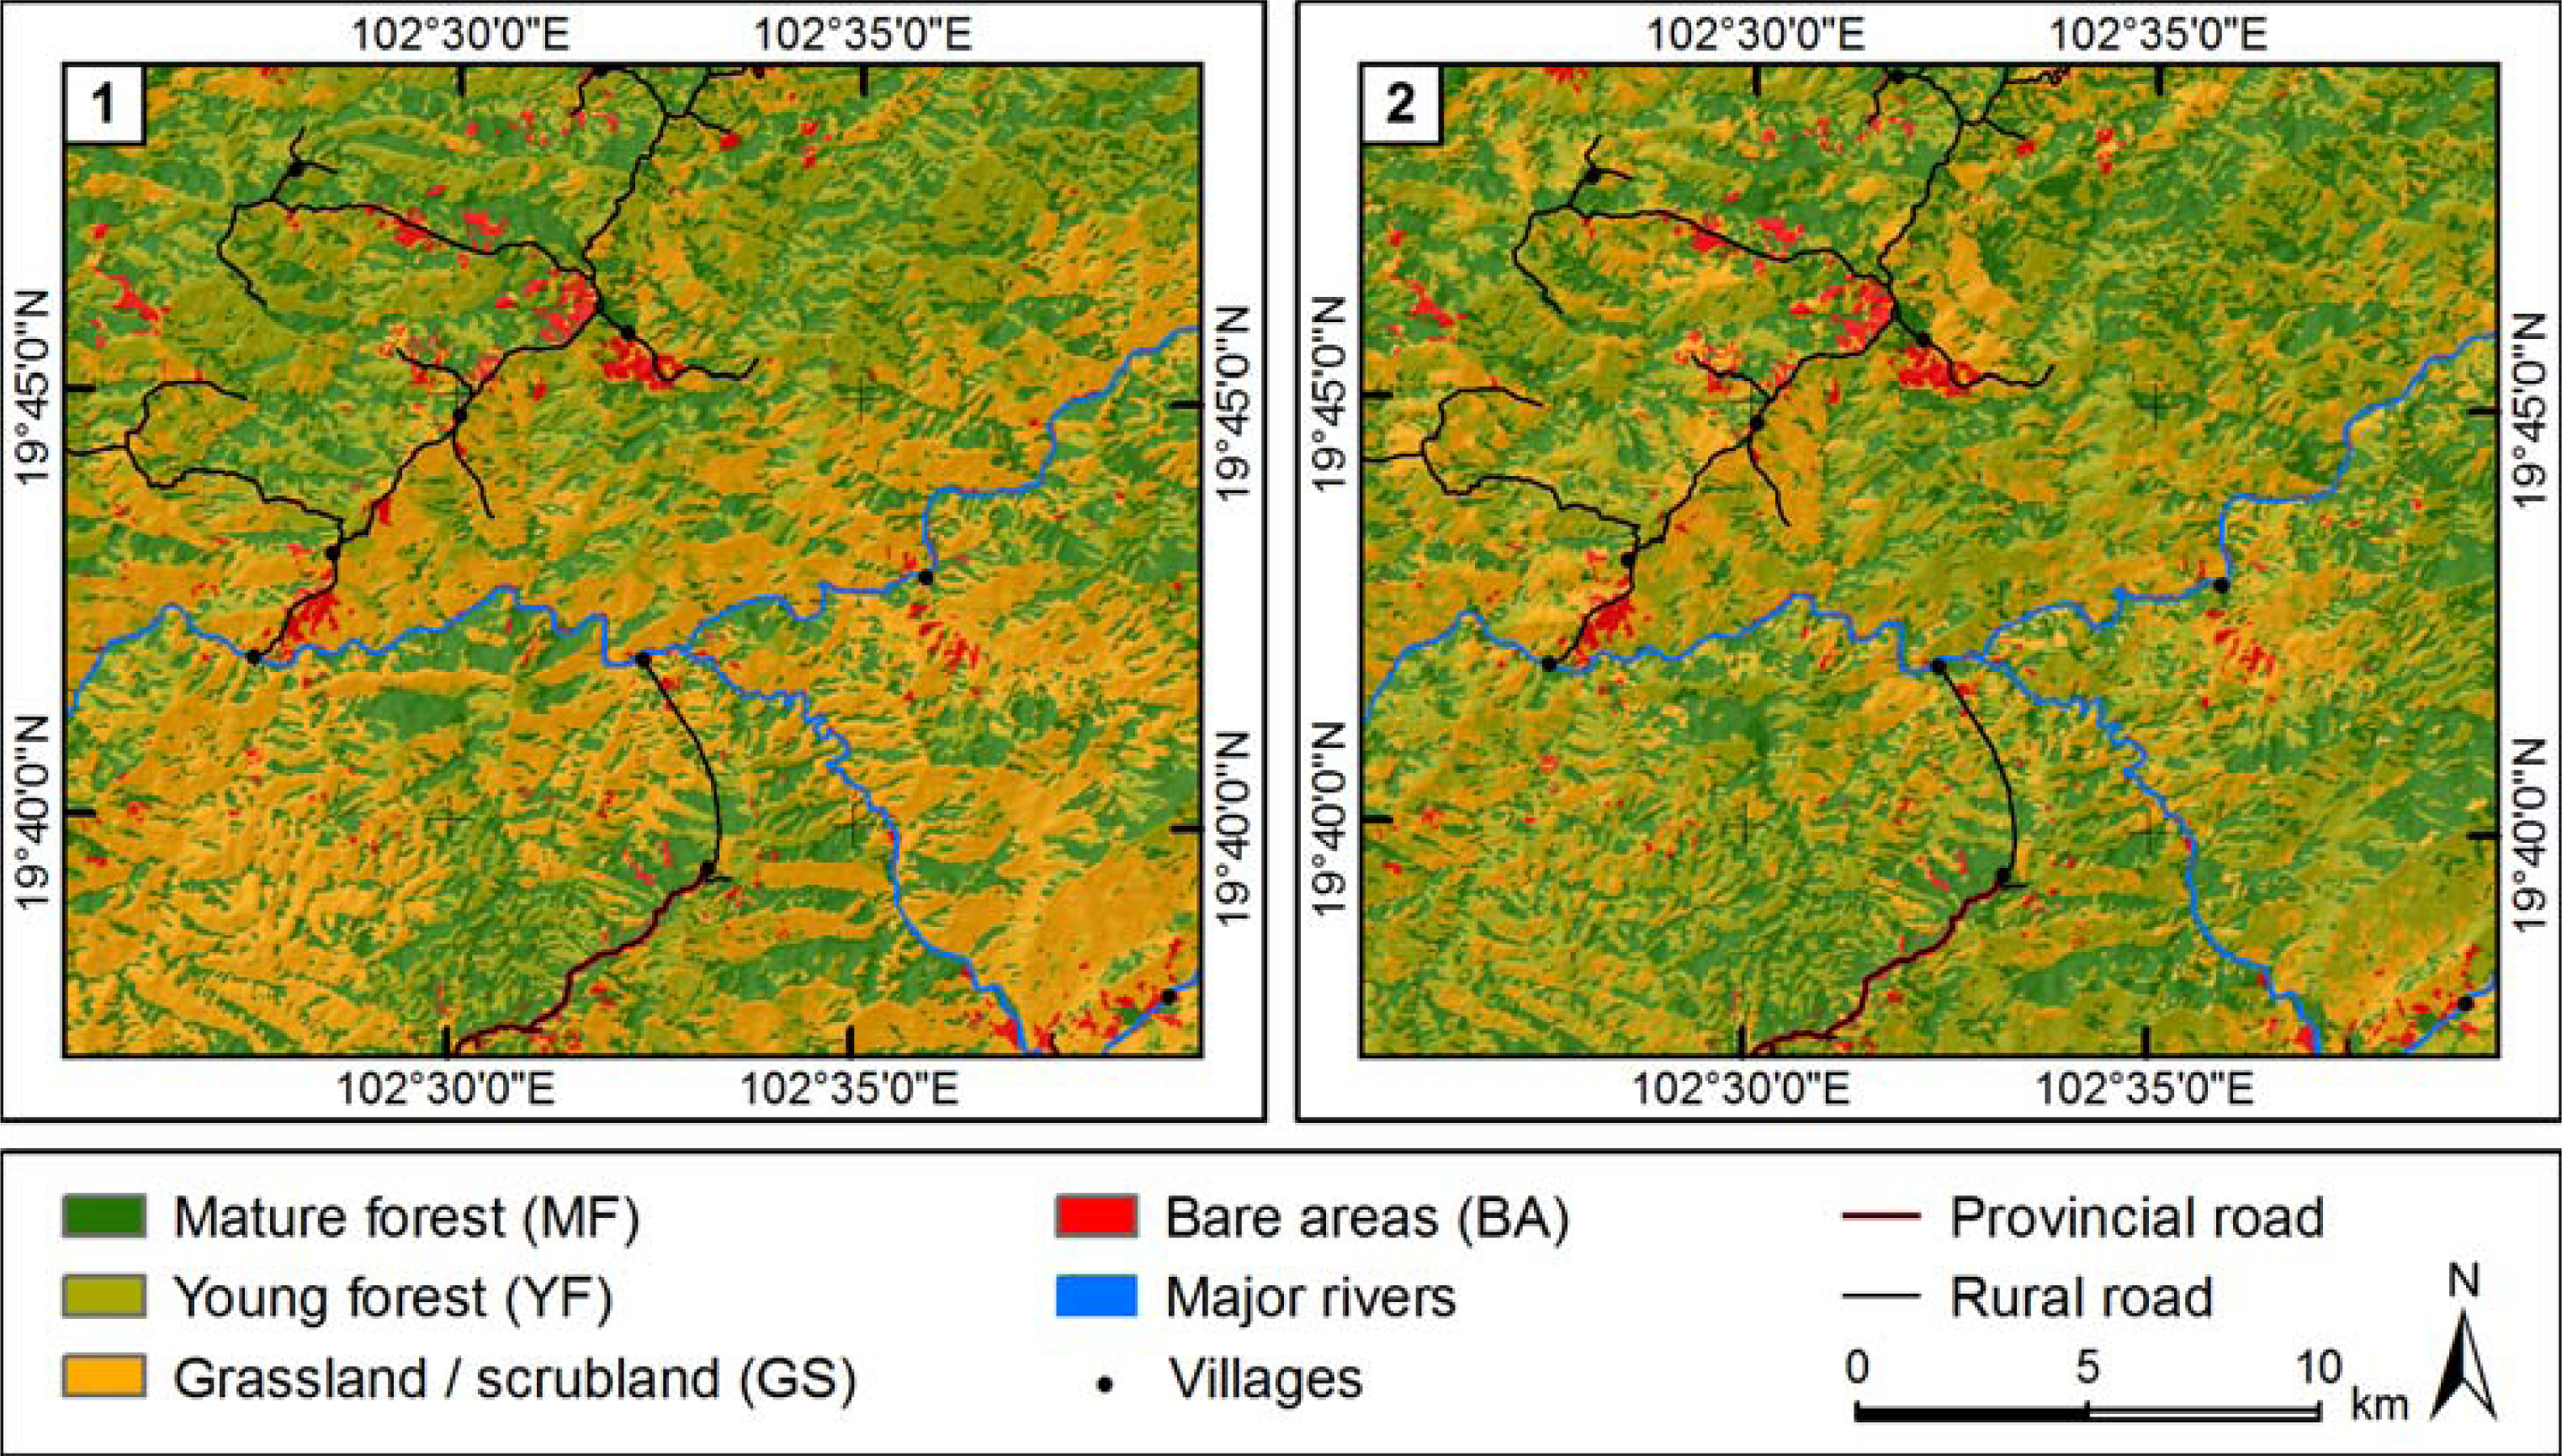
5.1. Image Classification

The two classification approaches (the first being based on the spectral reflectance of the AVNIR image and topographic data and the second using the spectral reflectance, topographic data and texture measures) resulted in different representations of land cover. Table 1 shows the percentage of each land cover class within the study area according to the two classification approaches.
These contrasting results of the two classification approaches reflect how the inclusion of texture measures can affect an object-oriented classification in mountainous regions. The classes BA and MF both show only a small difference between the two classifications. While the first classification approach shows a slightly higher share of the class BA, in the second classification, a larger area is covered by the class MF. More substantial differences can be seen between the classification approaches in classes GS and YF. In the first classification, the class, GS, covers almost 40% of the study area, while the class, YF, shows a share of only 20%. In the second classification approach, the situation is almost reversed. YF covers 34% of the study area, while GS only covers 25%. Including or excluding texture measures in the classification thus leads to very different results when classifying fallow vegetation: the first classification shows a more degraded or a more intensively utilized landscape than the second classification (Figure 4).
The accuracy assessment revealed that the first classification approach overestimated forest degradation. The overall accuracy of the first approach was 66.6%, and the accuracy of the second approach was 88.7%. The confusion matrices are displayed in Tables 2 and 3.
The accuracy assessments confirmed our hypothesis that the inclusion of texture in the image classification improves the classification of land cover in mountainous regions substantially. Comparing levels of accuracy between the first and second classification approaches showed that the inclusion of texture increased the classification accuracy by 22.1%. Our findings suggest that in areas with rugged terrain, a better object-oriented classification can be achieved by including GLCM texture measures. However, the inclusion of texture measures affected the accuracy of the individual classes differently: the accuracy of the class, BA, was 1% higher, without the inclusion of texture. Much more substantial differences in accuracy, on the other hand, were observed for the classes, GS, YF, and MF. By including the texture measures, we increased the accuracy of the class, GS (areas with up to three years of fallow, grassland and scrubland), by 10%, the class, YF (areas with more than three years of fallow and secondary forest), by almost 50%, and of the class, MF (mature evergreen and mixed (evergreen and deciduous) forest), by 20%. This increase in accuracy was crucial for the second step of the presented approach, where we used landscape metrics (calculated from the land cover data) to delineate the shifting cultivation landscapes [38].

5.2. Delineation of the Shifting Cultivation Landscape

We have presented an approach that combines a set of landscape metrics to delineate the landscapes where the traditional shifting cultivation prevails by using a single land cover dataset. Such a delineation or assessments of the crop-fallow rotation cycle are typically either based on an analysis of a time series of satellite imagery or information on the land use [2,3,9,11,12].
When using landscape metrics to detect certain processes, the close association between the metrics used and the spatial pattern said processes produce is an important factor [7]. Our analysis revealed that the ratios between the classes “grassland/scrubland” and “bare areas” (GS/BA), “young forest” and “grassland/scrubland” (YF/GS) and “young forest” and “bare areas” (YF/BA) calculated within a 5 × 5 km window can each be associated with certain aspects of the crop-fallow rotation cycle of the shifting cultivation land use practice. However, to delineate shifting cultivation landscapes conclusively, calculating the individual ratios did not suffice: each ratio only included two of the three land cover classes characteristic for a shifting cultivation landscape. Only by combining these three ratios were all three land cover classes included, allowing for the delineation of shifting cultivation landscapes. To increase the accuracy of this delineation, we used a fourth landscape metric calculated in a 2 × 2 km kernel to exclude agriculturally unused forest patches [2]. This combination of landscape metrics that describe the same process could also reduce the issue mentioned by Gustafson [6] that several configurations and processes may result in the same landscape metric values.
Figure 5 shows the delineated shifting cultivation landscape with the natural color pan-sharpened ALOS AVNIR image in the background. The forest areas with little to no land use intensity appear in dark green tones. The delineated areas under traditional shifting cultivation appear light green (fallow plots), interrupted by patches of cultivated plots. The denser the cultivated plots occur in the landscape (the areas with rotational agriculture fixed to three plots and permanent agriculture), the brighter the appearance of the image gets. These brighter areas appear only in the western part of the study region in the vicinity of the province capital, Luang Prabang, and along roads. Moving east from the capital city, most of the area is classified as shifting cultivation landscape. Only small, rather dark green areas are excluded, indicating that these are agriculturally unused forest patches within the shifting cultivation landscape. Further east within the study region, these patches tend to grow bigger, with a large area of agriculturally unused forest in the southeast.
While the proposed methodology performed well in separating agriculturally unused forests, areas with permanent agriculture and rotational agriculture fixed to three plots from the landscapes where the tradition shifting cultivation prevails, excluding areas with imperata grassland, was more problematic. Parts of the grassland in the east of Luang Prabang (see Figure 1) were labelled shifting cultivation landscape. This imperata grassland is a result of land degradation, due to the shifting cultivation land use practice [29]. It has thus been shaped by the shifting cultivation process in the past, and shifting cultivation often occurs in its surroundings. The land cover classes, as well as their spatial configurations within the imperata grassland, are thus very similar to the ones observed in shifting cultivation areas. Depending on the size of the grassland and its surrounding land cover, a proper differentiation from the shifting cultivation landscape using the proposed methodology was not always possible. This could be overcome by performing a more detailed land cover classification (e.g., by including imperata grass as an additional land cover category). Still, the spectral responses of the imperata grassland and some fallow and cultivated plots are similar, potentially reducing the accuracy of the land cover classification and landscape metrics.

6. Discussion

We presented a two-step approach (Figure 3) that allowed the delineation of shifting cultivation landscapes by using landscape metrics that are based on a land cover dataset depicting four broad land cover classes for a single time period. Two methodological challenges were related to this approach: the first concerned the classification of different fallow and forest classes in mountainous regions (Figure 3, Step 1). We tested two object-oriented image classifications: one based on the spectral reflectance of the ALOS AVNIR satellite image and ASTER GDEM topographic data; the second classification approach also included grey level co-occurrence matrix (GLCM) texture measures. Our results showed that by including texture measures, the accuracy of a land cover classification in a mountainous region could be increased by 22.1%. This is also supported by the findings of Lu [24], where in a pixel based classification approach, the inclusion of texture increased the accuracy more in mountainous regions than in flat ones. Prior research findings also suggest that the inclusion of texture does not improve the accuracy of all classes similarly [21,24,42]. Indeed, our results showed that especially the accuracy of the classes related to vegetation with higher biomass could be increased, while the accuracy of the class, BA, showed a slight decrease. This underlines the importance of including texture measures when mapping different forest classes in a mountainous area.
The second methodological challenge of the approach concerned the definition of appropriate landscape metrics to delineate the landscapes where shifting cultivation prevails (Figure 3, Step 2). We showed that landscape metrics calculated in a 5 × 5 km kernel in the form of ratios between two land cover classes (namely, the ratios between the classes “grassland/scrubland” (areas with up to three years of fallow, grassland and scrubland) and “bare areas” (including the currently cultivated plots and built up areas) (GS/BA), between “young forest” (areas with more than three years of fallow and secondary forest) and “grassland/scrubland” (YF/GS) and between “young forest” and “bare areas” (YF/BA)) can be associated with certain aspects of the crop-fallow rotation cycle of the shifting cultivation land use practice. However, as several processes can result in the same landscape metric value, it was not possible to delineate the shifting cultivation landscape using an individual ratio [6]. This could be overcome by combining the three ratios and by excluding the agriculturally unused forest patches using landscape metrics calculated in a 2 × 2 km kernel. This combination of landscape metrics allowed us to delineate the shifting cultivation landscapes without the inclusion of information on the land use or the analysis of a time series of remote sensing images. The example of imperata grassland, however, showed that the delineation of the shifting cultivation landscape using the proposed methodology can be problematic when based on broad land cover classes as, for example, the class, GS, included young fallow plots, as well as the imperata grassland. In this case, problems were limited to parts of the mountain ridge where imperata grassland occurs. This issue would be more problematic, however, in landscapes more heterogeneous in terms of land cover and land use practices.
The accuracy of the delineation of the shifting cultivation landscapes using the presented approach depended on the accuracy of the land cover classification itself and the landscape metrics, which need to show a close association with the processes to be detected [7]. To reduce errors in the outcome, it was, thus, important to define land cover classes that could be mapped accurately. While performing a detailed land cover classification (e.g., mapping of different species) is desirable, it can result in a low accuracy, due to the increased number of classes, the complex distribution of species and spectral intermixing of certain classes [43,44]. By defining broader land cover classes (e.g., including several species or land cover types with similar spectral responses), the accuracy can be increased, as the spectral difference between the classes is higher. However, the definition of broad land cover classes to improve the classification accuracy is also accompanied by a loss of information, as the distribution of specific species or land cover types within each of the broad classes is unknown. Despite the high accuracy, such a classification is, thus, not necessarily suitable for the detection of certain processes using landscape metrics: if some broad land cover classes include land cover types or species that are not a result of the process to be detected, the outcome of the landscape metrics can be erroneous, despite being based on an accurate classification. In such a situation, the relation between the landscape metrics and the processes to be detected is ambiguous. The definition of the land cover classes, thus, needs to be an optimization procedure, where land cover types or species are grouped into broad land cover classes that can be mapped accurately, while unambiguously depicting the land cover types produced by the process considered. However, the definition of an optimal set of land cover classes that fulfil both of these requirements may not always be possible. In the presented classification, the class, GS, included the plots with one to three years of fallow, as well as the agriculturally unused degraded areas with imperata grass. While such uncertainties in the classification led to some errors in the delineation of the shifting cultivation landscape, the problem was limited to the mountain ridge where imperata grassland occurs and could additionally be reduced by combining a set of landscape metrics that were based on different land cover classes. Combining different landscape metrics could, thus, not only improve the outcome, as different processes can result in the same landscape metric value, but also help to reduce errors in the delineation of shifting cultivation landscapes, due to uncertainties in the land cover classification [6].

7. Conclusions

Using remote sensing for the delineation of the area where shifting cultivation occurs is challenging, due to the rotational nature of the shifting cultivation land use practice. In the presented study, we demonstrated a new approach that allowed us to delineate shifting cultivation landscapes by calculating landscape metrics that were based on a single land cover dataset. For a delineation of such landscapes, two requirements need to be fulfilled. First, the classification approach needs to accurately map the land cover classes that are related to the shifting cultivation land use practice. We performed an object-oriented classification approach, and our results showed that the classification accuracy can be increased by 22.1% in a mountainous study region when including texture measures. This increase in the overall accuracy was mainly related to the increase in accuracy of the classes representing vegetation with higher biomass. The classes, “grassland/scrubland”, “young forest” and “mature forest”, showed an increase in accuracy of 10%, almost 50% and 20%, while the class, “bare areas” (including cultivated plots, as the image was acquired after harvest), showed a decrease of 1%. Furthermore, the distribution of the classes was different between the two classification approaches. Without texture measures, the class, “bare areas”, covered 7.9% of the study region, “grassland/scrubland”, 39.7%, “young forest”, 20.2%, and “mature forest”, 32.2%, while with texture measures, the shares of the classes were 6.7%, 24.9%, 34.6% and 33.8% respectively. In a mountainous region, the classification without texture measures thus overestimated the degradation of the landscape. We did not, however, assess the influence of the different texture measures on the classification accuracy. The study by Kim et al. [23] showed that the inclusion of different combinations of grey level co-occurrence matrix texture measures in an object-oriented classification can affect the classification accuracy. Further studies are required to assess the effect of different combinations of texture measures on classification accuracy in mountainous regions.
Second, the landscape metrics for the delineation of the shifting cultivation landscapes need to show a close relation to the pattern the considered process produces. As landscape metrics, we used ratios between land cover classes, as they showed an association with the cultivation/fallow pattern of shifting cultivation. However, several processes can result in the same metric value, especially when basing the landscape metrics on a rather broad definition of land cover classes [6]. The detection of a specific process can, thus, be difficult when using a single landscape metric. We found that combining a set of landscape metrics that are related to the shifting cultivation land use practice, but are based on different combinations of the land cover classes, could reduce this issue. A more detailed classification of the land cover could additionally improve the delineation of the shifting cultivation landscapes. Due to intermixing of the spectral characteristics of the classes, a piecemeal classification approach could be appropriate. The research of Thenkabail [44] showed that the classification accuracy can be increased by dividing the study area into subsets and by masking problem classes and reclassifying them. It would be interesting to see how the trade-off between the increased detail of the land cover classification and the resulting classification accuracy affects the delineation of the areas under shifting cultivation using landscape metrics.
The presented approach has the potential to assess the dynamics of the shifting cultivation landscapes when performed for two or more points in time. It is a cost-effective alternative to the analysis of a time series of satellite images, while being less dependent on having a dense time series of cloud-free images. The use of only one satellite image also reduces the available information and components, such as the crop-fallow cycles of individual plots, which cannot be assessed. Such information is important for a good understanding of the sustainability of shifting cultivation land use systems, as their extent and dynamics are only two of the aspects of the change these landscapes undergo. In Laos, shifting cultivation is influenced by various factors, which lead to its demise or change [45]. On the one hand, national policies aim at reducing the traditional shifting cultivation system, as it is perceived by policy makers as an underdeveloped form of land use, a poverty trap and as environmentally destructive [46]. On the other hand, economic influences from the surrounding countries are driving a transition of shifting cultivation lands into commercial tree plantations and cash crop production [47,48]. This variety of factors also results in changes within the shifting cultivation landscape, such as changes in the crop-fallow rotation cycle. Further research should, therefore, focus on determining the potential of the presented landscape metrics to assess areas of different crop-fallow rotation cycles and their dynamics in more detail.

Acknowledgments

This work was supported by the Swiss National Centre of Competence in Research (NCCR) North-South, co-funded by the Swiss National Science Foundation (SNF) and the Swiss Agency for Development and Cooperation (SDC). Additionally, this research is part of a project titled, “Impacts of Reducing Emissions from Deforestation and Forest Degradation and Enhancing Carbon Stocks”, which is funded by the European Community’s Seventh Framework Research Programme. More information can be found on the project’s website: http://www.i-redd.eu. Furthermore, this research has benefited from collaborations with the Agrobiodiversity Initiative in Lao PDR (TABI), a project funded by SDC and the exchange within the Global Land Project (GLP)

Conflict of Interest

The authors declare no conflict of interest.

References

  1. De Rouw, A.; Soulilad, B.; Phanthavong, K.; Dupin, B. The Adaptation of Upland Rice Cropping to Ever-shorter Fallow Periods and Its Limit. In Poverty Reduction and Shifting Cultivation Stabilisation in the Uplands of Lao PDR; Bouahom, B., Glendinning, A., Nilsson, S., Victor, M., Eds.; NAFRI: Vientiane, Lao PDR, 2005; pp. 139–148. [Google Scholar]
  2. Hett, C.; Castella, J.C.; Heinimann, A.; Messerli, P.; Pfund, J.L. A landscape mosaics approach for characterizing swidden systems from a REDD plus perspective. Appl. Geogr 2012, 32, 608–618. [Google Scholar]
  3. Inoue, Y.; Kiyono, Y.; Asai, H.; Ochiai, Y.; Qi, J.; Olioso, A.; Shiraiwa, T.; Horie, T.; Saito, K.; Dounagsavanh, L. Assessing land-use and carbon stock in slash-and-burn ecosystems in tropical mountain of Laos based on time-series satellite images. Int. J. Appl. Earth Obs. Geoinf 2010, 12, 287–297. [Google Scholar]
  4. Mertz, O.; Padoch, C.; Fox, J.; Cramb, R.; Leisz, S.; Lam, N.; Vien, T. Swidden change in southeast Asia: Understanding causes and consequences. Hum. Ecol 2009, 37, 259–264. [Google Scholar]
  5. Dorren, L.K.A.; Maier, B.; Seijmonsbergen, A.C. Improved Landsat-based forest mapping in steep mountainous terrain using object-based classification. For. Ecol. Manag 2003, 183, 31–46. [Google Scholar]
  6. Gustafson, E.J. Quantifying landscape spatial pattern: What is the state of the art? Ecosystems 1998, 1, 143–156. [Google Scholar]
  7. Li, H.; Wu, J. Use and misuse of landscape indices. Landsc. Ecol 2004, 19, 389–399. [Google Scholar]
  8. Heinimann, A. Patterns of Land Cover Change in the Lower Mekong Basin: The Relevance of Mesoscale Approaches, Ph.D. Dissertation, University of Bern, Bern, Switzerland. 2006.
  9. Hurni, K.; Hett, C.; Heinimann, A.; Messerli, P.; Wiesmann, U. Dynamics of shifting cultivation landscapes in Northern Lao PDR between 2000 and 2009 based on an analysis of MODIS time series and landsat images. Hum. Ecol 2013, 41, 21–36. [Google Scholar]
  10. Inoue, Y.; Qi, J.; Olioso, A.; Kiyono, Y.; Horie, T.; Asai, H.; Saito, K.; Ochiai, Y.; Shiraiwa, T.; Douangsavanh, L. Traceability of slash-and-burn land-use history using optical satellite sensor imagery: A basis for chronosequential assessment of ecosystem carbon stock in Laos. Int. J. Remote Sens 2007, 28, 5641–5647. [Google Scholar]
  11. Yamamoto, Y.; Oberthür, T.; Lefroy, R. Spatial identification by satellite imagery of the crop–fallow rotation cycle in northern Laos. Environ. Dev. Sustain 2009, 11, 639–654. [Google Scholar]
  12. Messerli, P.; Heinimann, A.; Epprecht, M. Finding homogeneity in heterogeneity—A new approach to quantifying landscape mosaics developed for the Lao PDR. Hum. Ecol 2009, 37, 291–304. [Google Scholar]
  13. Cihlar, J.; Jansen, L.J.M. From land cover to land use: A methodology for efficient land use mapping over large areas. Prof. Geogr 2001, 53, 275–289. [Google Scholar]
  14. Martínez, S.; Mollicone, D. From land cover to land use: A methodology to assess land use from remote sensing data. Remote Sens 2012, 4, 1024–1045. [Google Scholar]
  15. Fensham, R.J.; Fairfax, R.J. Effect of photoscale, interpreter bias and land type on woody crown-cover estimates from aerial photography. Austr. J. Bot 2007, 55, 457–463. [Google Scholar]
  16. McGwire, K.C. Analyst variability in labeling of unsupervised classifications. Photogramm. Eng. Remote Sensing 1992, 58, 5. [Google Scholar]
  17. Asner, G.P.; Warner, A.S. Canopy shadow in IKONOS satellite observations of tropical forests and savannas. Remote Sens. Environ 2003, 87, 521–533. [Google Scholar]
  18. GOFC-GOLD, A Sourcebook of Methods and Procedures for Monitoring and Reporting Anthropogenic Geenhouse Gas Emissions and Removals Caused by Deforestation, Gains and Losses of Carbon Stocks in Forests Remaining Forests and Forestation; GOFC-GOLD Report Version COP17-1; GOFC-GOLD Project Office, Natural Resources Canda: Edmonton, AB, Canada, 2011; p. 203.
  19. Helmer, E.H.; Brown, S.; Cohen, W.B. Mapping montane tropical forest successional stage and land use with multi-date Landsat imagery. Int. J. Remote Sens 2000, 21, 2163–2183. [Google Scholar]
  20. Franklin, S.E.; Hall, R.J.; Moskal, L.M.; Maudie, A.J.; Lavigne, M.B. Incorporating texture into classification of forest species composition from airborne multispectral images. Int. J. Remote Sens 2000, 21, 61–79. [Google Scholar]
  21. Eckert, S. Improved forest biomass and carbon estimations using texture measures from WorldView-2 Satellite data. Remote Sens 2012, 4, 810–829. [Google Scholar]
  22. Fuchs, H.; Magdon, P.; Kleinn, C.; Flessa, H. Estimating aboveground carbon in a catchment of the Siberian forest tundra: Combining satellite imagery and field inventory. Remote Sens. Environ 2009, 113, 518–531. [Google Scholar]
  23. Kim, M.; Madden, M.; Warner, T.A. Forest type mapping using object-specific texture measures from multispectral ikonos imagery: Segmentation quality and image classification issues. Photogramm. Eng. Remote Sens 2009, 75, 819–829. [Google Scholar]
  24. Lu, D. Aboveground biomass estimation using Landsat TM data in the Brazilian Amazon. Int. J. Remote Sens 2005, 26, 2509–2525. [Google Scholar]
  25. Sarker, L.R.; Nichol, J.E. Improved forest biomass estimates using ALOS AVNIR-2 texture indices. Remote Sens. Environ 2011, 115, 968–977. [Google Scholar]
  26. Messerli, P.; Heinimann, A.; Epprecht, M.; Phonesaly, S.; Thiraka, C.; Minot, N. Socio-Economic Atlas of the Lao PDR—An Analysis Based on the 2005 Population and Housing Census; Geographica Bernensia: Bern, Switzerland and Vientiane, Lao PDR, 2008; p. 139. [Google Scholar]
  27. Fujita, Y.; Phanvilay, K. Land and forest allocation in Lao People’s Democratic Republic: Comparison of case studies from community-based natural resource management research. Soc. Nat. Resour 2008, 21, 120–133. [Google Scholar]
  28. Saito, K.; Linquist, B.; Keobualapha, B.; Shiraiwa, T.; Horie, T. Farmers’ knowledge of soils in relation to cropping practices: A case study of farmers in upland rice based slash-and-burn systems of northern Laos. Geoderma 2006, 136, 64–74. [Google Scholar]
  29. Fujisaka, S. A diagnostic survey of shifting cultivation in northern Laos: Targeting research to improve sustainability and productivity. Agrofor. Syst 1991, 13, 95–109. [Google Scholar]
  30. TABI The Agrobiodiversity Initiative in the Lao PDR. Available online: http://www.tabi.la/en/maps/phonexay-village-level-maps.html (accessed on 7 November 2012).
  31. Nichol, J.; Hang, L.K. The influence of DEM accuracy, on topographic correction of Ikonos satellite images. Photogramm. Eng. Remote Sensing 2008, 74, 47–53. [Google Scholar]
  32. Bahadur, K.C.; K. Improving landsat and IRS image classification: Evaluation of unsupervised and supervised classification through band ratios and DEM in a mountainous landscape in Nepal. Remote Sens 2009, 1, 1257–1272. [Google Scholar]
  33. Trimble Documentation. In eCogntion Developer 8.7 User Guide; Trimble Germany GMBH: München, Germany, 2011; p. 250.
  34. Kindu, M.; Schneider, T.; Teketay, D.; Knoke, T. Land use/land cover change analysis using object-based classification approach in Munessa-Shashemene Landscape of the Ethiopian Highlands. Remote Sensing 2013, 5, 2411–2435. [Google Scholar]
  35. Kim, M.; Madden, M.; Warner, T. Estimation of Optimal Image Object Size for the Segmentation of Forest Stands with Multispectral IKONOS Imagery. In Object-Based Image Analysis; Blaschke, T., Lang, S., Hay, G.J., Eds.; Springer: Berlin, Heidelberg, Germany, 2008; pp. 291–307. [Google Scholar]
  36. Haralick, R.M.; Shanmugam, K.; Dinstein, I.H. Textural features for image classification. IEEE Trans. Syst. Man Cybern 1973, 3, 610–621. [Google Scholar]
  37. Robichaud, W.G.; Sinclair, A.R.E.; Odarkor-Lanquaye, N.; Klinkenberg, B. Stable forest cover under increasing populations of swidden cultivators in central Laos: The roles of intrinsic culture and extrinsic wildlife trade. Ecol. Soc 2009, 14, 33. [Google Scholar]
  38. Shao, G.; Wu, J. On the accuracy of landscape pattern analysis using remote sensing data. Landsc. Ecol 2008, 23, 505–511. [Google Scholar]
  39. Ruthenberg, H. Farming Systems in the Tropics; Clarendon Press: Oxford, UK, 1971; p. 313. [Google Scholar]
  40. Raufu, M.O. Pattern of land use among selected crop farmers in Osun State. Res. J. Soil Water Manag 2010, 1, 4. [Google Scholar]
  41. Nair, P.K.R. An Introduction to Agroforestry; Kluwer Academic Publishers: Dordrecht, The Netherlands, 1993; p. 499. [Google Scholar]
  42. Yu, Q.; Gong, P.; Clinton, N.; Biging, G.; Kelly, M.; Schirokauer, D. Object-based detailed vegetation classification. with airborne high spatial resolution remote sensing imagery. Photogramm. Eng. Remote Sensing 2006, 72, 799–811. [Google Scholar]
  43. Pan, X.-Z.; Uchida, S.; Liang, Y.; Hirano, A.; Sun, B. Discriminating different landuse types by using multitemporal NDXI in a rice planting area. Int. J. Remote Sens 2010, 31, 585–596. [Google Scholar]
  44. Thenkabail, P.S. Characterization of the alternative to slash-and-burn benchmark research area representing the Congolese rainforests of Africa using near-real-time SPOT HRV data. Int. J. Remote Sens 1999, 20, 839–877. [Google Scholar]
  45. Schmidt-Vogt, D.; Leisz, S.; Mertz, O.; Heinimann, A.; Thiha, T.; Messerli, P.; Epprecht, M.; Cu, P.; Chi, V.; Hardiono, M.; et al. An assessment of trends in the extent of Swidden in Southeast Asia. Hum. Ecol 2009, 37, 269–280. [Google Scholar]
  46. Heinimann, A.; Hett, C.; Hurni, K.; Messerli, P.; Epprecht, M.; Jørgensen, L.; Breu, T. Socio-economic perspectives on shifting cultivation landscapes in Northern Laos. Hum. Ecol 2013, 41, 51–62. [Google Scholar]
  47. Padoch, C.; Coffey, K.; Mertz, O.; Leisz, S.J.; Fox, J.; Wadley, R.L. The demise of Swidden in Southeast Asia? Local realities and regional ambiguities. Dan. J. Geogr 2007, 107, 29–41. [Google Scholar]
  48. Seidenberg, C.; Mertz, O.; Kias, M.B. Fallow, labour and livelihood in shifting cultivation: Implications for deforestation in northern Lao PDR. Geogr. Tidsskr 2003, 103, 10. [Google Scholar]
Figure 1. Overview of the study area. Displayed is the 2002 land use/land cover map obtained from the Ministry of Agriculture and Forestry of the Lao PDR.
Remotesensing 05 03377f1
Figure 2. Participatory assessed land use/land cover data (A) and training areas derived from the land use/land cover data (B).
Remotesensing 05 03377f2
Figure 3. Approach to delineating shifting cultivation landscapes. ALOS, Advanced Land Observing Satellite; AVNIR, Advanced Visible and Near-Infrared Spectrometer; PRISM, Panchromatic Remote-sensing Instrument for Stereo Mapping; DEM, Digital Elevation Model.
Remotesensing 05 03377f3
Figure 4. Comparison of the two classification approaches. On the left side, the first classification approach using ALOS AVNIR spectral reflectance and the Digital Elevation Model is shown and, on the right side, the second classification approach, which also included texture measures.
Remotesensing 05 03377f4
Figure 5. Shifting cultivation in the east of Luang Prabang: comparison of the delineation of the area where shifting cultivation prevails with a pan sharpened ALOS AVNIR image.
Remotesensing 05 03377f5
Table 1. Percentages of the study region under each land cover class: Classification 1 was based on the spectral reflectance and the topographic data, while Classification 2 also included texture measures.
Classification 1Classification 2
BA (bare areas)7.9%6.7%
GS (grassland/scrubland)39.7%24.9%
YF (young forest)20.2%34.6%
MF (mature forest)32.2%33.8%
Table 2. Accuracy assessment of Classification 1 (per cent): image segmentation and classification using ALOS AVNIR and topographic data (overall accuracy: 0.666, Kappa: 0.56).
Reference Class
BAGSYFMF
ClassificationBA95.7010.160.000.00
GS4.3084.8273.2619.74
YF0.005.0226.747.43
MF0.000.000.0072.83
Table 3. Accuracy assessment of Classification 2 (per cent): image segmentation using AVNIR data, classification using AVNIR data, topographic data and grey level co-occurrence matrix (GLCM) texture measures calculated from ALOS PRISM data (overall accuracy: 0.887, Kappa: 0.85).
Reference Class
BAGSYFMF
ClassificationBA94.655.170.000.00
GS5.3594.8324.730.00
YF0.000.0075.276.61
MF0.000.000.0093.39

