Spectrometer for Sky-Scanning Sun-Tracking Atmospheric Research (4STAR): Instrument Technology

Abstract
:1. Introduction
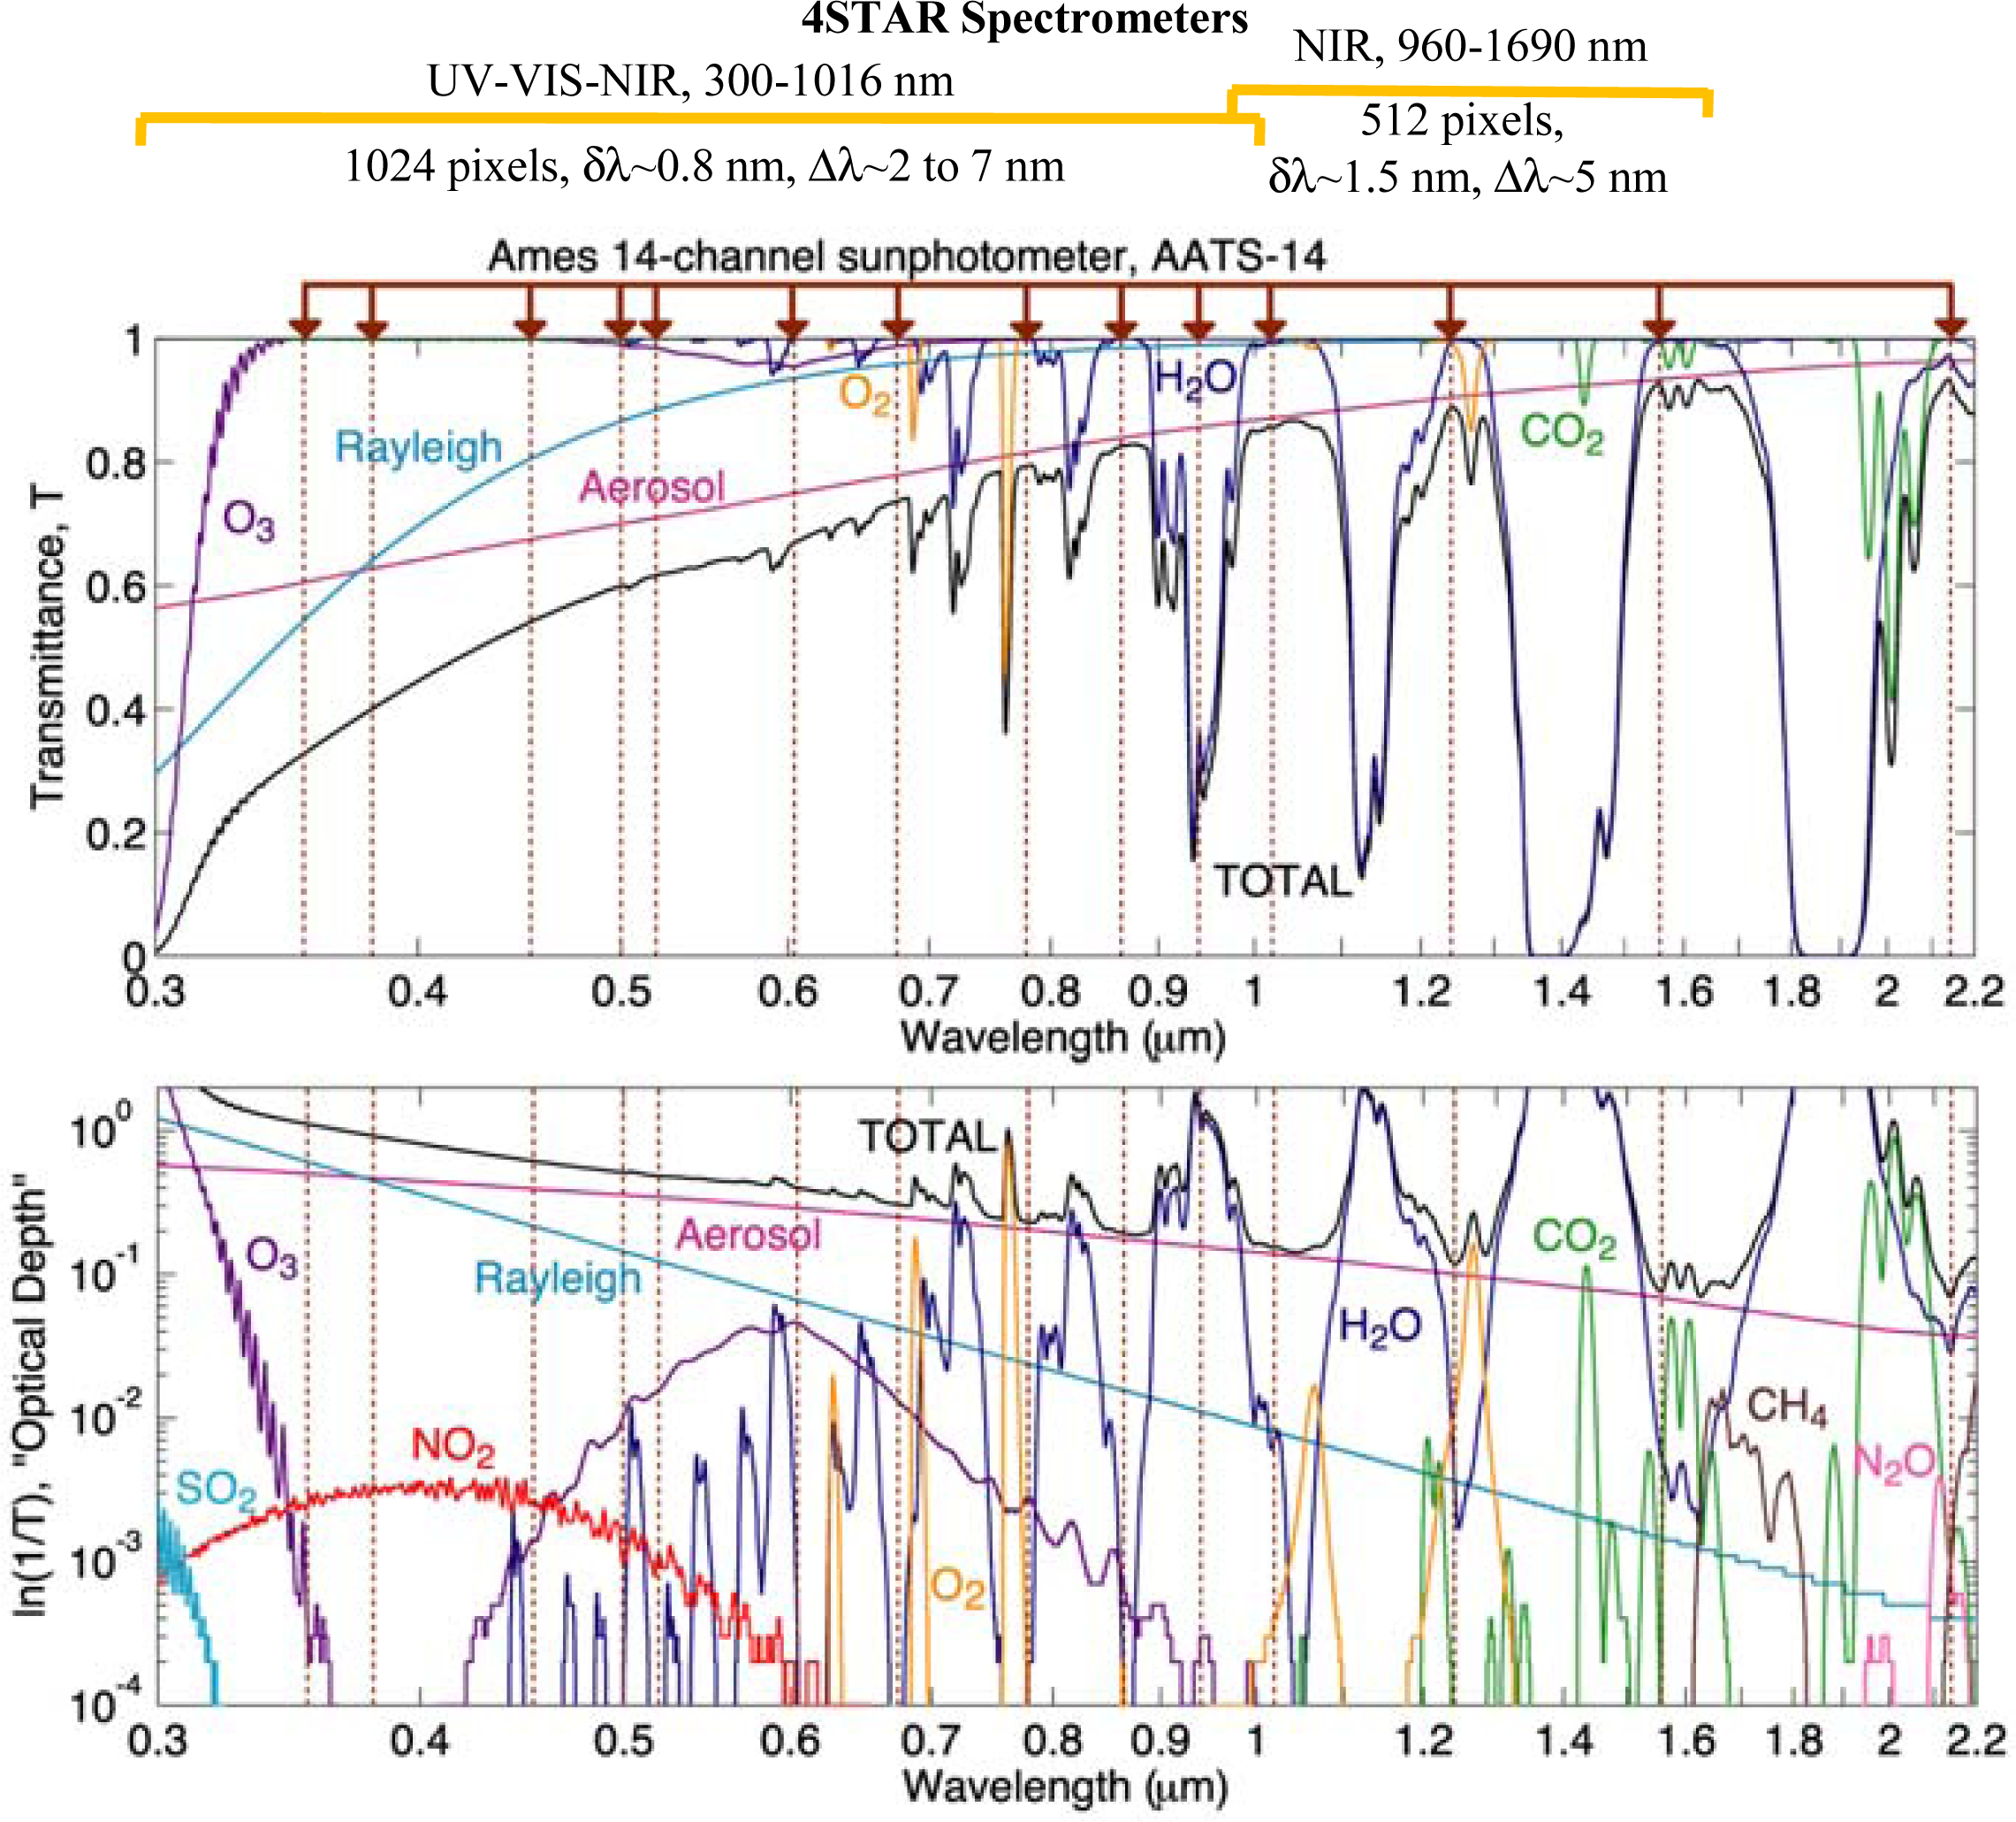
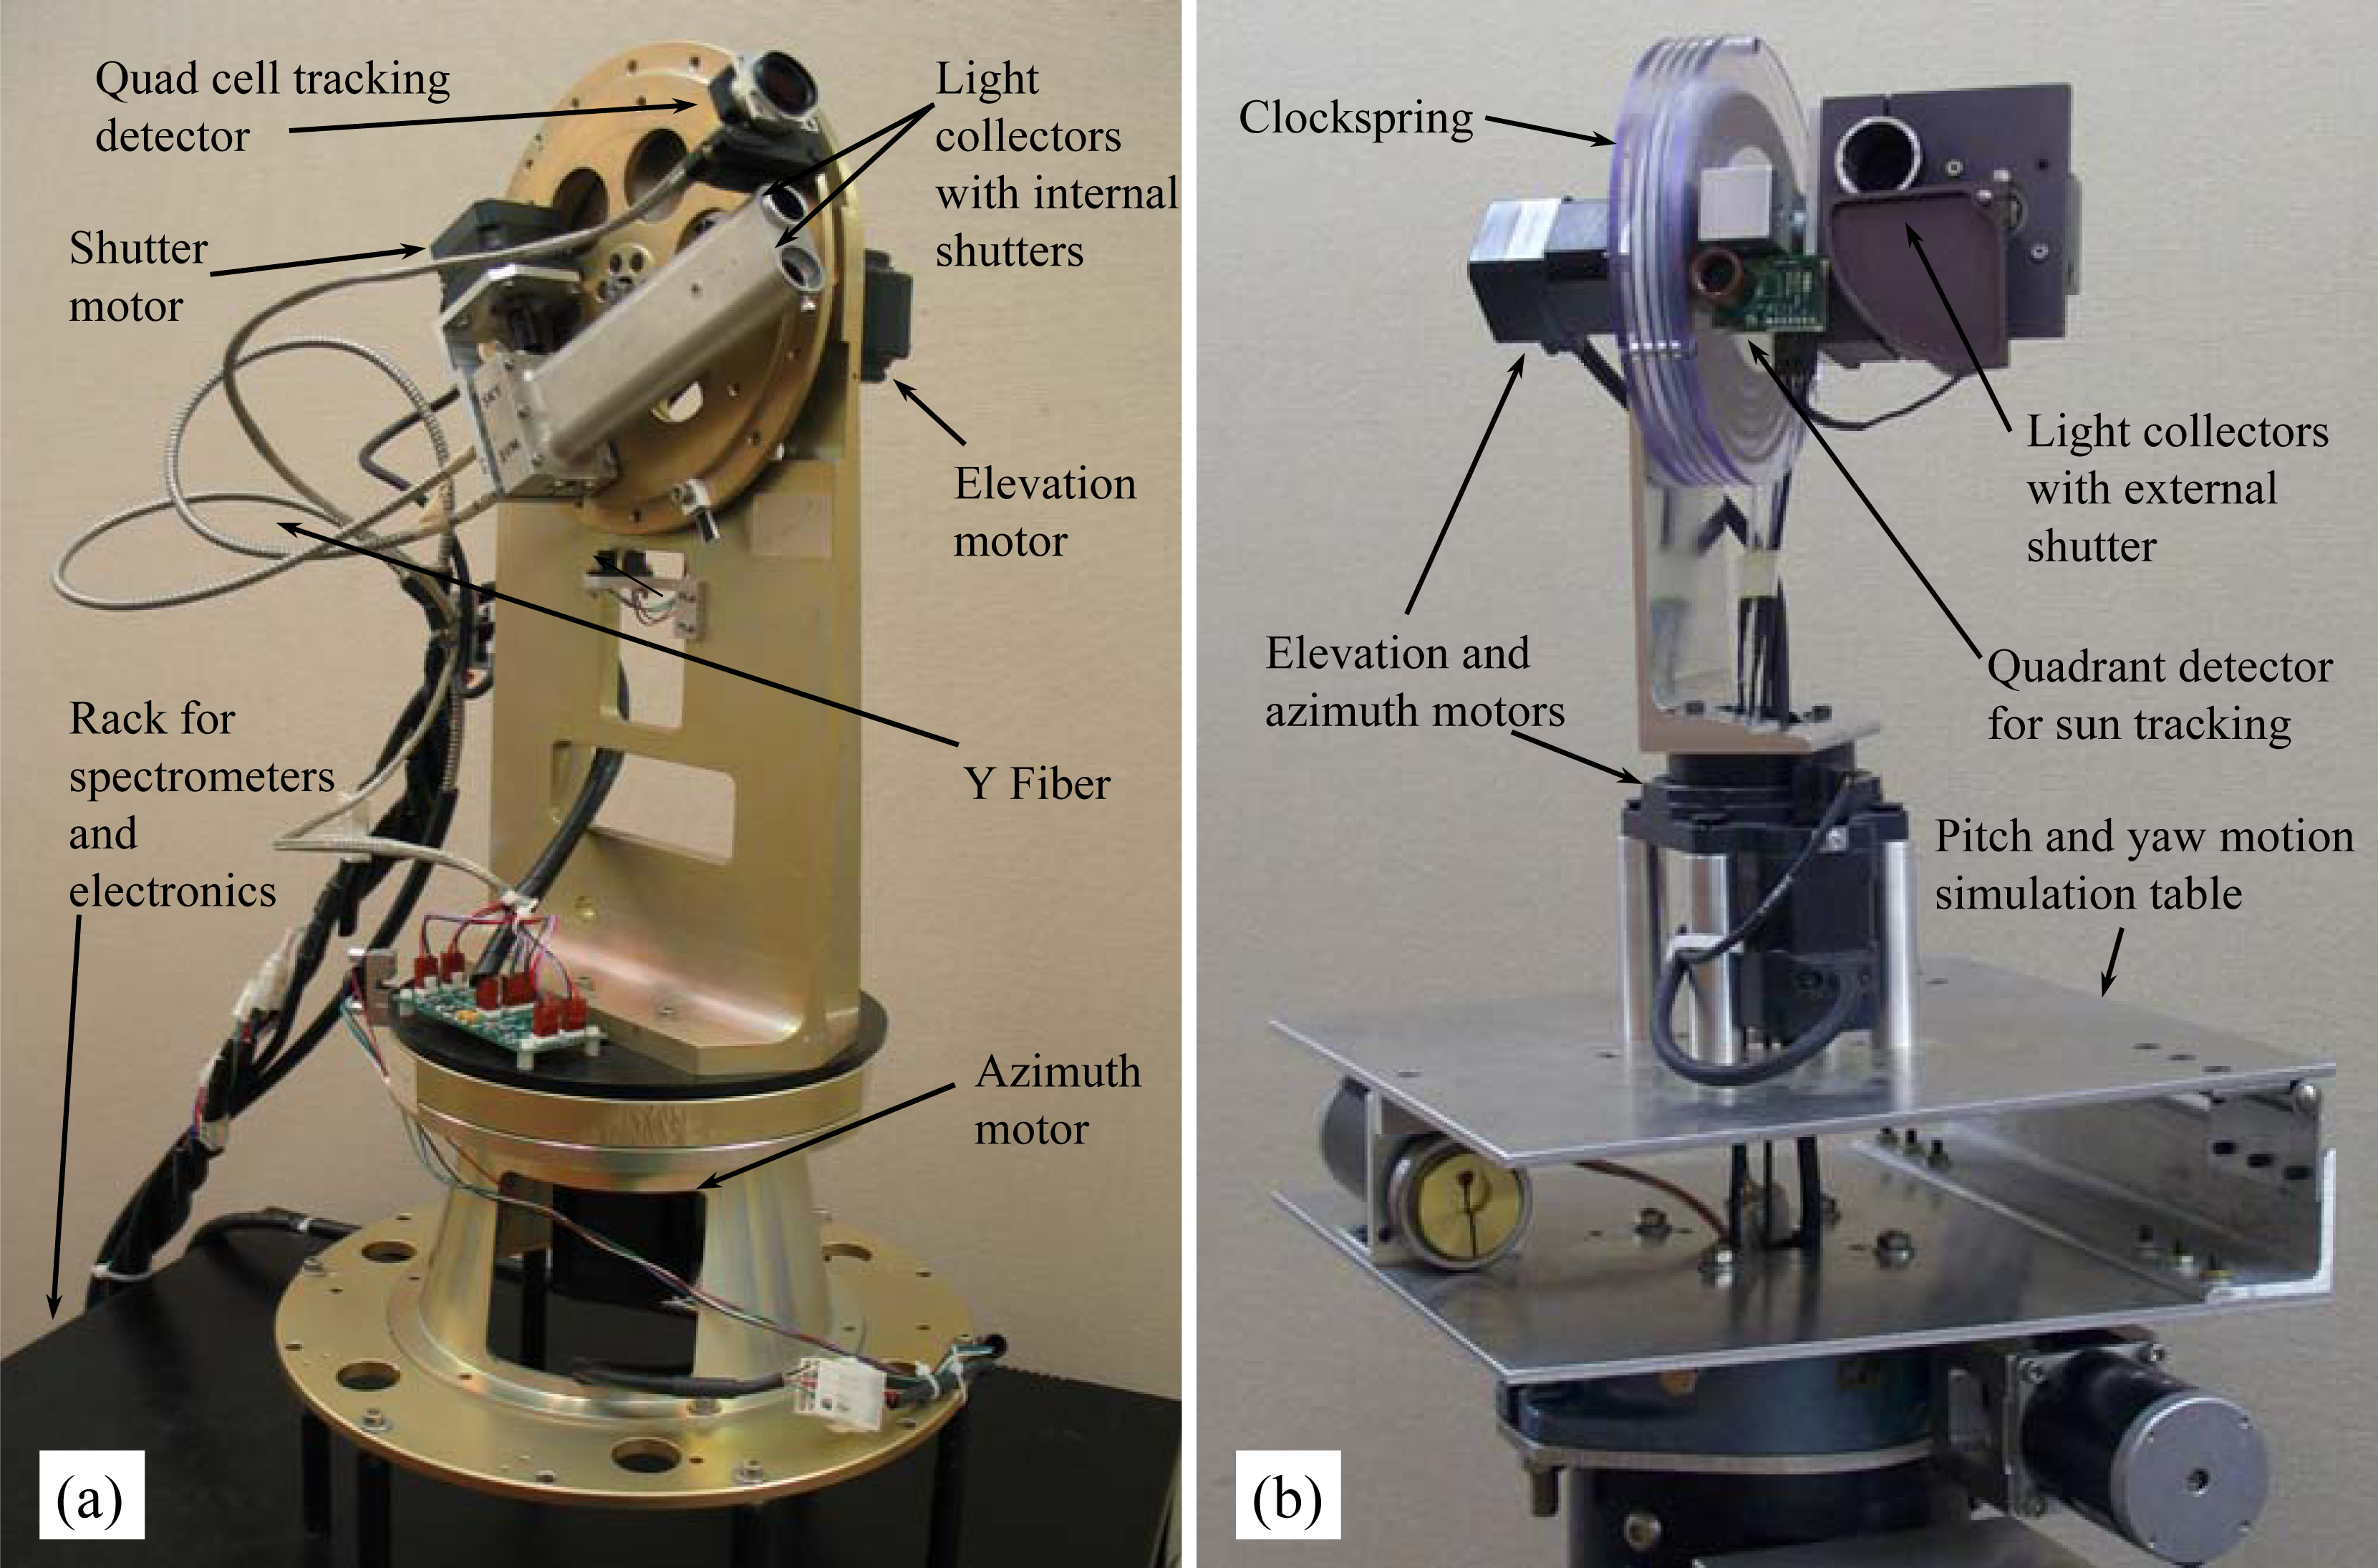
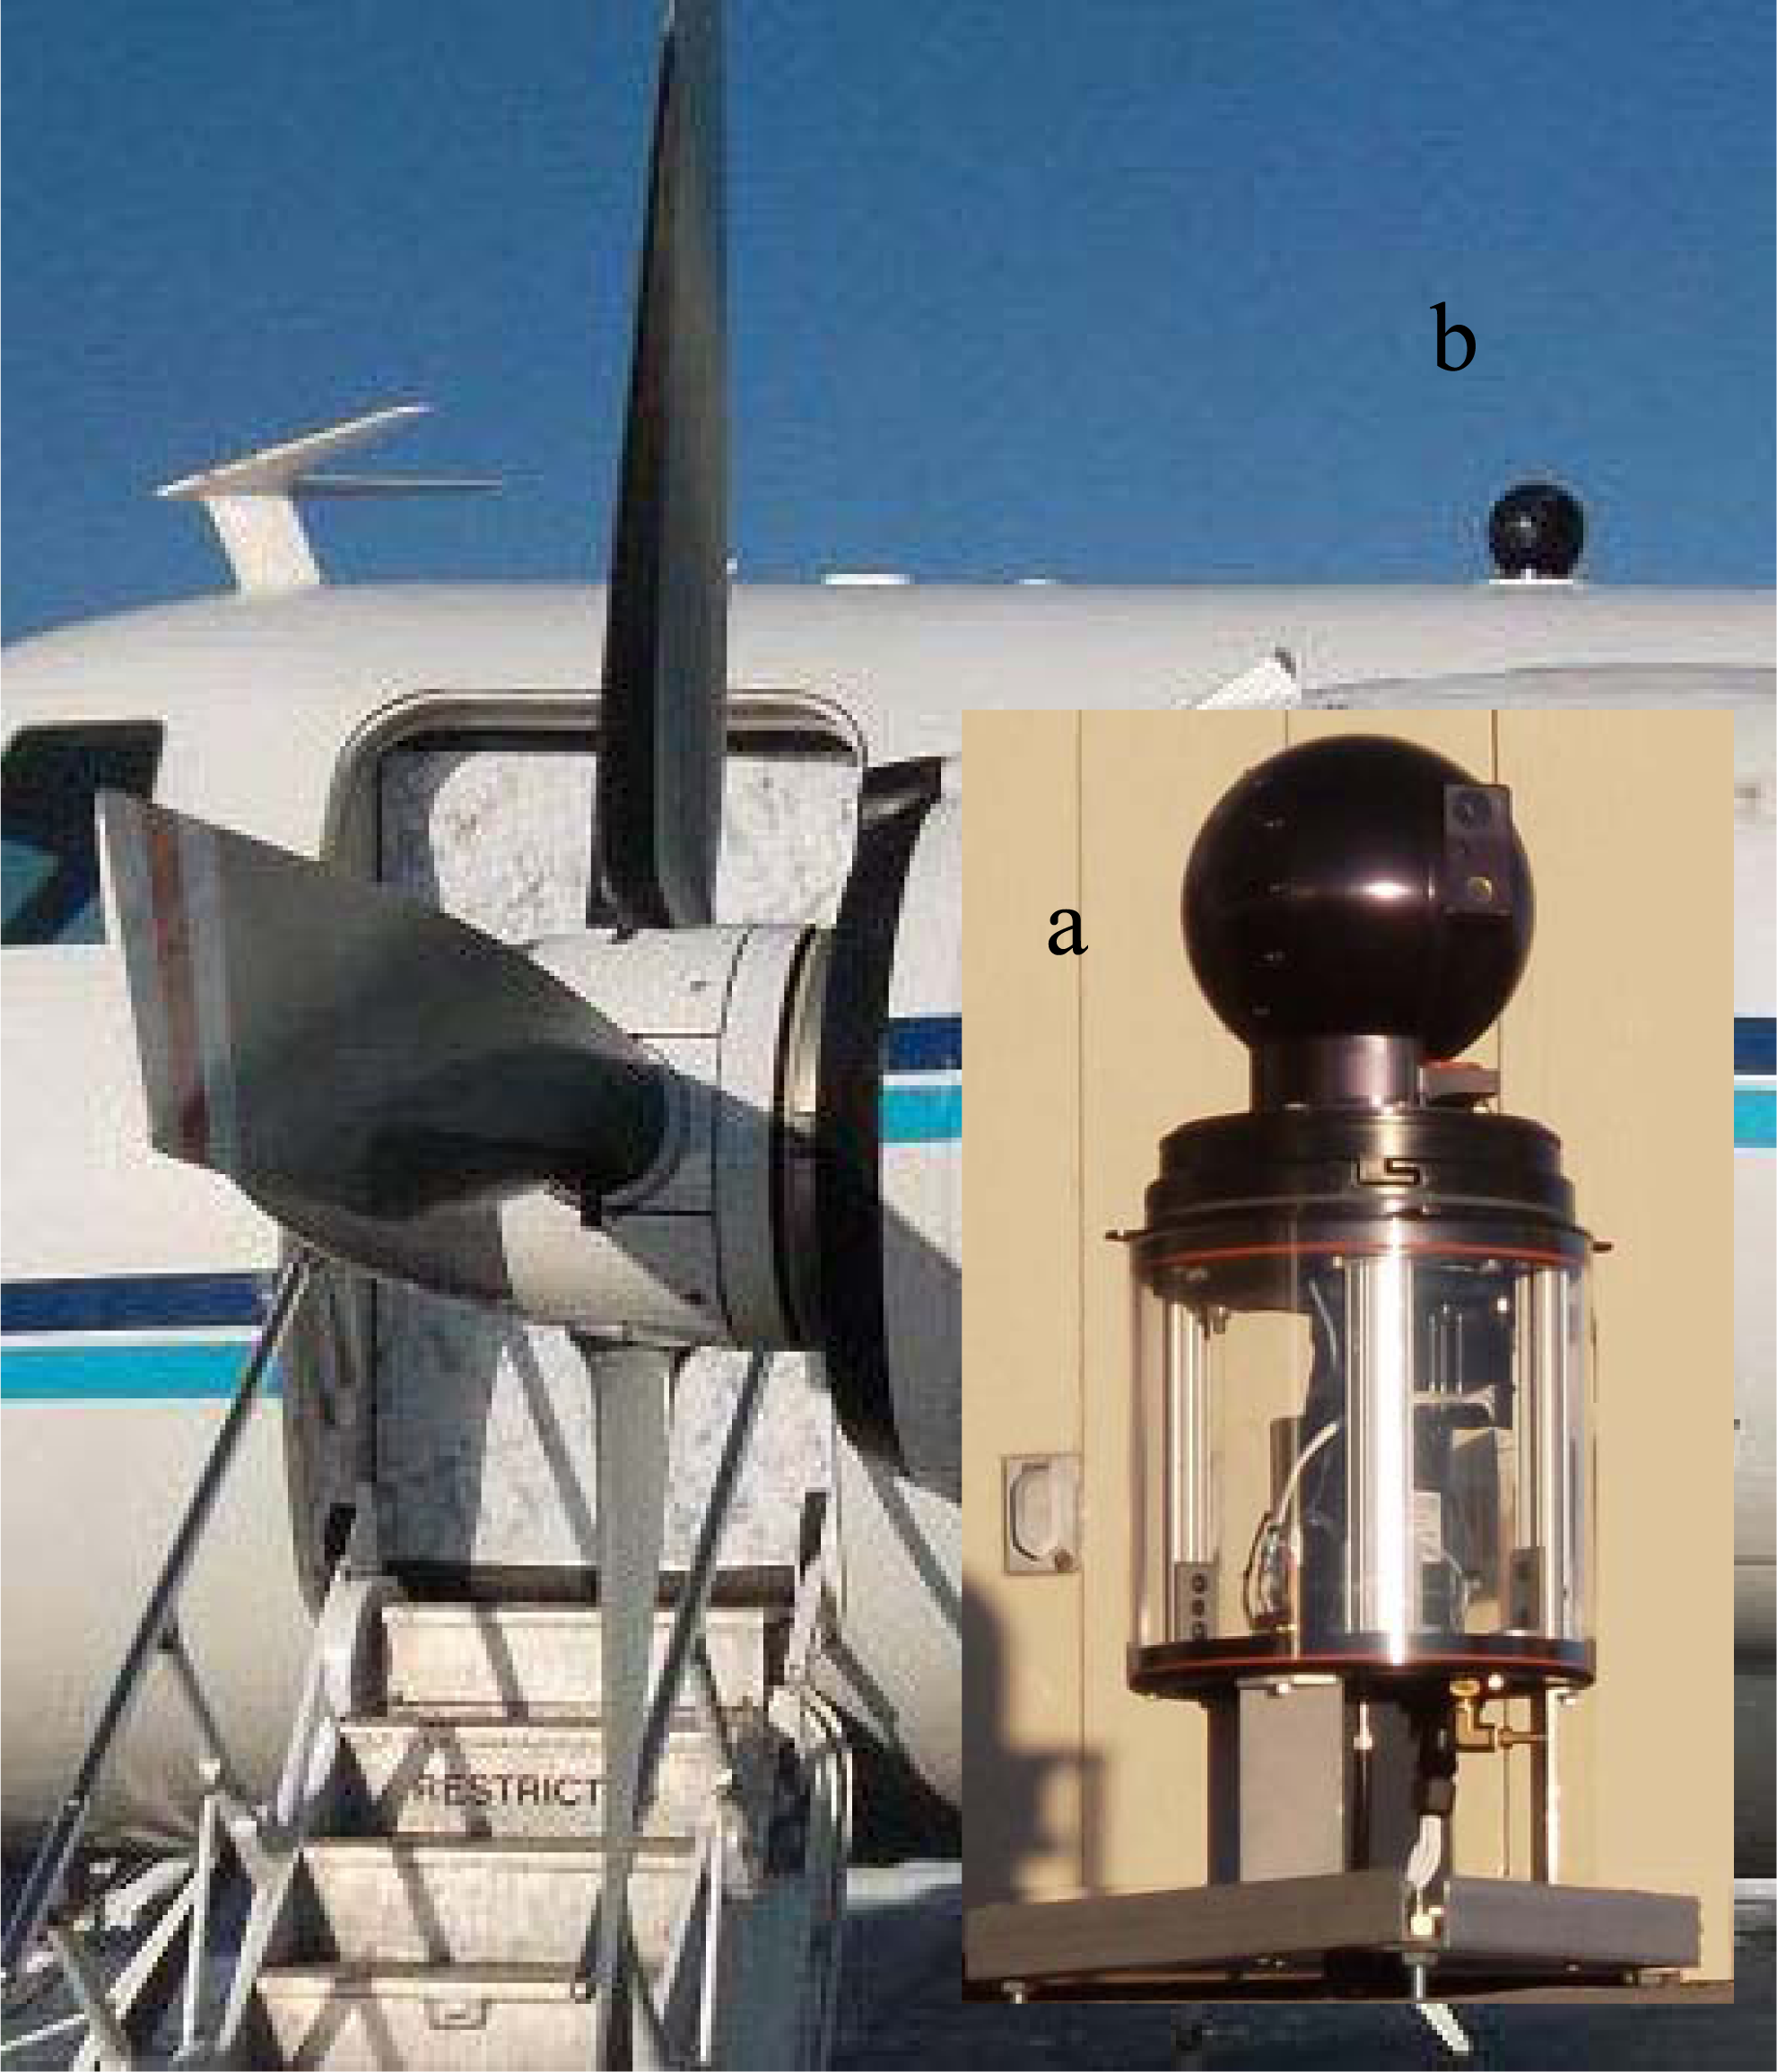
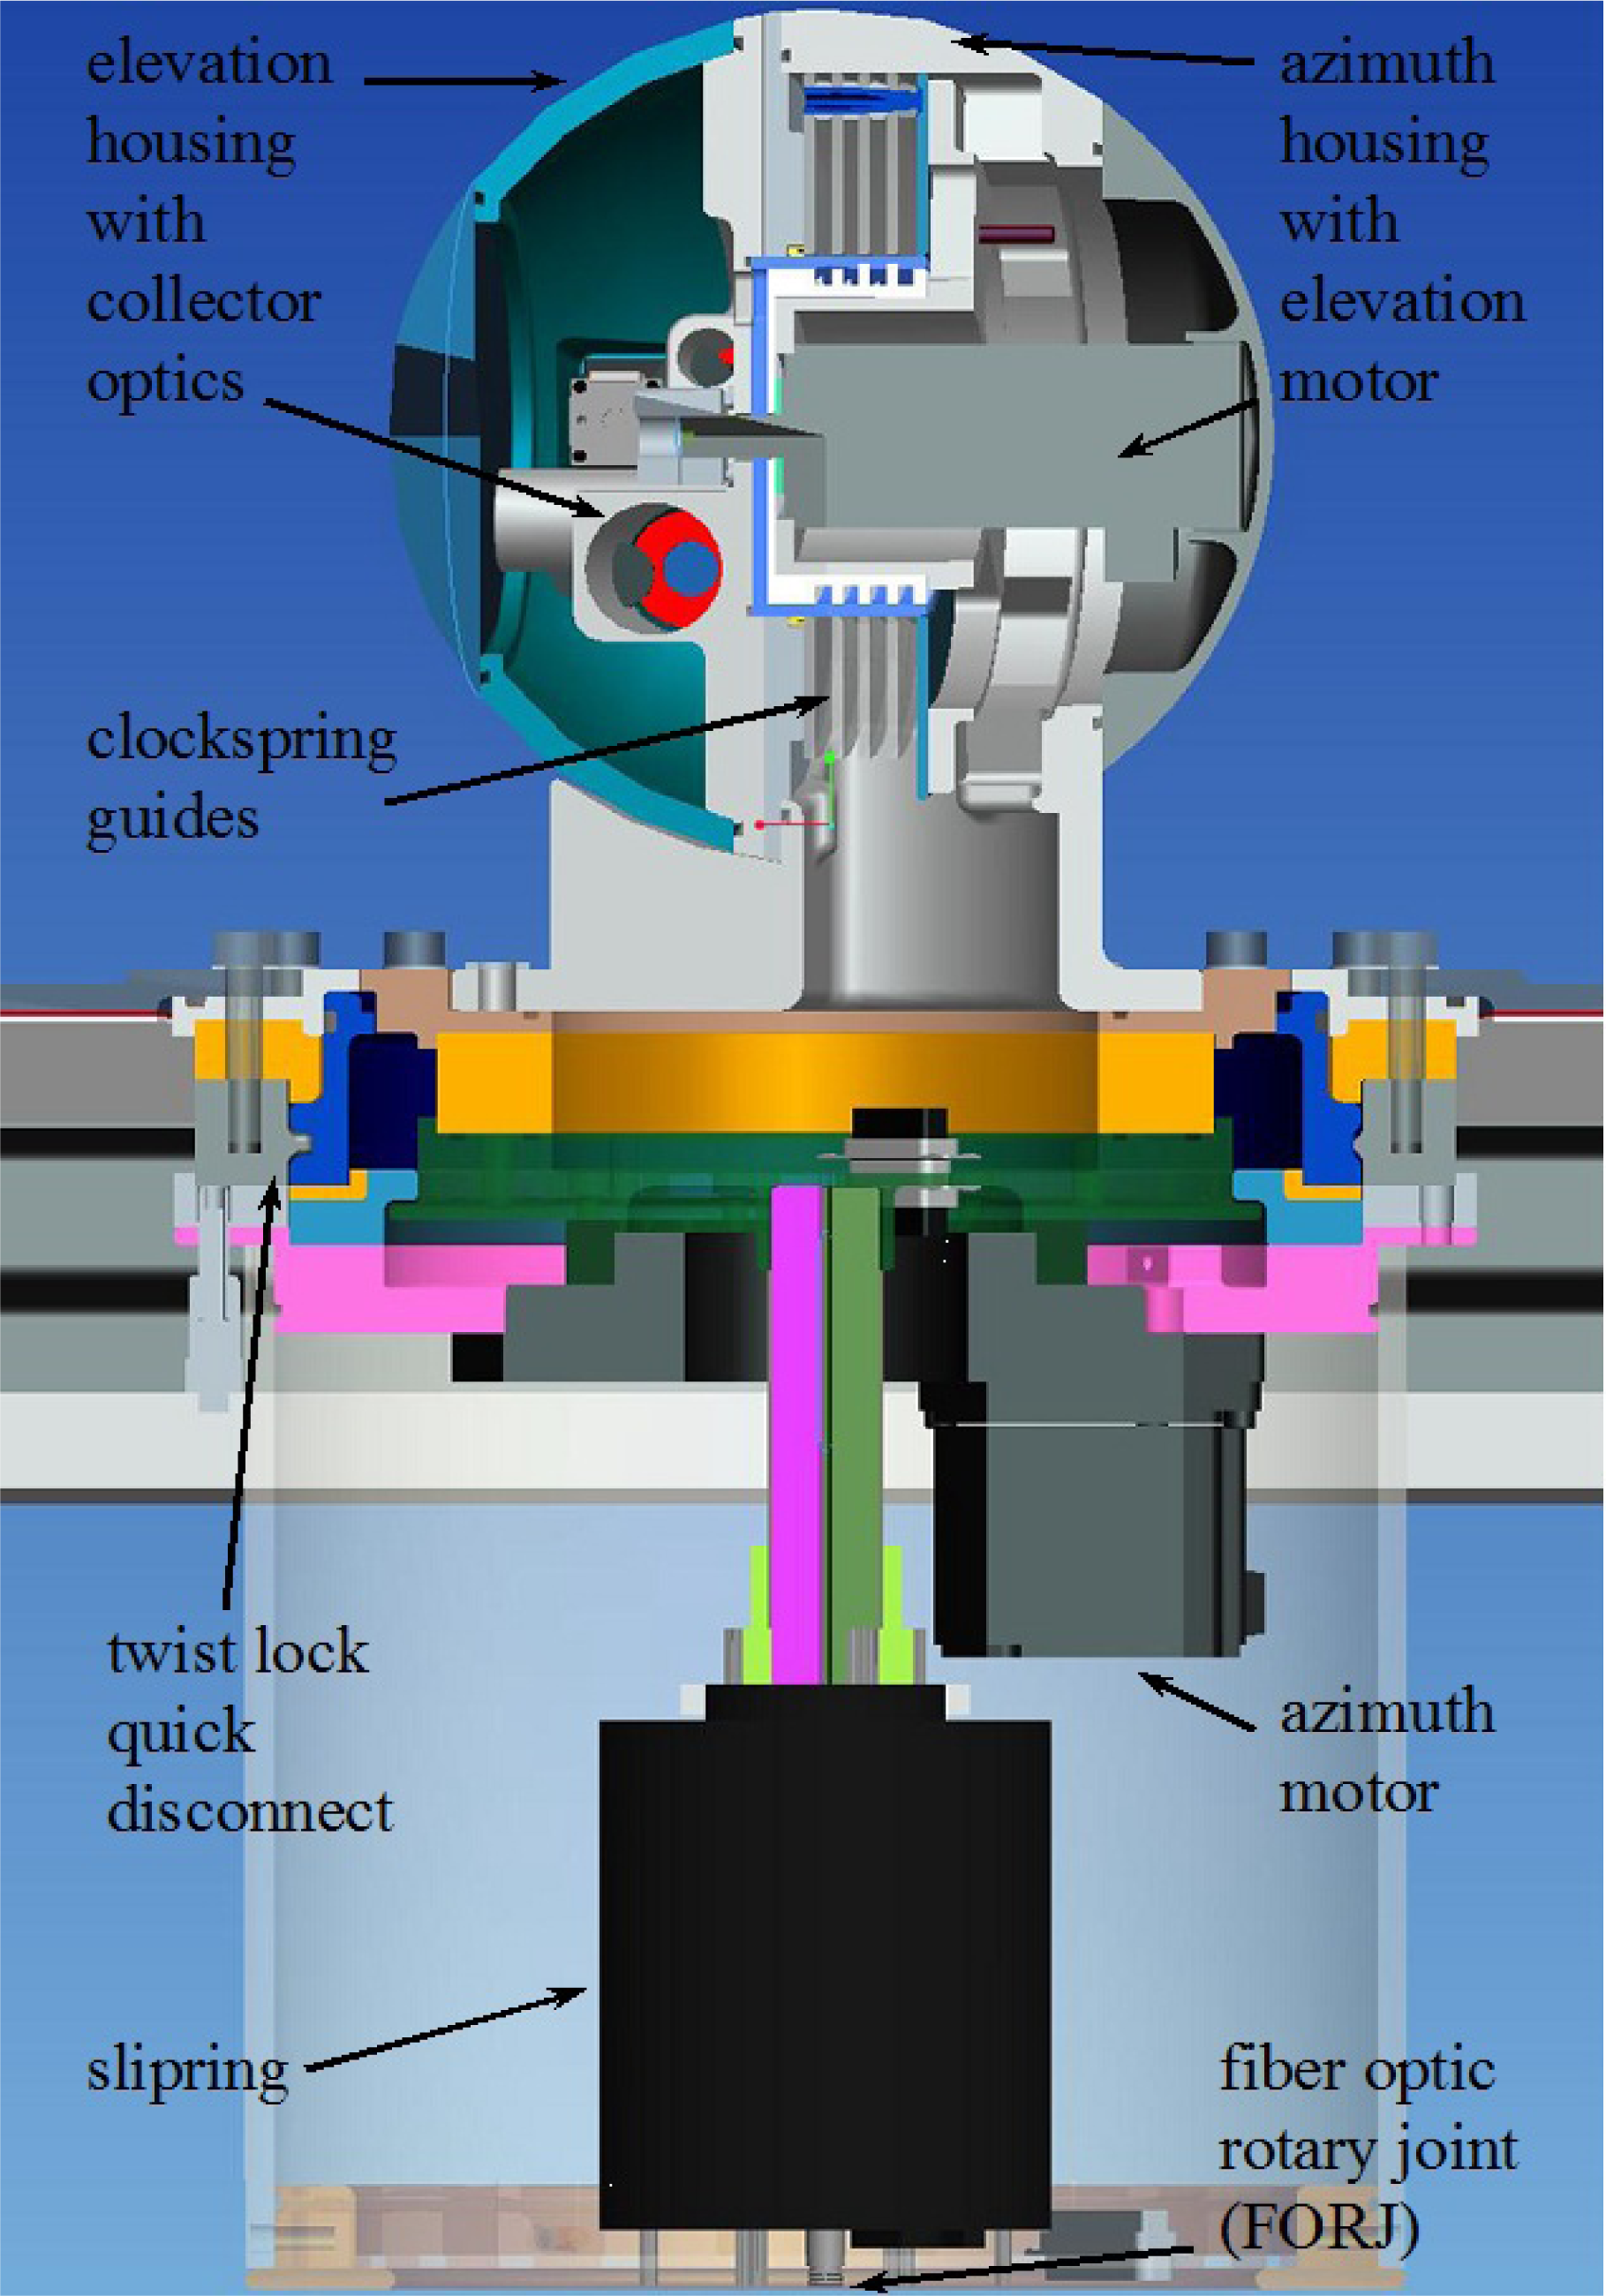
2. Instrument Description
- Are the charge-coupled device (CCD) (quantum) detector elements capable of meeting the radiometric accuracy and stability required?
- Does the combination of small aperture fiber optics and aggressive spectral dispersion within the spectrograph permit adequate light collection to meet the signal-to-noise ratio (SNR) requirement, i.e., can photo-electrons be collected fast enough to get useful sky scan measurements within an acceptably small spatial domain?
- Are stray light artifacts internal to the spectrometers adequately controlled (or deterministically correctable)?
- Will a flexible fiber optic bundle and fiber optic rotary joint (FORJ) provide consistent radiometric transmission through the full range of motion?
- Will the optical collectors’ windows remain clean enough during flight experiments that data will not be unacceptably contaminated?
- Can the mechanical motion axes be properly sealed across the aircraft pressure barrier without limiting tracking response?
3. Laboratory Testing of Flight Instrument Performance
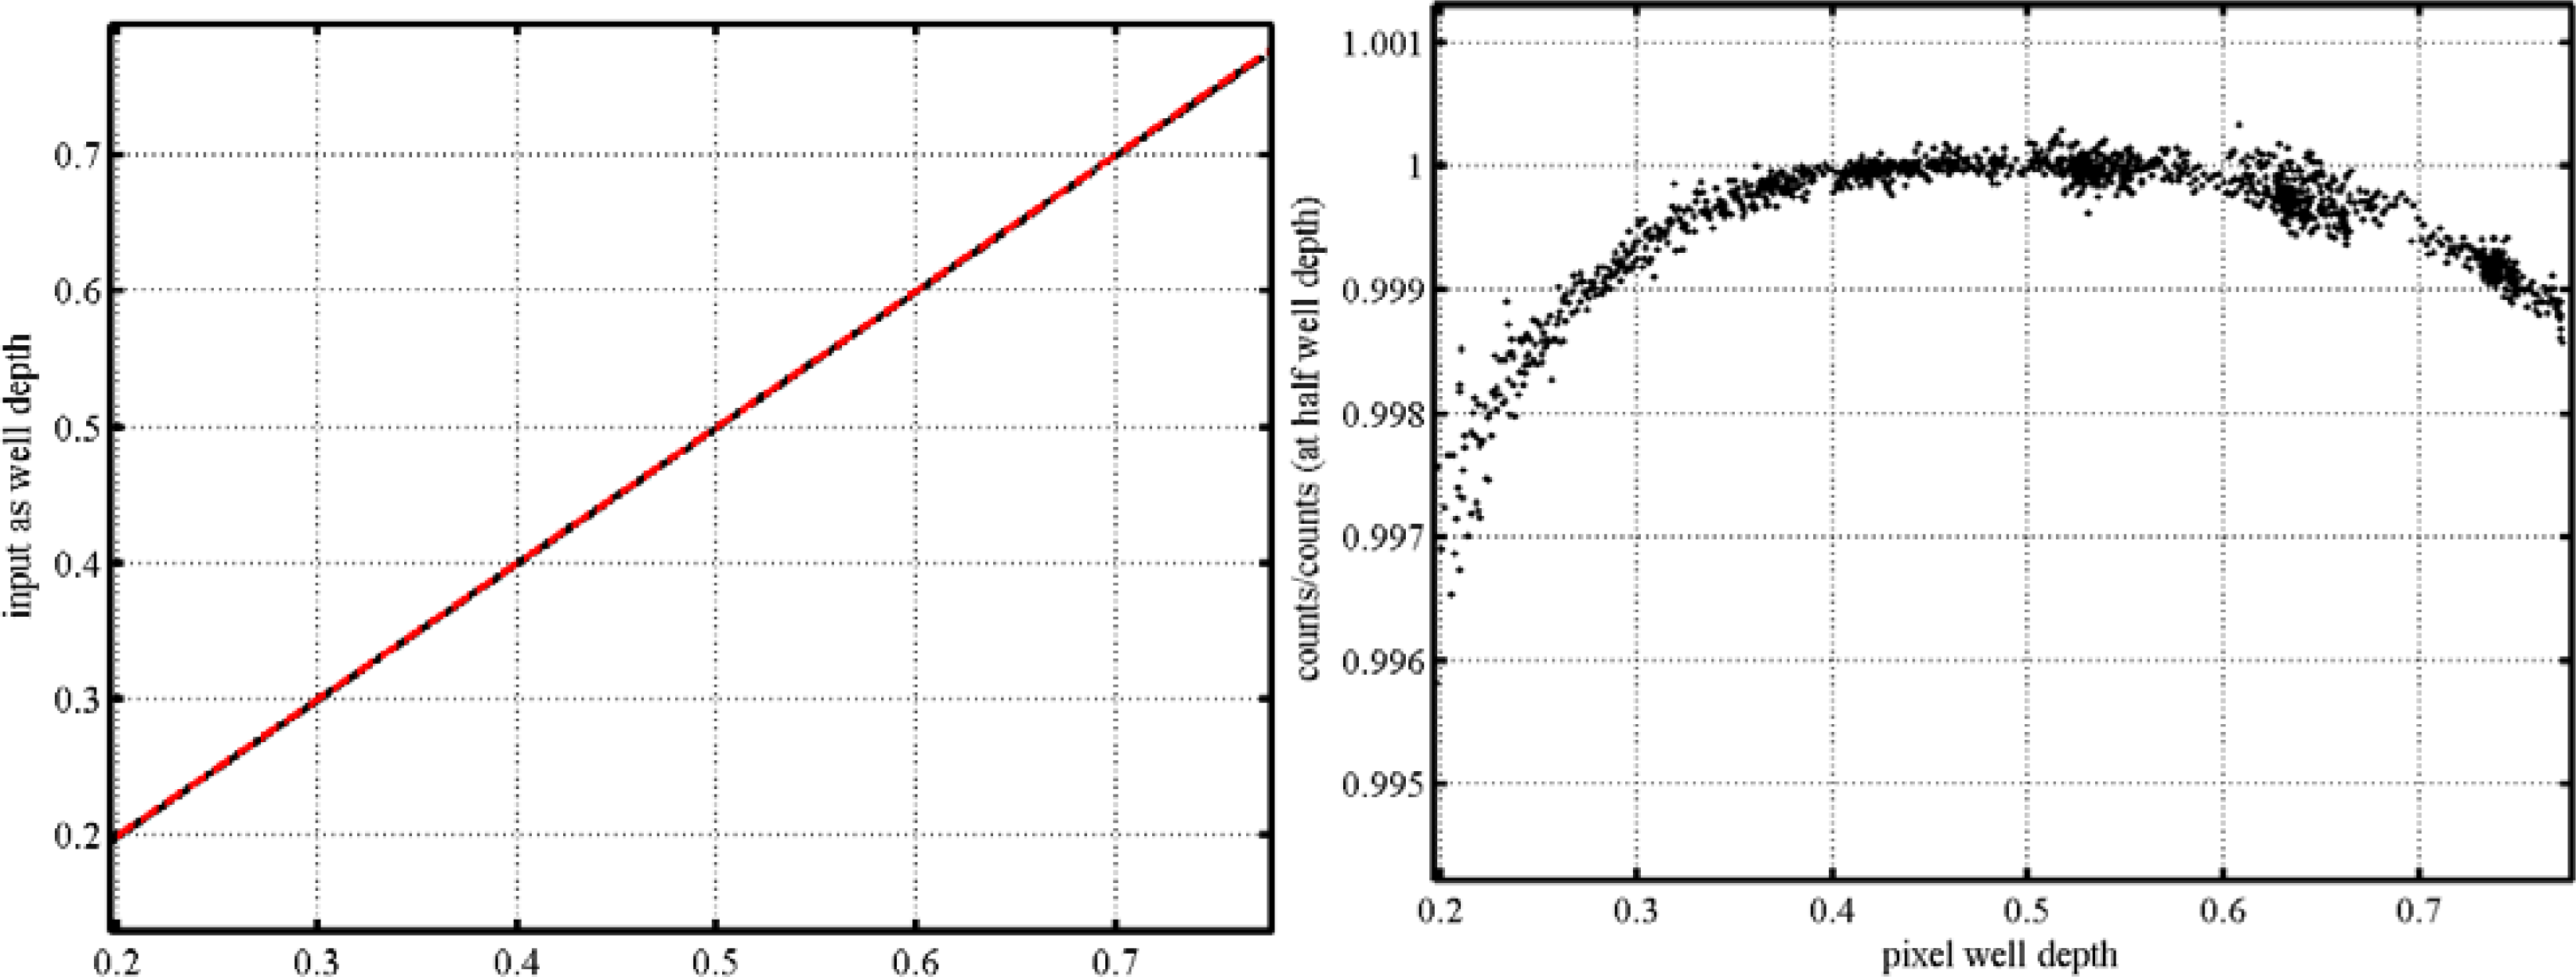
3.1. Detector Linearity
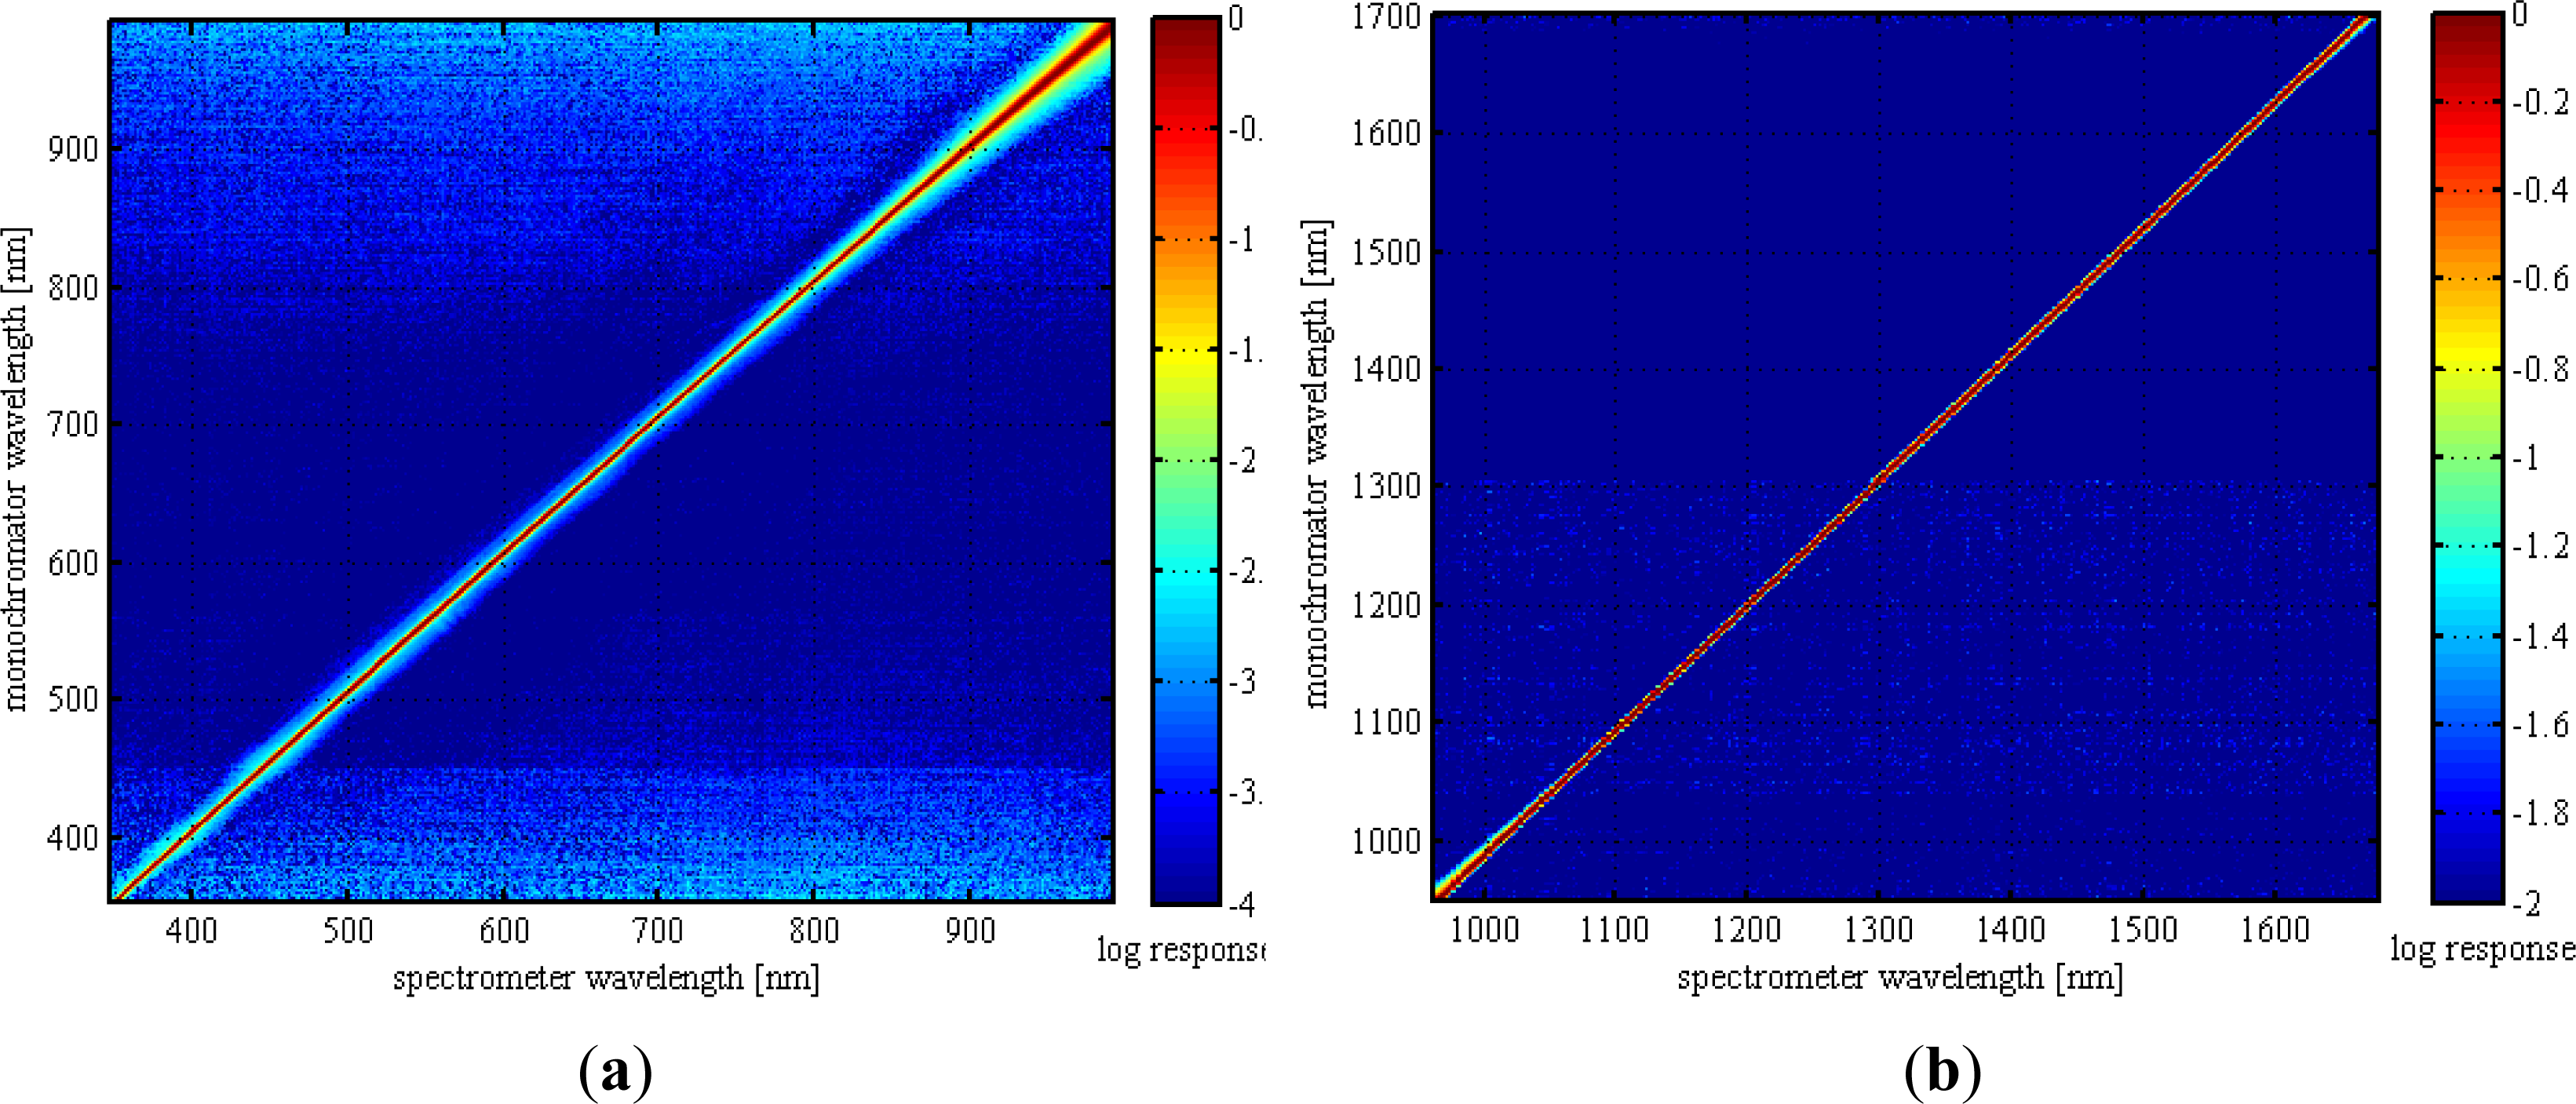
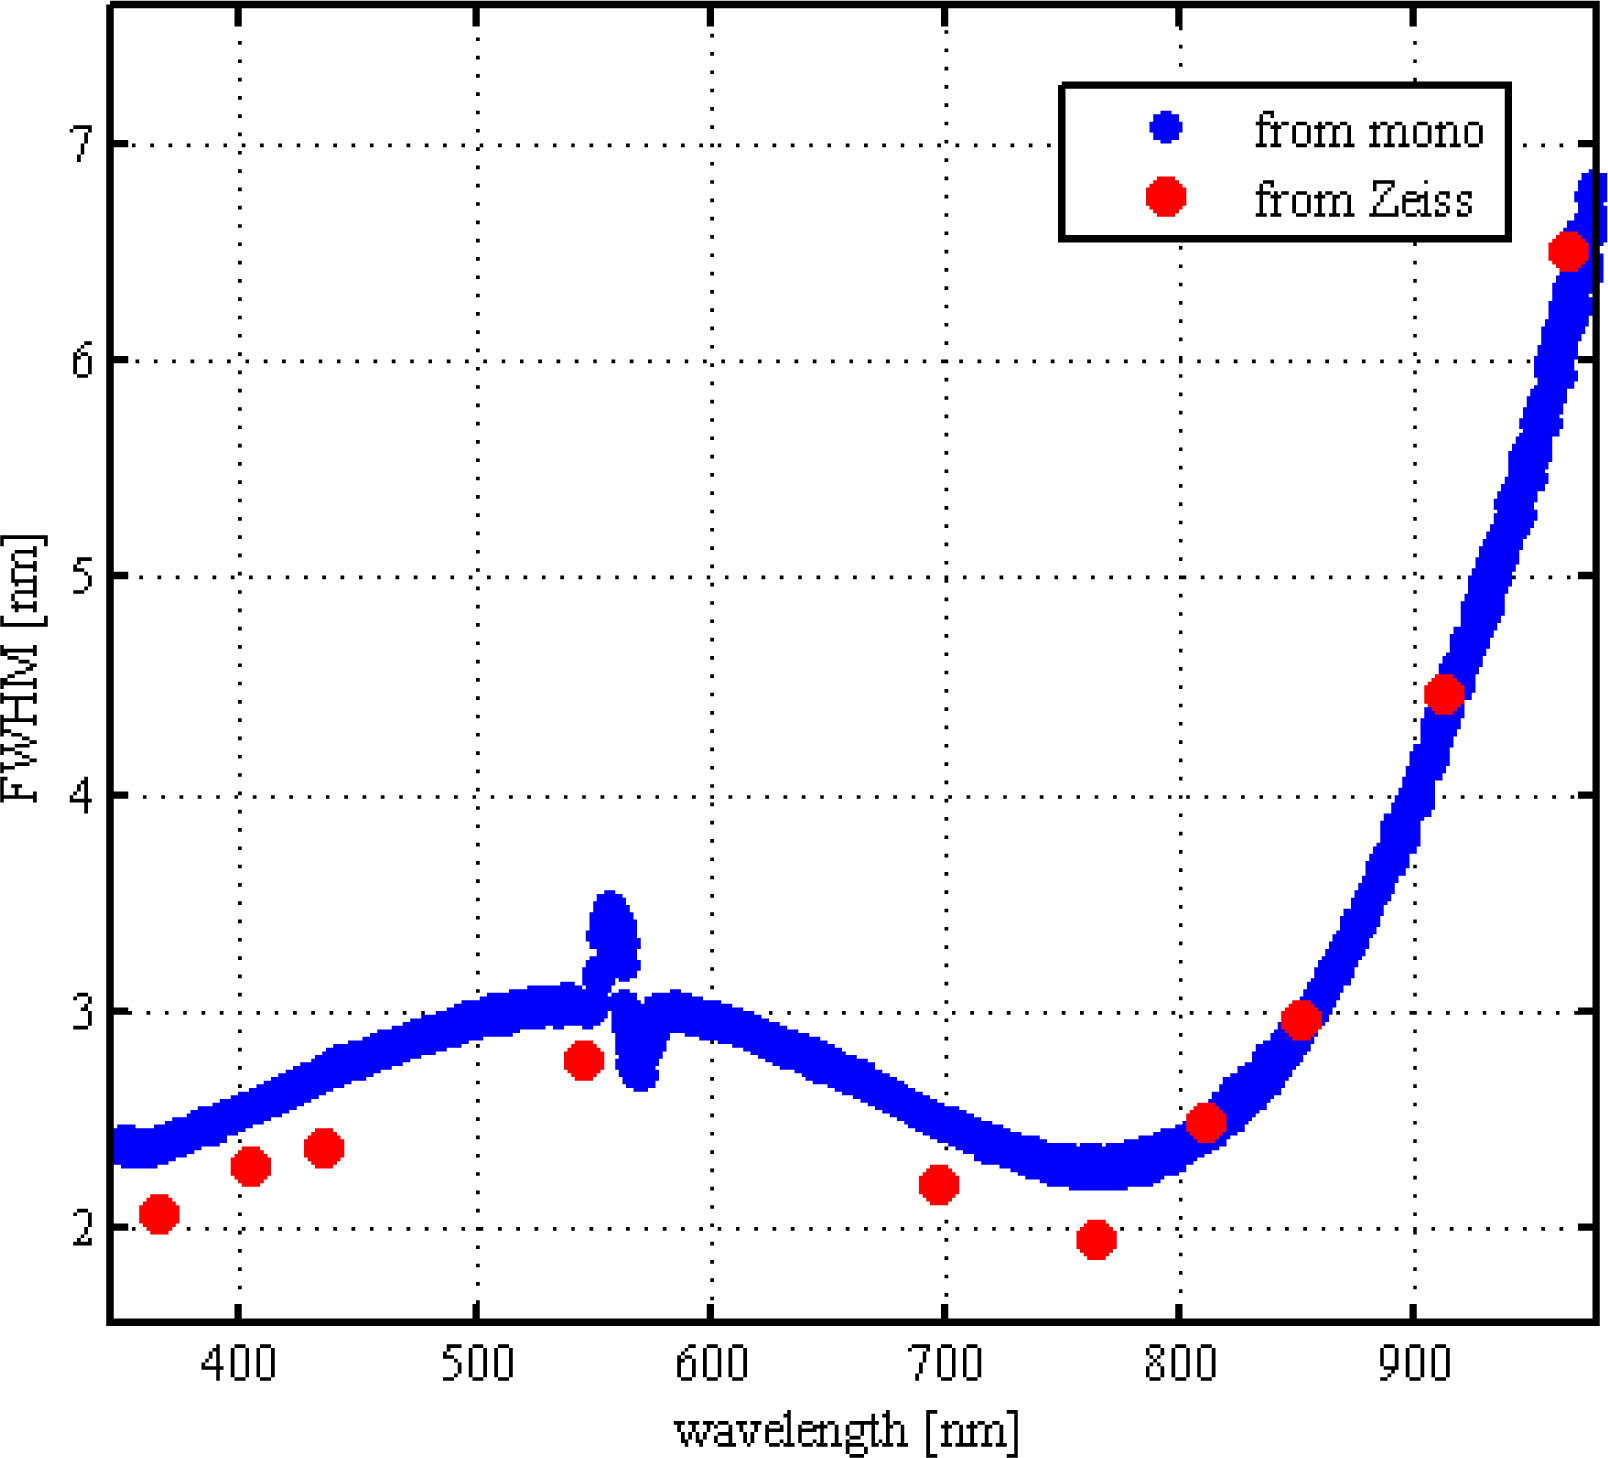
3.2. Spectral Calibration and Characterization
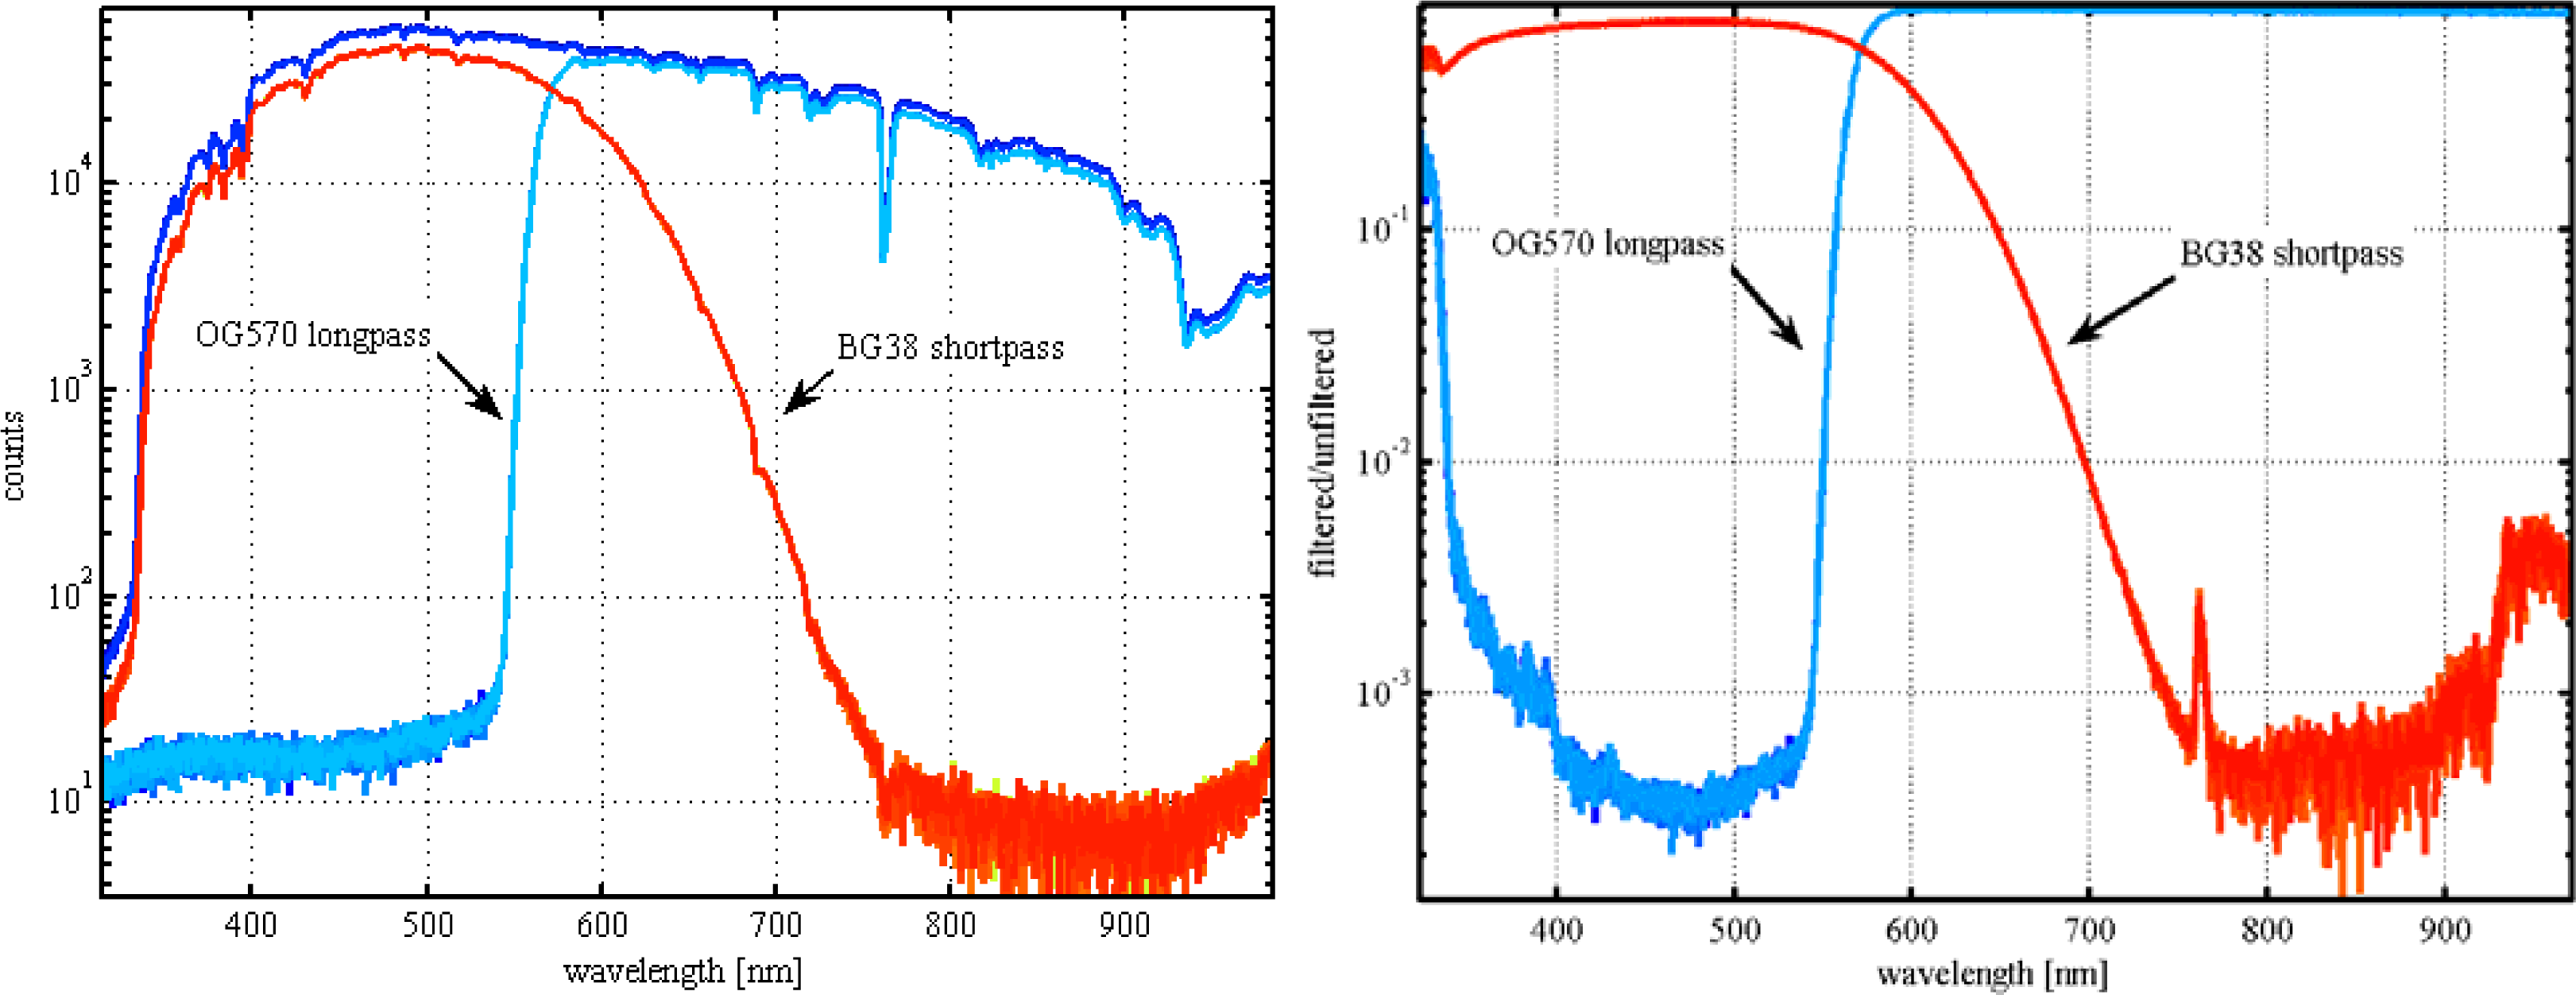
3.3. Other Detector and Spectrometer Error Sources
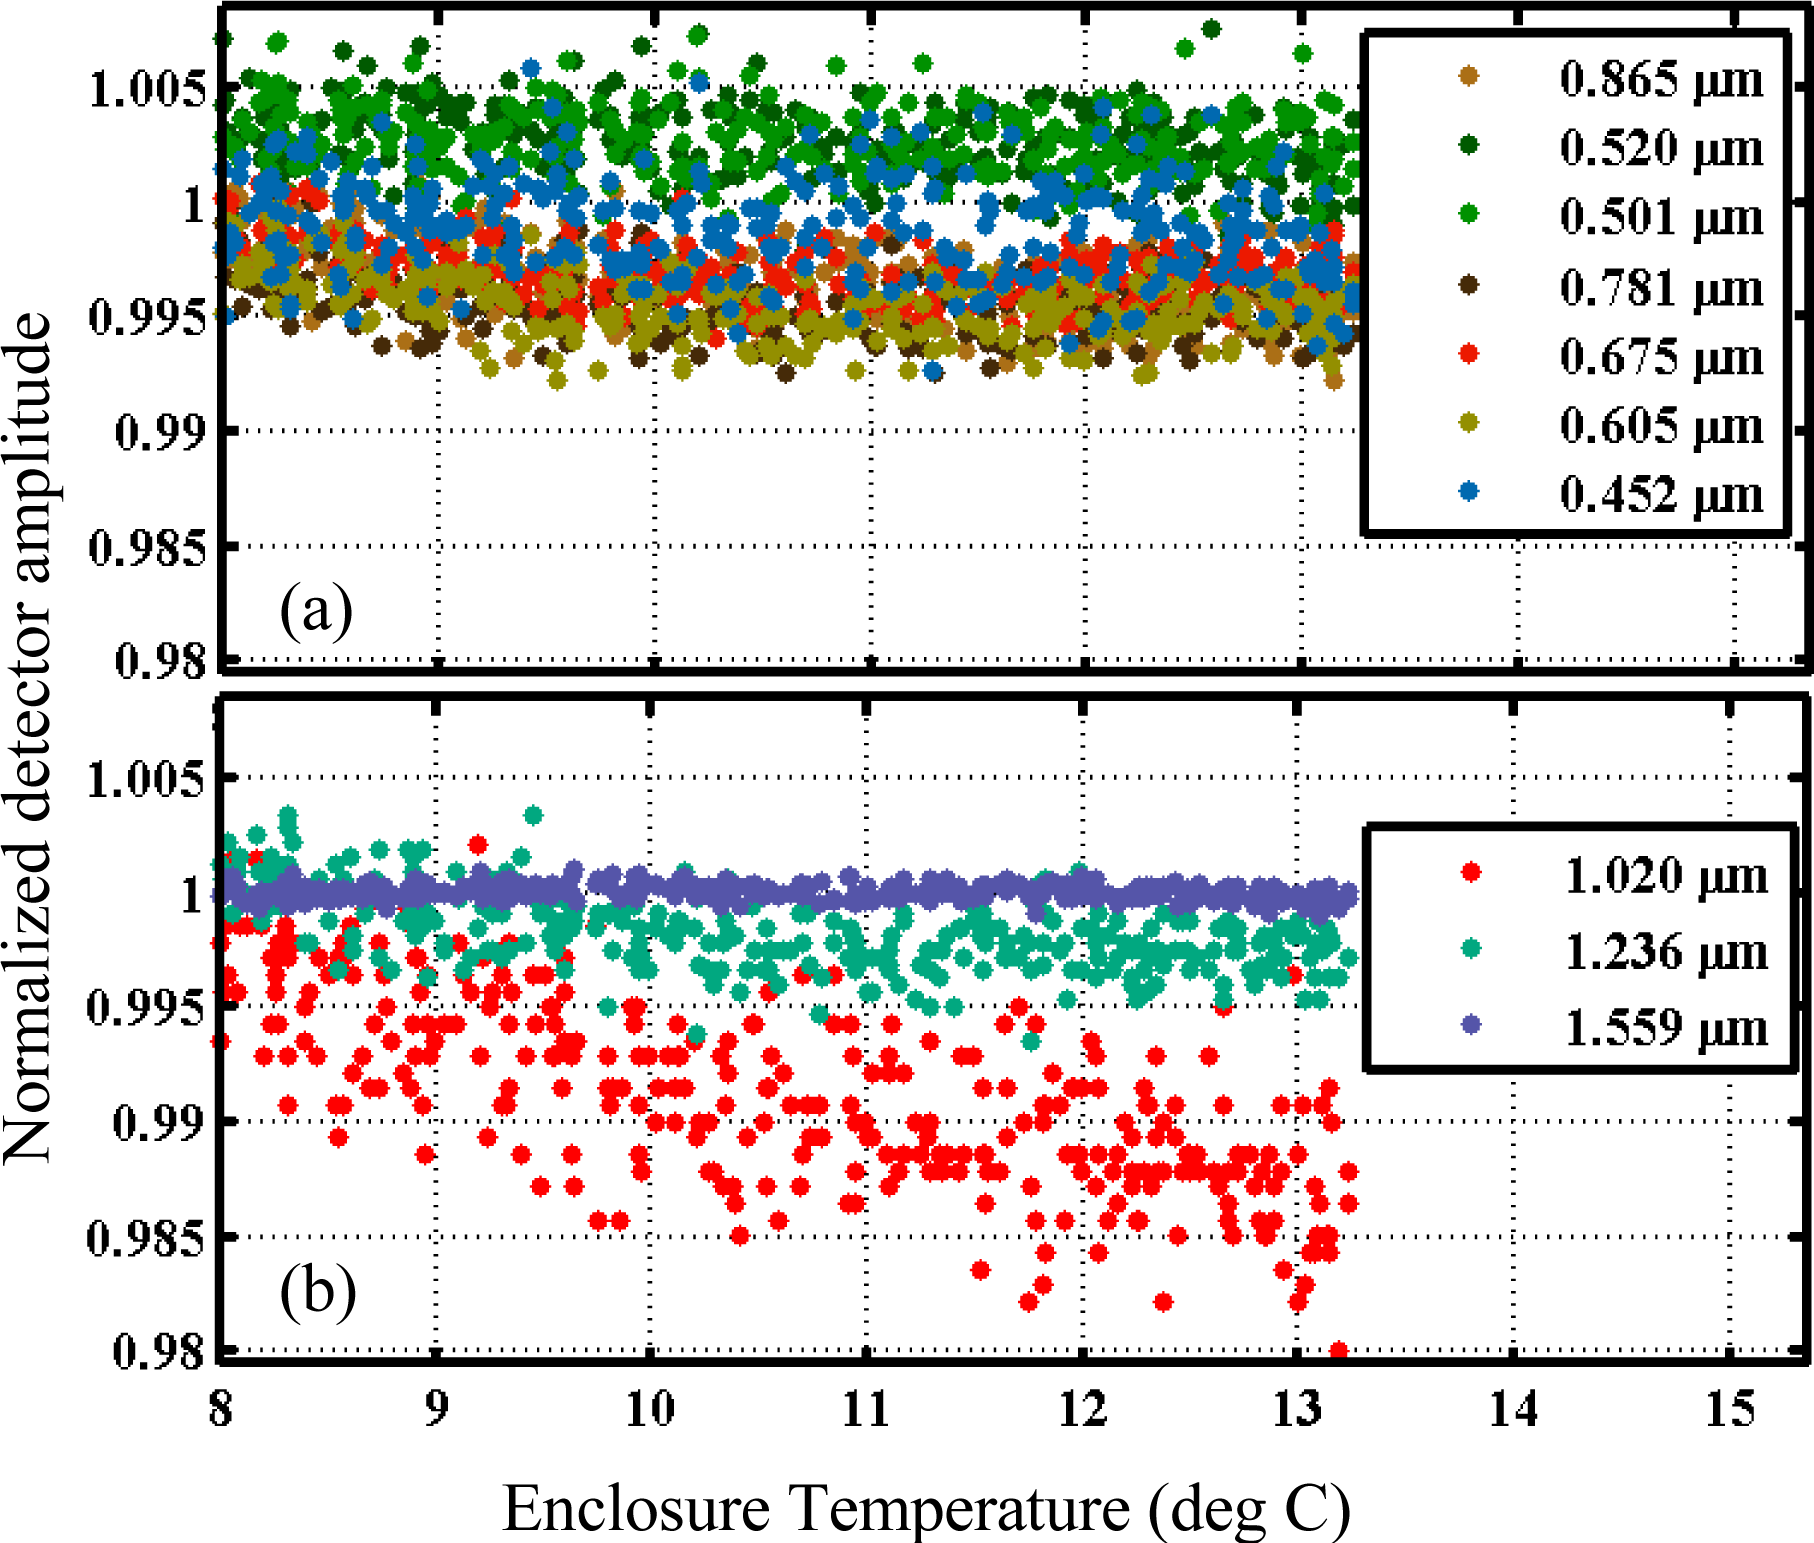
3.4. Light Path Transmission Stability
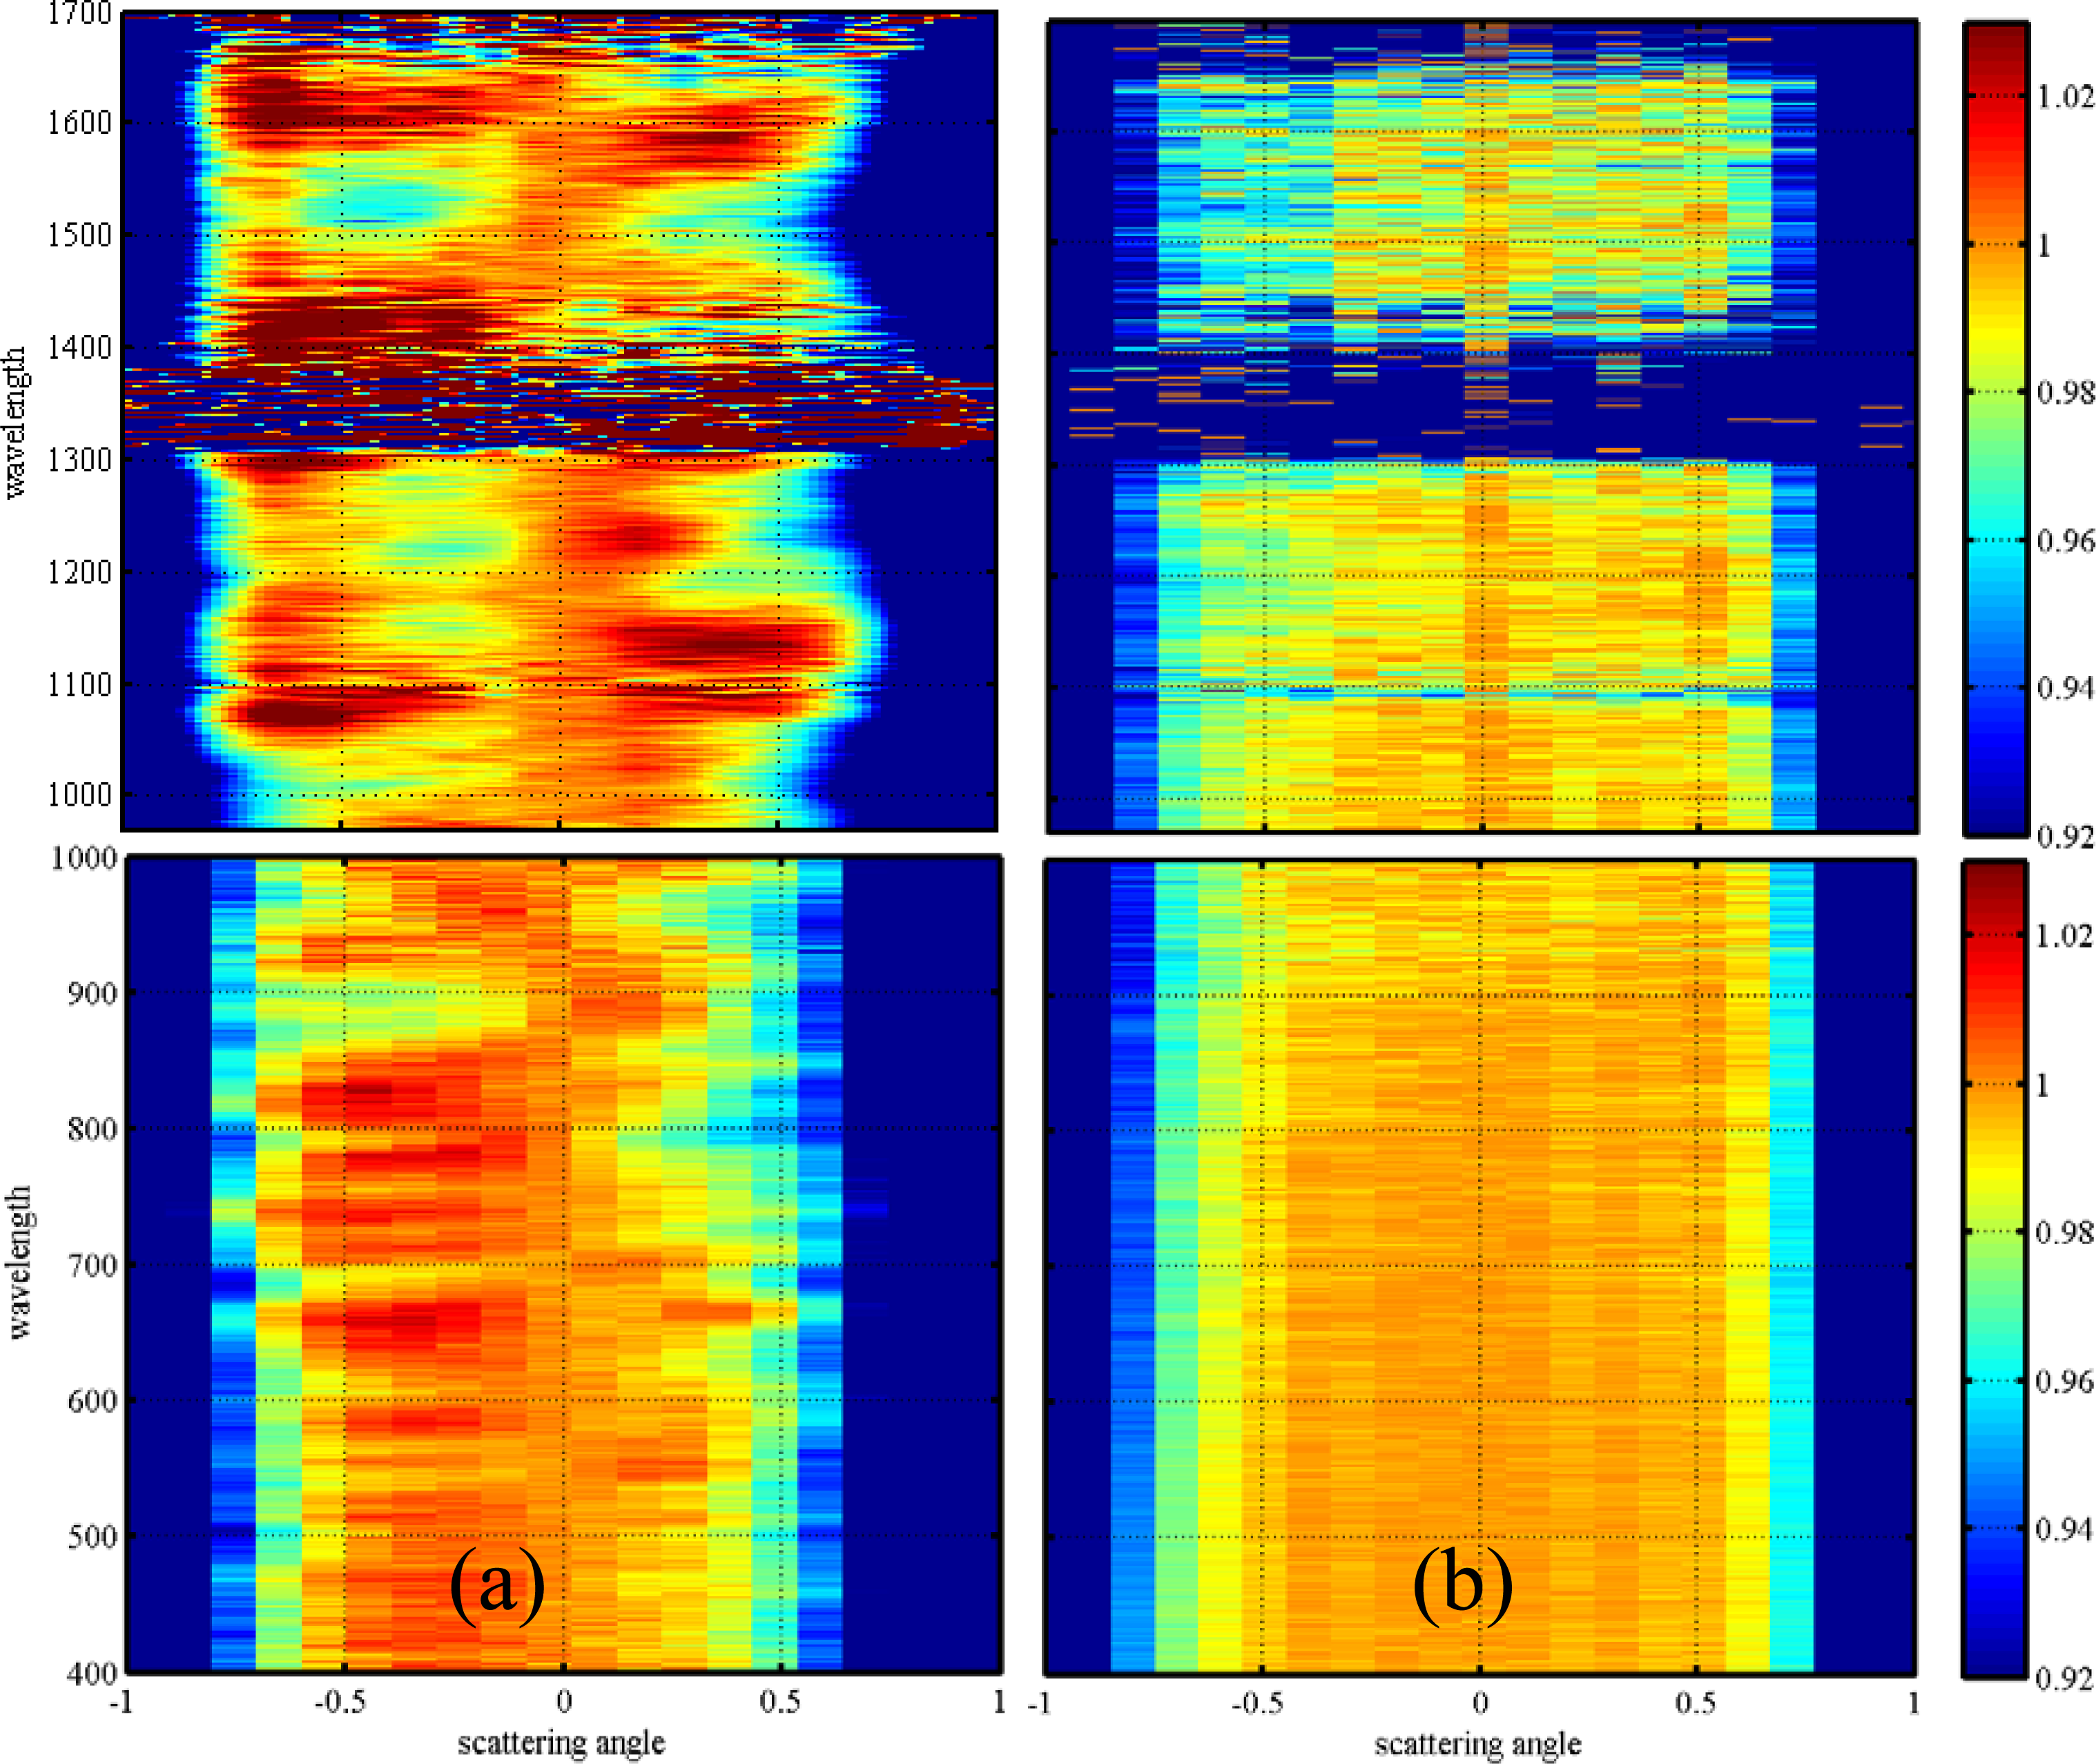
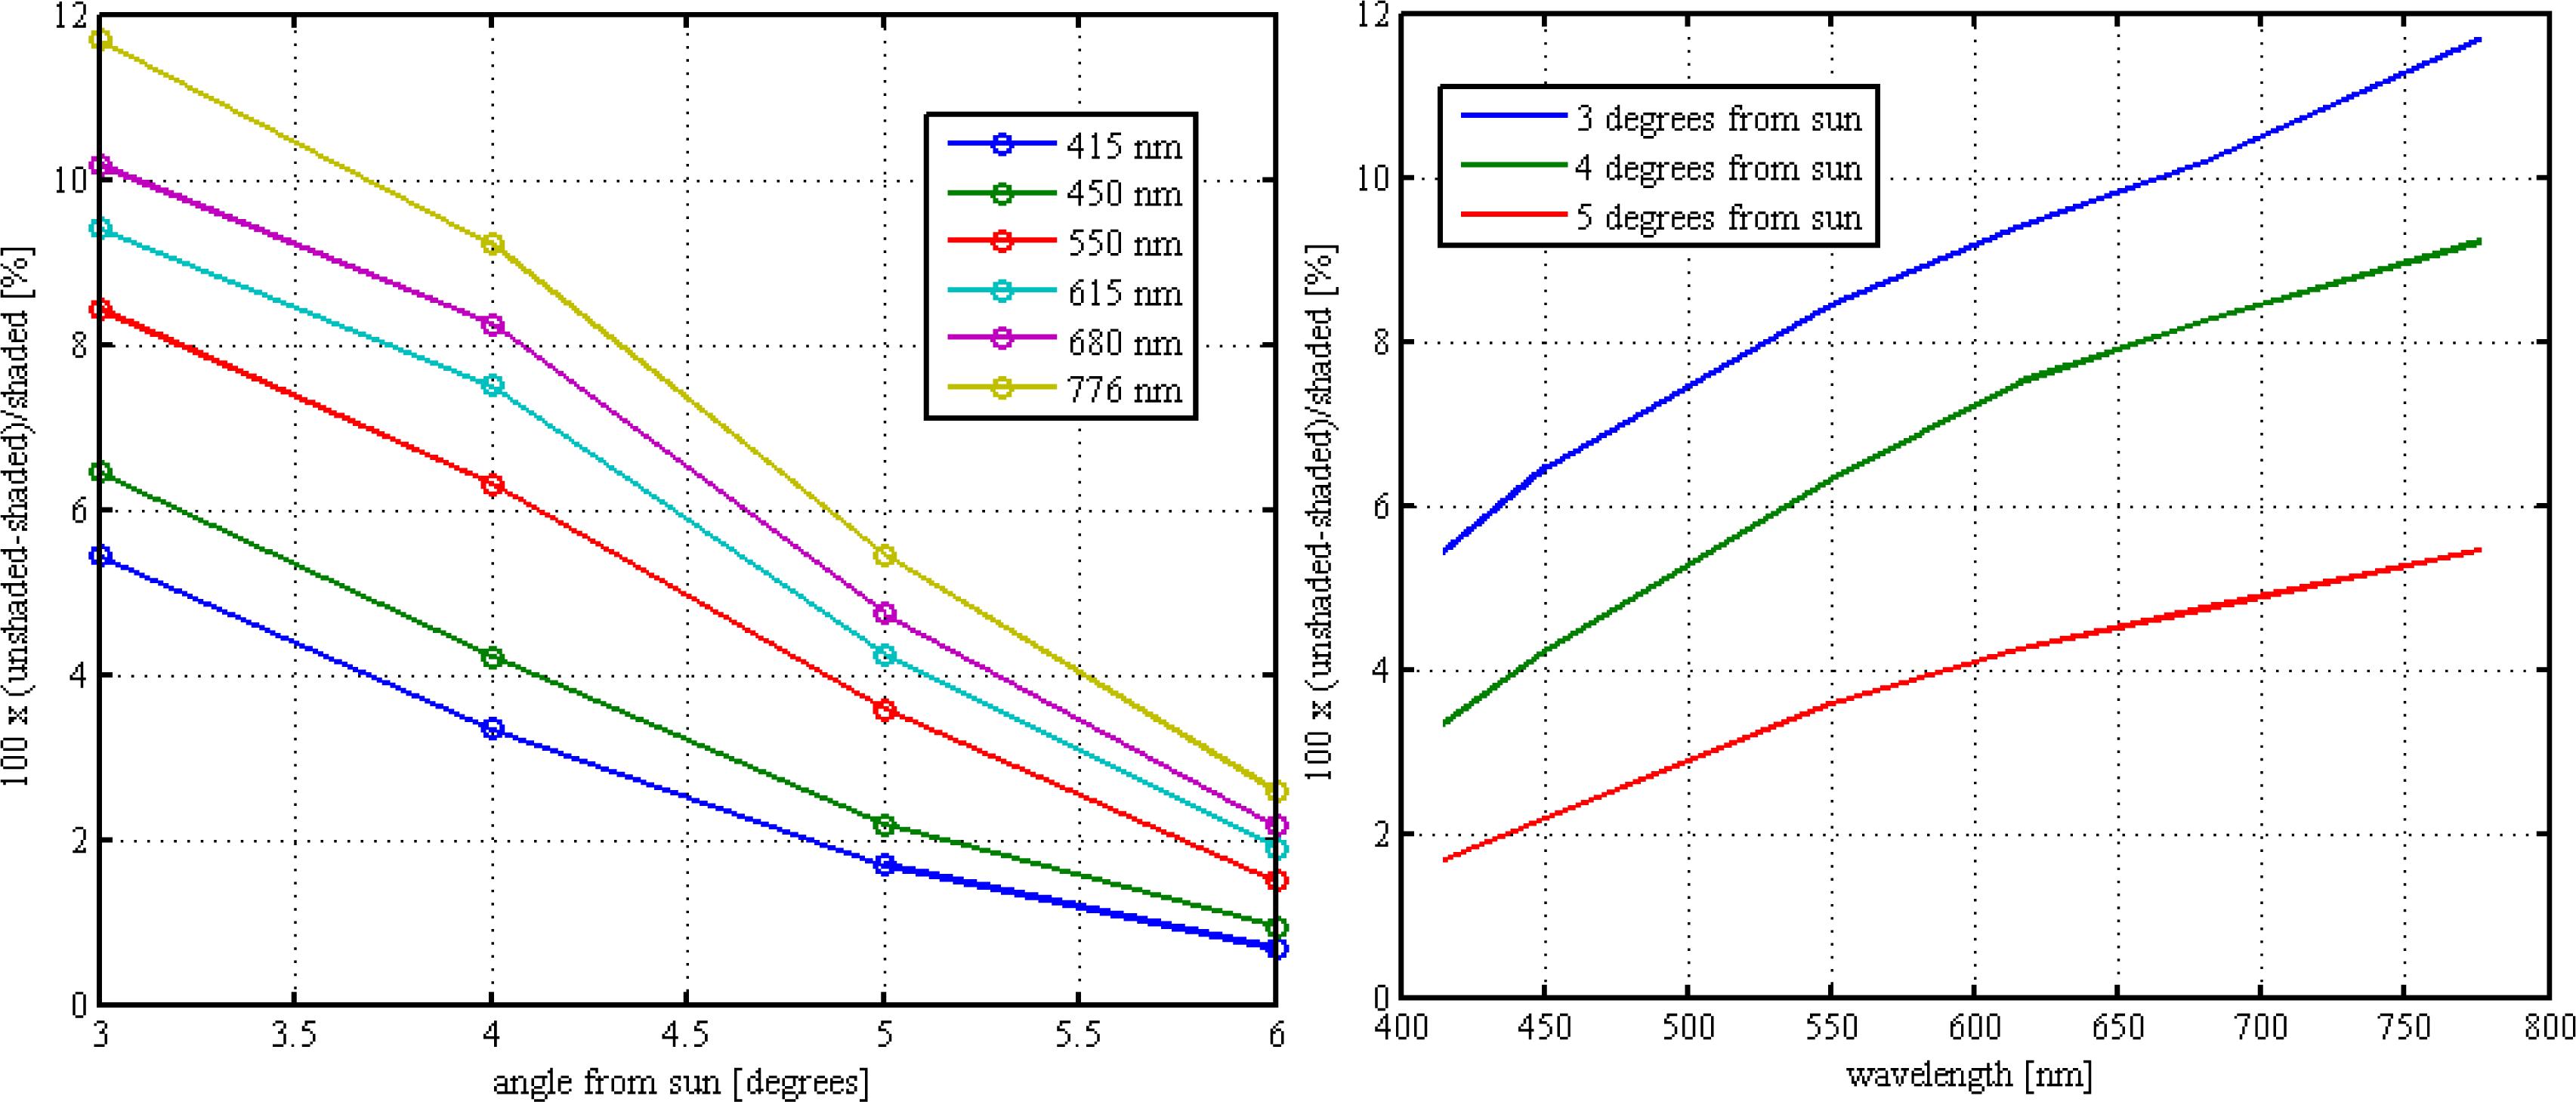
3.5. Field of View (FOV) Characterizations
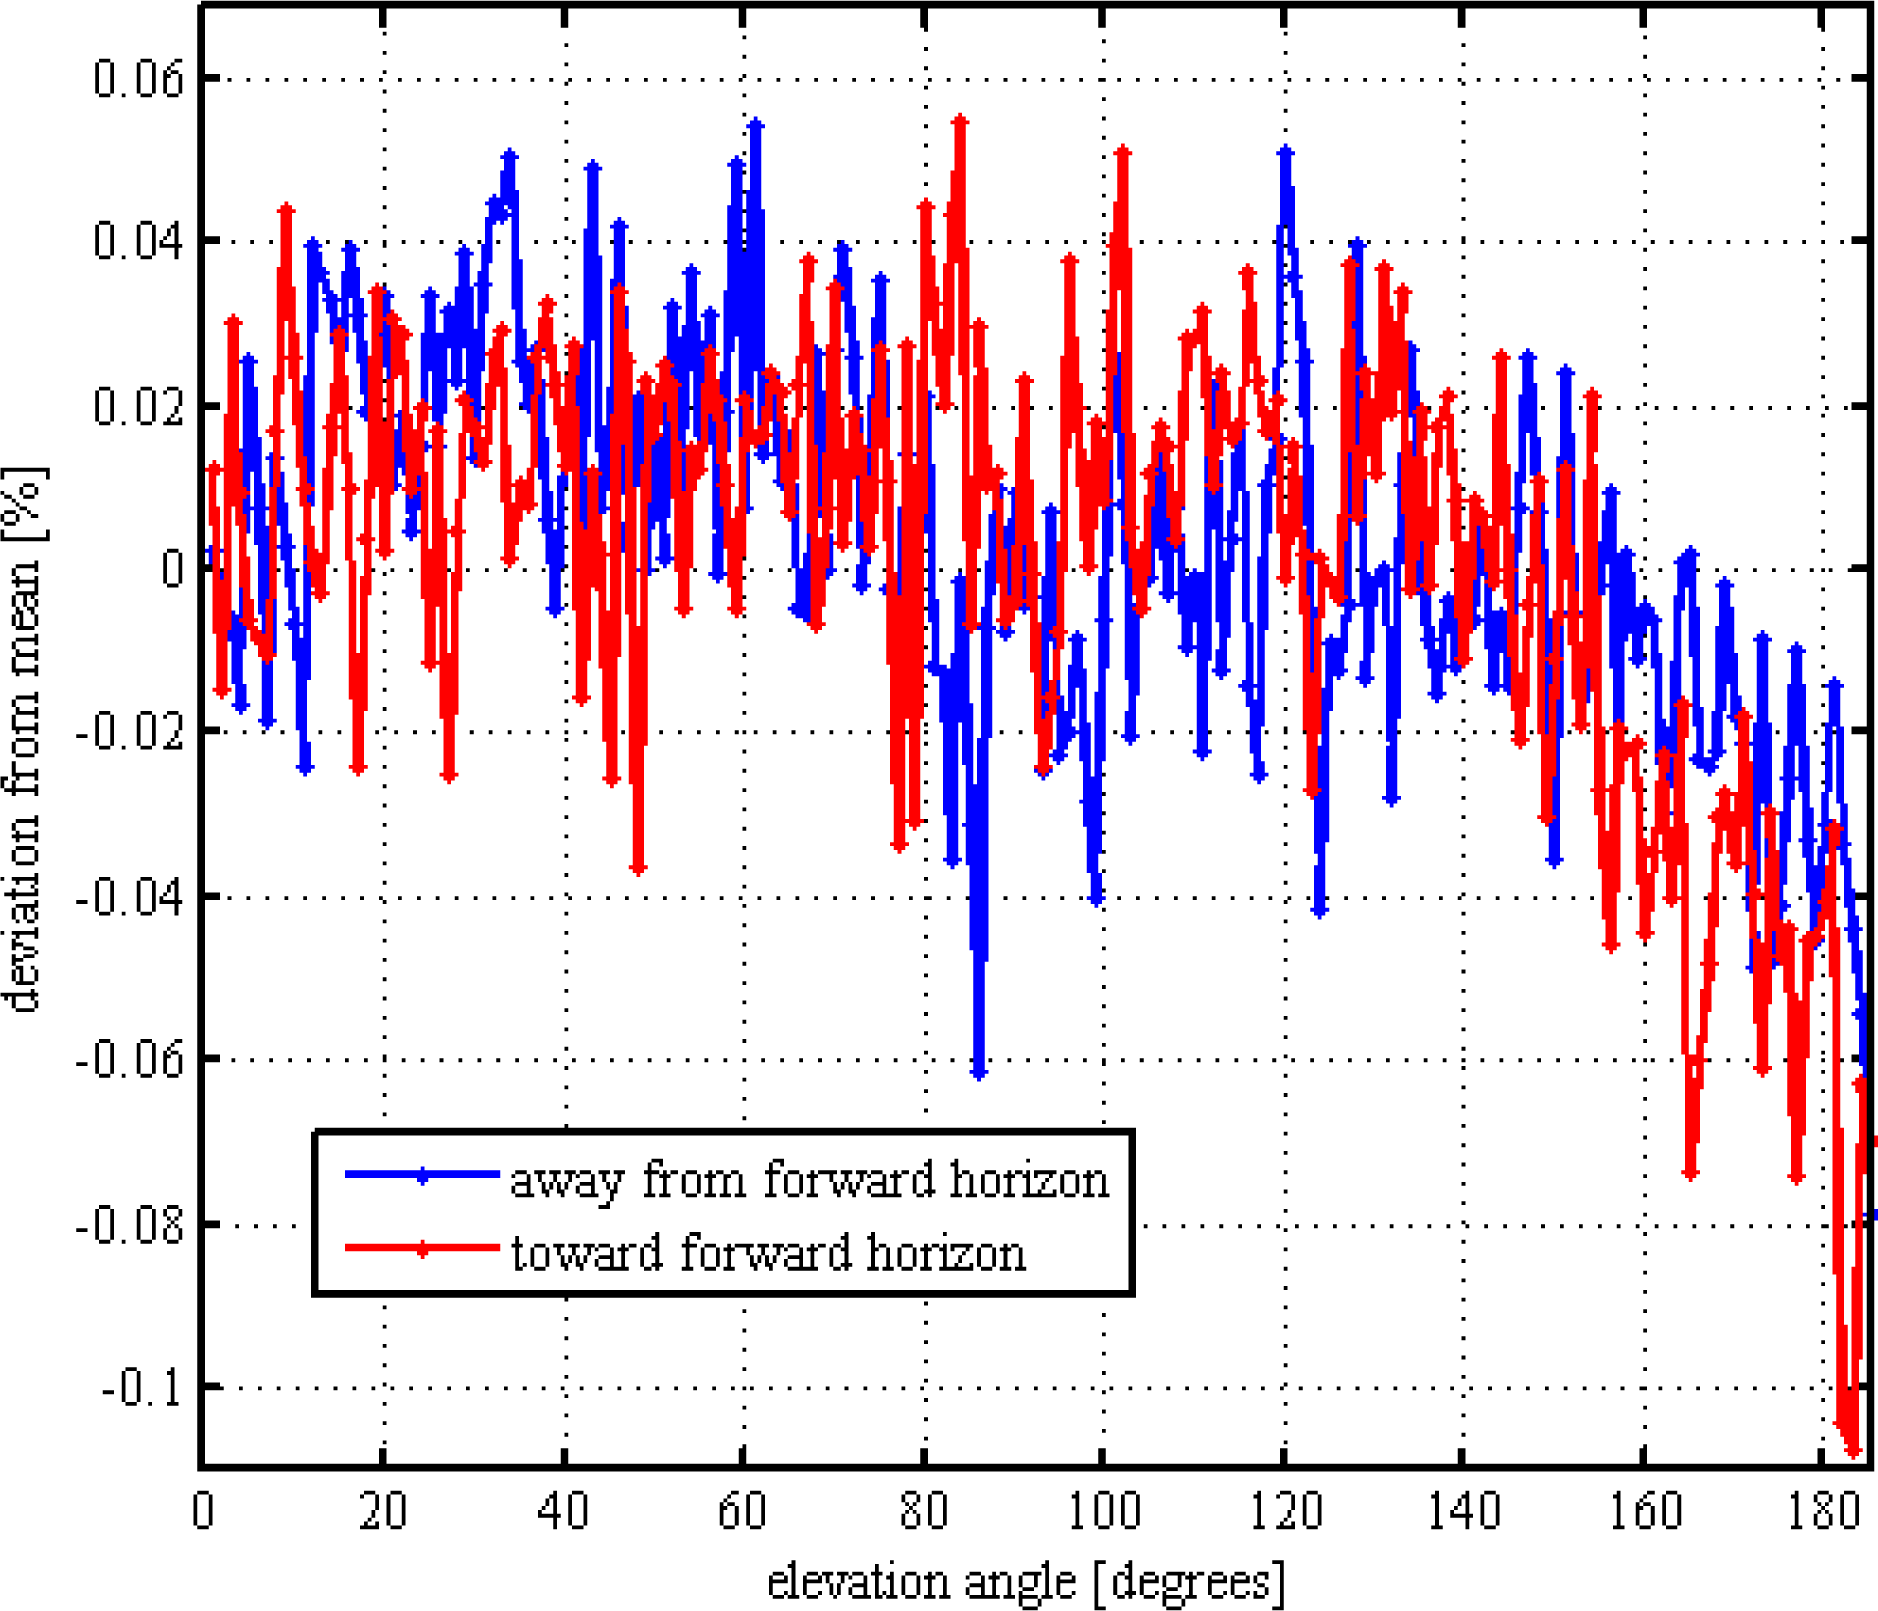
3.6. Tracking Errors
3.7. Radiometric Calibration
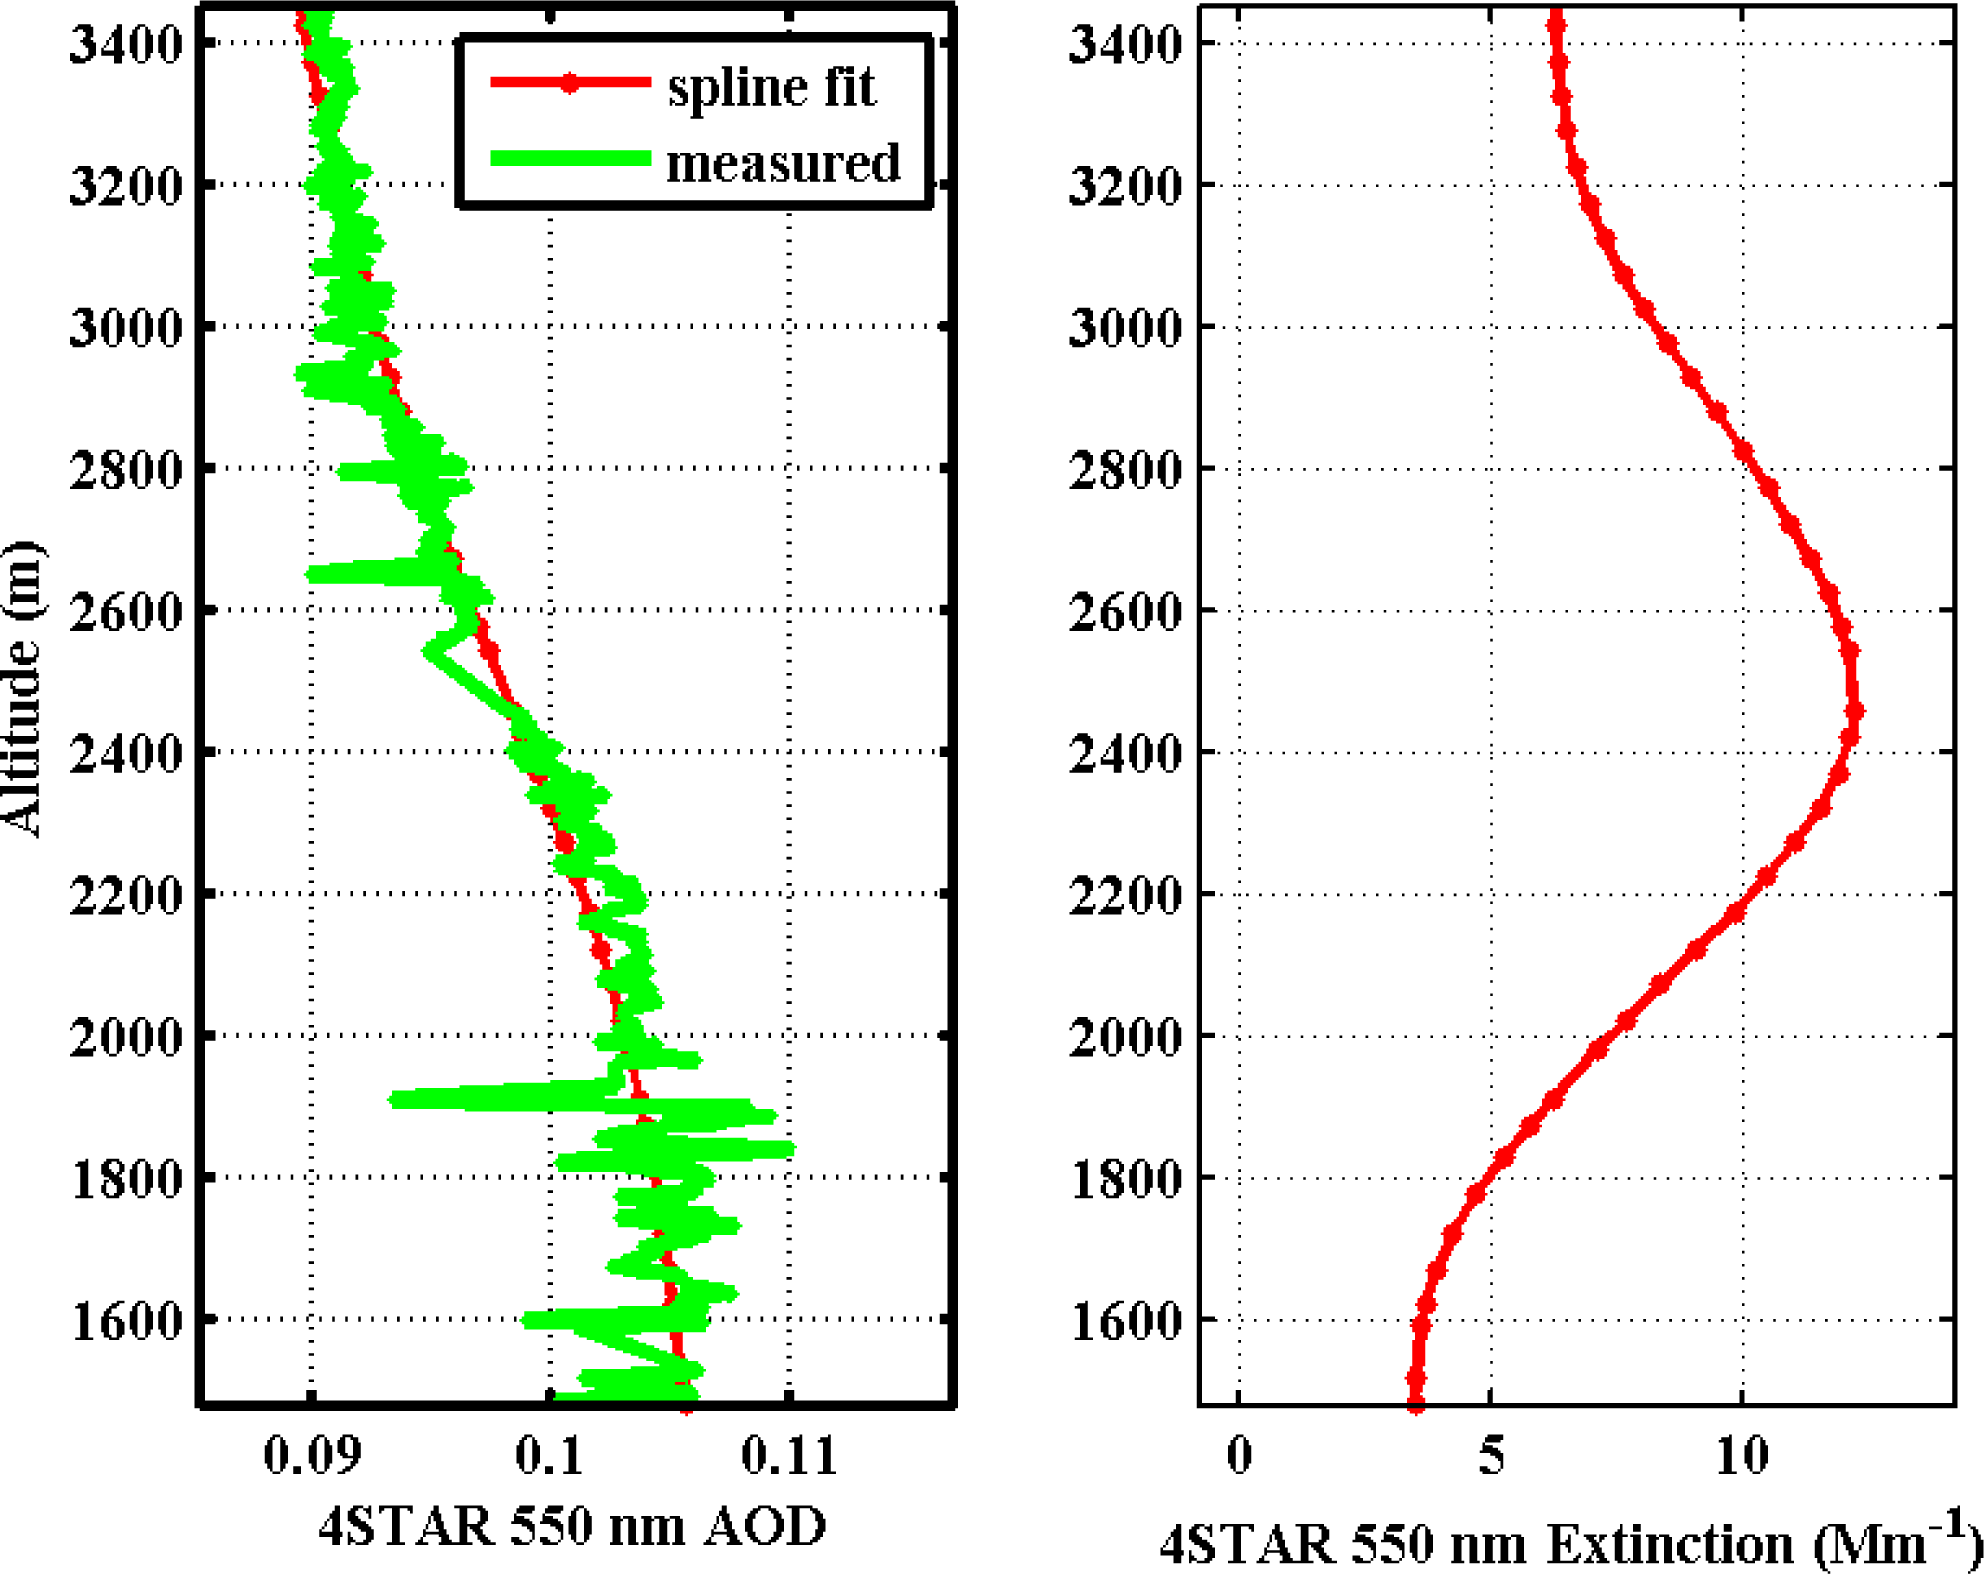
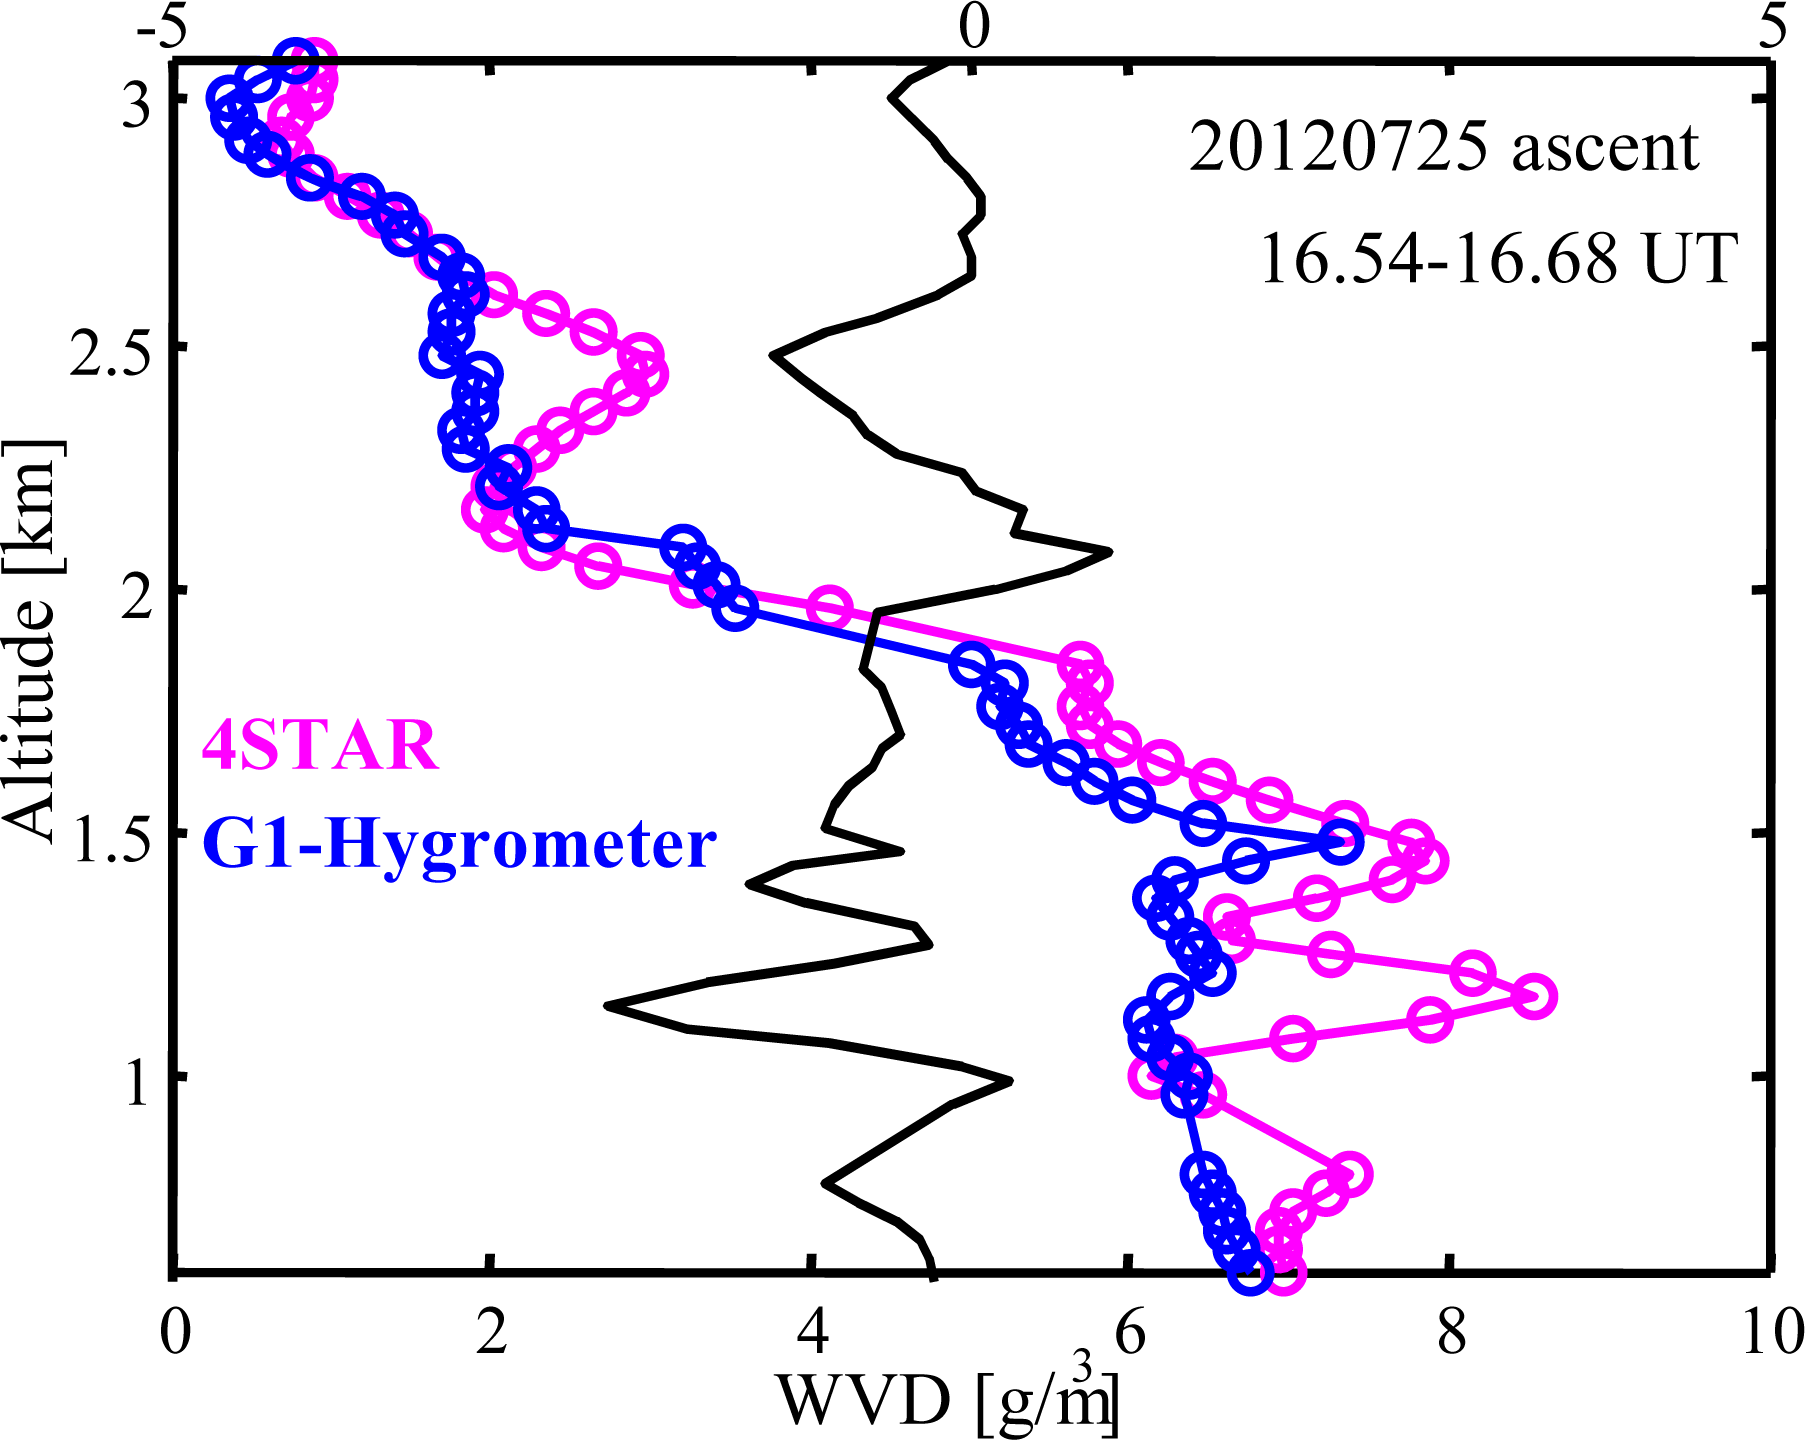
3.8. Flight Testing
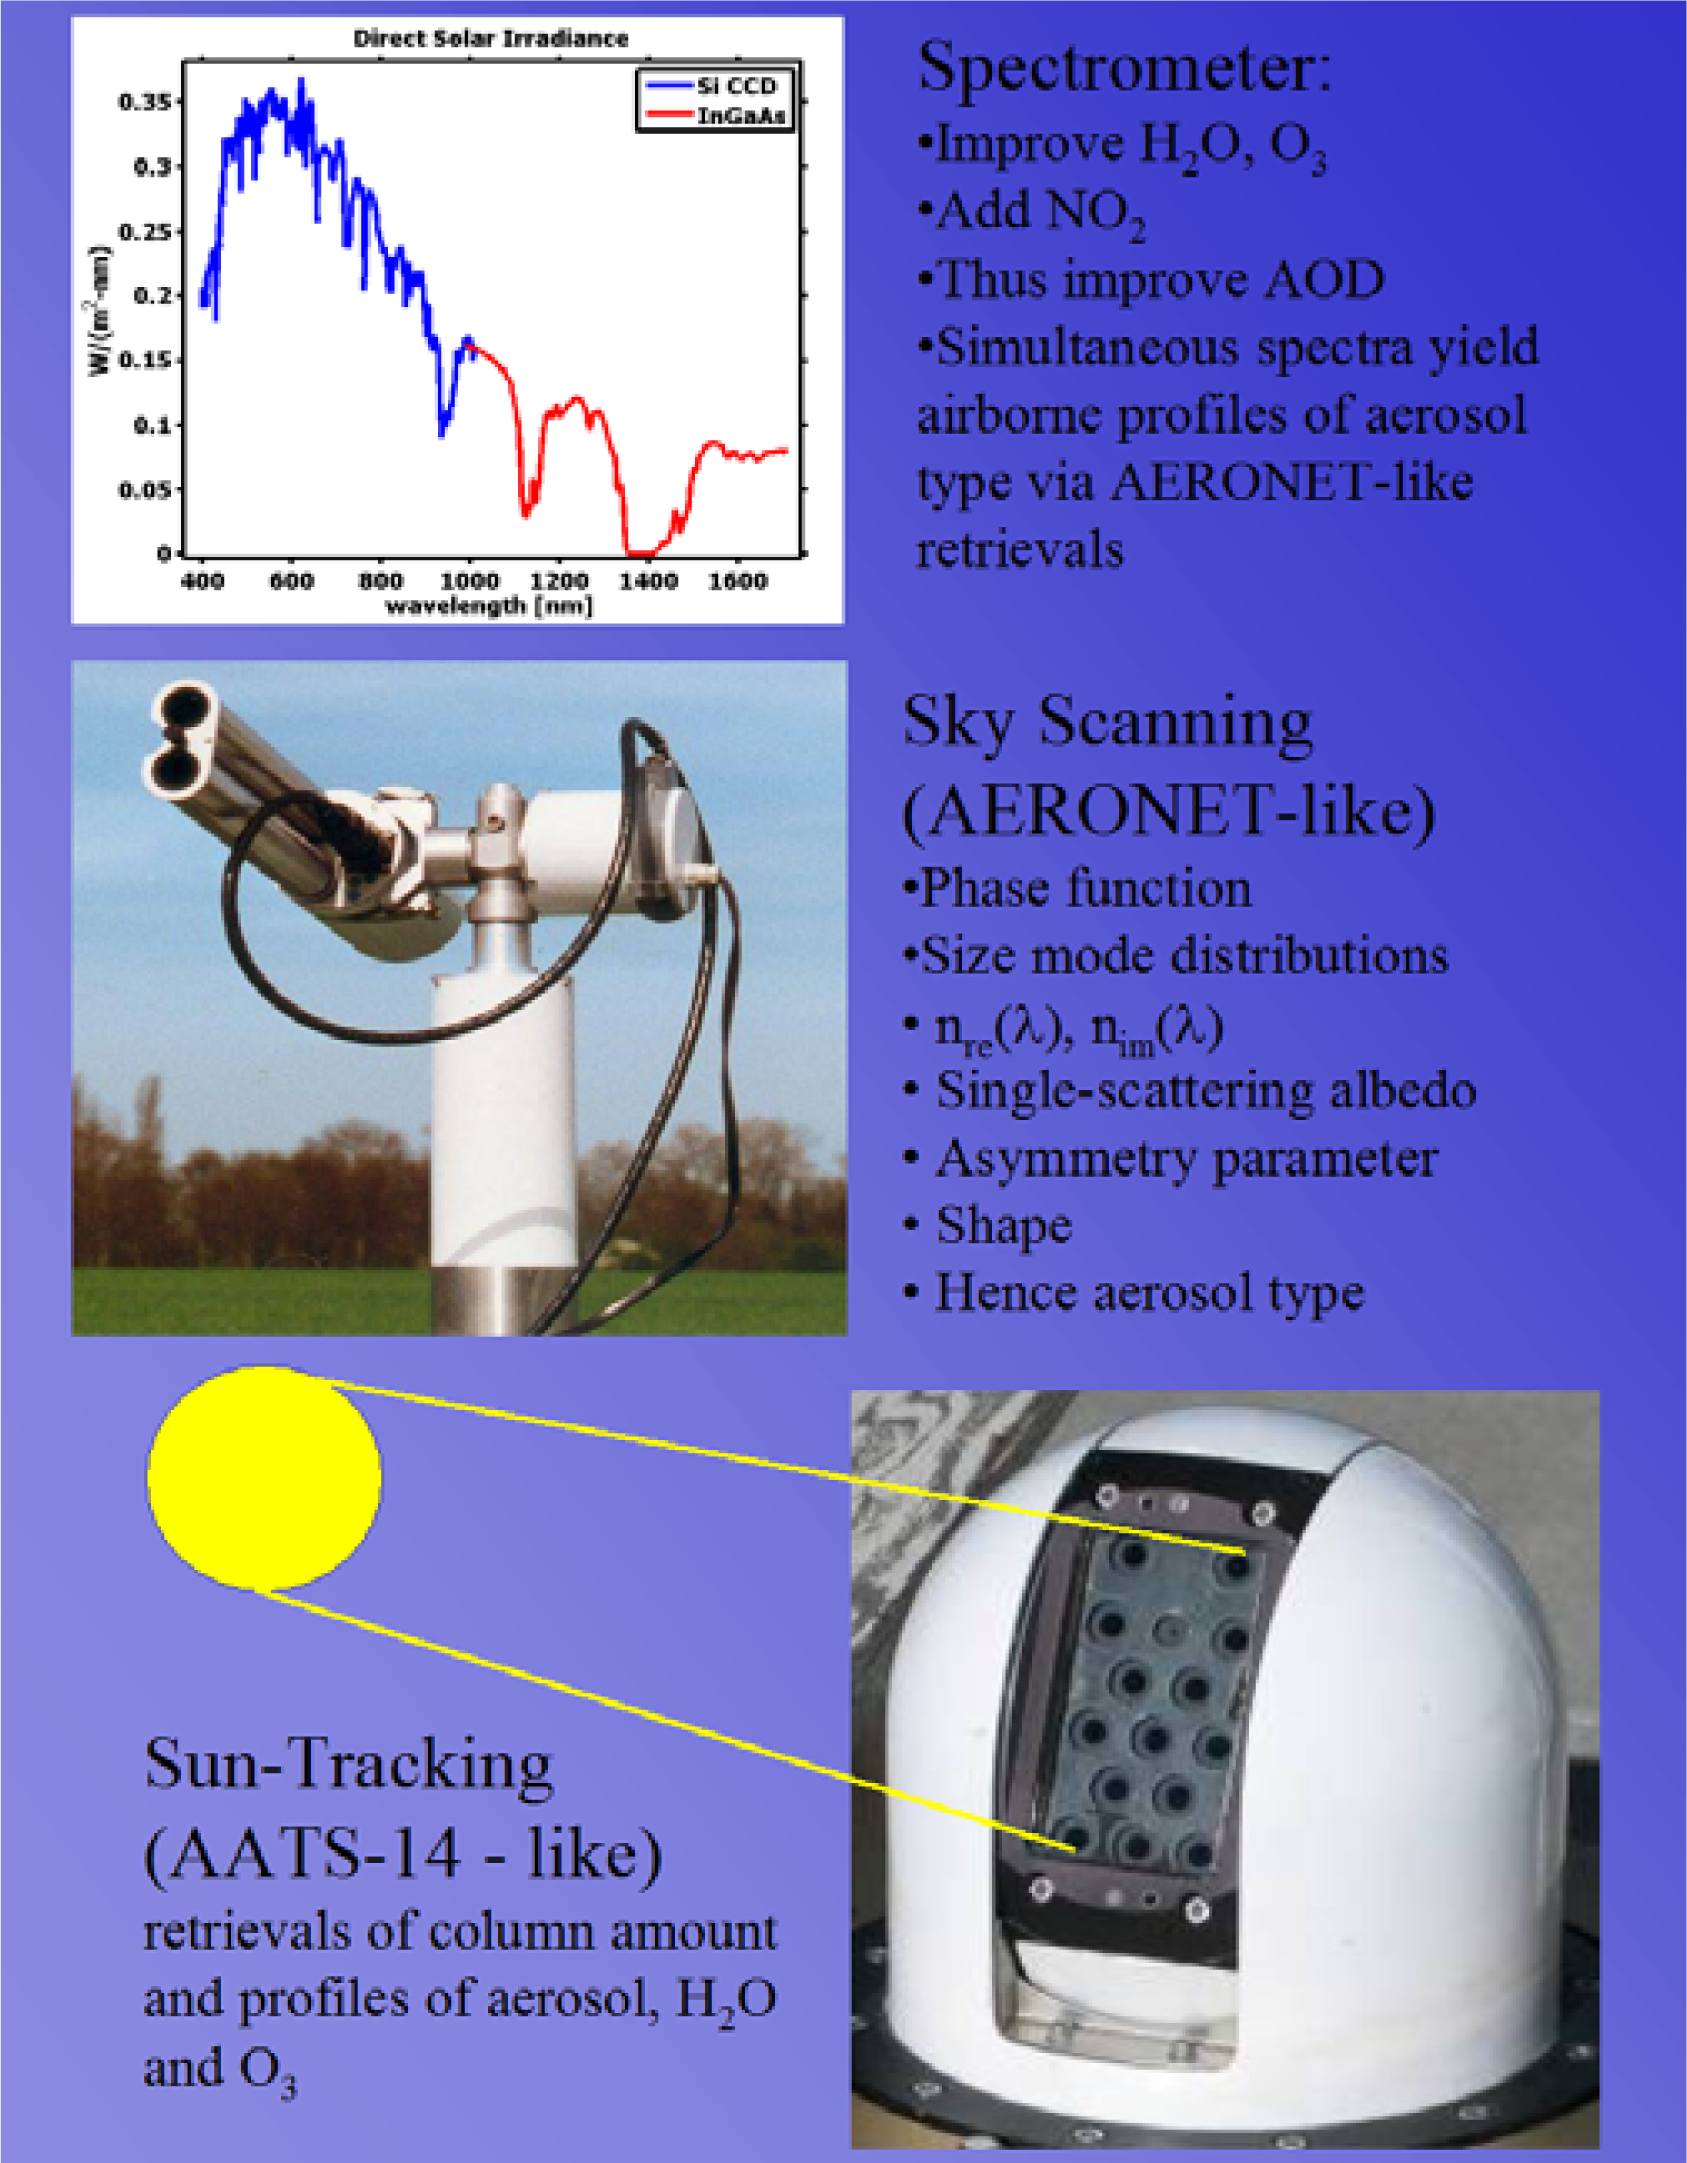
4. Future Work
5. Conclusions
Acknowledgments
Conflict of Interest
References
- Schmid, B.; Redemann, J.; Russell, P.B.; Hobbs, P.V.; Hlavka, D.L.; McGill, M.J.; Holben, B.N.; Welton, E.J.; Campbell, J.R.; Torres, O.; et al. Coordinated airborne, spaceborne, and ground-based measurements of massive, thick aerosol layers during the dry season in southern Africa. J. Geophys. Res 2003. [Google Scholar] [CrossRef]
- Livingston, J.; Schmid, B.; Redemann, J.; Russell, P.B.; Ramirez, S.A.; Eilers, J.; Gore, W.; Howard, S.; Pommier, J.; Fetzer, E.J.; et al. Comparison of water vapor measurements by airborne Sun photometer and near-coincident in situ and satellite sensors during INTEX/ITCT 2004. J. Geophys. Res 2007. [Google Scholar] [CrossRef]
- Livingston, J.M.; Schmid, B.; Russell, P.B.; Eilers, J.; Kolyer, R.W.; Redemann, J.; Ramirez, S.A.; Yee, J.-H.; Swartz, W.H.; Trepte, C.R.; et al. Retrieval of ozone column content from airborne Sun photometer measurements during SOLVE II: Comparison with coincident satellite and aircraft measurements. Atmos. Chem. Phys 2005, 5, 2035–2054. [Google Scholar]
- Russell, P.B.; Livingston, J.M.; Redemann, J.; Schmid, B.; Ramirez, S.A.; Eilers, J.; Khan, R.; Chu, A.; Remer, L.; Quinn, P.K.; et al. Multi-grid-cell validation of satellite aerosol property retrievals in INTEX/ITCT/ICARTT 2004. J. Geophys. Res 2006. [Google Scholar] [CrossRef]
- Schmid, B.; Ferrare, R.; Flynn, C.; Elleman, R.; Covert, D.; Strawa, A.; Welton, E.; Turner, D.; Jonsson, H.; Redemann, J.; et al. How well do state-of-the-art techniques measuring the vertical profile of tropospheric aerosol extinction compare? J. Geophys. Res 2006. [Google Scholar] [CrossRef]
- Shinozuka, Y.; Redemann, J. Horizontal variability of aerosol optical depth observed during the ARCTAS airborne experiment. Atmos. Chem. Phys 2011, 11, 8489–8495. [Google Scholar] [Green Version]
- Shinozuka, Y.; Redemann, J.; Livingston, J.M.; Russell, P.B.; Clarke, A.D.; Howell, S.G.; Freitag, S.; O’Neill, N.T.; Reid, E.A.; Johnson, R.; et al. Airborne observation of aerosol optical depth during ARCTAS: Vertical profiles, inter-comparison and fine-mode fraction. Atmos. Chem. Phys 2011, 11, 3673–3688. [Google Scholar]
- Colarco, P.R.; Toon, O.B.; Reid, J.S.; Livingston, J.M.; Russell, P.B.; Redemann, J.; Schmid, B.; Maring, H.B.; Savoie, D.; Welton, E.J.; et al. Saharan dust transport to the Caribbean during PRIDE: 2. Transport, vertical profiles, and deposition in simulations of in situ and remote sensing observations. J. Geophys. Res 2003. [Google Scholar] [CrossRef]
- Redemann, J.; Zhang, Q.; Schmid, B.; Russell, P.B.; Livingston, J.M.; Jonsson, H.; Remer, L.A. Assessment of MODIS-derived visible and near-IR aerosol optical properties and their spatial variability in the presence of mineral dust. Geophys. Res. Lett 2006. [Google Scholar] [CrossRef]
- Publications from Ames Airborne Tracking Sunphotometers. Available online: http://geo.arc.nasa.gov/sgg/AATS-website/AATS6&14Pubs.pdf (accessed on 28 July 2013).
- Parr, A.; Datla, R.; Gardner, J. Optical Radiometry; Elsevier Science: Philidelphia, PA, USA, 2005; p. 188. [Google Scholar]
- Schmid, B.; Tomlinson, J.M.; Hubbe, J.M.; Comstock, J.M.; Mei, F.; Chand, D.; Pekour, M.S.; Kluzek, C.D.; Andrews, E.; Biraud, S.C.; et al. The DOE ARM aerial facility. Bull. Amer. Meteor. Soc 2013. submitted. [Google Scholar]
- Herman, J.; Cede, A.; Spinei, E.; Mount, G.; Tzortziou, M.; Abuhassan, N. NO2 column amounts from ground-based Pandora and MFDOAS spectrometers using the direct-sun DOAS technique: Intercomparisons and application to OMI validation. J. Geophys. Res 2009, 114, 1–20. [Google Scholar]
- Segal-Rosenheimer, M.; Russell, P.B.; Schmid, B.; Redemann, J.; Livingston, J.M.; Flynn, C.J.; Johnson, R.R.; Dunagan, S.E.; Shinozuka, Y.; Herman, J.; et al. Tracking elevated pollution layers with a newly developed hyperspectral sun/sky sepctrometer (4STAR): Results from TCAP 2012 and 2013 Campaigns. J. Geophys. Res. 2013. in preparation. [Google Scholar]
- Kassianov, E.; Flynn, C.; Redemann, J.; Schmid, B.; Russell, P.B.; Sinyuk, A. Initial assessment of the spectrometer for sky-scanning, sun-tracking atmospheric research (4STAR)-based aerosol retrieval: Sensitivity study. Atmosphere 2012, 3, 495–521. [Google Scholar]
- Schmid, B.; Michalsky, J.; Halthore, R.; Beauharnois, M.; Harrison, L.; Livingston, J.; Russell, P.B.; Holben, B.; Eck, T. Evaluation of the applicability of solar and lamp radiometric calibrations of a precision Sun photometer operating between 300 and 1,025 nm. Appl. Opt 1998, 37, 3923–3941. [Google Scholar]
- Source: Hiss ARC High Output Sphere. Available online: http://spectral.gsfc.nasa.gov/docs/Cal/Other/Hiss/2013/ (accessed on 28 July 2013.).
- Shinozuka, Y.; Johnson, R.R.; Flynn, C.J.; Russell, P.B.; Schmid, B.; Redemann, J.; Dunagan, S.E.; Kluzek, C.D.; Hubbe, J.M.; Segal-Rosenheimer, M.; et al. Hyperspectral aerosol optical depths from TCAP flights. J. Geophys. Res 2013. in preparation. [Google Scholar]
- Fryc, I.; Brown, S.W.; Eppeldauer, G.P.; Ohno, Y. LED-based spectrally tunable source for radiometric, photometric, and colorimetric applications. Opt. Eng 2005, 44, 111309. [Google Scholar]
- Holben, B.N.; Tanré, D.; Smirnov, A.; Eck, T.F.; Slutsker, I.; Abuhassan, N.; Newcomb, W.W.; Schafer, J.S.; Chatenet, B.; Lavenu, F.; et al. An emerging ground-based aerosol climatology: Aerosol optical depth from AERONET. J. Geophys. Res 2001, 106, 12067–12097. [Google Scholar]


| Spectral | Range | Resolution |
| visible/near infrared (VNIR) | 350 to 1,015 nm | 2–3 nm |
| short wave infrared (SWIR) | 900 to 1,700 nm | 5–10 nm |
| Angular Sampling | Range | FOV |
| Direct solar beam | full hemisphere | 1.25 deg |
| sky light | full hemisphere | 2 deg |
| Pointing Control | Range | Accuracy |
| elevation | 0 to 180 degrees | 0.2 deg |
| azimuth | many revolutions | 0.2 deg |
| Signal Amplitude | ||
| Dynamic range | 10^4 | |
| Repeatability | <1.0% over 6 months | |
| Operational | ||
| space (time)* to acquire direct beam data | 100 m | |
| space (time)* to acquire sky scan data | 10,000 m | |
| aircraft pitch, roll, and yaw rate tracking limits | 6 deg/s | |
| aircraft climb and bank angle limits | 25 deg | |
| altitude ceiling | 12,500 m | |
| Lamp | Spectrometer | |||
|---|---|---|---|---|
| Gas | Wave-Length | Measured Column | From Mfg. | From GSFC Calibration |
| VNIR Spectrometer | ||||
| Hg | 365.18 | 239.71 | 365.27 | 365.23 |
| Hg | 404.66 | 288.60 | 404.74 | 404.21 |
| Hg | 435.83 | 327.24 | 435.88 | 435.88 |
| Hg | 546.07 | 464.62 | 546.15 | 546.33 |
| Ar | 696.54 | 654.00 | 696.61 | 696.56 |
| Ar | 763.51 | 739.00 | 763.41 | 763.16 |
| Kr | 811.29 | 800.02 | 811.04 | 811.07 |
| Ar | 912.30 | 931.00 | 912.24 | 912.58 |
| Ar | 965.78 | 1001.40 | 966.00 | 965.37 |
| SWIR Spectrometer | ||||
| Kr | 1145.75 | 419.16 | 1144.54 | NA |
| Kr | 1220.45 | 365.22 | 1219.42 | NA |
| Kr | 1317.74 | 295.21 | 1317.04 | NA |
| Cd | 1448.70 | 200.47 | 1447.68 | NA |
| Cd | 1570.80 | 107.71 | 1570.98 | NA |
© 2013 by the authors; licensee MDPI, Basel, Switzerland This article is an open access article distributed under the terms and conditions of the Creative Commons Attribution license ( http://creativecommons.org/licenses/by/3.0/).
Share and Cite
Dunagan, S.E.; Johnson, R.; Zavaleta, J.; Russell, P.B.; Schmid, B.; Flynn, C.; Redemann, J.; Shinozuka, Y.; Livingston, J.; Segal-Rosenhaimer, M. Spectrometer for Sky-Scanning Sun-Tracking Atmospheric Research (4STAR): Instrument Technology. Remote Sens. 2013, 5, 3872-3895. https://doi.org/10.3390/rs5083872
Dunagan SE, Johnson R, Zavaleta J, Russell PB, Schmid B, Flynn C, Redemann J, Shinozuka Y, Livingston J, Segal-Rosenhaimer M. Spectrometer for Sky-Scanning Sun-Tracking Atmospheric Research (4STAR): Instrument Technology. Remote Sensing. 2013; 5(8):3872-3895. https://doi.org/10.3390/rs5083872
Chicago/Turabian StyleDunagan, Stephen E., Roy Johnson, Jhony Zavaleta, Philip B. Russell, Beat Schmid, Connor Flynn, Jens Redemann, Yohei Shinozuka, John Livingston, and Michal Segal-Rosenhaimer. 2013. "Spectrometer for Sky-Scanning Sun-Tracking Atmospheric Research (4STAR): Instrument Technology" Remote Sensing 5, no. 8: 3872-3895. https://doi.org/10.3390/rs5083872
APA StyleDunagan, S. E., Johnson, R., Zavaleta, J., Russell, P. B., Schmid, B., Flynn, C., Redemann, J., Shinozuka, Y., Livingston, J., & Segal-Rosenhaimer, M. (2013). Spectrometer for Sky-Scanning Sun-Tracking Atmospheric Research (4STAR): Instrument Technology. Remote Sensing, 5(8), 3872-3895. https://doi.org/10.3390/rs5083872