Land Cover Change Monitoring Using Landsat MSS/TM Satellite Image Data over West Africa between 1975 and 1990

Abstract
:1. Introduction
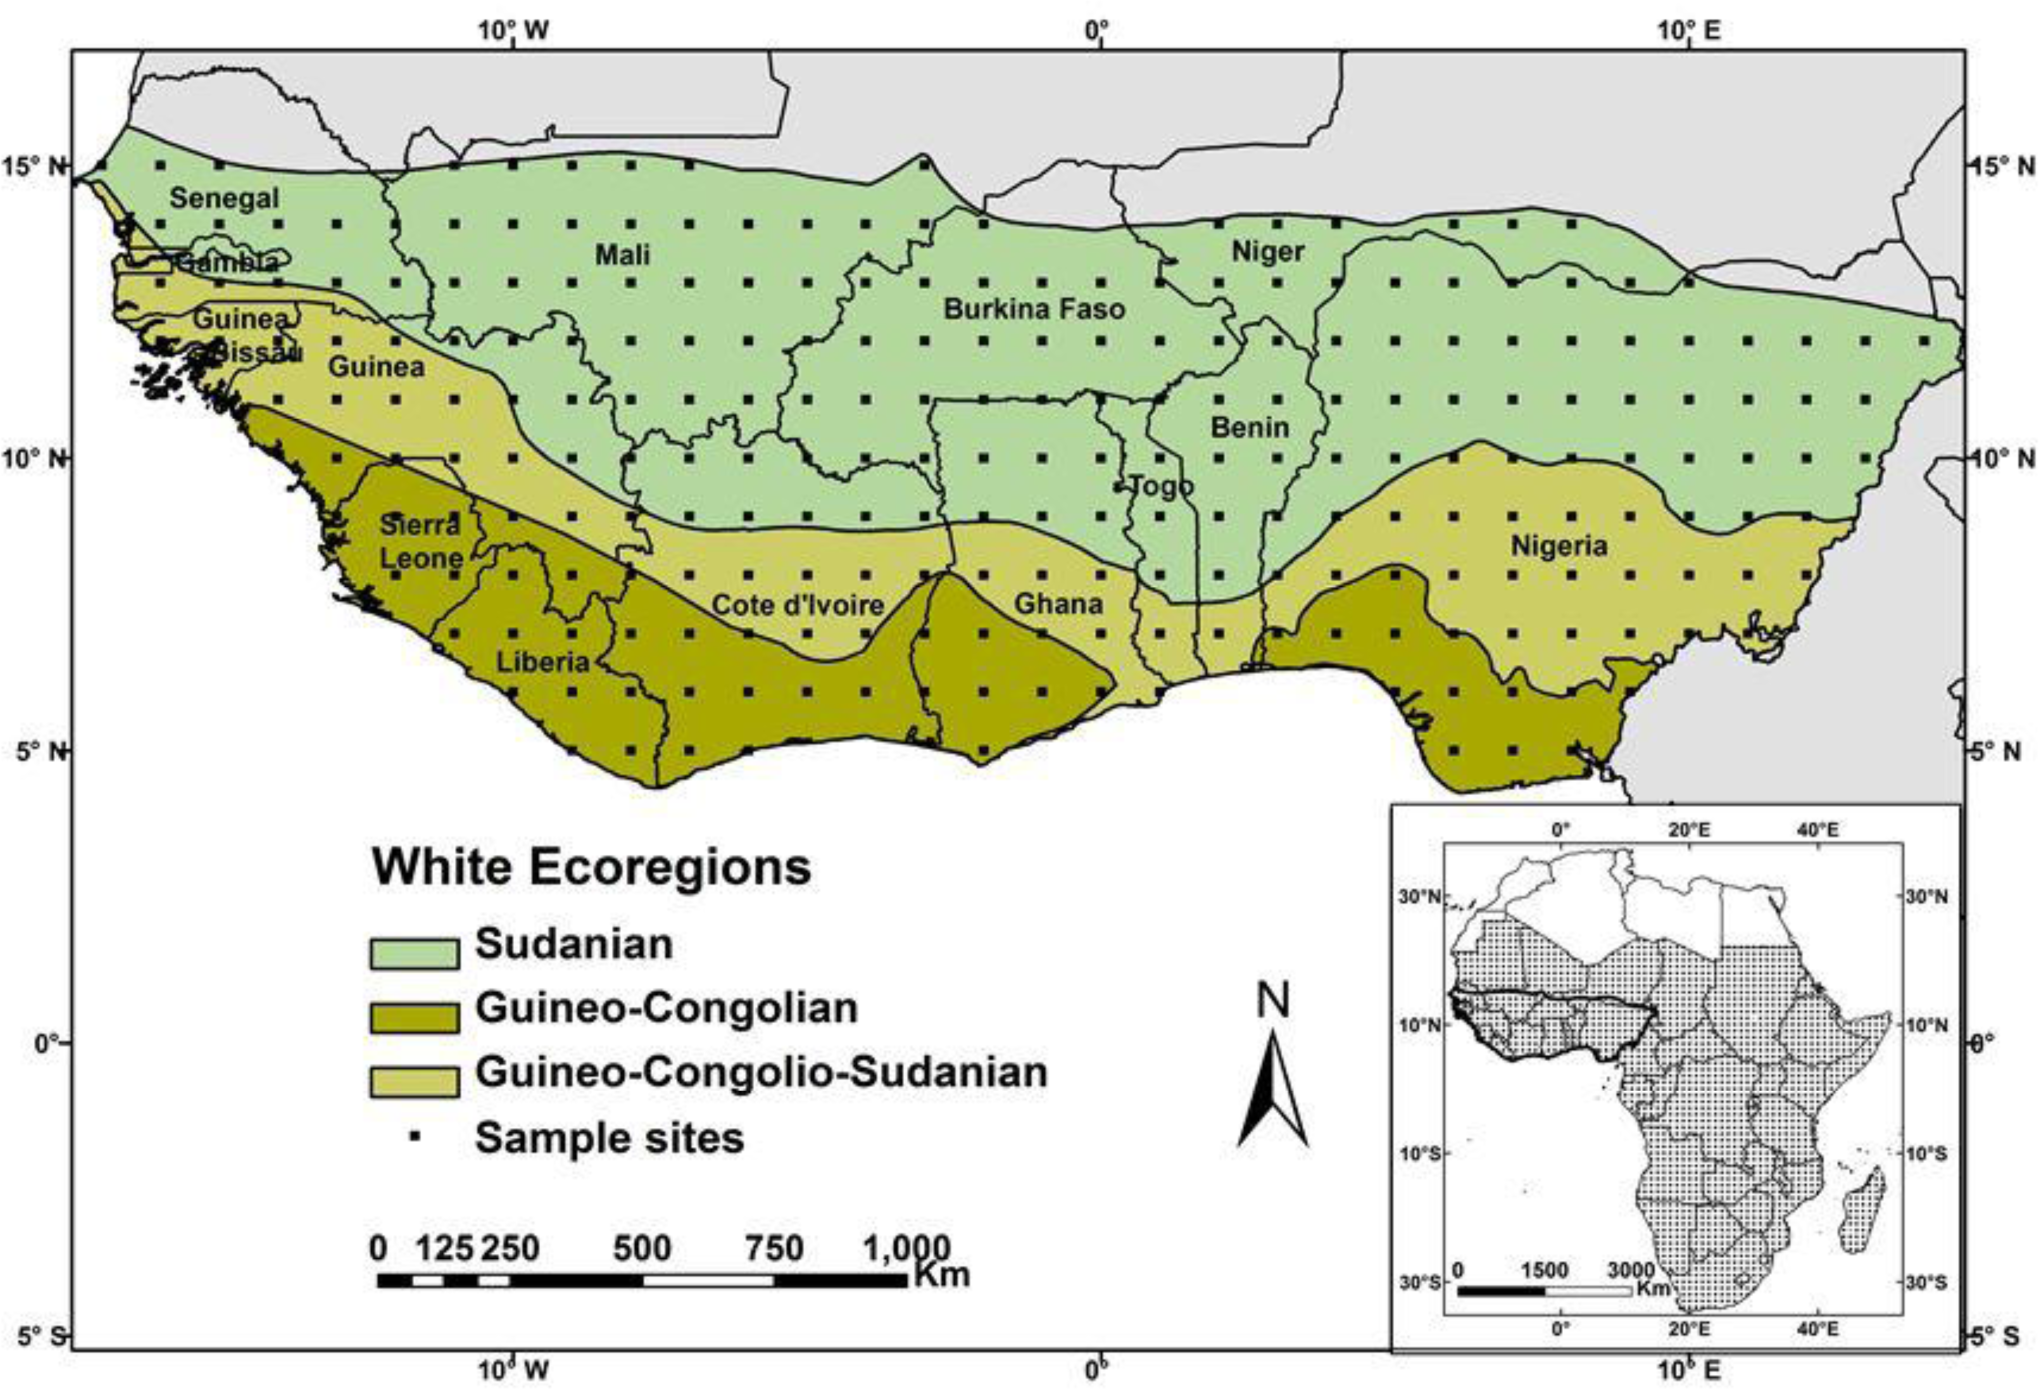
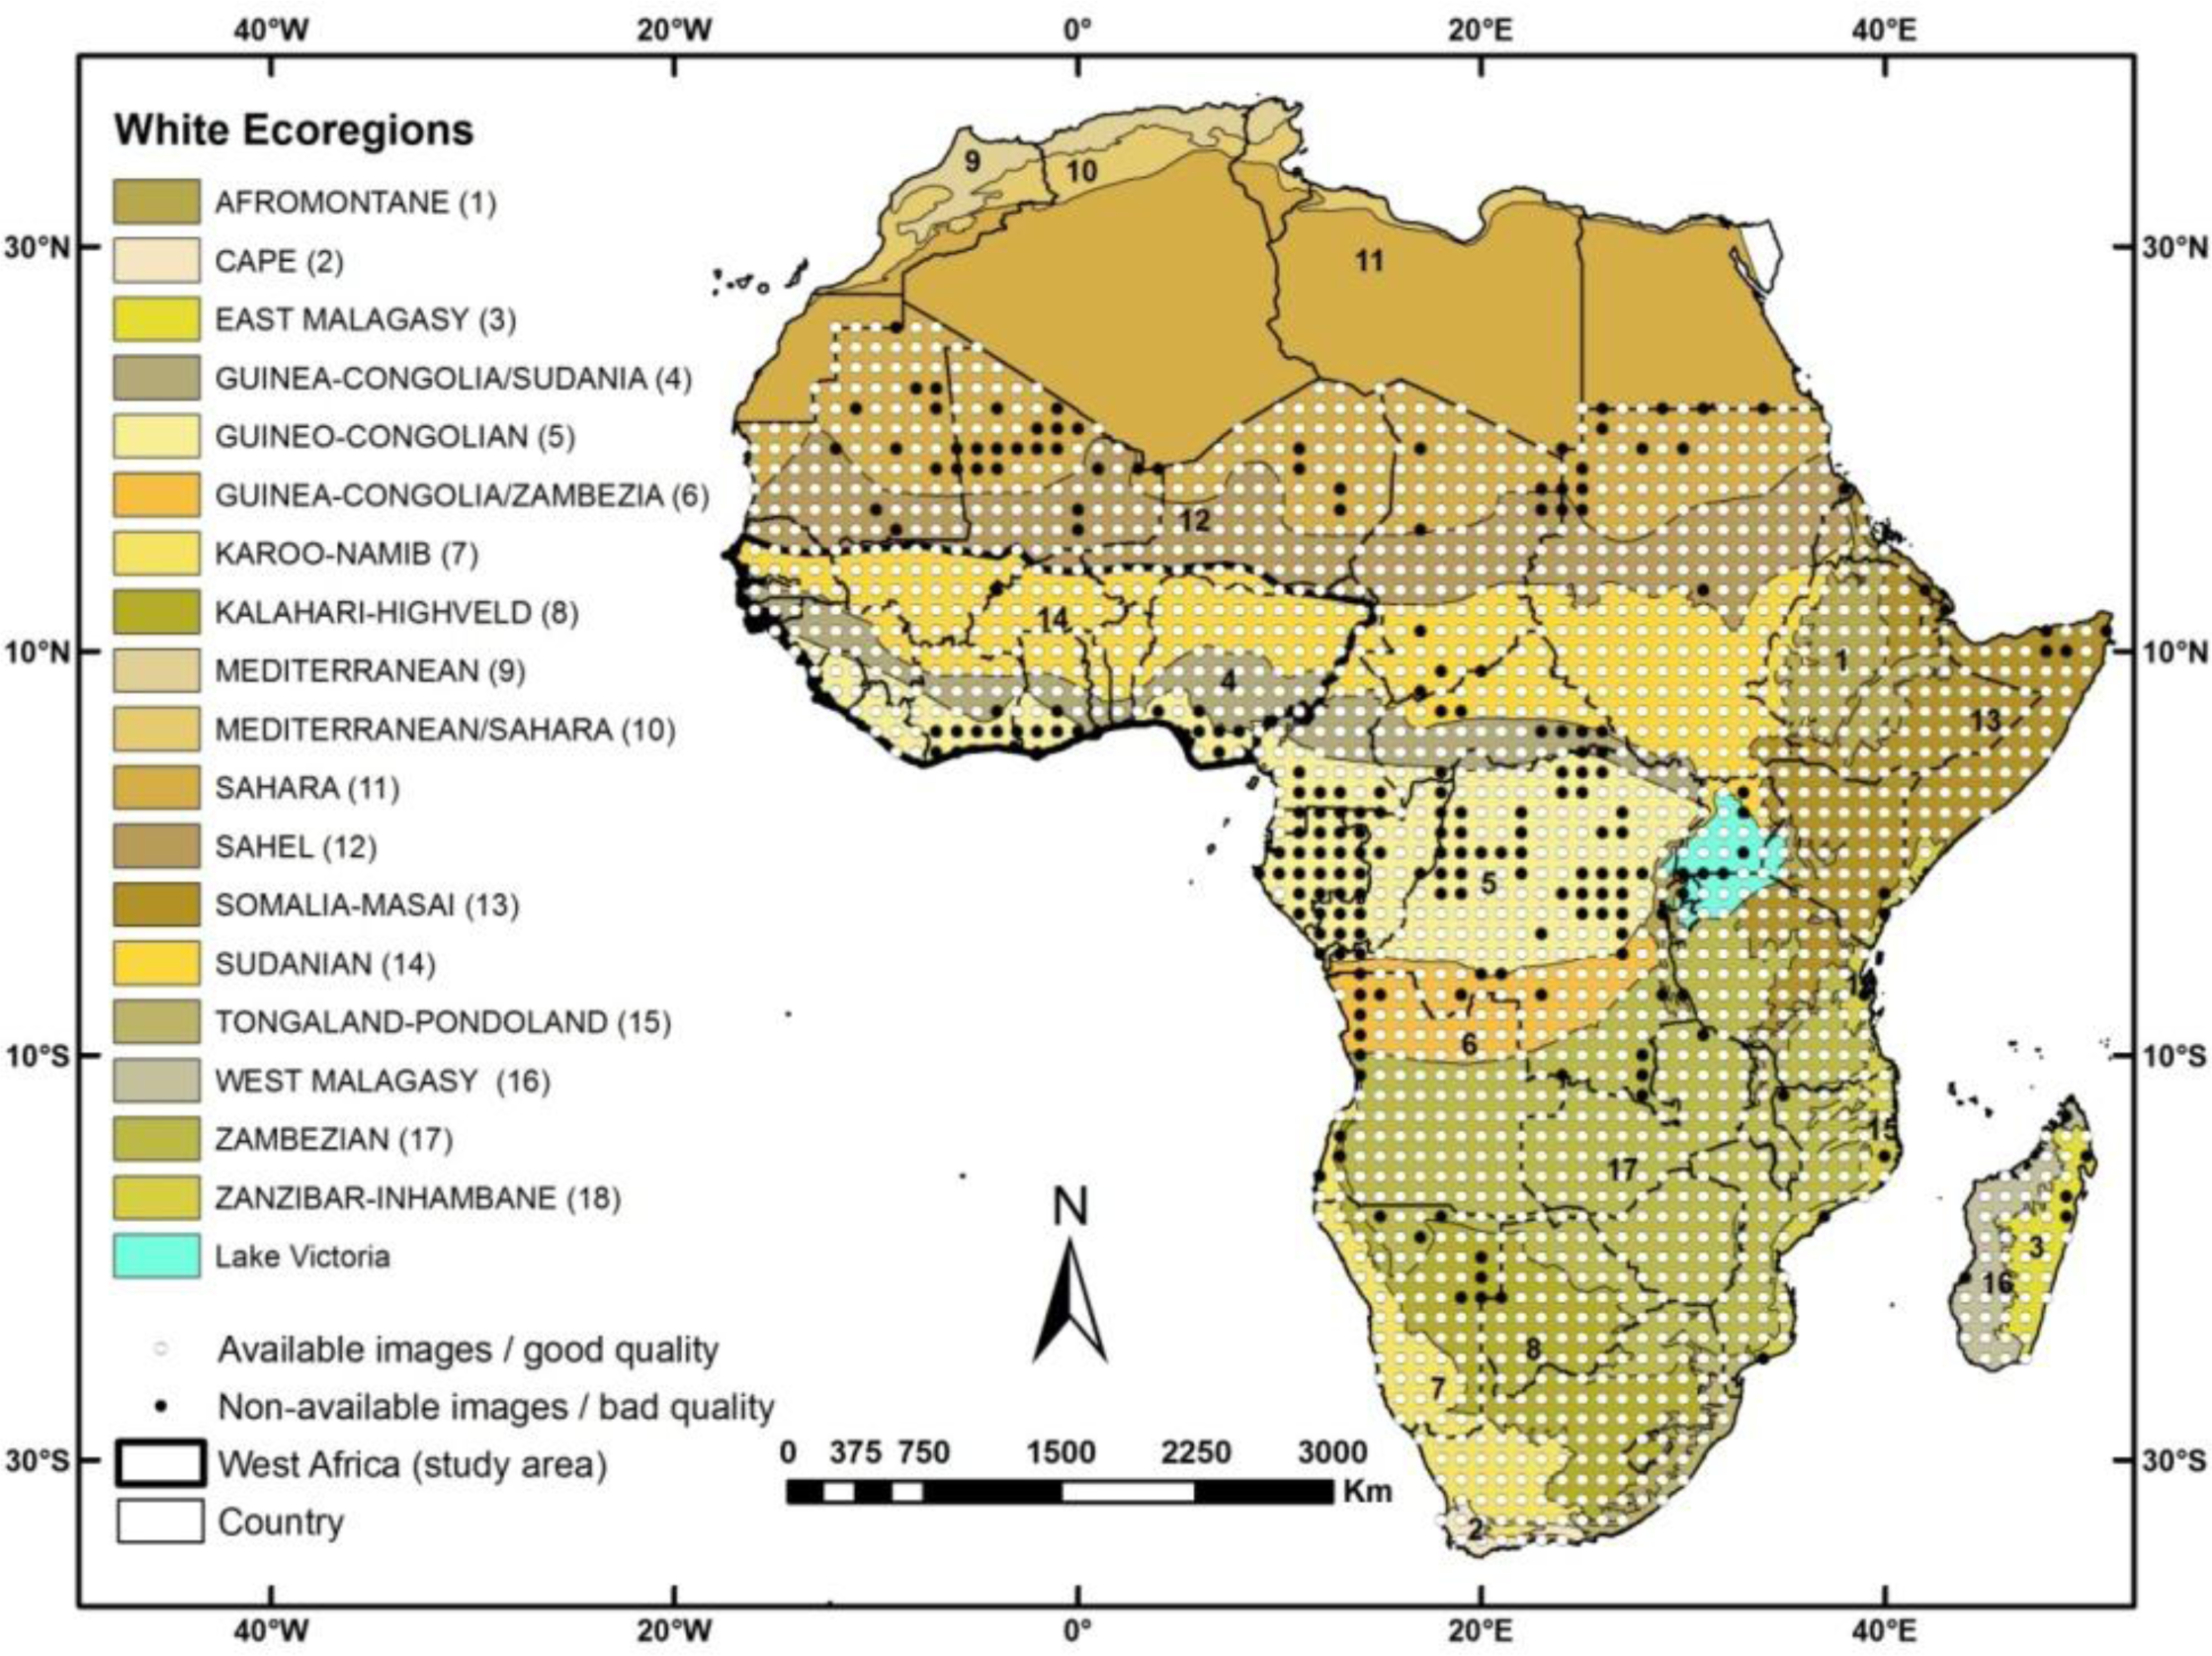
2. Study Area
3. Materials and Methods
3.1. Data Sources and Preparation
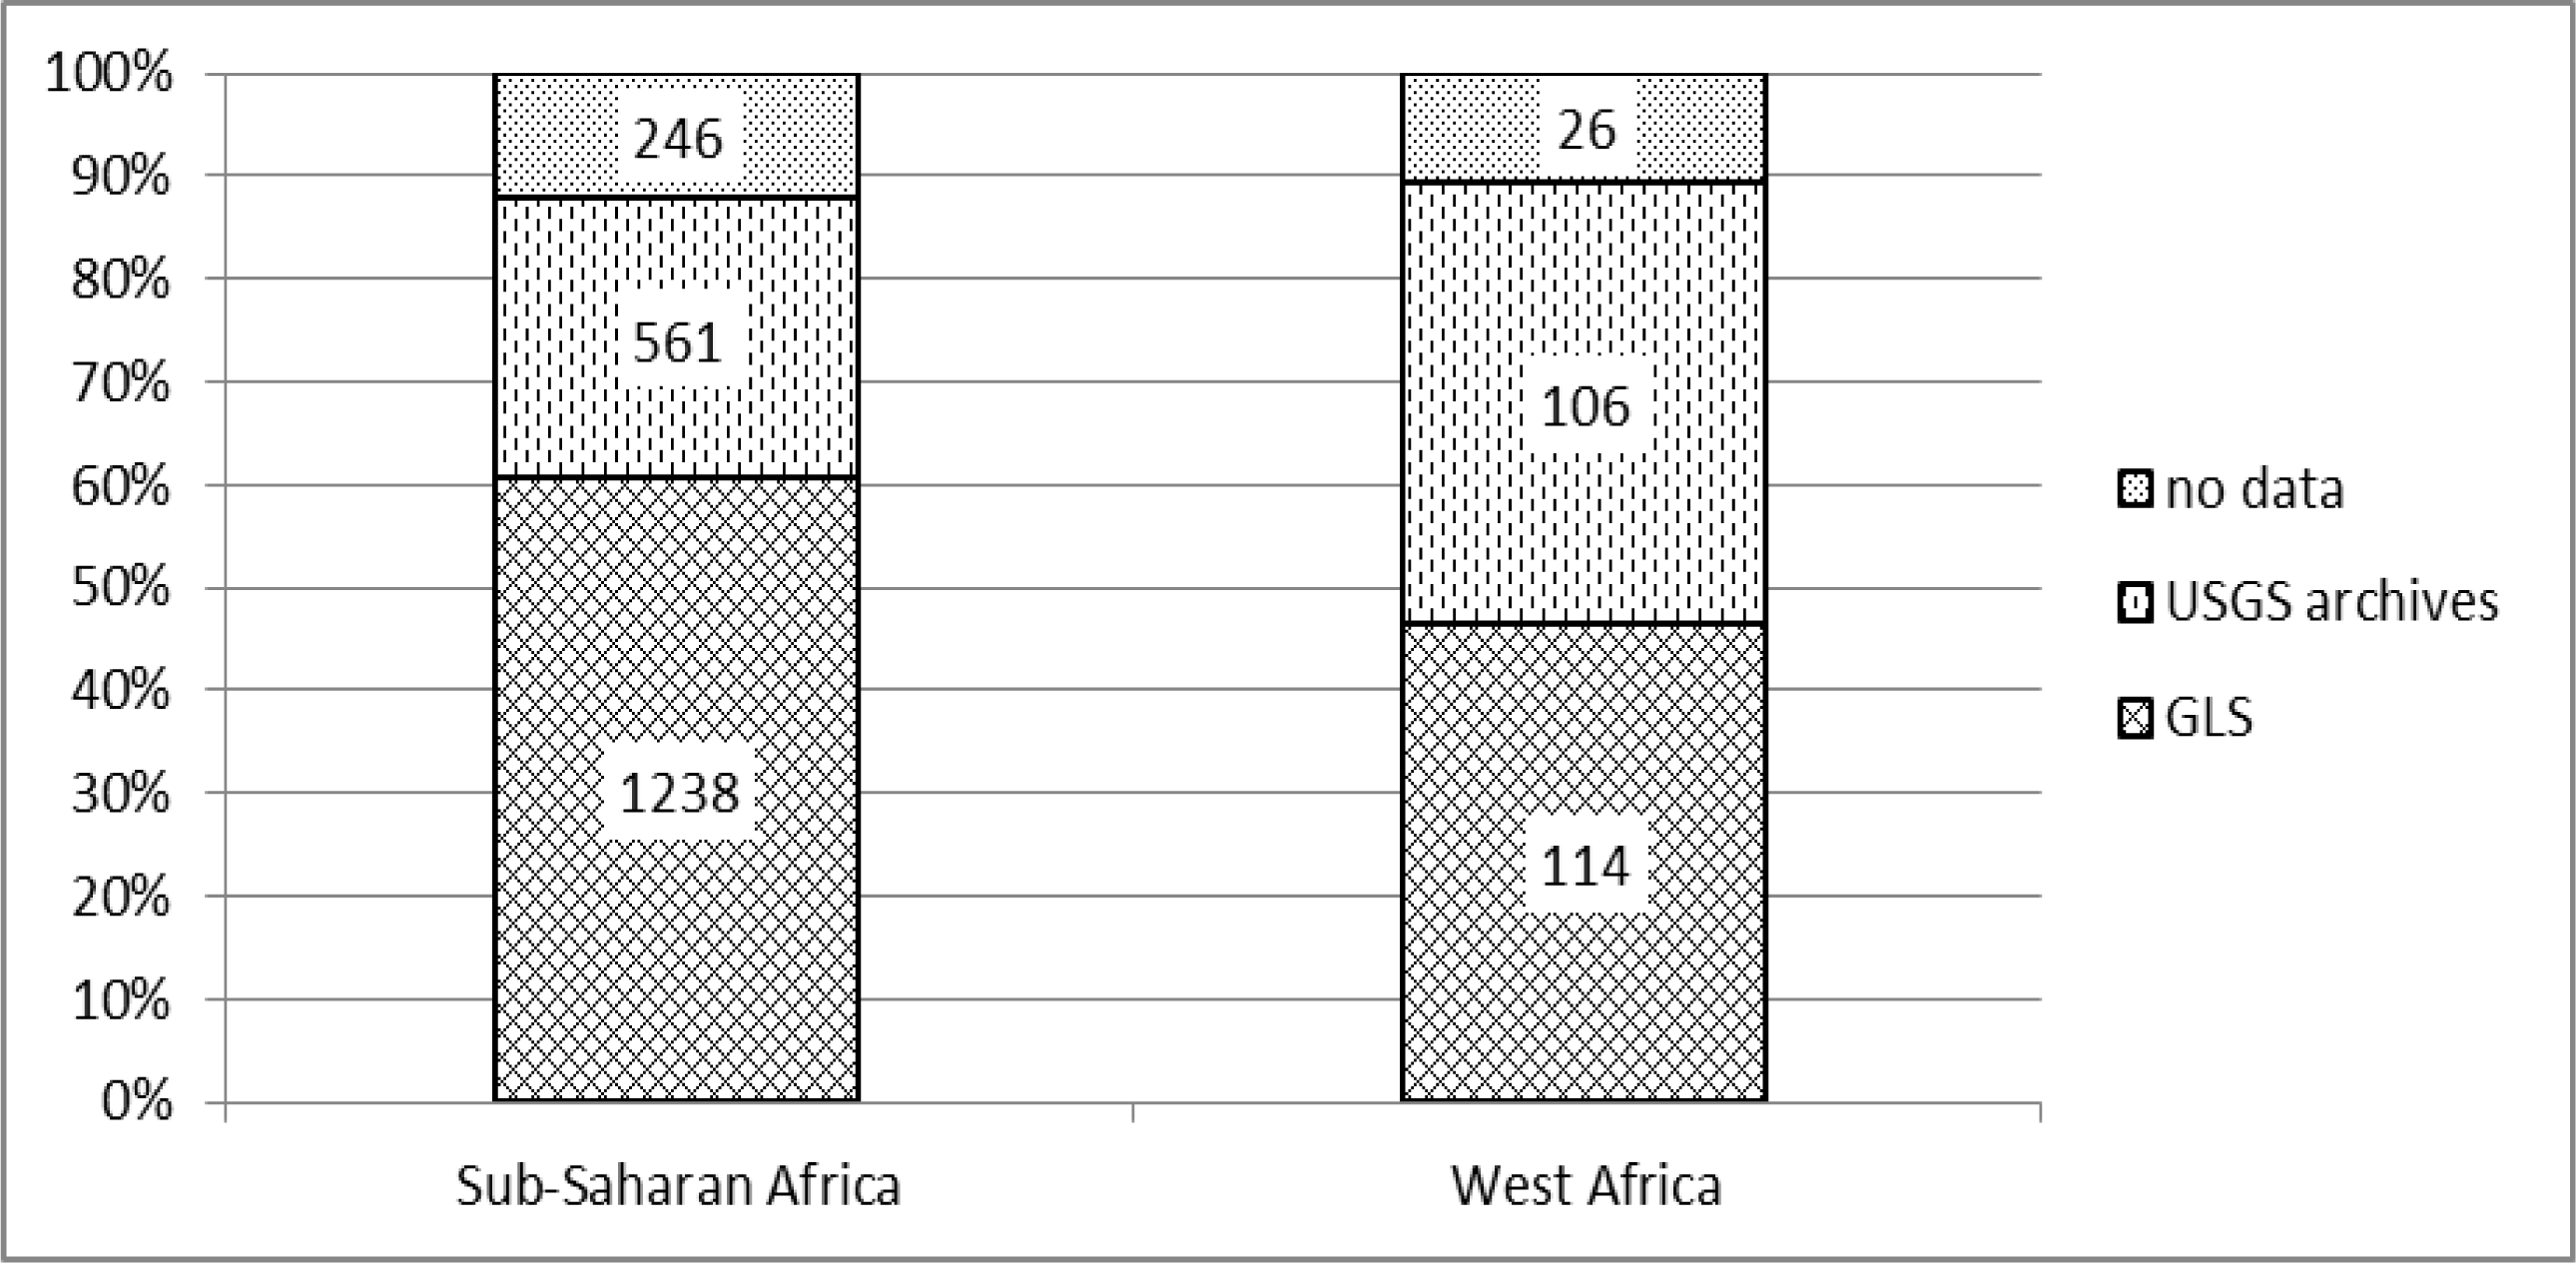
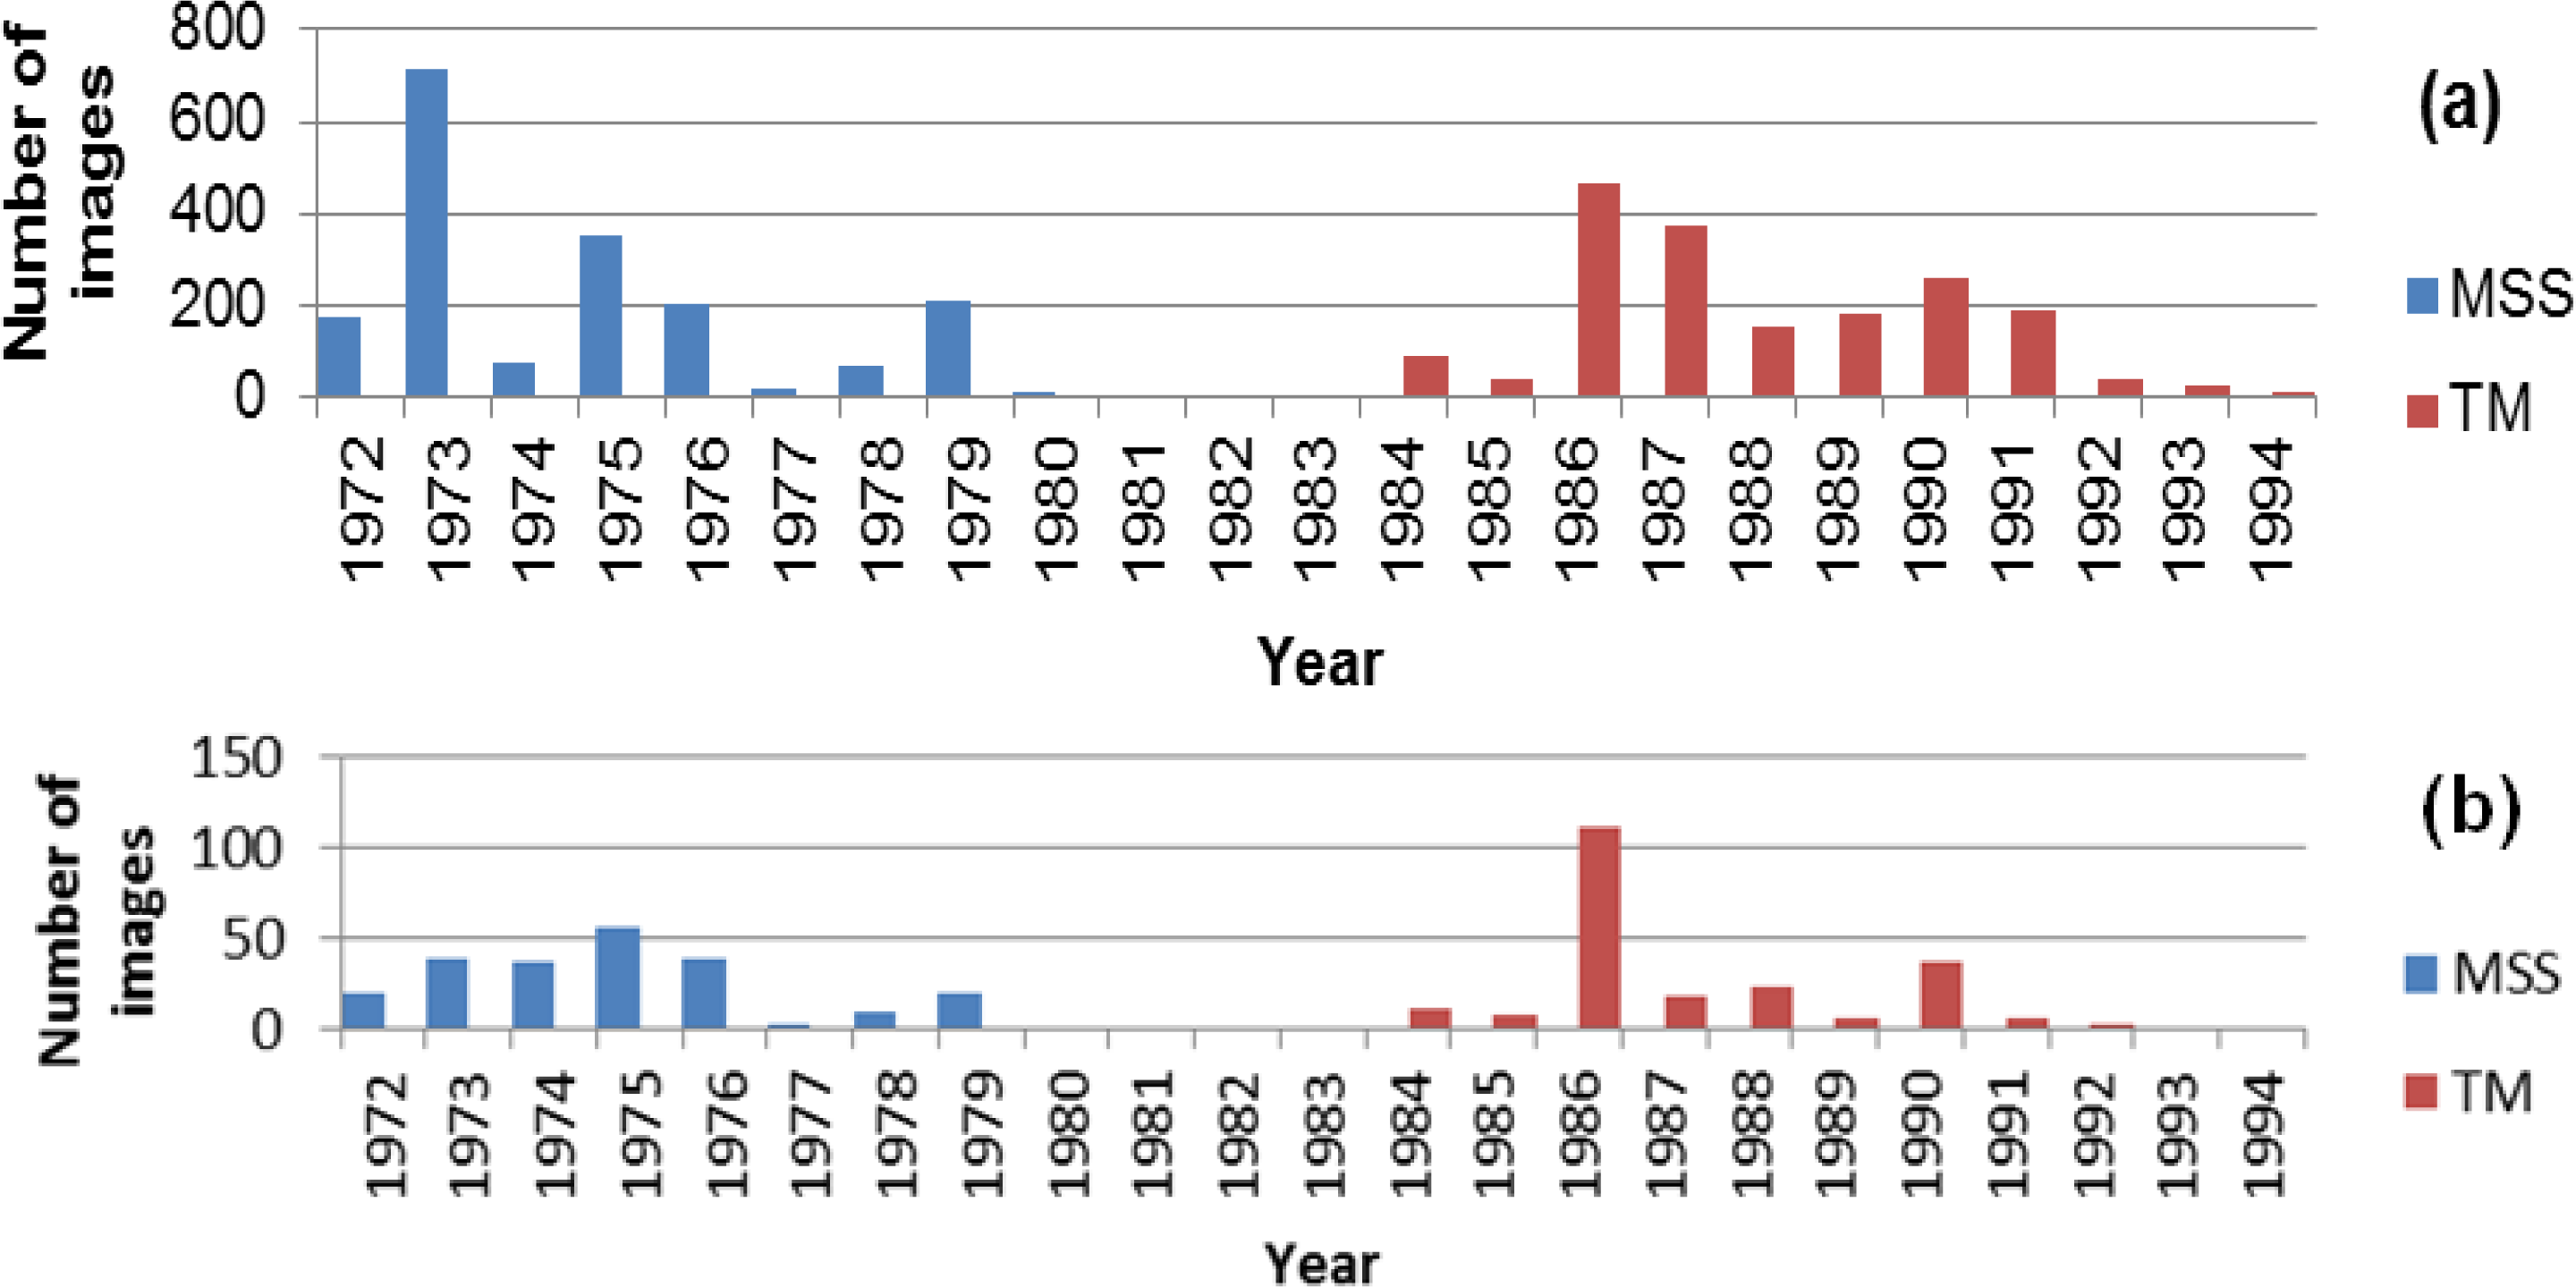
3.1.1. Satellite Image Data Sources
3.1.2. Sampling Strategy
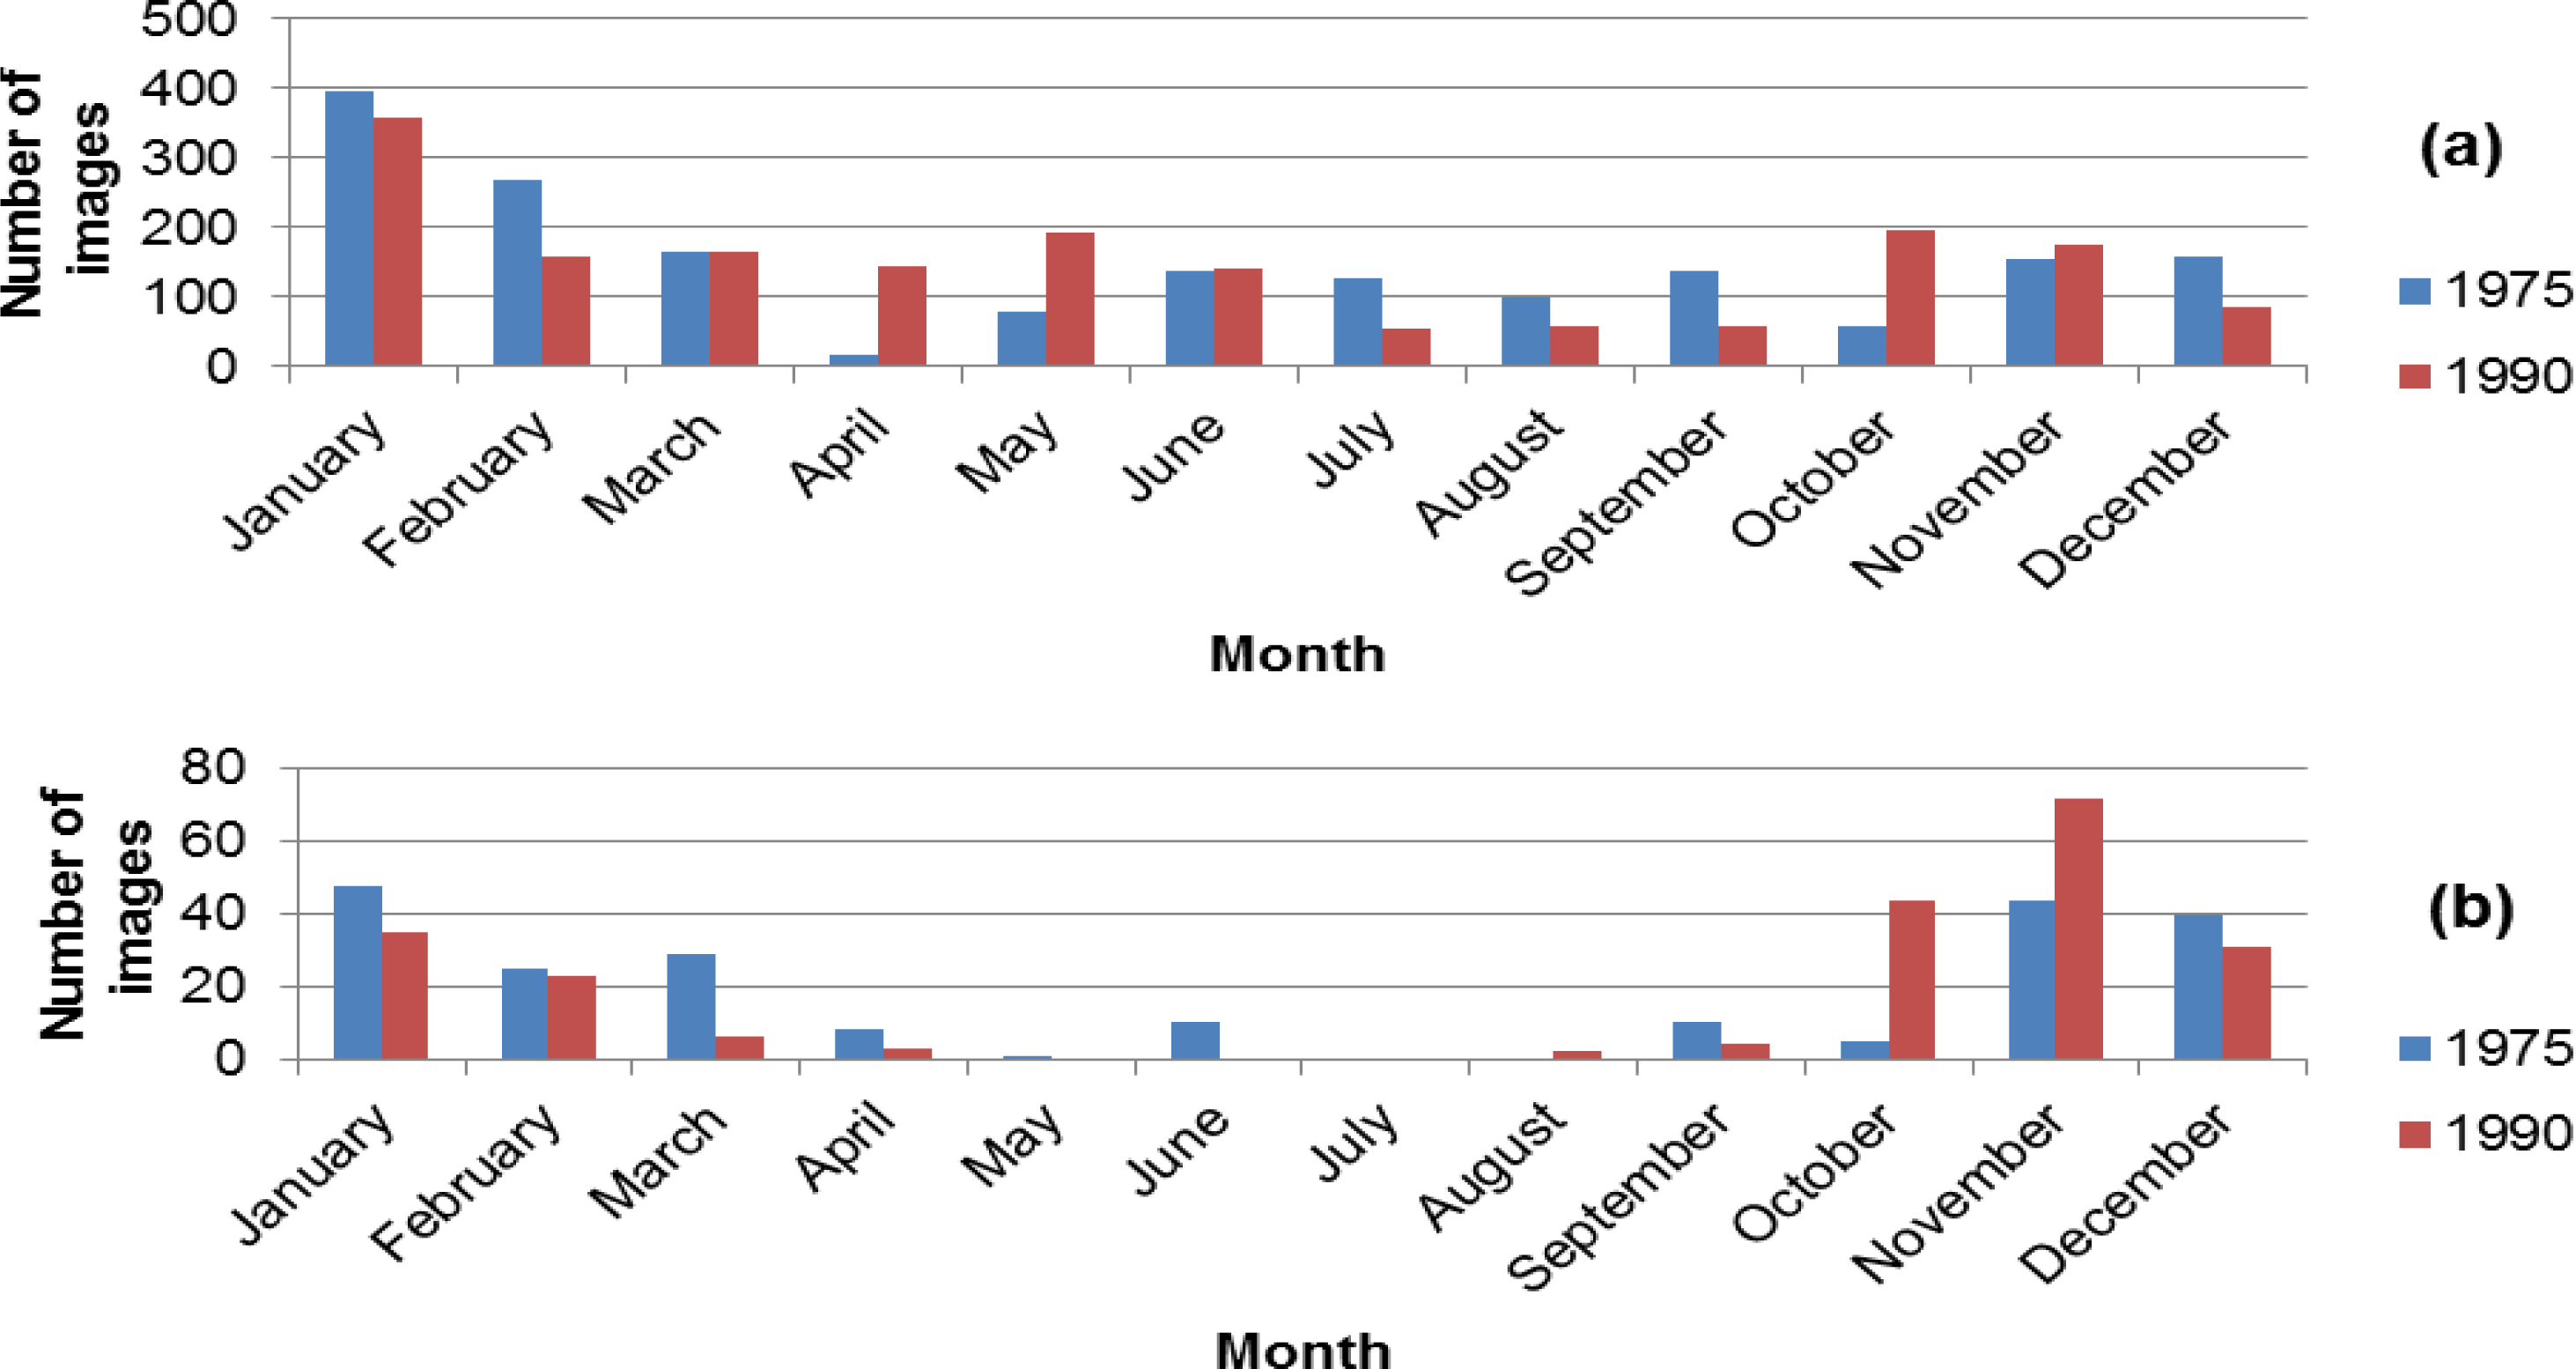
3.1.3. Dedicated Image Selection for Land Cover Change Assessment in West Africa
3.2. Methodology
3.2.1. Pre-Processing
3.2.2. Land Cover Classification and Change Detection Procedures
- - Tree Cover (≥70% of tree cover);
- - Tree Cover Mosaic (70%–30% of tree cover);
- - Other Wooded Land (≥70% of other wooded land);
- - Other Vegetation Cover (including areas of bare ground);
- - Inland Water (≥50% of water and previous criteria do not apply).
3.2.3. Derivation of Land Cover Change Statistics
4. Results
4.1. Land Cover Status in 1975
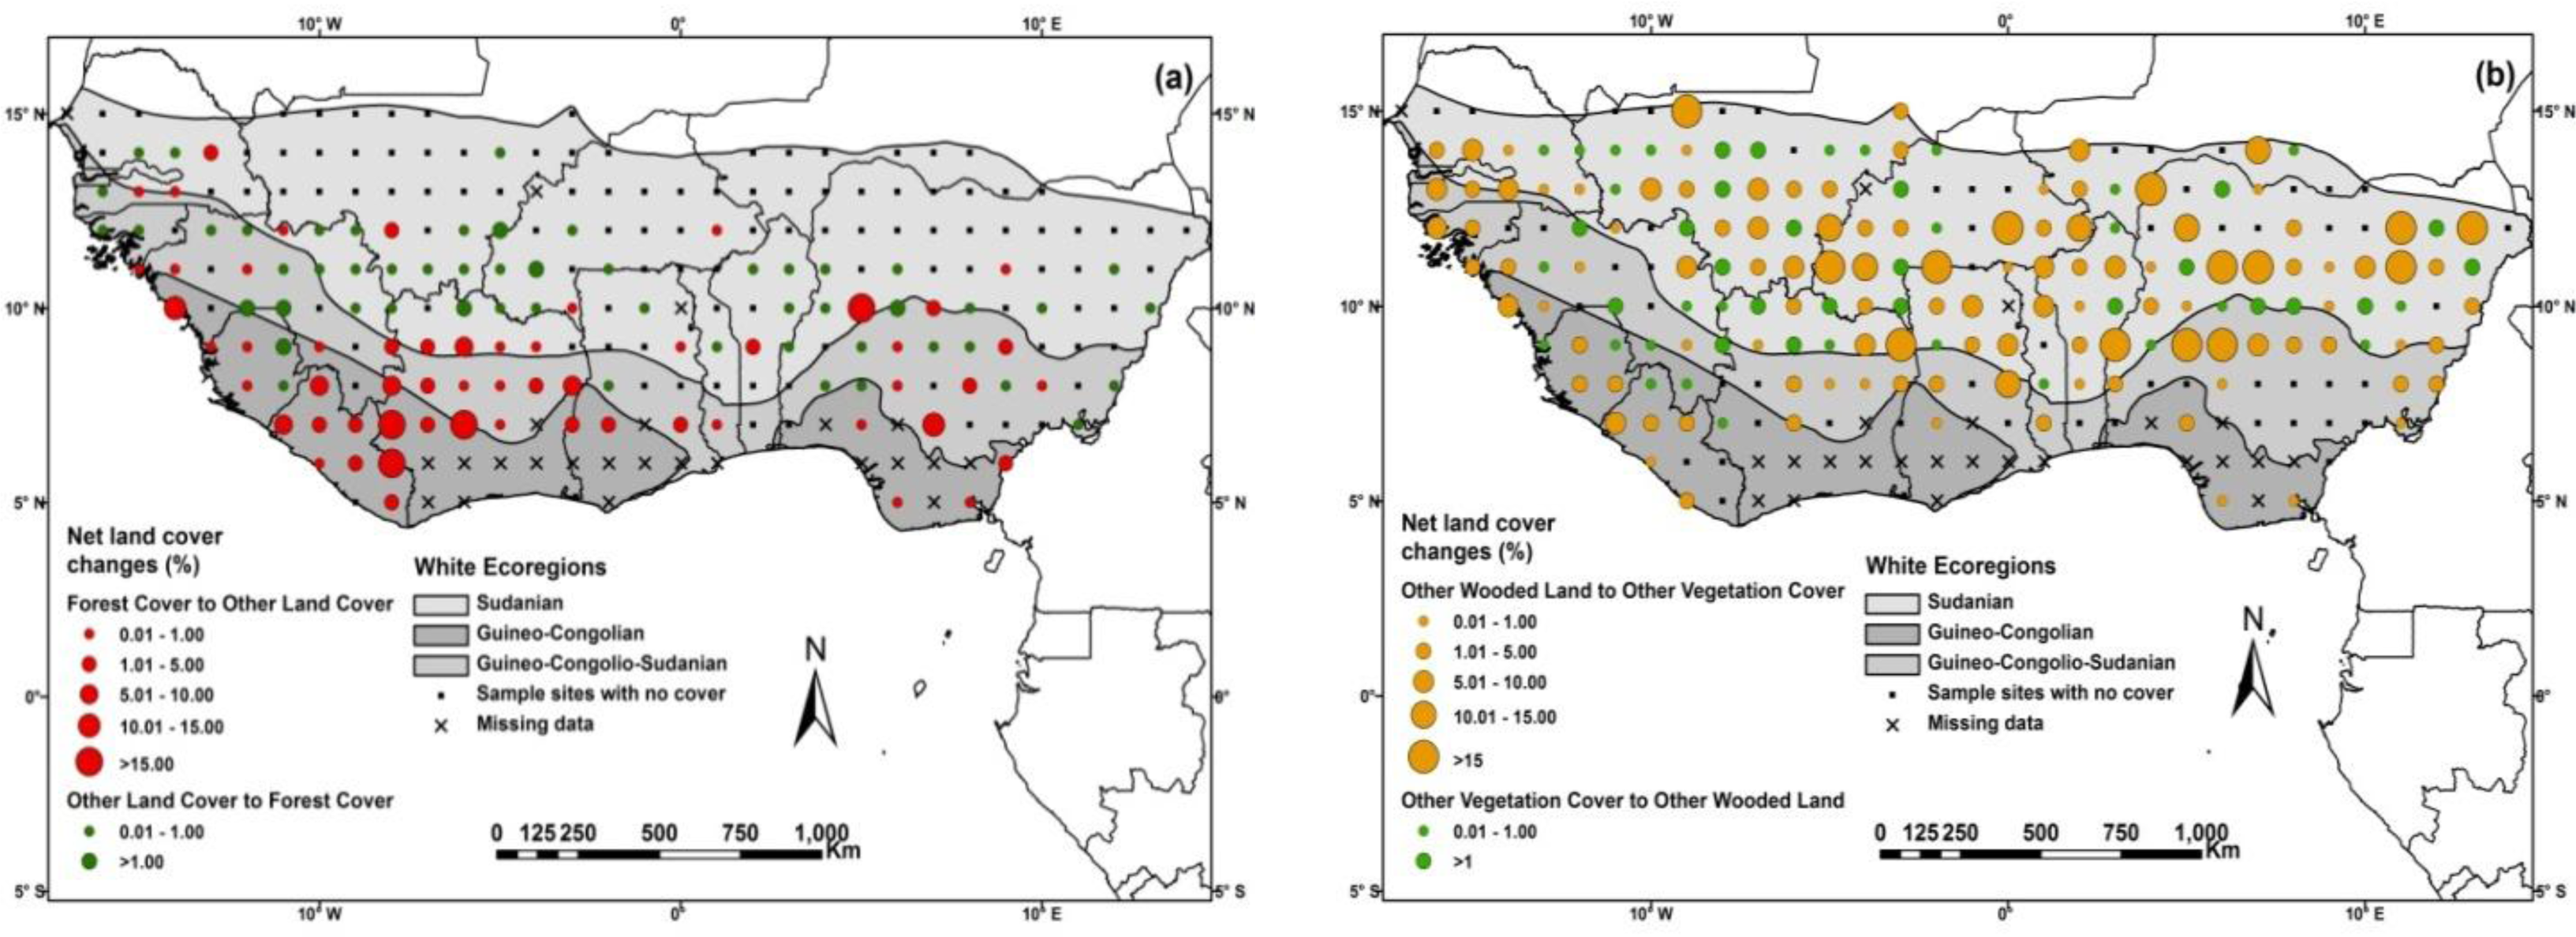
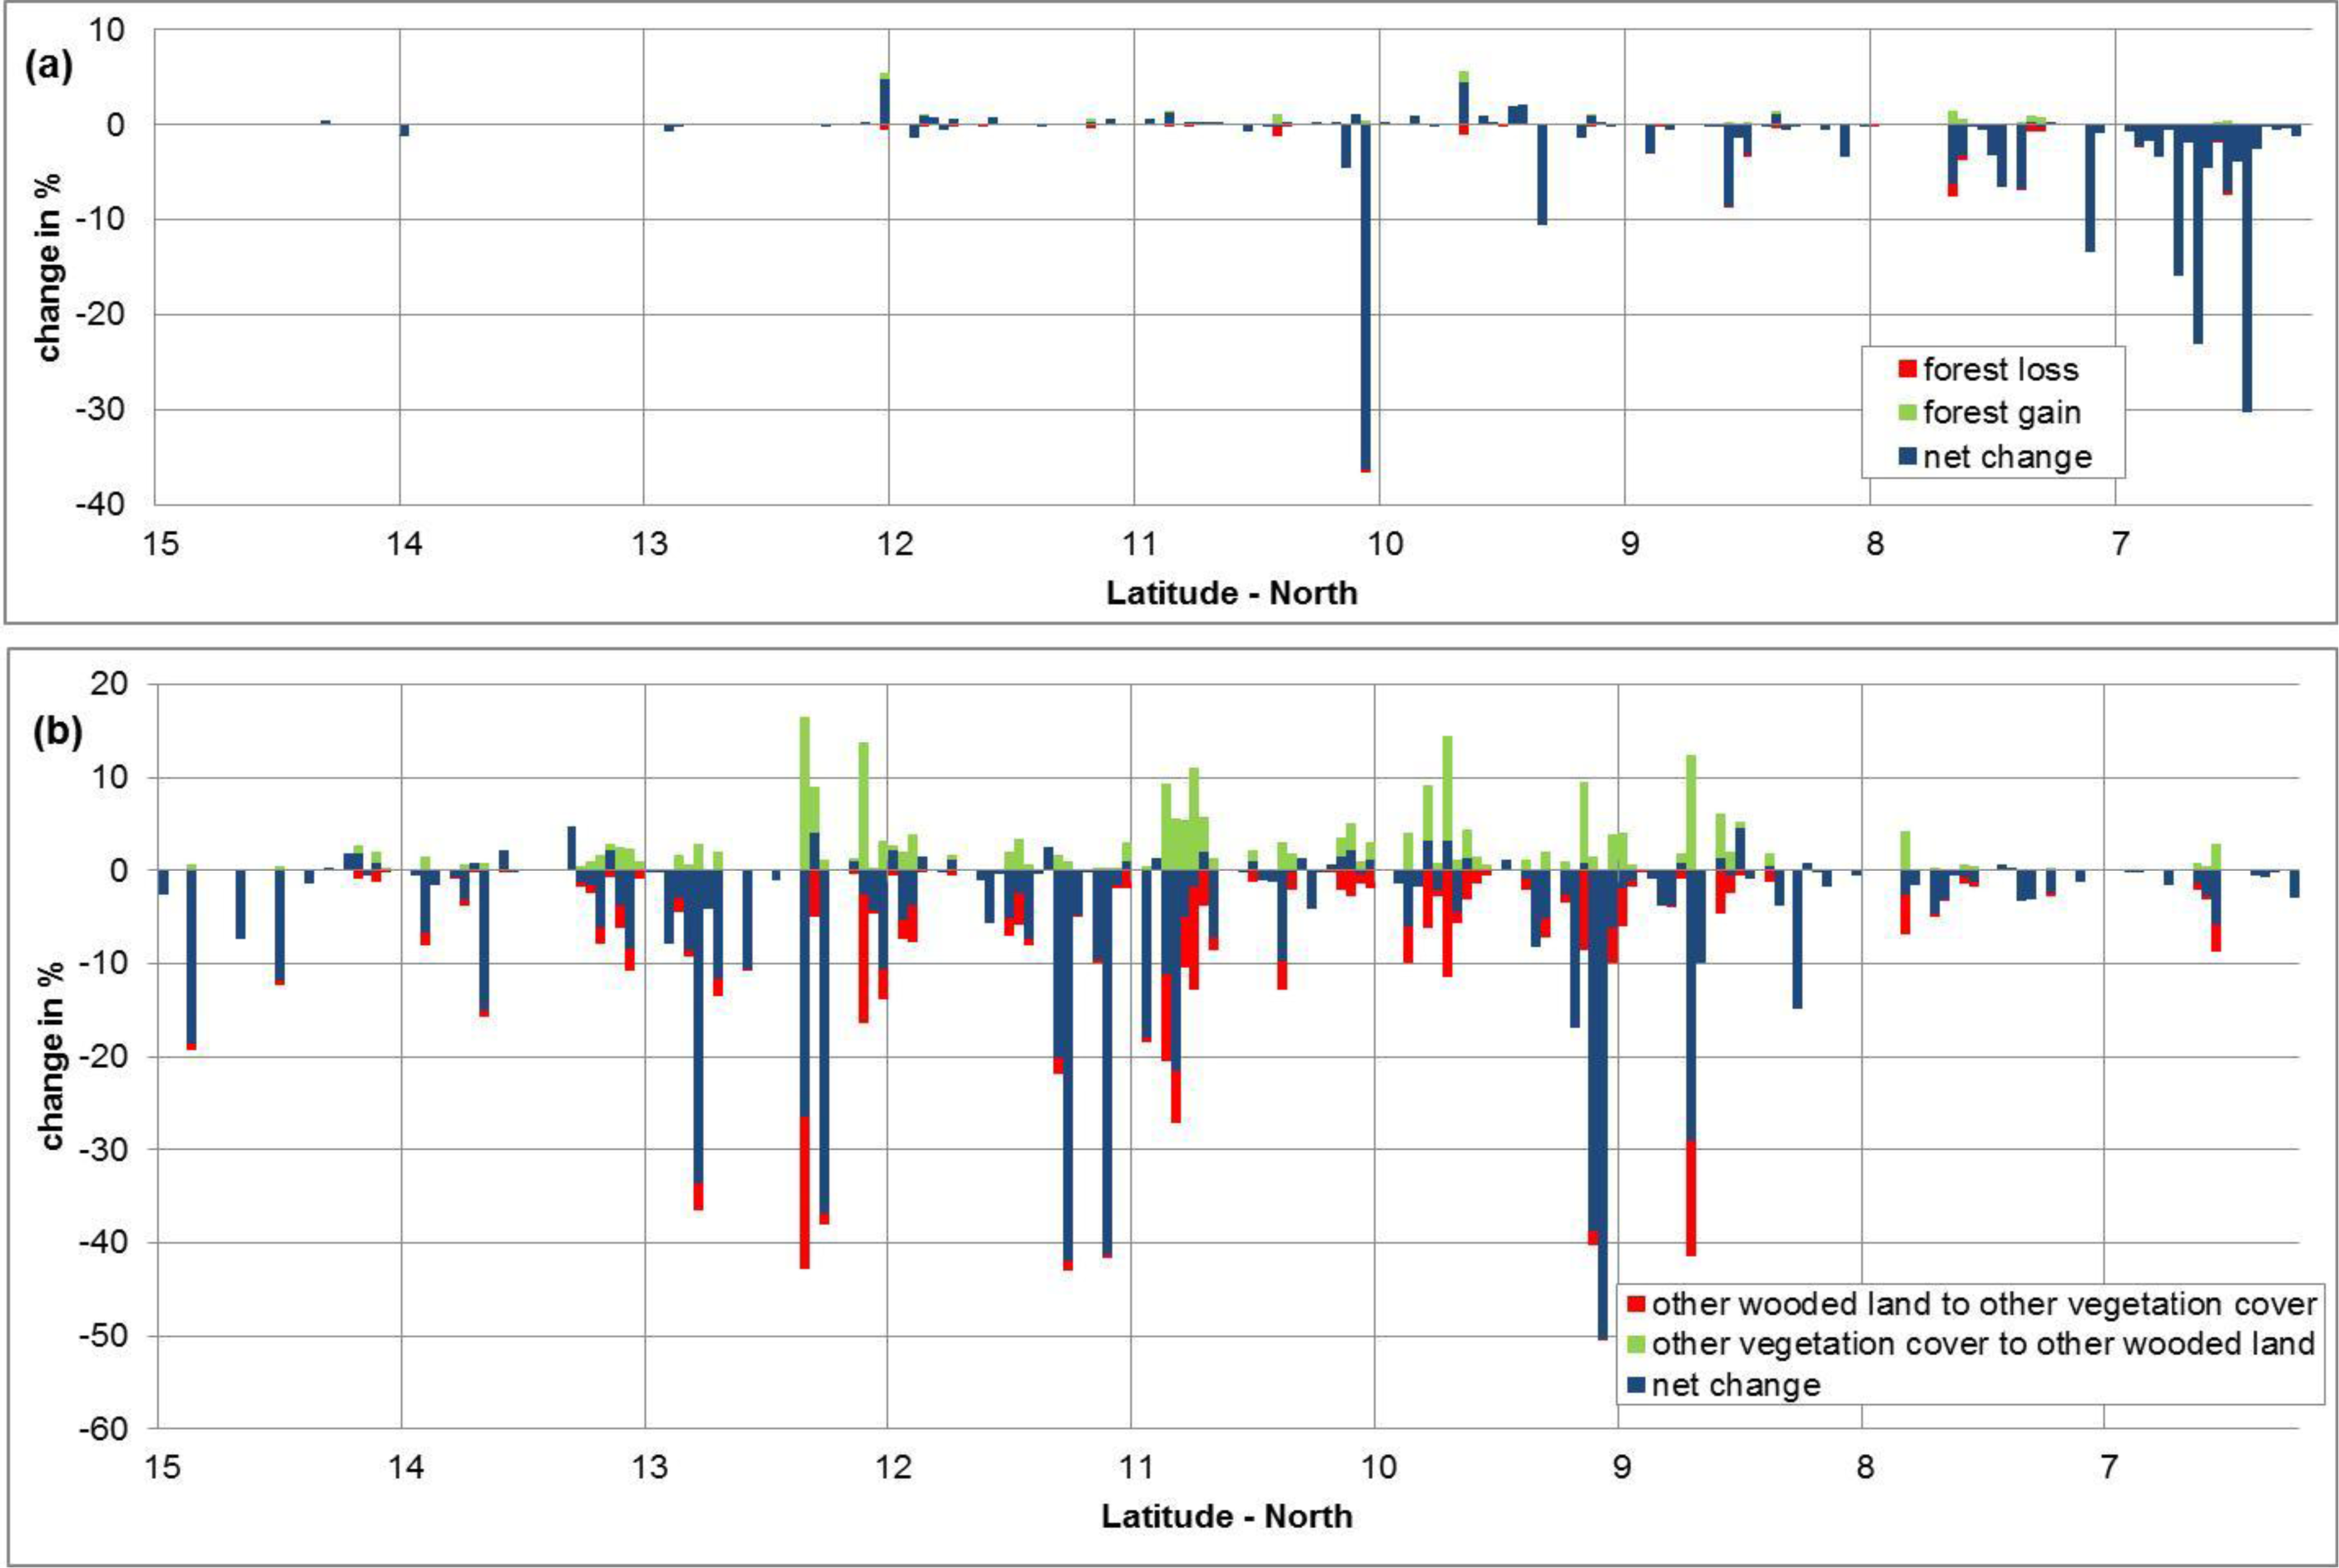
4.2. Land Cover Dynamics between 1975 and 1990
5. Discussion
6. Conclusions
Acknowledgments
Conflicts of Interest
References
- Brink, A.B.; Eva, H.D. Monitoring 25 years of land cover change dynamics in Africa: A sample based remote sensing approach. Appl. Geogr 2009, 29, 501–512. [Google Scholar]
- Poorter, L.; Bongers, F.; Kouamé, F.T.N.; Hawthorne, W.D. Biodiversity of West African Forests—An Ecological Atlas of Woody Plant Species; CABI Publishing: Oxford, UK, 2004. [Google Scholar]
- FAO (Food and Agriculture Organization of the United Nations). Forest Resources Assessment 1990—Tropical Countries Rome; FAO Forestry Paper No. 112; FAO: Rome, Italy, 1993. [Google Scholar]
- Persson, R. Forest Resources of Africa—An Approach to International Forest Resource Appraisals. Part II: Regional Analyses; Rapporter och Uppsatser, Institutionen for Skogstaxering: Stockholm, Sweden, 1977. [Google Scholar]
- Van der Werf, G.R.; Morton, D.C.; DeFries, R.S.; Olivier, J.G.J.; Kasibhatla, P.S.; Jackson, R.B.; Collatz, G.J.; Randerson, J.T. CO2 emissions from forest loss. Nat. Geosci 2009, 2, 737–738. [Google Scholar]
- Pekkarinen, A.; Reithmaier, L.; Strobl, P. Pan-European forest/non-forest mapping with Landsat ETM+ and CORINE land cover 2000 data. ISPRS J. Photogramm. Remote Sens 2009, 64, 171–183. [Google Scholar]
- Potapov, P.V.; Turubanova, S.A.; Hansen, M.C.; Adusei, B.; Broich, M.; Altstatt, A.; Mane, L.; Justice, C.O. Quantifying forest cover loss in Democratic Republic of the Congo, 2000–2010, with Landsat ETM plus data. Remote Sens. Environ 2012, 122, 106–116. [Google Scholar]
- Skole, D.; Tucker, C.J. Tropical deforestation and habitat fragmentation in the Amazon: Satellite data from 1978 to 1988. Science 1993, 250, 1905–1910. [Google Scholar]
- Tappan, G.G.; Sall, M.; Wood, E.C.; Cushing, M. Ecoregions and land cover trends in Senegal. J. Arid Environ 2004, 59, 427–462. [Google Scholar]
- Gallego, F.J. Remote sensing and land cover area estimation. Int. J. Remote Sens 2004, 25, 3019–3047. [Google Scholar]
- Richards, T.; Gallego, J.; Achard, F. Sampling for forest cover change assessment at the pan-tropical scale. Int. J. Remote Sens 2000, 21, 1473–1490. [Google Scholar]
- Esteve, P.; Fontes, J.; Gastellu-Etchegorry, J.P. Tropical dry ecosystems modelling and monitoring from space. Ecol. Model 1998, 108, 175–188. [Google Scholar]
- Larsson, H. Analysis of variations in land cover between 1972 and 1990, Kassala province, eastern Sudan, using Landsat MSS data. Int. J. Remote Sens 2002, 23, 325–333. [Google Scholar]
- Ruelland, D.; Tribotte, A.; Puech, C.; Dieulin, C. Comparison of methods for LUCC monitoring over 50 years from aerial photographs and satellite images in a sahelian catchment. Int. J. Remote Sens 2011, 32, 1747–1777. [Google Scholar]
- Wittig, R.; Koenig, K.; Schmidt, M.; Szarzynski, J. A study of climate change and anthropogenic impacts in West Africa. Environ. Sci. Pollut. Res 2007, 14, 182–189. [Google Scholar]
- Ruelland, D.; Dezetter, A.; Puech, C.; Ardoin-Bardin, S. Long-term monitoring of land cover changes based on Landsat imagery to improve hydrological modelling in West Africa. Int. J. Remote Sens 2008, 29, 3533–3551. [Google Scholar]
- Achard, F.; Eva, H.D.; Stibig, H.J.; Mayaux, P.; Gallego, J.; Richards, T.; Malingreau, J.P. Determination of deforestation rates of the world’s humid tropical forests. Science 2002, 297, 999–1002. [Google Scholar]
- Eva, H.; Carboni, S.; Achard, F.; Stach, N.; Durieux, L.; Faure, J.-F.; Mollicone, D. Monitoring forest areas from continental to territorial levels using a sample of medium spatial resolution satellite imagery. ISPRS J. Photogramm. Remote Sens 2010, 65, 191–197. [Google Scholar]
- Food and Agriculture Organization of the United Nations and European Commission Joint Research Centre (FAO). Global Forest Land-Use Change 1990–2005; Forestry Paper No. 169; Lindquist, E.J., D’annunzio, R., Gerrand, A., Macdicken, K., Achard, F., Beuchle, R., Brink, A., Eva, H.D., Mayaux, P., San-Miguel-Ayanz, J., et al., Eds.; FAO and JRC: Rome, Italy, 2012. [Google Scholar]
- Mayaux, P.; Holmgren, P.; Achard, F.; Eva, H.; Stibig, H.; Branthomme, A. Tropical forest cover change in the 1990s and options for future monitoring. Philos. Trans. R. Soc. B 2005, 360, 373–384. [Google Scholar]
- Mayaux, P.; Pekel, J.-F.; Desclée, B.; Donnay, F.; Lupi, A.; Achard, F.; Clerici, M.; Bodart, C.; Andreas, B.; Belward, A.; et al. State and evolution of the African rainforests between 1990 and 2010. Philos. Trans. R. Soc. B 2013, 368. [Google Scholar] [CrossRef] [Green Version]
- White, F. The Vegetation Map of Africa; UNESCO: Paris, France, 1983. [Google Scholar]
- Chander, G.; Markham, B.L.; Helder, D.L. Summary of current radiometric calibration coefficients for Landsat MSS, TM, ETM+, and EO-1 ALI sensors. Remote Sens. Environ 2009, 113, 893–903. [Google Scholar]
- Helder, D.L.; Karki, S.; Bhatt, R.; Micijevic, E.; Aaron, D.; Jasinski, B. Radiometric calibration of the Landsat MSS sensor series. IEEE Trans. Geosci. Remote Sens 2012, 50, 2380–2399. [Google Scholar]
- Tucker, C.J.; Grant, D.M.; Dykstra, J.D. Nasa’s global orthorectified Landsat data set. Photogramm. Eng. Remote Sens 2004, 70, 313–322. [Google Scholar]
- Beuchle, R.; Eva, H.D.; Stibig, H.J.; Bodart, C.; Brink, A.; Mayaux, P.; Johansson, D.; Achard, F.; Belward, A. A satellite data set for tropical forest area change assessment. Int. J. Remote Sens 2011, 32, 7009–7031. [Google Scholar]
- Bodart, C.; Eva, H.; Beuchle, R.; Rasi, R.; Simonetti, D.; Stibig, H.-J.; Brink, A.; Lindquist, E.; Achard, F. Pre-processing of a sample of multi-scene and multi-date Landsat imagery used to monitor forest cover changes over the tropics. ISPRS J. Photogramm. Remote Sens 2011, 66, 555–563. [Google Scholar]
- Goward, S.A.T.; Williams, D.; Faundeen, J.; Irons, J.; Franks, S. Historical record of Landsat global coverage: Mission operations, nslrsda, and international cooperator stations. Photogramm. Eng. Remote Sens 2006, 72, 1155–1169. [Google Scholar]
- Ju, J.; Roy, D.P. The availability of cloud-free Landsat ETM+ data over the conterminous united states and globally. Remote Sens. Environ 2008, 112, 1196–1211. [Google Scholar]
- Roy, D.P.; Ju, J.; Mbow, C.; Frost, P.; Loveland, T. Accessing free Landsat data via the internet: Africa’s challenge. Remote Sens. Lett 2010, 1, 111–117. [Google Scholar]
- Bodart, C.; Brink, A.B.; Donnay, F.; Lupi, A.; Mayaux, P.; Achard, F. Continental estimates of forest cover and forest cover changes in the dry ecosystems of Africa between 1990 and 2000. J. Biogeogr 2013, 40, 1036–1047. [Google Scholar]
- Rasi, R.; Bodart, C.; Stibig, H.-J.; Eva, H.; Beuchle, R.; Carboni, S.; Simonetti, D.; Achard, F. An automated approach for segmenting and classifying a large sample of multi-date Landsat imagery for pan-tropical forest monitoring. Remote Sens. Environ 2011, 115, 3659–3669. [Google Scholar]
- Rasi, R.; Beuchle, R.; Bodart, C.; Vollmar, M.; Seliger, R.; Achard, F. Automatic updating of an object-based tropical forest cover classification and change assessment. IEEE J. Sel. Top. Appl. Earth Obs. Remote Sens 2013, 6, 66–73. [Google Scholar]
- Desclee, B.; Simonetti, D.; Mayaux, P.; Achard, A. Multi-sensor monitoring system for forest cover change assessment in central Africa. IEEE J. Sel. Top. Appl. Earth Obs. Remote Sens 2013, 6, 110–120. [Google Scholar]
- Eva, H.D.; Achard, F.; Beuchle, R.; de Miranda, E.; Carboni, S.; Seliger, R.; Vollmar, M.; Holler, W.A.; Oshiro, O.T.; Arroyo, V.B.; et al. Forest cover changes in tropical south and central America from 1990 to 2005 and related carbon emissions and removals. Remote Sens 2012, 4, 1369–1391. [Google Scholar]
- Puyravaud, J.-P. Standardizing the calculation of the annual rate of deforestation. For. Ecol. Manag 2003, 177, 593–596. [Google Scholar]
- Persson, R. Forest Resources of Africa—An Approach to International forest Resource Appraisals. Part I: Country Descriptions; Rapporter och Uppsatser, Institutionen for Skogstaxering: Stockholm, Sweden, 1975. [Google Scholar]


| 1975/1990 | Tree Cover | Tree Cover Mosaic | Other Wooded Land | Other Vegetation Cover | Total 1,975 |
|---|---|---|---|---|---|
| Tree Cover | 155 | 14 | 6 | 5 | 180 (6.2%) |
| Tree Cover Mosaic | 1 | 317 | 14 | 10 | 342 (11.8%) |
| Other Wooded Land | 0 | 6 | 1,303 | 129 | 1,438 (49.6%) |
| Other Vegetation Cover | 0 | 2 | 37 | 900 | 939 (32.4%) |
| Total 1,990 | 156 (5.4%) | 339 (11.7%) | 1,360 (46.9%) | 1,044 (36%) | 2,899 (100.0%) |
| Change 1975–1990 | Loss | Gain | Net | Net Annual Change | Annual Change Rate |
|---|---|---|---|---|---|
| Tree Cover | 25 | 1 | −24 | −1.6 | −0.95% |
| Tree Cover Mosaic | 24 | 22 | −2 | −0.2 | −0.05% |
| Other Wooded Land | 135 | 57 | −78 | −5.2 | −0.37% |
| Other Vegetation Cover | 39 | 144 | 105 | 7.0 | 0.70% |
© 2014 by the authors; licensee MDPI, Basel, Switzerland This article is an open access article distributed under the terms and conditions of the Creative Commons Attribution license ( http://creativecommons.org/licenses/by/3.0/).
Share and Cite
Vittek, M.; Brink, A.; Donnay, F.; Simonetti, D.; Desclée, B. Land Cover Change Monitoring Using Landsat MSS/TM Satellite Image Data over West Africa between 1975 and 1990. Remote Sens. 2014, 6, 658-676. https://doi.org/10.3390/rs6010658
Vittek M, Brink A, Donnay F, Simonetti D, Desclée B. Land Cover Change Monitoring Using Landsat MSS/TM Satellite Image Data over West Africa between 1975 and 1990. Remote Sensing. 2014; 6(1):658-676. https://doi.org/10.3390/rs6010658
Chicago/Turabian StyleVittek, Marian, Andreas Brink, Francois Donnay, Dario Simonetti, and Baudouin Desclée. 2014. "Land Cover Change Monitoring Using Landsat MSS/TM Satellite Image Data over West Africa between 1975 and 1990" Remote Sensing 6, no. 1: 658-676. https://doi.org/10.3390/rs6010658