Spatio-Temporal Dynamics of Land-Use and Land-Cover in the Mu Us Sandy Land, China, Using the Change Vector Analysis Technique

Abstract
: The spatial extent of desertified vs. rehabilitated areas in the Mu Us Sandy Land, China, was explored. The area is characterized by complex landscape changes that were caused by different drivers, either natural or anthropogenic, interacting with each other, and resulting in multiple consequences. Two biophysical variables, NDVI, positively correlated with vegetation cover, and albedo, positively correlated with cover of exposed sands, were computed from a time series of merged NOAA-AVHRR and MODIS images (1981 to 2010). Generally, throughout the study period, NDVI increased and albedo decreased. Improved understanding of spatial and temporal dynamics of these environmental processes was achieved by using the Change Vector Analysis (CVA) technique applied to NDVI and albedo data extracted from four sets of consecutive Landsat images, several years apart. Changes were detected for each time step, as well as over the entire period (1978 to 2007). Four categories of land cover were created—vegetation, exposed sands, water bodies and wetlands. The CVA’s direction and magnitude enable detecting and quantifying finer changes compared to separate NDVI or albedo difference/ratio images and result in pixel-based maps of the change. Each of the four categories has a biophysical meaning that was validated in selected hot-spots, employing very high spatial resolution images (e.g., Ikonos). Selection of images, taking into account inter and intra annual variability of rainfall, enables differentiating between short-term conservancies (e.g., drought) and long-term alterations. NDVI and albedo, although comparable to tasseled cap’s brightness and greenness indices, have the advantage of being computed using reflectance values extracted from various Landsat platforms since the early 1970s. It is shown that, over the entire study period, the majority of the Mu Us Sandy Land area remained unchanged. Part of the area (6%), mainly in the east, was under human-induced rehabilitation processes, in terms of increasing vegetation cover. In other areas (5.1%), bare sands were found to expand to the central-north and the southwest of the area.1. Introduction
The degradation of soil and vegetation in drylands is termed desertification and generally results from combined factors, including climatic variations and human activities. Sandification is a related term that refers to land degradation in sandy areas, involving aeolian erosion, windblown sands, shifting dunes and the encouragement of sands into agriculture and even inhabited areas [1,2]. Certainly, sandification processes are associated with vegetation deterioration, productivity reduction, unstable ecosystems, environmental detriment and economic loss.
Considerable attention has been given to sandification processes in China, since vast areas of sandy deserts are located in the north of the country within arid and semi-arid climatic zones, where the annual precipitation is below 500 mm [1,3]. By the end of 2009, the desertified land area of China was estimated to be 2,623,700 km2 (27.33% of the national territory), and the sandified land area to be 1,731,100 km2 (69% of the total desertified land area) [4].
Based on literature review, detailed below, the temporal dynamics of the northern China sandy landscapes can be roughly separated into two periods, from 1950 to 1980 and from the 1980s onward. Records show that the rate of development of sandified land in northern China was 1560 km2·yr−1 between the late 1950s and 1975, 2100 km2·yr−1 between 1975 and 1987, and 3600 km2·yr−1 between 1987 and 2000 [5]. During the 1950s, 1960s and the 1970s, the sandification in northern China was the result of interaction between environmental and physical conditions and climatic and anthropogenic factors [6]. Sandy deserts are characterized by sparse vegetation and unconsolidated sands that tend to move under harsh dry and windy weather conditions. At least from the 1970s, this process was intensified due to frequent drought years that were caused by a gradual increase in the annual mean temperature, unstable precipitation, high rates of evaporation, as well as increasing wind speed [7]. Anthropogenic activities were expressed mainly through irrational human economic actions and land use practices, including: (1) overgrazing of about 200% above the carrying capacity with a high ratio of goats to sheep; (2) overcultivation since large-scale grassland was reclaimed into farmland; and (3) unrestricted cutting for the collection of firewood [3,6]. Although it is difficult to effectively separate the impact of anthropogenic desertification from that of environmental desertification due to the insufficient amount of data collected [1], it is believed that the human factors have been the dominant ones in enhancing sandification processes in northern China [5,6,8].
These trends of anthropogenic activities have been reversed since the 1980s. The rate of increasing sandified land has reduced in northern China, mainly due to the great amount of attention paid to this matter by the central government since the end of the 1970s. The state policy was to “plant trees everywhere and make the country green” [9]. This policy was enforced through a series of laws, regulations, resolutions and rules that were then followed by a series of significant strategic measures adopted by the local governments, with close coordination among their agencies, as well as wide public participation and arduous efforts made by local people (e.g., tree-planting campaigns). Actions to combat sandification, undertaken by the government and local residents, including ground and air-seeding of trees, bushes and grasses over large areas, the construction of long windbreaks, shelterbelts and barriers, pastureland enclosures, as well as chemical mulching and hydrologic solutions [2,10]. There is compelling evidence that, during these years, the area of grassland and woodland biomass production enlarged [11–14]. A monitoring program over the sandy deserts of northern China revealed that, between 2000 and 2004, the net area of sandified land decreased annually by 1283 km2, and between 2005 and 2009, it decreased annually by 1717 km2. In parallel, the average vegetation coverage in the sandified lands rose from 17.63% in 2004 to 18.69% in 2009.
In summary, the above review exhibits that the study area was subjected to different drivers that interact with each other, causing multiple consequences and therefore create complex landscape changes. On one hand, intensive human activities have caused curbing of sandification in some locations with a continuous reduction of the total sandified area. On the other hand, due to changes in climatic conditions (e.g., air temperature, wind speed), observations reveal intensification and expansion in other locations [4,8,15–22]. In addition, it has also been reported that the continued growth in mining and urbanization has had adverse impacts on the landscape [11].
Due to the ability of spaceborne imagery to cover, continuously and repeatedly, vast and remote areas and to evaluate land-cover and long-term changes over the last decades, numerous studies have used remote sensing data to assess the spatial extent of sandification in northern China and its temporal dynamics. This was implemented by various platforms and resolutions along with different image processing methods. Early data, from the 1960s, on land cover were manually interpreted from black and white aerial photographs and supplementary maps [23]. Most studies analyzed Landsat MSS/TM/ETM+ data from selected years on a regional scale [6,8,11–13,15–18,20–22,24–26], supplemented by thematic, administrative and topographic maps. Others used low-resolution imagery data from AVHRR and MODIS [12,21,27]. Using different biophysical indicators (e.g., vegetation indices, fractional cover, albedo, etc.), quantitative and qualitative assessments were applied to classify the severity levels of sandification [13,15,16,18,25,26].
From the above-mentioned studies, one may infer that in the sandy lands of northern China there are two factors that are prevalent and interacted to create different trends of land-cover change. On one side, due to climatic changes, sandification has developed rapidly and is still a serious threat to the fragile ecosystem. However, it is also evident that a considerable portion of the area has undergone rehabilitation processes by means of large cover of grasses, bushes, trees, as well as agricultural crops. Hence, the sandification has been controlled and reversed to some extent. Open questions remain: (1) In a given region, where are the desertified areas and where are the rehabilitated ones? (2) What is the degree of change in each direction? And (3) are these human- or climate-induced changes?
In order to explore these different trends and to consider the knowledge gaps, an appropriate remote sensing based change detection technique has to be employed, taking into account vegetation recovery on one hand, and sandification on the other. In this regard, Change Vector Analysis (CVA) seems to be the most suitable one, since it is a multivariant change detection technique that accepts two or more spectral bands, spectral features or biophysical indicators (e.g., spectral indices, land surface temperature, etc.) associated with the pixel of an image [28,29]. CVA was originally proposed by Malila [28] and further developed by the pioneering studies of Lambin, Strahlers and Ehrlich [30–33]. In CVA, each pixel is represented by a point in a multidimensional space (spectral and temporal) [34]. The methodology (detailed in the Datasets and Methodology section) enables high resolution pixel-by-pixel mapping of the direction and the magnitude of the changes. CVA has several notable advantages over other change detection techniques. Due to its two output products, change magnitude and direction, the CVA technique enables the user to stratify different types of change with respect to land use or land cover dynamics in a specific region. CVA also has the capability to concurrently analyze change in all data layers as opposed to selected bands [34]. Note that most of the studies using this technique have been carried out in forested regions (e.g., [28,35–37]), where the ground features are relatively easily defined (e.g., biomass loss, forest clearing, biomass gain, burnt area, etc.). Far fewer works (e.g., [38–41]) have applied this technique to drylands. In deserts, the biophysical variables and their resulting directional interpretation are different, as will be described later.
Consequently, the primary objective of the current project is to study the land-use/land-cover spatial and temporal dynamics in drylands via an image processing methodology. More specifically, the project aims at utilizing the change vector analysis (CVA) technique using spaceborne imagery over the Mu Us Sandy Land, China. This aim was fulfilled by computing NDVI and albedo from selected Landsat images of 1978, 1990, 1999, 2001, and 2007.
2. Study Area
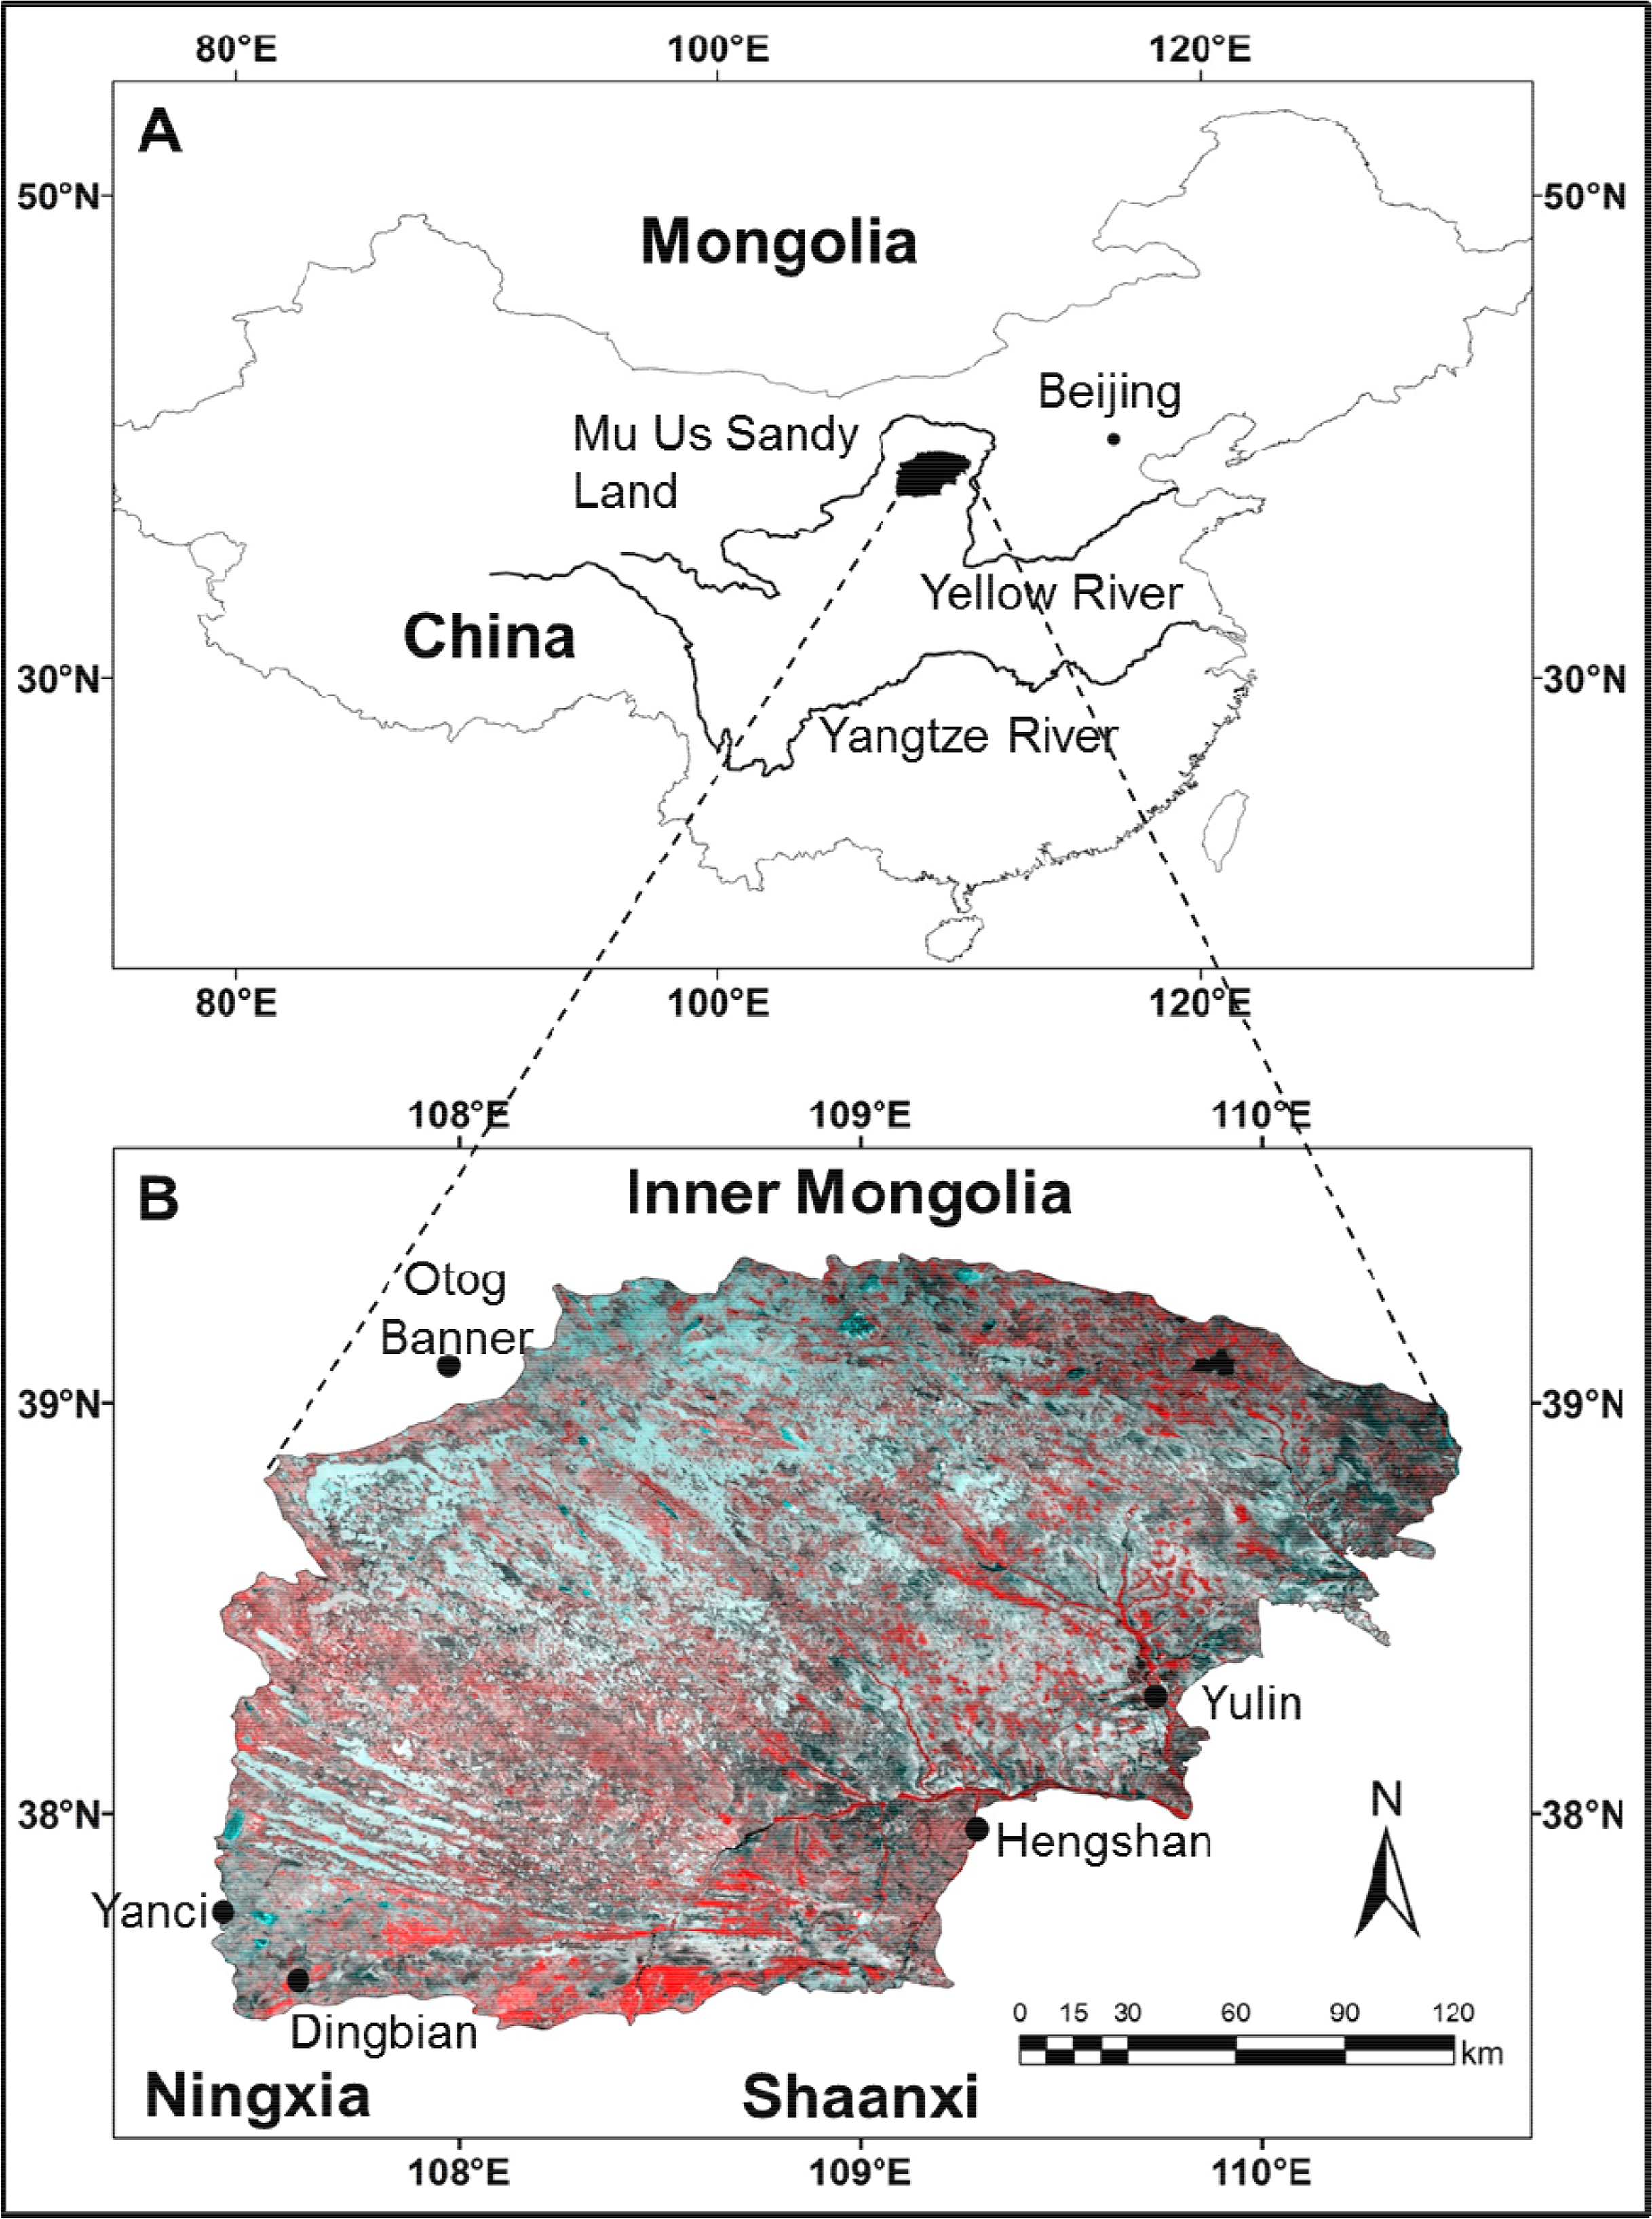
The Mu Us Sandy Land is one of the most seriously sandified areas in China [3]. It is located in the Ordos Plateau, between l07°20′E and 111°30′E and 37°27′N and 39°22′N, with an area of 38,372 km2 (Figure 1). Administratively, the Mu Us Sandy Land lies on the border area of the Inner Mongolia Autonomous Region, Shaanxi Province and the Ningxia Hui Autonomous Region.
The Mu Us Sandy Land has a typical continental semi-arid climate. Annual precipitation ranges from 440 mm in the southeast to 250 mm in the northwest, of which 60%–80% is concentrated in the period from June to August. High inter-annual fluctuations of precipitation characterize the region. Potential evaporation is 2220 mm annually; hence, the aridity index indicates an arid environment. The annual mean temperature is about 6.0 °C–8.5 °C, with monthly mean temperatures of 22 °C in July and −11 °C in January [8]. Over 200 days have a wind speed of more than 5 m·s−1. The topography in the study area gently undulates and slopes from northwest to southeast, with elevations ranging from 1200 to 1600 m above mean sea level. The natural landscape features in the Mu Us Sandy Land include shifting dunes, semi-fixed dunes, fixed dunes, low ridged-land, wetlands, alluvial terraces, lakes, rivers and streams [42]. Most of the land (ca. 77%) is covered by sand with varying thickness [43]. There are several main rivers that cross the southeast of the region and flow into the Yellow River. The ground water table is shallow, 1–3 m below ground, especially in the interdune areas [2]. There are several lakes in the interior of the sandy land, most of which are sodic lakes; others contain chloride, and a few are freshwater lakes [44].
The main vegetation species in sandy grassland (e.g., Stipa bungeana and Poa sphondyloides) cover more than 80% of the sandy land area. Artemisia ordosica and Caragana intermedia are the dominant shrub species; both are drought resistant. The other natural vegetation types include steppe, meadow and shrubs. In addition, there are farmlands, distributed along the river or scattered in the sandy grasslands, and artificial forests and shrubs [8,43]. The grassland in the northwest of the sandy land belongs to Inner Mongolia and is used for grazing only; in the east and south of the sandy land, some grassland areas have been reclaimed into farmland, where both animal husbandry and agriculture are the main economic activities. The sandy land was populated by 774,400 inhabitants in 2000 and 918,000 in 2010. Population density, that was around 10 persons per km2 in the 1950s, has continuously increased and reached a level of up to 80 persons per km2 in 2002 [45]. According to Zhang et al. [17], between 1960 and 2006, the area of farmlands remained almost at the same level; the areas of woodlands and grasslands increased by 20% and 55%, respectively; the areas of settlements and roads grew 4 times; and the areas of water bodies and unused lands decreased by 57% and 43%, respectively.
3. Datasets and Methodology
3.1. Meteorological Data
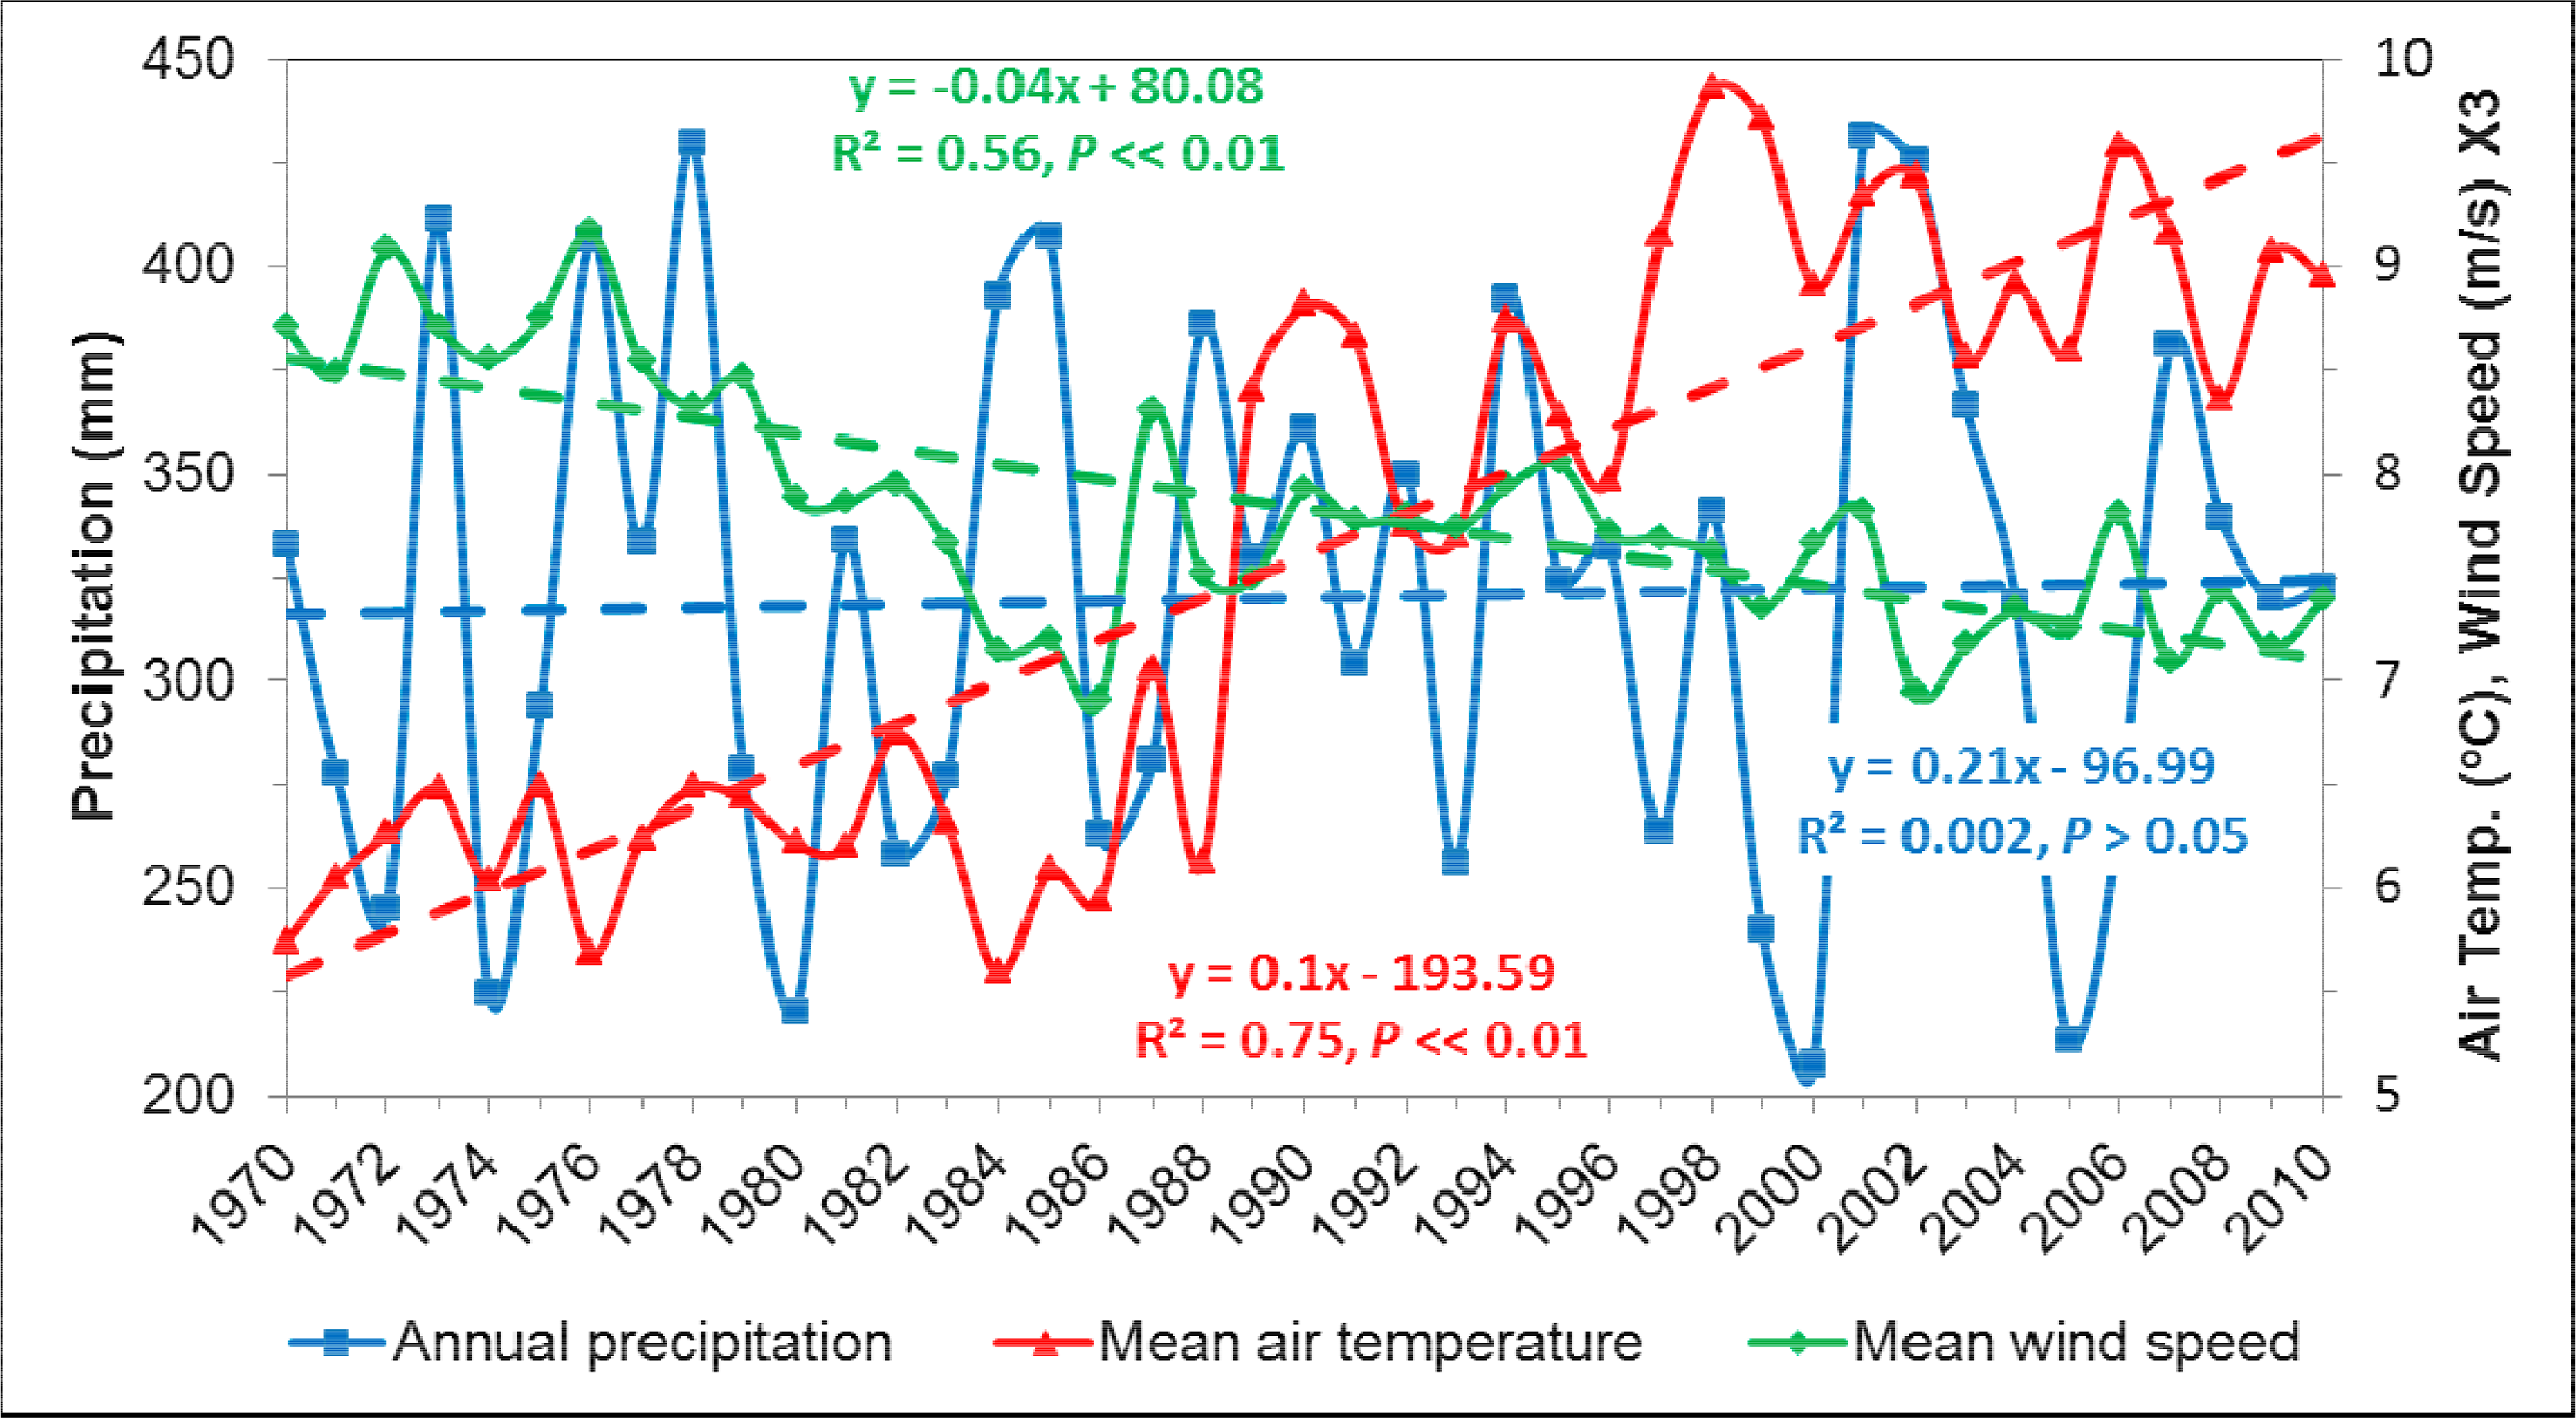
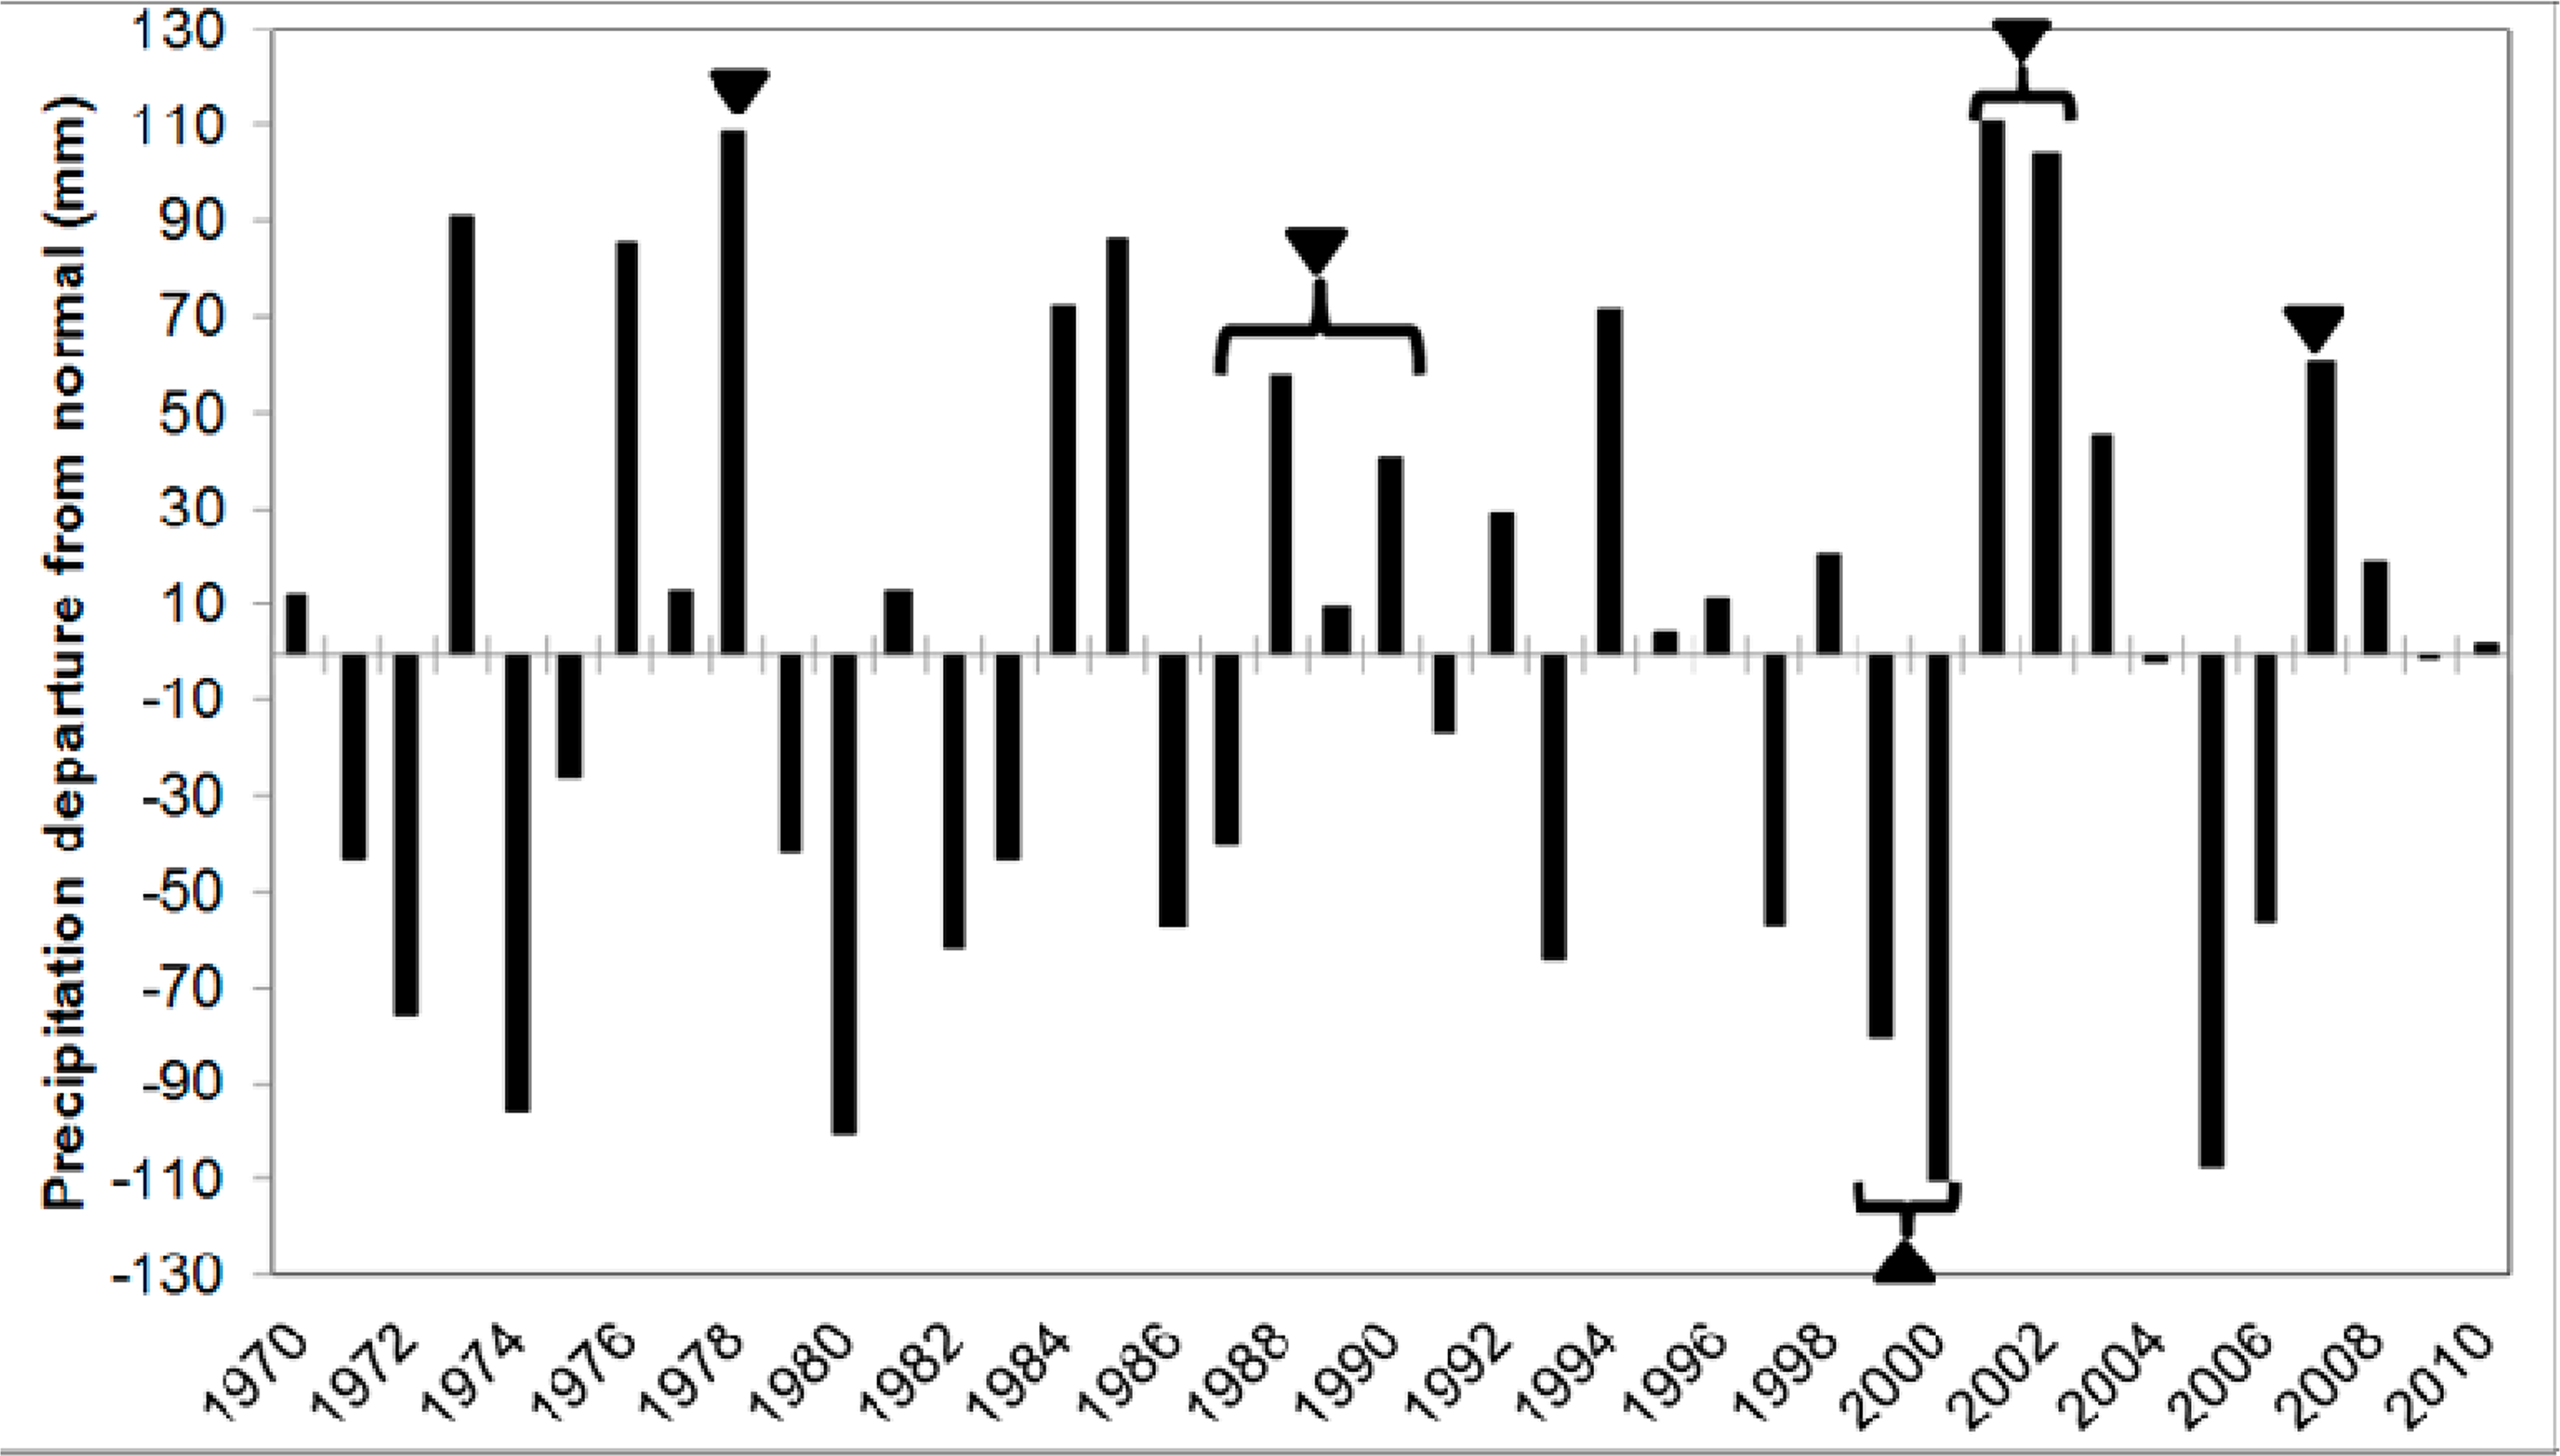
Meteorological data for 41 years (1970–2010) were acquired for 5 stations within and in the vicinity of the study area, namely Yulin, Hengshan, Dingbian, Yanchi, and Otog Banner (Figure 1) from the China Meteorological Data Sharing Service System ( http://cdc.cma.gov.cn/). The variables include monthly precipitation, air temperature and wind speed. The annual time series of these three variables is presented in Figure 2, and the departure of precipitation from the normal is illustrated in Figure 3.
3.2. NOAA-AVHRR
Data of the NOAA-AVHRR were obtained from NASA’s Land Long Term Data Record (LTDR) project website ( http://ltdr.nascom.nasa.gov/cgi-bin/ltdr/ltdrPage.cgi). In particular, data were acquired from the AVH09 daily surface reflectance (ρ) product (Version 3). This product is combined from the AVHRR systems onboard NOAA-7, 9, 11, 14, and 16 from 1981 to 1999 in a longitude-latitude geographic projection and at a spatial resolution of 0.05 degrees (ca. 5.55 km2 over the study area). For the current project, only data from channel 1 (red) and channel 2 (NIR), and quality assessments for July, August, and September were used. The global image was cropped over the study area. The quality assessment data were used for eliminating clouds and cloud shadows. Daily NDVI was computed according to Tucker [46] as:
Daily albedo (αAVHRR) values were computed by using Equation (2) after [2]:
3.3. MODIS
MODIS data were acquired from the NASA-USGS Land Processes Distributed Active Archive Center (LP DAAC) ( https://lpdaac.usgs.gov/products/). NDVI data were extracted from a 16-Day composite with 500 m of the MODIS Terra and Aqua systems (MOD13A1). The quality assessment information was obtained from the Quality Science Data Set (MODLAND_QA). The strictest criterion was selected, e.g., highlighted pixels with the highest probability to be contaminated with clouds and cloud shadows were excluded from the analysis. Finally, maximum value composites were computed for the three summer months (i.e., July, August and September) for each year. Similarly, albedo values were acquired from the MODIS Terra and Aqua systems (MCD43A3). They are 16-Day composites with 500-m resolution. Yearly data were averaged for the same summer months. For both variables, the time series of the NOAA-AVHRR (1981–1999) was merged with that of MODIS (2000–2010) to produce a continuous series of annual average NDVI and albedo over the entire domain.
3.4. Landsat
Landsat images were selected according to the following criteria: (1) images from the peak of the growing season (either August or September), preferably of the same year; (2) images from years with above-average precipitation; and (3) cloudless images. Due to these strict initial conditions and the fact that the area of interest should be mosaiced by four Landsat images, the number of available images in the archives ( http://glovis.usgs.gov/; http://edcsns17.cr.usgs.gov/NewEarthExplorer/; and ftp://ftp.glcf.umiacs.umd.edu/glcf/Landsat/) was found to be very limited. Consequently, four sets of images, several years apart, were chosen between 1978 and 2007 to fulfill the above-mentioned requirements (Figure 3, Table 1). Although all the used images were confined to less than two months in the summer, seasonal variability of the rainfall might also has potential impact on the inconsistency of the data. Bearing this in mind, the raw precipitation dataset was analyzed. No notable change in the seasonal patterns throughout the entire study period was found. A unimodal shape with a significant high peak of rainfall amount is evident in July and August. We conclude, therefore, that during a window of 7 weeks (from 31 July to 23 September), the spectral signal is less affected by seasonal variations and, thus, comparable. In addition to the rainy years, one set of images was used for the same season, but for a drought year (Figure 3, Table 1). Ideally, as in the two edge sets (i.e., 1978 and 2007), all the images were acquired in August of the same year. Both years are characterized by high above-average precipitation. The second set is composed of images from four consecutive years (1988–1991) and denoted hereafter as 1988 for simplicity. The third set is composed of two consecutive years (1999 and 2000) and denoted hereafter as 1999. Lastly, the fourth set is composed of two consecutive years (2001 and 2002) and denoted hereafter as 2001.
Pre-processing of each raw image included one-step radiometric and atmospheric corrections using the dark-object subtraction method [48,49] and the latest radiometric calibration coefficients published [50]. NDVI was calculated as in Equation (1). The albedo values for the MSS were calculated according to Xu et al. [15] (after [51]) and those for the TM/ETM+ according to Liang et al. [52] using the respective equations:
3.5. CVA
CVA produces have two outputs—change magnitude and change direction. The magnitude of the change (ΔMG) is computed by the Euclidean distance of a vector between two selected dates, the reference date (t1) and the target date (t2):
This way, the angle depicts the type of change with respect to the mutual change directions within pixels in the two bands. Generally, the number of direction categories is equal to 2n, where n is the number of spectral bands.
4. Analysis and Results
Long-term analysis of the meteorological variables (Figure 2) reveals that during the 41 years, temperature has significantly increased by about 3 °C, with a sharp step upwards in the late 1990s. Wind speed, on the contrary, was gradually and significantly decreased during the same period. Annual precipitation, however, has remained on the same average level of about 320 mm per year, but with notable fluctuations from year to year (Figure 2). These findings are in agreement with previous studies on the Mu Us Sandy Land [2,7,45].
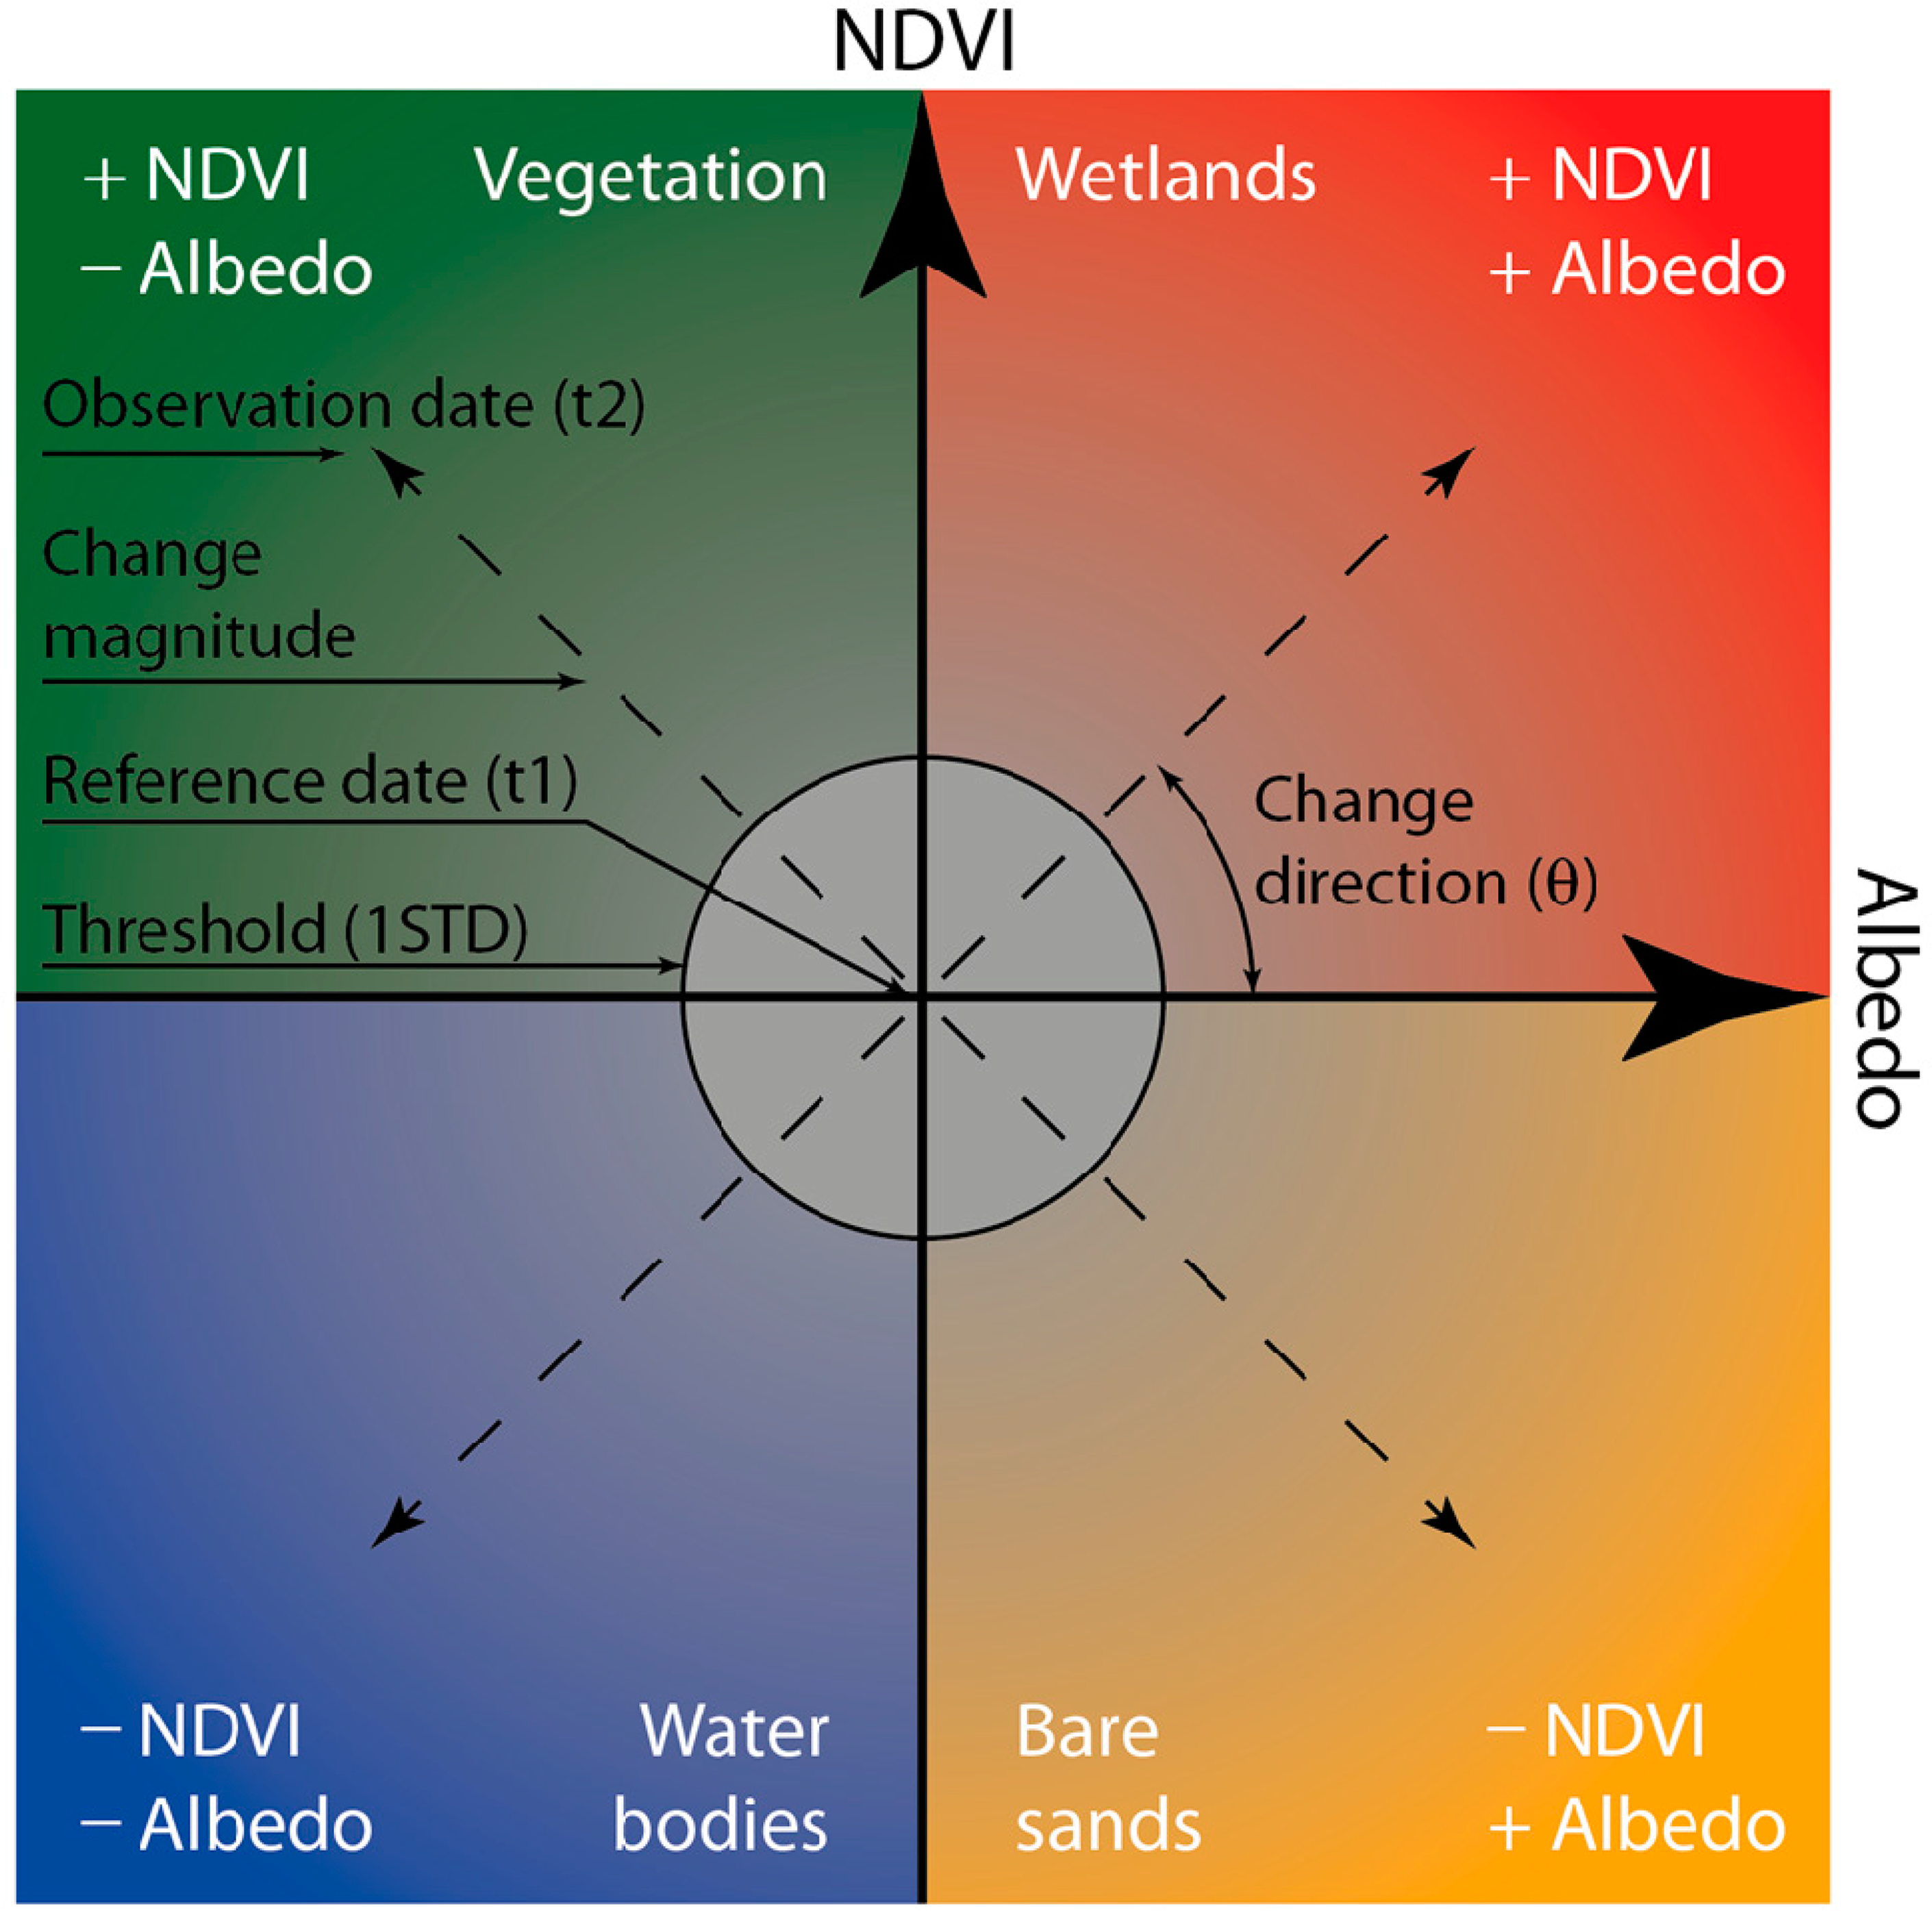
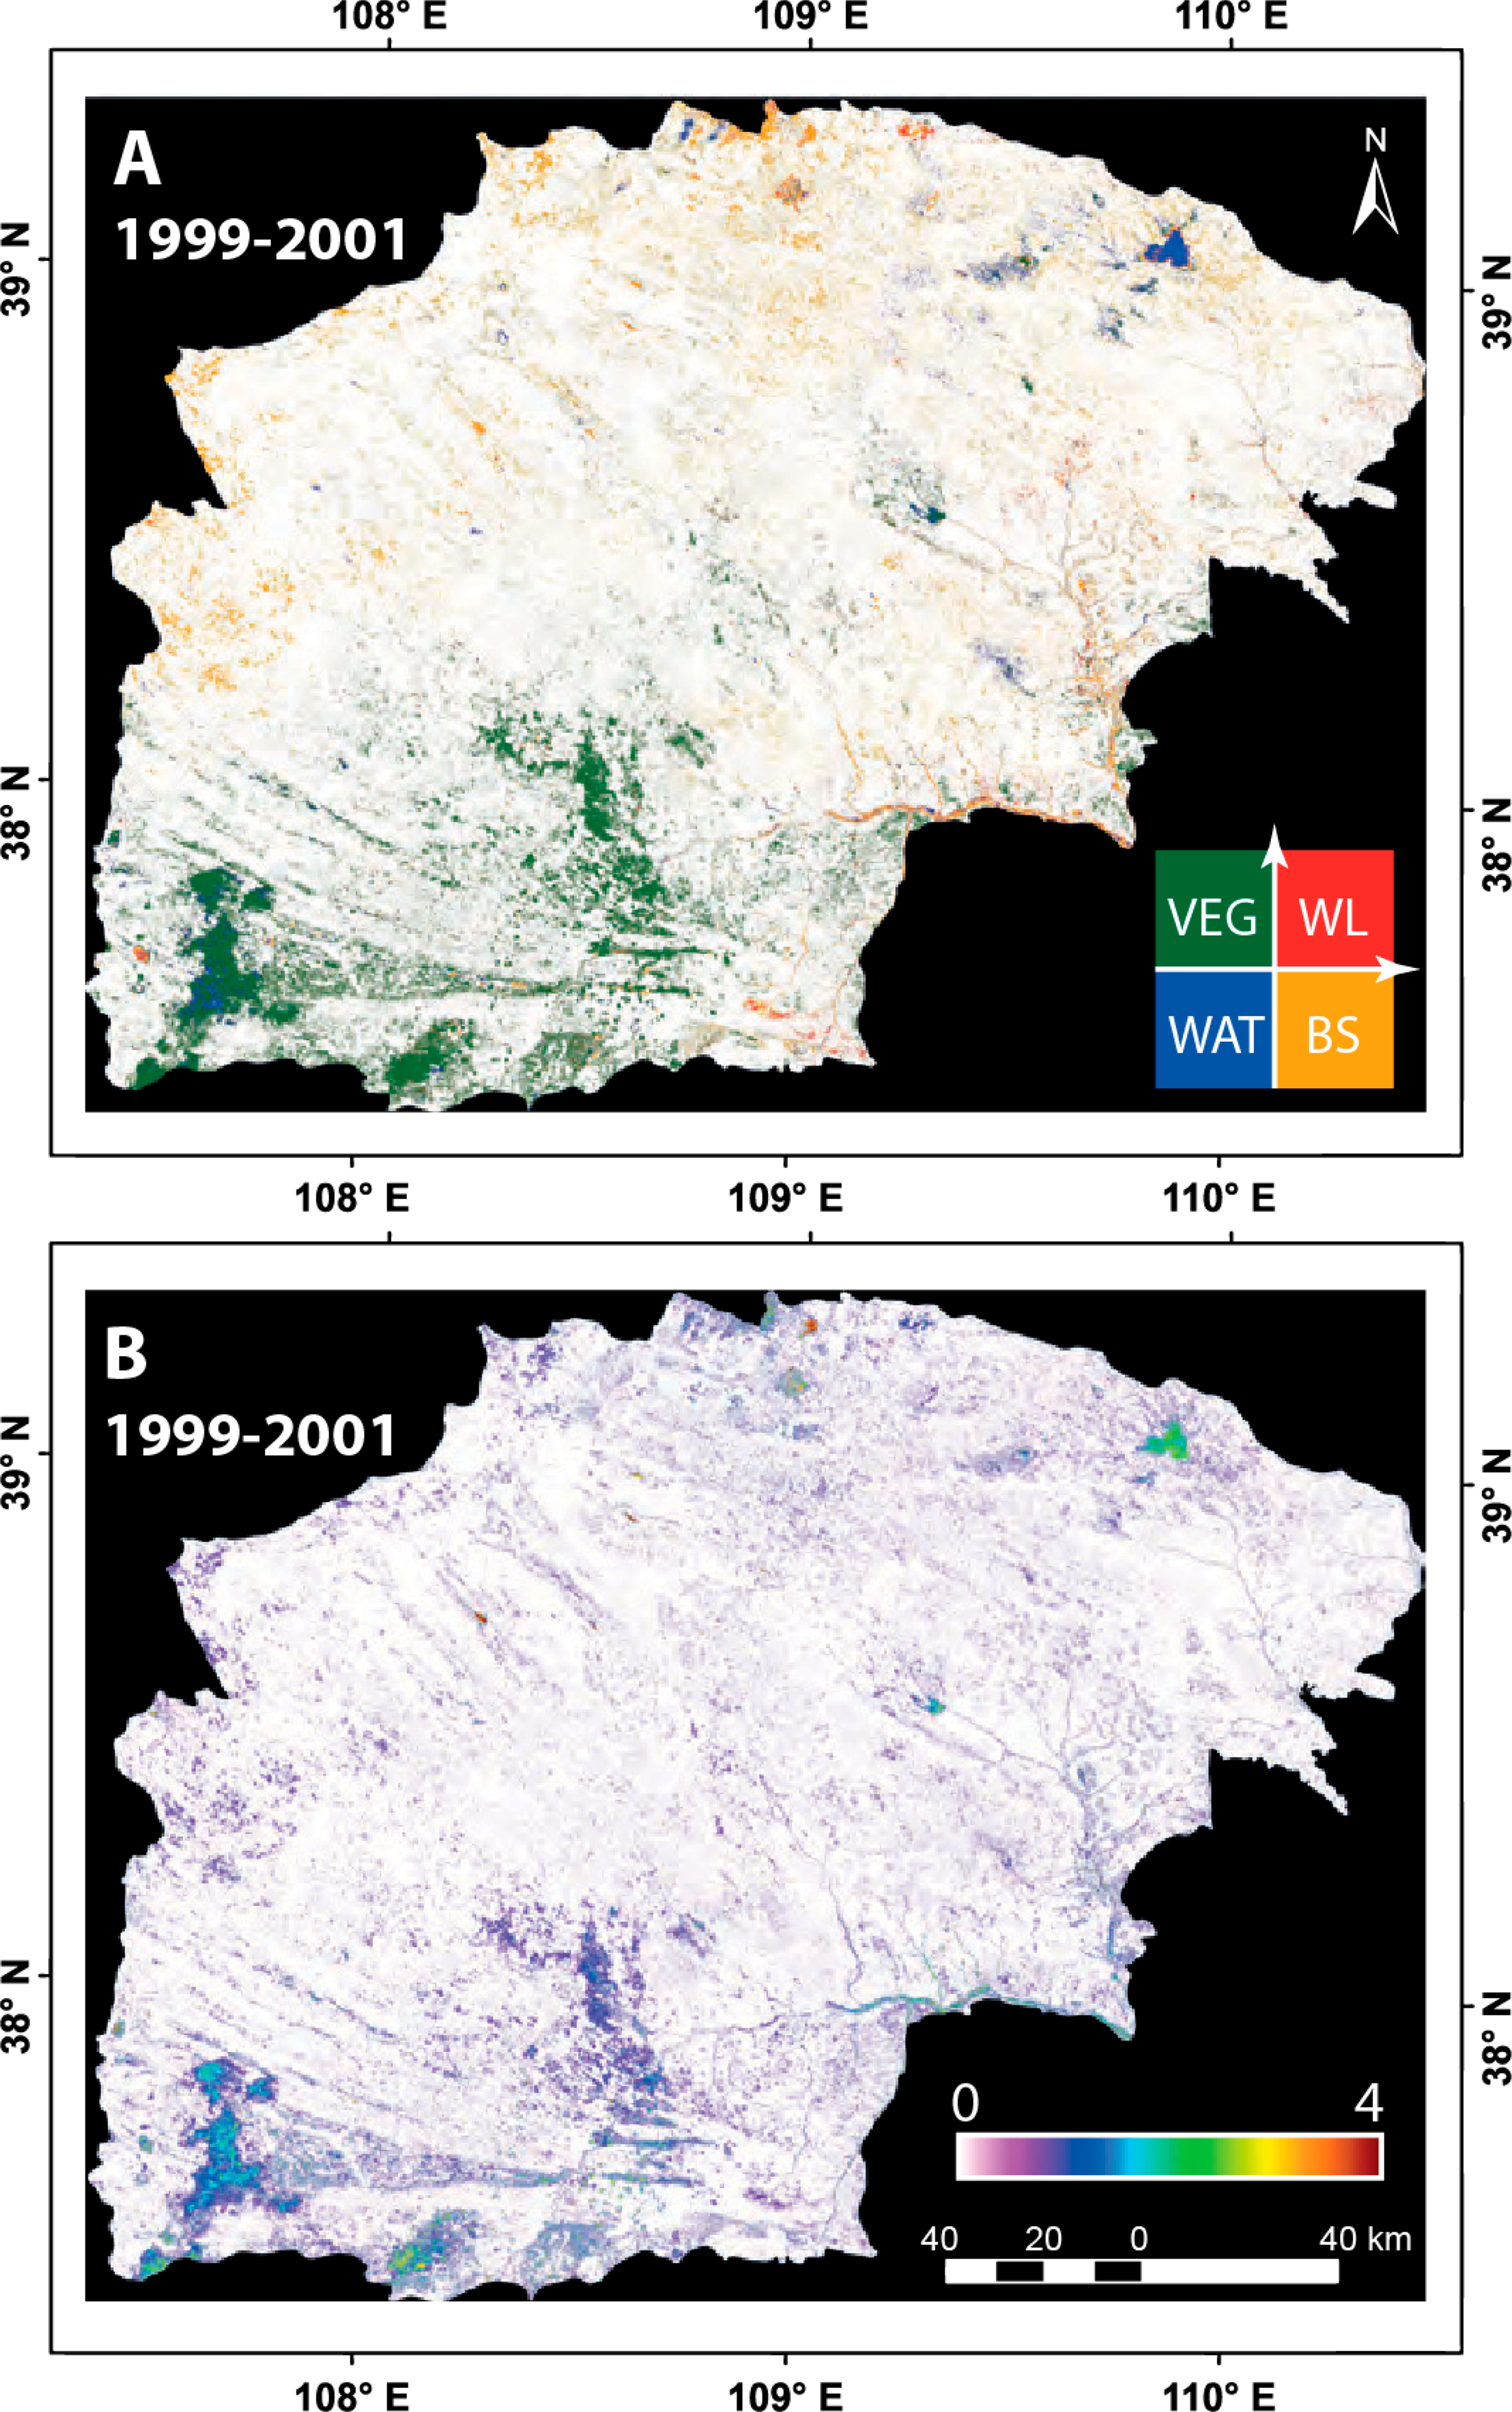
The merged time series of the NOAA-AVHRR (1981–1999) and MODIS (2000–2010) exhibits continuous series of annual average NDVI and albedo over the entire study area (Figure 4). No significant correlation was found between NDVI and precipitation. However, a significantly high negative correlation (r = −0.63; p << 0.01) was found between NDVI and albedo. NDVI gradually increased with time, and in the same period, the albedo decreased. While increasing NDVI values may resemble the rehabilitation processes of the landscape in terms of fractional vegetation cover and biomass, increasing albedo may be an indicator for sandification processes, since exposed sands have higher reflectance values. These characteristics are the rationale for selecting the NDVI and albedo as the two spectral variables of the CVA for assessing the temporal dynamics of the sandy environment. Consequently, for the current project, NDVI and albedo were used as biophysical indicators (rather than spectral bands). This variable selection results in four directional categories, as schematically described in Figure 5 by the four quadrants of the coordinate system. The first quadrant indicates an increase in both albedo and NDVI, a relationship that represents areas with a significant increase in wetlands. The second quadrant indicates an increase in NDVI and a decrease in albedo, a relationship that represents areas with a significant increase in vegetation. The third quadrant indicates a decrease in both albedo and NDVI, a relationship that represents areas with a significant increase in water bodies, and the fourth quadrant indicates an increase in albedo and a decrease in NDVI, a relationship that represents areas with a significant increase in bare sands.
Based on NDVI and albedo, CVA was applied to: (1) a pair of sequential drought and rainy years (1999 and 2001) as observed in the Landsat images; (2) three pairs of consecutive time periods during the rainy years (i.e., 1978–1988, 1988–2001 and 2001–2007) as observed in the Landsat images; and (3) the entire study period (1978–2007) of the Landsat time series.
In order to assess the short-term climate-induced changes in the regions, CVA was computed on the pair of images that combined the most severe drought years (1999) followed by the most rainy years (2001) (Figure 3). Respectively, rainfall changed from 224 to 428 mm (Figure 2). Figure 6 presents the direction and magnitude results for this pair of images. Since the ground water level is relatively high, intensive rainfall years could add extra water into the biological cycle. Therefore, the most notable change appears as relatively vast patches of natural vegetation in the southeastern part of the study area, and vegetation growth can be recognized in the interdune areas along the longitudinal dunes. These rainy years also flooded the lake in the northwest corner of the image.
Figure 7 illustrates the direction and magnitude results for each of the pairs of consecutive time periods of the rainy years. It can be seen that in the early 1980s, agricultural activities were initiated in the southern part of the study area and along rivers (Figure 7A,B). A small water body, called Hongjiannao Lake, in the north-east of the study area, dried out during this period and exhibits the most pronounced change. In the late 1980s and during the 1990s, sandification was recognized in the center and northern part of the area, while growth of vegetation occurred in the south and especially in the southwest (Figure 7C,D). Magnitude of change ranges from low in the bare sands areas, moderate over the vegetation re-growth areas, and high in the water bodies that were flooded again during this period. Note that the magnitude of the change and the extent of the vegetation patches are less than those observed between 1999 and 2001 due to the post-drought recovery (Figure 6). It can be concluded, therefore, that this change was mainly due to agricultural activity rather than a reaction to rainfall. Between 2001 and 2007, new vegetation was observed in the eastern, northern, and western sections of the area, while more sands appeared in the south in area that was covered before by natural vegetation. In this area, small interdune water bodies dried out and turned to be wetlands. Also, several dams were built along the rivers, storing water for irrigation (Figure 7E,F).
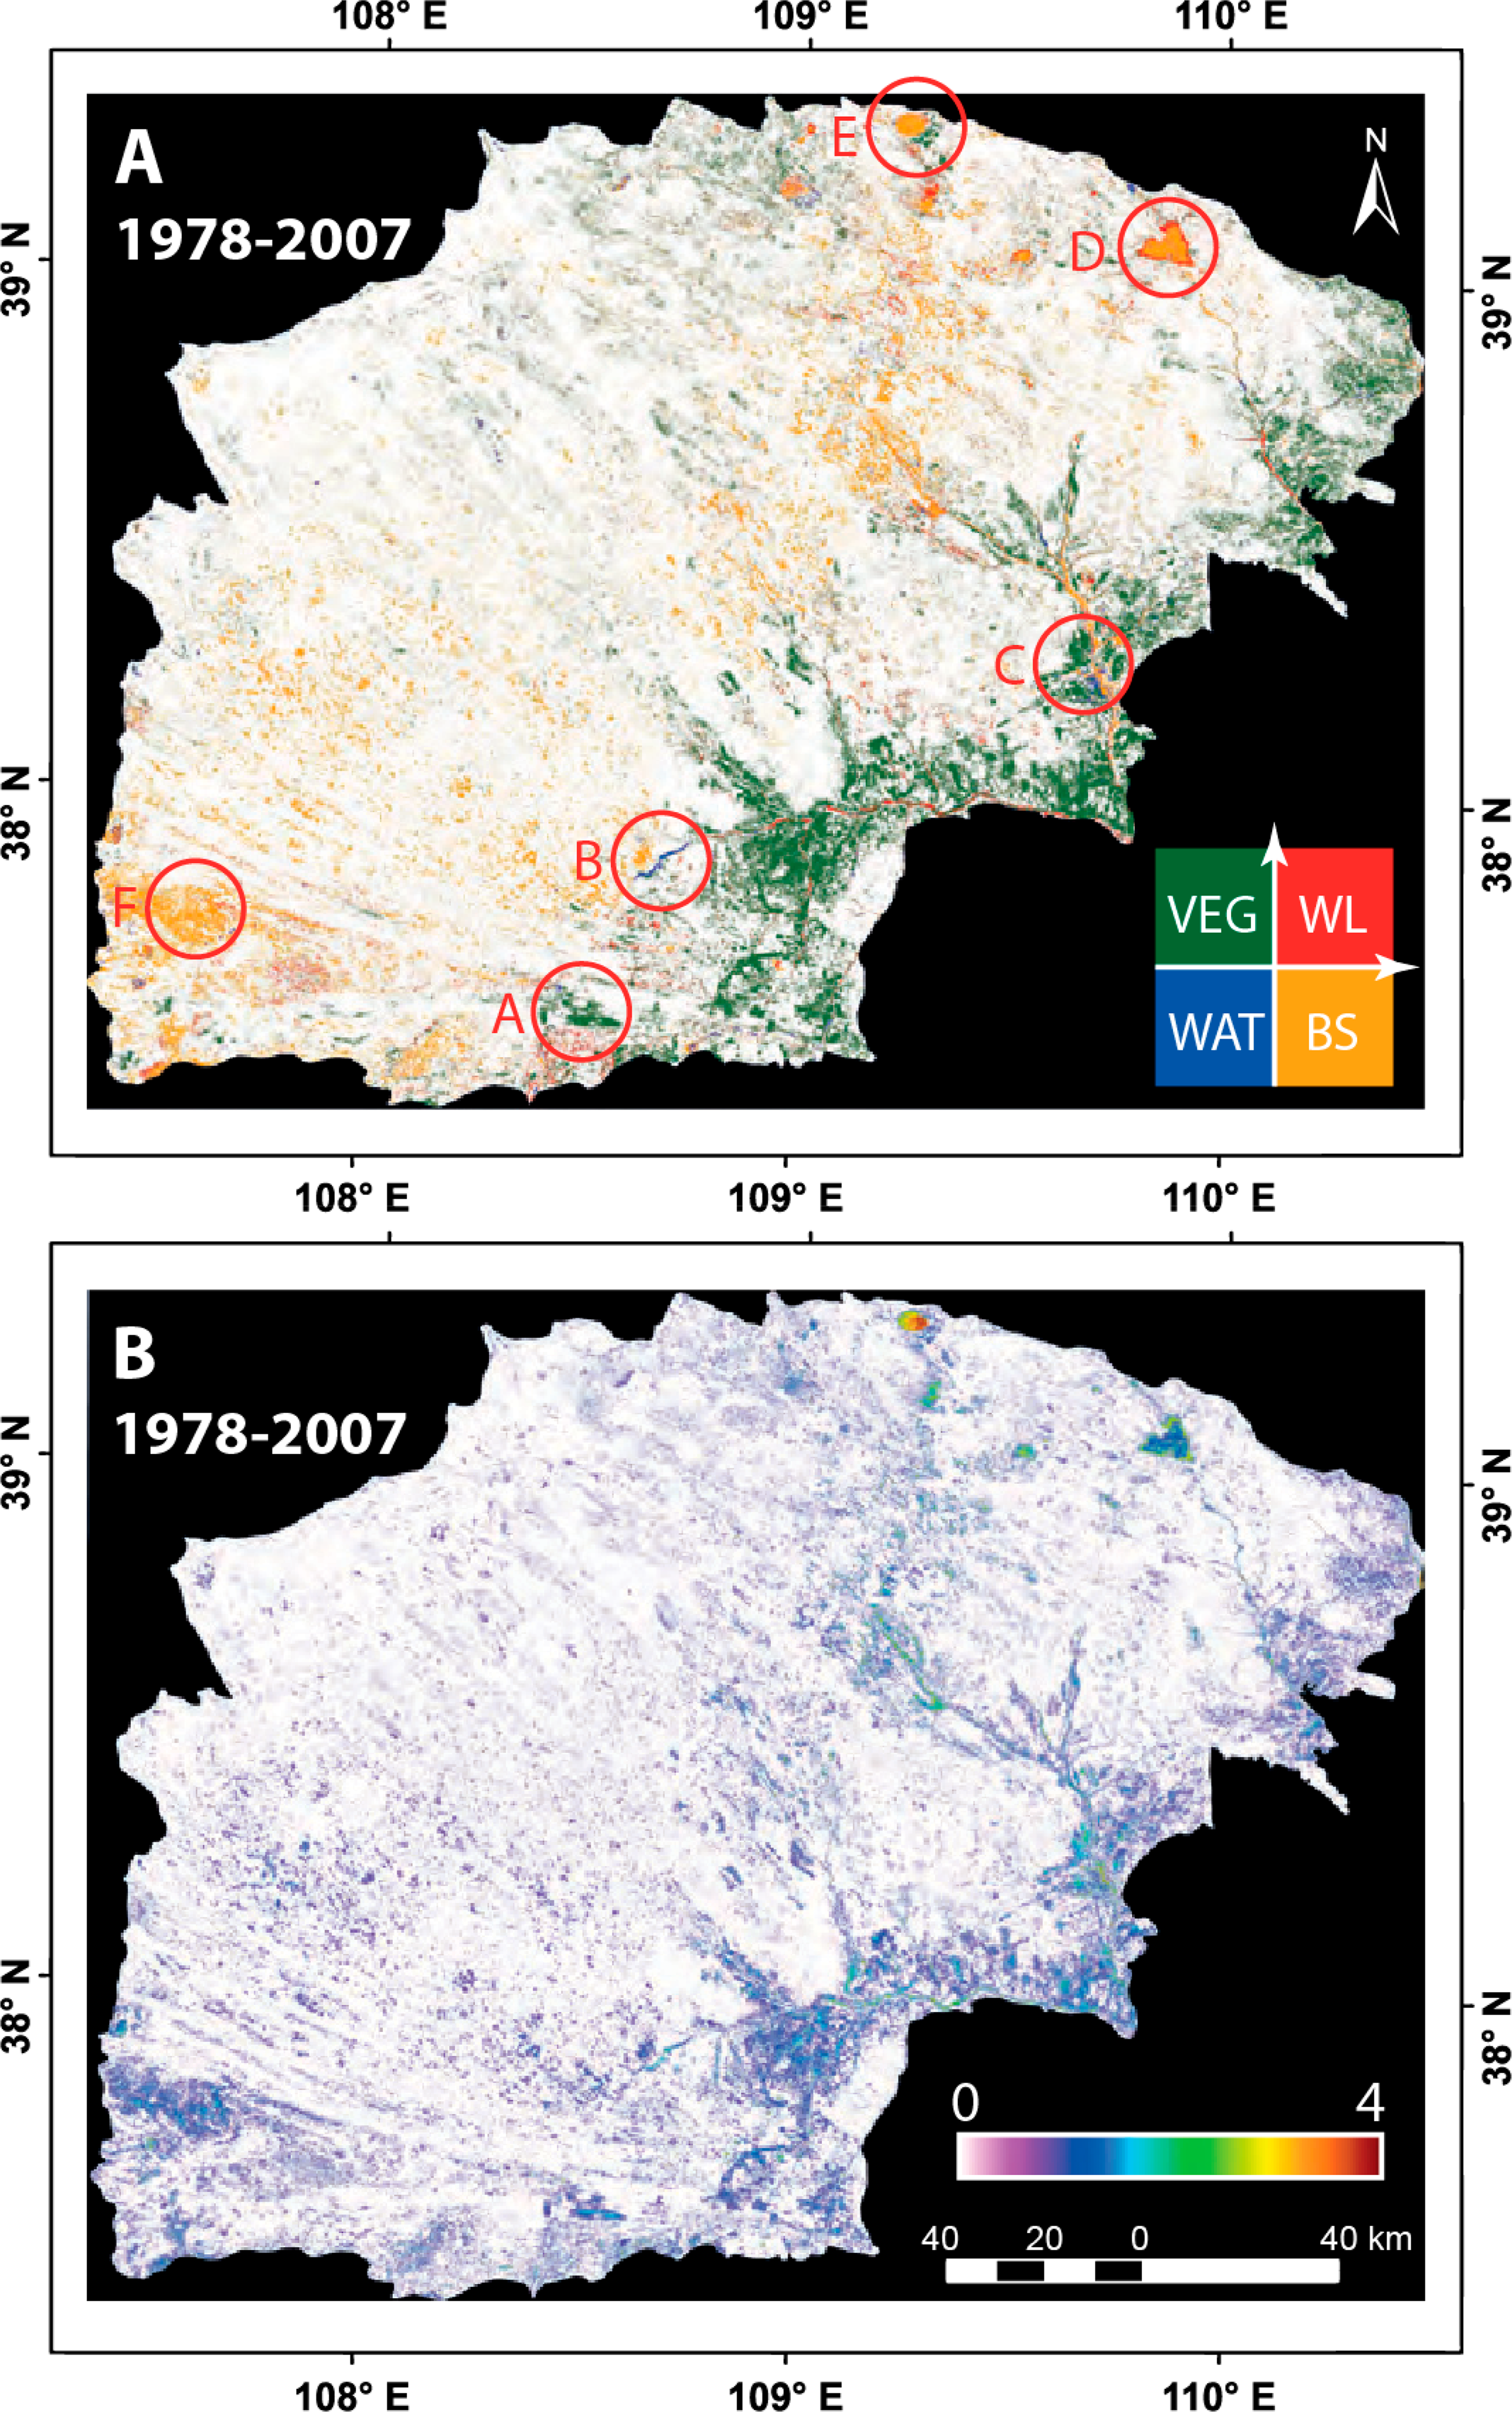
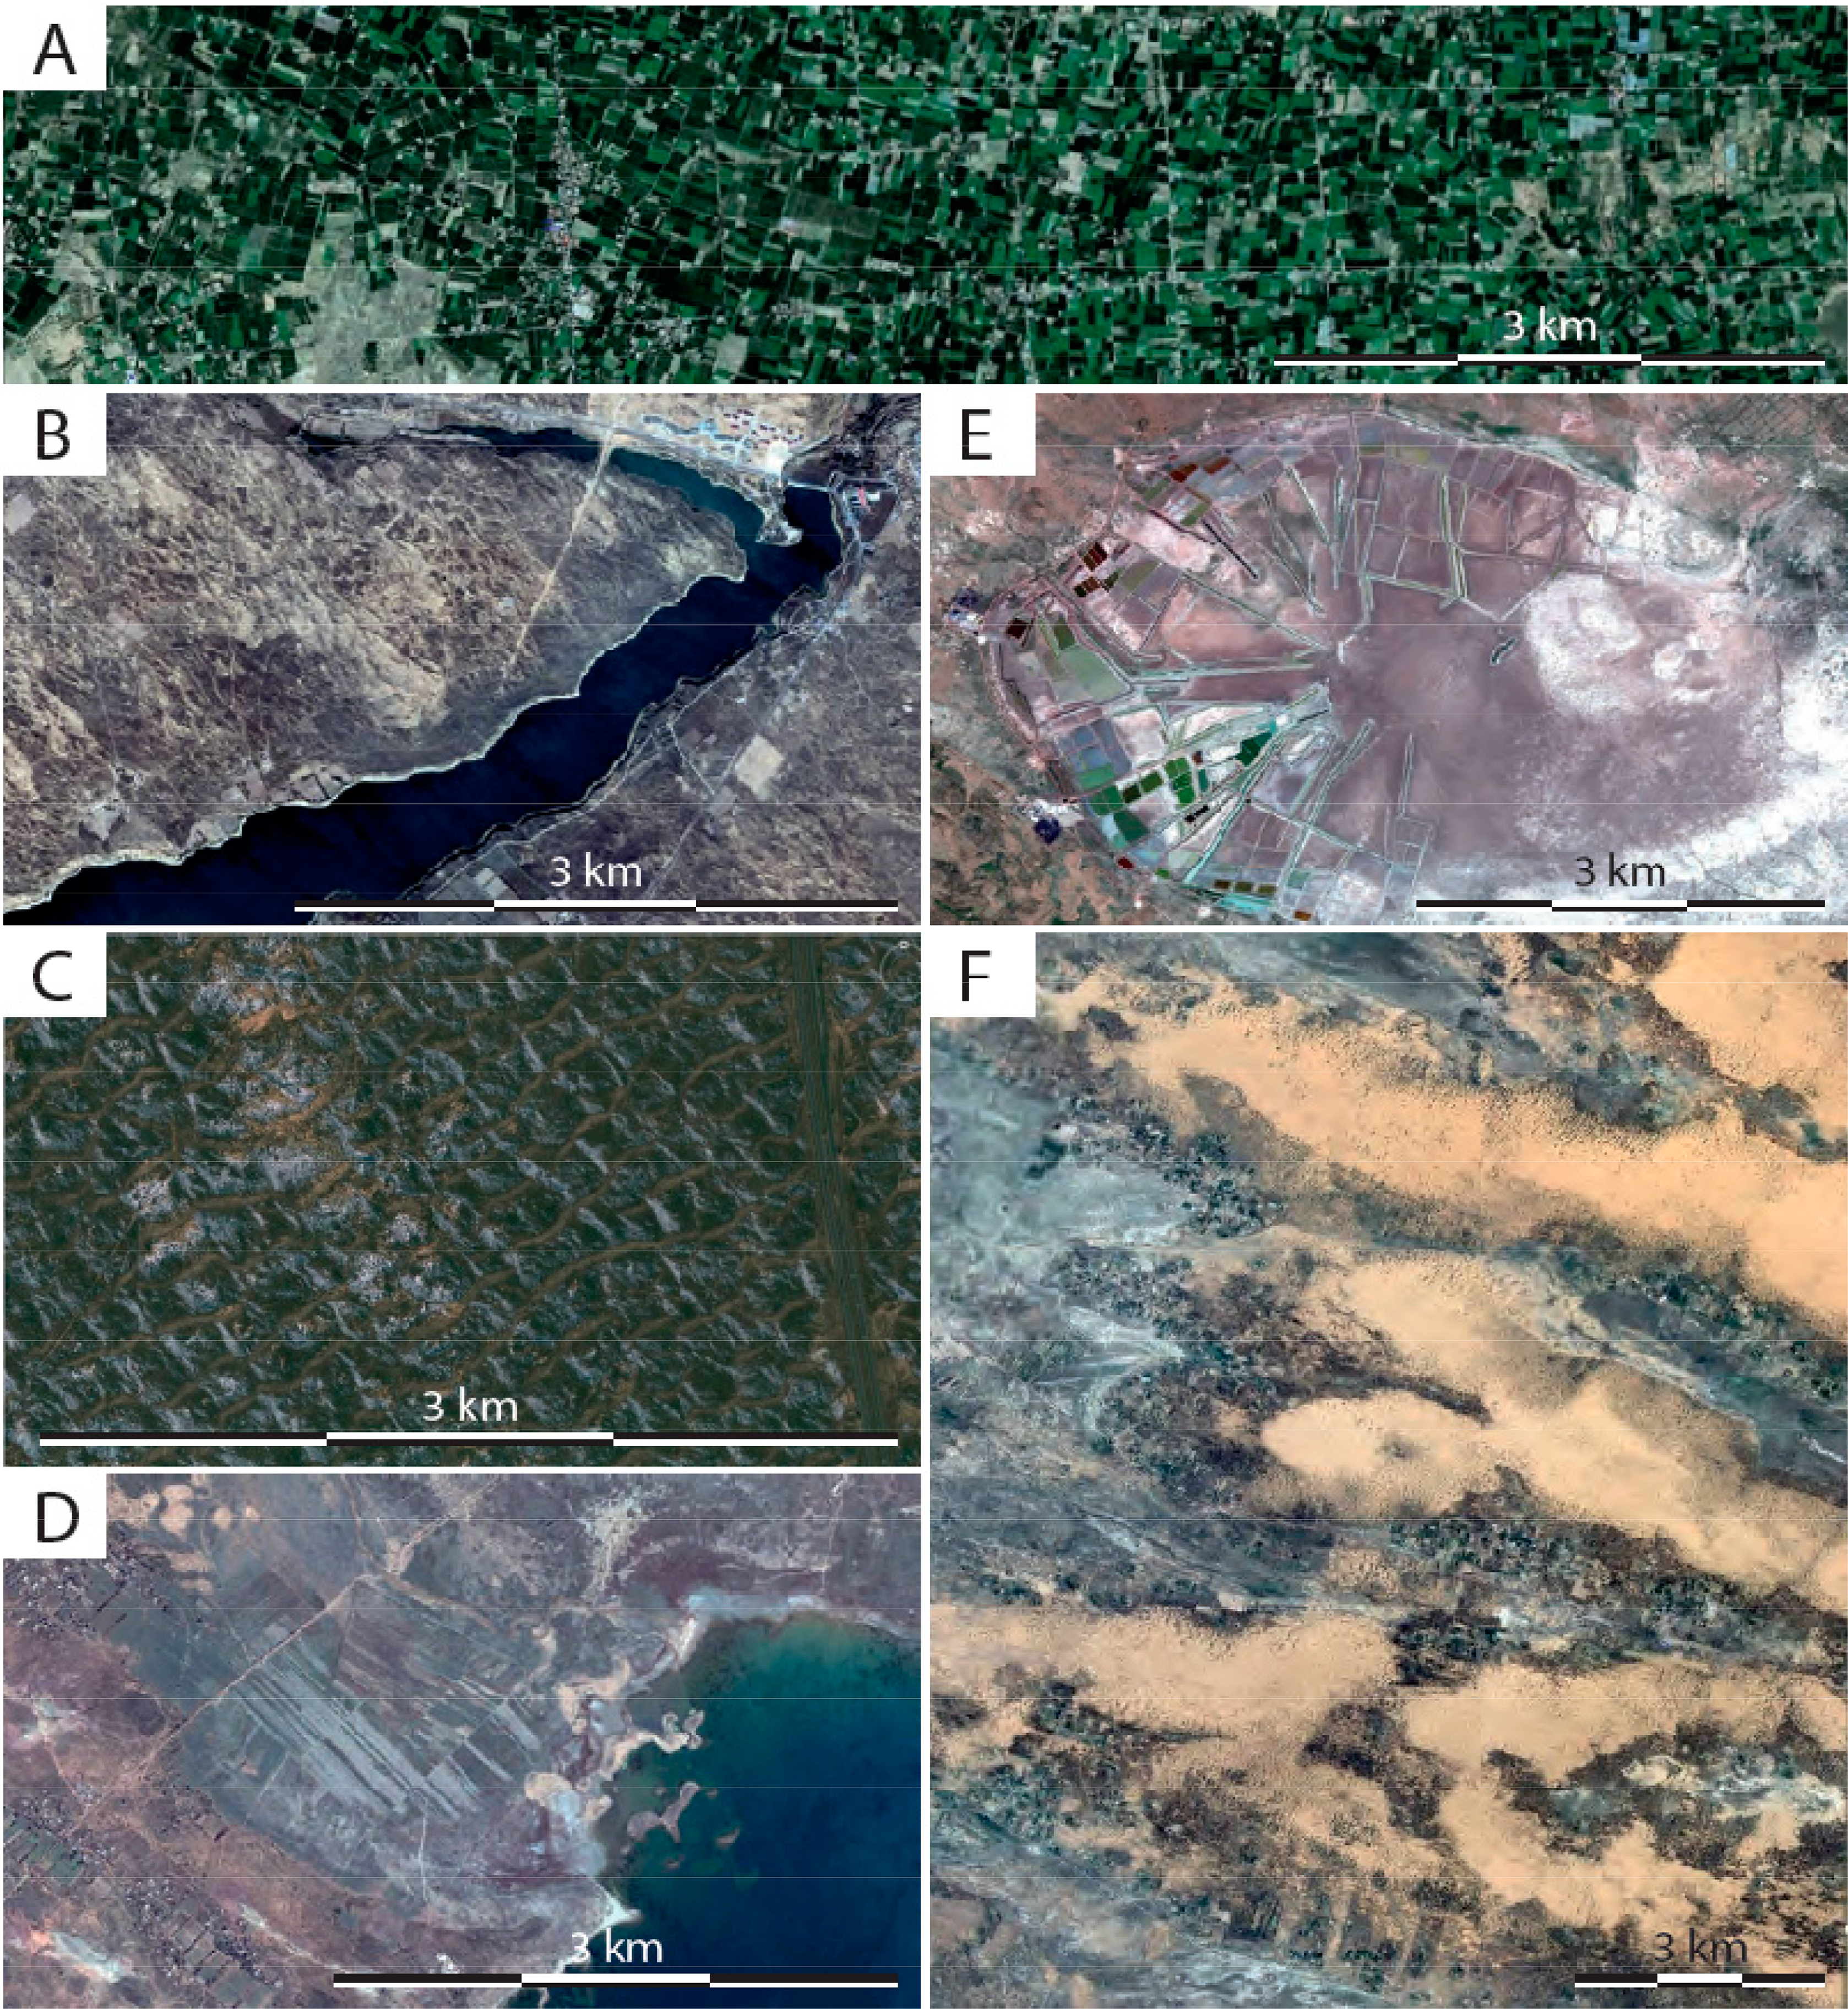
Figure 8 shows the CVA products for the entire study period (1978–2007). In general, it can be seen that vegetation growth and dune stabilization is evident in the eastern Mu Us Sandy Land, while bare sands have expanded to the central-northern and the southwestern parts. These results are consistent with those published in other studies (e.g., [21,26]). Several hot-spot change sites were used for visual interpretation of the results and to confirm the validity of the processes resulted by the CVA variables. This was implemented by zooming-in with very high spatial resolution images acquired by Ikonos, QuickBird or WorldView that are available online on the Google Earth website (Figure 9). Figure 9A (corresponds to Point A in Figure 8A) shows intensive rain-fed agricultural fields in the lowlands. The main crops in the Mu Us Sandy Land are maize and potatoes, sown in May and harvested in October. Figure 9B (corresponds to Point B in Figure 8A) exhibits the Batuwan Reservoir on the Wunding River. It is one of a series of water reservoirs in the region that were built to generate electricity and to supply water for irrigation and industrial purposes [58]. Figure 9C (corresponds to Point C in Figure 8A) demonstrates afforestation activities to stabilize small transverse to barchanoid ridge dunes. Trees, such as Pinus sylvestris var. mongolica, have been planted since the 1980s near the city of Yulin, and bushes, mainly Hedysarum scoparium and H. leave, were seeded from the air [3,8]. Figure 9D (corresponds to Point D in Figure 8A) shows wetlands to the north of Hongjiannao, China’s largest desert lake, which has shrunk by about 10 km2 between 1989 and 2007, and its water level is declining by 20 cm annually. The lake is fed by a high level of groundwater and a small river flowing from the north. It is predicted that the lake may vanish in a few decades, due to climate change and human activities, since water has been transported to irrigate the nearby croplands [59,60]. Wetlands are located in the northern part of the lake, near the river inlet, where high albedo values are created by exposed salt and alkali layers, while high NDVI values are caused by vegetation [61]. Figure 9E (corresponds to Point E in Figure 8A) shows Kangjia Bala’er, one of the former water lakes that, since drying up, has become an alkali quarry. Figure 9F (corresponds to Point F in Figure 8A) presents shifting longitudinal dunes that were caused by combined anthropogenic reasons (e.g., grazing pressure) and strong westerly winds that characterize the western part of the Mu Us Sandy Land [21]. These dunes expand into arable lands and urban areas.
Table 2 summarizes the total area changed for each of the studied time periods and for the entire period. It can be seen that the main changes, although small (3%–6% for each category), occur in vegetation-cover exposed sands. Changes of water bodies and wetlands are only of about 1%. The majority of the area (88%–90%) remains unchanged. For the entire period, vegetation cover increased by 6% and bare sands increased by 5.1%. Linking these values with Figure 4, it is suggested that during the study years, vegetation was recovered in some areas, while in others areas, vegetation was removed.
5. Discussion
Various earlier studies have calculated the LULC classification of the Mu Us Sandy Land and elsewhere, using Landsat images in different time steps since the 1970s. These studies presented 3–4 severity categories of desertification (e.g., severe, moderate, slight) or dune stability (e.g., mobile, semi-mobile, semi-fixed, fixed) along with their temporal trends in selected years stemming from the availability of the images [8,13,15,17,25,26]. In order to assess long-term changes, an alternative approach was implemented and described in the current research, namely CVA. CVA has two outputs—direction and magnitude; each of these is presented continuously, pixel by pixel, in the spatial domain. This technique produces a relative change between successive images without the need to struggle with uncertain classification. However, CVA strongly depends on the accurate radiometric calibration of each image, as well as on global (i.e., of all images involved) normalization of the spectral bands or variables.
It is worth mentioning that none of previous studies showed an accuracy assessment since no extensive field surveys were conducted in this vast and remote desert, nor have aerial photographs been continuously available for an objective and independent validation of the classifications [21]. For the same reasons, such a procedure was not possible in the current study. However, as commonly accepted that validation is performed with a higher resolution data than the used one, Ikonos and QuickBird images with 4-m resolution were employed for validation over specific key sites (rather than the entire study domain). Results successfully verified that a reservoir behind a dam is in agreement with the water quadrant of the CVA. The agricultural fields and afforestation areas are in agreement with the vegetation quadrant, the exposed salt and alkali layers are in agreement with the wetland quadrant, and the drying lake is in agreement with the bare soil quadrant.
In this study, the CVA methodology was to build “bottom-up”. First, the temporal dynamics of the two variables, NDVI and albedo, were examined in the Mu Us Sandy Land by utilizing a time series of combined NOAA-AVHRR and MODIS datasets. Upon inferring that the NDVI time series is significantly increasing while that of the albedo is decreasing, the hypothesis about the relationship between these variables and rehabilitation vs. sandification processes was developed.
Change detection studies that rely on irregular satellite images might pose a problem and uncertainty in the results [12,62], mainly due to year-to-year fluctuations of precipitation that can introduce a false-alarm in the long-term interpretation. To overcome this drawback, the long-term LULCC analysis was based explicitly on images of above-average rainy years and from the same phenological stage. Seasonal variability of the rainfall is another factor that might affect the spectral signal, and therefore was carefully examined. Short-term changes, such as a rainy year followed a drought year, reveal changes in different areas than long-term changes. This strengthens the reliability of long-term changes’ results.
In the current study, NDVI and albedo were chosen to represent changes in vegetation and bare sands, respectively. Various previous studies that applied CVA as a change detection algorithm for vegetation and soil used the tasseled cap’s brightness and greenness [35,38,63–67]. It is likely that both biophysical spectral variables would end up with close results. However, the chosen set of variables was found to be more applicative when using a long-term Landsat series. The reason is that there are different units for tasseled-cap transformations derived from different Landsat sensors. Digital numbers (DN)-based transformation values are available for MSS onboard Landsat 1 and 2 and TM onboard Landsat 4 and 5 [68,69]. Needless to say, DN-based transformations on different images might introduce a considerable error due to the different geometries of sun illumination. Moreover, no values are available for Landsat 3 (used in the current study). Reflectance-based transformation values are available for TM onboard Landsat 4 [70] and apparent reflectance-based transformation values for ETM+ onboard Landsat 7 [71]. Obviously, these three types of units make it difficult to process long-term data from different Landsat systems. NDVI and albedo, on the other hand, are calculated with reflectance values.
6. Summary and Conclusions
The spatial extent of desertified vs. rehabilitated areas in the Mu Us Sandy Land, China, and their causes, either natural or anthropogenic, were explored to settle previously-published contradictory findings. In order to fulfill this goal, the CVA technique was implemented using two variables—NDVI and albedo. While changes in NDVI reflect changes in vegetation cover, albedo depicts changes in bare sand cover. Using these variables, four categories of land cover change were computed—vegetation, exposed sands, water bodies and wetlands. The conclusions of this paper are twofold—technical and regional as itemized below.
Prior to the CVA, high accuracy pre-processing of the raw images, including atmospheric and geometric corrections, as well as normalization of the entire dataset, had to be performed. This was a crucial step without which long-term analyses could not have been performed.
The main advantage of CVA is the ability to concurrently process the data in the spectral and temporal domains, thus enabling the separation of direction and magnitude of the changes in a continuous manner, rather than in broad qualitative classes, such as slight-, moderate-, or severe land degradation.
The chosen variables (NDVI and albedo) were selected based on long-term time series analysis of these two variables derived from NOAA-AVHRR and MODIS data. The CVA’s direction and magnitude products detect finer changes compared to separate NDVI or albedo difference/ratio images.
NDVI and albedo, although comparable to tasseled cap’s brightness and greenness indices, have the advantage of being computed using reflectance values extracted from various Landsat platforms since the early 1970s.
Each of the four major sectors has a biophysical meaning that was validated in selected hot-spots, employing very high spatial resolution images.
Careful selection of images, taking into account inter- and intra-annual variability of rainfall, enables differentiating between short-term conservancies (e.g., drought) and long-term alterations.
Over the entire study period, despite the gradual increase in livestock and consequent growing grazing pressure, some portion of the area, mainly in the east, was under rehabilitation processes, in terms of increasing vegetation cover. Re-growth was a result of increased agricultural activity, planting or air seeding of herbs, grasses, bushes, and trees, and of building lee-shelters, windbreaks and barriers. This is most likely due to the national and local governmental policy to stabilize shifting sands and create pastures by increasing the surface roughness and, thus, decreasing wind speed. In other areas, bare sands expanded to the central-north and the southwest. It is concluded that CVA applied to albedo and NDVI may serve as a useful tool for studying LULC dynamics in arid environment.
Acknowledgments
This study is supported by the National Basic Research Program of China (973 Program) (Grant No. 2010CB951504). The authors sincerely thank Qiang Yang in Nanjing University for helping to obtain meteorological data and a land-use map of the region.
Author Contributions
All authors significantly contributed to the manuscript. Arnon Karnieli is the main author who initiated the idea, developed the research concept, and wrote the manuscript. Zhihao Qin and Bo Wu introduced the study area and provided the Landsat images from the Chinese receiving station. Natalya Panov carried out the image processing and analysis. Feng Yan was involved in the image processing and classification.
Conflicts of Interest
The authors declare no conflict of interest.
References
- Zha, Y.; Gao, J. Characteristics of desertification and its rehabilitation in China. J. Arid Environ 1997, 37, 419–432. [Google Scholar]
- Jiang, H. Culture, ecology, and nature’s changing balance: Sandification on Mu Us Sandy land, Inner Mongolia, China. In Global Desertification: Do Humans Cause Deserts? Reynolds, J.F., Stafford Smith, D.M., Eds.; Dahlem University Press: Berlin, Germany, 2002; pp. 181–196. [Google Scholar]
- Wang, T.; Wu, W. Combating desertification in China. In Proceedings of the International Symposium on New Technologies to Combat Desertification, Tehran, Iran, 12–15 October 1998; United Nations University: Tokyo, Japan, 1998. [Google Scholar]
- China_Tibet_Online. The Bulletin of Status Quo of Desertification and Sandification in China. Available online: http://eng.tibet.cn/2010home/news/201101/t20110109_817662.html (accessed on 24 June 2011).
- Wang, T.; Wu, W.; Xue, X.; Han, Z.; Zhang, W.; Sun, Q. Spatial-temporal changes of sandy desertified land during last 5 decades in northern China. Acta Geogr. Sin 2004, 59, 203–212. [Google Scholar]
- Wu, B.; Ci, L.J. Developing stages and causes of desertification in the Mu Us Sandland. Chin. Sci. Bull 1999, 44, 845–849. [Google Scholar]
- Lu, N.; Wilske, B.; Ni, J.; John, R.; Chen, J. Climate change in Inner Mongolia from 1955 to 2005-trends at regional, biome and local scales. Environ. Res. Lett 2009, 4, 1–6. [Google Scholar]
- Wu, B.; Ci, L.J. Landscape change and desertification development in the Mu Us Sandland, northern China. J. Arid Environ 2002, 50, 429–444. [Google Scholar]
- Guangyum, L. The Green Historical Journey of China; The Great Wall Publishing House: Beijing, China, 1991. [Google Scholar]
- Gao, Z.; Li, C.; Ci, L.; Yang, X. Engineering and technological measures for combating desertification. In Desertification and Its Control in China; Ci, L., Yang, X., Eds.; Higher Education Press: Beijing, China, 2010; pp. 427–463. [Google Scholar]
- Zha, Y.; Liu, Y.; Deng, X. A landscape approach to quantifying land cover changes in Yulin, Northwest China. Environ. Monit. Assess 2008, 138, 139–147. [Google Scholar]
- Runnstrom, M.C. Rangeland development of the Mu Us Sandy Land in semiarid China: An analysis using landsat and NOAA remote sensing data. Land Degrad. Dev 2003, 14, 189–202. [Google Scholar]
- Zhang, L.; Yue, L.P.; Xia, B. The study of land desertification in transitional zones between the MU US Desert and the Loess Plateau using RS and GIS—A case study of the Yulin region. Environm. Geol 2003, 44, 530–534. [Google Scholar]
- Wu, W. Study on process of desertification in Mu Us Sandy Land for last 50 years, China. J. Desert Res 2001, 21, 164–169. [Google Scholar]
- Xu, D.Y.; Kang, X.W.; Qiu, D.S.; Zhuang, D.F.; Pan, J.J. Quantitative assessment of desertification using Landsat data on a regional scale—A case study in the Ordos Plateau, China. Sensors 2009, 9, 1738–1753. [Google Scholar]
- Wang, T.; Wu, W.; Wang, X. Remote sensing monitoring and assessing sandy desertification: An example from the sandy desertification region of northern China. Quat. Sci 1998, 18, 108–118. [Google Scholar]
- Zhang, Y.Z.; Chen, Z.Y.; Zhu, B.Q.; Luo, X.Y.; Guan, Y.N.; Guo, S.; Nie, Y.P. Land desertification monitoring and assessment in Yulin of Northwest China using remote sensing and geographic information systems (GIS). Environ. Monit. Assess 2008, 147, 327–337. [Google Scholar]
- Jabbar, M.T.; Chen, X.L. Land degradation assessment with the aid of geo-information techniques. Earth Surf. Processes Landf 2006, 31, 777–784. [Google Scholar]
- Yang, X.; Zhang, K.; Jia, B.; Ci, L. Desertification assessment in China: An overview. J. Arid Environ 2005, 63, 517–531. [Google Scholar]
- Wu, W.; Wang, X.Z.; Yao, F.F. Applying remote sensing data for desertification monitoring in the Mu Us Sandland. J. Desert Res 1997, 17, 415–420. [Google Scholar]
- Mason, J.A.; Swinehart, J.B.; Lu, H.Y.; Miao, X.D.; Cha, P.E.; Zhou, Y.L. Limited change in dune mobility in response to a large decrease in wind power in semi-arid northern China since the 1970s. Geomorphology 2008, 102, 351–363. [Google Scholar]
- Liu, S.L.; Wang, T. Aeolian desertification from the mid-1970s to 2005 in Otindag Sandy Land, northern China. Environ. Geol 2007, 51, 1057–1064. [Google Scholar]
- Gao, J.; Zha, Y.; Ni, S. Assessment of the effectiveness of desertification rehabilitation measures in Yulin, north-western China using remote sensing. Int. J. Remote Sens 2001, 22, 3783–3795. [Google Scholar]
- Ju, C.Y.; Cai, T.J.; Yang, X.H. Topography-based modeling to estimate percent vegetation cover in semi-arid Mu Us Sandy Land, China. Comput. Electron. Agric 2008, 64, 133–139. [Google Scholar]
- Yan, C.Z.; Wang, T.; Han, Z.W.; Qie, Y.F. Surveying sandy deserts and desertified lands in north-western China by remote sensing. Int. J. Remote Sens 2007, 28, 3603–3618. [Google Scholar]
- Qi, Y.; Chang, Q.; Jia, K.; Liu, M.; Liu, J.; Chen, T. Remote sensing-based temporal-spatial variability of desertification and driving forces in an agro-pastoral transitional zone of Northern Shaanxi Province, China. Afr. J. Agric. Res 2011, 6, 1707–1716. [Google Scholar]
- John, R.; Chen, J.Q.; Lu, N.; Wilske, B. Land cover/land use change in semi-arid Inner Mongolia: 1992–2004. Environ. Res. Lett 2009, 4, 1–9. [Google Scholar]
- Malila, W.A. Change vector analysis: An approach for detecting forest changes with Landsat. In Proceedings of Sixth Annual Symposium on Machine Processing of Remotely Sensed Data: Soil Information Systems and Remote Sensing and Soil Survey, West Lafayette, IN, USA, 3–6 June 1980; Burroff, P.G., Morrison, D.B., Eds.; Purdue University Press: West Lafayette, IN, USA, 1980; pp. 326–335. [Google Scholar]
- Virag, L.A.; Colwell, J.E. An improved procedure for analysis of change in Thematic Mapper image-pairs. In Proceedings of the 21st Internatwnal Symposium on Remote Sensing of Environment, Ann Arbor, MI, USA, 26–30 October 1987; pp. 1101–1110.
- Lambin, E.F. Change detection at multiple temporal scales: Seasonal and annual variations in landscape variables. Photogramm. Eng. Remote Sens 1996, 62, 931–938. [Google Scholar]
- Lambin, E.F.; Ehrlich, D. Land-cover changes in Sub-Saharan Africa (1982–1991): Application of a change index based on remotely sensed surface temperature and vegetation indices at a continental scale. Remote Sens. Environ 1997, 61, 181–200. [Google Scholar]
- Lambin, E.F.; Strahler, A.H. Indicators of land-cover change for change-vector analysis in multitemporal space at coarse spatial scales. Int. J. Remote Sens 1994, 15, 2099–2119. [Google Scholar]
- Lambin, E.F.; Strahler, A.H. Change-vector analysis in multitemporal space—A tool to detect and categorize land-cover change processes using high temporal-resolution satellite data. Remote Sens. Environ 1994, 48, 231–244. [Google Scholar]
- Coppin, P.; Jonckheere, I.; Nackaerts, K.; Muys, B.; Lambin, E. Digital change detection methods in ecosystem monitoring: A review. Int. J. Remote Sens 2004, 25, 1565–1596. [Google Scholar]
- Siwe, R.N.; Koch, B. Change vector analysis to categorise land cover change processes using the tasselled cap as biophysical indicator. Environ. Monit. Assess 2008, 145, 227–235. [Google Scholar]
- Nackaerts, K.; Vaesen, K.; Muys, B.; Coppin, P. Comparative performance of a modified change vector analysis in forest change detection. Int. J. Remote Sens 2005, 26, 839–852. [Google Scholar]
- Phua, M.H.; Tsuyuki, S.; Furuya, N.; Lee, J.S. Detecting deforestation with a spectral change detection approach using multitemporal Landsat data: A case study of Kinabalu Park, Sabah, Malaysia. J. Environ. Manag 2008, 88, 784–795. [Google Scholar]
- Sanchez Flores, E.; Yool, S.R. Sensitivity of change vector analysis to land cover change in an arid ecosystem. Int. J. Remote Sens 2007, 28, 1069–1088. [Google Scholar]
- Dawelbait, M.A.A.; Morari, F. LANDSAT, spectral mixture analysis and change vector analysis to monitor land cover degradation in a savanna region in Sudan (1987–1999–2008). Int. J. Water Resour. Arid Environ 2011, 1, 366–377. [Google Scholar]
- Dawelbait, M.; Morari, F. Monitoring desertification in a savannah region in Sudan using Landsat images and spectral mixture analysis. J. Arid Environ 2012, 80, 45–55. [Google Scholar]
- Dubovyk, O.; Menz, G.; Conrad, C.; Thonfeld, F.; Khamzina, A. Object-based identification of vegetation cover decline in irrigated agro-ecosystems in Uzbekistan. Quat. Int 2013, 311, 163–174. [Google Scholar]
- Deng, H.; Shu, S.G.; Song, Y.Q.; Xing, F.L. Distribution of sand dunes and sand shifts along the southern fringe of the Mu Us Desert since the Ming Dynasty. Chin. Sci. Bull 2007, 52, 3128–3138. [Google Scholar]
- Zhang, X.S. Ecological background, principles of management and optimized models of the Mu Us sandy grasslands. Acta Phytoecol. Sin 1994, 18, 1–16. [Google Scholar]
- Sun, J.; Zou, X.; Gao, Q.; Jia, B.; Yang, X. Natural background of China’s drylands. In Desertification and Its Control in China; Ci, L., Yang, X., Eds.; Higher Education Press: Beijing, China, 2010; pp. 29–99. [Google Scholar]
- Wang, X.; Chen, F.H.; Dong, Z.; Xia, D. Evolution of the southern Mu Us Desert in North China over the past 50 years: An analysis using proxies of human activity and climate parameters. Land Degrad. Dev 2005, 16, 351–366. [Google Scholar]
- Tucker, C.J. Red and photographic infrared linear combinations for monitoring vegetation. Remote Sens. Environ 1979, 8, 127–150. [Google Scholar]
- Holben, B.N. Characteristics of maximum-value composite images from temporal AVHRR data. Int. J. Remote Sens 1986, 7, 1417–1434. [Google Scholar]
- Chavez, P.S. Image-based atmospheric corrections revisited and improved. Photogramm. Eng. Remote Sens 1996, 62, 1025–1036. [Google Scholar]
- Song, C.; Woodcock, C.E.; Seto, K.C.; Lenney, M.P.; Macomber, S.A. Classification and change detection using Landsat TM data: When and how to correct atmospheric effects? Remote Sens. Environ 2001, 75, 230–244. [Google Scholar]
- Chander, G.; Markham, B.L.; Helder, D.L. Summary of current radiometric calibration coefficients for Landsat MSS, TM, ETM+, and EO-1 ALI sensors. Remote Sens. Environ 2009, 113, 893–903. [Google Scholar]
- Musick, H.B. Temporal change of Landsat MSS albedo estimates in arid rangeland. Remote Sens. Environ 1986, 20, 107–120. [Google Scholar]
- Liang, S.L.; Shuey, C.J.; Russ, A.L.; Fang, H.L.; Chen, M.Z.; Walthall, C.L.; Daughtry, C.S.T.; Hunt, R. Narrowband to broadband conversions of land surface albedo: II. Validation. Remote Sens. Environ 2003, 84, 25–41. [Google Scholar]
- Bayarjargal, Y.; Karnieli, A.; Bayasgalan, M.; Khudulmur, S.; Gandush, C.; Tucker, C.J. A comparative study of NOAA-AVHRR derived drought indices using change vector analysis. Remote Sens. Environ 2006, 105, 9–22. [Google Scholar]
- Horning, N.; Robinson, J.A.; Sterling, E.J.; Turner, W.; Spector, S. Remote Sensing for Ecology and Conservation: A Handbook of Techniques; Oxford University Press: New York, NY, USA, 2010. [Google Scholar]
- Johnson, R.D.; Kasischke, E.S. Change vector analysis: A technique for the multispectral monitoring of land cover and condition. Int. J. Remote Sens 1998, 19, 411–426. [Google Scholar]
- Paz-Kagan, T.; Panov, N.; Shachak, M.; Zaady, E.; Karnieli, A. Structural changes of desertified and managed shrubland landscapes in response to drought: Spectral, spatial and temporal analyses. Remote Sens 2014, 6, 8134–8164. [Google Scholar]
- Volcani, A.; Karnieli, A.; Svoray, T. The use of remote sensing and GIS for spatio-temporal analysis of the physiological state of a semi-arid forest with respect to drought years. For. Ecol. Manag 2005, 215, 239–250. [Google Scholar]
- Song, Y.; Yan, P.; Du, J.-H.; Zhao, P.; Gao, X.-S.; Yue, Y.-J.; Pan, X.-H.; Zhu, M.-J. Evaluation on the amount of sand transported into the Batuwan Reservoir. J. Arid Land Resour. Environ 2008, 22, 68–73. [Google Scholar]
- Zhang, H.-Y.; Liu, P.-P.; Li, X.-X. Land use dynamic change of Hongjiannao watershed in northern Shaanxi Province. Environ. Sci. Technol 2011, 34, 180–183. [Google Scholar]
- China Daily (2009) Expert: China’s Largest Desert Lake May Vanish in Decades. Available online: http://www.chinadaily.com.cn/china/2009-07/27/content_8478515.htm (accessed on 27 July 2009).
- Shen, J.; Wang, Y.; Yang, X.D.; Zhang, E.L.; Yang, B.; Ji, J.F. Paleosandstorm characteristics and lake evolution history deduced from investigation on lacustrine sediments—The case of Hongjiannao Lake, Shaanxi Province. Chin. Sci. Bull 2005, 50, 2355–2361. [Google Scholar]
- Wu, W.; de Pauw, E.; Zucca, C. Land degradation monitoring in the West Muus, China. In Proceedings of XXIst ISPRS Congress, Technical Commission VIII, China, 3–11 July 2008; pp. 847–858.
- Dhakal, A.S.; Amada, T.; Aniya, M.; Sharma, R.R. Detection of areas associated with flood and erosion caused by a heavy rainfall using multitemporal Landsat TM data. Photogramm. Eng. Remote Sens 2002, 68, 233–239. [Google Scholar]
- Allen, T.R.; Kupfer, J.A. Application of spherical statistics to change vector analysis of Landsat data: Southern Appalachian spruce-fir forests. Remote Sens. Environ 2000, 74, 482–493. [Google Scholar]
- Foster, J.R.; Townsend, P.A.; Zganjar, C.E. Spatial and temporal patterns of gap dominance by low-canopy lianas detected using EO-1 Hyperion and Landsat Thematic Mapper. Remote Sens. Environ 2008, 112, 2104–2117. [Google Scholar]
- Kennedy, R.E.; Cohen, W.B.; Schroeder, T.A. Trajectory-based change detection for automated characterization of forest disturbance dynamics. Remote Sens. Environ 2007, 110, 370–386. [Google Scholar]
- Wulder, A.A.; Skakun, R.S.; Kurz, W.A.; White, J.C. Estimating time since forest harvest using segmented Landsat ETM+ imagery. Remote Sens. Environ 2004, 93, 179–187. [Google Scholar]
- Kauth, R.J.; Thomas, G.S. The tasseled cap—A graphic description of the spectral-temporal development of agricultural crops as seen in Landsat. Proceedings of the Symposium on Machine Processing of Remotely Sensed Data, West Lafayette, IN, USA, 29 June–1 July 1976; LARS, Purdue University: West Lafayette, IN, USA, 1976; pp. 41–51. [Google Scholar]
- Crist, E.P.; Cicone, R.C. A physically-based transformation of Thematic Mapper data—The TM tasseled cap. IEEE Trans. Geosci. Remote Sens 1984, 22, 256–263. [Google Scholar]
- Crist, E.P. A TM tasseled cap equivalent transformation for reflectance factor data. Remote Sens. Environ 1985, 17, 301–306. [Google Scholar]
- Huang, C.; Wylie, B.; Yang, L.; Homer, C.; Zylstra, G. Derivation of a tasselled cap transformation based on Landsat 7 at-satellite reflectance. Int. J. Remote Sens 2002, 23, 1741–1748. [Google Scholar]


| System | Path/Row * | Path/Row | Path/Row | Path/Row | Denoted in Text |
|---|---|---|---|---|---|
| 127/33 | 127/34 | 128/33 | 128/34 | ||
| Landsat-3 MSS | 19-Aug-78 | 19-Aug-78 | 20-Aug-78 | 20-Aug-78 | 1978 |
| Landsat-5 TM | 11-Sep-89 | 29-Aug-90 | 15-Sep-88 | 23-Aug-91 | 1988 |
| Landsat-7 ETM+ | 31-Jul-99 | 01-Sep-00 | 22-Sep-99 | 22-Sep-99 | 1999 |
| Landsat-7 ETM+ | 6-Aug-02 | 23-Sep-02 | 10-Aug-01 | 10-Aug-01 | 2001 |
| Landsat-5 TM | 12-Aug-07 | 12-Aug-07 | 03-Aug-07 | 03-Aug-07 | 2007 |
*Path and row are according to the Landsat’s World Reference System (WRS)-2. Note that, for the MSS, the path numbers are 137 and 138 rather than 127 and 128, respectively.
| Years | Vegetation (km2)/(%) | Bare Sands (km2)/(%) | Water Bodies (km2)/(%) | Wetlands (km2)/(%) | No Change (km2)/(%) | Total Area (km2)/(%) |
|---|---|---|---|---|---|---|
| 1978–1988 | 1719/4.5 | 1531/4.0 | 484/1.3 | 109/0.3 | 34,528/90 | 38,371/100 |
| 1988–2001 | 1397/3.6 | 1765/4.6 | 161/0.4 | 396/1.0 | 34,651/90.3 | 38,371/100 |
| 2001–2007 | 2137/5.6 | 1771/4.6 | 302/0.8 | 307/0.8 | 33,853/88.2 | 38,371/100 |
| 1978–2007 | 2304/6.0 | 1950/5.1 | 461/1.2 | 310/0.8 | 33,345/86.9 | 38,371/100 |
© 2014 by the authors; licensee MDPI, Basel, Switzerland This article is an open access article distributed under the terms and conditions of the Creative Commons Attribution license (http://creativecommons.org/licenses/by/4.0/).
Share and Cite
Karnieli, A.; Qin, Z.; Wu, B.; Panov, N.; Yan, F. Spatio-Temporal Dynamics of Land-Use and Land-Cover in the Mu Us Sandy Land, China, Using the Change Vector Analysis Technique. Remote Sens. 2014, 6, 9316-9339. https://doi.org/10.3390/rs6109316
Karnieli A, Qin Z, Wu B, Panov N, Yan F. Spatio-Temporal Dynamics of Land-Use and Land-Cover in the Mu Us Sandy Land, China, Using the Change Vector Analysis Technique. Remote Sensing. 2014; 6(10):9316-9339. https://doi.org/10.3390/rs6109316
Chicago/Turabian StyleKarnieli, Arnon, Zhihao Qin, Bo Wu, Natalya Panov, and Feng Yan. 2014. "Spatio-Temporal Dynamics of Land-Use and Land-Cover in the Mu Us Sandy Land, China, Using the Change Vector Analysis Technique" Remote Sensing 6, no. 10: 9316-9339. https://doi.org/10.3390/rs6109316