Next Article in Journal
Multi-Sensor Calibration Studies of AVHRR-Heritage Channel Radiances Using the Simultaneous Nadir Observation Approach
Next Article in Special Issue
Classification of Plot-Level Fire-Caused Tree Mortality in a Redwood Forest Using Digital Orthophotography and LiDAR
Previous Article in Journal / Special Issue
Burned Area Detection and Burn Severity Assessment of a Heathland Fire in Belgium Using Airborne Imaging Spectroscopy (APEX)
 
 
Correction published on 11 December 2014, see Remote Sens. 2014, 6(12), 12509-12510.
Article

A New Metric for Quantifying Burn Severity: The Relativized Burn Ratio

1
Aldo Leopold Wilderness Research Institute, Rocky Mountain Research Station, USDA Forest Service, 790 East Beckwith, Missoula, MT 59801, USA
2
Missoula Fire Sciences Laboratory, Rocky Mountain Research Station, USDA Forest Service, 5775 Hwy 10 W, Missoula, MT 59808, USA
*
Author to whom correspondence should be addressed.
Remote Sens. 2014, 6(3), 1827-1844; https://doi.org/10.3390/rs6031827
Submission received: 8 January 2014 / Revised: 17 February 2014 / Accepted: 24 February 2014 / Published: 27 February 2014
(This article belongs to the Special Issue Quantifying the Environmental Impact of Forest Fires)

Abstract

:
Satellite-inferred burn severity data have become increasingly popular over the last decade for management and research purposes. These data typically quantify spectral change between pre-and post-fire satellite images (usually Landsat). There is an active debate regarding which of the two main equations, the delta normalized burn ratio (dNBR) and its relativized form (RdNBR), is most suitable for quantifying burn severity; each has its critics. In this study, we propose and evaluate a new Landsat-based burn severity metric, the relativized burn ratio (RBR), that provides an alternative to dNBR and RdNBR. For 18 fires in the western US, we compared the performance of RBR to both dNBR and RdNBR by evaluating the agreement of these metrics with field-based burn severity measurements. Specifically, we evaluated (1) the correspondence between each metric and a continuous measure of burn severity (the composite burn index) and (2) the overall accuracy of each metric when classifying into discrete burn severity classes (i.e., unchanged, low, moderate, and high). Results indicate that RBR corresponds better to field-based measurements (average R2 among 18 fires = 0.786) than both dNBR (R2 = 0.761) and RdNBR (R2 = 0.766). Furthermore, the overall classification accuracy achieved with RBR (average among 18 fires = 70.5%) was higher than both dNBR (68.4%) and RdNBR (69.2%). Consequently, we recommend RBR as a robust alternative to both dNBR and RdNBR for measuring and classifying burn severity.

Graphical Abstract

1. Introduction

Over the last decade, substantial time, effort, and money have been invested in developing satellite-inferred wildfire burn severity maps. Imagery from the Landsat TM and ETM+ sensors have been particularly useful for this purpose due to their 30 m spatial resolution, ca. 16-day temporal resolution, and a deep catalogue of publicly-available images dating back to 1984. Landsat images and burn severity maps derived from them have been invaluable for developing an atlas of burn severity for large fires in the US [1], determining the drivers of burn severity [24], measuring the effect of past disturbance and management on burn severity [57], and quantifying the effects of fire on biotic communities [8].
Consistent with major burn severity mapping efforts [1], we define burn severity as the degree of fire-induced change to vegetation and soils, as measured with Landsat-based metrics. The two most commonly used Landsat-based metrics of burn severity are the delta normalized burn ratio (dNBR) [9] and its relativized form (RdNBR) [10], both of which rely on the normalized burn ratio (NBR) (Equation (1)). NBR is sensitive to the amount of chlorophyll content in plants, moisture, and char or ash in the soil. The equations for dNBR (Equation (2)) and RdNBR (Equation (3)) use NBR derived from pre- and post-fire satellite images to quantify spectral change. Both metrics are sensitive to changes commonly caused by fire [1113] and are often strongly correlated to field-based measures of burn severity [1416]. Although maps of dNBR and RdNBR provide depictions of landscape change on a continuous scale, researchers and practitioners commonly classify these continuous metrics into categorical maps representing unchanged, low, moderate, and high burn severity (e.g., [10]).
NBR = ( band   4 band   7 band   4 + band   7 ) *
dNBR = ( ( NBR prefire NBR postfire ) * 1000 ) dNBR offset
RdNBR = dNBR | ( NBR prefire ) | 0.5
* These bands are specific to Landsat 5 and 7 and are not valid for other satellites such as MODIS and Landsat 8.
The equations for both dNBR and RdNBR make slight and important adjustments to the simple difference between pre- and post-fire NBR. The dNBRoffset in Equation (2) is the average dNBR value from pixels in relatively homogenous, unchanged areas outside the burn perimeter and is intended to account for differences due to phenology or precipitation between the pre- and post-fire images [10,17]. Although the dNBRoffset is not always used when generating dNBR maps [1], it becomes important when comparing dNBR among fires [17]. The denominator in Equation (3) is what makes the RdNBR a metric of relative, rather than absolute, change, thus emphasizing change relative to the amount of pre-fire vegetative cover [10].
A relativized version of burn severity is advantageous in certain situations. Miller and Thode [10] clearly articulated the main argument for a relativized version of burn severity such as RdNBR: pixels whose pre-fire vegetative cover is low (
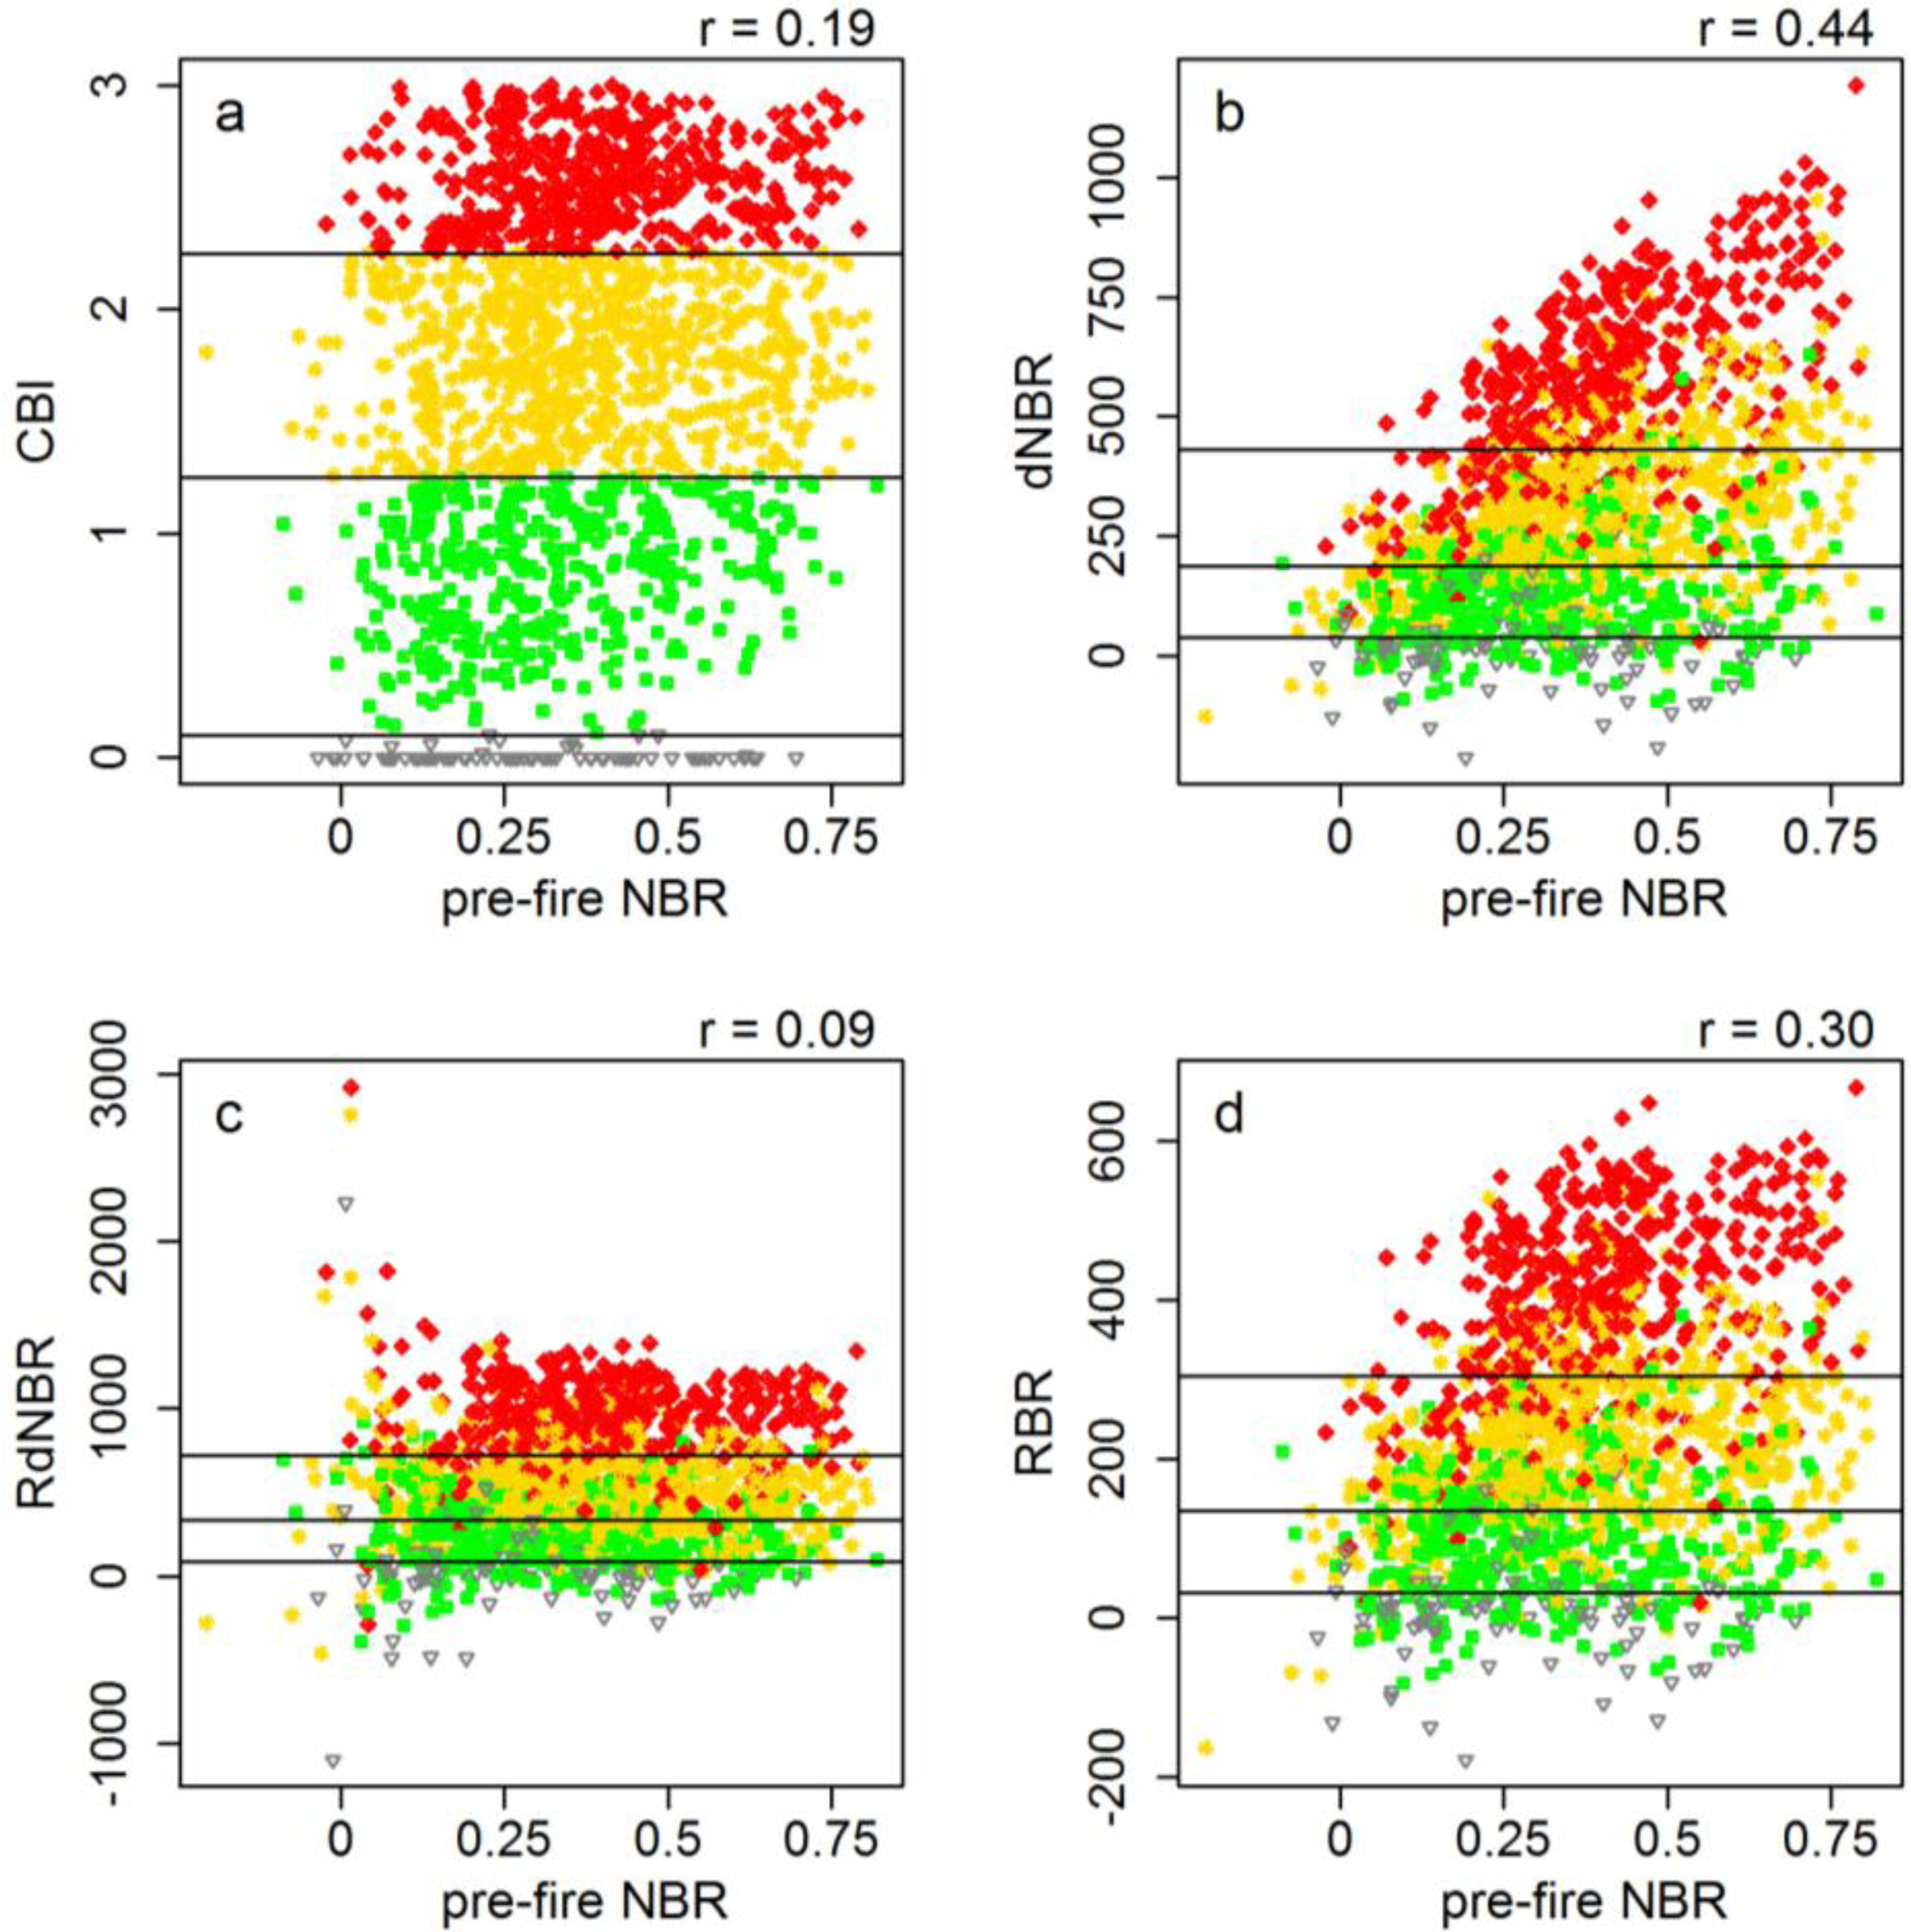
i.e., low NBR) will generally have low dNBR values regardless of the degree of fire-induced mortality of the vegetation. As an absolute measure of change, dNBR simply does not allow for the quantification of high severity in these cases, even if all pre-fire vegetation is consumed. As a result, dNBR values are often correlated to pre-fire NBR. The denominator in the equation for RdNBR (Equation (3)) removes this correlation and allows the metric to be more sensitive than dNBR to changes where pre-fire vegetation cover is low. As such, a relative index like RdNBR is theoretically more suited to detect changes to vegetation on a consistent scale.
Mathematically, however, there are several difficulties associated with the RdNBR denominator (Equation (3)). First, the square root transformation causes very small values of pre-fire NBR to produce extremely high or low (i.e., negative) values of RdNBR [10]. The meaning of such extreme values is difficult to interpret since they appear as outliers compared to most RdNBR values and are more due to very low pre-fire NBR values as opposed to the amount of fire-induced change. Furthermore, the RdNBR equation reaches infinity, and therefore fails, when the pre-fire NBR equals zero, requiring that pre-fire NBR values of zero be replaced with 0.001 ([18]). Lastly, the absolute value transformation of the pre-fire NBR term converts negative pre-fire NBR values to positive values. This transformation adds ambiguity to the resulting RdNBR values by not fully accounting for the variation in pre-fire NBR. Negative pre-fire NBR values comprise a small proportion of most fires (<1%) and correspond to areas with very little to no vegetation [10]; in dry ecosystems, such values occasionally comprise over 10% of the area within a fire perimeter [1].
The use of dNBR vs. RdNBR is actively debated [1921] and results regarding which metric better corresponds to field-based burn severity data have been inconclusive [11,19]. Some studies have concluded that RdNBR provides higher classification accuracies than dNBR when discrete classes (i.e., low, moderate, and high) of burn severity are required [10,21]. Other studies have concluded that dNBR generally performs better than RdNBR, both in terms of correspondence with field measurements and classification accuracies [12,19].
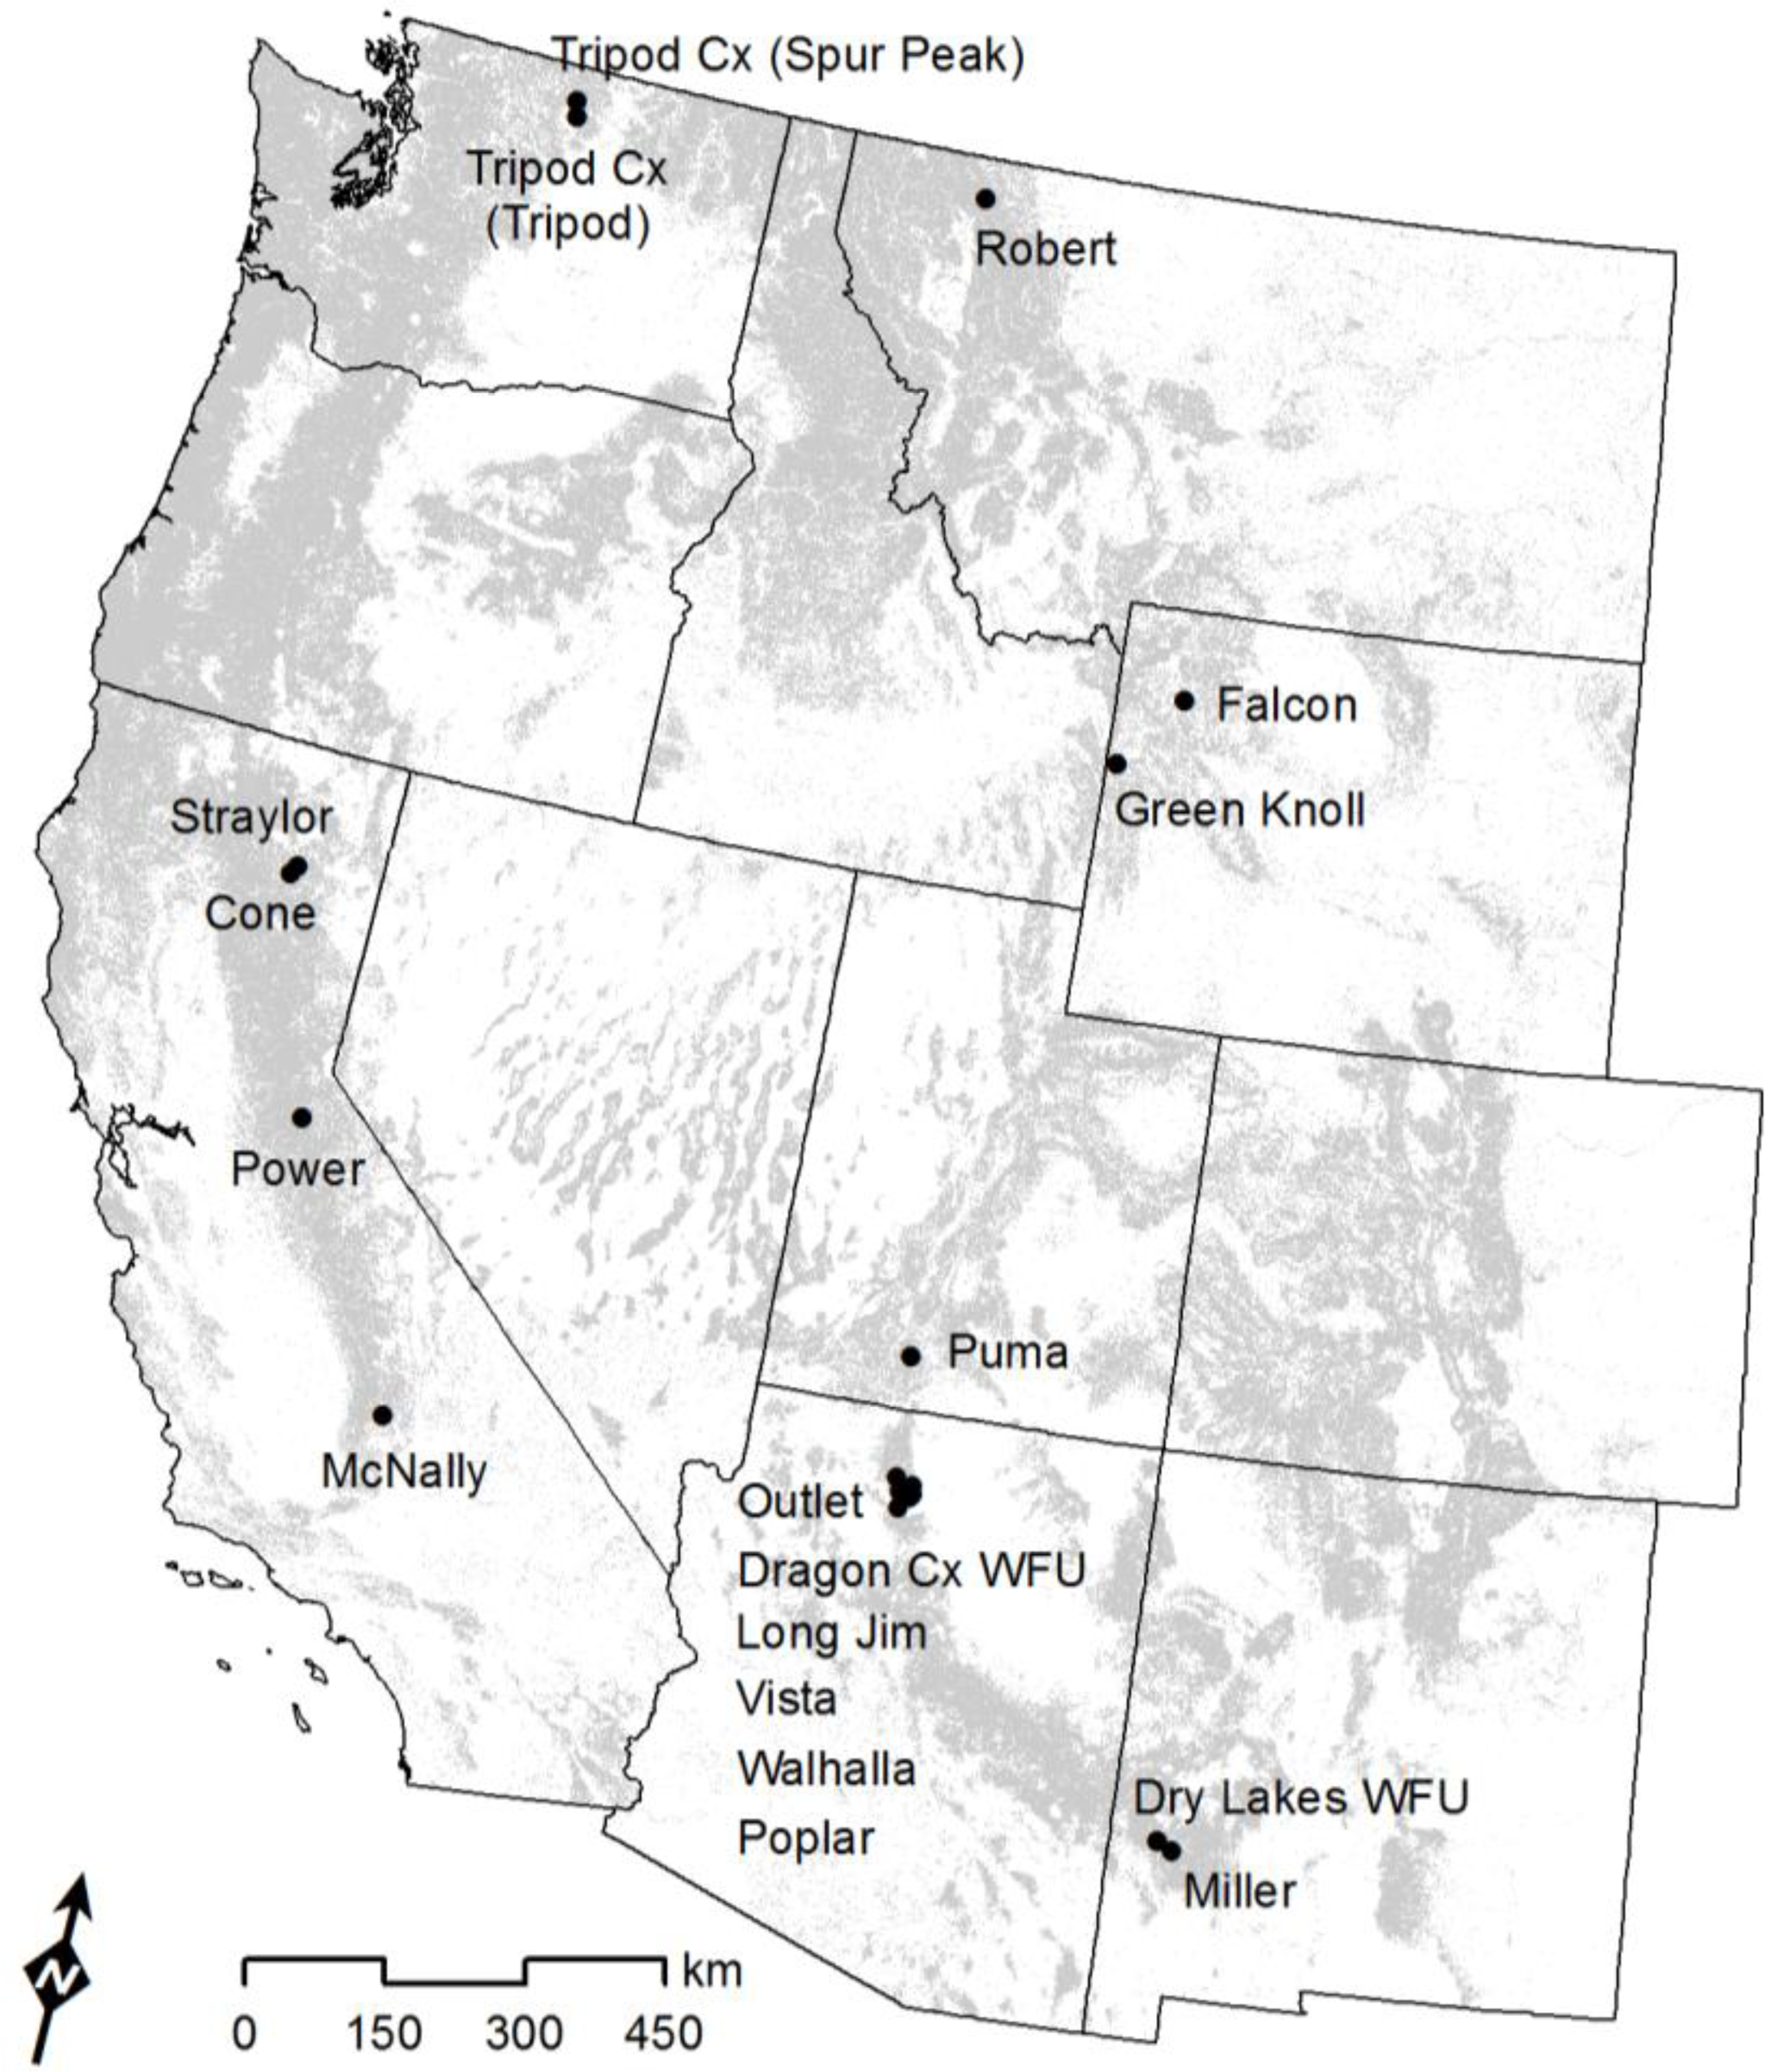
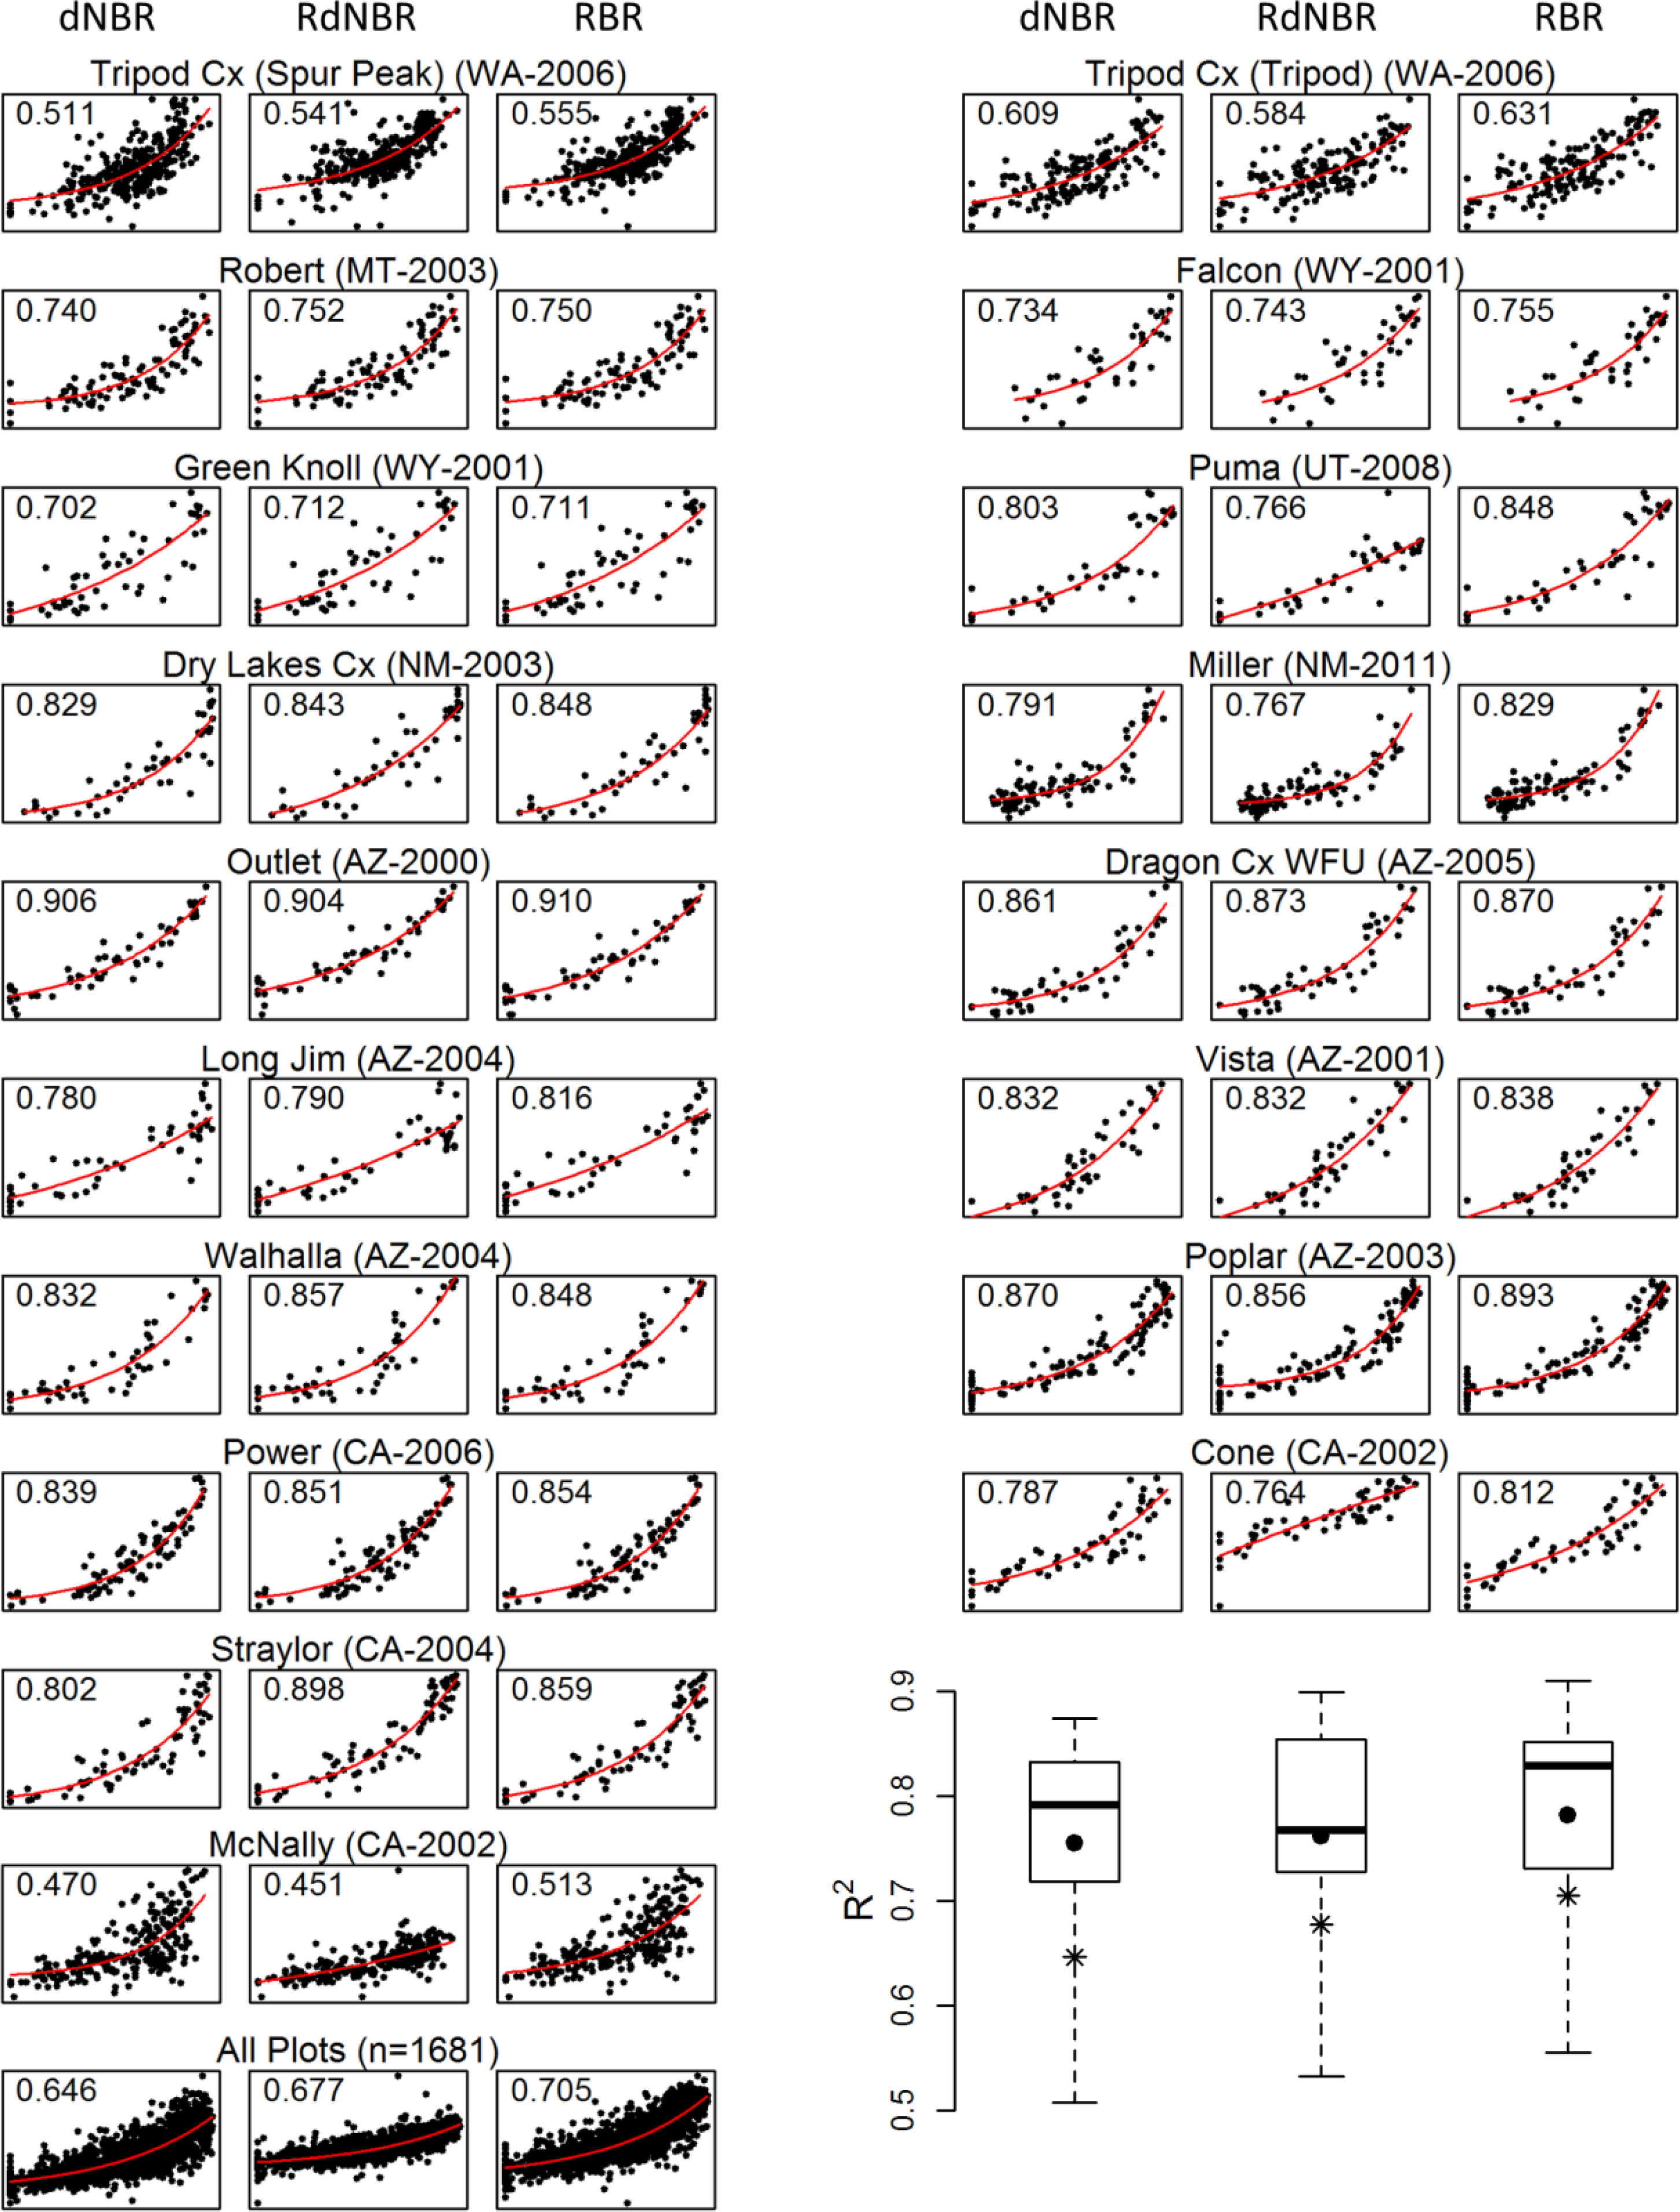
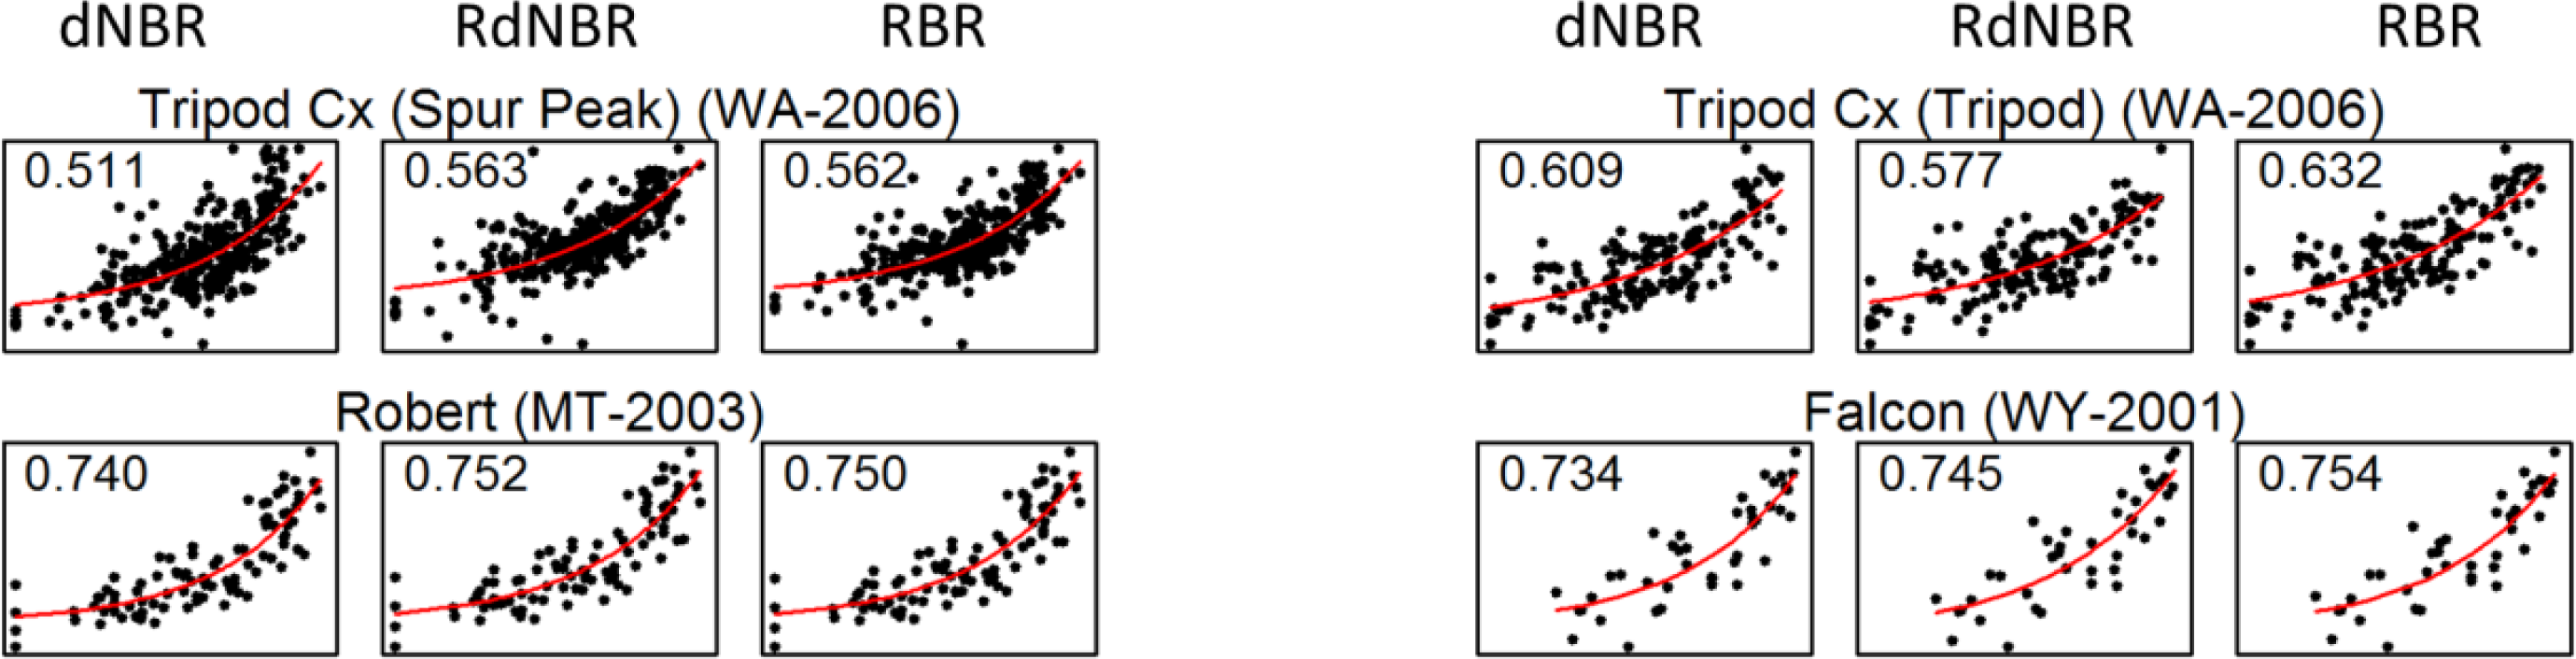
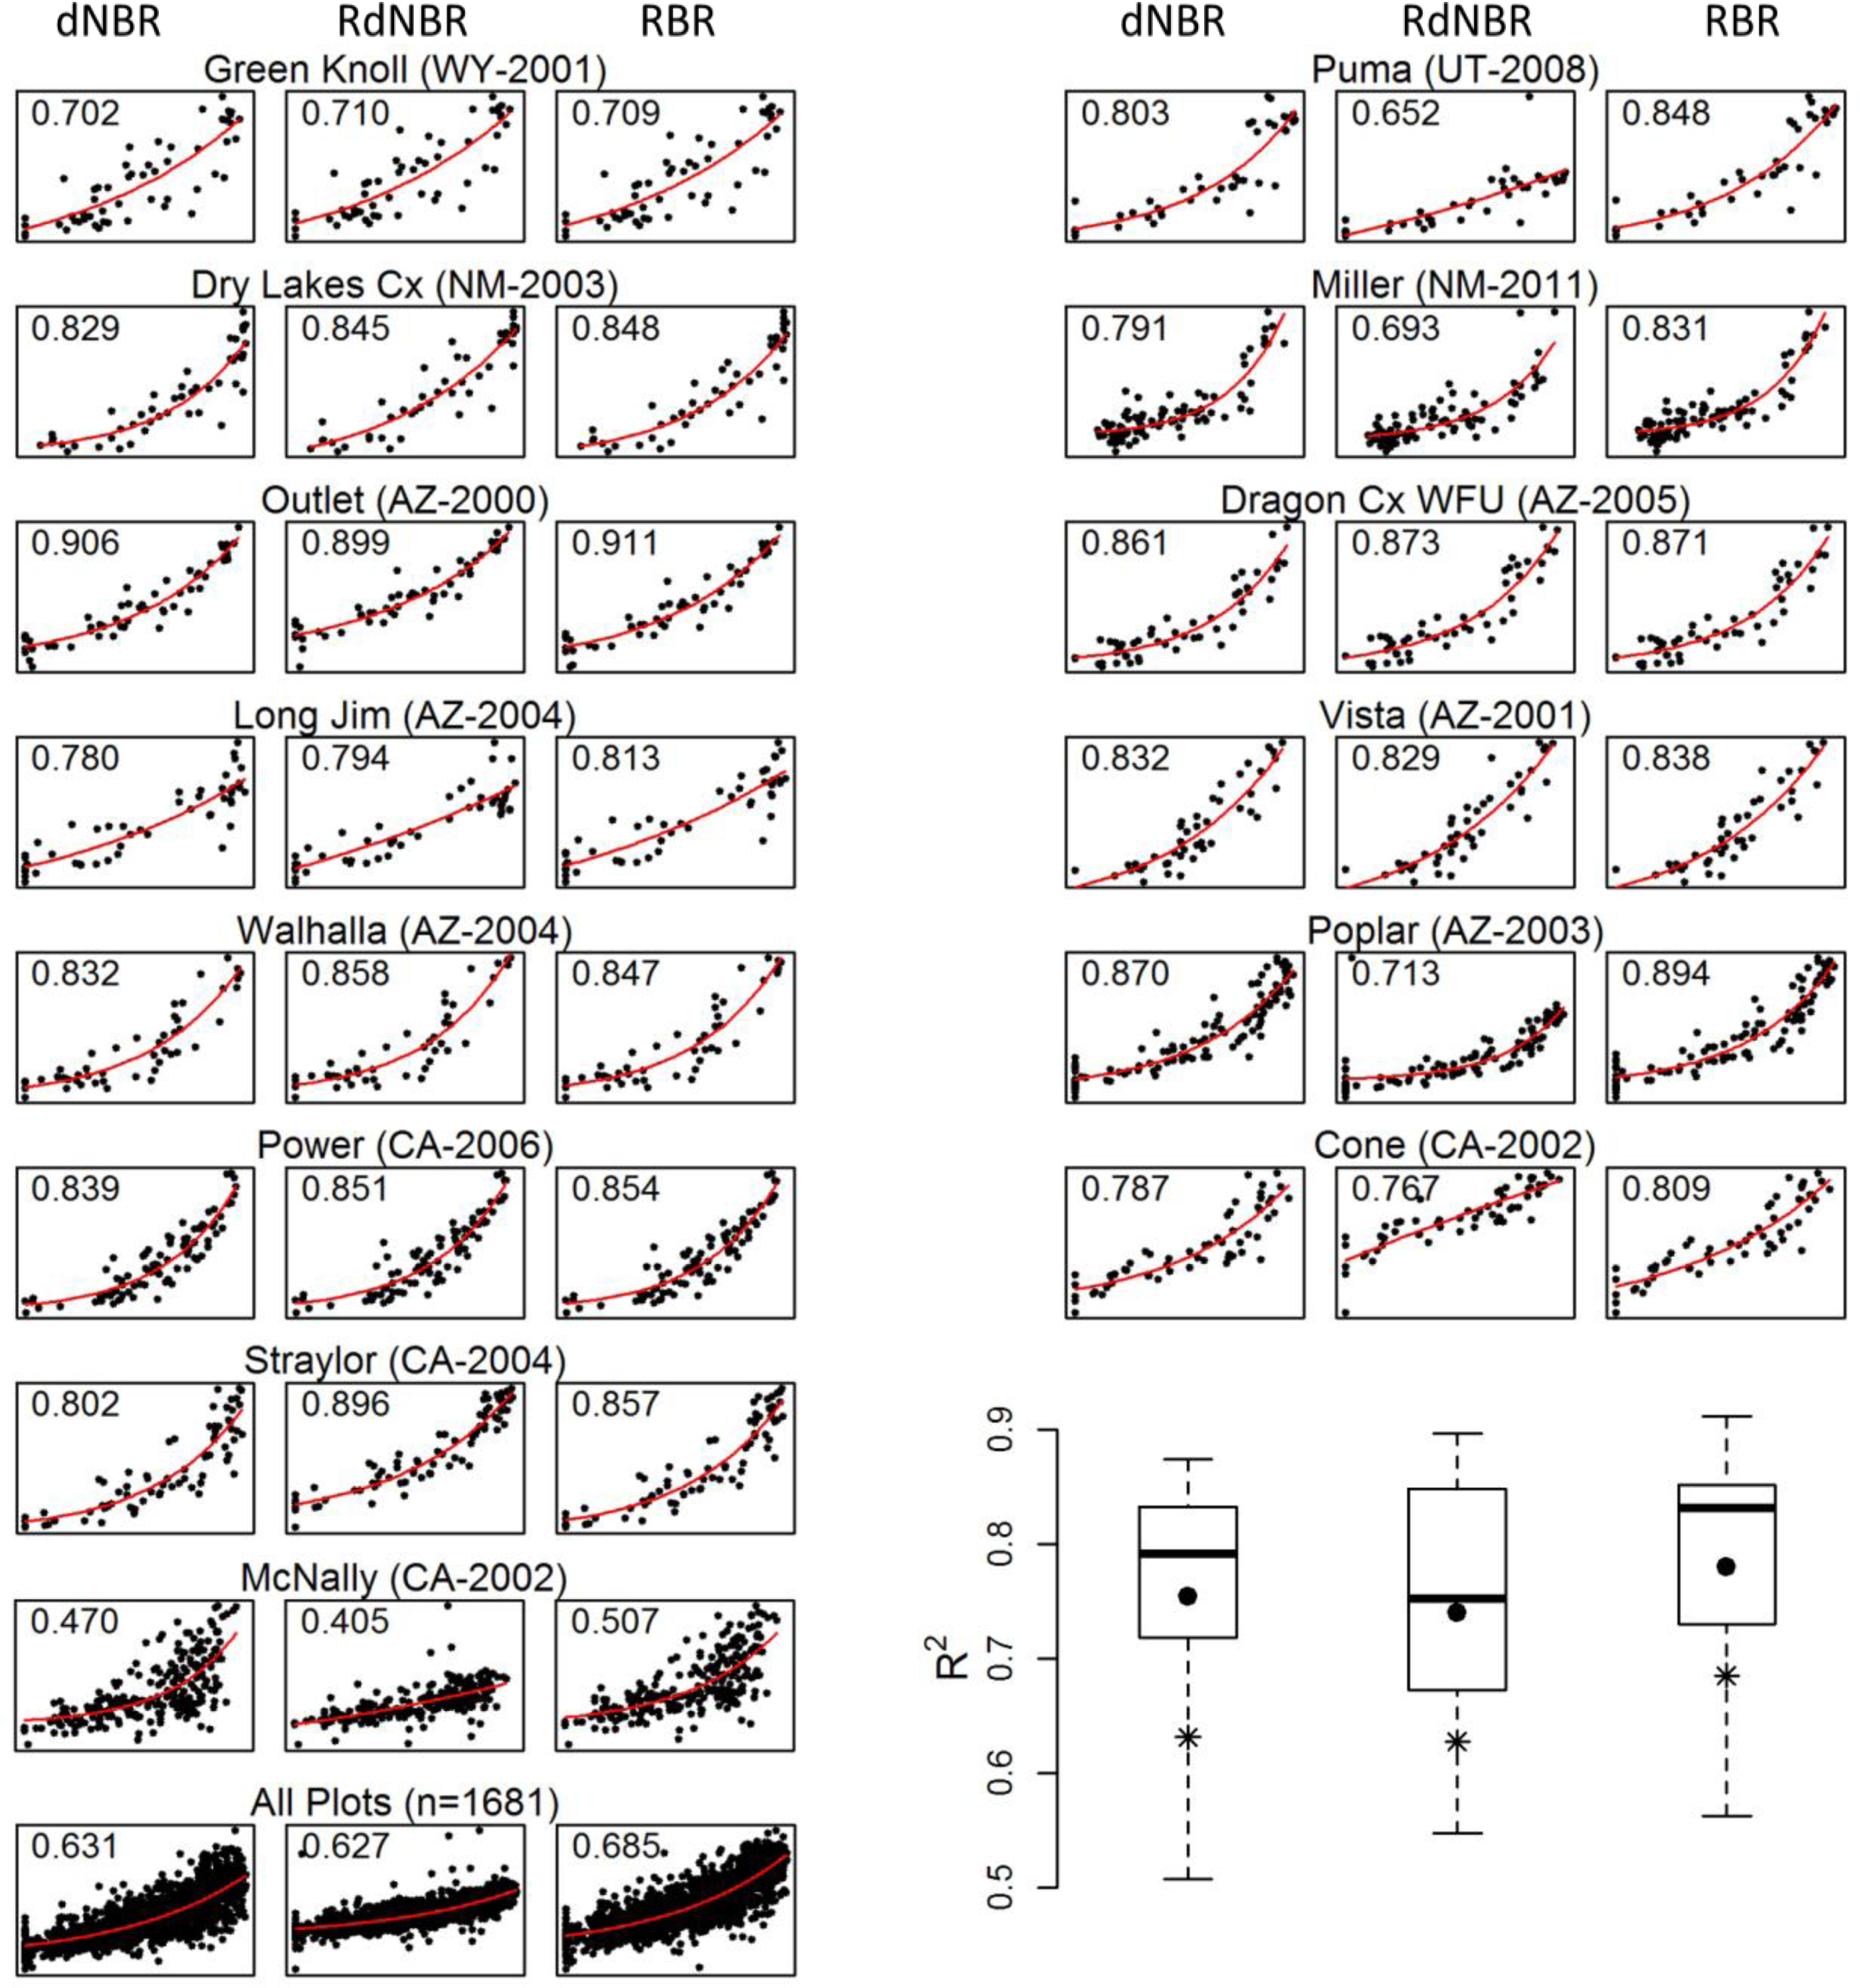
The goal of this study was to propose and evaluate an alternative relativized burn severity metric that is sensitive to changes where pre-fire vegetation cover is low but avoids the difficulties associated with the RdNBR equation; we call this new metric the relativized burn ratio (RBR). We examine 18 fires from across the western US and evaluate the ability of RBR to characterize burn severity in terms of its correspondence to a continuous field-based measure of burn severity and its overall accuracy when classifying into discrete burn severity classes (i.e., unchanged, low, moderate, and high). We also conducted parallel analyses using dNBR and RdNBR in order to determine if RBR improves upon either metric.

2. Methods

2.1. Study Area and Field Data

Our study is focused primarily on coniferous and mixed broadleaf-coniferous forests in the conterminous western US (Figure 1). To acquire field-sampled burn severity data with the widest possible geographic coverage across this range, we solicited other researchers for data collected throughout the western US and collected data on one fire in New Mexico’s Gila Wilderness. In all cases, data were either collected in the field or standardized post-collection to meet protocols of the composite burn index (CBI), a widely-used field measurement of burn severity [9]. Under the CBI protocol, individual rating factors in each of several vertically arranged strata from substrates (soil and rock) up through litter and surface fuels, low herbs and shrubs, tall shrubs, and trees within increasing height categories are assessed on a continuous 0 to 3 scale indicating the magnitude of fire effects. A rating of 0 reflects no change due to fire, while 3 reflects the highest degree of change. Factors assessed include soil char, surface fuel consumption, vegetation mortality, and scorching of trees. Typically, ratings are averaged for each strata and then across all strata to arrive at an overall CBI severity rating for an entire plot. We acquired our data from numerous sources, and as such, we were often provided with only the overall CBI rating with no information on other factors or strata (though they were measured and incorporated into the overall CBI rating).
We assembled CBI data from over 3000 field plots, and we selected a subset to include in this study. Burn severity patterns are often highly heterogeneous and we wanted to ensure that our sample for each fire in our study included this variability. As a first criterion, we selected fires with ≥ 40 CBI plots. Secondly, to ensure adequate samples from across the range of CBI values, we further selected fires where at least 15% of the plots fell in each of three ranges—unchanged or low severity (CBI ≤ 1.25), moderate severity (1.25 < CBI ≤ 2.25), and high severity (CBI > 2.25). Our final field dataset, therefore, consisted of CBI data from 1,681 plots from 18 fires (Figure 1; Table 1).
Fires selected for this study were distributed in three regions of the western US: the Northwest and Northern Rockies, the Southwest, and the Sierra Nevada mountains (Figure 1; Table 1). The four fires in the Northwest and Northern Rockies varied from relatively dry ponderosa pine and mixed conifer forests (Tripod complex) to mesic montane (Robert) and subalpine forests (Falcon and Green Knoll) [22]. The nine Southwest fires also included dry forests and woodlands dominated by ponderosa pine, alligator juniper and Gambel oak (Dry Lakes, Miller, Long Jim), as well as montane mixed conifer (Puma, Dragon Complex, Vista, Walhalla) and subalpine conifer forests (Outlet, Poplar). The four fires in the Sierra Nevada were a mixture of relatively dry ponderosa pine, Jeffrey pine, and California mixed conifer forests, with small amounts of western juniper and California oak species.
In terms of historical fire regimes (LANDFIRE Fire Regime Group version 1.1.0) [22], fires in the Northwest and Northern Rockies represented mostly mixed-severity and stand replacement regimes, with the exception of the Tripod Complex fires, which burned mostly in a forest with a historically high-frequency surface fire regime (Table 1). Our selected fires in the Southwest ranged from predominantly low-severity surface regimes (Dry Lakes and Long Jim) to fairly even mixtures of low-, mixed-, and high-severity regimes (Poplar). The four Sierra Nevada fires all represented a predominantly low-severity surface fire regime.
From a management perspective, most fires in our study were managed as suppression fires, with a few exceptions. Two fires were prescribed burns (Long Jim and Walhalla) and one was an escaped prescribed burn (Outlet). Two others, Dry Lakes Complex and Dragon Complex were managed as “Wildland Fire Use”, a management strategy that allows wildfires to burn without suppression actions within designated boundaries.

2.2. Remotely-Sensed Severity Metrics

We generated the dNBR and RdNBR burn severity metrics for all fires except the Miller Fire using Landsat imagery acquired from the Monitoring Trends in Burn Severity program (MTBS) [1]. Although MTBS produces and distributes dNBR and RdNBR grids, we chose to calculate dNBR and RdNBR directly from Landsat imagery (Equations (13)) to ensure that we made parallel comparisons among metrics (for example, dNBR as distributed by MTBS does not include the dNBRoffset (Equation (2))). For |NBRprefire| values < 0.001, we substituted 0.001 in place of NBRprefire (Equation (3)), as per the previously described suggestion of J. Miller [18]. MTBS data were not available for the Miller Fire, so we obtained Landsat 5 imagery from the US Geological Survey Center for Earth Resources Observation and Science (USGS-EROS) and generated the dNBR and RdNBR grids using MTBS protocol.
Next, we developed the relativized burn ratio (RBR) (Equation (4)), which is very similar in concept to the RdNBR. The RBR is a relativized version of dNBR:
RBR = ( dNBR ( NBR prefire + 1.001 ) )
Simply put, RBR is the dNBR divided by a simple adjustment to the pre-fire NBR. Adding 1.001 to the denominator ensures that the denominator will never be zero, thereby preventing the equation from reaching infinity and failing. We did not evaluate adjustment values < 1.001 because we did not want the equation to fail under any circumstance; however, we did evaluate adjustment values > 1.001 and found that these resulted in decreased correspondence with field data.
For each CBI plot location, we extracted values for the three burn severity metrics using bilinear interpolation, as suggested by Cansler [23]. Bilinear interpolation is a common sampling approach for continuous data in which the resultant value is a weighted average of the four nearest pixel centroids, where closer pixel centroids are given higher weight than distant pixel centroids. This type of sampling approach was necessary because CBI plot locations are unlikely to fall within the center of a 30 m Landsat pixel. We did not use the approach of Miller and Thode [10], who used the average from a 3 × 3 pixel window around each plot location, because we felt that bilinear interpolation would provide more precise and spatially-specific values for plot locations.

2.3. Data Analysis

We compared the performance of RBR to dNBR and RdNBR by evaluating the (1) correspondence of the continuous values to field-measured CBI values, and (2) overall classification accuracy relative to CBI. Although our primary objective was to determine if RBR was a viable alternative to dNBR and RdNBR, we also wanted to ensure that RBR more or less mimicked the relationship between pre-fire NBR and CBI; this was a primary criterion in developing RdNBR [10]. As such, we also evaluated the correlation of pre-fire NBR to CBI and each of the three metrics using Pearson’s correlations.
To evaluate the performance of the satellite-derived indices as continuous metrics of burn severity, we tested their correspondence to CBI using nonlinear regression (cf. [10]). In previous studies, simple linear and various non-linear regression forms have been used to model the relationship between CBI and dNBR or RdNBR (e.g., [4,10,16,21]). To facilitate comparison between our results and those of Miller and Thode [10], we chose to use their non-linear model of the form:
y = a * b * exp ( CBI * c )
where y is the satellite-derived metric being evaluated. We quantified the correspondence of each metric to CBI as the coefficient of determination (i.e., R2 of a linear regression between predicted and observed values). We conducted the regression for each of the 18 fires and for all 1,681 plots lumped together. We also conducted a five-fold cross-validation on all plots; five evaluations were conducted with 80% of the data used to train the nonlinear model and the remaining 20% used to test the model. The resulting coefficients of determination for the five testing datasets were averaged.
Next, we evaluated each remotely sensed burn severity metric’s classification accuracy relative to CBI. Four distinct categories are commonly used when mapping burn severity: unchanged (CBI ≤ 0.1), low (>0.1 and ≤1.25), moderate (>1.25 and ≤2.25), and high (>2.25). We calculated the values of each burn severity metric that corresponded to the CBI breakpoints of 0.1, 1.25, and 2.25 using the nonlinear regressions described above. This approach resulted in a unique set of thresholds for each severity metric for each fire as well as threshold values for all plots analyzed simultaneously. Using these thresholds, we calculated the classification accuracy for each metric as the percent of plots correctly classified into each burn severity class relative to field-measured CBI; this was conducted for each fire individually and all plots together. Therefore, our evaluation of RBR from a classification perspective involves (1) the average overall classification accuracy among all individual fires and (2) the classification accuracy of all plots analyzed simultaneously. Though the CBI breakpoints used for this classification are arbitrary, as they are in most applications that categorize continuous data, they are based on ecological conditions defining Key and Benson’s [9] CBI scale and allow for consistent interpretation of classes across multiple fires. These CBI thresholds also facilitate comparison to previous studies (e.g., [10,19,21]).
Although the dNBRoffset for each fire is provided within the MTBS metadata, it may be inconvenient or difficult to generate for those not using MTBS data. We therefore conducted parallel analyses, for comparative purposes, omitting the dNBRoffset from Equation (2); these results are presented in the Appendix.

3. Results

3.1. Correspondence to Field-Measured CBI: Nonlinear Regressions

The nonlinear regression equation we used to model the relationship between satellite-derived severity metrics and CBI fit the data reasonably well (Figure 2). Averaged among all fires, the correspondence between CBI and RBR was higher (R2 = 0.786) than both dNBR (R2 = 0.761) and RdNBR (R2 = 0.766) (Figure 2). Similarly, when all plots were evaluated simultaneously, RBR performed best (R2 = 0.705), followed by RdNBR (R2 = 0.677) and dNBR (R2 = 0.646). The results of the five-fold cross-validation were similar: RBR performed best (R2 = 0.703), followed by RdNBR (R2 = 0.675) and dNBR (R2 = 0.643). For the majority of fires, the correspondence between each of the three metrics and CBI was well above 0.7. Only two fires (Tripod Cx [Spur Peak] and McNally) had R2 values as low as 0.45–0.55, while six fires (Outlet, Dragon Cx, Walhalla, Poplar, Power, and Straylor) had R2 of ≥0.85 for at least one of the three metrics. For 13 of the 18 fires, RBR had the highest correspondence to CBI, whereas RdNBR had the highest correspondence to CBI in the remaining five fires. RBR also outperformed both dNBR and RdNBR when the dNBRoffset was excluded from Equation (2) (Figure A1, Appendix).

3.2. Correlation to Pre-Fire NBR

Correlation of each burn severity metric to pre-fire NBR shows that the relativized burn severity metrics (RBR and RdNBR) are less correlated to pre-fire NBR than to dNBR (Figure 3). When evaluating all 1681 plots, we found little correlation (r = 0.19) between CBI and pre-fire NBR (Figure 3a). In contrast, the correlation between dNBR and pre-fire NBR is relatively high (r = 0.44; Figure 3b). The correlation between RdNBR (r = 0.09) and RBR (r = 0.30) to pre-fire NBR more closely resembles what we observe for CBI and pre-fire NBR (Figure 3c,d). When evaluating correlations on individual fires, a similar pattern emerged: correlation to pre-fire NBR is always highest for dNBR, lowest for RdNBR, and intermediate for RBR (data not shown). Extreme values in RdNBR as pre-fire NBR nears zero are evident (Figure 3c).

3.3. Classification Accuracy

Overall classification accuracies for individual fires ranged from 50.0% (RdNBR, Miller) to 86.7% (RBR and dNBR, Puma) (Table 2). When averaged among fires, RBR had the highest average overall classification accuracy (70.5%), followed by RdNBR (69.2%) and dNBR (68.4%). When all plots were analyzed and classified simultaneously, a similar pattern emerged: RBR had the highest overall classification accuracy (66.2%), followed by RdNBR (65.5%) and dNBR (64.2%). Although not a primary objective of this study, we were also able to evaluate the variability in thresholds among fires. We found that, among the 18 fires, the variability (i.e., the coefficient of variation) in thresholds was lower for RBR compared to RdNBR (Table 3); compared to dNBR, the variability was lower for two out of three thresholds. Similar results were found when the dNBRoffset was excluded from the burn severity equations (Tables A1 and A2, Appendix). Classification accuracies of individual severity classes are also presented (Table A3).

4. Discussion

Overall, RBR better corresponded to field-based burn severity measurements and had higher classification accuracy compared to dNBR and RdNBR. Although there were individual fires where other metrics (particularly RdNBR) performed better than RBR, when the evaluations were averaged among the 18 fires and when all plots were lumped and analyzed simultaneously (including the five-fold cross-validation), RBR always performed best. Our evaluation included fires throughout the western US in forests with fire regimes ranging from predominately low-severity surface (e.g., Miller) to stand-replacing (e.g., Green Knoll), suggesting that RBR is a robust severity metric that can be used across broad geographic regions and fire regimes.
Like RdNBR, RBR is a relativized version of dNBR, designed to detect change even where pre-fire vegetation cover is low. We demonstrated that both RBR and RdNBR are less correlated to pre-fire NBR than is dNBR, indicating that the relativized metrics are better at detecting high severity effects across the full range of pre-fire vegetation cover. Areas of relatively sparse or spatially discontinuous vegetation are fairly common throughout the western US and will potentially become more common as climate becomes more arid and fire becomes more frequent [24,25]. Accurately characterizing burn severity in such areas will become increasingly important. Our study supports the use of a relativized form of the dNBR equation; on average, RBR or RdNBR performed better than dNBR. However, the choice between using an absolute (i.e., dNBR) vs. relativized (e.g., RBR) remotely sensed measure of burn severity should depend upon the objectives of any particular study, paying special attention to what is being measured by each metric.
Excluding the dNBRoffset from the burn severity equations can affect performance of the remotely sensed burn severity metrics. When dNBRoffset was excluded, we found lower correspondence to CBI field data for all three burn severity metrics when plots from all 18 fires were evaluated simultaneously (Figure A1, Appendix). Furthermore, classification accuracies were generally lower when the dNBRoffset was excluded. These findings support the assertion by Miller and Thode [10] that, when making comparisons among fires, regardless of which burn severity metric is used, incorporating the dNBRoffset should be considered.
The RBR is an improvement upon RdNBR in terms of correspondence to field measures of burn severity and overall classification accuracy. Although this improvement may appear marginal, one of the key strengths of the RBR equation is that it avoids some of the mathematical difficulties associated with the RdNBR equation. That is, the RBR equation (1) does not fail (i.e., reach infinity) for any pre-fire NBR value (including zero), (2) does not result in extremely high or low values when pre-fire NBR is near zero, and (3) retains the sign of pre-fire NBR, thereby avoiding potential arbitrary bias of taking the absolute value. Furthermore, the reduced variability in RBR thresholds values among fires indicates that RBR thresholds are more “stable” compared to RdNBR thresholds and are thus more transferable among fires and ecoregions.
There have been several recent developments relating to remote sensing of fire effects, such as hyperspectral analysis [14,26], linear spectral unmixing [27], and the use of other satellite platforms [28]. While there is promise in these new remote sensing methods that may lead to a more ecologically-linked metric for remotely sensing burn severity in the long run, these other approaches have not been shown to perform better than Landsat-based dNBR or RdNBR when validated with CBI field data (e.g., [14,28]). For the time being, therefore, Landsat-based severity metrics such as RBR, dNBR, and RdNBR remain relatively robust compared to these emerging approaches.
It has also been noted that differences in geography, ecosystem type, and pre-fire soils can influence satellite-inferred burn severity metrics [2931]. As such, some have suggested that a suite of methods will ultimately be needed to adequately quantify burn severity, with different approaches optimized for different settings [27]. Indeed, our data indicate that all remotely-sensed burn severity metrics evaluated in this study had higher correspondence to field data in the southwestern US compared to the other geographic regions we analyzed. This said, even when we lumped all our data, the correspondence of RBR and field data was strikingly high (r2 = 0.705 for all plots), indicating that RBR is a useful metric across the range of geography and ecosystem types covered in our study. Because we limited our study to forested areas in the western US, it is unclear if RBR is a valid burn severity metric in other geographic regions (e.g., southeastern US, Canada, and Alaska).

5. Conclusion

The relativized burn ratio (RBR) is a Landsat-based burn severity metric that is an alternative to both dNBR and RdNBR. The correspondence between RBR and field-based measures of burn severity indicates an improvement over dNBR and RdNBR. The overall classification accuracy of RBR into discrete classes of burn severity also indicates that RBR improves upon dNBR and RdNBR. Another strength of RBR is that it avoids some of the mathematical difficulties associated with the RdNBR equation. Given the number of fires analyzed in this study and the large geographic extent, we demonstrated that RBR is a robust metric for measuring and classifying burn severity over a broad range of fire-regime types. As such, the use of RBR should help facilitate the description and study of burn severity patterns, as well as their drivers and consequences in forests like those of the conterminous western US.

Acknowledgments

We acknowledge National Fire Plan funding from the USDA Forest Service, Rocky Mountain Research Station. We thank L. Holsinger for creating the burn severity grids for the Miller Fire and all individuals and organizations cited in Table 1 for sharing their CBI field data. We appreciate the comments and suggestions from three anonymous reviewers that helped to improve the manuscript.

Author Contributions

Sean Parks designed the study, conducted analyses, and wrote the manuscript. Greg Dillon designed the study, conducted analyses, and contributed to manuscript writing and revision. Carol Miller contributed to manuscript writing and revision.

Conflicts of Interest

The authors declare no conflict of interest.

References

  1. Eidenshink, J.; Schwind, B.; Brewer, K.; Zhu, Z.L.; Quayle, B.; Howard, S. A project for monitoring trends in burn severity. Fire Ecol 2007, 3, 3–21. [Google Scholar]
  2. Thompson, J.R.; Spies, T.A.; Ganio, L.M. Reburn severity in managed and unmanaged vegetation in a large wildfire. Proc. Natl. Acad. Sci. USA 2007, 104, 10743–10748. [Google Scholar]
  3. Bradstock, R.A.; Hammill, K.A.; Collins, L.; Price, O. Effects of weather, fuel and terrain on fire severity in topographically diverse landscapes of south-eastern Australia. Landscape Ecol 2010, 25, 607–619. [Google Scholar]
  4. Dillon, G.K.; Holden, Z.A.; Morgan, P.; Crimmins, M.A.; Heyerdahl, E.K.; Luce, C.H. Both topography and climate affected forest and woodland burn severity in two regions of the western US, 1984 to 2006. Ecosphere 2011, 2. art130.. [Google Scholar]
  5. Wimberly, M.C.; Cochrane, M.A.; Baer, A.D.; Pabst, K. Assessing fuel treatment effectiveness using satellite imagery and spatial statistics. Ecol. Appl 2009, 19, 1377–1384. [Google Scholar]
  6. Arkle, R.S.; Pilliod, D.S.; Welty, J.L. Pattern and process of prescribed fires influence effectiveness at reducing wildfire severity in dry coniferous forests. For. Ecol. Manage 2012, 276, 174–184. [Google Scholar]
  7. Parks, S.A.; Miller, C.; Nelson, C.R.; Holden, Z.A. Previous fires moderate burn severity of subsequent wildland fires in two large western US wilderness areas. Ecosystems 2014, 17, 29–42. [Google Scholar]
  8. Arkle, R.S.; Pilliod, D.S.; Strickler, K. Fire, flow and dynamic equilibrium in stream macroinvertebrate communities. Freshwater Biol 2010, 55, 299–314. [Google Scholar]
  9. Key, C.H.; Benson, N.C. Landscape Assessment (LA): Sampling and Analysis Methods. In Firemon: Fire Effects Monitoring and Inventory System; Lutes, D., Keane, R.E., Caratti, J.F., Key, C.H., Benson, N.C., Sutherland, S., Gangi, L., Eds.; RMRS-GTR-164; Rocky Mountain Research Station, US Department of Agriculture, Forest Service: Fort Collins, CO, USA, 2006; pp. LA-1–LA-51. [Google Scholar]
  10. Miller, J.D.; Thode, A.E. Quantifying burn severity in a heterogeneous landscape with a relative version of the delta Normalized Burn Ratio (dNBR). Remote Sens. Environ 2007, 109, 66–80. [Google Scholar]
  11. Zhu, Z.; Key, C.H.; Ohlen, D.; Benson, N.C. Evaluate Sensitivities of Burn-Severity Mapping Algorithms for Different Ecosystems and Fire Histories in the United States; Final Report to the Joint Fire Sciences Program, JFSP 01-1-4-12; Joint Fire Science Program: Boise, IA, USA, 2006. [Google Scholar]
  12. Hudak, A.T.; Morgan, P.; Bobbitt, M.J.; Smith, A.M.S.; Lewis, S.A.; Lentile, L.B.; Robichaud, P.R.; Clark, J.S.; McKinley, R.A. The relationship of multispectral satellite imagery to immediate fire effects. Fire Ecol 2007, 3, 64–90. [Google Scholar]
  13. Miller, J.D.; Safford, H.D.; Crimmins, M.; Thode, A.E. Quantitative evidence for increasing forest fire severity in the Sierra Nevada and southern Cascade Mountains, California and Nevada, USA. Ecosystems 2009, 12, 16–32. [Google Scholar]
  14. Van Wagtendonk, J.W.; Root, R.R.; Key, C.H. Comparison of AVIRIS and Landsat ETM+ detection capabilities for burn severity. Remote Sens. Environ 2004, 92, 397–408. [Google Scholar]
  15. Wimberly, M.C.; Reilly, M.J. Assessment of fire severity and species diversity in the southern Appalachians using Landsat TM and ETM plus imagery. Remote Sens. Environ 2007, 108, 189–197. [Google Scholar]
  16. Holden, Z.A.; Morgan, P.; Evans, J.S. A predictive model of burn severity based on 20-year satellite-inferred burn severity data in a large southwestern US wilderness area. For. Ecol. Manage 2009, 258, 2399–2406. [Google Scholar]
  17. Key, C.H. Ecological and sampling constraints on defining landscape fire severity. Fire Ecol 2006, 2, 34–59. [Google Scholar]
  18. Miller, J. Personal communication. 2012. [Google Scholar]
  19. Soverel, N.O.; Perrakis, D.D.B.; Coops, N.C. Estimating burn severity from Landsat dNBR and RdNBR indices across western Canada. Remote Sens. Environ 2010, 114, 1896–1909. [Google Scholar]
  20. Tanase, M.A.; Riva, J.D.L.; Pérez-Cabello, F. Estimating burn severity at the regional level using optically based indices. Can. J. For. Res 2010, 41, 863–872. [Google Scholar]
  21. Cansler, C.A.; McKenzie, D. How robust are burn severity indices when applied in a new region? Evaluation of alternate field-based and remote-sensing methods. Remote Sens 2012, 4, 456–483. [Google Scholar]
  22. Rollins, M.G. LANDFIRE: A nationally consistent vegetation, wildland fire, and fuel assessment. Int. J. Wildland Fire 2009, 18, 235–249. [Google Scholar]
  23. Cansler, C.A. Drivers of Burn Severity in the Northern Cascade Range, Washington; M.Sc. Thesis,; University of Washington: Seattle, WA, USA, 2011. [Google Scholar]
  24. Littell, J.S.; Oneil, E.E.; McKenzie, D.; Hicke, J.A.; Lutz, J.A.; Norheim, R.A.; Elsner, M.M. Forest ecosystems, disturbance, and climatic change in Washington state, USA. Clim. Change 2010, 102, 129–158. [Google Scholar]
  25. Westerling, A.L.; Turner, M.G.; Smithwick, E.A.H.; Romme, W.H.; Ryan, M.G. Continued warming could transform Greater Yellowstone fire regimes by mid-21st century. Proc. Natl. Acad. Sci. USA 2011, 108, 13165–13170. [Google Scholar]
  26. Kokaly, R.F.; Rockwell, B.W.; Haire, S.L.; King, T.V.V. Characterization of post-fire surface cover, soils, and burn severity at the Cerro Grande Fire, New Mexico, using hyperspectral and multispectral remote sensing. Remote Sens. Environ 2007, 106, 305–325. [Google Scholar]
  27. Lentile, L.B.; Smith, A.M.S.; Hudak, A.T.; Morgan, P.; Bobbitt, M.J.; Lewis, S.A.; Robichaud, P.R. Remote sensing for prediction of 1-year post-fire ecosystem condition. Int. J. Wildland Fire 2009, 18, 594–608. [Google Scholar]
  28. Veraverbeke, S.; Hook, S.; Hulley, G. An alternative spectral index for rapid fire severity assessments. Remote Sens. Environ 2012, 123, 72–80. [Google Scholar]
  29. Smith, A.M.S.; Eitel, J.U.H.; Hudak, A.T. Spectral analysis of charcoal on soils: Implications for wildland fire severity mapping methods. Int. J. Wildland Fire 2010, 19, 976–983. [Google Scholar]
  30. Epting, J.; Verbyla, D.; Sorbel, B. Evaluation of remotely sensed indices for assessing burn severity in interior Alaska using Landsat TM and ETM+. Remote Sens. Environ 2005, 96, 328–339. [Google Scholar]
  31. Picotte, J.J.; Robertson, K.M. Validation of remote sensing of burn severity in south-eastern US ecosystems. Int. J. Wildland Fire 2011, 20, 453–464. [Google Scholar]

Appendix

Table A1. Overall classification accuracy when classifying plots into discrete severity classes of unchanged, low, moderate, and high when the dNBRoffset term was excluded from the equations. The last two rows depict the average classification accuracy among the 18 fires and of all plots analyzed simultaneously, respectively.
Fire NamedNBRRdNBRRBR
Tripod Cx (Spur Peak)63.471.070.7
Tripod Cx (Tripod)58.858.160.6
Robert68.575.075.0
Falcon64.371.466.7
Green Knoll63.063.063.0
Puma86.777.886.7
Dry Lakes Cx75.577.681.6
Miller53.251.152.1
Outlet66.768.568.5
Dragon Cx WFU66.766.770.6
Long Jim67.371.471.4
Vista76.180.478.3
Walhalla70.266.070.2
Poplar75.969.475.9
Power75.077.377.3
Cone71.271.269.5
Straylor77.376.076.0
McNally50.857.152.9

Average of 18 fires68.469.470.4
All plots (n = 1681)63.865.866.5
Table A2. Thresholds for the three remotely sensed burn severity metrics when the dNBRoffset term was excluded from the equations corresponding to CBI = 0.1 (unchanged/low), 1.25 (low/moderate) and 2.25 (moderate/high) for each fire.
RegionFire NamedNBRRdNBRRBR

unch/lowlow/modunch/lowlow/modmod/highmod/highunch/lowlow/modmod/high
Northwest and northern RockiesTripod Cx (Spur Peak)9721376158335478204396774
Tripod Cx (Tripod)10825085182344496229429773
Robert210522160136313518124281643
Falcon13423087160321453177357726
Green Knoll3−71159−4797295474−101200610

SouthwestPuma371453012729635348502973
Dry Lakes Cx6614849124271336118348704
Miller145188122158287343337473876
Outlet−47109−3877271382−103172607
Dragon Cx WFU421442910828839161252662
Long Jim211211610621224420357715
Vista−43156−30111343492−70252757
Walhalla−6120−387280381−3197643
Poplar7219758141317437235347701

Sierra NevadaPower381612510028647555210589
Cone−42117−4295292391−234293715
Straylor19121159224432924229584
McNally71147391122653596331682

Coefficient of variation1.560.260.182.270.310.141.640.250.12
All plots (n = 1681)371883213530443090336722
Table A3. Producer’s and user’s accuracy for all plots (n = 1681) for each severity class for the three burn severity metrics evaluated in this study. These values use the thresholds developed for all plots and evaluate the burn severity grids that include the dNBRoffset.
Producer’s AccuracyUser’s AccuracyOverall
UnchangedLowModerateHighUnchangedLowModerateHighAccuracy
dNBR73.957.960.473.242.557.966.174.064.2
RdNBR70.146.265.680.636.756.667.478.665.5
RBR72.751.664.978.940.557.868.078.066.2
Figure A1. Scatterplots depicting the relationship between three remotely sensed severity metrics (y-axis) and CBI (x-axis) when the dNBRoffset term was excluded from the equations. The state abbreviation and year in which the fire occurred are shown in parentheses. The red lines represent the nonlinear fits. The coefficient of determination (R2) is shown for each fit. Boxplots in the lower right summarize the R2 of all fires for each metric; boxes represent the inter-quartile range, whiskers extend to the 5th and 95th percentiles, horizontal lines represent the median, solid dots the mean, and asterisks indicate the R2 of 1,681 plots with a single model. All fits are statistically significant (p < 0.001).
Remotesensing 06 01827f4aRemotesensing 06 01827f4b
Figure 1. Location of the 18 fires included in this study. Forested areas in the western US are shown in gray shading.
Remotesensing 06 01827f1
Figure 2. Scatterplots depicting the relationship between three remotely sensed severity metrics (y-axis) and composite burn index (CBI) (x-axis). The state abbreviation and year in which the fire occurred are shown in parentheses. The red lines represent the nonlinear fits. The coefficient of determination (R2) is shown for each fit. Boxplots in the lower right summarize the R2 of all fires for each metric; boxes represent the inter-quartile range, whiskers extend to the 5th and 95th percentiles, horizontal lines represent the median, solid dots the mean, and asterisks indicate the R2 of 1681 plots with a single model. All fits are statistically significant (p < 0.001).
Remotesensing 06 01827f2
Figure 3. Correlations between pre-fire NBR (x-axis) and CBI (a), dNBR (b), RdNBR (c), and RBR (d), using all 1,681 plots. Pearson’s correlation is shown in the upper right of each pane. Plots are colored and symbolized by their field-measured CBI severity class: unchanged (gray inverted triangles), low (green boxes), moderate (yellow asterisks), and high (red diamonds). Horizontal lines are the burn severity class thresholds for each metric (calculated with all plots for dNBR, RdNBR, and RBR).
Remotesensing 06 01827f3
Table 1. Summary of fires analyzed in this study.
RegionFire NameYearPlotsOverstory Species (in Order of Prevalence)Historical Fire Regime (Rollins 2009)
SurfaceMixedReplace
Northwest and Northern RockiesTripod Cx (Spur Peak) 12006328Douglas-fir, ponderosa pine, subalpine fir, Engelmann spruce80–90%<5%5–10%

Tripod Cx (Tripod) 12006160Douglas-fir, ponderosa pine, subalpine fir, Engelmann spruce>90%<5%<5%

Robert 2200392Subalpine fir, Engelmann spruce, lodgepole pine, Douglas-fir, grand fir, western red cedar, western larch5–10%30–40%40–50%

Falcon 3200142Subalpine fir, Engelmann spruce, lodgepole pine, whitebark pine0%30–40%60–70%

Green Knoll 3200154Subalpine fir, Engelmann spruce, lodgepole pine, Douglas-fir, aspen0%20–30%70–80%

SouthwestPuma 4200845Douglas-fir, white fir, ponderosa pine20–30%70–80%0%

Dry Lakes Cx 3200349Ponderosa pine, Arizona pine, Emory oak, alligator juniper>90%0%0%

Miller 5201194Ponderosa pine, Arizona pine, Emory oak, alligator juniper80–90%5–10%0%

Outlet 6200054Subalpine fir, Engelmann spruce, lodgepole pine, ponderosa pine, Douglas-fir, white fir30–40%5–10%50–60%

Dragon Cx WFU 6200551Ponderosa pine, Douglas-fir, white fir, aspen, subalpine fir, lodgepole pine60–70%20–30%5–10%

Long Jim 6200449Ponderosa pine, Gambel oak>90%0%0%

Vista 6200146Douglas-fir, white fir, ponderosa pine, aspen, subalpine fir20–30%70–80%0%

Walhalla6200447Douglas-fir, white fir, ponderosa pine, aspen, subalpine fir, lodgepole pine60–70%20–30%<5%

Poplar 62003108Douglas-fir, white fir, ponderosa pine, aspen, subalpine fir, lodgepole pine20–30%20–30%40–50%

Sierra NevadaPower 7200488Ponderosa/Jeffrey pine, white fir, mixed conifers, black oak>90%0%0%

Cone 7200259Ponderosa/Jeffrey pine, mixed conifers80–90%<5%<5%

Straylor 7200475Ponderosa/Jeffrey pine, western juniper>90%0%<5%

McNally 72002240Ponderosa/Jeffrey pine, mixed conifers, interior live oak, scrub oak, black oak70–80%10–20%0%
Note: Composite Burn Index (CBI) data sources:
1Susan Prichard, USDA Forest Service, Pacific Northwest Research Station;
2Mike McClellan, Glacier National Park;
3Zack Holden, USDA Forest Service, Northern Region;
4Joel Silverman, Bryce Canyon National Park;
5Sean Parks, USDA Forest Service, Rocky Mountain Research Station, Aldo Leopold Wilderness Research Institute;
6Eric Gdula, Grand Canyon National Park;
7Jay Miller, USDA Forest Service, Pacific Southwest Region.
Table 2. Overall classification accuracy when classifying plots into discrete severity classes of unchanged, low, moderate, and high. The last two rows depict the average classification accuracy among the 18 fires and of all plots analyzed simultaneously, respectively.
Fire NamedNBRRdNBRRBR
Tripod Cx (Spur Peak)63.471.670.1
Tripod Cx (Tripod)58.858.861.3
Robert68.575.075.0
Falcon64.371.466.7
Green Knoll63.063.063.0
Puma86.775.686.7
Dry Lakes Cx75.577.681.6
Miller53.250.053.2
Outlet66.768.568.5
Dragon Cx WFU66.766.770.6
Long Jim67.369.471.4
Vista76.180.478.3
Walhalla70.268.170.2
Poplar75.968.575.9
Power75.076.177.3
Cone71.271.269.5
Straylor77.376.074.7
McNally50.857.154.2

Average of 18 fires68.469.270.5
All plots (n = 1681)64.265.566.2
Table 3. Thresholds for the three remotely sensed burn severity metrics corresponding to CBI = 0.1 (unchanged/low), 1.25 (low/moderate) and 2.25 (moderate/high) for each fire.
RegionFire NamedNBRRdNBRRBR

unch/lowLow/modmod/highunch/lowlow/modmod/highunch/lowlow/modmod/high
Northwest and Northern RockiesTripod Cx (Spur Peak)5216843310931069640123304
Tripod Cx (Tripod)9623848420440875276173336
Robert10922552212928664863139316
Falcon15224847120038375598172334
Green Knoll−27203518−37258666−18125322

SouthwestPuma361443525247993830126295
Dry Lakes Cx7115334113236071453129276
Miller122165320294400785102139268
Outlet−30126399−65201633−2490284
Dragon Cx WFU19121368202116221191271
Long Jim5115127412243778743132238
Vista−69130466−111209716−4893325
Walhalla301564176625970125114307
Poplar6018542517831268850132308

Sierra NevadaPower381614755621159026101287
Cone−35124398−214309727−35101298
Straylor361383469427361230107258
McNally911673797336671754128281

Coefficient of variation1.320.230.171.690.270.111.330.200.09
All plots (n = 1681)421804229931970435130298

