1. Introduction
Airborne and spaceborne hyperspectral remote sensing offers repetitive, consistent and comprehensive datasets with enhanced discrimination capabilities for the characterization of subtle spectral features and important chemical and physical properties of the observed terrain features/objects. A significant amount of research and development has been concentrated on a variety of applications including environmental monitoring, agricultural, forestry and geological mapping, natural resource exploration, land-use analysis, terrain categorization, water-quality monitoring,
etc. [
1–
3].
Moreover, due to the recent advances on optics and photopic technology, sensors’ quality (e.g., signal to noise ratio) is improving continuously and new dual (e.g., [
4]) or lightweight ones with low power consumption for unmanned aerial vehicles (UAVs) have been developed and employed (e.g., [
5–
7]). In all above applications, the continuously and enormously increasing size of acquired data requires the development of efficient operational tools that are able to register accurately and automatically the acquired hypercubes. The registration approach should adaptively vary to accommodate different types of sensors (frame or push-broom) that differ in the acquisition procedure and the resulting geometry.
On the one hand, the push-broom (line scanning) sensors capture gradually (line by line) the spatial image domain and concurrently all spectral bands. Let us denote with : Ω ⊂ 3 → a hyperspectral dataset (hypercube), where (x, y, z) = Iz(x, y) and x, y are the spatial image dimensions and z indexes one of the N spectral bands/channels. Push-broom sensors, at a single moment t and at every sequential acquisition step, capture only one line along the x spatial axis but all the spectral channels across the z spectral axis. Therefore, the acquired hypercube is heavily distorted across the two spatial axis, while all the spectral bands are co-registered. On the other hand, the frame hyperspectral sensors acquire, at a single time instance t, spectral information from one channel that covers the whole spatial domain I(x, y). The spectral bands are captured sequentially at consecutive time instances t. Therefore, the resulting hypercube is not registered across the z spectral axis. Depending on the movement and motion of the acquisition platform the displacements are in the general case significant, as every image Iz(x, y) was not acquired from the same principal point and with the same geometry.
Co-registration of the captured spectral bands is therefore necessary in order to account for the misalignment due to the fact that they were acquired at different time instances. The requirement for registration is further amplified by a number of distortion sources that include, but are not limited to, the movement of the airborne platform upon which the sensor is mounted, the different acquisition settings (e.g., frame rate, integration time,
etc.), and the distortions that are induced by the multi-filter optical system. As a consequence, the registration process should be able to cope with transformations that are parametrized by an increased number of degrees of freedom, such as the affine and the polynomial ones [
8,
9].
In this paper, an automated generic co-registration framework for frame hyperspectral sensors is introduced which is based on feature descriptors. The developed approach has been designed to address affine transformations, but it can be easily extended to other transformations including the case of projective or polynomial models. We focus on airborne frame hyperspectral VNIR sensors which record wavelength bands from 400 nm to 1000 nm with a 10 nm–80 nm Full Width at Half Maximum (FWHM), which are usually mounted onboard UAVs or manned helicopters and aircrafts. The proposed frameworks exploits the efficiency of local feature detectors in order to effectively detect key points in salient image regions. Aiming for a generic formulation, all the standard feature descriptor parameters like scale octaves, initial smoothing, gaussian blur, nearest neighbor ratio, contrast/edge thresholds, etc. have been left stable.
1.2. Contributions
In this paper, we propose a generic and automated framework which can utilize any descriptor without the need to tune its parameters. Note that for example the SIFT performance is controlled by 17 different parameters [
21,
24] and their optimal tuning (if any) is an extremely complex procedure for hyperspectral data. Moreover, allowing the delivery of more key points (e.g., increasing octaves, decreasing initial smoothing,
etc.) and correspondences results, also, to numerous outliers (
Figure 1, [
21]).
The focus of this work is to keep the computational complexity as low as possible allowing with optimized coding real time applications. Therefore, the image descriptors are not computed over the entire hypercube [
23] or the entire projection space [
22], but they are computed at severally bands of the hyperspectral data. This is of significant importance if one takes into account that feature point descriptors are already high-dimensional vectors while the vector SIFT formulation multiplies their complexity by the number of the spectral bands.
Motivated by the observation that the success of automatic feature extraction relies on the descriptor and the characteristics of the input data [
13], the proposed approach divides the wavelength in three parts (named Main Spectral Groups, MSG) in which terrain objects usually poses the same stable spectral characteristics and behavior. This allows the efficient decomposition of the registration problem and the accurate fully automated co-registration of every hypercube without using any information e.g., from the GPS/IMU as in similar efforts [
7] or propose specific spectral borders as in [
7,
25]. The algorithm does not make any assumption about the type of sensor,
i.e., a Fabry-Perot interferometer with this expected intensity range, radiometric characteristics,
etc. Furthermore, generic grouping rules let any dataset from any hyperspectral frame sensor to fit in.
2. Developed Methodology
Our goal was to design a generic and automated framework that is able to efficiently register raw hyperspectral data from frame-type sensors. Such data usually contain tens or hundreds of images that in general, depict the same geographic region. However, since every spectral band has been acquired in a different moment, raw data are unregistered. The spatial content of the acquired bands of the hypercube can vary significantly, depending on various parameters like the platform stability, position-hold capabilities, micro-movements, speed, sensor’s integration time, etc. In particular, in most cases the overall geometry of each spectral band differs a lot and for example just the translation can be in the range of tens of pixels.
The developed approach is generic, automated and can account for different spatial and spectral resolutions and different spectral ranges, narrow or broader band settings. The developed methodology utilizes data correspondences which have been detected automatically from invariant and robust image descriptors. Throughout our experiments three standard local feature description were employed (namely SIFT, SURF and ASIFT). We compare the three descriptors in terms of efficiency and applicability for frame hyperspectral data from UAVs. Depending on the application one can employ any unsupervised local feature descriptor, robust estimation and transformation/warping algorithm. The developed methodology is able to account for all the spatial and spectral variations and to recover data geometry based on any transformation (like an affine one).
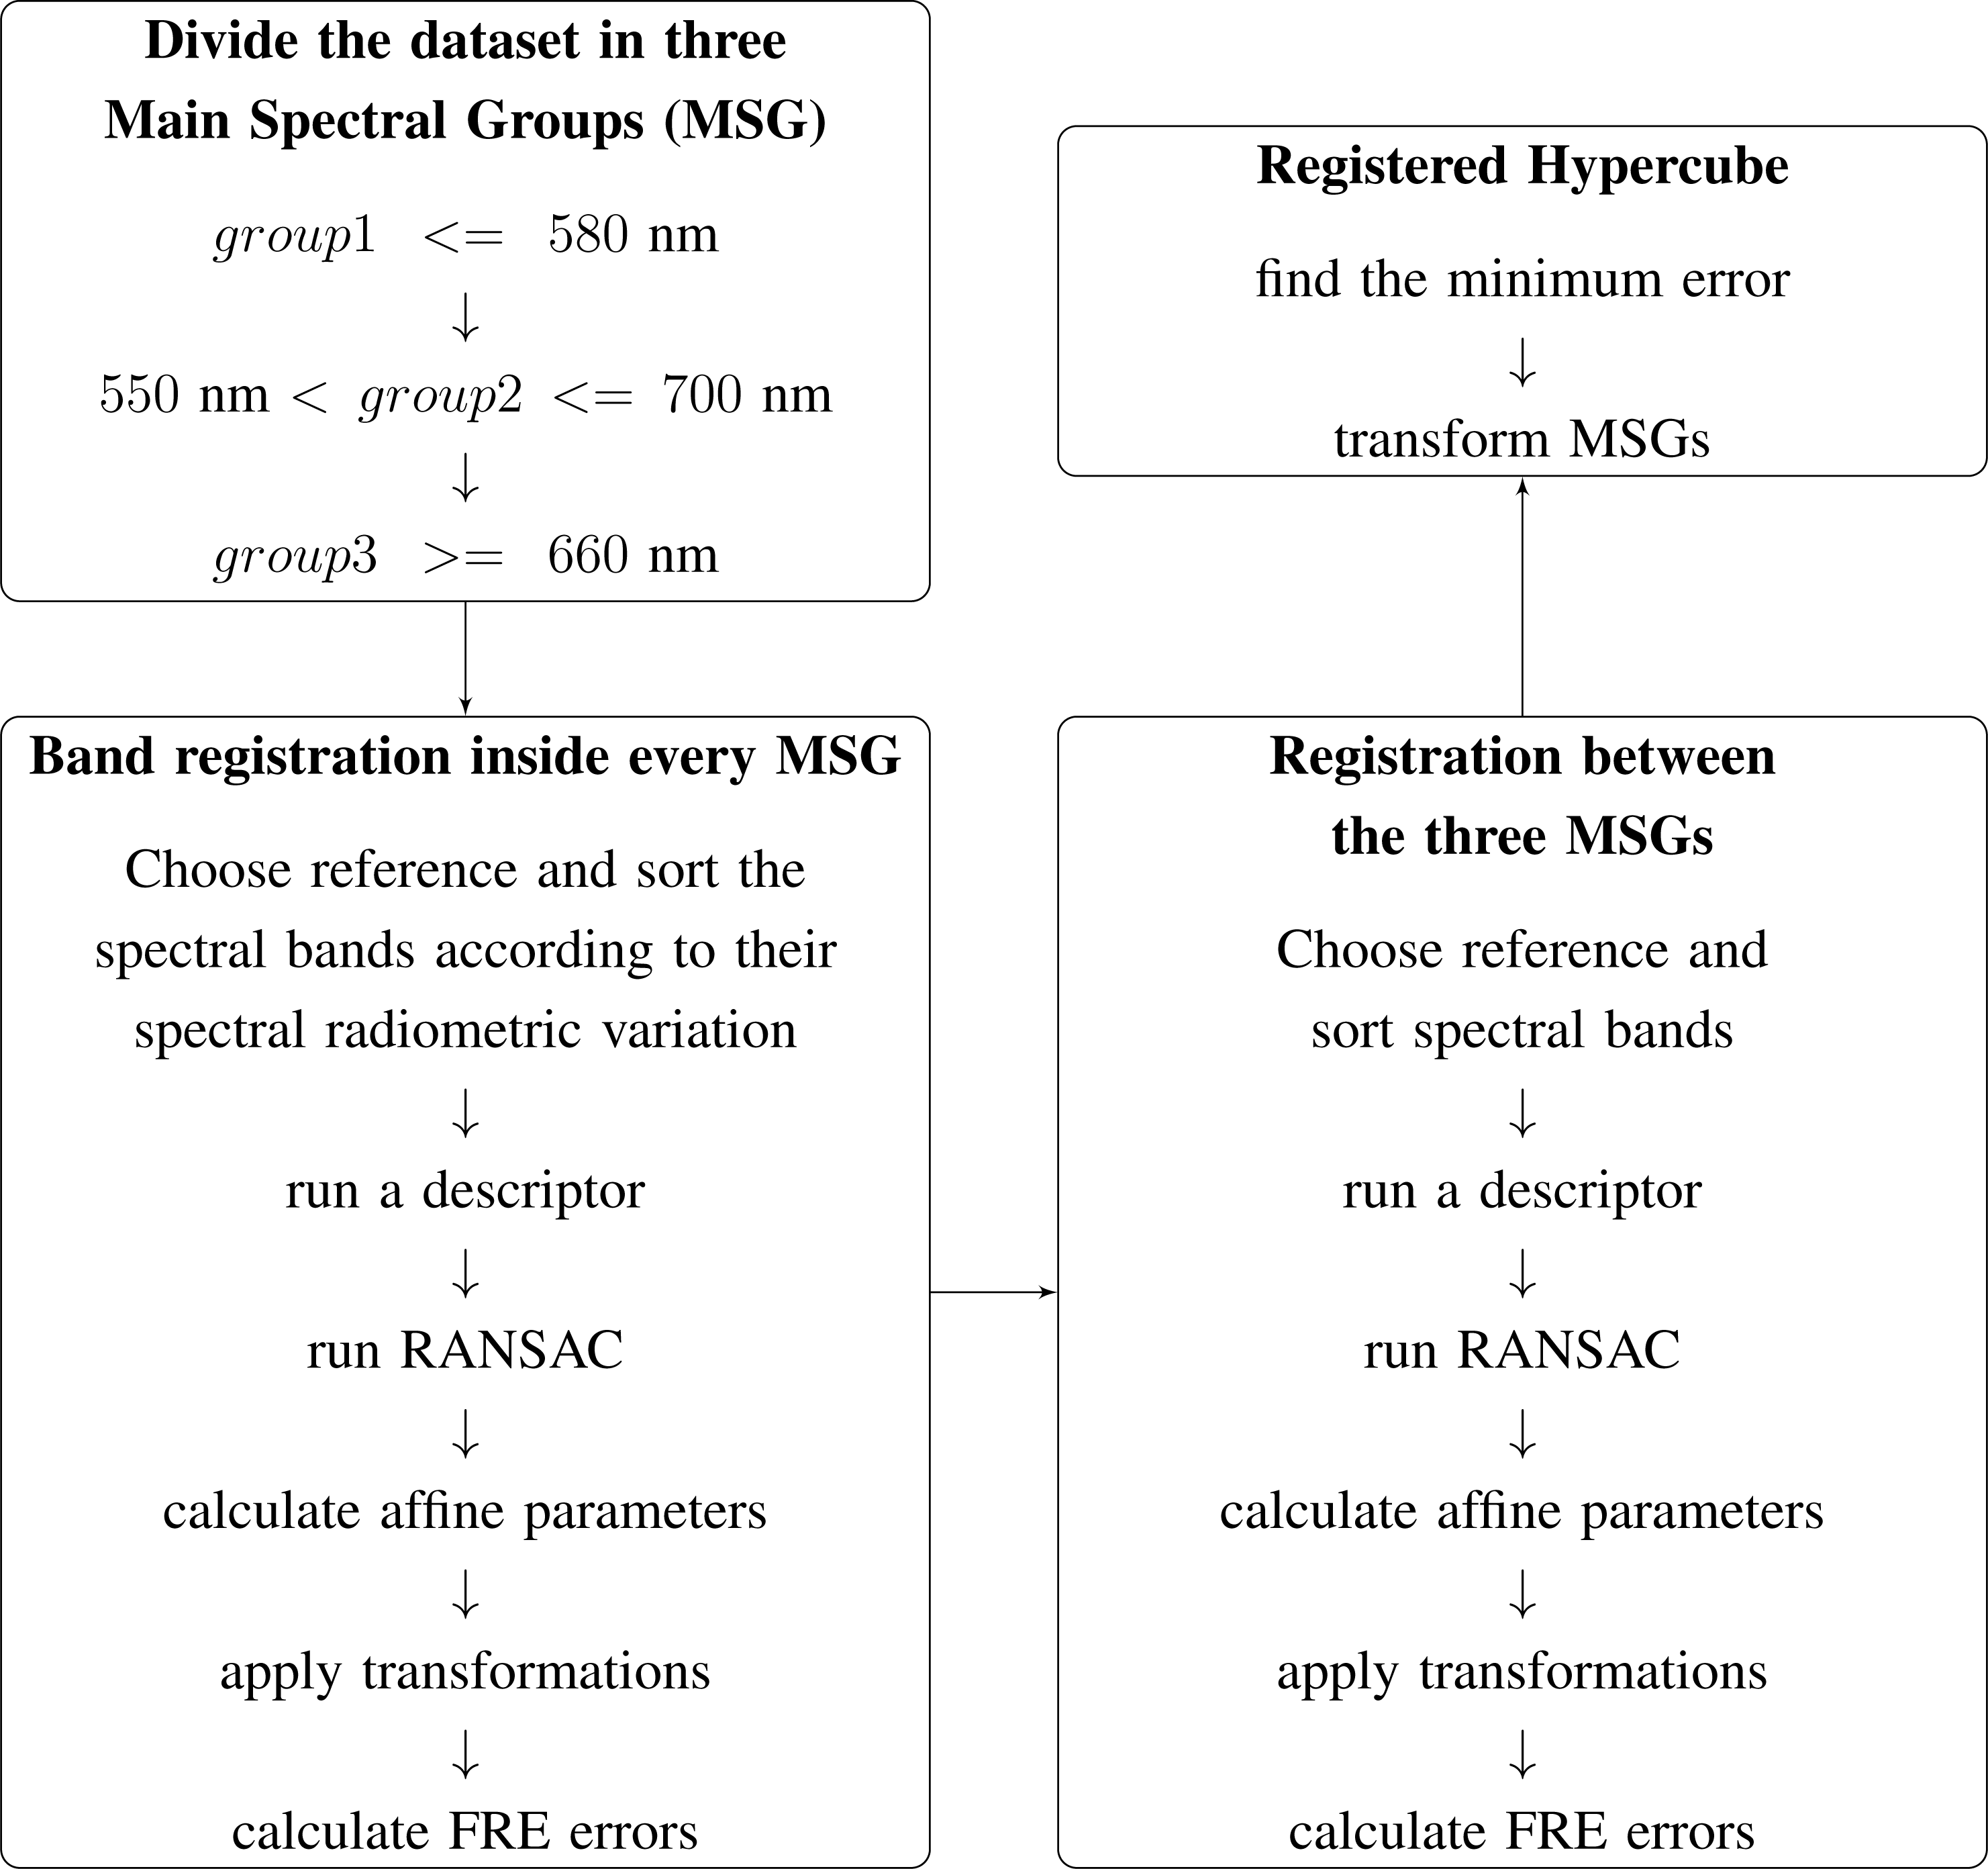
The corresponding flowchart of our implementation is described in
Figure 2. More specifically, the developed approach can be divided into the following three processing steps.
- (i)
Classify spectral bands in Main Spectral Groups (MSG):
The first step of the procedure is to separate the hypercube into the dominant spectral categories according to the given wavelength (i.e., sensor’s sensitivity). The borders of the three main spectral groups were determined based on our experience regarding the representative spectral signatures of the main terrain objects. Water, impervious surfaces/man-made objects and vegetation change, in general, their reflectance/behavior at the green-yellow and red-edge regions. Therefore, and without sticking to a specific sensor or specific wavelenght/channels, three overlapping spectral groups are generated. In particular, for VNIR sensors the borders are defined at the green-yellow (550–580 nm) and red-edge (660–700 nm) regions. It should be noted that the borders are not exact numerical thresholds but the formulation allows one spectral band to take part in more than one spectral groups. This formulation significantly facilitates the last co-registration step.
- (ii)
Spectral bands registration in each spectral group (MSG):
During the second processing step, the spectral bands from each MSG are co-registered. Unlike similar efforts [
7], we do not a priori specify our reference bands. During the initialization process, we calculate the standard deviation of each spectral band as an indication about the spectral/radiometric variation of every channel. In particular, after sorting the bands of each spectral group, the ones with the broader spectral variation are used as a reference and all the other ones from the group are registered to this selected one through an iterative procedure. We select the reference band with the specific unsupervised manner as it makes easier for the detectors to find correspondences with the other bands of the group. One can employ different descriptors (like SURF, SIFT, ASIFT,
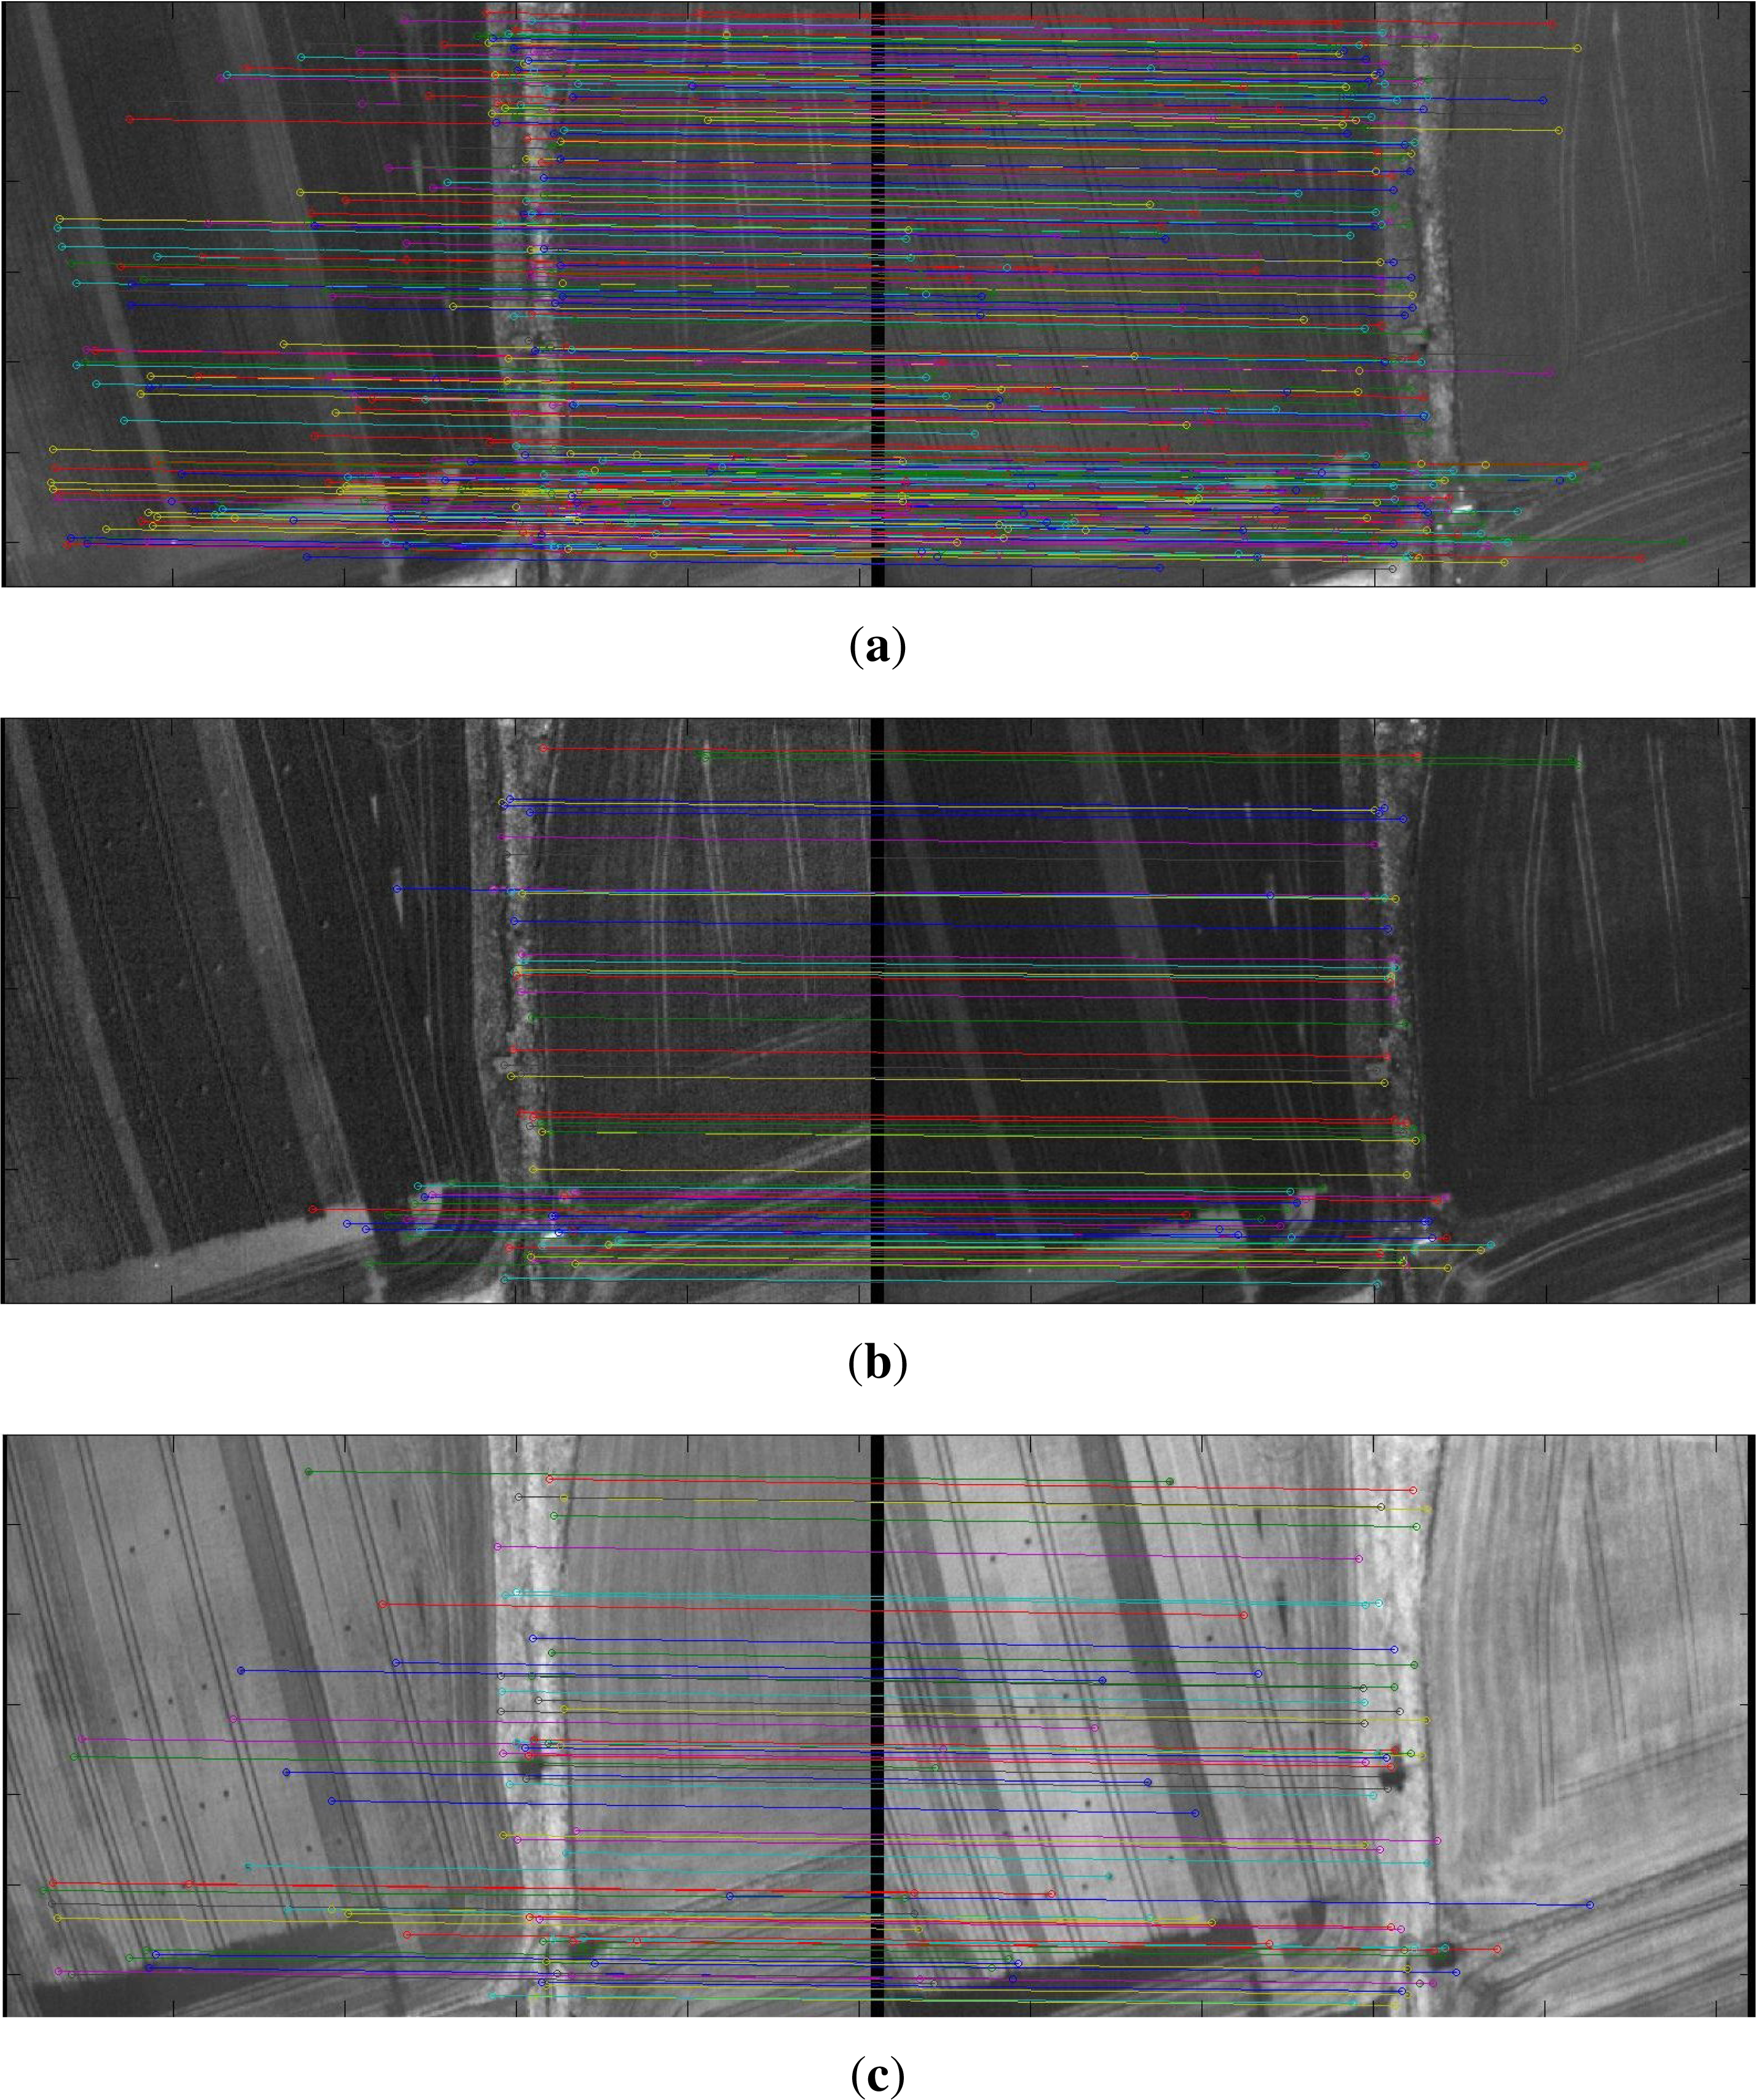
etc.) and robust estimation procedures (like RANSAC) in order to efficiently detect enough correspondences for the (e.g., affine) transformation and spectral band registration. This registration procedure is demonstrated in
Figure 3a–c for the three corresponding spectral groups in which the developed approach managed to produce enough inliers for the successful in-group registration.
- (iii)
Co-registration of the spectral groups (MSG):
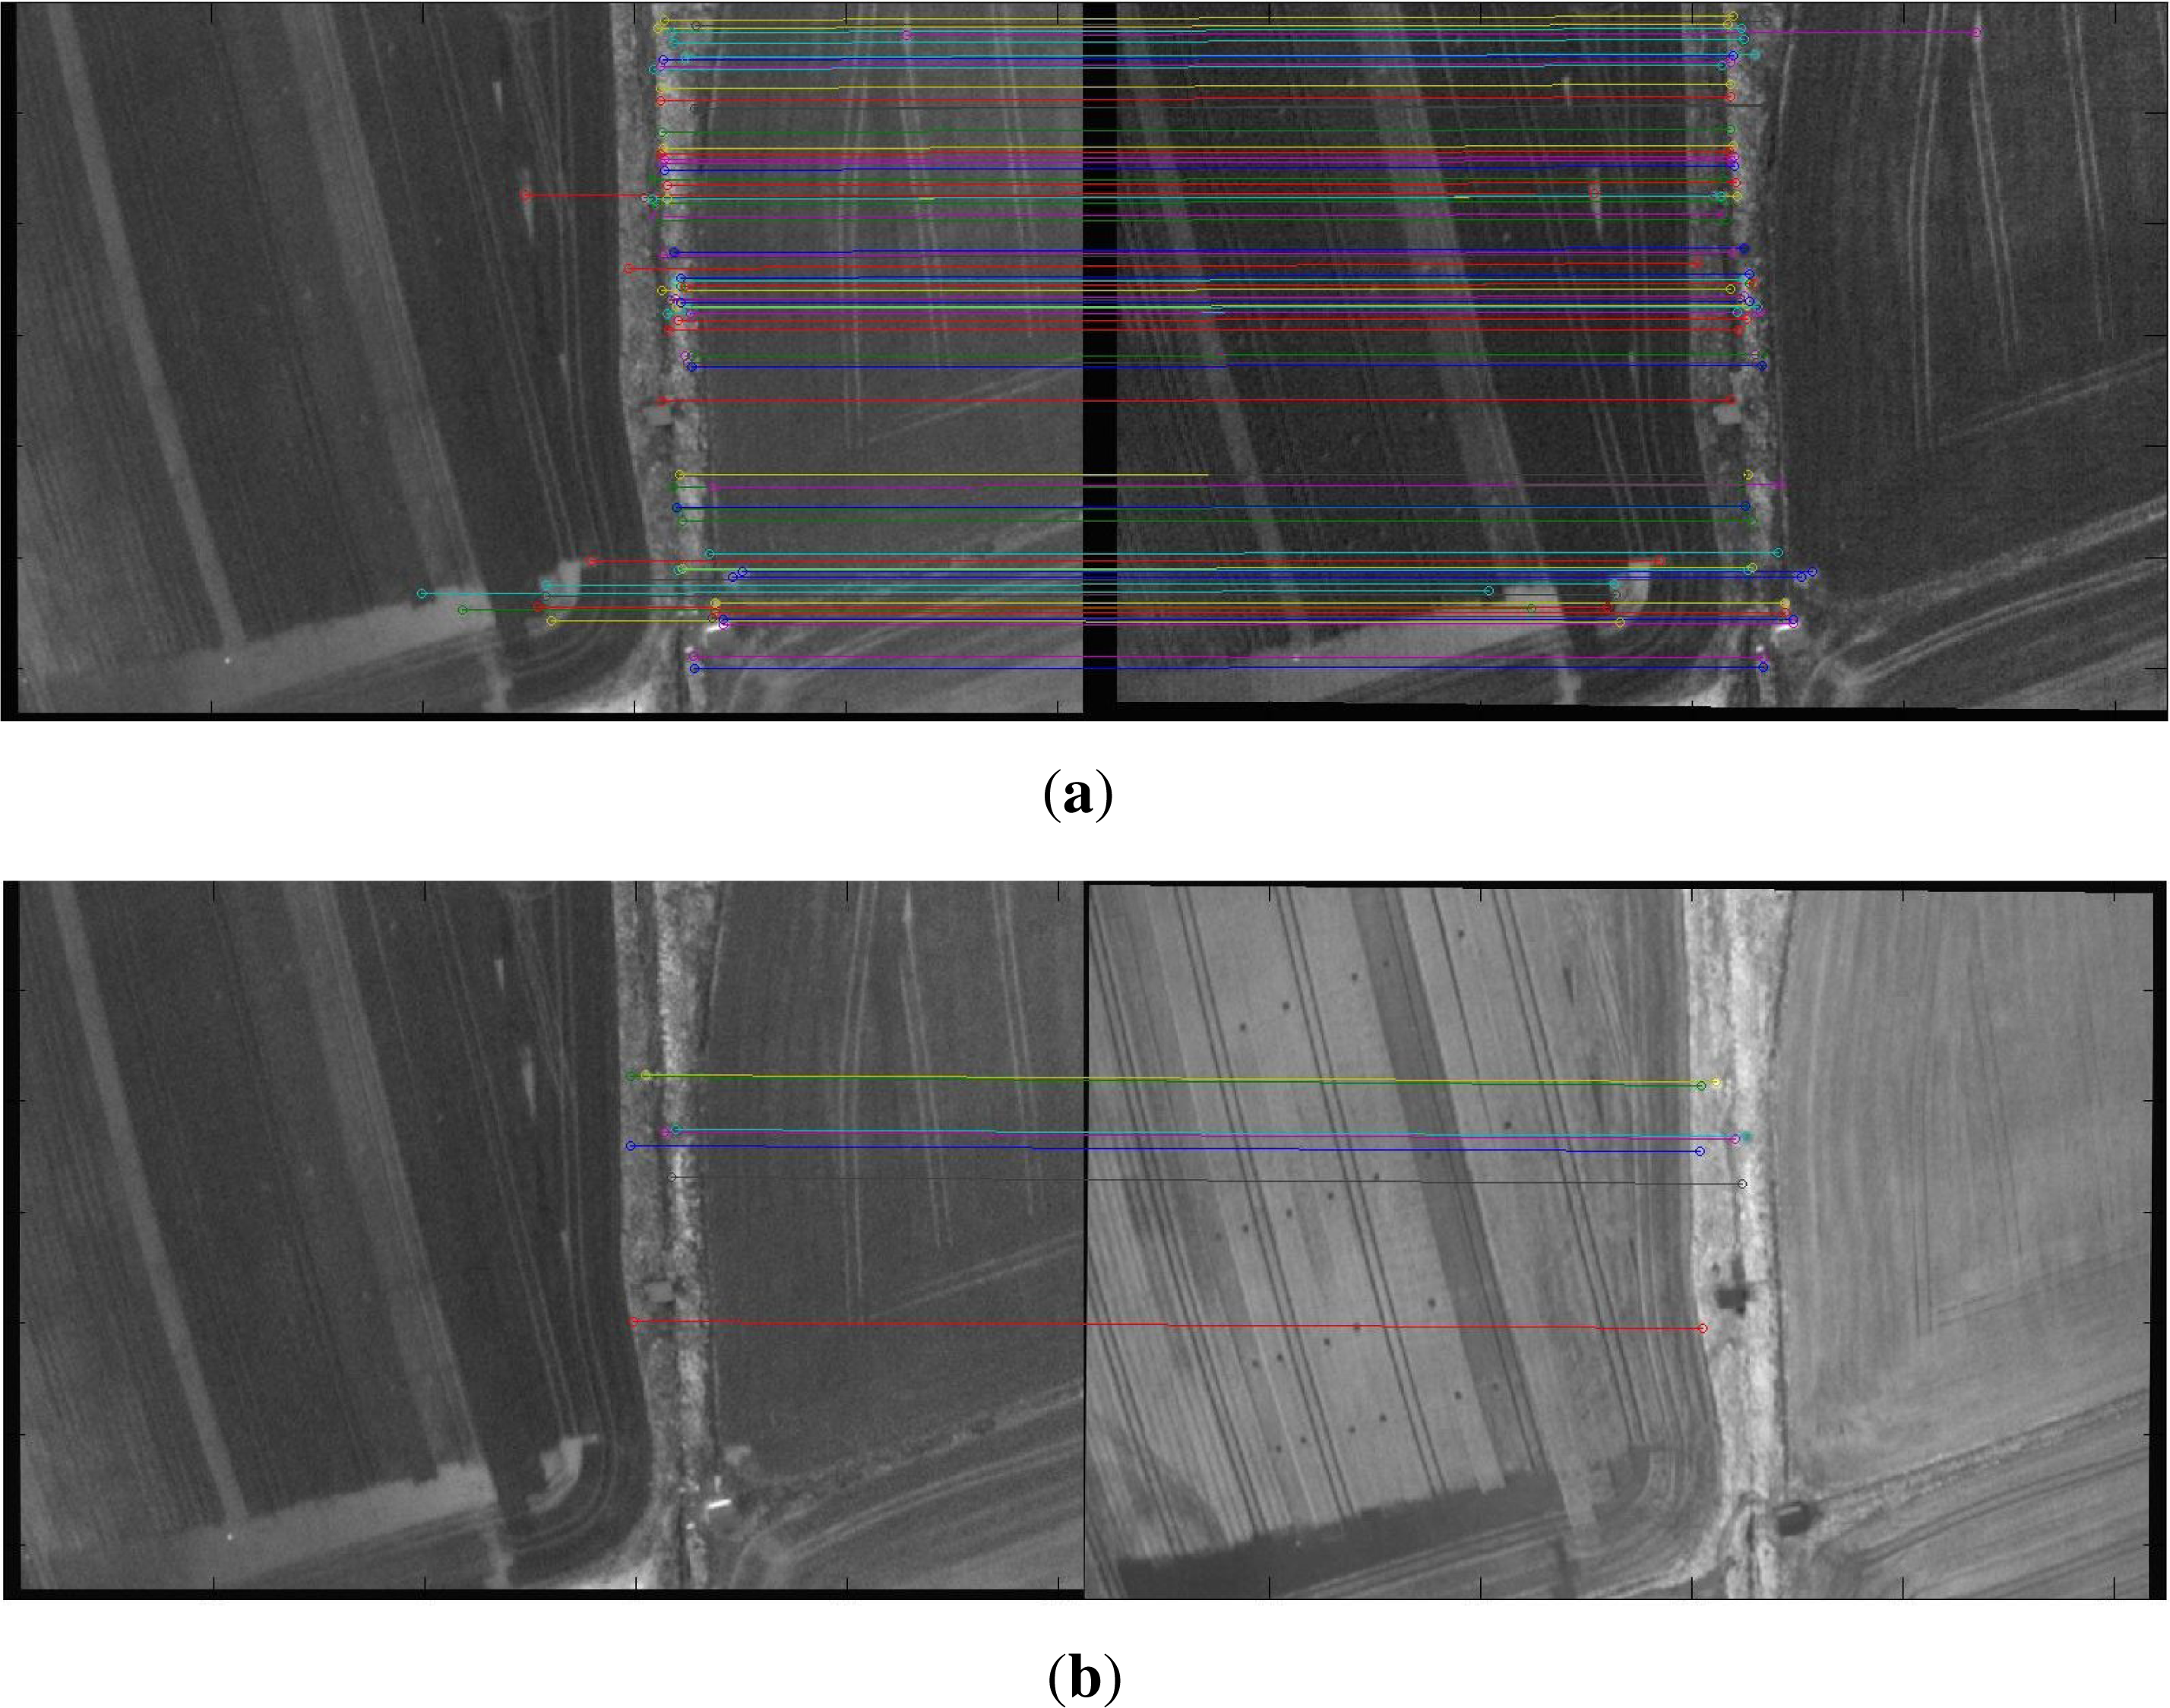
At this point the spectral bands of each group are registered and the next processing step is to perform the co-registration between the MSGs. Therefore, we propose an iterative approach in order to seek for the appropriate representative bands based on both their spectral variance and proximity to each group. Under such an unsupervised manner the appropriate optimal bands (or series of bands) are selected and correspondences are computed for the co-registration task (e.g., the correspondences between the first and second MSG are shown in
Figure 4a while the ones between the first and third shown at
Figure 4b). In particular, the algorithm sorts the bands of each group according to their variation (standard deviation) and proximity (spectral distance between the individual bands) in the following manner. First in the list are the bands which served as a reference (larger variation) in the previous step, then follow the bands which are closer to them (with a small spectral distance) and then the rest of the bands according to their standard deviation. This type of sorting enables the convergence usually after just a couple of iterations.
Under the proposed formulation we narrow effectively the search space of solutions (image pairs) by selecting in an unsupervised manner the spectral bands which can lead quickly to the required solution. The key values for VNIR sensors are placed near the borders of the green/yellow and the red-edge regions. These regions are defining and determining the band classification in coherent groups. Note that we allow spectral overlaps.
Moreover, in the second and third step, a robust estimation procedure like RANSAC (RANdom SAmple Consensus) is used in order to detect outliers. Throughout our experiments, we account for affine transformations [X = a(1, 1)×x+a(1, 2)×y+a(1, 3); Y = a(2, 1)×x+a(2, 2)×y+a(2, 3)] since it is the model that is commonly used during registration and ortho-rectification procedures. However, other simpler or more complex models can be straight forwardly applied.
In order to evaluate quantitatively the performance of each procedure, the Fiducial Registration Error (FRE) was calculated in every case and for all spectral bands [
26]. FRE gives an indication of how well the detected correspondences are matched together. The FRE error is giving an indication of how correct the inliers are, how correct the correspondences serve globally the given transformation. More specifically, FRE is the average ratio calculated by finding the sum difference of all the corresponding points between the reference and the registered image and the sum difference of the reference and the test image.
where N is the number of correspondences, R and t are the parameters of the calculated transformation, xi is the position of the point at the test image, the yi is the position of the point at the reference image and ωi is a non-negative weighting factor, which may be used to decrease the influence of less reliable points and it is calculated by the formula
where LEi is the difference between the position of the point at the test and reference initial image.
FRE acts as an indicator of the overall registration errors. Briefly, given a certain set of point correspondences, which can be a priori defined, the registration can performed by selecting an appropriate transformation that aligns these point sets (fiducial points or ficucials). In either views of the image, the chosen fiducial points are displaced from their correct locations (localization error, LE).
Through an iterative process and by sorting spectral bands based on the possibility to deliver numerous and correct correspondences across the spectral range of each group, an optimal search path is proposed which can be interrupted as soon as the process reaches an accepted maximum error (FRE). In addition, by allowing spectral overlaps, certain (common) bands are classified in more than one group and therefore in the third step the process may end up to a fully constrained warping i.e., register two groups based on the same spectral band. Therefore, by introducing a generic spectral grouping and by allowing spectral overlaps the possibilities to have a concrete co-registration step are significant. However, in cases that the common bands differ a lot for the group and during the registration procedure large FRE errors are calculated, then they are excluded from the group.
3. Experimental Results and Evaluation
The developed methodology was qualitatively and quantitatively validated on six different datasets. The test data were acquired from a frame hyperspectral sensor onboard a UAV (multicopter and fix-wing). The hyperspectral sensor (Rikola
®) had an horizontal and vertical FOV at 37° and a default spectral range: 400–1000 nm, with a min spectral resolution (FWHM) at 10 nm. The default spatial dimensions of it are 1024 × 1024 pixels with a power consumption less than 5 Watt and a weight less than 600 g. Certain acquired datasets contained 42 spectral bands with a spectral range of 400–850 nm and other from 20 to 40 spectral bands with a spectral range from 450–900 nm. The Rikola sensor is employing a Fabry-Perot interferometer which is formed by two semi transparent mirrors placed face to face. The use of multiple orders of the interferometer is matched to different sensitivities of the RGB pixels of the image sensor. The Fabry-Perot interferometer is placed in the lens system in such a way that the light goes collimated through it and the transmitted spectral bands are a function of the interferometer air gap. By changing the air gap it is possible to acquire a new set of wavelengths for each image. With a sequence of images captured with different air gap values the spectrum is reconstructed for every pixel in the image [
27]. The hyperspectral datasets were acquired over different regions consisting of simple and complex landscape, multiple objects of various classes, different texture patterns and an important terrain variability. They also may contain shadows and occlusions.
Firstly, as it is demonstrated in
Figure 3 the developed algorithm can address efficiently during the first processing step the registration of every spectral band in every MSG. After deciding the appropriate reference, their co-registration takes place based on the detection of both enough and correct correspondences which is indicated also by the calculated errors. For example, in
Figure 3 all spectral bands, including the common ones, have been properly registered with a sufficient amount of accurate correspondences and low registration errors. In particular, bands from the 510.2 nm, 601.7 nm and 783 nm were chosen as the reference and the maximum calculated error was (i) 0.02 with 290 correspondences for MSG #1 as it is demonstrated in
Figure 3a; (ii) 0.03 with 72 correspondences for MSG #2 as shown in
Figure 3b and (iii) 0.02 with 75 correspondences for MSG #3 as shown in
Figure 3c.
Furthermore, the third processing step which is addressing the co-registration between the spectral groups has been validated and delivers similar accurate results. Correspondences are computed between the appropriate spectral group representatives and the co-registration of the MSG is performed (
Figure 4). This is not a trivial task, however, as the algorithm is seeking for the optimal band combination between different groups that deliver enough correspondences and low errors. Common bands are sorted first in the list and other depending on their spectral variance and proximity follow. For example, in
Figure 4a the spectral band at 550.5 nm, which has been successfully registered at both MSGs, was employed in the third processing step resulting to a low registration error of 0.84 with 84 correspondences. The other two MSGs, shown in
Figure 4b, were registered based on the spectral bands at 550.5 nm and 715.7 nm with a resulting error of 3.24 and when 7 correspondences had been calculated.
Moreover, in
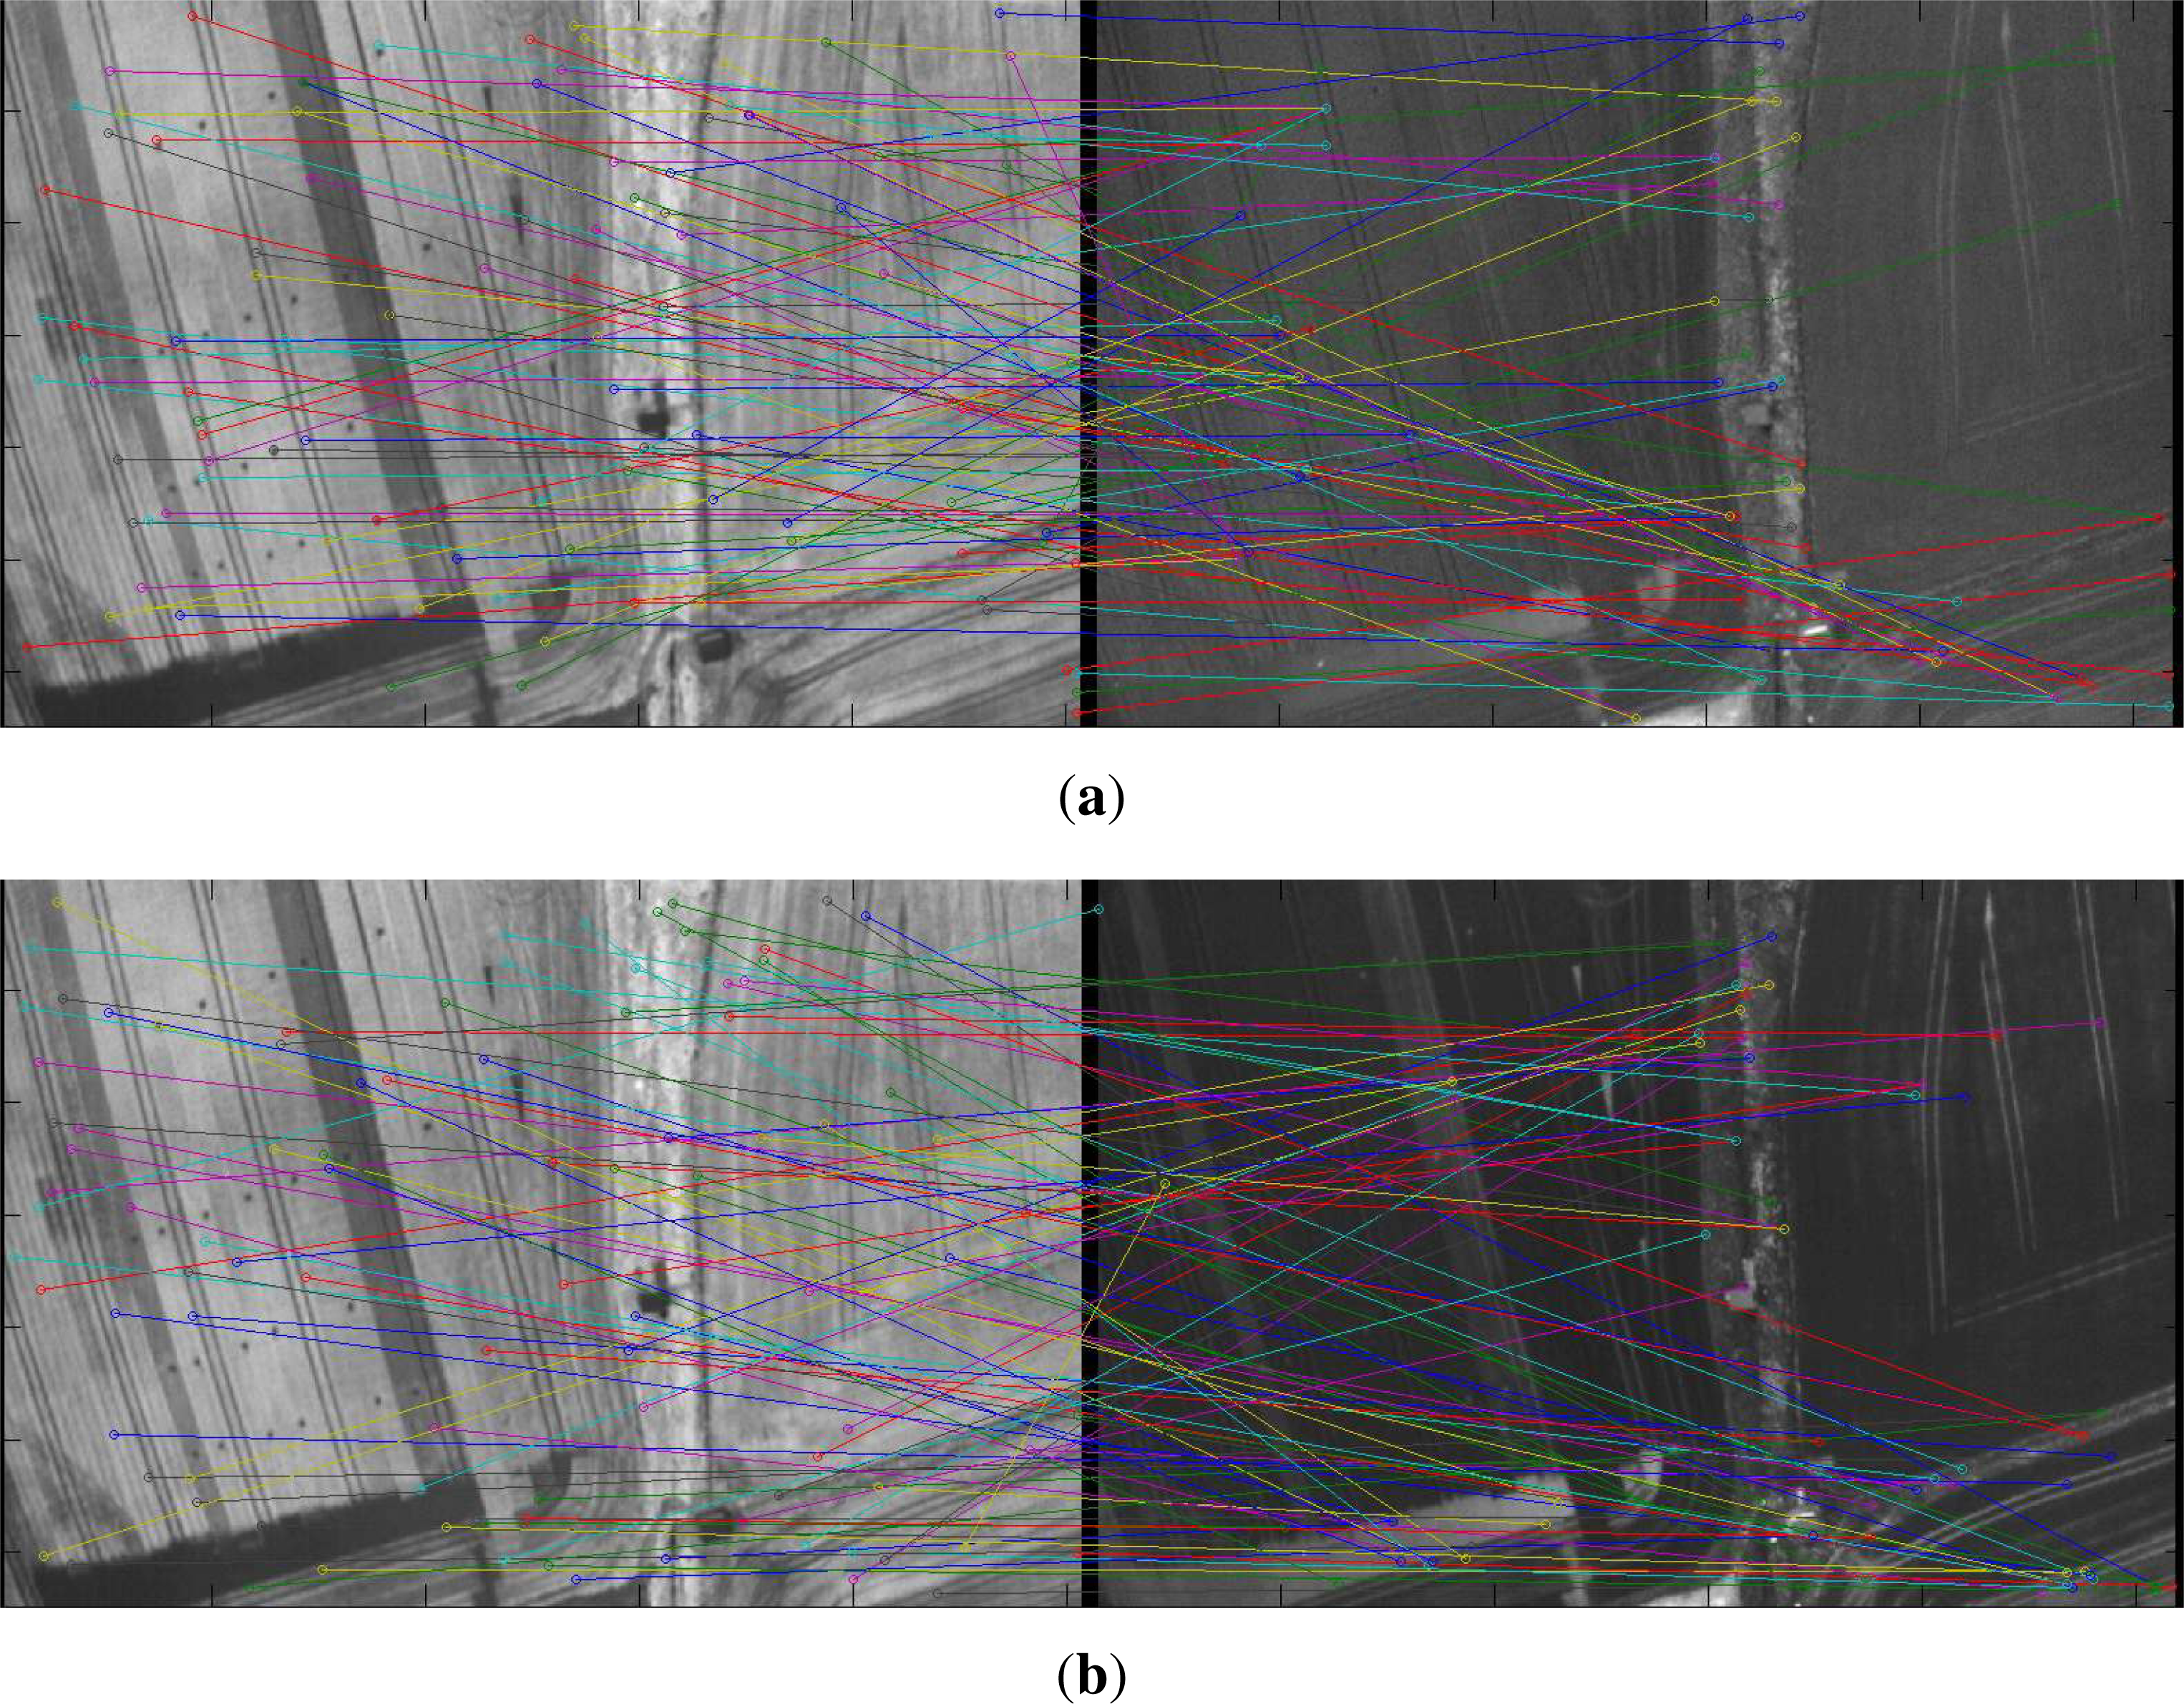
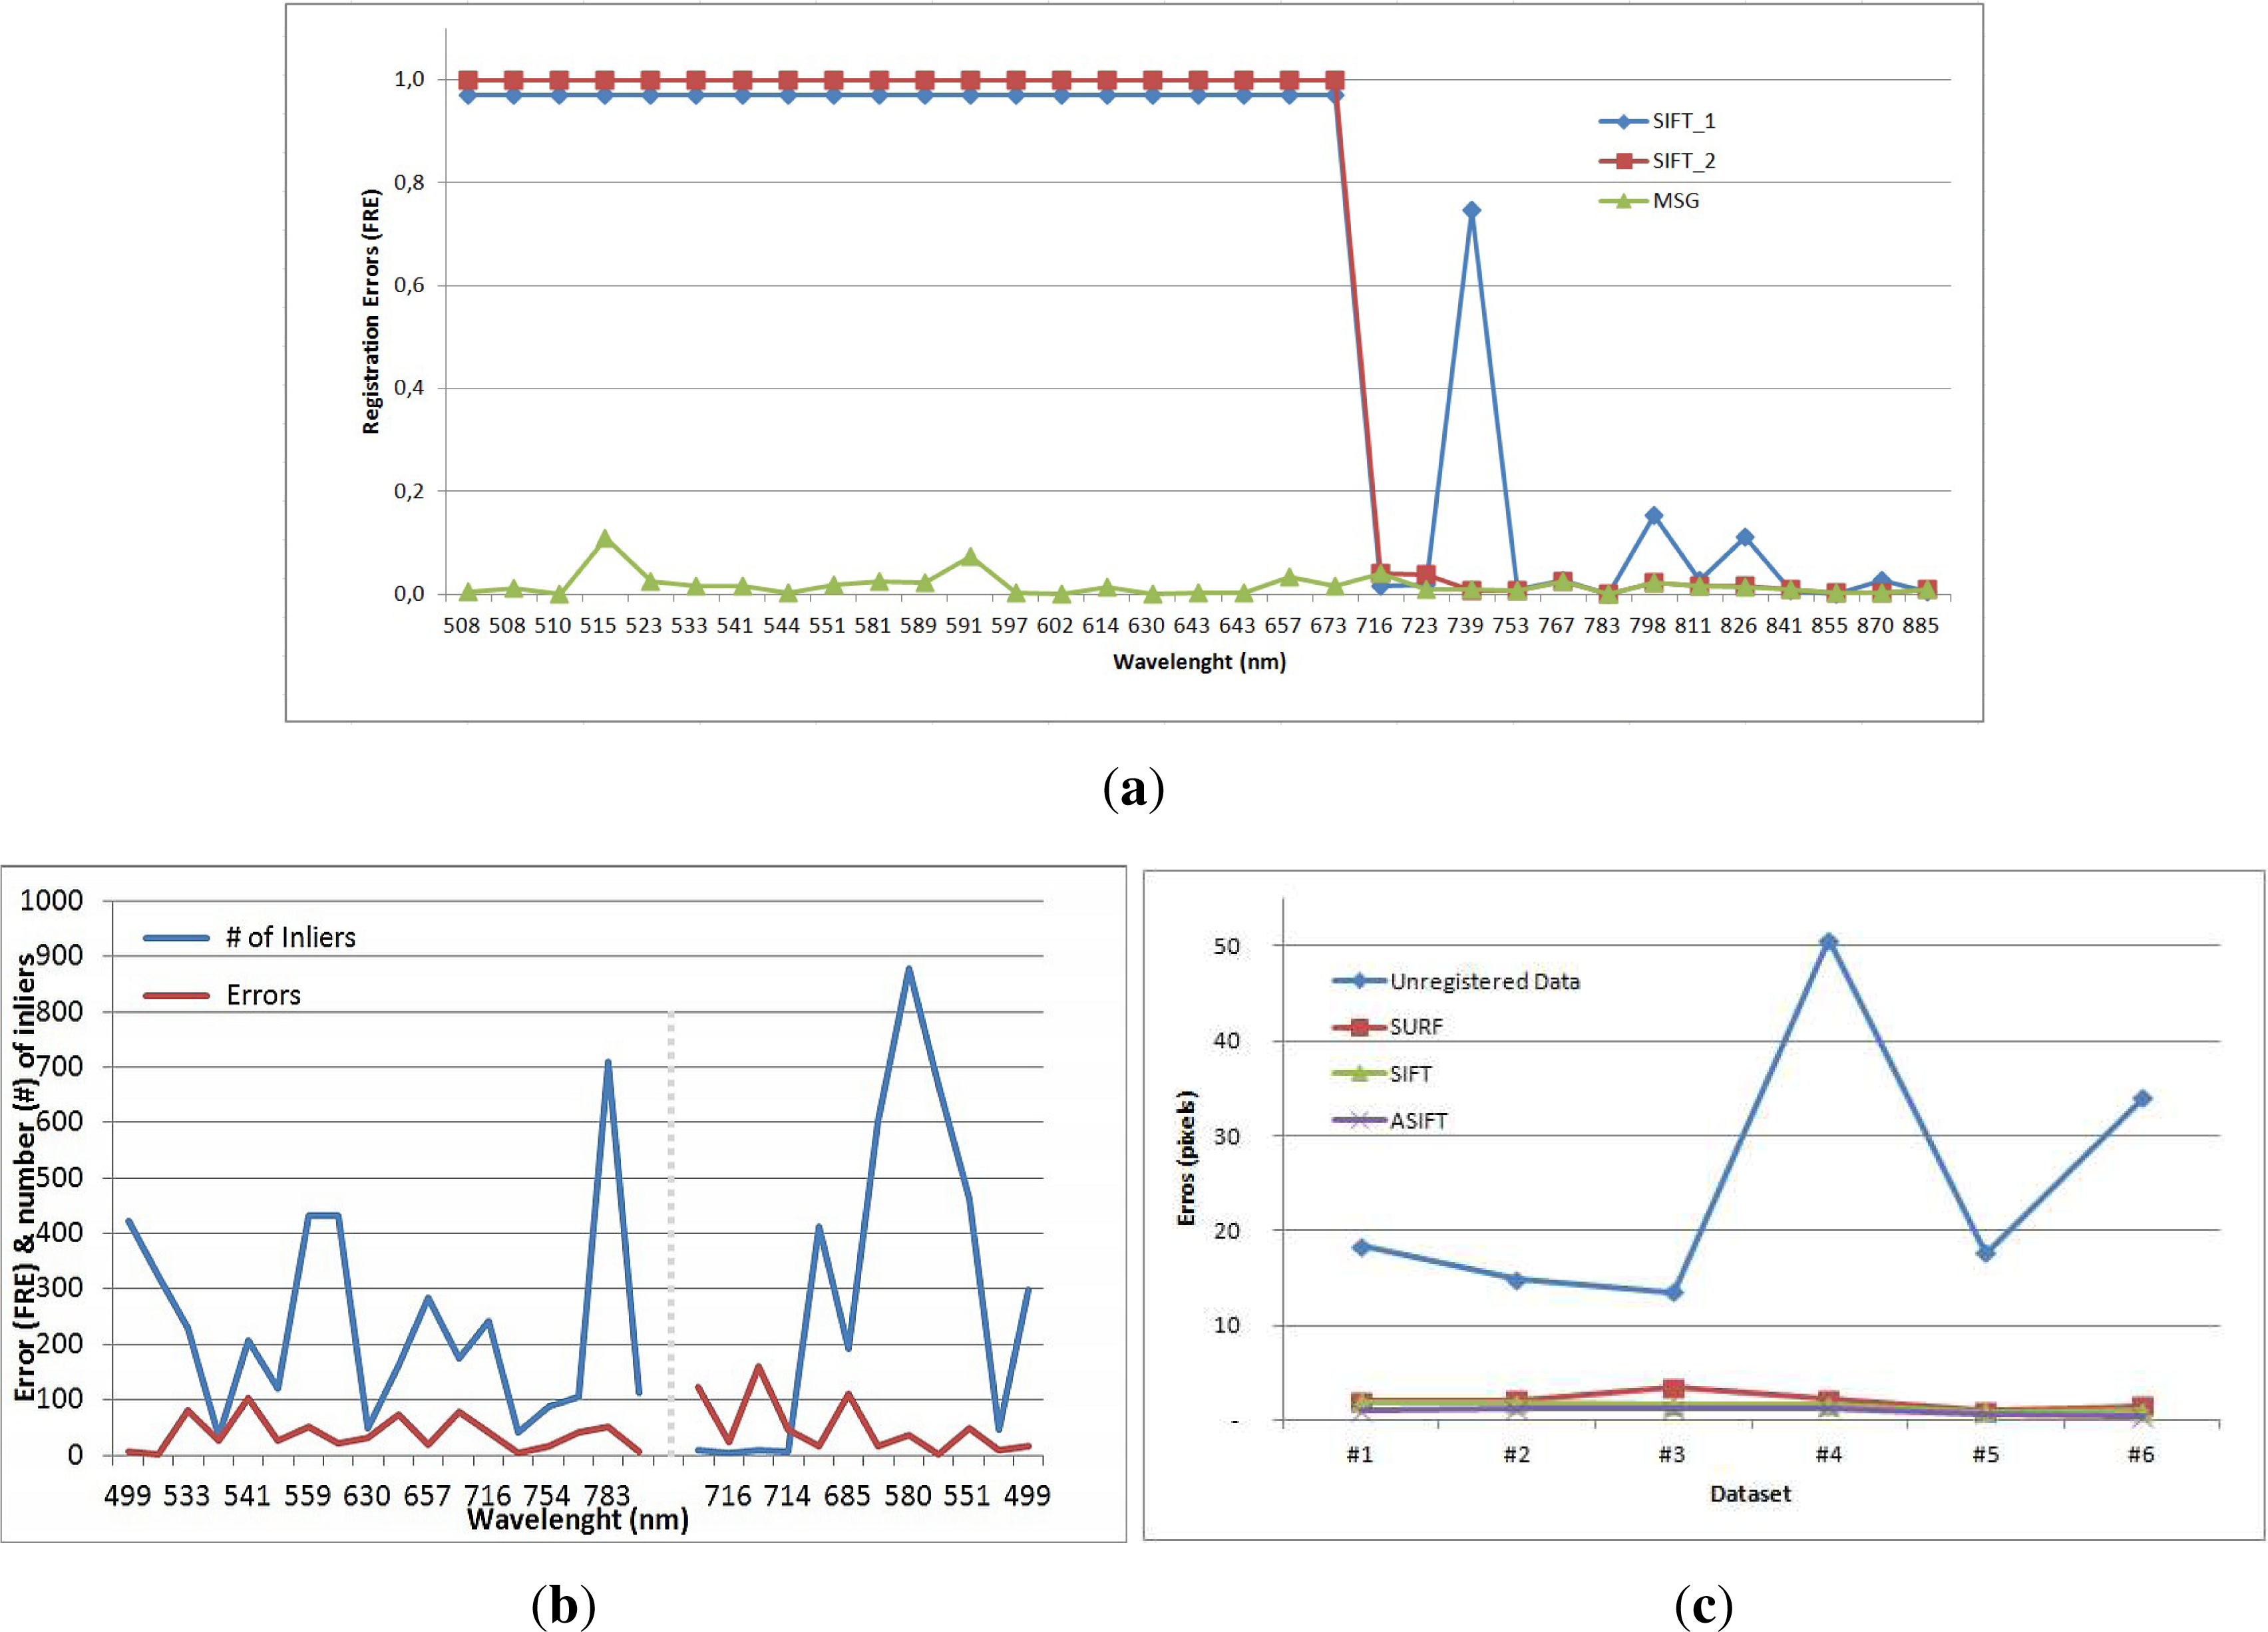
Figure 5 one can observe the overall performance of the developed methodology as it has been calculated during the quantitative evaluation. In
Figure 5a it is demonstrated that local feature descriptors fail to deliver enough inliers when computed over the entire given spectrum. Both SIFT with standard parameter settings and SIFT with a more sensitive setup and more delivered features points fail to calculate effective correspondences and therefore outliers dominate the result. In particular, even with a robust model estimation the registration procedure could not converged for all the bands up to 700 nm, while in contrast the proposed method addressed successfully the entire hypercube. For the default SIFT setup the major parameters were those proposed by Lowe ([
12])
i.e., number of octaves: 3, edge threshold: 10 and initial gaussian blur: 1.60. For the sensitive SIFT setup: number of octaves: 6, initial gaussian blur: 1 and nearest neighbor ratio: 0.8. Moreover, regarding the ASIFT ([
17]) descriptor the parameters were the same as the default SIFT ones, while the tilt was set to 4. In a similar way, the SURF ([
16]) parameters were the default: number of octaves: 5, initial sampling step: 2 and Hessian response threshold: 0.0002. In general, the standard SIFT and ASIFT techniques failed to detect correspondences between the bands that were just before and after the red edge region (680–700 nm). The SURF and the more sensitive SIFT did find more correspondences, but even after a dual RANSAC application many outliers were dominating the result.
In
Figure 5b,c it is shown that during the proposed registration procedure the number of resulted inliers is relative large and in all cases sufficient to address the transformation. The calculated errors (in
Figure 5b), which are presented for visual reasons upscaled by a factor of 1000, stayed, also, relative low indicating that in all cases the computed correspondences are both enough and correct. Note that the left part of the plot in
Figure 5b (499 nm–783 nm) indicates the performance of the 2nd processing step and the right part (716 nm–499 nm) the performance of the 3rd processing step. In
Figure 5c the resulting errors, which have been computed from the manually denoted points, of every descriptor for all the datasets are presented (
Table 1). The blue line represents the initial mean measured displacement which is more than 13 pixels for all the datasets. The other three lines show the mean errors for every descriptor in all datasets. All descriptors managed to successfully register raw data with a mean displacement error that was lower than 4 pixels. The ASIFT descriptor gave the best results, as the mean displacement error was lower than 1.5 pixels in all datasets. The larger error was calculated when the SURF descriptor was employed over the Dataset # 3 (3.51 pixels), which depicts an agricultural/rural region and the errors appear mainly on the perimeter of the scene.
In terms of computational performance, the SIFT detector is the fastest one and right after follows the SURF. In all datasets (both agriculture and peri-urban regions) the entire registration process was completed in a few minutes (from 5 min to 8 min) with the SIFT detector, in 10 to 15 min with the SURF detector and it needed up 30 to 90 min when the ASIFT descriptor was employed. In
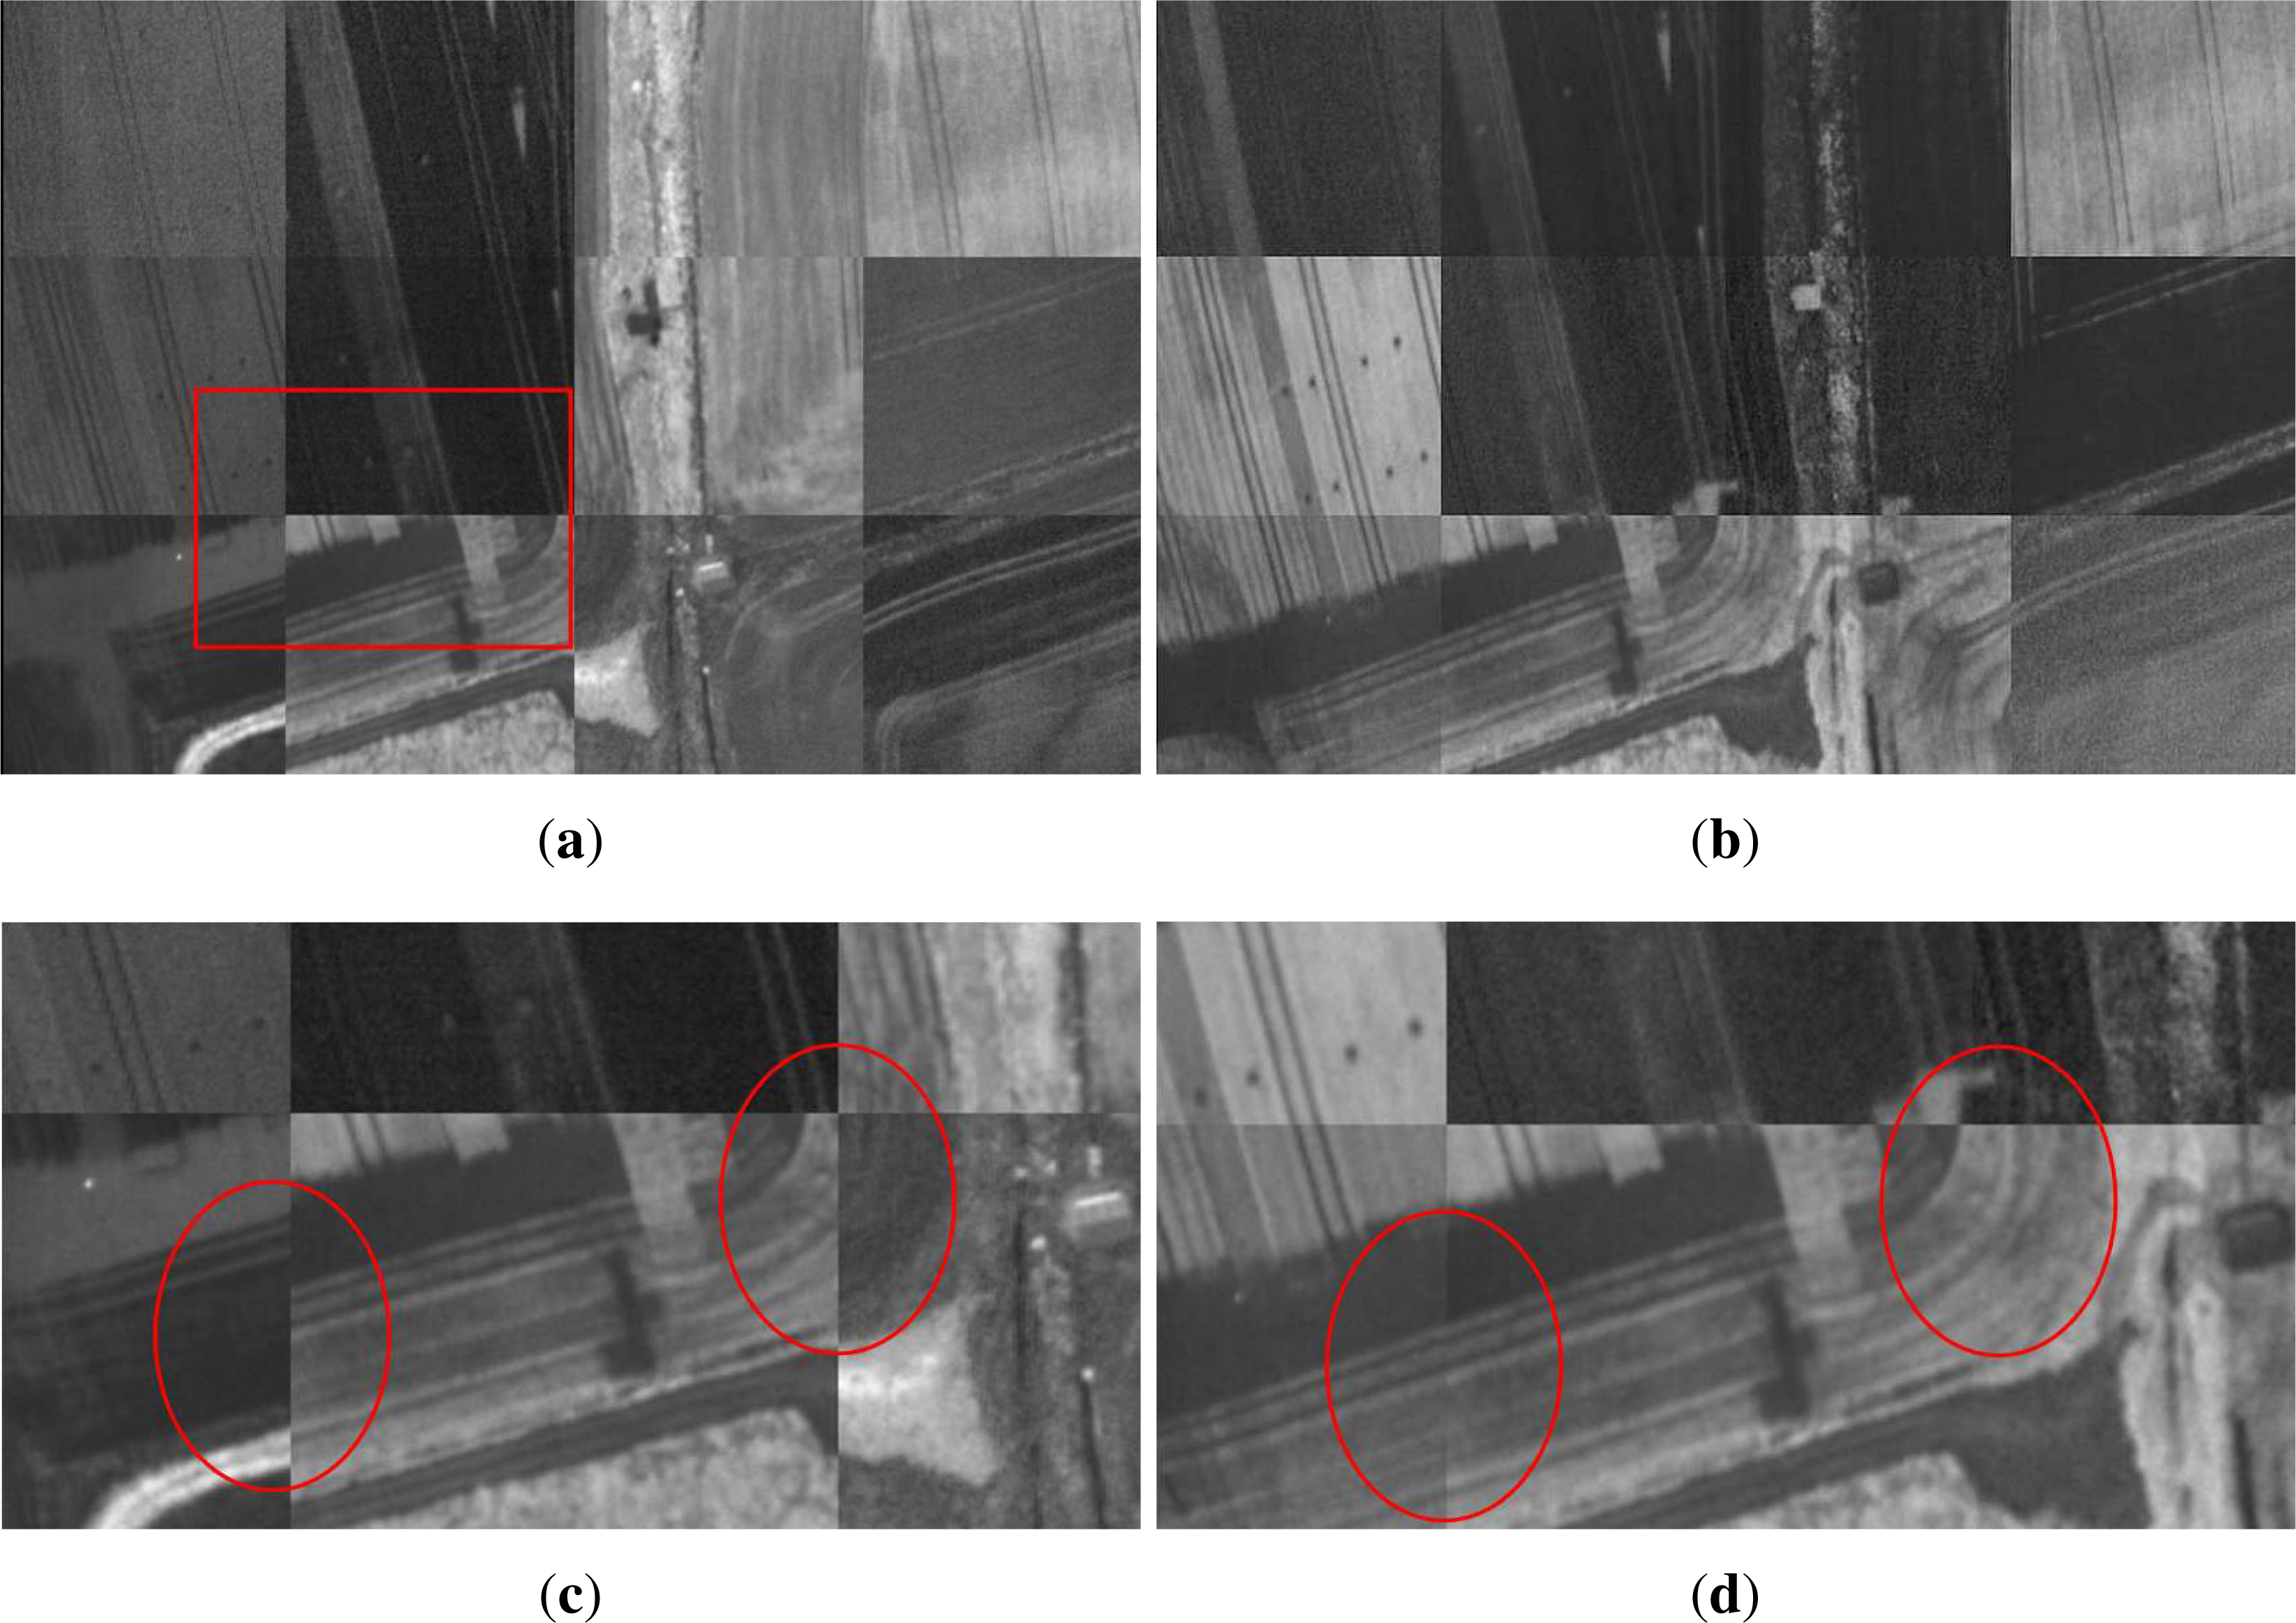
Figures 6 and
8 one can observe the important spatial variability of raw data. By selecting randomly spectral bands from the raw unregistered hypercube and putting them together in different sub-regions a checkerboard image demonstrates, in the left part of each figure’s the initial displacements. Raw unregistered data (e.g., also provided in zoom at lower rows) possess a significant spatial variation with displacements of more than a few pixels. In particular, the initial displacements of raw data are shown in
Table 1 where the errors have been calculated by selecting manually the same discrete points in all spectral bands. The registration errors, presented in
Table 1, serve as a further quantitative evaluation component. They have been computed from the manually denoted points which an expert had designated after a careful photo-interpretation in every spectral band.
More specifically, the second dataset (
Figure 6) which is over an agricultural region had significant initial displacements which are shown in
Figure 6a,c. After the application of the developed algorithm all the spectral bands aligned (
Figure 6b,d) and the quantitative evaluation indicated an overall registration error of 1.25 pixels. The registration procedure, under an unsupervised manner, employed the same spectral band at 550 nm (with 1405 correspondences) for the registration of the first two spectral groups and the spectral bands at 544 nm and 715 nm, with 10 correspondences, for the registration of the first and third group. The algorithm converged after about 30 min using the ASIFT descriptor and less than 15 and 8 min for the SURF and SIFT detectors, respectively.
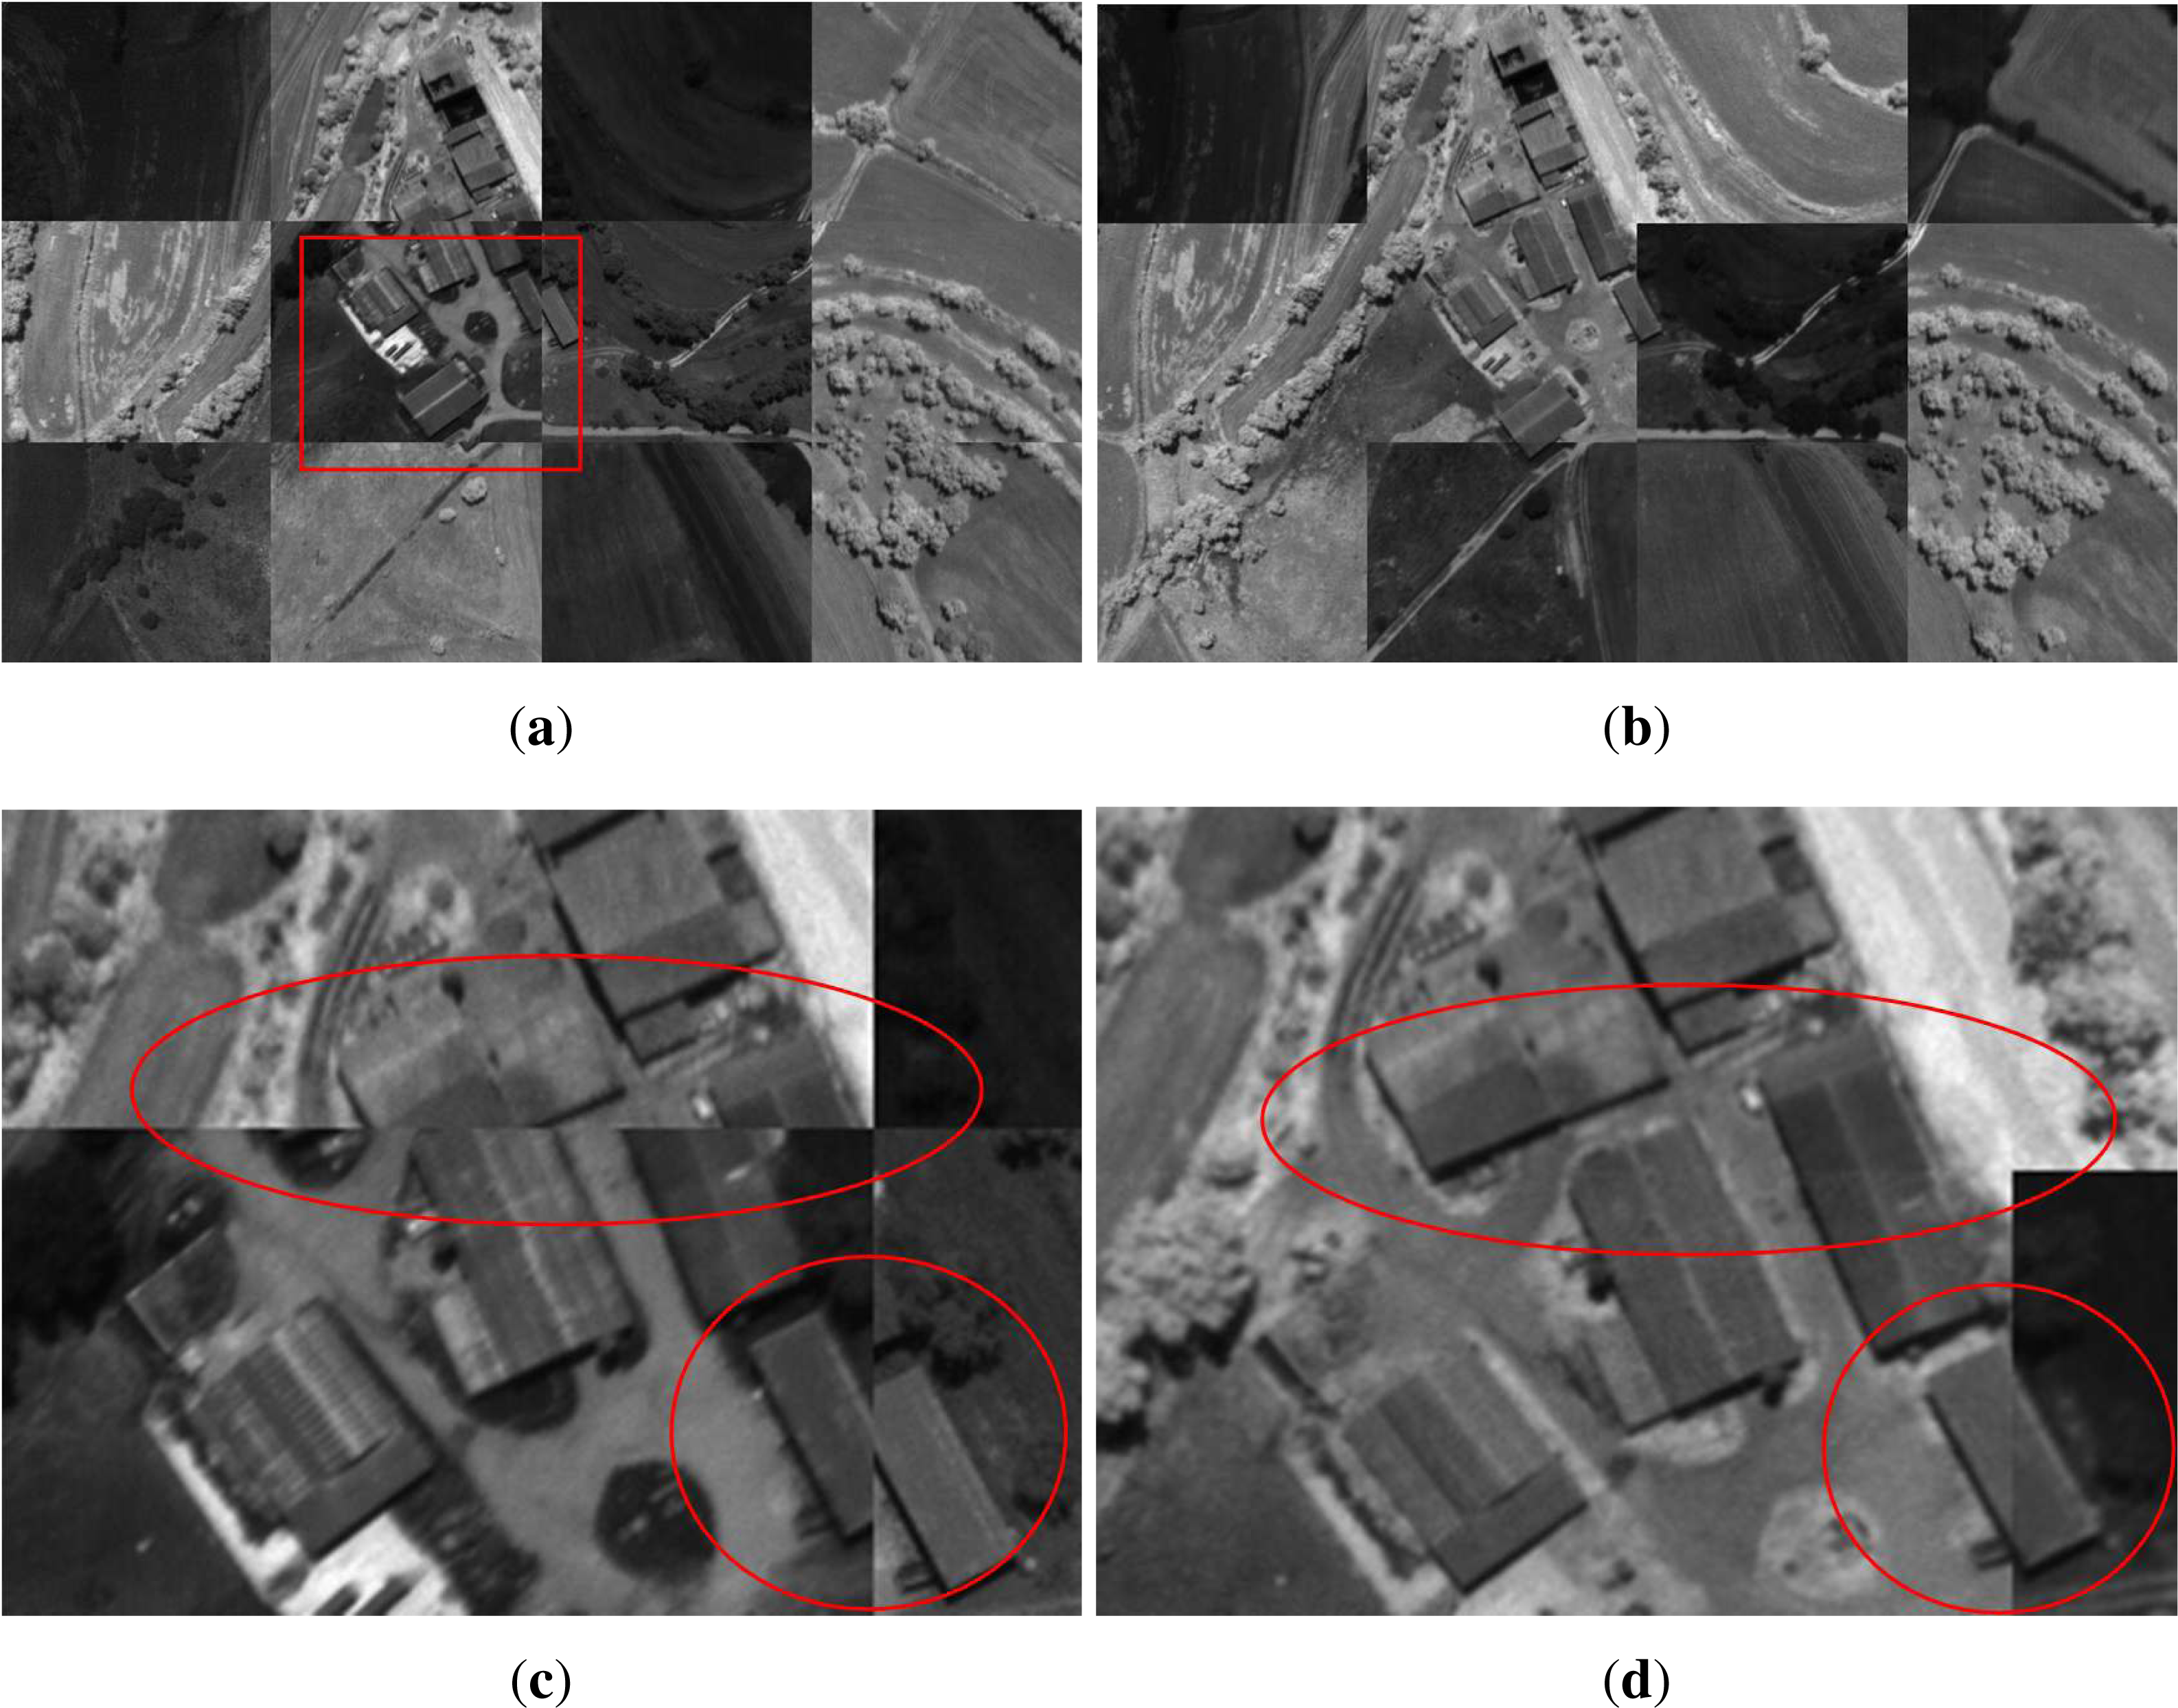
In
Figure 7 the raw and resulting registered hypercubes of Dataset #5 are shown over a peri-urban region. The acquired from a UAV raw data possessed an important spatial and geometric variation in all spectral bands as it can be observed in
Figure 7a,c. The successful application of the developed automated co-registration algorithm managed to recover effectively the geometry of the scene and register all spectral bands successfully (
Figure 7b,d). Quantitative evaluation results indicated a sub-pixel accuracy of 0.66 pixels (
Table 1). Under an unsupervised manner the procedure selected the common spectral band at 559 nm for the registration of the first and second group with 4286 correspondences and bands at 559 nm and 685 nm for the registration of the first and third group (with 2486 correspondences).
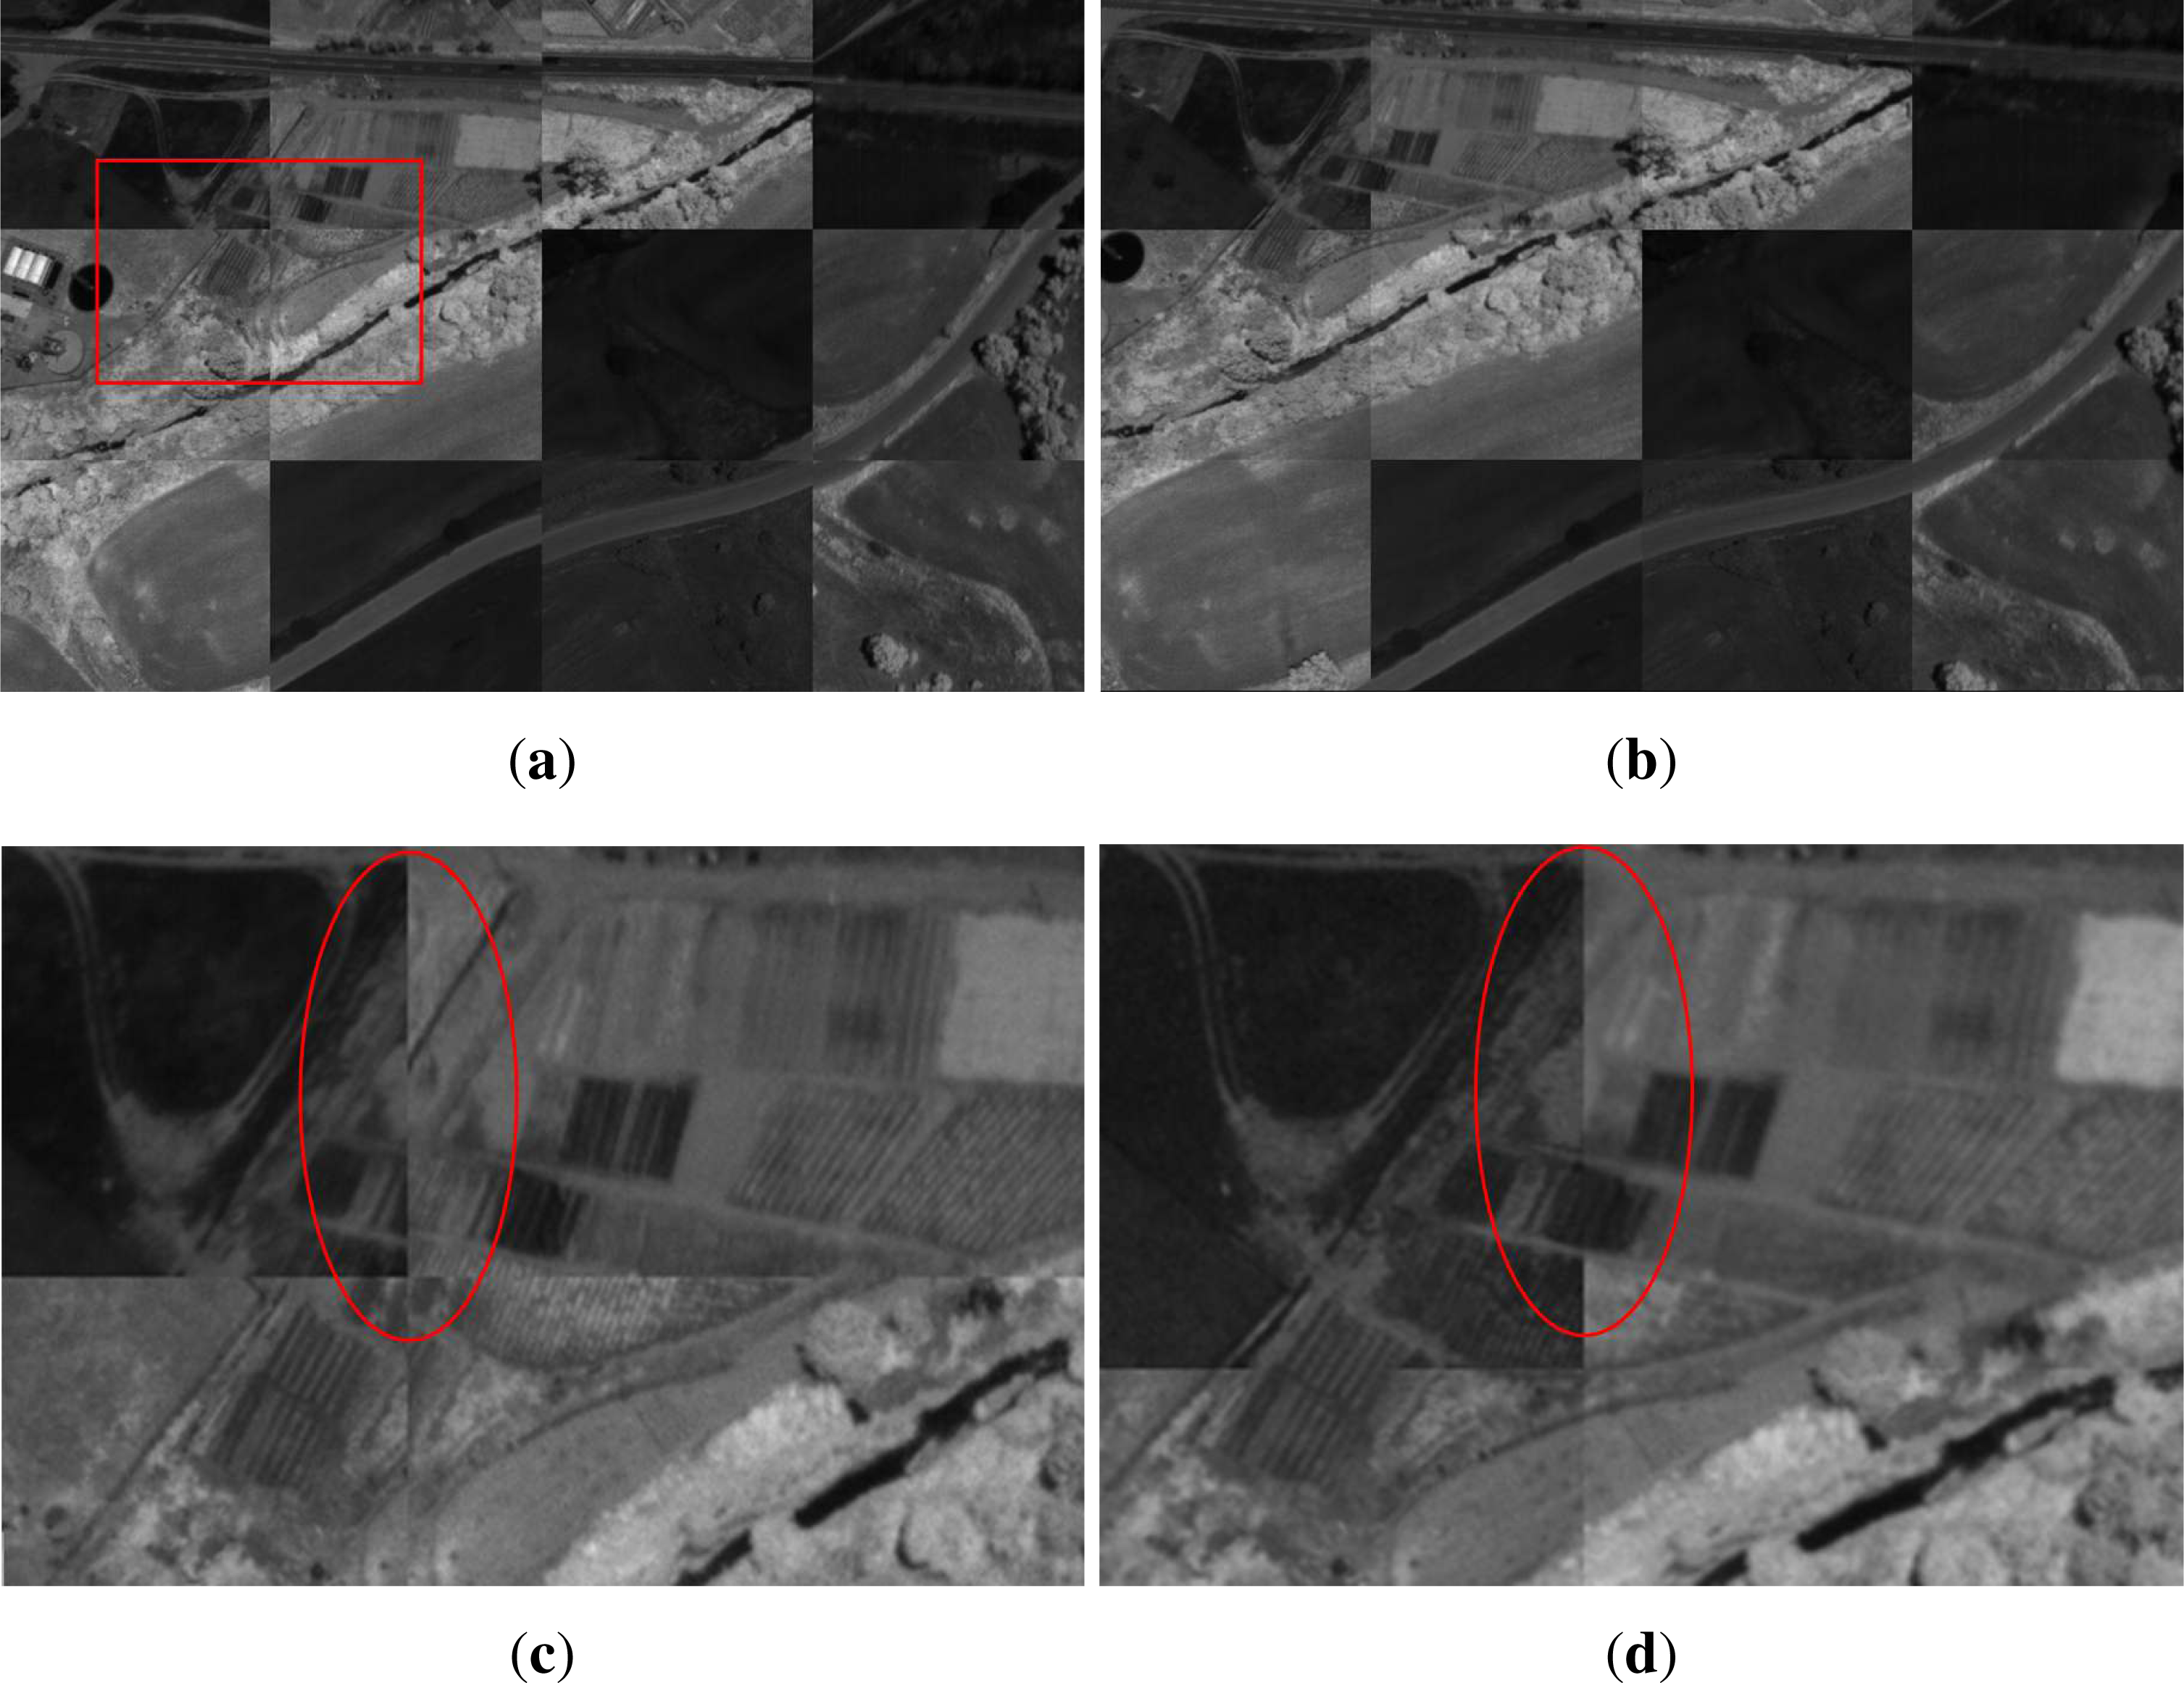
With a sub-pixel accuracy were, also, recovered the raw data from Dataset #6. In
Figure 8a,c one can observe the important initial displacements of over 33 pixels. The developed algorithm managed to register all spectral bands and recover their geometry (
Figure 8b,d). The resulting overall registration error (
Table 1) was 0.35 pixels while the spectral bands at 580 nm and 685 nm were the key ones during the third processing step where 4117 correspondences were calculated for the first and second group and 1583 ones for the first and third group.
4. Conclusions and Future Perspectives
In this paper, an algorithm for the automatic registration of frame hyperspectral data has been developed and evaluated. The algorithm is relatively fast and efficient. It is based on feature descriptors and the decomposition of the problem into three basic processing steps. The operated wavelength is divided in an appropriate number of spectral groups. Then the co-registration of all the spectral bands of each group is performed. In particular, after sorting the spectral bands in terms of spectral variance and proximity to the key changing spectral regions, the appropriate bands are selected for the co-registration inside and in-between the MSGs. We narrow effectively the search space of solutions by selecting in an unsupervised manner the spectral bands which can lead quickly to the solution. Even with much illumination changes, rotation and translation effects, the image descriptors can find enough correspondences and result to an acceptable accuracy. In all experimental results with different descriptors the algorithm rapidly converged with low errors. The ASIFT descriptor resulted into the best spatial accuracy by delivering more inliers but at the same time was the slowest one. On the other hand, the standard SIFT descriptor detected less inliers with relative low errors and lower overall processing time. The SURF descriptor was the more sensitive one to outliers and therefore provided the lower co-registration accuracy. Overall, the algorithm converged in all cases in a few minutes, with the source code written in Matlab®) allowing real-time application and real-time hypercube registration through an optimized C/C++ implementation. In particular, the entire process using the SURF algorithm, was completed in about 10–15 min, using the SIFT descriptor was completed in maximum 8 min. The ASIFT descriptor required much more time i.e., from at least 30 to 90 min, depending on the number of the detected inliers. The developed algorithm has been evaluated both qualitatively and quantitative over different datasets, both in rural, agricultural and peri-urban areas. In particular, in agricultural areas errors were larger since in contrast to the structured ones, their smooth structure and texture produce a limited number of correspondences. The experimental results and their validation appear promising. Even with significant spectral variation and important rotation and translation effects, the methodology can deliver enough inliers with adequate accuracy.


