Water Feature Extraction and Change Detection Using Multitemporal Landsat Imagery


Abstract
: Lake Urmia is the 20th largest lake and the second largest hyper saline lake (before September 2010) in the world. It is also the largest inland body of salt water in the Middle East. Nevertheless, the lake has been in a critical situation in recent years due to decreasing surface water and increasing salinity. This study modeled the spatiotemporal changes of Lake Urmia in the period 2000–2013 using the multi-temporal Landsat 5-TM, 7-ETM+ and 8-OLI images. In doing so, the applicability of different satellite-derived indexes including Normalized Difference Water Index (NDWI), Modified NDWI (MNDWI), Normalized Difference Moisture Index (NDMI), Water Ratio Index (WRI), Normalized Difference Vegetation Index (NDVI), and Automated Water Extraction Index (AWEI) were investigated for the extraction of surface water from Landsat data. Overall, the NDWI was found superior to other indexes and hence it was used to model the spatiotemporal changes of the lake. In addition, a new approach based on Principal Components of multi-temporal NDWI (NDWI-PCs) was proposed and evaluated for surface water change detection. The results indicate an intense decreasing trend in Lake Urmia surface area in the period 2000–2013, especially between 2010 and 2013 when the lake lost about one third of its surface area compared to the year 2000. The results illustrate the effectiveness of the NDWI-PCs approach for surface water change detection, especially in detecting the changes between two and three different times, simultaneously.1. Introduction
Monitoring of changes using remote sensing technology is widely used in different applications, such as land use/cover change [1,2], disaster monitoring [3,4], forest and vegetation change [5,6], urban sprawl [7,8], and hydrology [9,10]. Surface water is one of the irreplaceable strategic resources for human survival and social development [11]. It is essential for humans, food crops, and ecosystems [12]. Reliable information about the spatial distribution of open surface water is critically important in various scientific disciplines, such as the assessment of present and future water resources, climate models, agriculture suitability, river dynamics, wetland inventory, watershed analysis, surface water survey and management, flood mapping, and environment monitoring [13–16]. Remote sensing satellites at different spatial, spectral, and temporal resolutions provide an enormous amount of data that have become primary sources, being extensively used for detecting and extracting surface water and its changes in recent decades [17–23].
Several image processing techniques have been introduced in recent decades for the extraction of water features from satellite data. Single-band methods utilize a selected threshold value to extract water features. In this type, errors are common because of mixing of water pixels with those of different cover types [15]. Classification techniques adopted to extract surface water are normally more accurate compared with single-band methods [15]. Multi-band methods combine different reflective bands for improved surface water extraction [15]. For instance, the Normalized Difference Water Index (NDWI) was developed for the extraction of water features from Landsat imagery [24]. Since water features extracted using the NDWI include false positives from built-up land, a modified NDWI (MNDWI) was developed in which the middle infrared (MIR) band was replaced with the near infrared (NIR) band [18]. The MNDWI extracts surface water while suppressing errors from built-up land as well as vegetation and soil [18]. Surface water change detection is usually conducted by extracting water features individually from the multi-date satellite images, before making comparisons to detect their changes [15,19,20,25–28].
In this study, the surface area changes of Lake Urmia, Iran in the period 2000–2013 were investigated. Lake Urmia, with an area varying from 5200–6000 km2 in the 20th century, is the 20th largest lake and the second largest hyper saline lake (before September 2010) in the world. It is also the largest inland body of salt water in the Middle East [29]. The lake is the habitat for a unique bisexual Artemia (a species of brine shrimp), and becomes a host for more than 20,000 pairs of Flamingo and about 200–500 pairs of White Pelican every winter [30,31]. Lake Urmia forms a rare and important ecologic, economic and geo-tourism zone and was recognized as a Biosphere Reserve by United Nations Educational, Scientific and Cultural Organization (UNESCO) in 1975. In addition, the lake helps moderate the temperature and humidity of the region, providing a suitable place for agricultural activities [31]. The lake is currently in a critical situation as a consequence of decreasing surface water area and increasing salinity. To facilitate expanding agricultural activities 35 dams have been constructed on 21 rivers flowing to the lake [29]. These dams, the exploitation of ground water and increased water demand for industrial and domestic uses, being intensified by a long period of drought, have been the major factors contributing to the shrinkage of the lake surface area [31]. It is vital to monitor decline of the lake surface area as regular monitoring can provide the basis for understanding the human influence on the lake so as to more effectively manage it.
This study aimed to model the spatiotemporal changes of Lake Urmia in the period 2010–2013 using multi-temporal Landsat ETM+, TM, and OLI data. Different surface water extraction techniques were initially examined and the most suitable technique was used to detect and map the spatiotemporal changes of the lake. In addition, a novel surface water change detection approach, based on Principal Components of multi-temporal Normalized Difference Water Index (NDWI-PCs), was developed and evaluated.
2. Materials and Methods
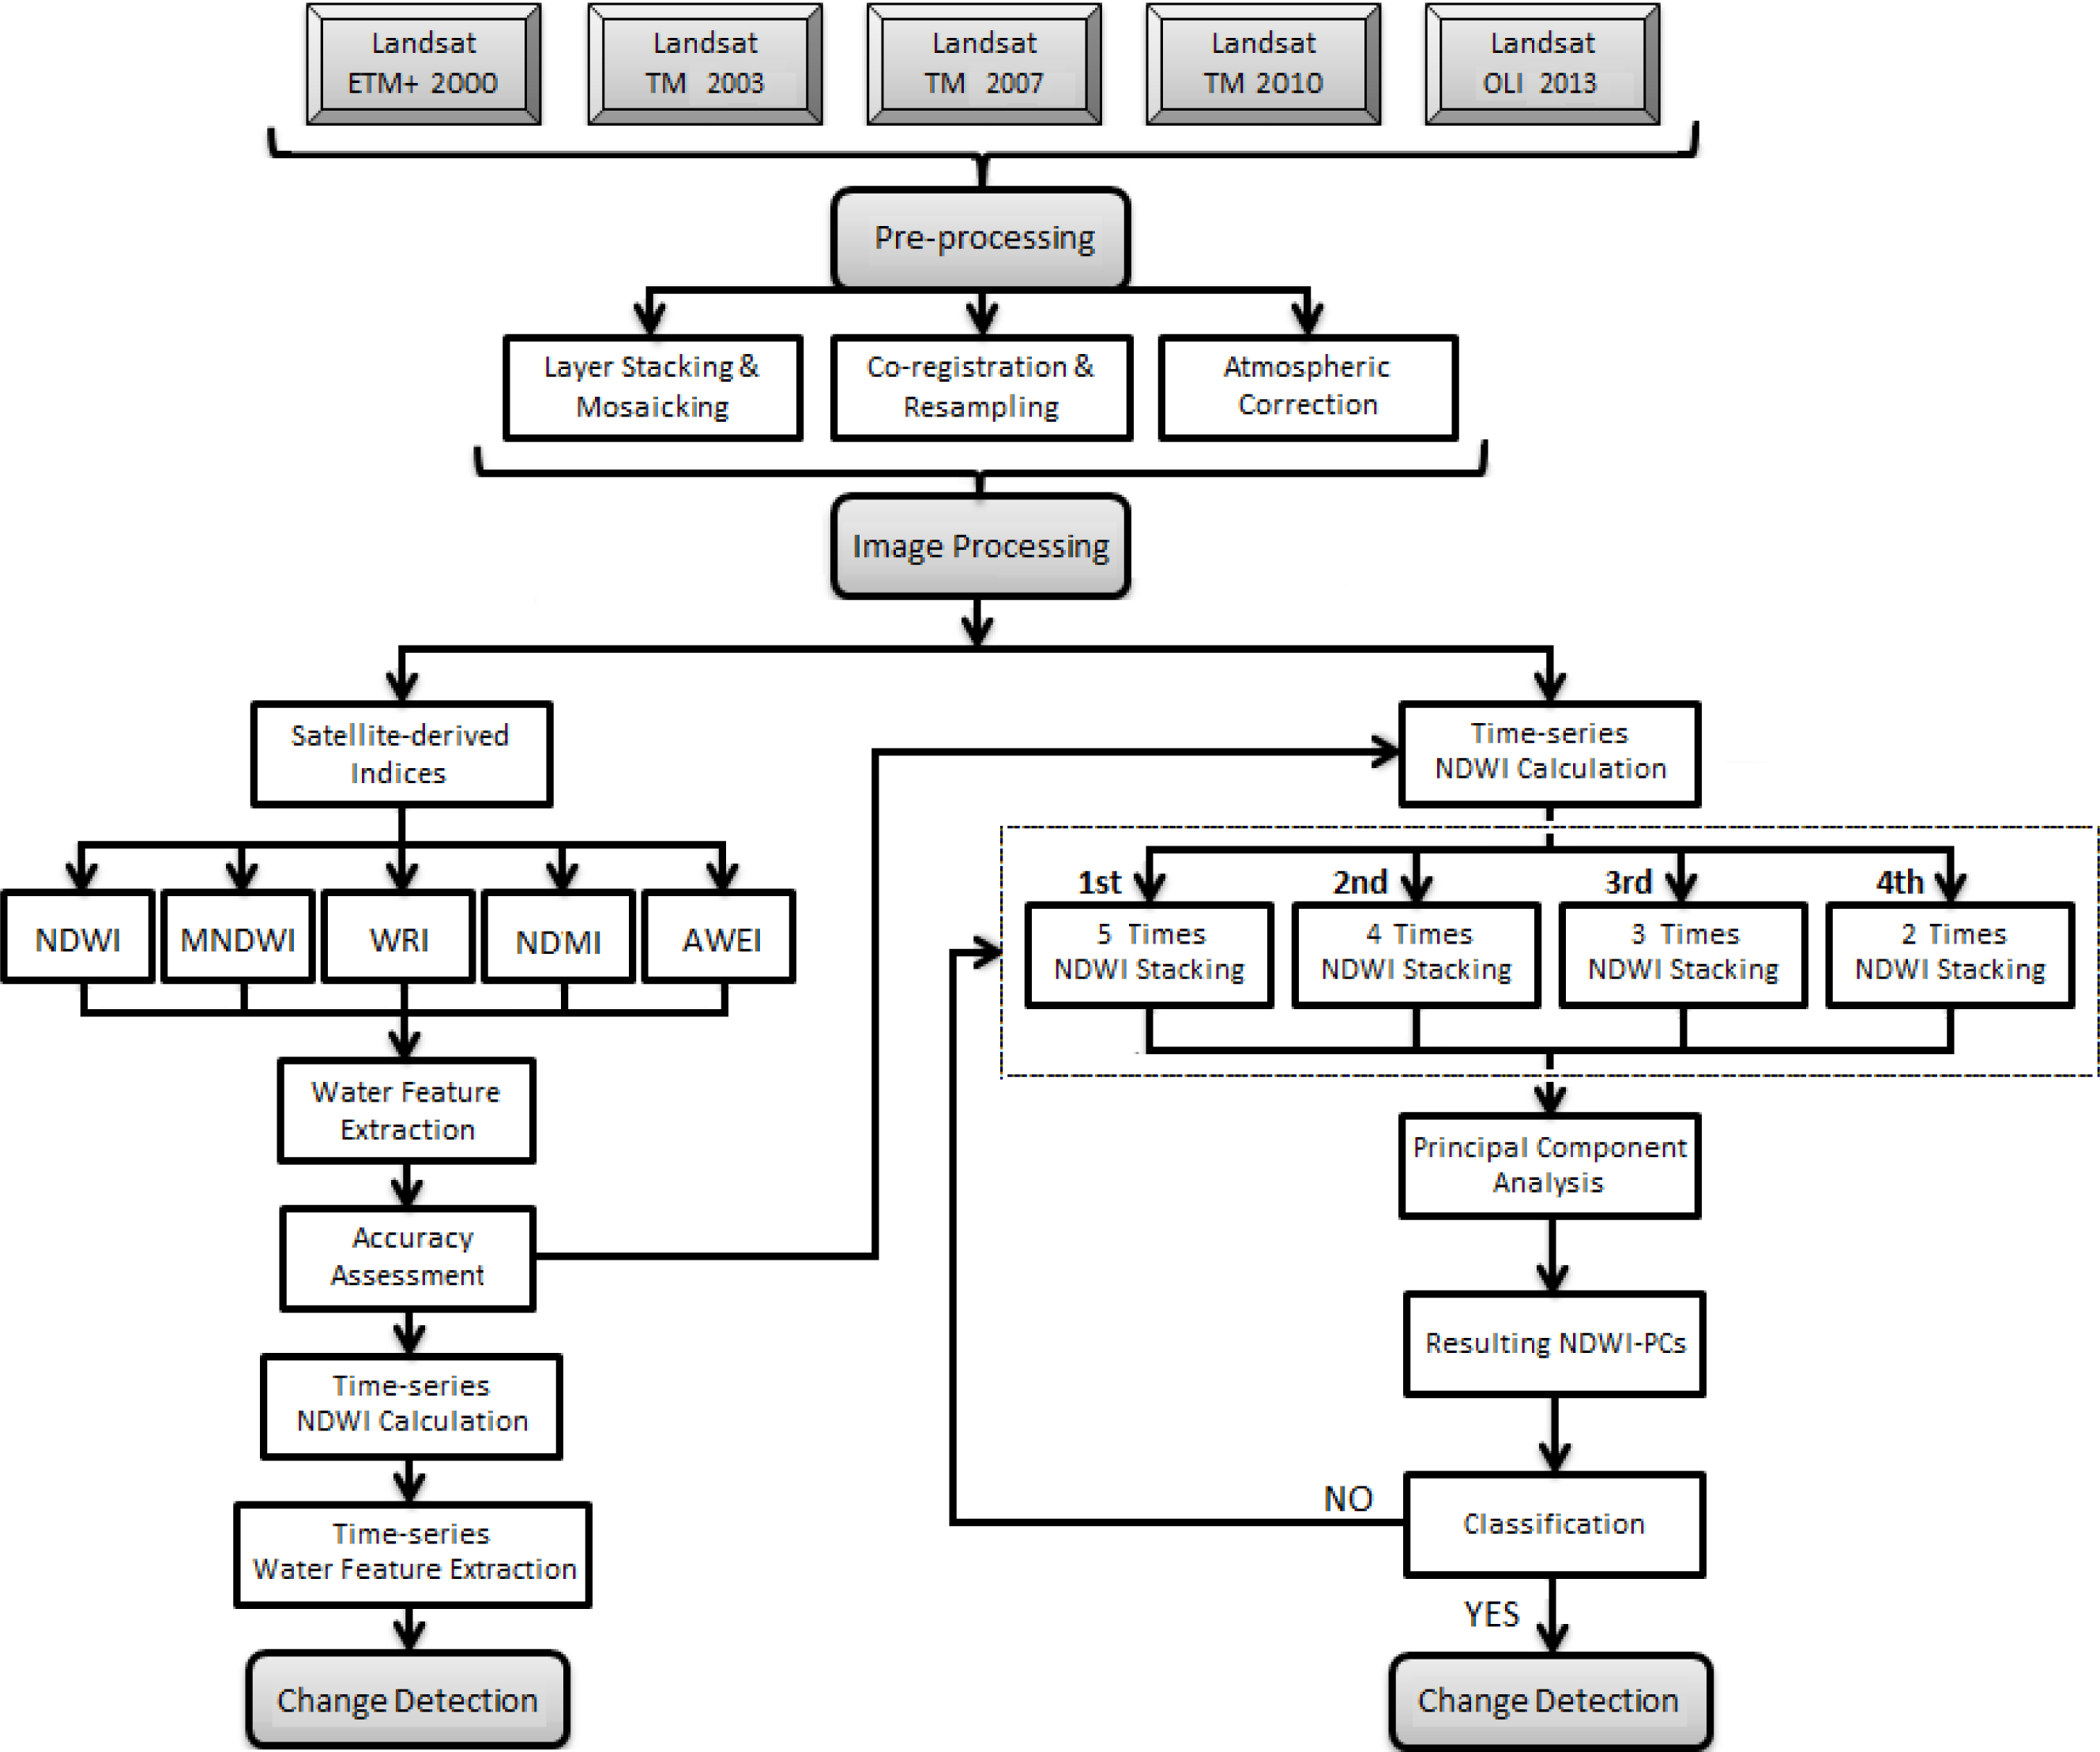
In order to achieve the aims of the study, the following tasks were performed: study area definition, data collection, image pre-processing, comparison of different satellite-derived indexes for surface water detection, extraction of the lake surface area in each image, developing the NDWI-PCs approach, and change detection and modeling. Figure 1 shows the overall methods adopted in this study to detect the lake surface area changes.
2.1. Study Area
Lake Urmia (Urumiyeh in Persian), bound by 37°03′N to 38°17′N and 44°59′E to 45°59′E, has a maximum depth of 16 m and is about 140 km long and 40–55 km wide [29]. The lake is a shallow and saline lake that is located in the northwest of Iran. Lake Urmia has a total catchment area of approximately 51,876 km2 that is about 3.2% of the size of Iran, and it represents about 7% of the country’s surface water [30]. The maximum surface area of the lake has been estimated to be about 6100 km2, but since 1995, it has been constantly declining and reached 2366 km2 in August of 2011 [32]. About 60 rivers (permanent and episodic) are found in the catchment area of the lake all of which flow through agricultural, industrial and urban areas normally without waste water treatment [30,33]. The climate of the lake basin is characterized by cold winters and relatively temperate summers, being influenced by the mountains surrounding the lake [33].
2.2. Data Set
Three scenes of Landsat-7 ETM+ data acquired in August 2000, two scenes of Landsat-5 TM data acquired in September 2003, three scenes of Landsat-5 TM data acquired in September 2007, three scenes of Landsat-5 TM data acquired in July 2010, and one scene of Landsat-8 OLI image acquired in August 2013 were obtained from the US Geological Survey (USGS) Global Visualization Viewer. All the images are obtained for the same season (summer). The obtained Landsat data (Level 1 Terrain Corrected (L1T) product) were pre-georeferenced to UTM zone 38 North projection using WGS-84 datum. The other necessary corrections were performed in this study. Table 1 presents the specifications of Landsat TM, ETM+ and OLI images.
2.3. Image Pre-Processing
To prepare the input satellite images for further processing, the following pre-processing steps were performed: radiometric calibration, atmospheric correction, mosaicking, co-registration, and resampling. Radiometric calibration and atmospheric correction were conducted according to [34]. In doing so, the obtained images were converted to at-satellite radiance using the Landsat calibration tool in ENVI 4.8. After conversion to at-satellite radiance, each image was converted to at-satellite reflectance. The required information including the Data Acquisition Date and Sun Elevation was obtained from the Landsat header files. At last, the Dark Object Subtraction (DOS) method [35], was employed to convert at-satellite reflectance to surface reflectance for full absolute correction.
Subsequently, the images of each year were mosaicked to generate new images covering the entire study area. For this purpose, the mosaicking tool based on georeferenced images was used. For co-registration of the multi-temporal images, one of the images was used as the reference to register the other images. The input images were co-registered with a Root Mean Square Error (RMSE) of less than 0.5 pixels using the manual image to image co-registration method. Around 25 control points were selected for co-registration of each image with the reference image. Finally, the dataset were resampled to the same size of the study area using the Nearest Neighbor method.
2.4. Comparison of Different Feature Extraction Techniques for Surface Water Extraction
In order to detect the surface area changes of Lake Urmia in the period 2000–2013, the water surface of the lake in each temporal image was extracted individually. In doing so, the performances of different satellite-derived indexes including Normalized Difference Water Index (NDWI) [24], Normalized Difference Moisture Index (NDMI) [36], Modified Normalized Difference Water Index (MNDWI) [18], Water Ratio Index (WRI) [37], Normalized Difference Vegetation Index (NDVI) [38], and Automated Water Extraction Index (AWEI) [39] were examined for the extraction of surface water from Landsat data (Table 2).
In this respect, the NDWI, NDMI, MNDWI, WRI, NDVI, and AWEI indexes were calculated from Landsat ETM+ 2000 and TM 2010 images (as a sample) to evaluate their performances for the extraction of surface water. A land-water threshold was manually applied to classify the images into two classes, land and water. Suitable land-water thresholds for each index were determined through trial and error and comparison to reference maps generated using visual interpretation. For visual interpretation of water bodies, the near-infrared (NIR) band is usually preferred, because NIR is strongly absorbed by water and is strongly reflected by the terrestrial vegetation and dry soil [16]. Thus, band 4 of Landsat data was selected in this study due to its higher ability to discriminate water and dry/land areas. The reference maps were generated utilizing careful on-screen digitizing of the lake surface area in multi-temporal Landsat ETM+ 2000 and TM 2010 images (band 4) using visual interpretation.
2.5. Surface Water Change Detection Using the Most Suitable Water Feature Extraction Technique
The feature extraction technique, identified as the best option for water features extraction, was employed to model the spatiotemporal changes of Lake Urmia in the period 2000–2013 using the multi-temporal Landsat ETM+ 2000, TM 2003, TM 2007, TM 2010, and OLI 2013 images. To achieve this, the selected index was calculated, analyzed and classified independently (using image-specific thresholds) to extract the lake surface area in each year. Finally, the generated maps were overlaid to produce the lake surface area changes map in the period 2000–2013.
2.6. Developing a New Approach for Surface Water Change Detection (NDWI-PCs)
As manual thresholding of several images is time consuming, a novel surface water change detection approach was developed and tested for detection of the lake surface area changes between five, four, three, and two different times, respectively. The proposed approach is based on Principal Components of multi-temporal NDWI (NDWI-PCs). A change detection method, based on Principal Components of multi-temporal NDMI (also known as NDWIGao [40]), was suggested by [41] for forest fire detection (NDMI-PCs). In the present study, the suitability of the NDMI-PCs was tested for detection of Lake Urmia surface area changes, but this method was found inappropriate for surface water change detection. Further investigation showed that the NDMI used in this method is not suitable for the extraction of surface water from Landsat data (see Table 3). Therefore, the performance of different satellite-derived indexes including NDWI, MNDWI, WRI, NDVI, and AWEI was examined for the extraction of surface water from Landsat data. The accuracy assessment analyses indicated superiority and higher performance of the NDWI compared with other indexes used for this purpose. Accordingly, the NDMI-PCs method was reformulated for surface water change detection through substituting the NDMI by the NDWI.
To perform the new NDWI-PCs approach, the NDWI was calculated from the multi-temporal Landsat data. Subsequently, the obtained NDWI images were stacked into one composite file. The Principal Component Analysis (PCA) technique was then performed to transform the composite image into a new PCA space. Finally, the resulting Principal Components of multi-temporal NDWI (NDWI-PCs) were classified and analyzed for detection of the lake surface area changes. The thresholding technique, based on the trial and error method, was manually applied to classify the resulting PCs to detect the changes. The proposed approach was evaluated for detection of the lake water surface changes between five, four, three, and two different times, respectively.
In order to evaluate the effectiveness of the proposed approach for surface water change detection, different accuracy assessment analyses were performed. The performance of different methods to detect the lake surface area changes between 2000 and 2010 was first evaluated through calculation of the Absolute Error, as the difference between the changed areas detected using the applied method and the reference. In this respect, the lake surface area changes between 2000 and 2010 was calculated using each method and then the Absolute Error was calculated based on the reference change result. In addition, the Overall Accuracy, Kappa Coefficient, and Producer’s and User’s Accuracies (for change pixels) were calculated to support the accuracy assessment analysis.
3. Results
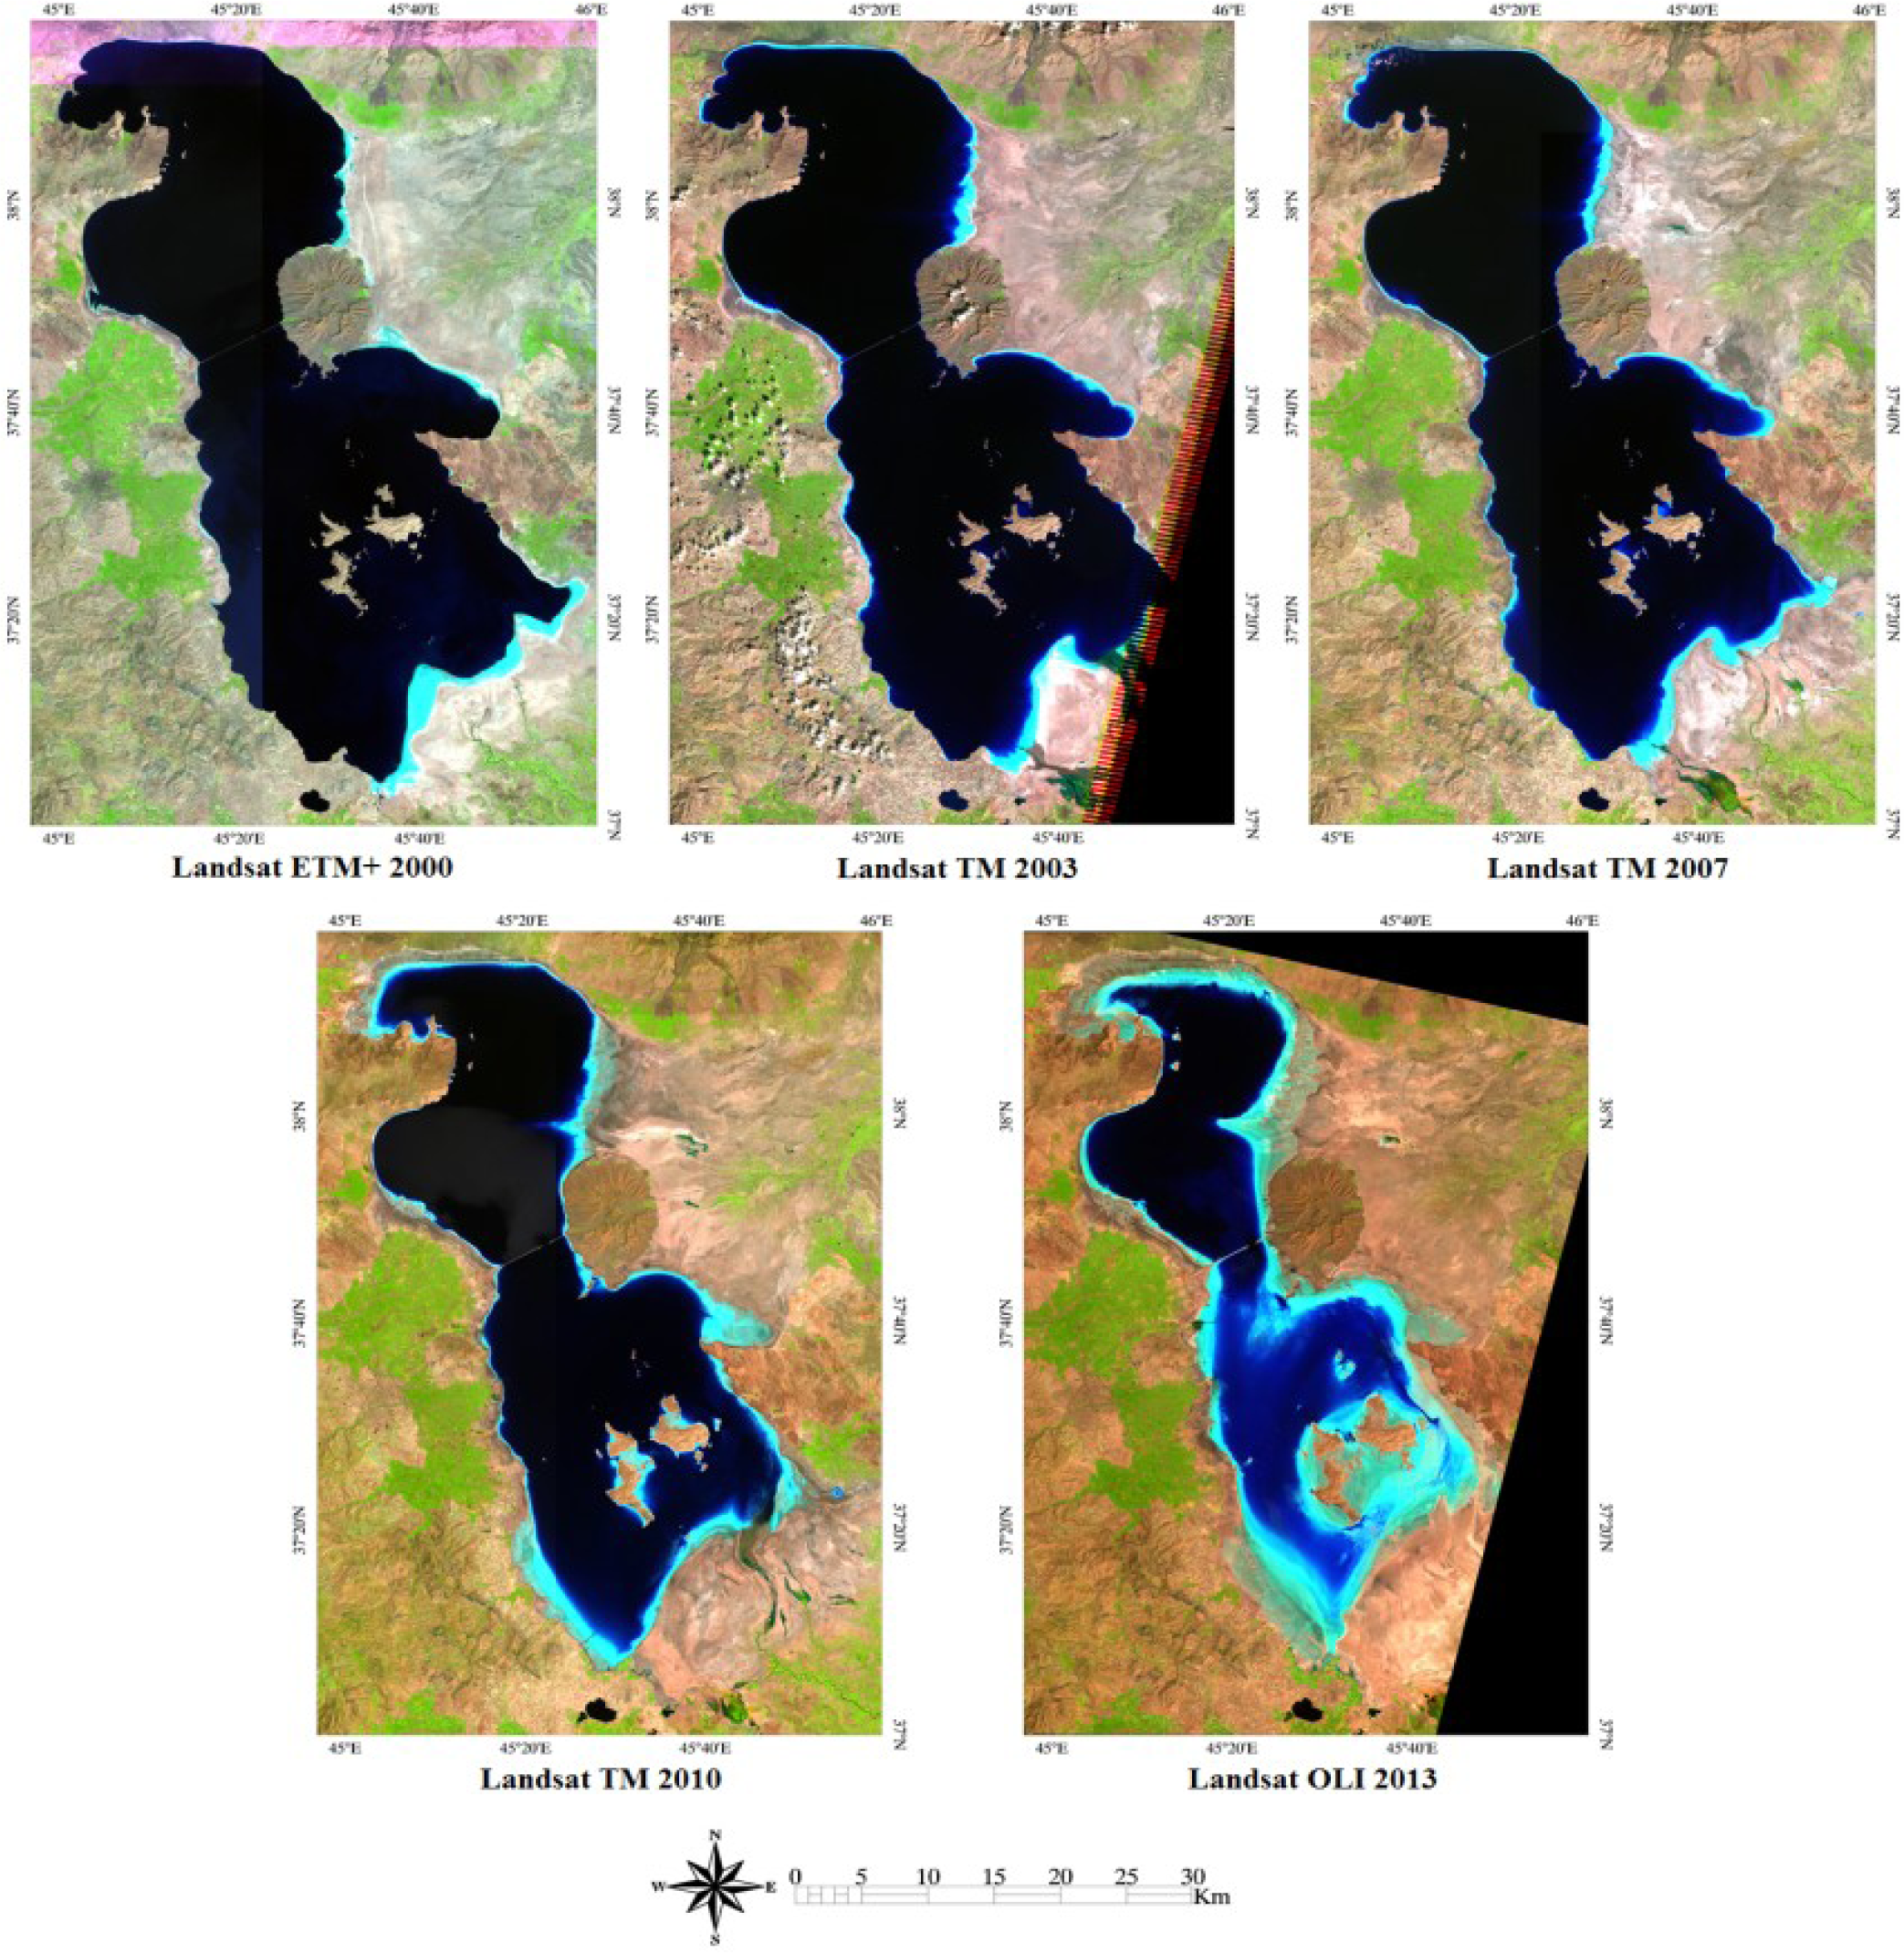
Once the required satellite data were obtained, the image pre-processing techniques were performed to prepare the images for further processing. The dataset after pre-processing are shown in Figure 2. One image for the year 2003 was unavailable in USGS to cover entire the lake in this year. However, the missed area is too small compared with the total surface area of the lake and we tried to reduce the error by adding the missed area to the calculated area of the lake through a simple interpolation.
3.1. Surface Water Change Detection Using the Most Suitable Technique
Different satellite-derived indexes including NDWI, NDMI, MNDWI, WRI, NDVI, and AWEI were examined for the extraction of surface water from the Landsat ETM+ 2000 and TM 2010 data. The Absolute Error, Overall Accuracy and Kappa Coefficient were calculated to assess the accuracy of the results. The lake surface areas in 2000 and 2010 estimated using the selected image-specific thresholds are presented in Table 3. The accuracy assessment analyses are shown in Table 4.
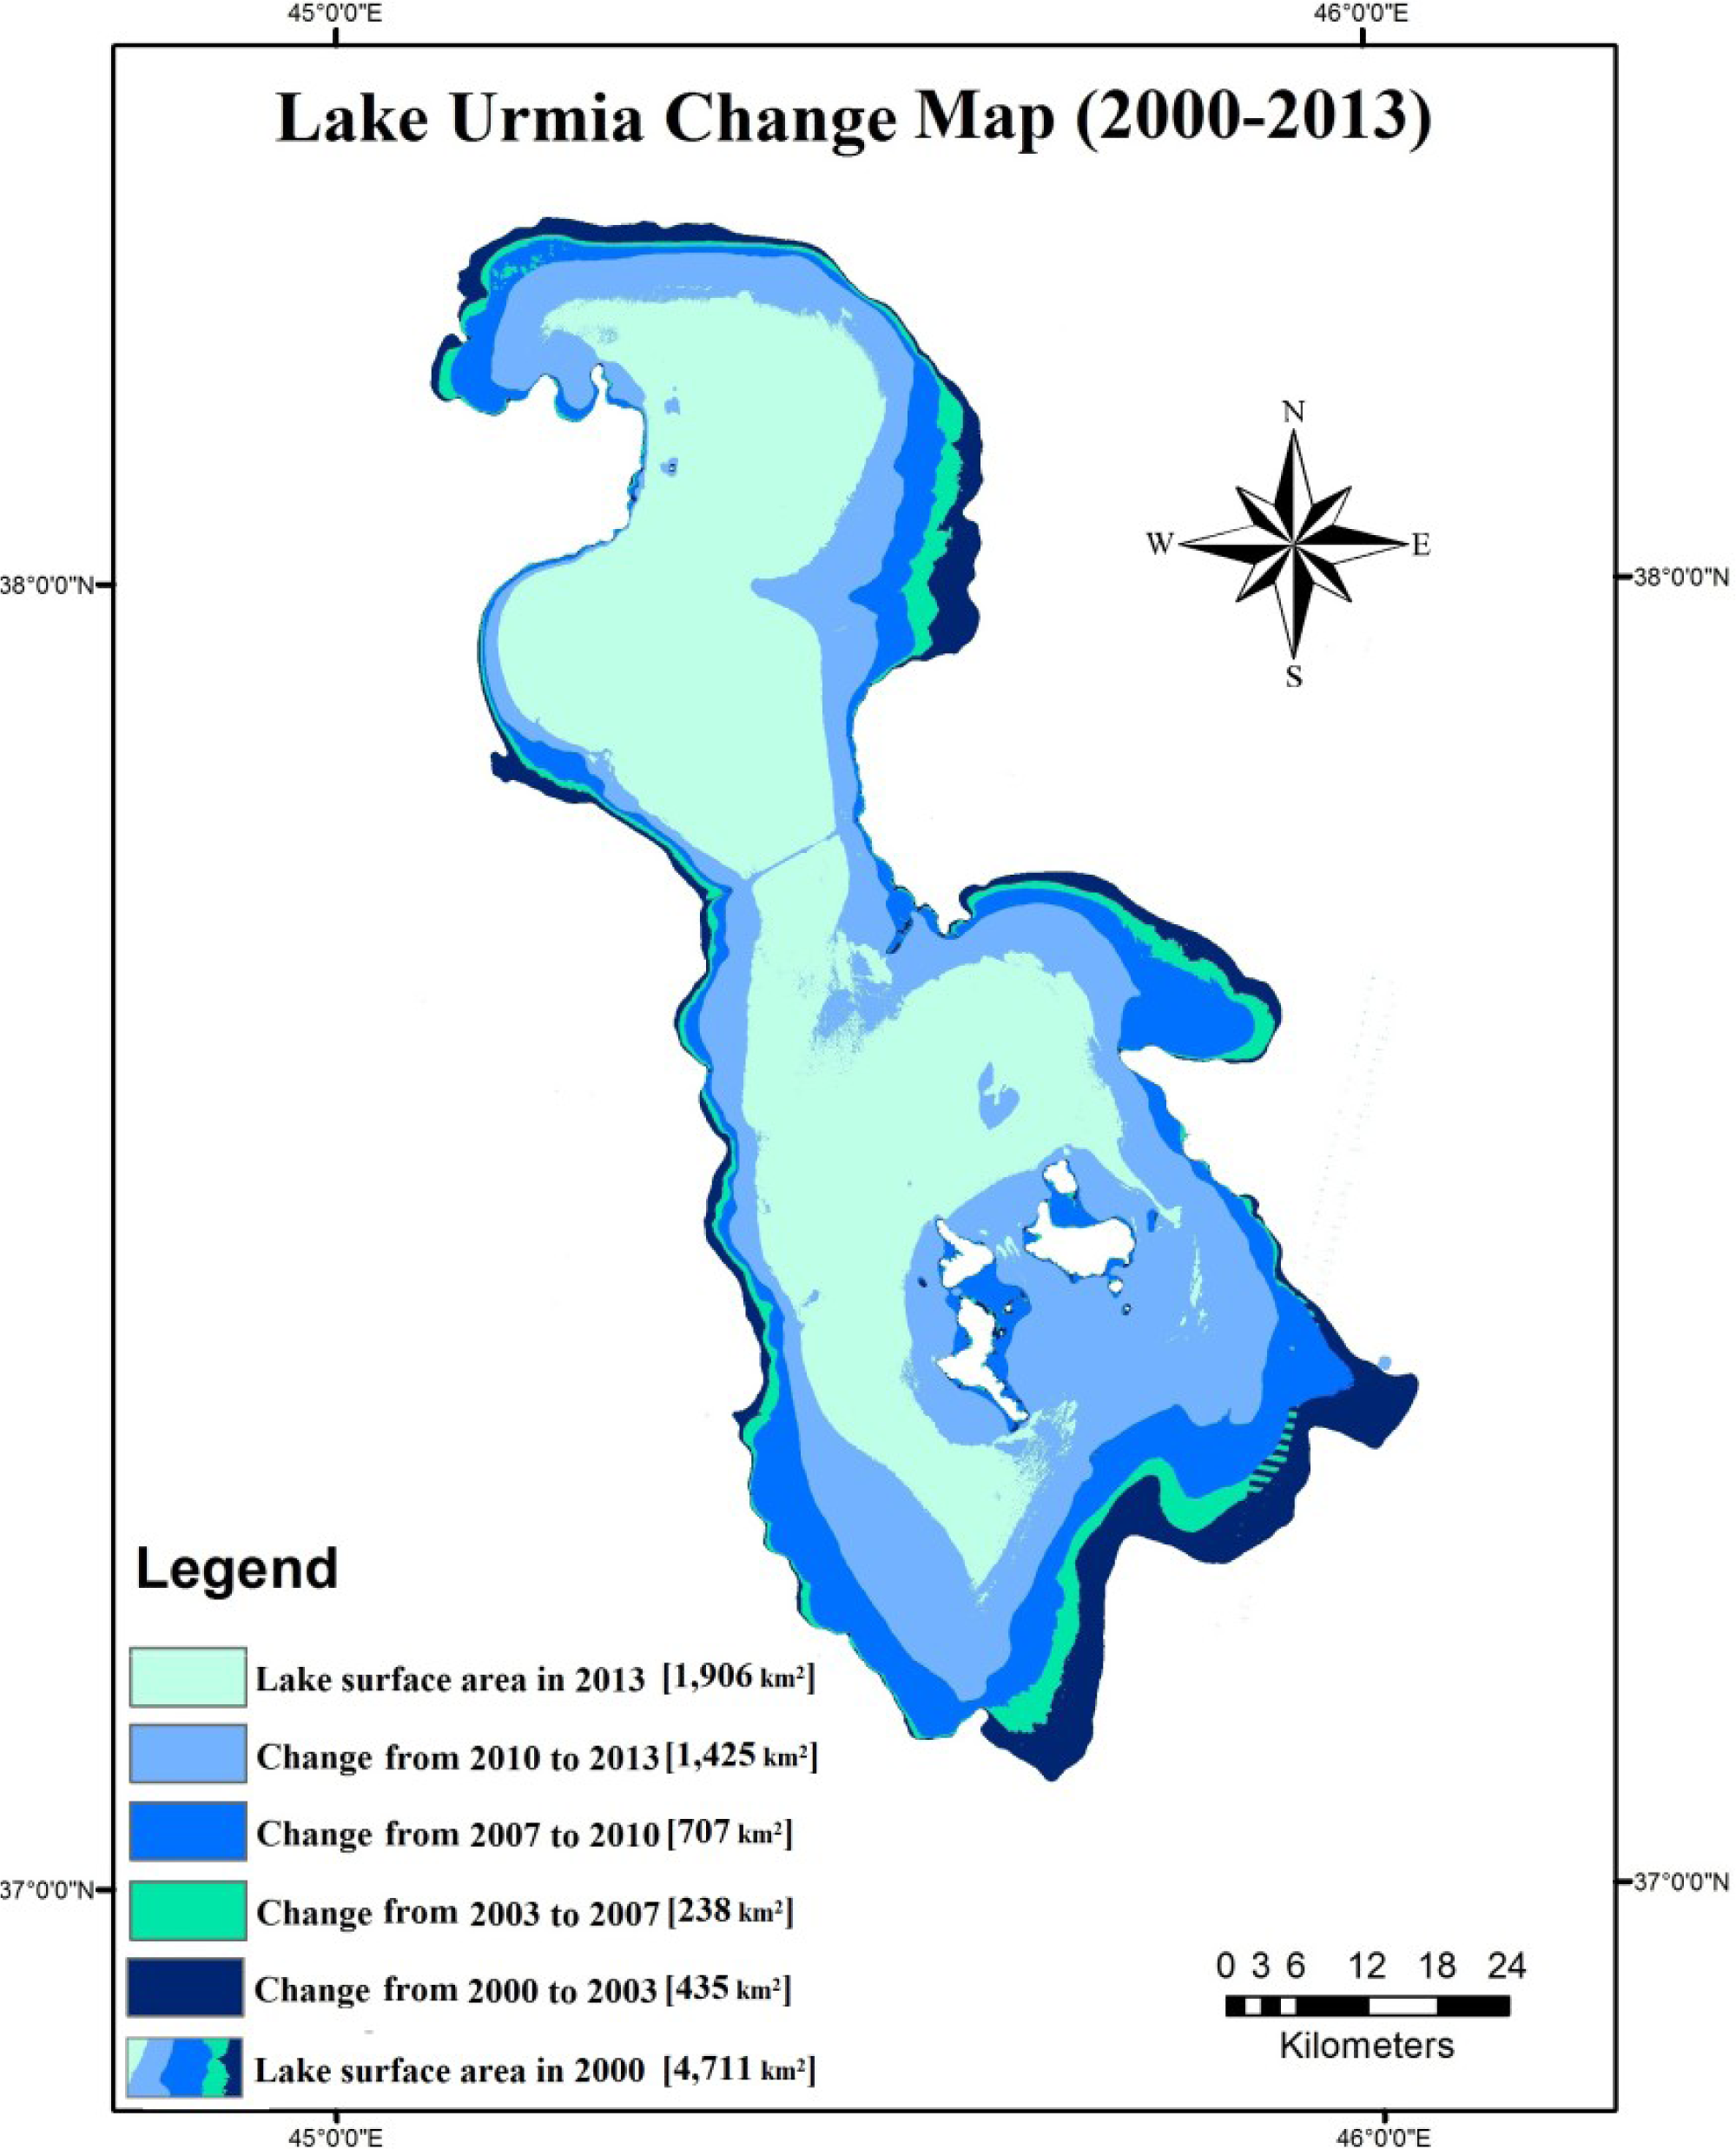
The results show that the NDMI was incapable of extracting the water surface of Lake Urmia, while the NDWI and NDVI provided the highest accuracy results. It seems the errors in the results are mainly omission/commission of water pixels around the edges of the lake. The results further indicate the superiority and higher performance of the NDWI as compared with other indexes for the extraction of surface water from Landsat data. Accordingly, the NDWI was used to model the spatiotemporal changes of Lake Urmia in the period 2000–2013. For this purpose, the NDWI was calculated from the multi-temporal Landsat 2000, 2003, 2007, 2010, and 2013 images. The lake surface area in each year was extracted through the classification of the NDWI images using image-specific thresholds. Finally, the multi-temporal lake surface area maps were overlaid to produce the lake surface area changes map in the period 2000–2013 (Figure 3).
The statistical results, summarized in Table 5, reveal that the lake surface area was about 4711 km2 in 2000, 4276 km2 in 2003, 4038 km2 in 2007, 3331 km2 in 2010, and 1906 km2 in 2013. The results further show that the lake surface area changes were about 435 km2 between 2000 and 2003, 238 km2 between 2003 and 2007, 707 km2 between 2007 and 2010, and 1425 km2 between 2010 and 2013, while the total surface area changes of the lake between 2000 and 2013 were about 2805 km2. The results indicate an intense decreasing trend in Lake Urmia surface area in the period 2000–2013. The most intense changes occurred between 2010 and 2013, within which period the lake lost about one third of its surface area compared to the year 2000 and half of its surface area compared to the year 2010. The maximal changes are observed around the southern and eastern parts of the lake.
3.2. Surface Water Change Detection Using the New NDWI-PCs Approach
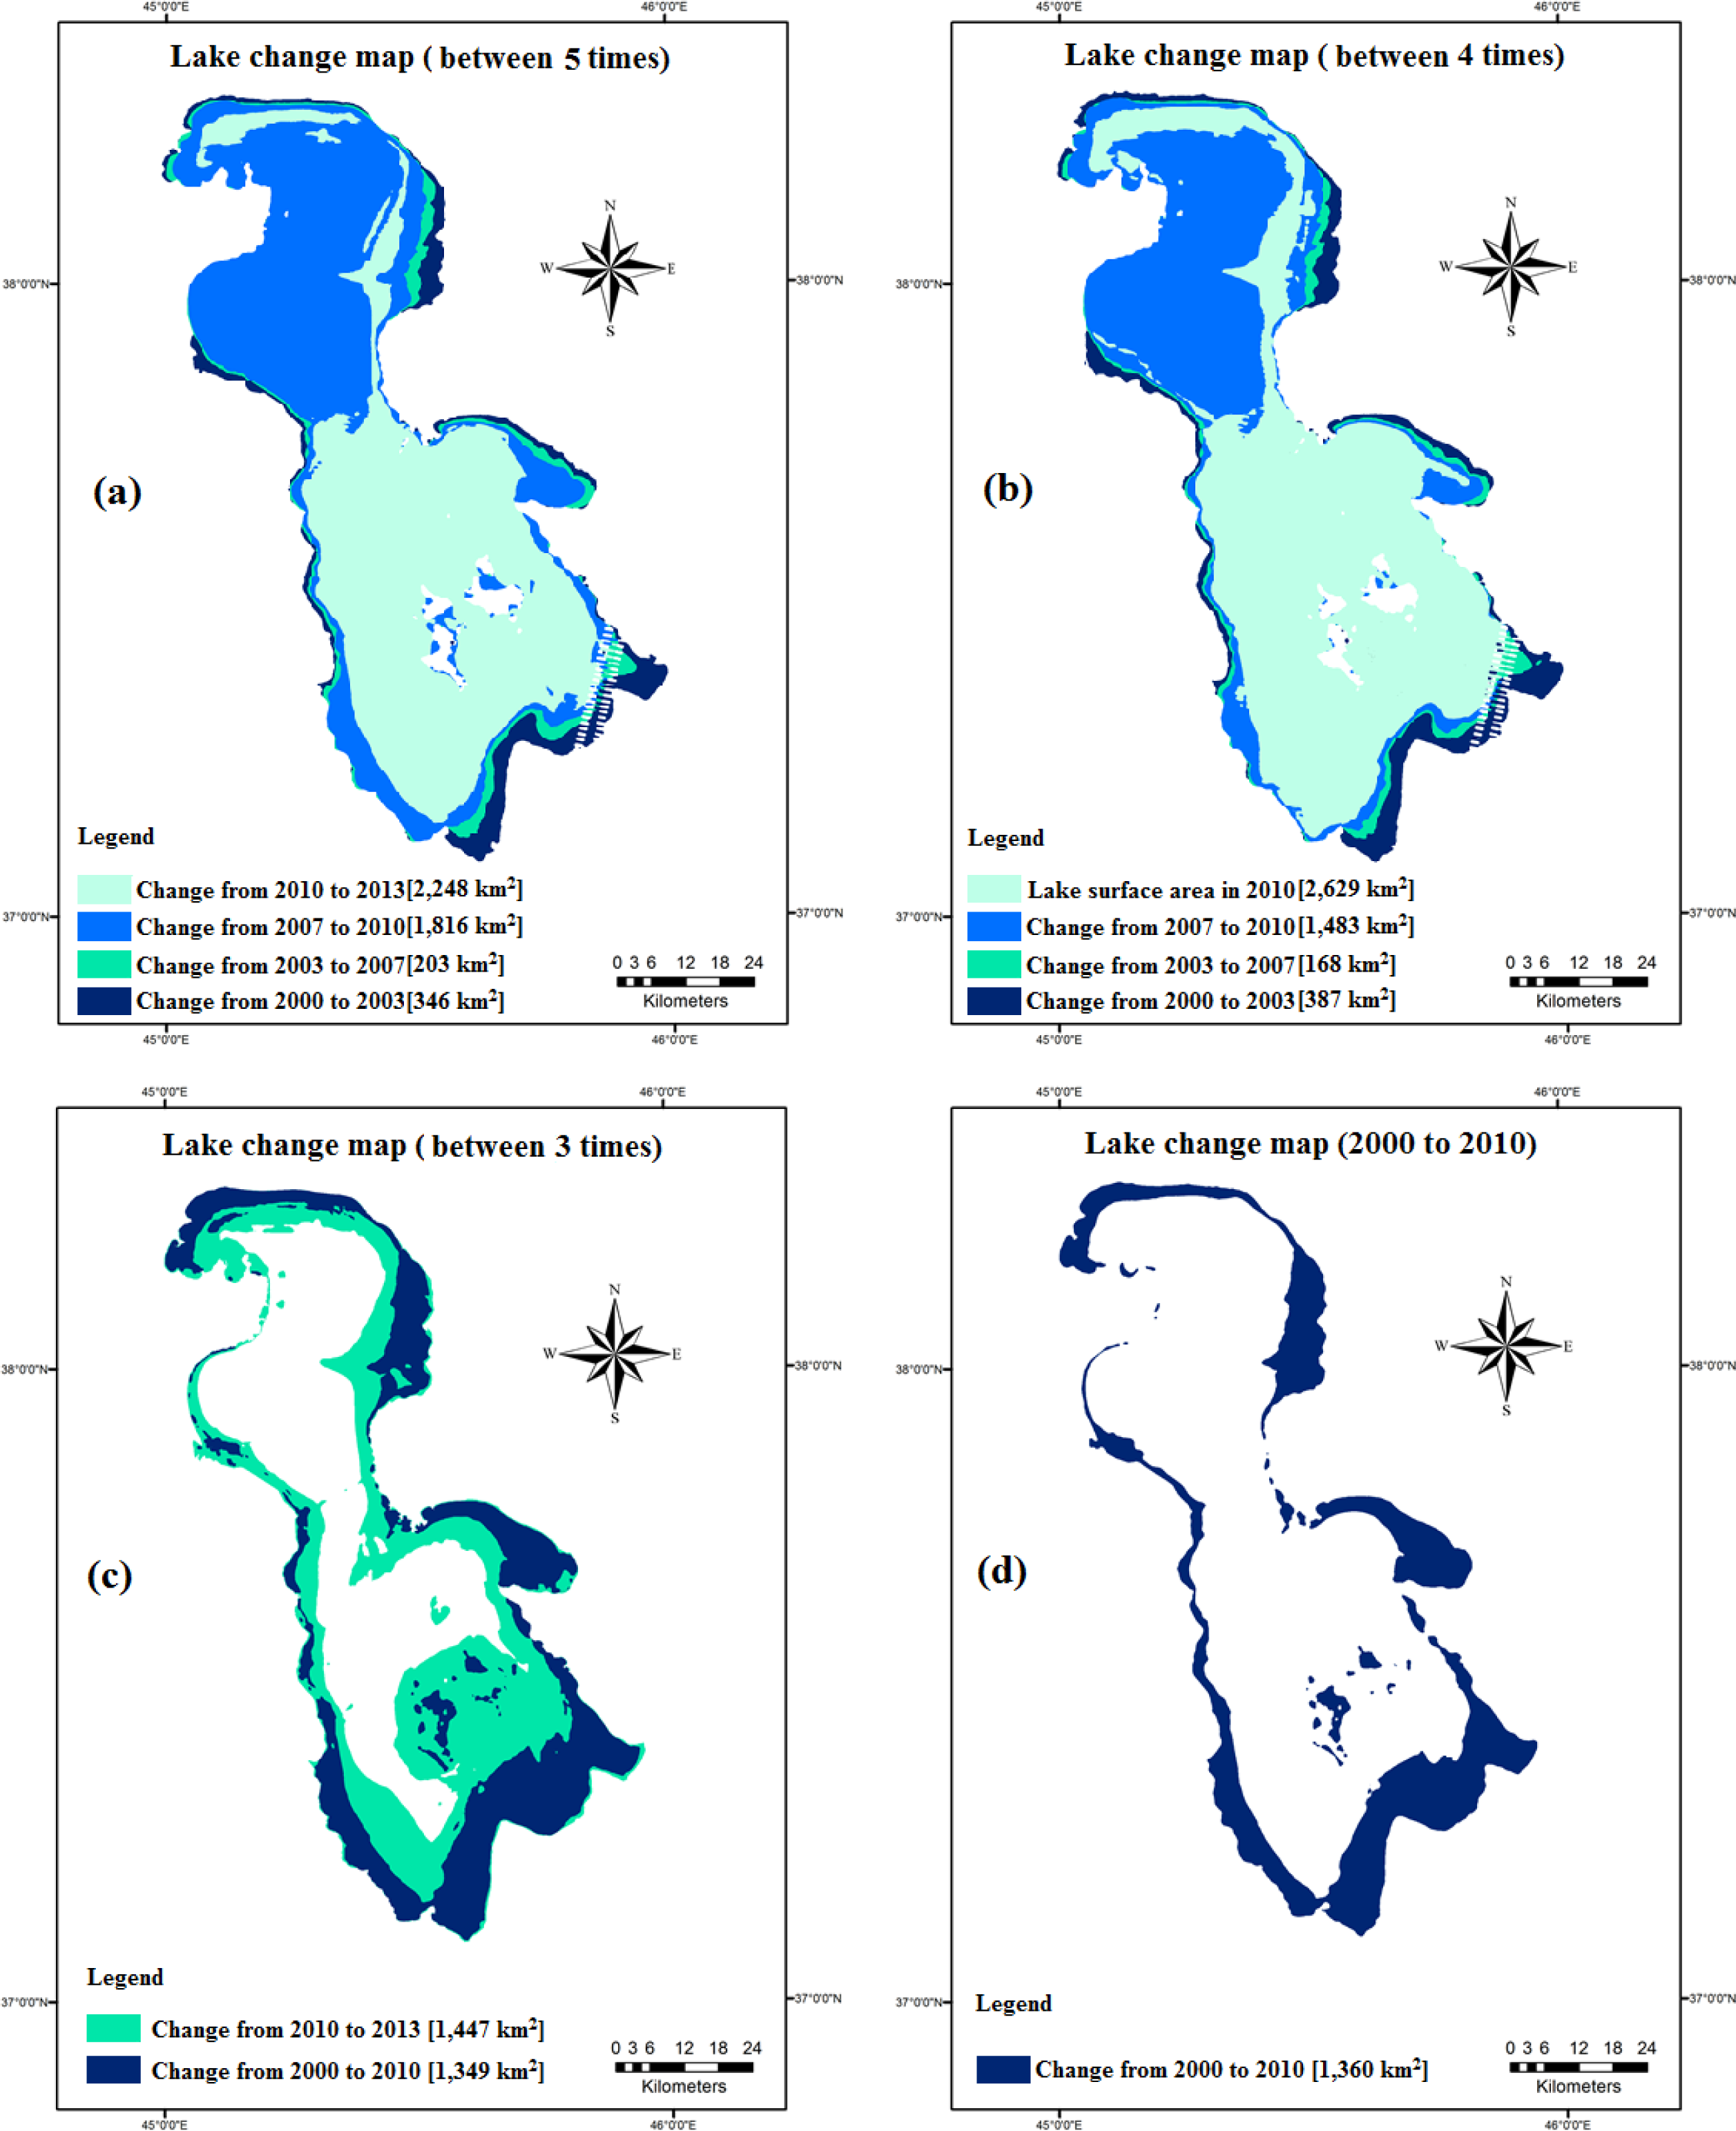
As the NDWI was assessed as the best water extraction technique, it was used to formulate the new principal components approach (NDWI-PCs). Table 6 outlines the applicability of the NDWI-PCs for simultaneously detecting the surface water changes of multi-temporal images. This approach was initially examined to detect the surface water changes between five different times, simultaneously. The results show that the NDWI-PC2, NDWI-PC3, NDWI-PC4, and NDWI-PC5 were incapable of detecting the changes. Nevertheless, the NDWI-PC1 was able to detect the changes from 2000–2003 and 2003–2007, while the changes from 2007–2010 and 2010–2013 were partially mixed (Figure 4a). The results indicate that the NDWI-PCs approach was inefficient for simultaneously detecting the surface water changes between five different times. In the next experiment, the NDWI-PCs approach was examined for the time-series 2000, 2003, 2007, and 2010 (four different times). The results show that only the NDWI-PC1 was able to detect the surface water changes. Although the changes from 2000–2003 and 2003–2007 could be identified using NDWI-PC1, the changes from 2007–2010 were not detectable using this component (Figure 4b).
In the next experiment, the NDWI-PCs approach was examined for simultaneously detecting the surface water changes in time-series 2000, 2010 and 2013 when the most changes occurred (three times). Contrary to the previous experiments, interpretation and classification of the resulting PCs show that the NDWI-PC2 successfully detected the changes from 2000–2010 and 2010–2013, simultaneously (Figure 4c). The results reveal that the lake surface area has decreased about 1349 km2 between 2000 and 2010, and 1447 km2 between 2010 and 2013. Finally, the proposed NDWI-PCs approach was investigated for detection of the lake surface area changes between 2000 and 2010 (two times) as a sample. The results indicate high performance of the NDWI-PCs approach in detecting the surface water changes between two different times, especially using the NDWI-PC2 which yielded the highest accuracy output (Figure 4d). The shrinkage of the lake surface area was about 1360 km2 in this period.
4. Accuracies, Errors, and Uncertainties
A comparative analysis was performed to assess the performances of different methods adopted in this study to detect the water surface changes of Lake Urmia between 2000 and 2010. The statistical results, as shown in Table 7, indicate that the lake surface area between 2000 and 2010 decreased by about 1360 km2 based on NDWI-PCs, while it decreased by about 1380 km2 based on multi-temporal NDWI, 1384 km2 based on multi-temporal NDVI, 1309 km2 based on multi-temporal WRI, 1283 km2 based on multi-temporal AWEI, and 1201 km2 based on multi-temporal MNDWI. Based on the result of visual interpretation as the reference, the lake surface area shrunk by about 1371 km2 in this period experiencing an approximate 29% shrinkage in 2010 compared to 2000. The results are suggestive of a high association between the changed areas detected using the NDWI-PCs, multi-temporal NDWI, and multi-temporal NDVI. Based on the reference change result, the NDWI-PCs approach underestimated the lake surface area change about 11 km2, while the change was overestimated about 9 km2 and 13 km2 using the NDWI and NDVI methods, respectively. The WRI, AWEI and MNDWI methods highly underestimated the lake surface area change between 2000 and 2010.
Accuracy assessment analyses (Table 7) show superiority of the NDWI-PCs, Multi-temporal NDWI and Multi-temporal NDVI methods for surface water change detection compared with other methods. The NDWI-PCs achieved an Absolute Error of 11 km2, an Overall Accuracy of 99.86%, a Kappa Coefficient of 0.91, a Producer’s Accuracy of 92.22, and a User’s Accuracy of 90.67. The NDWI achieved an Absolute Error of 9 km2, an Overall Accuracy of 99.88%, a Kappa Coefficient of 0.91, a Producer’s Accuracy of 92.54, and a User’s Accuracy of 91.06. The NDVI achieved an Absolute Error of 13 km2, an Overall Accuracy of 99.71%, a Kappa Coefficient of 0.87, a Producer’s Accuracy of 93.17, and a User’s Accuracy of 84.33. While, only the NDWI and NDWI-PCs methods provided the accuracies of higher than 90% for surface water change detection. The WRI, AWEI and MNDWI could not effectively achieve accuracy results in comparison with the NDWI-PCs, NDWI and NDVI in detecting the water surface changes in Lake Urmia.
Overall, the NDWI performed slightly better than the NDWI-PCs in detecting the surface water changes. Nevertheless, the NDWI-PCs have advantage over the NDWI in that it detects the surface water changes of two and three different times simultaneously by applying a single threshold to the selected PC. In contrast, the NDWI requires applying a threshold for each time to extract surface water, then subtracting the statistics to estimate the changes.
5. Discussions
The NDMI was developed for detection of vegetation water liquid, and thus would not be efficient for extraction of water features. The NDVI was developed mainly for separating green vegetation from other surfaces. However, it did perform well for surface water detection. The water features enhanced using the NDWI are often mixed with built-up land and the area of extracted water can be overestimated. The MNDWI was developed to modify the NDWI in detecting water features for water regions with backgrounds dominated by built-up land areas. The AWEI was formulated to effectively eliminate dark built surfaces in areas with urban background. In Lake Urmia, where there are no urban areas, the NDWI performed significantly better compared with the MNDWI and AWEI for the extraction of open surface water.
In this study, the NDWI performed significantly better compared with other indexes for mapping lake water surface using Landsat data. PCA is a useful technique for production of uncorrelated output bands, segregation of noise components, and reduction of dimensionality of data set. The present study integrated the advantages of both NDWI and PCA techniques to develop a new approach, named NDWI-PCs. The proposed approach has the advantage of simultaneously detecting the surface water changes of multi-temporal images (between two and three different times) through applying a single threshold to the selected PC. The NDWI-PCs could be useful in detecting the decreasing or increasing changes in any open surface water in the world, as the behavior of water is approximately similar in different regions and different satellite images with similar band wavelengths.
As shown in the study, Lake Urmia lost more than half of its surface area in the period 2000–2013 with half of this decline occurring between 2010 and 2013. If this trend continues, it is very likely that the lake will lose all of its surface area in the near future. This is very critical because the lake provides many benefits for the society and the people living in its surroundings. Therefore, appropriate measures need to be taken by policy makers to prevent further decline of the lake surface area and to restore the lake to its original condition. It is evident that constructing dams on the rivers flowing to the lake, excessive ground water exploitation, devoting water sources to agricultural, industrial and domestic uses, and long periods of drought have all reduced the surface area of Lake Urmia. Further, the changes to water supply and extraction from the catchment such as the changes in rainfall and agricultural land use over the time period should be investigated.
6. Conclusions
This study aimed to model the spatiotemporal changes of Lake Urmia in the period 2000–2013. Through a comparative analysis, the NDWI was selected and employed for this purpose. The results showed an intense decreasing trend in the lake surface area in the period 2000–2013, especially between 2010 and 2013 when the lake lost about 1425 km2 (one third) of its surface area compared to the year 2000. The total change of the lake over the time period was about 2805 km2. If such a decreasing trend in Lake Urmia continues, it is very likely that the lake will lose its entire water surface in the near future. Furthermore, a new approach was introduced for surface water change detection which is based on Principal Components of multi-temporal NDWI (NDWI-PCs). The study demonstrated high performance of the proposed approach in simultaneously detecting the surface water changes between two and three image dates. In detecting the lake water surface change between 2000 and 2010, the NDWI-PCs approach achieved an Absolute Error of 11 km2, an Overall Accuracy of 99.86%, a Kappa Coefficient of 0.91, a Producer’s Accuracy of 92.22, and a User’s Accuracy of 90.67. This approach has advantage over other methods in that it detects the surface water changes of two and three different times simultaneously through applying a single threshold to the selected PC. In conclusion, the proposed NDWI-PCs approach has been proven to be effective in detecting the water surface changes in Lake Urmia, Iran. Accordingly, the method may prove useful in studying other surface waters in the world as well as flood monitoring.
Acknowledgments
The Universiti Teknologi Malaysia (UTM) under Research University Funding Scheme (Q.J130000.3009.00M19 & Q.J130000.2527.03H68) and Ministry of Education Malaysia are hereby acknowledged for providing the facilities utilized during this research work and for supporting the related research. The authors are also grateful to U.S. Geological Survey (USGS) for providing the multi-temporal Landsat data.
Author Contributions
This research article was mainly performed and prepared by the first author, Komeil Rokni. Anuar Ahmad supervised this research work and his comments were considered throughout the paper. Ali Selamat reviewed the article for final submission. Sharifeh Hazini contributed to accuracy assessment analyses.
Conflicts of Interest
The authors declare no conflict of interest.
References
- Salmon, B.P.; Kleynhans, W.; van Den Bergh, F.; Olivier, J.C.; Grobler, T.L.; Wessels, K.J. Land cover change detection using the internal covariance matrix of the extended Kalman filter over multiple spectral bands. IEEE J. Sel. Topics Appl. Earth Observations Remote Sens 2013, 6, 1079–1085. [Google Scholar]
- Demir, B.; Bovolo, F.; Bruzzone, L. Updating land-cover maps by classification of image time series: A novel change-detection-driven transfer learning approach. IEEE Trans. Geosci. Remote Sens 2013, 51, 300–312. [Google Scholar]
- Volpi, M.; Petropoulos, G.P.; Kanevski, M. Flooding extent cartography with Landsat TM imagery and regularized Kernel Fisher’s discriminant analysis. Comput. Geosci 2013, 57, 24–31. [Google Scholar]
- Brisco, B.; Schmitt, A.; Murnaghan, K.; Kaya, S.; Roth, A. Sar polarimetric change detection for flooded vegetation. Int. J. Digit. Earth 2013, 6, 103–114. [Google Scholar]
- Kaliraj, S.; Muthu Meenakshi, S.; Malar, V.K. Application of remote sensing in detection of forest cover changes using geo-statistical change detection matrices—A case study of devanampatti reserve forest, tamilnadu, India. Nat. Environ. Polluti. Technol 2012, 11, 261–269. [Google Scholar]
- Markogianni, V.; Dimitriou, E.; Kalivas, D.P. Land-use and vegetation change detection in plastira artificial lake catchment (Greece) by using remote-sensing and GIS techniques. In Int. J. Remote Sens; 2013; 34, pp. 1265–1281. [Google Scholar]
- Bagan, H.; Yamagata, Y. Landsat analysis of urban growth: How Tokyo became the world’s largest megacity during the last 40 years. Remote Sens. Environ 2012, 127, 210–222. [Google Scholar]
- Raja, R.A.A.; Anand, V.; Kumar, A.S.; Maithani, S.; Kumar, V.A. Wavelet based post classification change detection technique for urban growth monitoring. J. Indian Soc. Remote Sens 2013, 41, 35–43. [Google Scholar]
- Dronova, I.; Gong, P.; Wang, L. Object-based analysis and change detection of major wetland cover types and their classification uncertainty during the low water period at Poyang Lake, China. Remote Sens. Environ 2011, 115, 3220–3236. [Google Scholar]
- Zhu, X.; Cao, J.; Dai, Y. A. Decision Tree Model For Meteorological Disasters Grade Evaluation of Flood. Proceedings of 4th International Joint Conference on Computational Sciences and Optimization 2011, Kunming and Lijiang, Yunnan, China, 15–19 April 2011; Institute of Electrical and Electronics Engineers: New York NY, USA, 2011; pp. 916–919. [Google Scholar]
- Ridd, M.K.; Liu, J. A comparison of four algorithms for change detection in an urban environment. Remote Sens. Environ 1998, 63, 95–100. [Google Scholar]
- Lu, S.; Wu, B.; Yan, N.; Wang, H. Water body mapping method with HJ-1A/B satellite imagery. Int. J. Appl. Earth Obs. Geoinf 2011, 13, 428–434. [Google Scholar]
- Desmet, P.J.J.; Govers, G. A. GIS procedure for automatically calculating the USLE LS factor on topographically complex landscape units. J. Soil Water Conserv 1996, 51, 427–433. [Google Scholar]
- Zhou, W.; Wu, B. Assessment of soil erosion and sediment delivery ratio using remote sensing and GIS: A case study of upstream chaobaihe river catchment, north China. Int. J. Sediment Res 2008, 23, 167–173. [Google Scholar]
- Du, Z.; Linghu, B.; Ling, F.; Li, W.; Tian, W.; Wang, H.; Gui, Y.; Sun, B.; Zhang, X. Estimating surface water area changes using time-series Landsat data in the qingjiang river basin, China. J. Appl. Remote Sens 2012, 6. [Google Scholar] [CrossRef]
- Sun, F.; Sun, W.; Chen, J.; Gong, P. Comparison and improvement of methods for identifying waterbodies in remotely sensed imagery. Int. J. Remote Sens 2012, 33, 6854–6875. [Google Scholar]
- Water Body Extraction from Multi-Source Satellite Images. Available online: http://citeseerx.ist.psu.edu/viewdoc/download?doi=10.1.1.301.8033&rep=rep1&type=pdf (accessed on 21 June 2003).
- Xu, H. Modification of normalised difference water index (NDWI) to enhance open water features in remotely sensed imagery. Int. J. Remote Sens 2006, 27, 3025–3033. [Google Scholar]
- Water Body Extraction And Change Detection Based on Multi-Temporal SAR Images. Available online: http://adsabs.harvard.edu/abs/2009SPIE.7498E..96Z (accessed on 21 January 2014).
- Zhou, H.; Hong, J.; Huang, Q. Landscape and water quality change detection in urban wetland: A post-classification comparison method with IKONOS data. Procedia Environ. Sci 2011, 10, 1726–1731. [Google Scholar]
- Tang, Z.; Ou, W.; Dai, Y.; Xin, Y. Extraction of water body based on Landsat TM5 imagery—A case study in the Yangtze river. Adv. Inf. Comm. Technol 2013, 393, 416–420. [Google Scholar]
- Li, W.; Du, Z.; Ling, F.; Zhou, D.; Wang, H.; Gui, Y.; Sun, B.; Zhang, X. A comparison of land surface water mapping using the normalized difference water index from TM, ETM+ and ALI. Remote Sens 2013, 5, 5530–5549. [Google Scholar]
- McFeeters, S.K. Using the normalized difference water index (NDWI) within a geographic information system to detect swimming pools for mosquito abatement: A practical approach. Remote Sens 2013, 5, 3544–3561. [Google Scholar]
- McFeeters, S.K. The use of the normalized difference water index (NDWI) in the delineation of open water features. Int. J. Remote Sens 1996, 17, 1425–1432. [Google Scholar]
- Alesheikh, A.A.; Ghorbanali, A.; Nouri, N. Coastline change detection using remote sensing. Int. J. Environ. Sci. Technol 2007, 4, 61–66. [Google Scholar]
- Lopez-Caloca, A.; Tapia-Silva, F.O.; Escalante-Ramirez, B. Lake Chapala change detection using time series. Remote Sens. Agric. Ecosyst. Hydrol 2008, 7104, 1–11. [Google Scholar]
- El-Asmar, H.M.; Hereher, M.E. Change detection of the coastal zone east of the Nile Delta using remote sensing. Environ. Earth Sci 2011, 62, 769–777. [Google Scholar]
- Xu, Y.B.; Lai, X.J.; Zhou, C.G. Water surface change detection and analysis of bottomland submersion-emersion of wetlands in Poyang Lake reserve using ENVISAT ASAR data. China Environ. Sci 2010, 30, 57–63. [Google Scholar]
- Delju, A.H.; Ceylan, A.; Piguet, E.; Rebetez, M. Observed climate variability and change in Urmia lake basin, Iran. Theor. Appl. Climatol 2012, 111, 285–296. [Google Scholar]
- Eimanifar, A.; Mohebbi, F. Urmia lake (northwest Iran): A brief review. Saline Syst 2007, 3, 1–8. [Google Scholar]
- Death of Urmia Lake, A Silent Disaster Investigating of Causes, Results Solutions of Urmia Lake Drying. Available online: http://conference.khuisf.ac.ir/DorsaPax/userfiles/file/pazhohesh/zamin%20mashad/127.pdf (accessed on 21 January 2014).
- Sima, S.; Ahmadalipour, A.; Tajrishy, M. Mapping surface temperature in a hyper-saline lake and investigating the effect of temperature distribution on the lake evaporation. Remote Sens. Environ 2013, 136, 374–385. [Google Scholar]
- Ghaheri, M.; Baghal-Vayjooee, M.; Naziri, J. Lake Urmia, Iran: A summary review. Int. J. Salt Lake Res 1999, 8, 19–22. [Google Scholar]
- Schroeder, T.A.; Cohen, W.B.; Song, C.; Canty, M.J.; Yang, Z. Radiometric correction of multi-temporal Landsat data for characterization of early successional forest patterns in western Oregon. Remote Sens. Environ 2006, 103, 16–26. [Google Scholar]
- Chavez, P.S., Jr. Image-based atmospheric corrections—Revisited and improved. Photogramm. Eng. Remote Sens 1996, 62, 1025–1036. [Google Scholar]
- Wilson, E.H.; Sader, S.A. Detection of forest harvest type using multiple dates of Landsat TM imagery. Remote Sens. Environ 2002, 80, 385–396. [Google Scholar]
- Shen, L.; Li, C. Water Body Extraction from Landsat ETM+ Imagery Using Adaboost Algorithm. Proceedings of 18th International Conference on Geoinformatics, Beijing, China, 18–20 June 2010; pp. 1–4.
- Rouse, J.W.; Haas, R.H.; Schell, J.A.; Deering, D.W. Monitoring Vegetation Systems in the Great Plains with ERTS (Earth Resources Technology Satellite). Proceedings of Third Earth Resources Technology Satellite Symposium, Greenbelt, ON, Canada, 10–14 December 1973; Volume SP-351. pp. 309–317.
- Feyisa, G.L.; Meilby, H.; Fensholt, R.; Proud, S.R. Automated water extraction index: A new technique for surface water mapping using Landsat imagery. Remote Sens. Environ 2014, 140, 23–35. [Google Scholar]
- Gao, B.C. NDWI—A normalized difference water index for remote sensing of vegetation liquid water from space. Remote Sens. Environ 1996, 58, 257–266. [Google Scholar]
- Phua, M.H.; Tsuyuki, S.; Soo Lee, J.; Ghani, M.A.A. Simultaneous detection of burned areas of multiple fires in the tropics using multisensor remote-sensing data. Int. J. Remote Sens 2012, 33, 4312–4333. [Google Scholar]


| Satellite | Sensor | Path/Row | Year | Resolution (m) | Wavelength (μm) |
|---|---|---|---|---|---|
| Landsat-5 | TM | 169/33 169/34 168/34 | 2003 2007 2010 | 30 | Band 1: 0.45–0.52 |
| Band 2: 0.52–0.60 | |||||
| Band 3: 0.63–0.69 | |||||
| Band 4: 0.76–0.90 | |||||
| Band 5: 1.55–1.75 | |||||
| Band 7: 2.08–2.35 | |||||
| Landsat-7 | ETM+ | 169/33 169/34 168/34 | 2000 | 30 | Band 1: 0.45–0.515 |
| Band 2: 0.525–0.605 | |||||
| Band 3: 0.63–0.69 | |||||
| Band 4: 0.75–0.90 | |||||
| Band 5: 1.55–1.75 | |||||
| Band 7: 2.09–2.35 | |||||
| Landsat-8 | OLI | 169/33 | 2013 | 30 | Band 1: 0.435–0.451 |
| Band 2: 0.452–0.512 | |||||
| Band 3: 0.533–0.590 | |||||
| Band 4: 0.636–0.673 | |||||
| Band 5: 0.851–0.879 | |||||
| Band 6: 1.566–1.651 | |||||
| Band 7: 2.107–2.294 | |||||
| Band 9: 1.363–1.384 | |||||
| Index | Equation | Remark | Reference |
|---|---|---|---|
| Normalized Difference Water Index | NDWI = (Green − NIR)/(Green + NIR) | Water has positive value | [24] |
| Normalized Difference Moisture Index | NDMI = (NIR − MIR)/(NIR + MIR) | Water has positive value | [36] |
| Modified Normalized Difference Water Index | MNDWI = (Green − MIR)/(Green + MIR) | Water has positive value | [18] |
| Water Ratio Index | WRI = (Green + Red)/(NIR + MIR) | Value of water body is greater than 1 | [37] |
| Normalized Difference Vegetation Index | NDVI = (NIR − Red)/(NIR + Red) | Water has negative value | [38] |
| Automated Water Extraction Index | AWEI = 4 × (Green-MIR) − (0.25 × NIR + 2.75 × SWIR) | Water has positive value | [39] |
| Index | Land-Water Threshold | Lake Area in 2000 (km2) | Land-Water Threshold | Lake Area in 2010 (km2) |
|---|---|---|---|---|
| Reference | 4699 | 3328 | ||
| NDWI | 0.234 | 4711 | 0.153 | 3331 |
| NDMI | - | - | - | - |
| MNDWI | 0.450 | 4808 | 0.270 | 3607 |
| WRI | 2.330 | 4751 | 1.790 | 3442 |
| NDVI | −0.210 | 4742 | −0.290 | 3358 |
| AWEI | 0.000 | 4782 | −0.150 | 3499 |
| Index | For the Year 2000 | For the Year 2010 | ||||
|---|---|---|---|---|---|---|
| Absolute Error (km2) | Overall Accuracy (%) | Kappa Coefficient | Absolute Error (km2) | Overall Accuracy (%) | Kappa Coefficient | |
| NDWI | 12 | 99.35 | 0.95 | 3 | 99.64 | 0.96 |
| MNDWI | 109 | 93.67 | 0.88 | 279 | 90.40 | 0.86 |
| WRI | 52 | 98.45 | 0.93 | 114 | 95.13 | 0.90 |
| NDVI | 43 | 99.06 | 0.95 | 30 | 98.91 | 0.94 |
| AWEI | 83 | 96.63 | 0.91 | 171 | 94.06 | 0.90 |
| Year | Lake Surface Area (km2) | Lake Surface Area Change (km2) | ||||
|---|---|---|---|---|---|---|
| 2000 | 4711 | −435 | −2805 | |||
| 2003 | 4276 | −238 | ||||
| 2007 | 4038 | −707 | ||||
| 2010 | 3331 | −1425 | ||||
| 2013 | 1906 | |||||
| Multi-Temporal Change Detection | NDWI-PCs | Can Detect the Changes | Cannot Detect the Changes | Remark |
|---|---|---|---|---|
| Change detection between 5 different times | NDWI-PC1 | × | Only PC1 partially detected the changes | |
| NDWI-PC2 | × | |||
| NDWI-PC3 | × | |||
| NDWI-PC4 | × | |||
| NDWI-PC5 | × | |||
| Change detection between 4 different times | NDWI-PC1 | × | Only PC1 partially detected the changes | |
| NDWI-PC2 | × | |||
| NDWI-PC3 | × | |||
| NDWI-PC4 | × | |||
| Change detection between 3 different times | NDWI-PC1 | × | Only PC2 well detected the changes | |
| NDWI-PC2 | × | |||
| NDWI-PC3 | × | |||
| Change detection between 2 different times | NDWI-PC1 | × | PC1 and PC2 well detected the changes | |
| NDWI-PC2 | × | |||
| Method | Changed Area (km2) | Absolute Error (km2) | Overall Accuracy (%) | Kappa Coefficient | Producer’s Accuracy (%) | User’s Accuracy (%) |
|---|---|---|---|---|---|---|
| Reference | 1371 | 0 | 100 | 1 | 100 | 100 |
| Proposed NDWI-PCs | 1360 | 11 | 99.86 | 0.91 | 92.22 | 90.67 |
| Multi-temporal NDWI | 1380 | 9 | 99.88 | 0.91 | 92.54 | 91.06 |
| Multi-temporal NDVI | 1384 | 13 | 99.71 | 0.87 | 93.17 | 87.33 |
| Multi-temporal WRI | 1309 | 62 | 97.30 | 0.86 | 87.49 | 90.09 |
| Multi-temporal AWEI | 1283 | 88 | 96.37 | 0.89 | 85.13 | 88.38 |
| Multi-temporal MNDWI | 1201 | 170 | 94.81 | 0.86 | 37.31 | 82.45 |
© 2014 by the authors; licensee MDPI, Basel, Switzerland This article is an open access article distributed under the terms and conditions of the Creative Commons Attribution license (http://creativecommons.org/licenses/by/3.0/).
Share and Cite
Rokni, K.; Ahmad, A.; Selamat, A.; Hazini, S. Water Feature Extraction and Change Detection Using Multitemporal Landsat Imagery. Remote Sens. 2014, 6, 4173-4189. https://doi.org/10.3390/rs6054173
Rokni K, Ahmad A, Selamat A, Hazini S. Water Feature Extraction and Change Detection Using Multitemporal Landsat Imagery. Remote Sensing. 2014; 6(5):4173-4189. https://doi.org/10.3390/rs6054173
Chicago/Turabian StyleRokni, Komeil, Anuar Ahmad, Ali Selamat, and Sharifeh Hazini. 2014. "Water Feature Extraction and Change Detection Using Multitemporal Landsat Imagery" Remote Sensing 6, no. 5: 4173-4189. https://doi.org/10.3390/rs6054173