Article

Evapotranspiration Variability and Its Association with Vegetation Dynamics in the Nile Basin, 2002–2011

1
Geospatial Sciences Center of Excellence (GSCE), South Dakota State University, Brookings, 57007 SD, USA
2
Earth Resources Observation and Science (EROS) Center, U.S. Geological Survey, Sioux Falls, 57198 SD, USA
*
Author to whom correspondence should be addressed.
Remote Sens. 2014, 6(7), 5885-5908; https://doi.org/10.3390/rs6075885
Submission received: 13 January 2014 / Revised: 12 June 2014 / Accepted: 16 June 2014 / Published: 25 June 2014
(This article belongs to the Special Issue Earth Observation for Water Resource Management in Africa)

Abstract

:
Evapotranspiration (ET) is a vital component in land-atmosphere interactions. In drylands, over 90% of annual rainfall evaporates. The Nile Basin in Africa is about 42% dryland in a region experiencing rapid population growth and development. The relationship of ET with climate, vegetation and land cover in the basin during 2002–2011 is analyzed using thermal-based Simplified Surface Energy Balance Operational (SSEBop) ET, Normalized Difference Vegetation Index (NDVI)-based MODIS Terrestrial (MOD16) ET, MODIS-derived NDVI as a proxy for vegetation productivity and rainfall from Tropical Rainfall Measuring Mission (TRMM). Interannual variability and trends are analyzed using established statistical methods. Analysis based on thermal-based ET revealed that >50% of the study area exhibited negative ET anomalies for 7 years (2009, driest), while >60% exhibited positive ET anomalies for 3 years (2007, wettest). NDVI-based monthly ET correlated strongly (r > 0.77) with vegetation than thermal-based ET (0.52 < r < 0.73) at p < 0.001. Climate-zone averaged thermal-based ET anomalies positively correlated (r = 0.6, p < 0.05) with rainfall in 4 of the 9 investigated climate zones. Thermal-based and NDVI-based ET estimates revealed minor discrepancies over rainfed croplands (60 mm/yr higher for thermal-based ET), but a significant divergence over wetlands (440 mm/yr higher for thermal-based ET). Only 5% of the study area exhibited statistically significant trends in ET.

1. Introduction

Drylands are terrestrial ecosystems characterized by the scarcity of water. Rainfall is generally low (<600 mm/yr), and the potential rate of evapotranspiration greatly exceeds rainfall [1]. Drylands occupy about 41% the global surface and provide food, grazing for livestock, energy and forestry products and ecosystem services to about a third of the global population [2,3]. The limitations in water and/or nutrients have made these ecosystems highly sensitive to environmental changes and prone to land degradation, such as desertification [4]. With regards to socioeconomic conditions, dryland populations on average lag significantly behind the rest of the world on human well-being and development indicators [3]. This is particularly true for the Nile Basin of Africa, where a quarter of the continent’s population lives in a region where 42% of the basin is dryland and water is scarce [57]. Moreover, the population in the region is highly dependent on natural resources for its livelihood, highly vulnerable to food insecurity and exposed to political instability [68]. Over the last few years, the Nile Basin has undergone major transformation in land cover/land use change, mainly from expanding urban and agricultural activities, with possible implications for water use and food security in the region [913].
At global and continental scales, evapotranspiration (ET) is the second largest component of the terrestrial water budget after precipitation [14]. While this proportion is retained at the basin scale, it is reversed in irrigation schemes and wetlands [15]. Terrestrial ET transfers a large volume of water from soil and vegetation into the atmosphere [16]. About 60% of the global annual land precipitation is lost to ET; while ET from vegetation constitutes about 80% of terrestrial ET [14,17]. In dryland ecosystems where much of the soil is bare, ET can consume as much as 90% or more of the annual precipitation [18]. The high rate of ET (combined with the low rate of rainfall) in dryland ecosystems reduces soil water availability and, subsequently, inhibits the primary productivity of the vegetation [3]. Vegetation productivity is of great economic importance in many regions of dryland ecosystems [2]. The Normalized Difference Vegetation Index (NDVI) is often used as a proxy for vegetation productivity [8,19]. Moreover, human activity, such as agricultural and industrial development, has been a principal factor in the modification of the ecohydrological system [4,2024].
In order to improve our understanding of ecohydroclimatologic dynamics, several numerical weather prediction systems and land surface models have been developed over the last few decades. The models range in complexity from simple water balance equations to complex physical parameterization of land-atmosphere interactions. In addition, the advent of remote sensing brought the capability to continuously collect time series of spatially-explicit quantitative data on land-atmosphere interactions at regional and global scales at regular time intervals [25]. Model-derived and remote sensing land surface and climatological data have been particularly critical in data-scarce regions of the world. Several remote sensing-based ET methods are currently available that, according to Courault et al. [26], can generally be grouped into: direct methods that use thermal infrared (TIR) directly into simplified semi-empirical models; deterministic methods that use assimilation procedures and combine different remote sensing bands ingested into complex models to estimate ET; the inference (vegetation indices) method that uses remote sensing data to compute the reduction factor, such as the crop coefficient, to compute with reference to evapotranspiration for the estimation of actual evapotranspiration; and the residual methods (of the energy budgets),which use the spatial variability in remote sensing images to calculate the surface energy balance equation and attempt to minimize the use of atmospheric data. Most of the currently operational remote sensing-based ET models such as the Surface Energy Balance Algorithm (SEBAL) [27], Surface Energy Balance System (SEBS) [28], Simplified Surface Energy Balance (SSEB) [29] and Operational Simplified Surface Energy Balance (SSEBop) [30] are in this category. A more detailed discussion on the different ET methods can be found in Calgano et al. [31].
The scarcity of reliable and openly distributed in situ data in the Nile Basin region means that only a few basin-scale studies are available so far; and most of those studies have to rely on model and remote sensing data [32,33]. Previous works on ET in the region include those conducted at field-scales [34,35] or high resolution imagery [16,36,37], or regional/basin-scale [3350], or the continental/global-scale [17,51,52]. Continental- and regional-scale trend analysis conducted at 0.5° to 1.0° resolution indicated a downward trend in ET over the past few decades in substantial parts of the Nile Basin region [17,51,52]. However, some studies of localized areas, like parts of the Nile Delta [38], that used moderate resolution satellite data suggest an increase in ET over the last few decades. Previous studies in the region focused either on trends in ET dynamics [51] or the relationship between climate and ET [17]. This work attempts to add to this growing scientific literature by analyzing the variability in actual evapotranspiration (referred to as ET in this paper) and its relationship with climate, land cover and vegetation productivity in the Nile Basin using satellite-derived and land surface models during 2002–2011.
Using a hybrid combination of satellite-derived and modeled data, we present basin-wide geographically-distributed ET dynamics and the drivers, a comparison between thermal-based and NDVI-based ET in different climate zones and land cover and the ET-vegetation interaction in the basin during the period of 2002–2011. The data used are long-term records of thermal-based (SSEBop (Simplified Surface Energy Balance Operational), [30]) and NDVI-based ET (MOD16 (MODIS Terrestrial ET Product), [5355]), satellite-driven rainfall (TRMM (Tropical Rainfall Measuring Mission), [56]) and vegetation (NDVI derived from MODIS Nadir Bidirectional Reflectance Distribution Function (BRDF)-Adjusted Reflectance, NBAR, [57]).

2. Materials and Methods
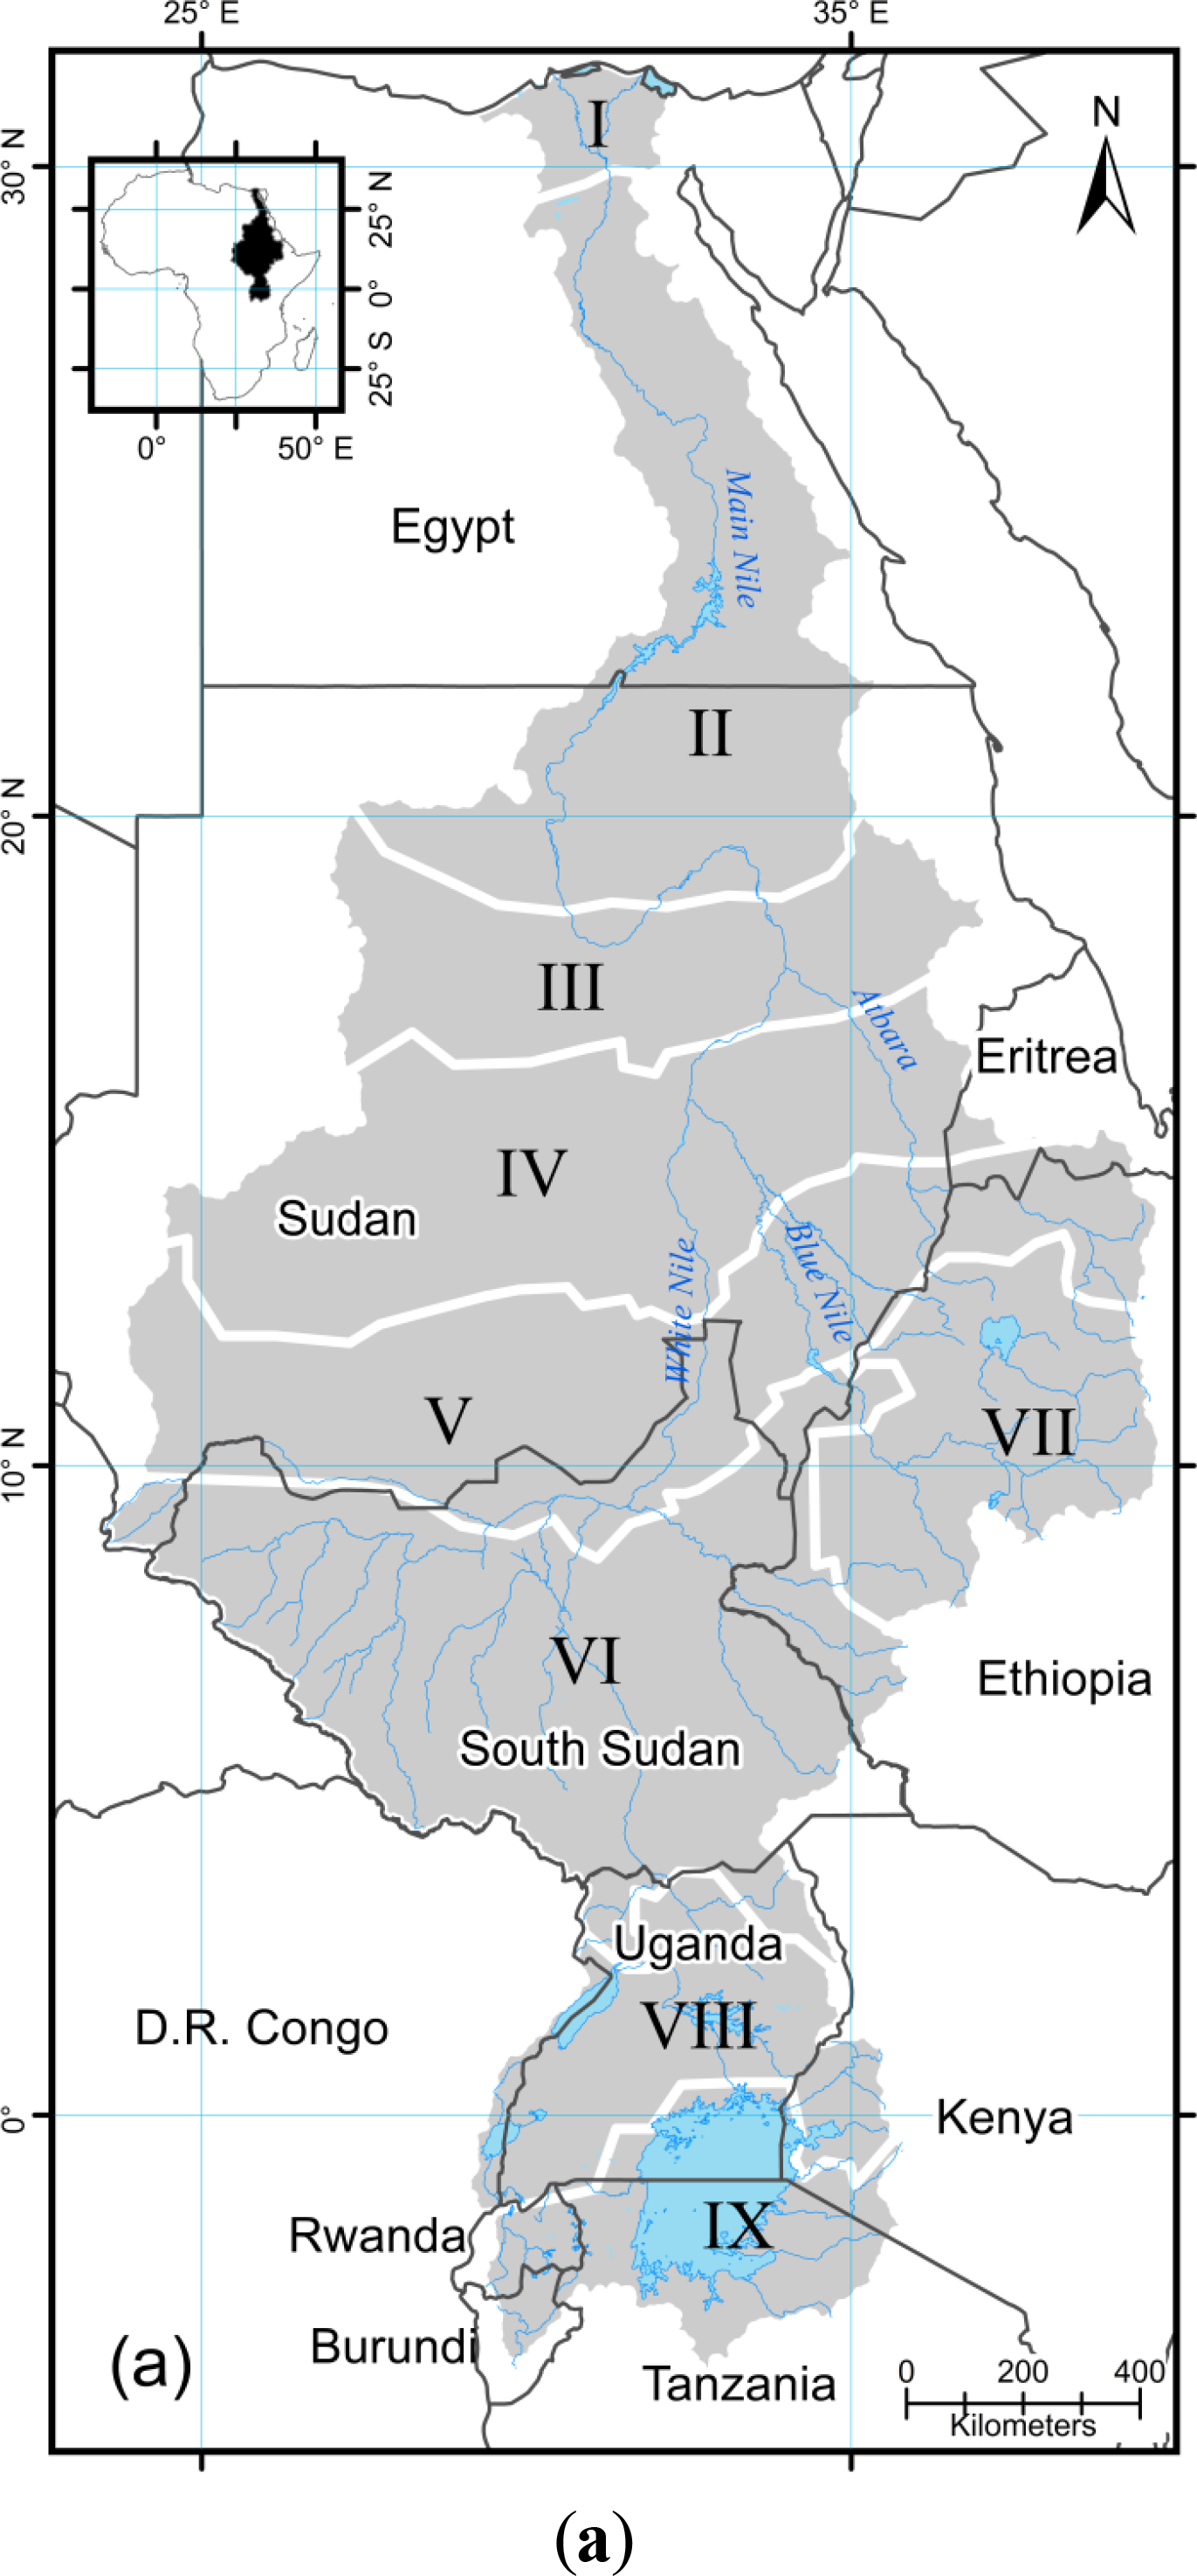
2.1. Study Area

The Nile Basin (Figure 1a) is located in northeastern Africa and extends from latitude 4°S to 32°N and from longitude 21°30′E to 40°30′E. The basin is home to the River Nile, which drains an area of about 3.3 million km2 (∼10% of the continent’s landmass). The basin’s land cover is dominated by shrublands and woodlands (37%) and bare soils (30%), while the remaining is irrigated and rainfed agricultural land (11%), grasslands (10%), forest cover (7%), wetlands and lakes (3%) and a fraction of it covered with built-up areas [6]. Subsequently, the spatial distribution of vegetation productivity in the basin is highly variable, as illustrated in Figure 2d. Regions with predominantly high vegetation productivity are the Equatorial Lakes Region (Zones VIII and IX), South Sudan (VI) and the western part of the Ethiopian Highlands (Zone VII). Except for the Nile Delta (Zone I) and the Nile Valley river corridor (Zone II), the rest of the basin in Zones II, III and IV shows very low vegetation productivity.
Rainfall distribution in the basin (Figure 2c) is mainly driven by the seasonal fluctuation of the Inter-Tropical Convergence Zone (ITCZ) and its interaction with topography [58,59]. A pronounced north-south rainfall gradient ranging from almost no rain over Lake Nasser in Egypt (Zone II) to rainfall totaling ∼2100 mm/yr in Gore, Ethiopia (Zone VII) lead to the climatic classification of the basin into nine climate zones (Figure 1, [58]). Low mean annual basin rainfall (∼1046 mm/yr) in only geographically-limited regions means that the Nile River Basin has one of the lowest discharges compared to other major river basins in the world [5,6].
Evaporative losses in the basin are extremely high because the headwaters of the river primarily originate in the tropics; and because the river stagnates in large lakes (Lake Victoria, Lake Tana, Lake Albert), extensive swamps (the Sudd in South Sudan), artificial impoundments in arid environments (Lake Nasser/Nubia in Egypt/Sudan, Jebel el Aulia in Sudan) and meanders through arid and hyper-arid ecosystems [5,6]. Annual ET estimates (Figure 2a,b) in the basin range from <∼20 mm/yr in the hyper-arid and arid regions (Zones II, III and IV) to about >∼1400 mm/yr in the equatorial and central basin regions (Zones VI and VIII). In the Nile Delta (Zone 1), where rainfall is minimal and agriculture depends entirely on irrigation, annual ET ranges between ∼700–1100 mm/yr. The Nile Basin is drained by two principal tributaries, the Blue Nile (from the Ethiopian Highlands, which overall contribute ∼86% of the total inflows to the Main Nile) and the White Nile (from the Equatorial Lakes Region, contributing the rest) that join at the confluence in Khartoum, Sudan, to form the Main Nile River [5862]. River Atbara drains the northern Ethiopian Highlands and is the last tributary to join the Main Nile (Figure 1a).

2.2. Data

2.2.1. Thermal-Based Data (SSEBop ET)

Senay et al. [29] produced the Simplified Surface Energy Balance (SSEB) model using thermal data for uniform agricultural fields. Later versions integrated additional information on topography, latitude and differences between land surface temperature and air temperature to enhance the model [63,64]. The SSEBop ET algorithm is an operational parameterization of the SSEB model that uses MODIS land surface temperature (LST) and model-derived meteorological parameters to produce a gridded ET product [30]. For a given day and location, the SSEBop approach assumes: (i) a near-constant temperature discontinuity between bare dry surface and atmosphere year to year under clear sky conditions; and (ii) clear sky net radiation as the main driver of surface energy balance [30]. The SSEBop algorithm uses NDVI for a one-time model parameterization to establish the upper and lower boundary conditions for LST; however, the algorithm does not directly include NDVI values in the computation for ET estimation [30]. The method has been tested using 14-year MODIS data from the United States, Africa and Southeast Asia and has been validated comprehensively over the Conterminous U.S. (CONUS) against flux tower observations, water balance ET and MOD16 [65]. The data are available at 1-km resolution 8-day totals from the U.S. Geological Survey (USGS) Earth Resources Observation and Science (EROS) Center.

2.2.2. NDVI-Based Data (MOD16 ET)

The MODIS 1-km spatial resolution Terrestrial ET Product for the Nile Basin [53] is acquired from the Nile Basin Initiative (NBI, [66]). MOD16 data are available at 8-day, monthly and annual time scales. The MOD16 algorithm employs the Penman–Monteith ET model and utilizes MODIS products, including 14 land cover types, Leaf Area Index/Fraction of Photosynthetically Active Radiation (LAI/FPAR), and white sky-albedo for the estimation of ET [54,55]. In addition to the vegetation surface-based algorithm employed in the previous global MOD16 ET algorithm, the improved version uses additional Terra MODIS daytime LST, NDVI and Enhanced Vegetation Index (EVI) data to estimate ET over deserts, urban areas, inland water bodies, such as rivers and lakes, as well as vegetated surfaces, and is produced specifically for the Nile Basin [53].

2.2.3. MODIS NDVI Data

For vegetation data, 1-km spatial resolution, 8-day NDVI composites were derived from the red (0.620–0.670 μm) and near-infrared (0.841–0.876 μm) bands of the MODIS Nadir BRDF-Adjusted Reflectance (NBAR) Product (MCD43B4, version 4) for 46 observations per year for the period from 2002 to 2011. MCD43B4 data are 16-day composites generated using acquisitions from MODIS onboard both Terra and Aqua platforms. The overlapping by 8-days of two successive composites resulted in the availability of one image every 8 days. The NBAR data provide an improved surface reflectance product with reduced cloud and aerosol contamination, with view angle effects removed [57]. The data are freely available via the National Aeronautics and Space Administration (NASA) next generation metadata and service discovery tool, Reverb [67].

2.2.4. TRMM Rainfall Data

In data-scarce regions, such as the Nile Basin, where gauge data are sparse or unevenly distributed, and where weather observation networks are deteriorating, satellite rainfall estimates provide essential, and at times, the only spatiotemporal information data for multiple time periods at a range of spatial scales [68]. In this study, we used the daily TRMM [56] merged high quality infrared precipitation product (3B42, V.7). The TRMM-3B42 algorithm combines geostationary infrared, passive microwaves and also ground-based gauge data [68]. TRMM-3B42 estimates are produced at a 3-hour temporal and a 0.25° spatial resolution; data are acquired from NASA’s TRMM site [69].

2.3. Methods

2.3.1. Pre-Processing of Data

Examination of the data (SSEBop, MODIS ET and NDVI) revealed areas where there is a high and low frequency of 8-day time series datasets. Frequency (%) maps of the 8-day time series data from each of the three datasets with values greater than zero are included in Figure 3. For this analysis, only SSEBop ET (ET > 0), MODIS NDVI (NDVI > 0) and MODIS ET (ET > 0) retrievals during 2002–2011 are included. Moreover, while doing inter-comparison and correlations, SSEBop pixels where the corresponding MODIS ET and NDVI values are zero are also excluded.

2.3.2. Standardized Anomalies

To analyze interannual variations, standardized anomalies were computed by subtracting the mean of the annual values from the corresponding individual annual values and dividing by the standard deviation. Dimensionless standard units of the standardized anomalies (SA) facilitate the direct comparison of variations in different geographic locations. Standardized anomalies (SA) were categorized into five classes: (i) SA ≤ −2: severely dry; (ii) −2 ≤ SA < −0.5: moderately dry; (iii) −0.5 ≤ SA ≤ 0.5: normal; (iv) 0.5 < SA ≤ 2: moderately wet; and (v) SA > 2: severely wet. In this paper, we generally define dryness for SA < −0.5 and wetness for SA > 0.5.

2.3.3. Inter-Model Comparisons

Indirect inter-model comparisons of SSEBop and MOD16 estimates were conducted by comparing time series of monthly ET estimates (an average of 30 × 30 pixels) from each ET dataset over selected land cover (using MODIS land cover and Google Earth for visual inspection) with respect to corresponding estimates of vegetation productivity (NDVI). The indirect comparison with respect to rainfall was made using time series of annual ET anomalies averaged per each of the nine climate zones. Pearson’s product-moment coefficient of linear correlation (r) is used to measure the relationship between ET from SSEBop and MODIS ET with vegetation productivity.

2.3.4. Trend Analysis

In order to detect the presence of temporal trends (consistent, one-directional, long-term changes over time in ET and rainfall), a linear regression trend test was conducted, where time is the independent variable and ET or rainfall is the dependent variable. In order to perform statistical inference regarding the slope (trend through time) of a line fitted using the ordinary least-squares (OLS) method, the following criteria have to be met [70]: (1) the normality of residuals resulting from the linear regression (Shapiro–Wilk test) [71]; (2) homoscedasticity: the variance of the residuals must be constant throughout time (Breusch–Pagan test) [72]; and (3) serial independence: the residuals should be free from autocorrelation (Breusch–Godfrey test) [73] at lags of up to two samples. The linear model in this study was run at an annual time scale for both ET and rainfall for the decadal study period, and statistical significance was chosen at the 95% level.

3. Results

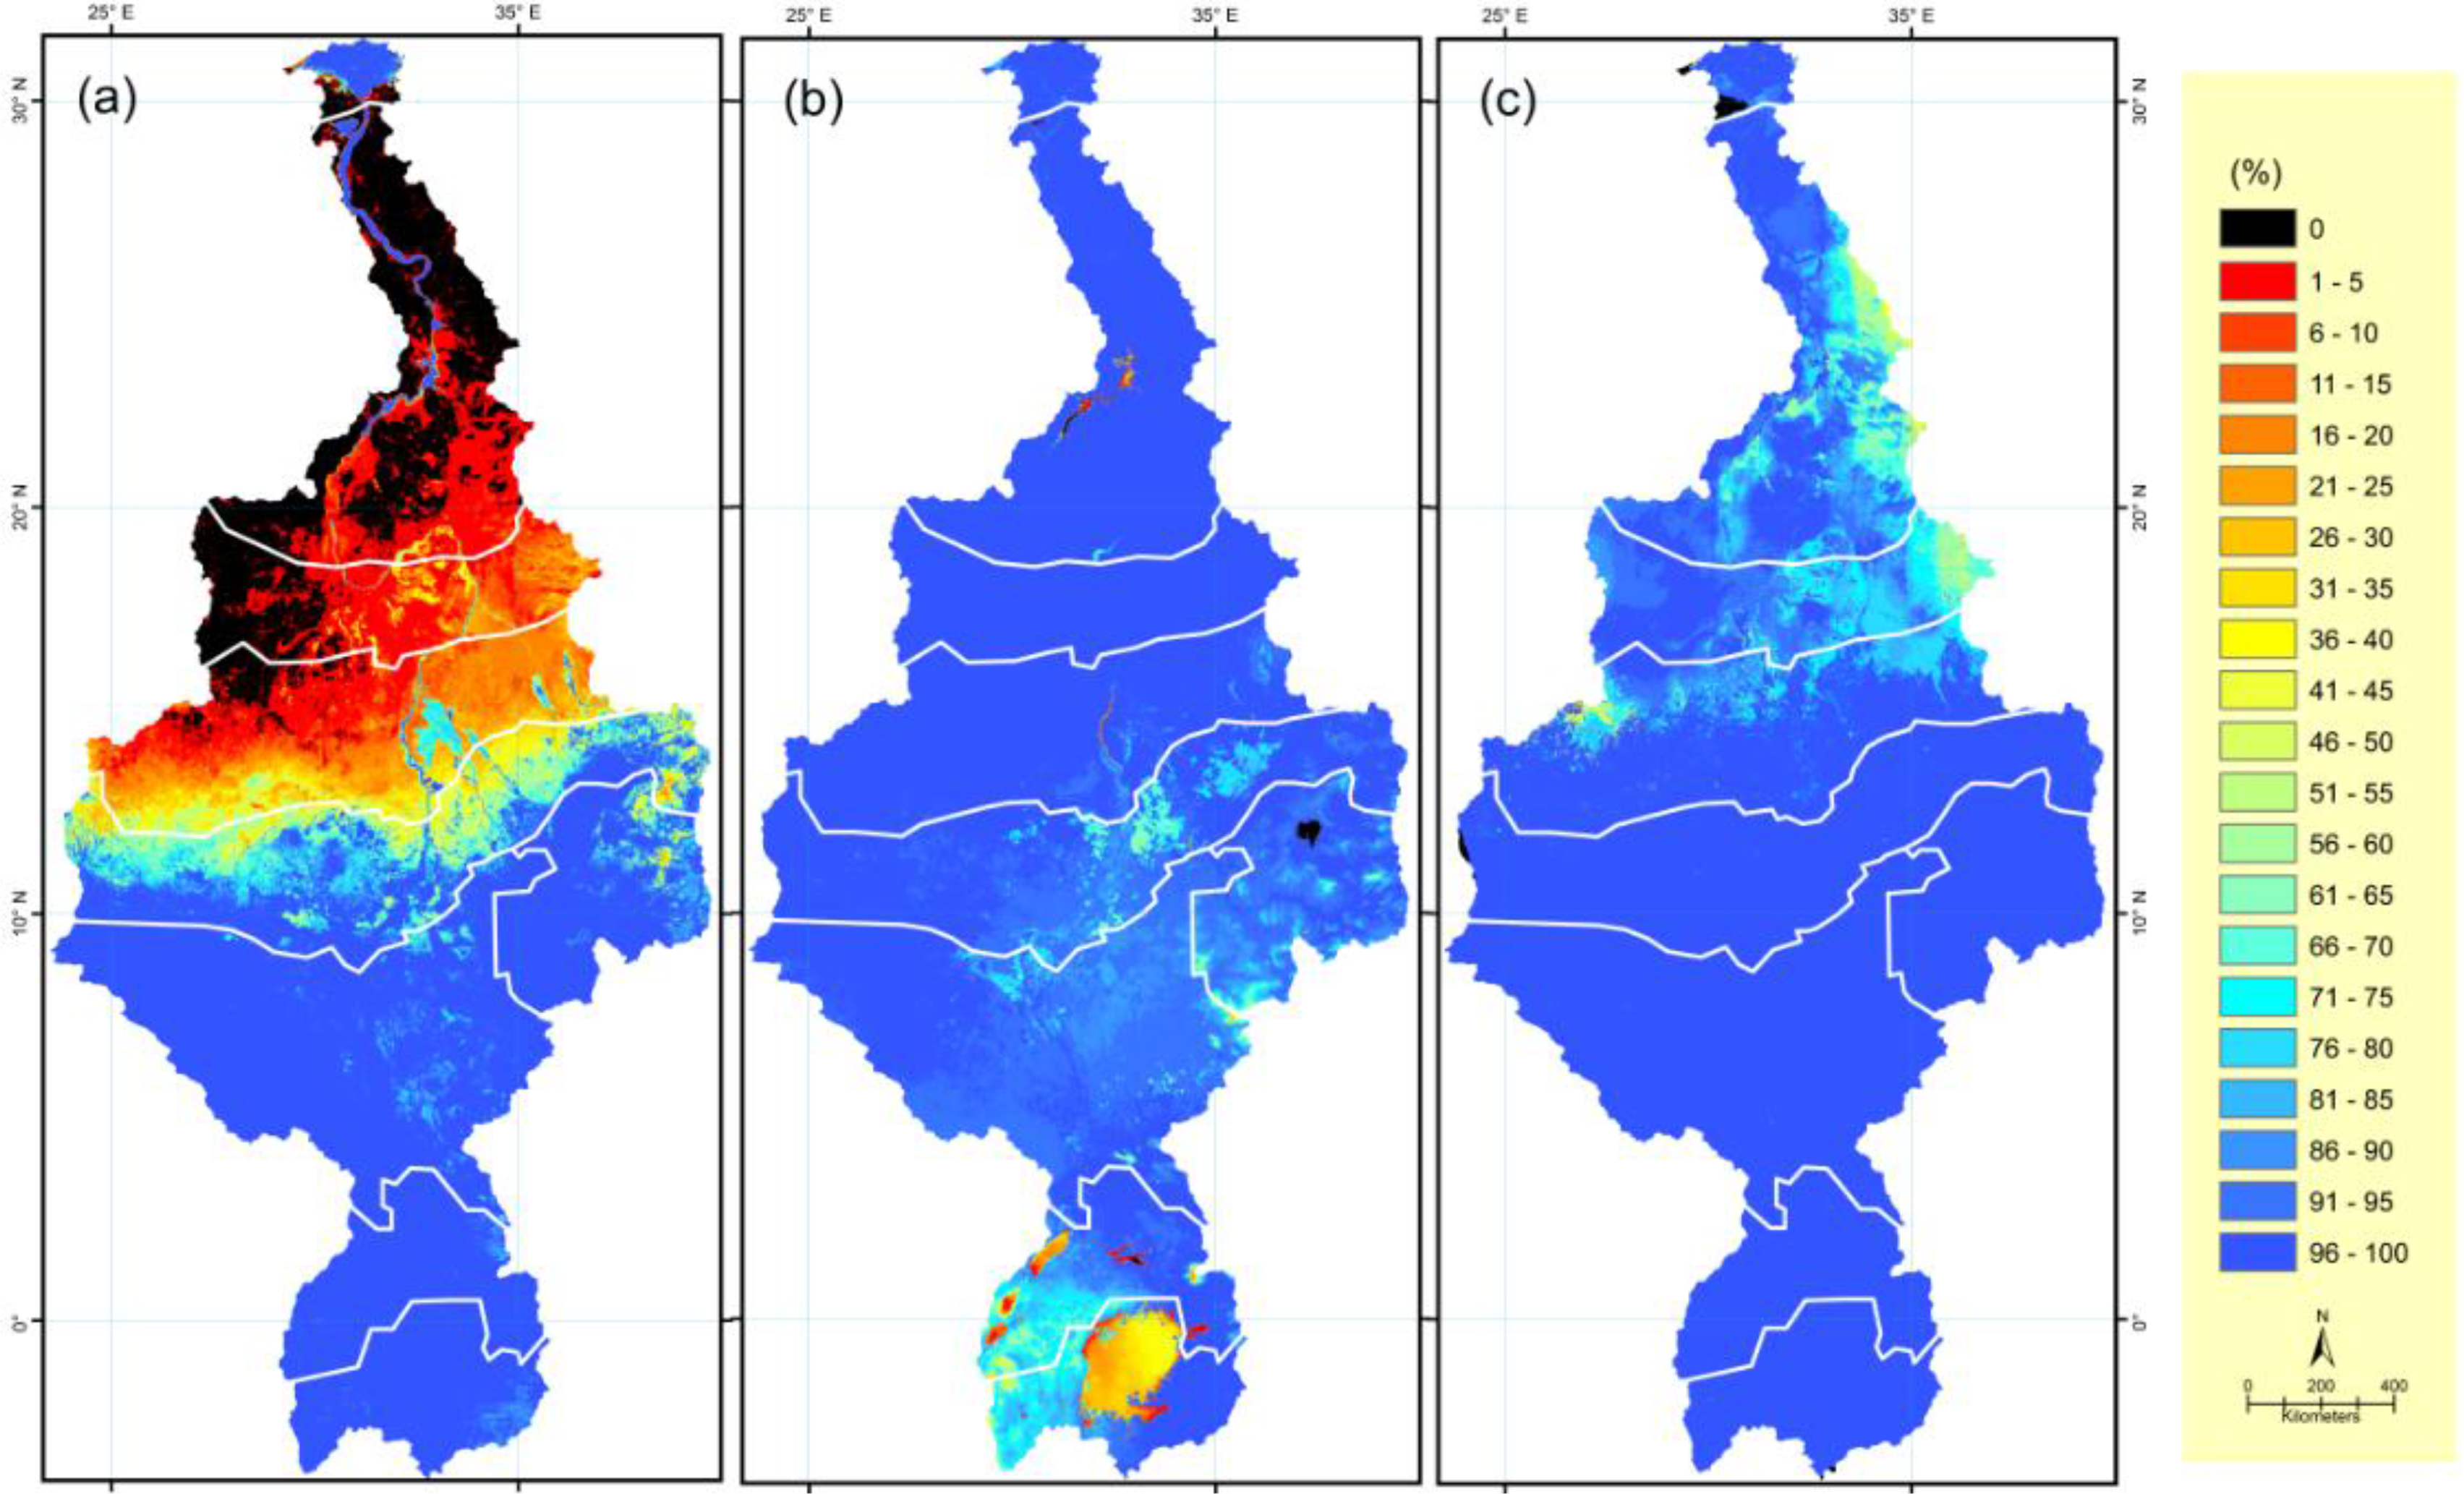
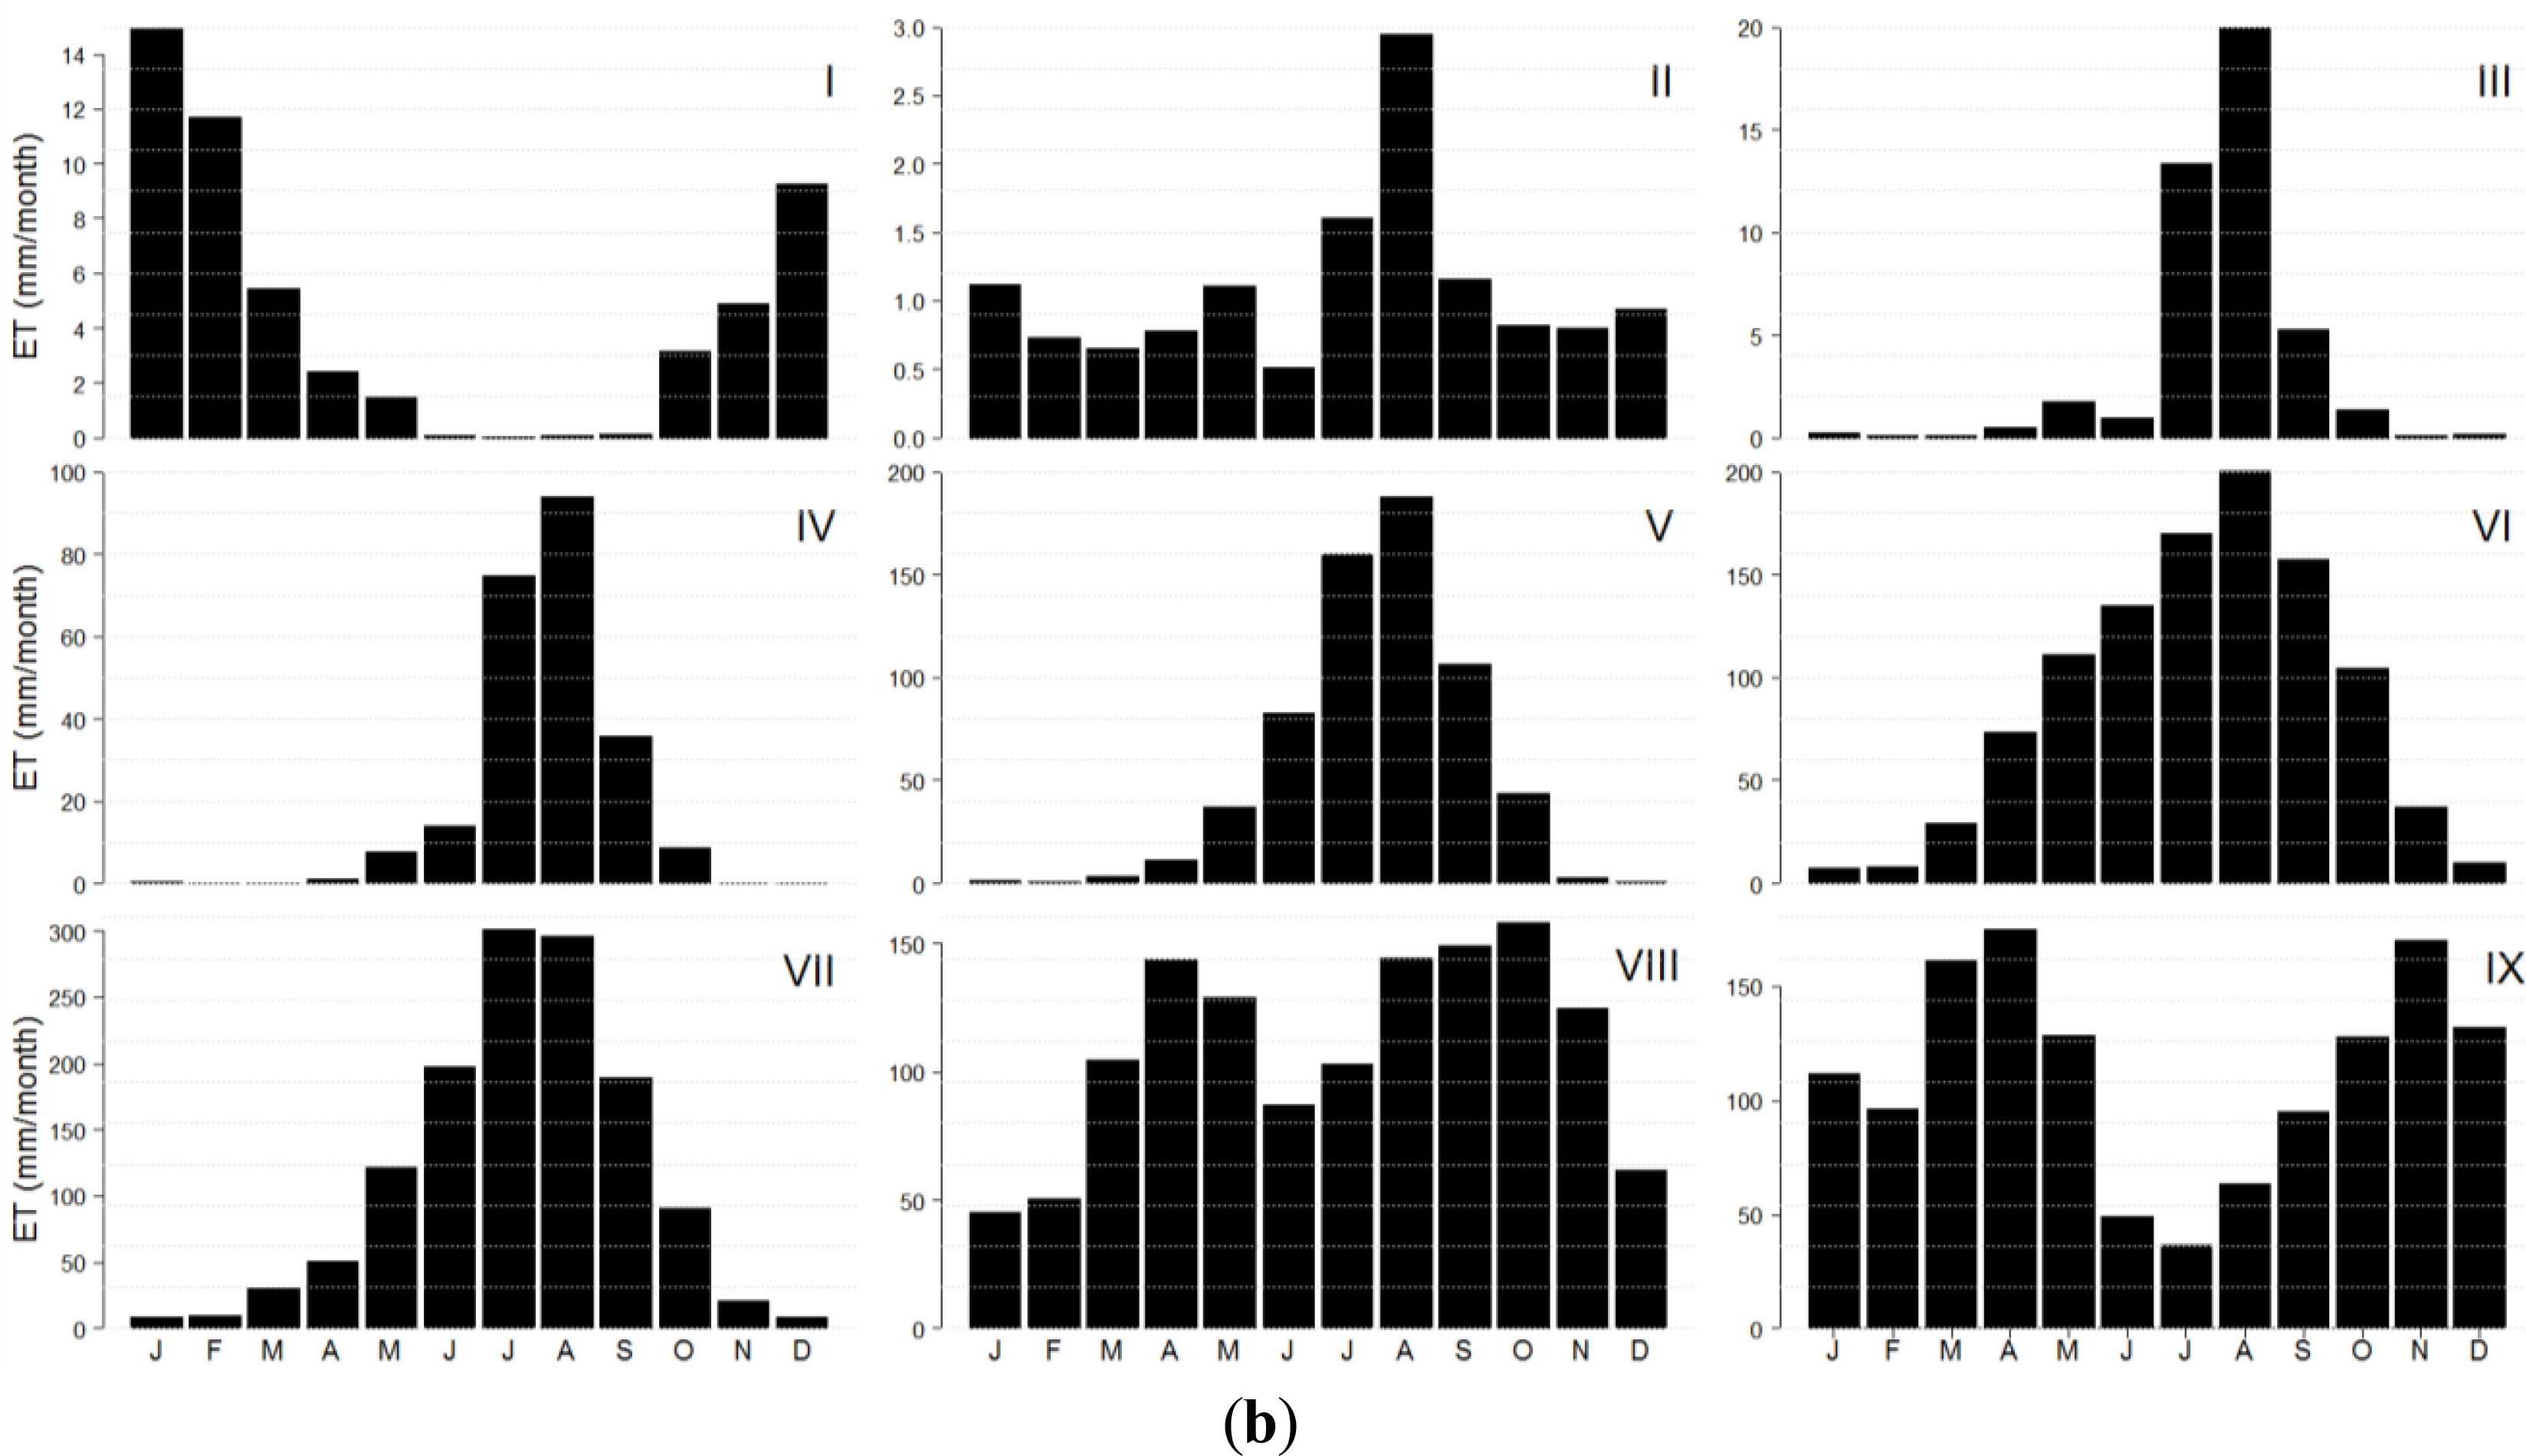
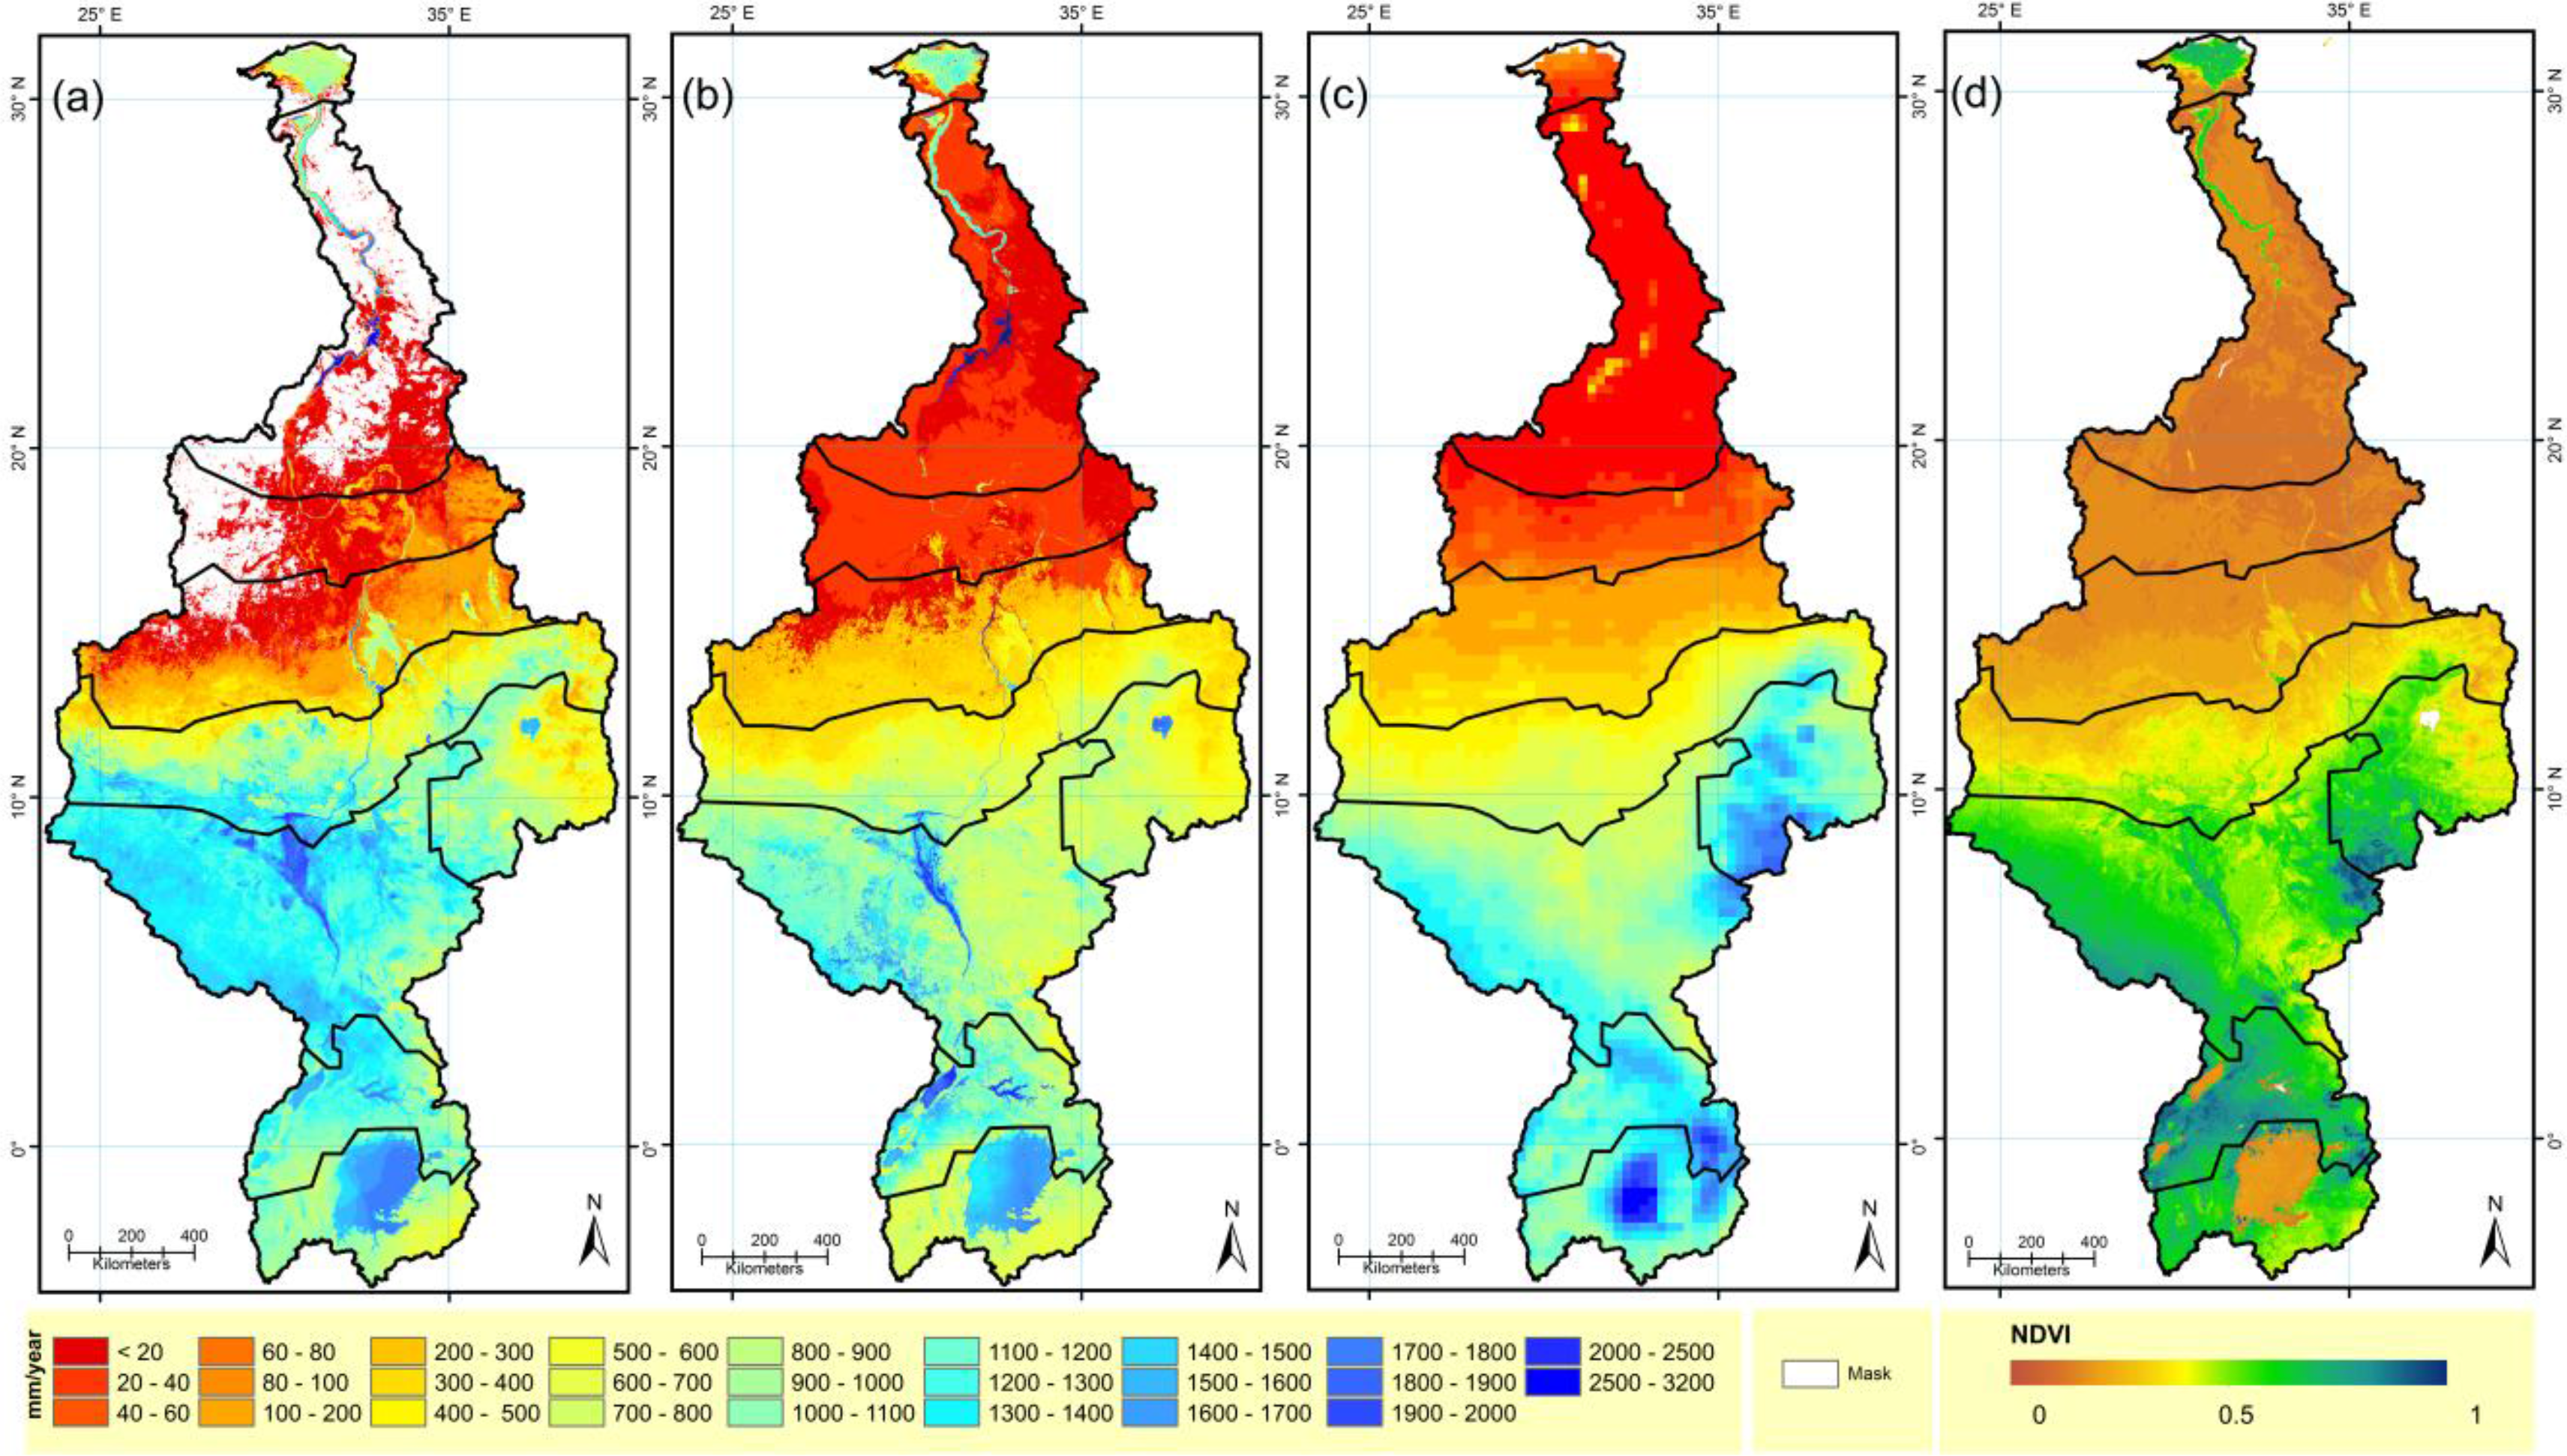
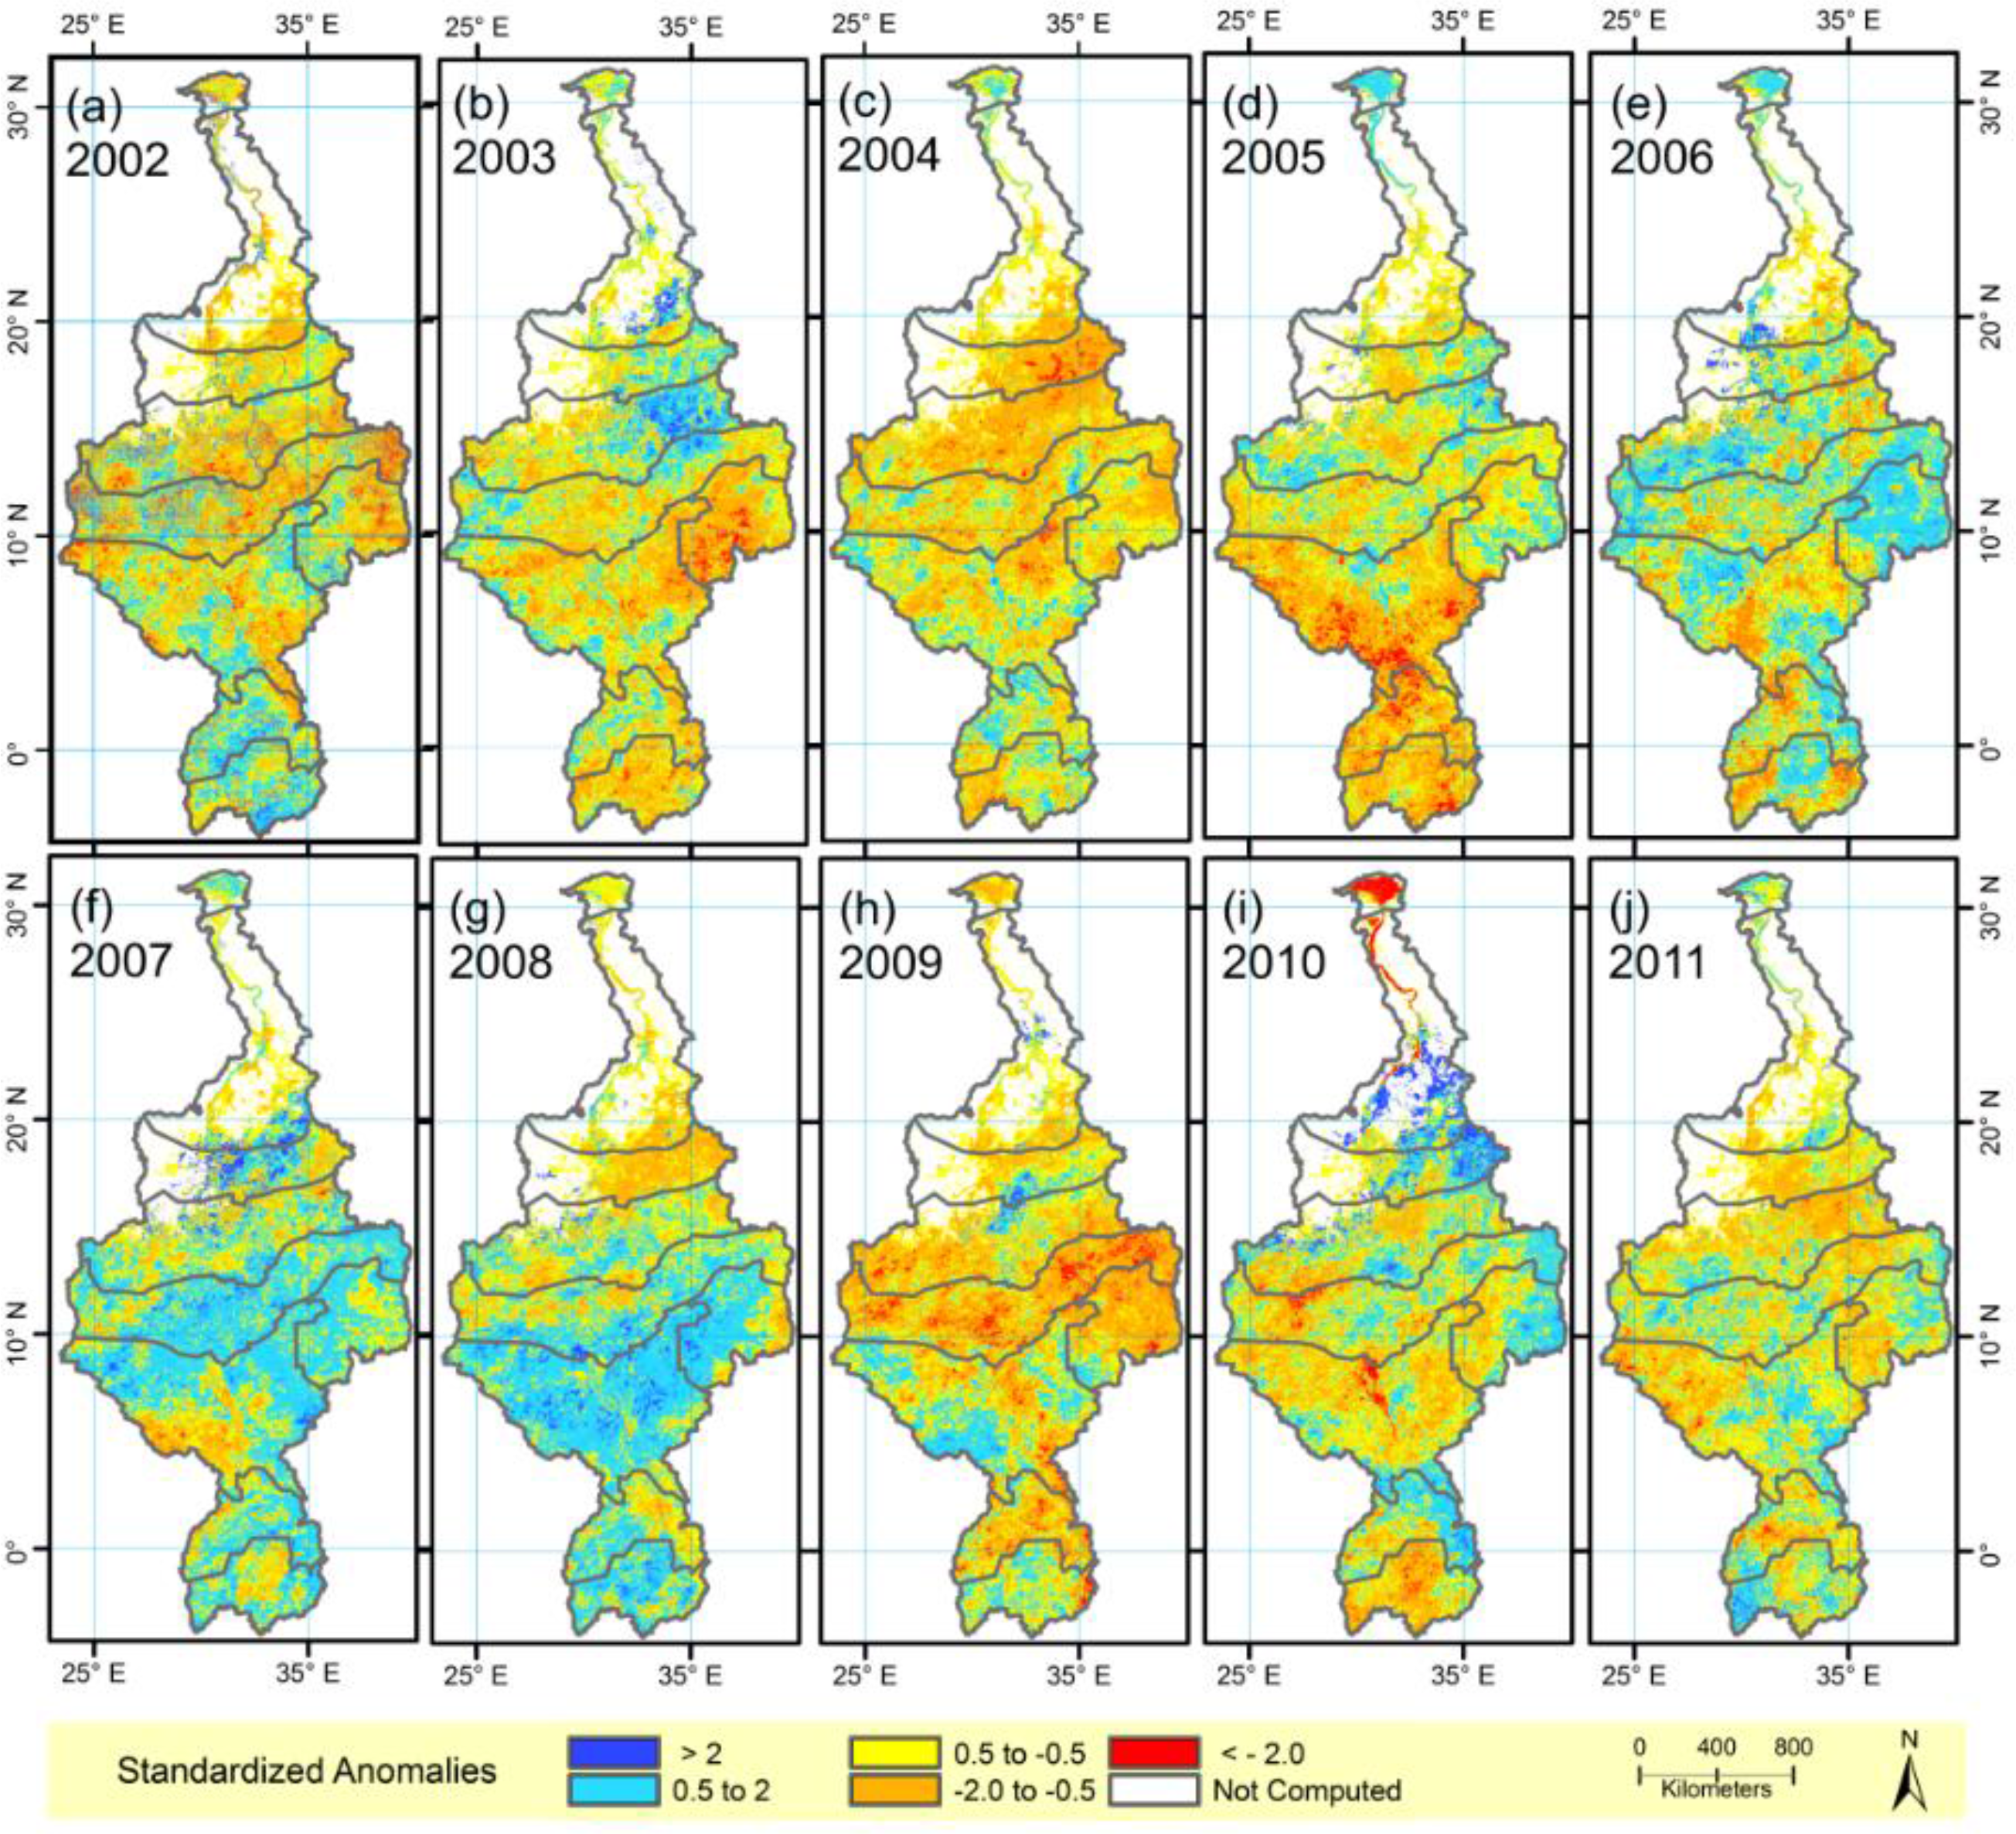
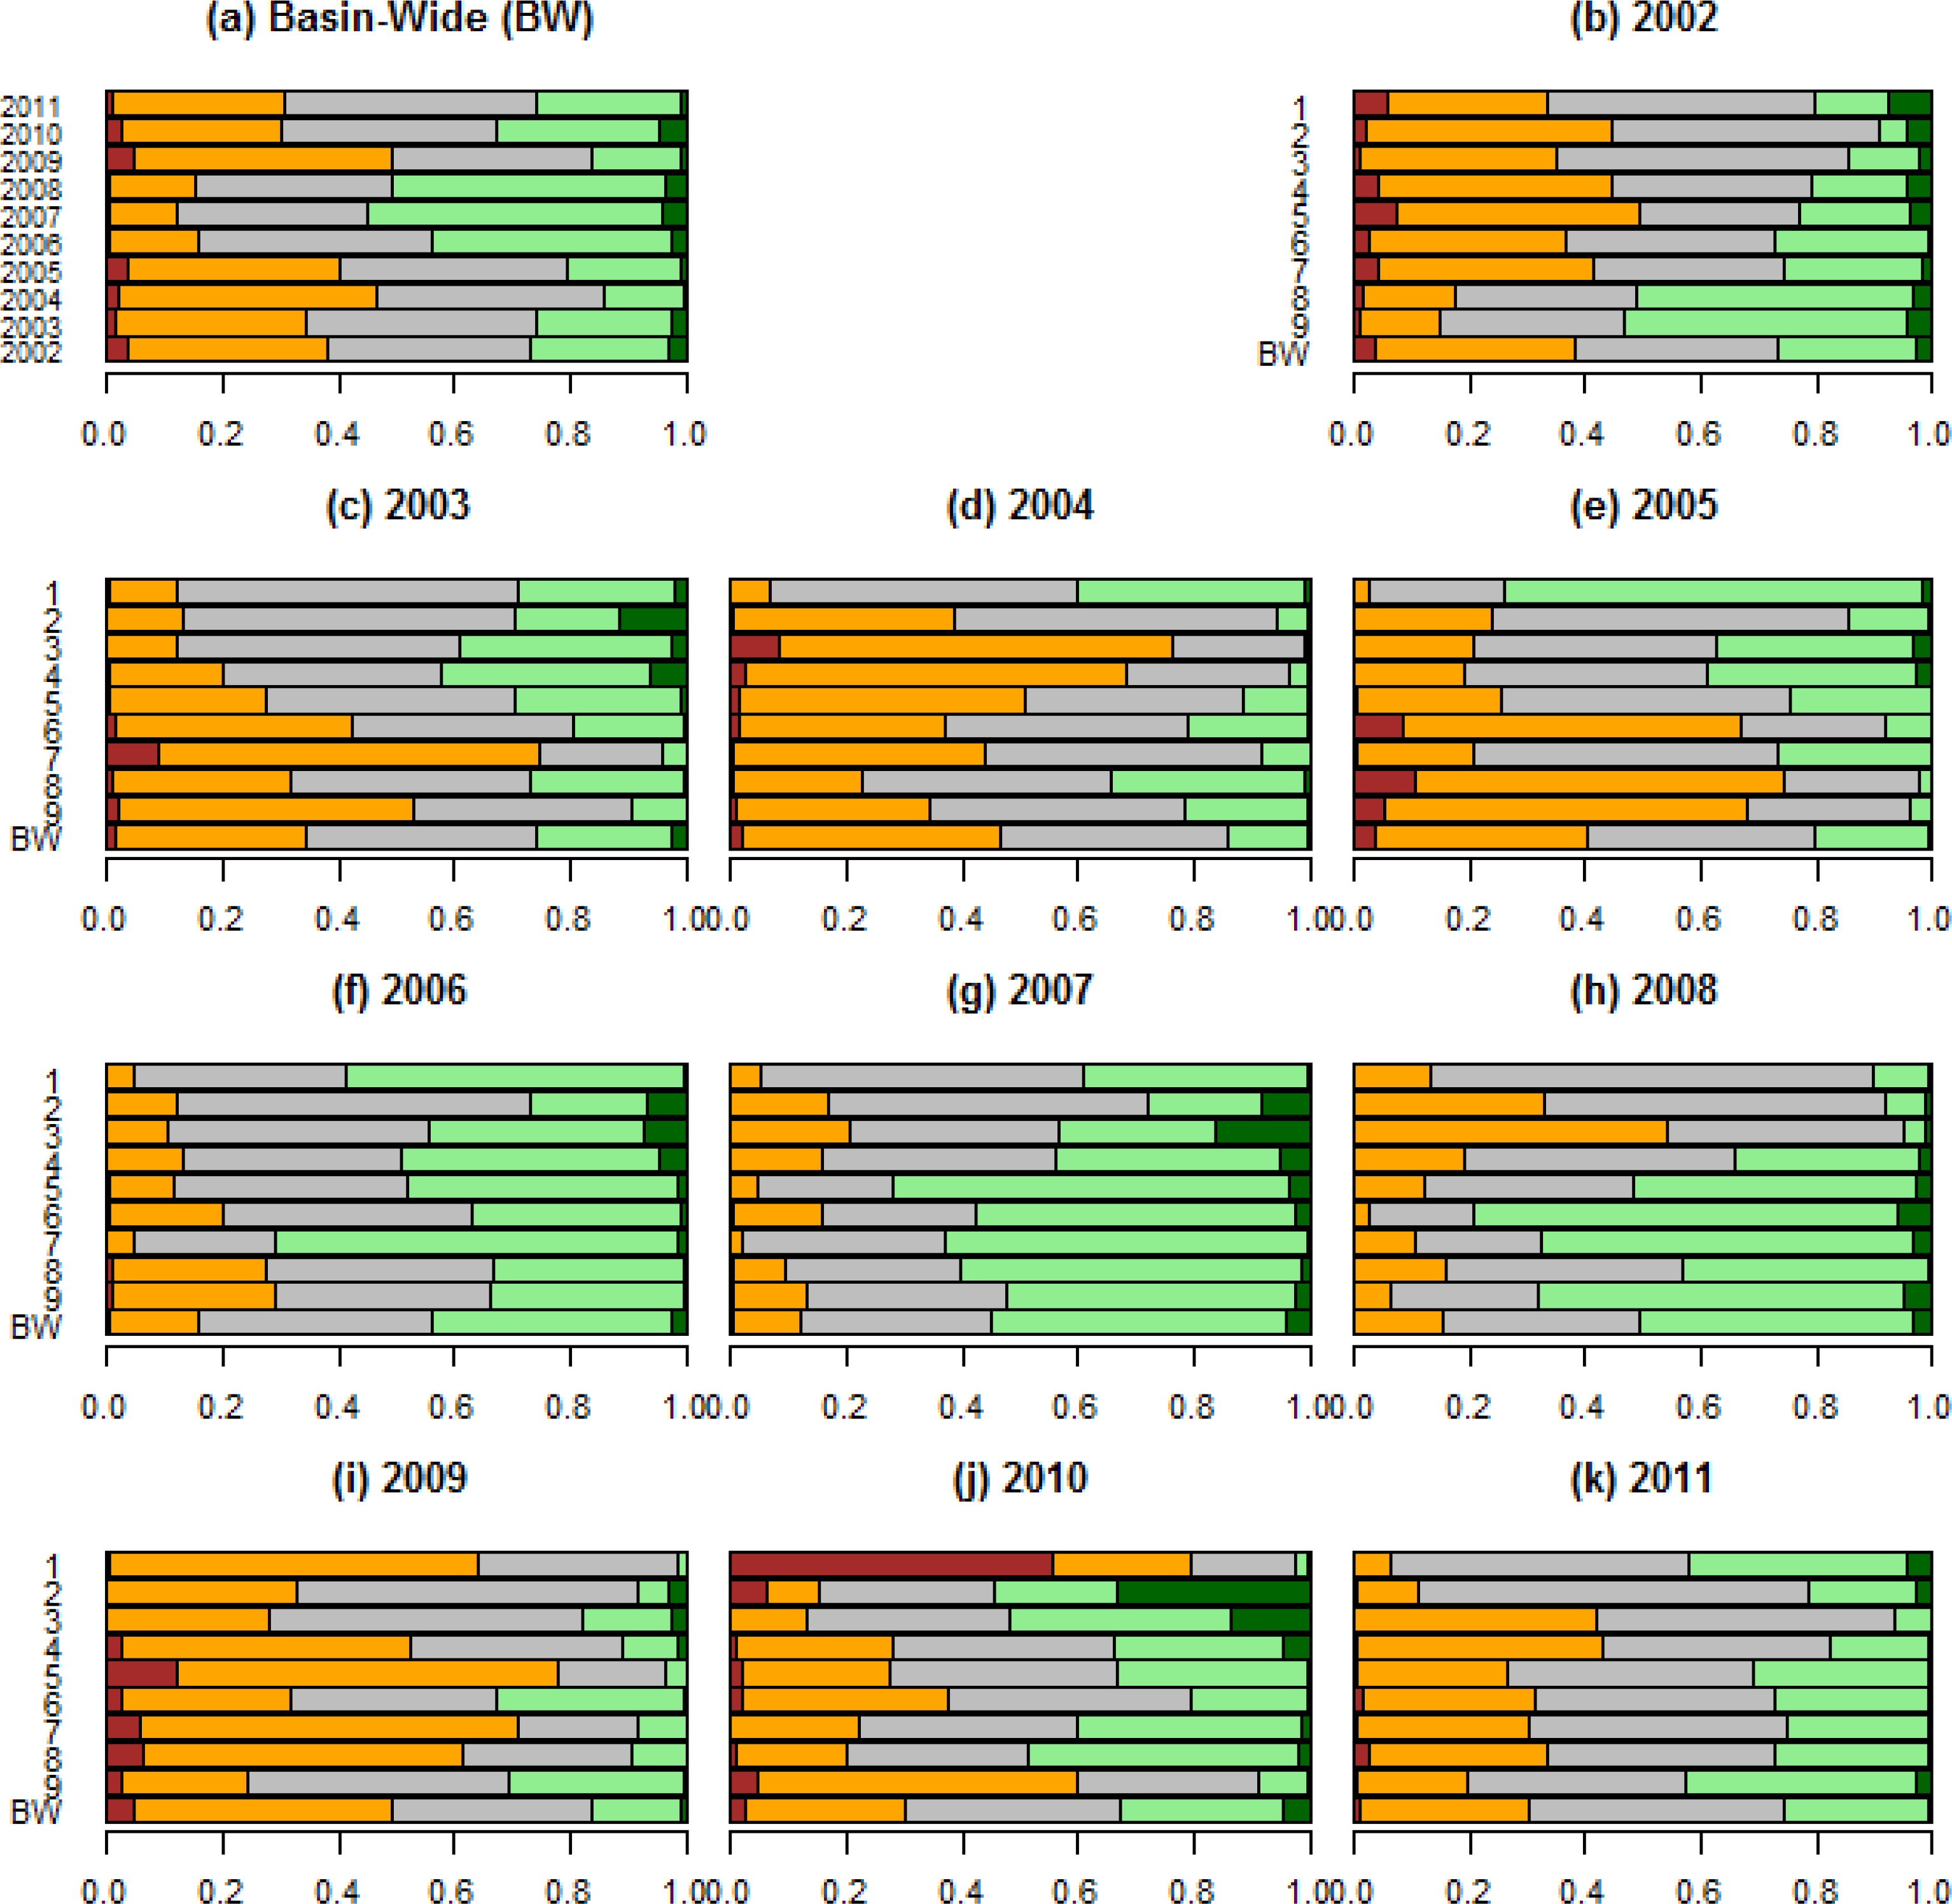
3.1. Basin-Wide ET Dynamics
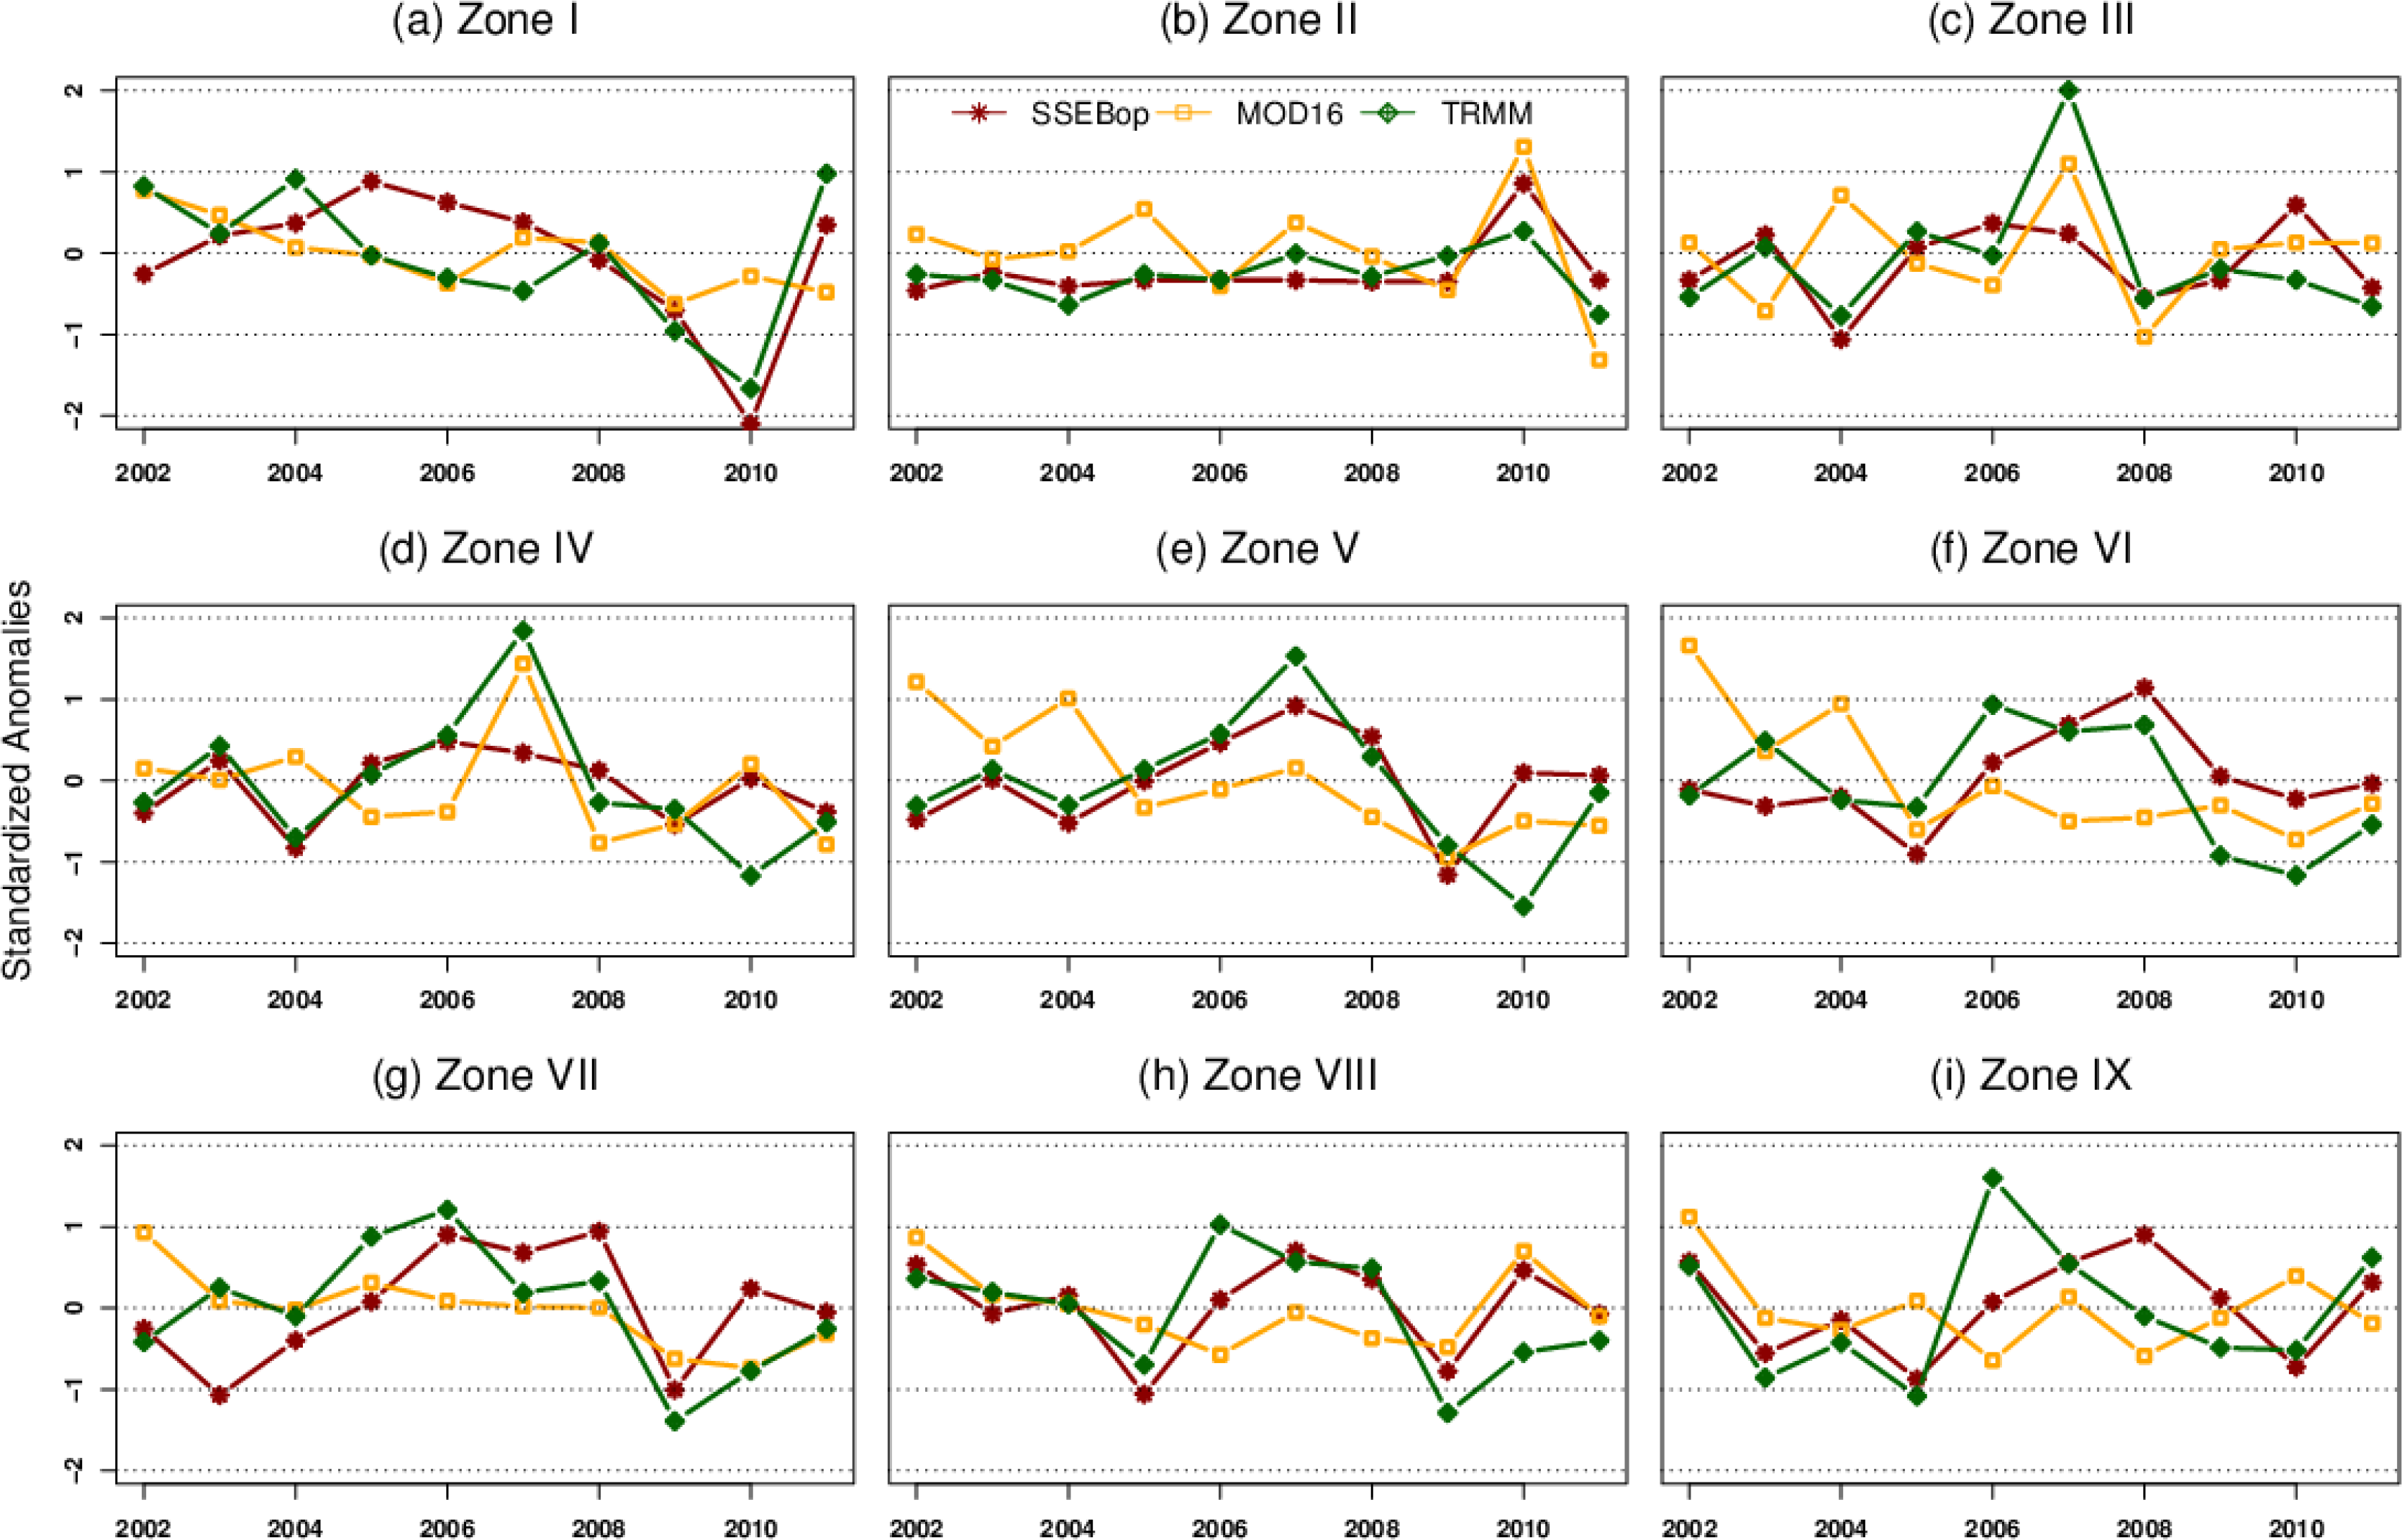
The results of the interannual anomaly analysis, visually illustrated in Figure 4, conducted using thermal-based ET data (SSEBop) revealed two temporally distinct dry periods (2002–2005 and 2009–2011) and a wet period (2006–2008) that characterized ET dynamics in the Nile Basin. About 30%–50% of the study area (86% of the total basin area) exhibited dryness (negative ET anomalies < −0.5) during the dry periods; while a minimum of 40% exhibited wetness (positive ET anomalies > 0.05) during the three consecutive wet years. Basin-wide, the driest years are 2004, 2005 and 2009 (∼40%–50% exhibiting dryness); while 2007 and 2008 constitute the wettest years (∼50% exhibiting wetness). The degree of severity of dryness/wetness and proportional areal extent of affected regions basin-wide and for each of the nine climate zones are summarized in Figure 5. Furthermore, the analysis also revealed that the areal extent of high degree severity level dryness (negative ET anomalies < −2) and wetness (positive ET anomalies > 2) affected regions do not exceed 5% of the study area during the study period (Figure 5a).

3.2. Drivers of ET

3.2.1. Effects of Climate on ET

Across the basin, the relationships between ET and TRMM rainfall variabilities are influenced by climate, but this relationship also depends on the type of ET data used. Figure 6 shows a time series of standardized annual anomalies for SSEBop, MOD16 and rainfall averaged over each of the nine climate zones. Strong interannual variabilities are observed (especially in SSEBop ET and rainfall) in temporal harmony with the dry and wet periods across the arid, tropical and equatorial regions of the basin. In Zone I, where rainfall is minimal except at northern coastlines, a strong negative anomaly was observed in SSEBop ET and rainfall in 2010, while MOD16 ET appears to show relatively minimum variability throughout the study period (Figure 6a). Nonetheless, the disagreement in the variability between MOD16 ET and rainfall in Zone I is not unexpected, as this zone is an extensively irrigated region with minimal rainfall. In Zone II (Figure 6b), the anomalies from SSEBop, MOD16 and rainfall all peaked in 2010, while showing relatively minimum variability for the rest of the time period. In Zones III and IV, MOD16 and TRMM rainfall show temporal harmony during the wet period, both peaking in 2007; while this peak is absent in SSEBop (Figure 6c,d). However, MOD16 exhibited temporal disharmony with rainfall anomalies for the rest of the year in those zones. In Zones V and VI (Figure 6e,f), with the exception of a few discrepancies, SSEBop and rainfall showed agreement. Overall, the variability in annual MOD16 anomalies in the mainly arid to rainy parts of the basin (Zones V–IX) failed to agree with the variability observed from annual SSEBop ET and TRMM rainfall anomalies. On the other hand, a statistically significant relationship was observed between zonally-averaged SSEBop ET and rainfall variabilities.
Table 1 shows correlation results between zonally-averaged annual anomalies of SSEBop ET versus TRMM rainfall, as well as MOD16 ET versus TRMM rainfall. SSEBop ET anomalies showed a weak positive temporal association with corresponding rainfall anomalies in four zones (I, II, V and VIII) with the correlation coefficients ranging between r = 0.61 to 0.67 at a statistical significance of p < 0.05. On the other hand, corresponding MOD16 ET anomalies showed statistically significant correlation with rainfall only in Zone II. The fact that zonal anomalies of SSEBop and TRMM exhibited a statistically significant relationship in four of the nine climate zones, while that of MOD16 exhibited in only one, indicates that results of the analysis are affected by data type.

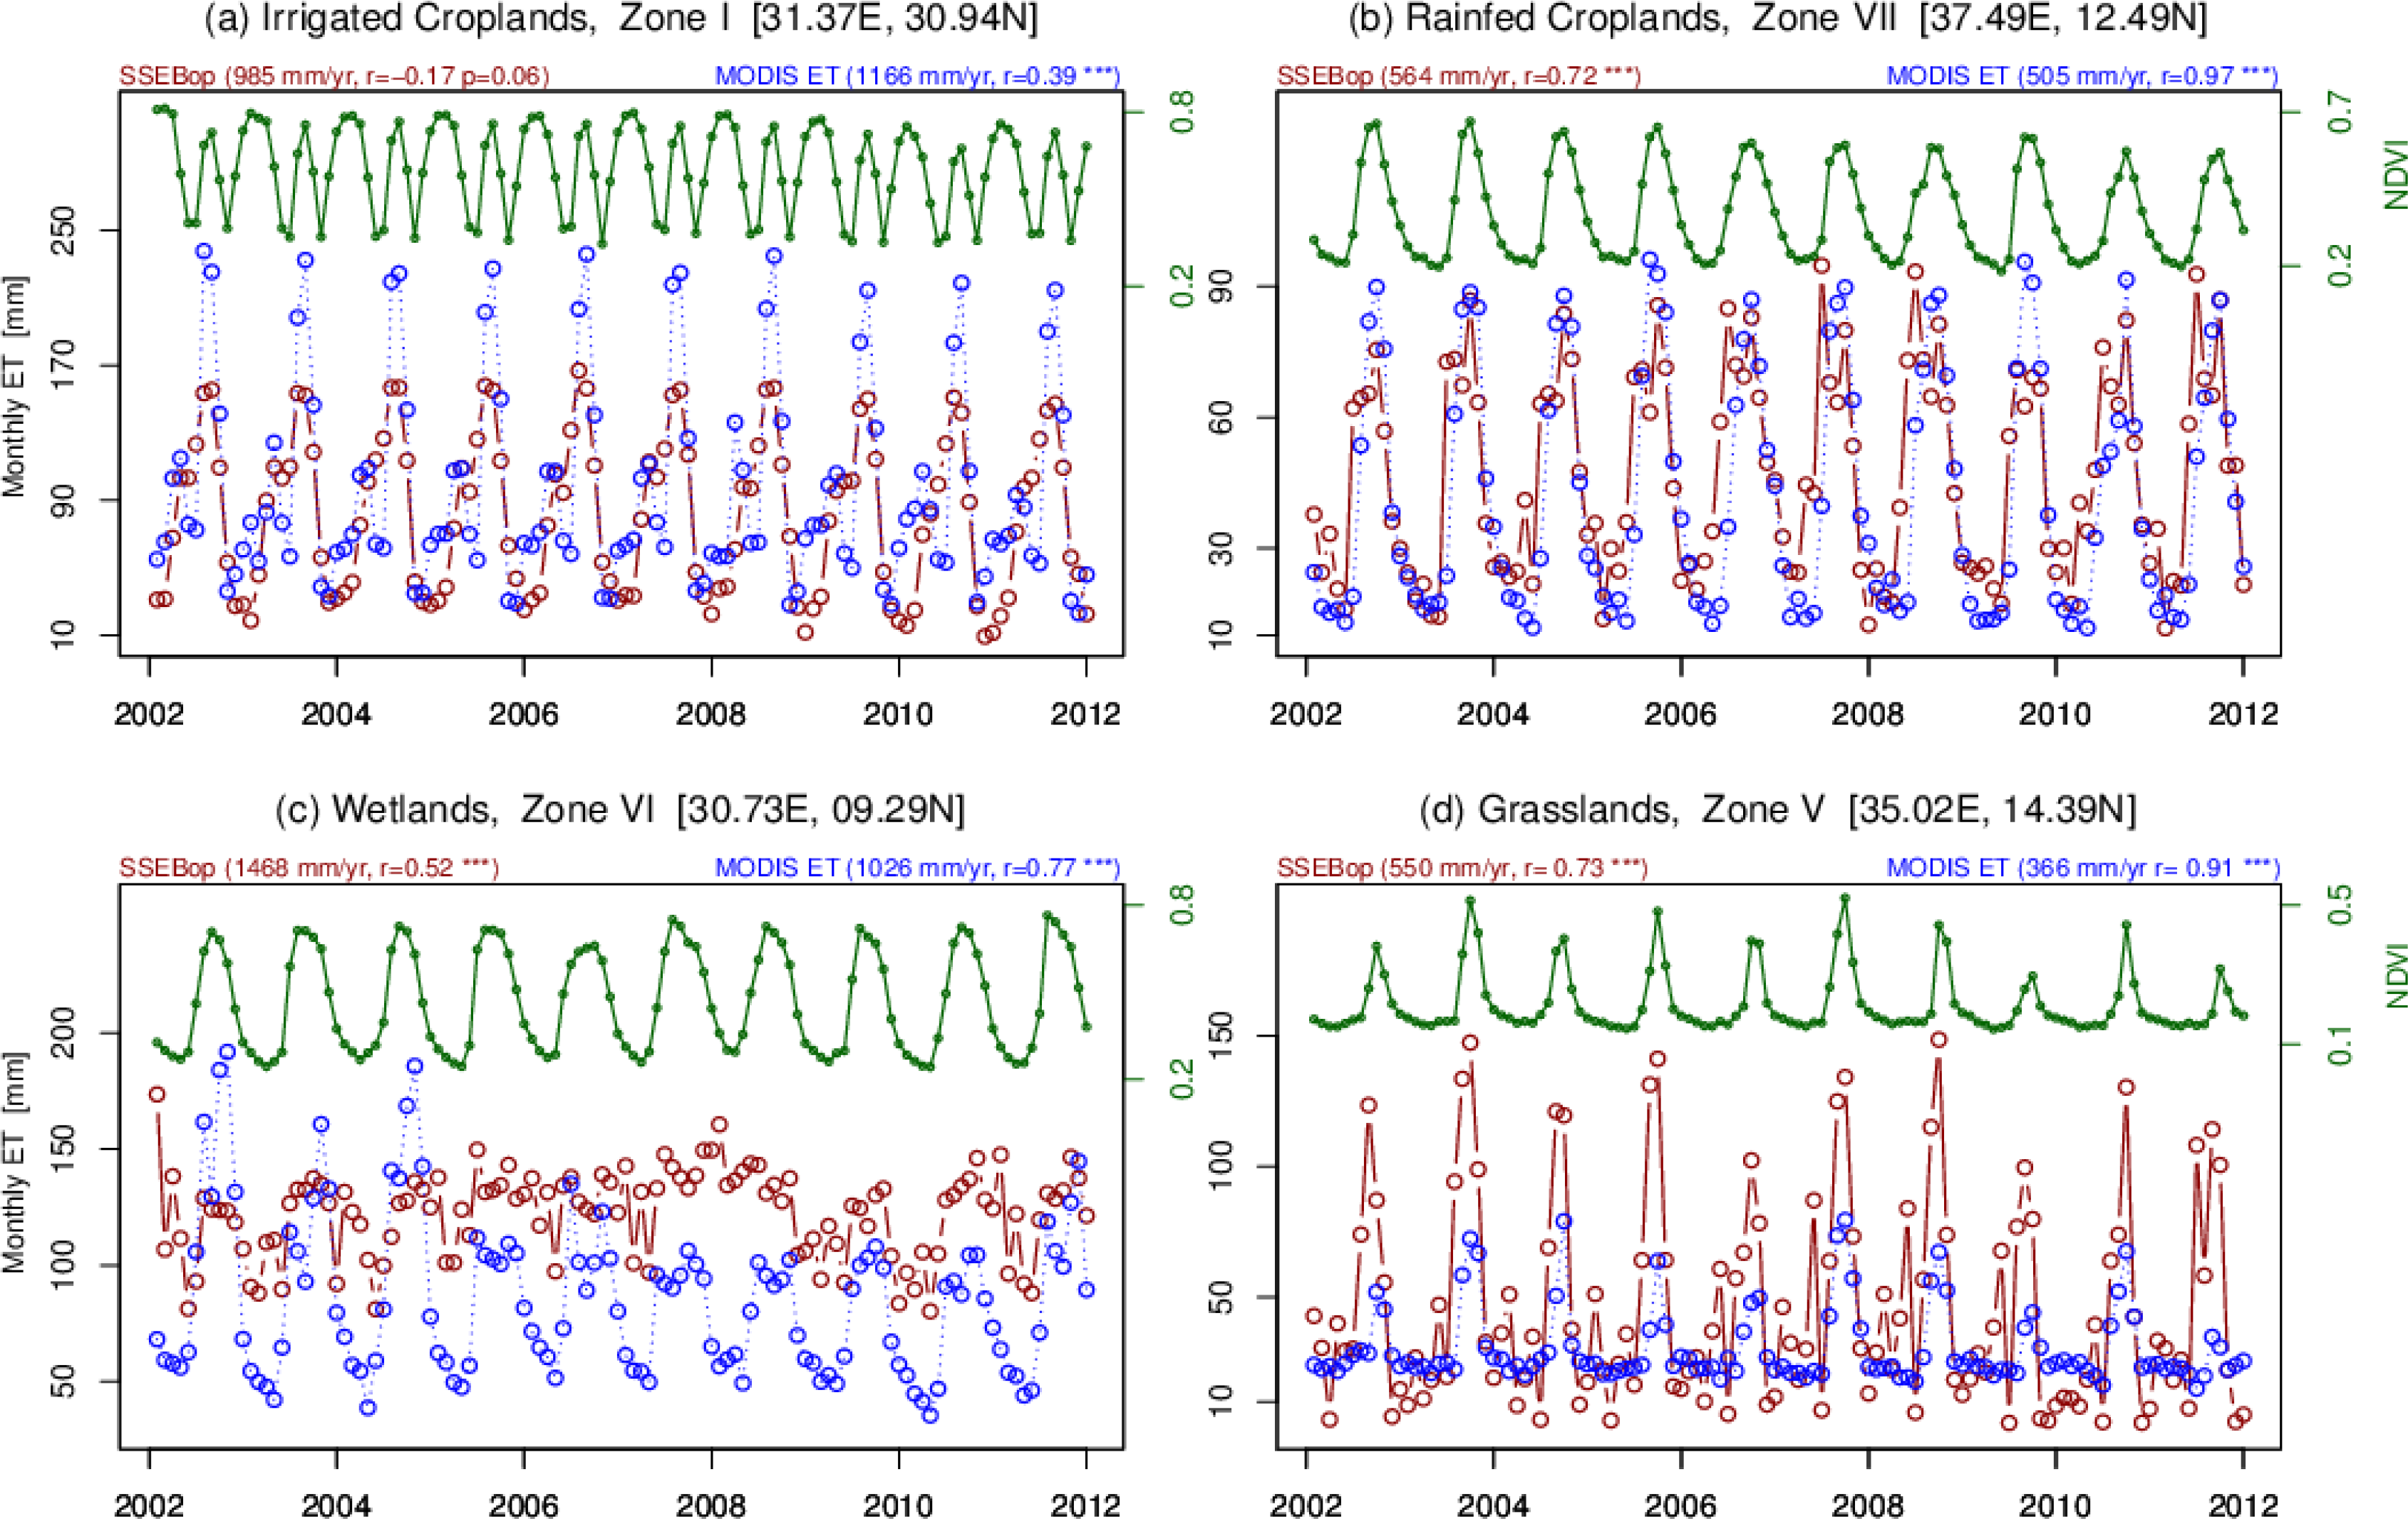
3.2.2. Effects of Vegetation on ET

The relationship between vegetation productivity dynamics and ET (SSEBop and MOD16) in different climate zones is presented in Figure 7. Both similarities and discrepancies were observed in a manner that the SSEBop and MOD16 monthly values relate with the seasonal variability of vegetation productivity. SSEBop and MOD16 temporally correlate with vegetation productivity in Zones VII and V (Figure 7b,d). However, they reveal discrepancies in Zones I and VI (Figure 7a,c). In Zone I in particular, MOD16 clearly captures the seasonality in vegetation dynamics by capturing the two peak seasons, while SSEBop distinctly captures only a single peak season (Figure 7a). Generally, MOD16 shows better correlation with vegetation productivity in different climate zones with statistical significance of p < 0.001.

3.2.3. Effects of Land Cover on ET

Time series of monthly ET estimates from SSEBop and MOD16 from selected land cover/land use types (irrigated and rainfed croplands, wetlands and grasslands) is presented in Figure 7. In irrigated croplands, monthly estimates of SSEBop and MOD16 show significant inconsistencies in seasonality and magnitude (a difference of ∼80–90 mm/month) during the peak season (months of July and August), but agree during the rest of the seasons (Figure 5a). However, in rainfed croplands (Figure 7b), they show similarity both in magnitude and seasonality. Estimates from SSEBop and MOD16 also agree in seasonality in wetlands (Figure 5c) and grasslands (Figure 5d), but differ significantly during peak seasons.

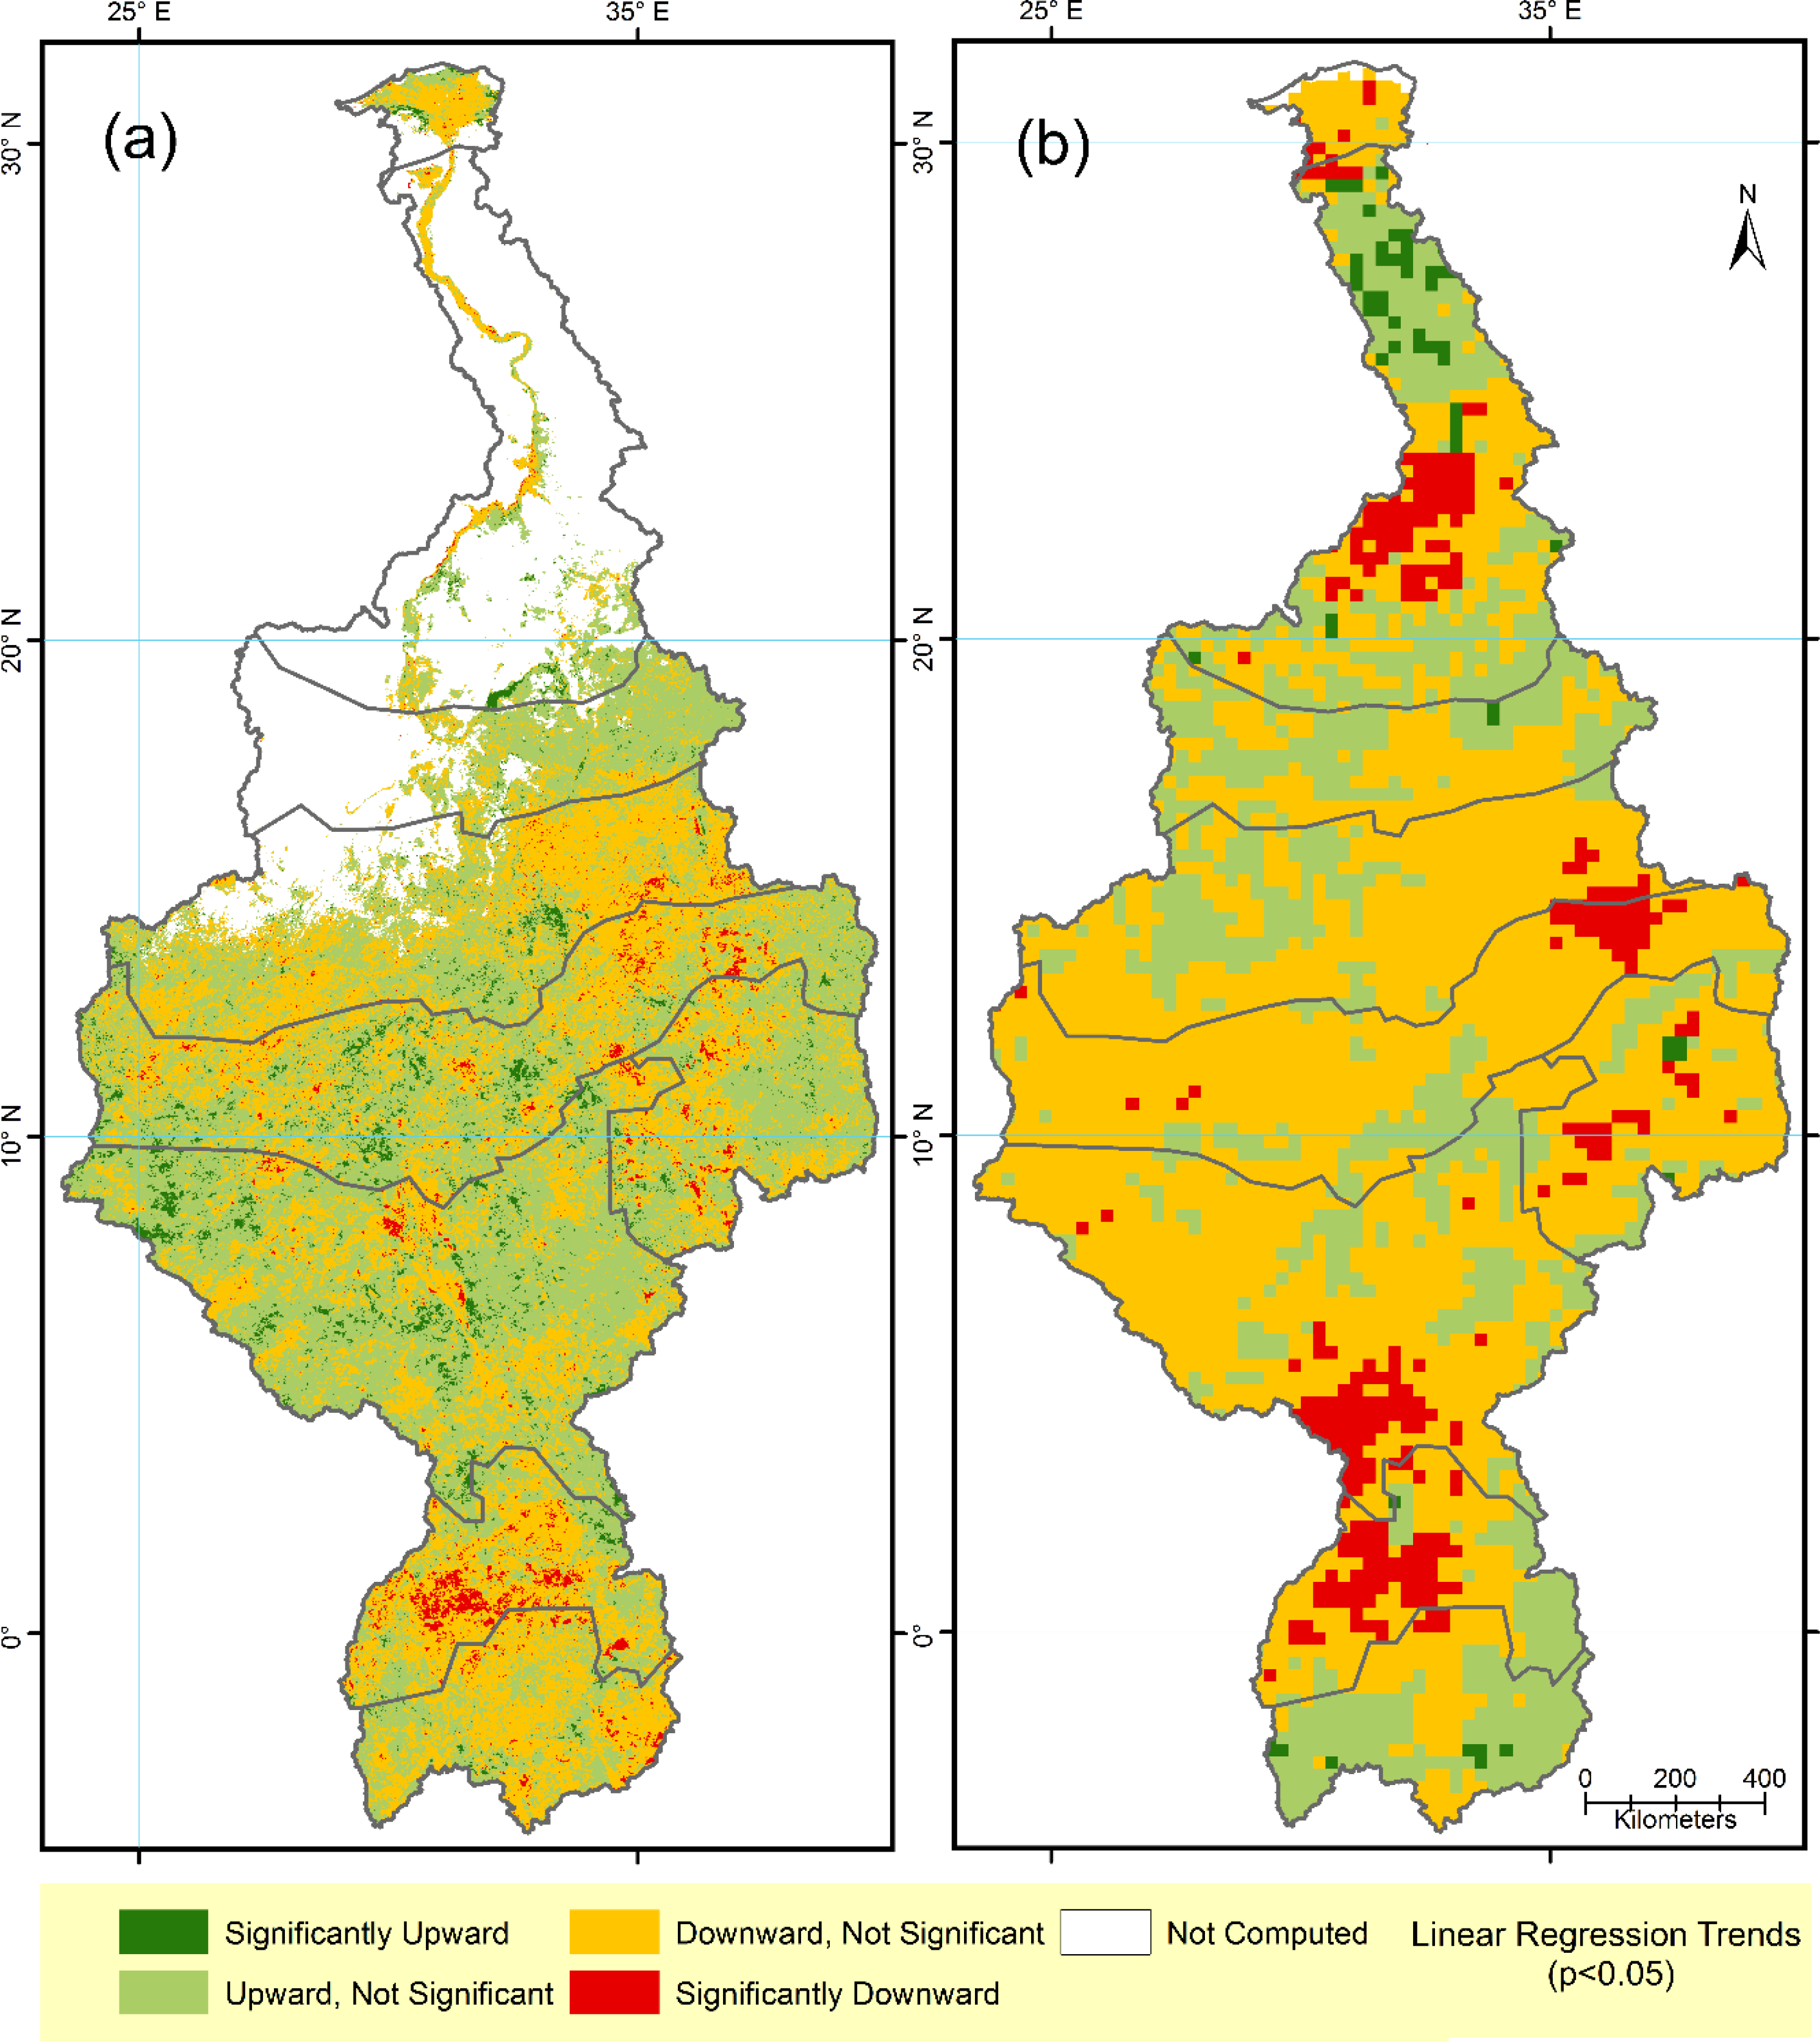
3.3. Trends in ET and Rainfall

The linear regression temporal trend analysis related annual ET and rainfall to time for the decade of 2002–2011 as illustrated in Figure 8. The ET decadal trend map (Figure 8a) revealed a non-significant trend at 95% statistical significance level for nearly the entire basin, except for a few small, mostly scattered, localized areas.
Of the total basin region with valid ET pixels, only 2.3% and 3.4% of the pixels were characterized as significantly downward and upward trends, respectively, at the 95% statistical significance level. The regression test also detected trends in the remaining regions of the study area (∼94%, 40% negative, 54% positive), but those are not statistically significant. Nonetheless, interpretation of the results from the linear regression trend test should cautiously take into account the relatively short study period of 10 years.
The regions of central Uganda in the Equatorial Lakes Region in Zone VIII indicated the most conspicuous area characterized by downward trends (Figure 8), while limited and scattered areas in the western Ethiopian Highlands (Zone VII) and eastern Sudan (Zone V) also revealed downward trends. Significant upward trends characterized very limited and localized areas and were scattered across the regions of central Sudan and South Sudan (Zones V and VI). In the northern part of the basin, the Nile Delta (Zone I) and the Nile Valley (Zone II) regions showed largely no-significant trend, except in the eastern/western fringes of the Nile Delta, which showed significant upward trends. Figure 8b illustrates the trend analysis results for rainfall across the basin. The rainfall trend map reveals detected downward rainfall trends in Zone VIII, southern parts of Zone VI, eastern parts of Zone V and scattered areas in western parts of Zone VII. However, no statistically significant upward trends in rainfall were detected in the basin (Figure 8b).

4. Discussion

4.1. ET Dynamics

The interannual SSEBop ET anomaly maps presented in Figure 4 showed basin-wide ET dynamics during the study period. While 2004 and 2009 were found to be relatively the most dryness-dominated years of the decade (2002–2011) basin-wide, 2009 particularly stood out as the driest year when key headwater regions of the basin exhibited considerable dryness (Figures 4c,h and 5a). Viste et al. [74] recently noted 2009 as the driest year of the region in nearly three decades where large-scale drought patterns dominated large parts of east Africa. Key headwater regions of the basin that were considerably affected by dryness in 2009 included the Blue Nile basin (Zone VII, ∼70% exhibiting dryness), the Tekezze/Sobat basin (eastern parts of Zone V, ∼80% exhibiting dryness) and the Equatorial Lakes Region that includes Lake Kyoga-Albert-Aswa basin (Zone VIII, >60% exhibiting dryness) and Lake Victoria basin (Zone IX, >20% exhibiting dryness). Furthermore, the Blue Nile basin region of the Ethiopian Highlands (Zone VII) exhibited dryness in 2002/2004 (>40% exhibiting dryness) and 2003/2009 (>70% exhibiting dryness). As the Blue Nile basin region provides a substantial portion of the Nile water to the basin, substantial droughts in Zone VII could have consequences downstream. The Equatorial Lakes Region exhibited considerable dryness in 2005 (>70% of Zones VIII/IX exhibiting dryness), 2009 (>60% of Zone VIII exhibiting dryness) and 2010 (∼60% of Zone IX exhibiting dryness). The extensive dryness (>70% of each zone) in the lower parts of the basin (Zones VI, VIII and IX) in 2005 is probably the consequence of a rainfall deficit in the region [75].
The consequence of extensive dryness basin-wide and, particularly, in the key headwaters of the Nile Basin in 2009 manifested downstream in Zone I in the Nile Delta in 2009 (60% exhibiting dryness) and 2010 (80% exhibiting dryness and 60% severe dryness), as illustrated in Figures 4h,i and 5i,j. Because rainfall in Zone I is minimal (Figure 1b), a plausible explanation for the considerable dryness in 2009 and 2010 in the Nile Delta is a possible economization of irrigation water, as inflow into the Aswan High Dam Reservoir declined in 2009.

4.2. ET Drivers

The relationship of the zonal average of annual anomalies of SSEBop ET and TRMM rainfall per each climate zone (Figure 6) overall suggest that rainfall drives ET variability in the region, albeit there are a few discrepancies, depending on the climate zone. However, this is not consistent with the results observed from MOD16 ET to rainfall relationship. Moreover, because climate Zone I is principally and heavily irrigated agricultural field, where rainfall is minimal, no correlation is expected between rainfall and ET. Nonetheless, SSEBop anomalies showed statistically significant strong temporal harmony with rainfall anomalies in both arid and rainy regions (in four of the nine climate zones with r = 0.6 at p < 0.05); while MOD16 anomalies showed no statistically significant correlation with rainfall in eight of the nine climate zones (Table 1). The analysis clearly showed that the temporal relationship between ET and rainfall anomalies is more pronounced with SSEBop ET than MOD16 ET anomalies. This generally positive relationship between SSEBop ET and rainfall anomalies is in general agreement with Jung et al. [17], who recently showed a strong relationship between ET and soil moisture anomalies in east Africa.
The correlations between monthly ET versus vegetation productivity (Figure 7) depict the degree to which seasonal and interannual variabilities between the two variables are related. The strongest and statistically significant (p < 0.001) correlations, on the order of r = 0.7 (with SSEBop) and r = 0.9 (with MOD16), were observed in climate Zones V and VII; while the weakest correlations were in climate Zone I. The SSEBop monthly ET showed a negative correlation in Zone I and failed to temporally correlate with one of the two peak vegetation productivity seasons. This negative correlation could be the result of one or a combination of multiple reasons including climate (rain in Zone I is minimal), types of primary inputs data and the parameterization used in the model. In climate zones that get a fair amount of rain, however, both the SSEBop and MOD16 temporally correlated well with the seasonal variability in vegetation productivity with little discrepancies and stronger correlations.
Investigation of monthly ET variabilities from SSEBop and MOD16 over selected land cover types is presented in Figure 7. An analysis of monthly ET variability with respect to land cover revealed that the SSEBop and MOD16 estimates differed over irrigated croplands, grasslands and wetlands, but agreed in rainfed croplands. SSEBop showed that wetlands have the highest mean annual ET (1468 mm/yr), followed by irrigated croplands (985 mm/yr), rainfed croplands (564 mm/yr) and grasslands (550 mm/yr). On the other hand, for MOD16, the highest annual ET is from irrigated croplands (1166 mm/yr) followed by wetlands (1026 mm/yr), rainfed croplands (505 mm/yr) and grasslands (366 mm/yr). The largest discrepancy between SSEBop and MOD16 in annual estimates (a difference of ∼440 mm/yr) was observed over wetlands (Figure 7). On the other hand, monthly ET variability appeared to be high over cropped fields (very high for MOD16 over irrigated croplands), while small over wetlands for SSEBop and over grasslands for MOD16. This discrepancy in estimates of ET between SSEBop and MOD16 over different land cover types has also been shown by other researchers. Velpuri et al. [65] validated the two products in the CONUS and showed that both SSEBop and MOD16 underestimated over croplands. However, we found that over irrigated croplands, only SSEBop underestimated, while both gave similar estimates over rainfed croplands. Further, we found that monthly MOD16 estimates over irrigated croplands in Zone I generally agreed quantitatively with monthly estimates available in the literature [15]. On the other hand, SSEBop has significantly higher estimates than MOD16 over grasslands, especially during the peak seasons (Figure 7d). Velpuri et al. indicated that SSEBop provides a better estimate over grasslands than MOD16. Moreover, over deep-rooted vegetation cover, such as forest, Velpuri et al. found that SSEBop and MOD16 have an accuracy of R2 = 0.72 and R2 = 0.56, respectively, compared with ground-based observations. The discrepancy in monthly estimates between the two estimates persisted over wetlands (Figure 7c). While MOD16 estimates significantly and irregularly vary seasonally and annually from ∼200 mm/month to ∼100 mm/month, MOD16 estimates consistently stayed within 80–120 mm/month. A plausible reason for the significant difference between the two estimates could be in the input datasets that the two ET algorithms use: SSEBop uses land surface temperature as its primary input and is independent of the impact that frequent flooding has on vegetation that may affect the ET. On the other hand, MOD16 uses vegetation information in its algorithm, and consequently, the ET results could reflect the changes in vegetation.

4.3. Trends in ET and Rainfall

The detected temporal trend results reveal that the overall annual ET trend during 2002 to 2011 in the Nile Basin can be characterized as no-significant trend, except for a few parts (Figure 8). The most conspicuously affected region is the Equatorial Lakes Region, where statistically significant downward trends were observed in substantial areas of Zone VIII (the region in Uganda surrounded by the tri-lakes: Lakes Victoria, Albert and Kyoga). Western parts of the Ethiopian Highlands and eastern Sudan (Zones V and VII) also showed a few defragmented localized regions of a downward trend. In the northern part of the basin, no significant trends are detected, except around the fringes of the Nile Delta (Zone I). The fringes of the Nile Delta normally have less ET compared to the inland regions of the delta, as recently shown by Simonneaux et al. [41], but show an upward trend. This finding is in agreement with other studies that indicated increasing ET and vegetation productivity in newly reclaimed desert lands in the fringes of the Nile Delta following the expansion of irrigation agriculture in the last few decades [9,39,40,76,77]. On the other hand, the trend analysis on rainfall data showed no significant upward trend, but parts of Uganda (Zone VIII), South Sudan (Zone VI), the western Ethiopian Highlands (Zone VII) and eastern parts of Sudan (Zone V) showed a statistically significant downward trend in rainfall.

4.4. Uncertainties, Errors and Accuracies

Some degree of uncertainty in any model-based or satellite-derived parameter estimates is inevitable. Sources of uncertainties in remotely sensed ET estimates could be attributed to uncertainties in input data that can introduce biases in ET estimates, limitations and biases in the parameterization in the algorithm, cloud cover, errors arising from spatial and temporal scaling approaches, as well as influences from biophysical and geophysical factors, such as land cover and climate. Comparisons with ground-based measurements (which themselves have a reported uncertainty of 10%–15%) indicate that the various remote sensing techniques for estimating ET have uncertainties of 15%–30% [78,79]. A review of about 30 published validations of remotely sensed ET against ground-based flux towers reported an average Root Mean Square Error (RMSE) of just over 50 W/m2 and relative errors of 15%–30% [65]. In this study, the major sources of uncertainties come from satellite-derived evapotranspiration estimates, rainfall estimates, vegetation indices, the limitations of the linear regression trend method and the short time available for the trend analysis.
A comprehensive review of the accuracies and uncertainties of SSEBop ET and MOD16 ET over different land cover types and climate zones with respect to field-based measurements in the U.S. are provided by Velpuri et al. [65]. The mean basin-scale uncertainty levels in SSEBop ET data are much lower than the reported uncertainty levels (up to 50%) of the mean land ET obtained from remote sensing data, up-scaled tower measurements, land surface models and reanalysis datasets [79,80], illustrating the reliability of monthly SSEBop products for basin-scale ET estimation [65]. Mu et al. [53] provided a performance evaluation of the MOD16 estimates for the Nile Basin, using the basin-scale average of runoff and gridded precipitation data and running the improved algorithm in other regions of the world where there is sufficient availability of the flux tower data.
The relationship between annual anomalies of ET and rainfall in different climate zones was investigated using datasets of varying spatial scales. The ET datasets have a spatial resolution of 1-km, which is much higher than the 25-km resolution of the rainfall data. However, the magnitudes of the uncertainties that could arise from using data of different spatial resolutions diminish, as the anomalies were averaged per each climate zone. Moreover, remote sensing data are subject to systematic errors with consistent bias that overall have little impact on the long-term anomalies. With regards to the linear regression trend analysis, readers should be cautious in interpreting the significance of the linear trend results, since we did not test the normality of the residuals, the homoscedasticity and serial independence of the data before performing the statistical inference regarding the slope, as recommended by de Beurs and Henebry [70]. Nonetheless, the trends generally remain unbiased, even if those assumptions are not met; the limitations with respect to uncertainties in the significance of the estimated parameters, however, remain [70].

5. Conclusions

This paper characterizes variation in actual evapotranspiration (ET) and investigates its relation with vegetation productivity in the Nile Basin for the period of 2002–2011. Hybrids of both satellite-derived and modeled ET datasets, the NDVI-based MOD16 and the thermal-based SSEBop ET datasets were used to comparatively analyze ET variability in relation to vegetation productivity (NDVI), climate (rainfall) and land cover. The analysis of interannual anomalies using thermal-based ET revealed temporally distinct mini-episodes of dry (2002–2005, 2009–2011) and wet (2006–2008) periods that dominated 40%–50% of the study area; with 2007 and 2009 being the wettest and driest years, respectively. An investigation of the relationship between monthly ET variability with vegetation productivity indicated that NDVI-based ET had stronger positive correlations (r = 0.77 to r = 0.97) with vegetation than thermal-based ET (r = 0.52 to r = 0.73) at a statistical significance of p < 0.001, particularly in rainfed regions. This finding is not unexpected, as NDVI data are the primary input in the NDVI-based ET data. The analysis of the relationship between annual anomalies of ET and rainfall in different climate zones showed that thermal-based ET anomalies correlated positively (r = 0.6 at p < 0.05) with corresponding rainfall anomalies in two of the six investigated rainfed climate zones; whereas NDVI-based ET showed no significant relationship. A comparison of thermal-based and NDVI-based ET estimates over selected land cover types revealed minor disagreements over rainfed croplands (60 mm/yr higher for thermal-based ET), but a significant divergence over wetlands (440 mm/yr higher for thermal-based ET).
The results in this study confirm previous regional-scale drying and greening periods in the region. This paper used rainfall as a proxy for soil moisture, but this may not always be valid, particularly in the wetter parts of the basin; as a result, the use of soil moisture data, such as Soil Moisture and Ocean Salinity (SMOS, Kerr et al. [81]), should be considered. The trend analysis conducted in this study is limited to 10 years based on the availability of the dataset used, which begins at the start of the millennium. However, the trend test could reveal long-term changes in the basin if the analysis could be extended using long-term evapotranspiration data, such as the 1983–2006 global ET dataset produced by Zhang et al. [82]. In order to improve the accuracy of remote sensing data, the findings need to be verified with long-term field measurement data.

Acknowledgments

This work was partially supported by: the Global Livestock Collaborative Research Support Program (CRSP): PCE-G-00-98-00036-00 Sub-grant Number 144-29-29; the Applied Science Program of NASA Earth-Sun System Division contract# NNA06CH751; and FEWS-NET. The authors would like to thank Pierre Camberlin (University of Bourgogne, Dijon, France) for the permission to reuse the climate stratification data, and Milly Mbuliro (Nile Basin Initiative (NBI), Entebbe, Uganda) for the provision of the MOD16 data. Finally, we thank the Journal Editor and the anonymous reviewers for their useful and constructive reviews that greatly improved the manuscript.

Author Contributions

All of the authors contributed (in part or in full) to the concept design and development of the research and improvement of the manuscript. Henok Alemu performed the research and prepared the manuscript.

Conflicts of Interest

The authors declare no conflict of interest. Any use of trade, firm or product names is for descriptive purposes only and does not imply endorsement by the U.S. Government.

References

  1. Jenerette, G.D.; Barron-Gafford, G.A.; Guswa, A.J.; McDonnell, J.J.; Villegas, J.C. Organization of complexity in water limited ecohydrology. Ecohydrology 2012, 5, 184–199. [Google Scholar]
  2. Fensholt, R.; Langanke, T.; Rasmussen, K.; Reenberg, A.; Prince, S.D.; Tucker, C.; Scholes, R.J.; Le, Q.B.; Bondeau, A.; Eastman, R.; et al. Greenness in semi-arid areas across the globe 1981–2007—An Earth observing satellite based analysis of trends and drivers. Remote Sens. Environ 2012, 121, 144–158. [Google Scholar]
  3. Safriel, U.; Adeel, Z.; Niemeijer, D.; Puigdefabregas, J.; White, R.; Lal, R.; Winslow, M.; Ziedler, J.; Prince, S.; Archer, E.; et al. Dryland Systems. In Millennium Ecosystem Assessment, 2005. Ecosystems and Human Well-Being: Current State and Trends; Hassan, R., Scholes, R., Ash, N., Eds.; World Ressources Institute: Washington, DC, USA, 2005; pp. 623–662. [Google Scholar]
  4. Newman, B.D.; Wilcox, B.P.; Archer, S.R.; Breshears, D.D.; Dahm, C.N.; Duffy, C.J.; McDowell, N.G.; Phillips, F.M.; Scanlon, B.R.; Vivoni, E.R. Ecohydrology of water-limited environments: A scientific vision. Water Resour. Res 2006, 42, W06302. [Google Scholar]
  5. Sutcliffe, J.V.; Parks, Y.P. The Hydrology of the Nile; IAHS Special Publication No.5; International Association of Hydrological Sciences: Wallingford, UK, 1999. [Google Scholar]
  6. Nile Basin Initiative (NBI). State of the River Nile Basin 2012. Available online: www.nbi.org (accessed on 12 October 2013).
  7. Food and Agriculture Organization (FAO). Population Prospects in the Nile Basin, 2011. Available online: www.faonile.org (accessed on 15 June 2013).
  8. Pricope, N.G.; Husak, G.; Lopez-Carr, D.; Funk, C.; Michaelsen, J. The climate-population nexus in the East African Horn: Emerging degradation trends in rangeland and pastoral livelihood zones. Glob. Environ. Chang 2013, 23, 1525–1541. [Google Scholar]
  9. Bakr, N.; Weindorf, D.C.; Bahnassy, M.H.; Marei, S.M.; El-Badawi, M.M. Monitoring land cover changes in a newly reclaimed area of Egypt using multi-temporal Landsat data. Appl. Geogr 2010, 30, 592–605. [Google Scholar]
  10. Jägerskog, A.; Cascão, A.; Hårsmar, M.; Kim, K. Land Acquisitions: How will They Impact Transboundary Waters? Report Nr 30; Stockholm International Water Institute (SIWI): Stockholm, Sweden, 2012. [Google Scholar]
  11. Cotula, L.; Vermeulen, S.; Leonard, R.; Keeley, J. Land Grab or Development Opportunity? Agricultural Investment and International Land Deals in Africa; International Institute for Environment and Development(IIED)/Food and Agriculture Organization of the United Nations (FAO), International Fund for Agricultural Development (IFAD): London, UK/Rome, Italy, 2009. Available online: http://www.ifad.org/pub/land/land_grab.pdf (accessed on 15 July 2013).
  12. Whittington, D.; Wu, X.; Sadoff, C. Water resource management in the Nile Basin: The economic value of cooperation. Water Policy 2005, 7, 227–252. [Google Scholar]
  13. Arsano, Y. Ethiopia and the Nile, Dilemmas of National and Regional Hydropolitics; Swiss Federal Institute of Technology Zurich: Zurich, Switzerland, 2007. Available online: http://www.css.ethz.ch/publications/pdfs/Ethiopia-and-the-Nile.pdf (accessed on 11 May 2013).
  14. Glenn, E.P.; Huete, A.R.; Nagler, P.L.; Hirschboeck, K.K.; Brown, P. Integrating remote sensing and ground methods to estimate evapotranspiration. Crit. Rev. Plant. Sci 2007, 26, 139–168. [Google Scholar]
  15. Droogers, P.; Immerzeel, W.; Perry, C. Application of Remote Sensing in National Water Plans: Demonstration Cases for Egypt, Saudi-Arabia and Tunisia; FutureWater Report 80; World Bank; Wageningen, The Netherlands, 2009; Available online: http://www.futurewater.nl/downloads/2008_Droogers_FW80.pdf (accessed on 12 July 2013).
  16. Anderson, M.C.; Allen, R.G.; Morse, A.; Kustas, W.P. Use of Landsat thermal imagery in monitoring evapotranspiration and managing water resources. Remote Sens. Environ 2012, 122, 50–65. [Google Scholar]
  17. Jung, M.; Reichstein, M.; Ciais, P.; Seneviratne, S.I.; Sheffield, J.; Goulden, M.L.; Bonan, G.; Cescatti, A.; Chen, J.; de Jeu, R.; et al. Recent decline in the global land evapotranspiration trend due to limited moisture supply. Nature 2010, 467, 951–954. [Google Scholar]
  18. Wilcox, B.; Seyfried, M.; Breshears, D.; Stewart, B.; Howell, T. The Water Balance on Rangelands. In Encyclopedia of Water Science; Stewart, B.A., Howell, T.A., Eds.; Mercel Dekker: New York, NY, USA, 2003; pp. 791–794. [Google Scholar]
  19. Pettorelli, N.; Vik, J.O.; Mysterud, A.; Gaillard, J.-M.; Tucker, C.J.; Stenseth, N.C. Using the satellite-derived NDVI to assess ecological responses to environmental change. Trends Ecol. Evolut 2005, 20, 503–510. [Google Scholar]
  20. Oberg, J.W.; Melesse, A.M. Evapotranspiration dynamics at an ecohydrological restoration site: An energy balance and remote sensing approach. J. Am. Water Resour. Assoc 2006, 42, 565–582. [Google Scholar]
  21. Melesse, A.M.; Nangia, V. Estimation of spatially distributed surface energy fluxes using remotely-sensed data for agricultural fields. Hydrol. Process 2005, 19, 2653–2670. [Google Scholar]
  22. Melesse, A.M.; Frank, A.; Nangia, V.; Hanson, J. Analysis of energy fluxes and land surface parameters in a grassland ecosystem: A remote sensing perspective. Int. J. Remote Sens 2008, 29, 3325–3341. [Google Scholar]
  23. Melesse, A.M.; Abtew, W.; Dessalegne, T. Evaporation estimation of Rift Valley lakes: Comparison of models. Sensors 2009, 9, 9603–9615. [Google Scholar]
  24. Melesse, A.; Weng, Q.; Thenkabail, P.; Senay, G. Remote sensing sensors and applications in environmental resources mapping and modelling. Sensors 2007, 7, 3209–3241. [Google Scholar]
  25. Justice, C.O.; Townshend, J.R.G.; Vermote, E.F.; Masuoka, E.; Wolfe, R.E.; Saleous, N.; Roy, D.P.; Morisette, J.T. An overview of MODIS Land data processing and product status. Remote Sens. Environ 2002, 83, 3–15. [Google Scholar]
  26. Courault, D.; Seguin, B.; Olioso, A. Review on estimation of evapotranspiration from remote sensing data: From empirical to numerical modeling approaches. Irrig. Drain. Syst 2005, 19, 223–249. [Google Scholar]
  27. Bastiaanssen, W.G.M.; Menenti, M.; Feddes, R.A.; Holtslag, A.A.M. A remote sensing Surface Energy Balance Algorithm for Land (SEBAL), Part 1: Formulation. J. Hydrol 1998, 212–213, 198–212. [Google Scholar]
  28. Su, Z. The Surface Energy Balance System (SEBS) for estimation of turbulent heat fluxes. Hydrol. Earth Syst. Sci 2002, 6, 85–99. [Google Scholar]
  29. Senay, G.; Budde, M.; Verdin, J.; Melesse, A. A coupled remote sensing and simplified surface energy balance approach to estimate actual evapotranspiration from irrigated fields. Sensors 2007, 7, 979–1000. [Google Scholar]
  30. Senay, B.G.; Bohms, S.; Singh, R.K.; Gowda, P.H.; Velpuri, N.M.; Alemu, H.; Verdin, J.P. Operational evapotranspiration mapping using remote sensing and weather datasets: A new parameterization for the SSEB approach. J. Am. Water Resour. Assoc 2013, 49, 577–591. [Google Scholar]
  31. Calcagno, G.; Mendicino, G.; Monacelli, G.; Senatore, A.; Versace, P. Distributed Estimation of Actual Evapotranspiration through Remote Sensing Techniques. In Methods and Tools for Drought Analysis and Management; Rossi, G., Vega, T., Bonaccorso, B., Eds.; Springer: Amsterdam, The Netherlands, 2007; Volume 62, pp. 125–147. [Google Scholar]
  32. Droogers, P.; Immerzeel, W. Managing the Real Water Consumer: Evapotranspiration; FutureWater Report 78. World Bank: Wageningen, The Netherlands, 2008. Available online: http://www.futurewater.nl/downloads/2008_Droogers_FW78.pdf (accessed on 12 July 2013).
  33. Yilmaz, M.T.; Anderson, M.C.; Zaitchik, B.; Hain, C.R.; Crow, W.T.; Ozdogan, M.; Chun, J.A.; Evans, J. Comparison of prognostic and diagnostic surface flux modeling approaches over the Nile River basin. Water Resour. Res 2014, 50, 386–408. [Google Scholar]
  34. Bashir, M.; Tanakamaru, H.; Tada, A. Remote Sensing-Based Estimates of Evapotranspiration for Managing Scarce Water Resources in the Gezira Scheme, Sudan. In From Headwaters to the Ocean; Taniguchi, M., Burnett, W.C., Fukushima, Y., Haigh, M., Umezawa, Y., Eds.; Hydrological Change and Water Management: Kyoto, Japan, 2008; pp. 381–386. [Google Scholar]
  35. Petersen, G.; Fohrer, N. Flooding and drying mechanisms of the seasonal Sudd flood plains along the Bahr el Jebel in southern Sudan. Hydrol. Sci. J 2010, 55, 4–16. [Google Scholar]
  36. Ayenew, T. Evapotranspiration estimation using thematic mapper spectral satellite data in the Ethiopian rift and adjacent highlands. J. Hydrol 2003, 279, 83–93. [Google Scholar]
  37. Anderson, M.C.; Kustas, W.P.; Norman, J.M.; Hain, C.R.; Mecikalski, J.R.; Schultz, L.; Gonzalez-Dugo, M.P.; Cammalleri, C.; Pimstein, A.; Gao, F; et al. Mapping daily evapotranspiration at field to continental scales using geostationary and polar orbiting satellite imagery. Hydrol. Earth Syst. Sci 2011, 15, 223–239. [Google Scholar] [Green Version]
  38. Bashir, M.A.; Hata, T.; Tanakamaru, H.; Abdelhadi, A.W.; Tada, A. Satellite-based energy balance model to estimate seasonal evapotranspiration for irrigated sorghum: A case study from the Gezira scheme, Sudan. Hydrol. Earth Syst. Sci 2008, 12, 1129–1139. [Google Scholar]
  39. El-Shirbeny, M.A.; Aboelghar, M.A.; Arafat, S.M.; El-Gindy, A.-G.M. Assessment of the mutual impact between climate and vegetation cover using NOAA-AVHRR and Landsat data in Egypt. Arab J. Geosci 2013, 7, 1287–1296. [Google Scholar]
  40. Elhag, M.; Psilovikos, A.; Manakos, I.; Perakis, K. Application of the SEBS water balance model in estimating daily evapotranspiration and evaporative fraction from remote sensing data over the Nile delta. Water Resour. Manag 2011, 25, 2731–2742. [Google Scholar]
  41. Simonneaux, V.; Abdrabbo, M.A.A.; Saleh, S.M.; Hassanein, M.K.; Abou-Hadid, A.F.; Chehbouni, A. MODIS estimates of annual evapotranspiration of irrigated crops in the Nile Delta based on the FAO method: Application to the Nile river budget. Proc. SPIE 2010. [Google Scholar] [CrossRef]
  42. El Tahir, M.; Wang, W.; Xu, C.; Zhang, Y.; Singh, V. Comparison of methods for estimation of regional actual evapotranspiration in data scarce regions: Blue Nile region, eastern Sudan. J. Hydrologic Eng. 2012, 17, 578–589. [Google Scholar]
  43. Mohamed, Y.A.; Bastiaanssen, W.G.M.; Savenije, H.H.G. Spatial variability of evaporation and moisture storage in the swamps of the upper Nile studied by remote sensing techniques. J. Hydrol 2004, 289, 145–164. [Google Scholar]
  44. Rebelo, L.M.; Senay, G.B.; McCartney, M.P. Flood pulsing in the Sudd wetland: Analysis of seasonal variations in inundation and evaporation in South Sudan. Earth Interac 2012, 16, 1–19. [Google Scholar]
  45. Psilovikos, A.; Elhag, M. Forecasting of remotely sensed daily evapotranspiration data over Nile Delta region, Egypt. Water Resour. Manag 2013, 27, 4115–4130. [Google Scholar]
  46. De Bruin, H.A.R.; Trigo, I.F.; Jitan, M.A.; Temesgen Enku, N.; van der Tol, C.; Gieske, A.S.M. Reference crop evapotranspiration derived from geo-stationary satellite imagery: A case study for the Fogera flood plain, NW-Ethiopia and the Jordan Valley, Jordan. Hydrol. Earth Syst. Sci 2010, 14, 2219–2228. [Google Scholar]
  47. Senay, G.B.; Asante, K.; Artan, G. Water balance dynamics in the Nile Basin. Hydrol. Process 2009, 23, 3675–3681. [Google Scholar]
  48. Mohamed, Y.A.; van den Hurk, B.J.J.M.; Savenije, H.H.G.; Bastiaanssen, W.G.M. Hydroclimatology of the Nile: Results from a regional climate model. Hydrol. Earth Syst. Sci 2005, 9, 263–278. [Google Scholar]
  49. Sun, Z.; Gebremichael, M.; Ardö, J.; de Bruin, H.A.R. Mapping daily evapotranspiration and dryness index in the East African highlands using MODIS and SEVIRI data. Hydrol. Earth Syst. Sci 2011, 15, 163–170. [Google Scholar]
  50. Zhang, Z.; Xu, C.-Y.; Yong, B.; Hu, J.; Sun, Z. Understanding the changing characteristics of droughts in Sudan and the corresponding components of the hydrologic cycle. J. Hydrometeorol 2012, 13, 1520–1535. [Google Scholar]
  51. Marshall, M.; Funk, C.; Michaelsen, J. Examining evapotranspiration trends in Africa. Clim. Dyn 2012, 38, 1849–1865. [Google Scholar]
  52. Sun, Z.; Gebremichael, M.; Ardo, J.; Nickless, A.; Caquet, B.; Merboldh, L.; Kutschi, W. Estimation of daily evapotranspiration over Africa using MODIS/Terra and SEVIRI/MSG data. Atmos. Res 2012, 112, 35–44. [Google Scholar]
  53. Mu, Q.M.; Zhao, M.S.; Running, S.W. MOD16 1-km2 Terrestrial Evapotranspiration (ET) Product for the Nile Basin; Algorithm Theoretical Basis Document; Numerical Terradynamic Simulation Group, College of Forestry and Conservation, University of Montana: Missoula, MT, USA, 29 May 2013. [Google Scholar]
  54. Mu, Q.M.; Zhao, M.S.; Running, S.W. Improvements to a MODIS global terrestrial evapotranspiration algorithm. Remote Sens. Environ 2011, 115, 1781–1800. [Google Scholar]
  55. Mu, Q.; Zhao, M.; Running, S.W. MODIS Global Terrestrial Evapotranspiration (ET) Product (NASA MOD16A2/A3); Algorithm Theoretical Basis Document, Collection 5; NASA HQ, Numerical Terradynamic Simulation Group, University of Montana: Missoula, MT,USA, 20 November 2013. [Google Scholar]
  56. Huffman, G.J.; Adler, R.F.; Stocker, E.; Bolvin, D.T.; Nelkin, E.J. Analysis of TRMM 3-Hourly Multi-Satellite Precipitation Estimates Computed in Both Real and Post-Real Time. Proceedings of 12th Conference on Satellite Meteorology and Oceanography, Long Beach, CA, USA, 9–13 February 2003.
  57. Schaaf, C.B.; Gao, F.; Strahler, A.H.; Lucht, W.; Li, X.; Tsang, T.; Strugnell, N.C.; Zhang, X.; Jin, Y.; Muller, J.P.; et al. First operational BRDF, albedo nadir reflectance products from MODIS. Remote Sens. Environ 2002, 83, 135–148. [Google Scholar]
  58. Camberlin, P. Nile Basin Climates. In The Nile: Origins, Environments, Limnology and Human Use; Dumont, H.J., Ed.; Springer: Houten, The Netherlands, 2009; pp. 307–333. [Google Scholar]
  59. Beyene, T.; Lettenmaier, D.P.; Kabat, P. Hydrological impacts of climate change on the Nile River basin: Implications of the 2007 IPCC scenarios. Clim. Chang 2010, 100, 433–461. [Google Scholar]
  60. Conway, D. From headwater tributaries to international river: Observing and adapting to climate variability and change in the Nile basin. Glob. Environ. Chang 2005, 15, 99–114. [Google Scholar]
  61. Zaitchik, B.F.; Simane, B.; Habib, S.; Anderson, M.C.; Ozdogan, M.; Foltz, J.D. Building climate resilience in the Blue Nile/Abay Highlands: A role for earth system sciences. Int. J. Environ. Res. Publ. Health 2012, 9, 435–446. [Google Scholar]
  62. Waterbury, J. The Nile Basin: National Determinants of Collective Action; Yale University Press: Ann Arbor, MI, USA, 2002. [Google Scholar]
  63. Senay, G.; Budde, M.; Verdin, J. Enhancing the Simplified Surface Energy Balance (SSEB) approach for estimating landscape ET: Validation with the METRIC model. Agric. Water Manag 2011, 98, 606–618. [Google Scholar]
  64. Senay, G.; Leake, S.; Nagler, P.; Artan, G.; Dickinson, J.; Cordova, J.; Glenn, E. Estimating basin scale evapotranspiration (ET) by water balance and remote sensing methods. Hydrol. Process 2011, 25, 4037–4049. [Google Scholar]
  65. Velpuri, N.M.; Senay, G.B.; Singh, R.K.; Bohms, S.; Verdin, J.P. A comprehensive evaluation of two MODIS evapotranspiration products over the conterminous United States: Using point and gridded FLUXNET and water balance ET. Remote Sens. Environ 2013, 139, 35–49. [Google Scholar]
  66. Nile Basin Initiative (NBI). Available online: http://nileis.nilebasin.org/ (accessed on 2 February 2014).
  67. Reverb|ECHO-NASA’s Next Generation Earth Science Tool. Available online: http://earthdata.nasa.gov/reverb (accessed on 15 May 2013).
  68. Dinku, T.; Ceccato, P.; Grover-Kopec, E.; Lemma, M.; Connor, S.J.; Ropelewski, C.F. Validation of satellite rainfall products over East Africa’s complex topography. Int. J. Remote Sens 2007, 28, 1503–1526. [Google Scholar]
  69. NASA ’s Tropical Rainfall Measuring Mission (TRMM). Available online: http://trmm.gsfc.nasa.gov/ (accessed on 3 September 2013).
  70. De Beurs, K.; Henebry, G. A statistical framework for the analysis of long image time series. Int. J. Remote Sens 2005, 26, 1551–1573. [Google Scholar]
  71. Shapiro, S.S.; Wilk, M.B. An analysis of variance test for normality (complete samples). Biometrika 1965, 52, 591–611. [Google Scholar]
  72. Breusch, T.S.; Pagan, A.R. A simple test for heteroscedasticity and random coefficient variation. Econometrica 1979, 47, 1287–1294. [Google Scholar]
  73. Breusch, T.S. Testing for autocorrelation in dynamic linear models. Aust. Econ. Papers 1978, 17, 334–355. [Google Scholar]
  74. Viste, E.; Korecha, D.; Sorteberg, A. Recent drought and precipitation tendencies in Ethiopia. Theor. Appl. Climatol 2013, 112, 535–551. [Google Scholar]
  75. Hastenrath, S.; Polzin, D.; Mutai, C. Diagnosing the droughts and floods in equatorial East Africa during boreal autumn 2005–08. J. Clim 2010, 23, 813–817. [Google Scholar]
  76. Elhag, M; Psilovikos, A; Makrantonaki, M.S. Land use changes and its impacts on water resources in Nile Delta region using remote sensing techniques. Environ. Dev. Sustain 2013, 15, 1189–1204. [Google Scholar]
  77. Abd El-Kawy, O.R.; Rød, J.K.; Ismail, H.A.; Suliman, A.S. Land use and land cover change detection in the western Nile delta of Egypt using remote sensing data. Appl. Geogr 2011, 31, 483–494. [Google Scholar]
  78. Kalma, J.D.; McVicar, T.R.; McCabe, M.F. Estimating land surface evaporation: A review of methods using remotely sensed surface temperature data. Surv. Geophy 2008, 29, 421–469. [Google Scholar]
  79. Mueller, B.; Seneviratne, S.I.; Jimenez, C.; Corti, T.; Hirschi, M.; Balsamo, G. Evaluation of global observations-based evapotranspiration datasets and IPCC AR4 simulations. Geophys. Res. Lett 2011, 38, L06402. [Google Scholar]
  80. Vinukollu, R.K.; Meynadier, R.; Sheffield, J.; Wood, E.F. Multi-model, multisensory estimates of global evapotranspiration: Climatology, uncertainties and trends. Hydrol. Process 2011, 25, 3993–4010. [Google Scholar]
  81. Kerr, Y.H.; Waldteufel, P.; Richaume, P.; Wigneron, J.P.; Ferrazzoli, P.; Mahmoodi, A.; Al Bitar, A.; Cabot, F.; Gruhier, C.; Juglea, S.E.; et al. The SMOS soil moisture retrieval algorithm. IEEE Trans. Geosci. Remote Sens 2012, 50, 1384–1403. [Google Scholar]
  82. Zhang, K.; Kimball, J.S.; Nemani, R.R.; Running, S.W. A continuous satellite-derived global record of land surface evapotranspiration from 1983 to 2006. Water Resour. Res 2010, 46, W09522. [Google Scholar]
Figure 1. The Nile Basin. (a) Delineated zones with roman numerals represent rainfall regimes from Camberlin [58]. (b) Mean monthly rainfall (mm) from TRMM, 2002–2011 for each climate zone.
Remotesensing 06 05885f1aRemotesensing 06 05885f1b
Figure 2. Long-term mean annual estimates (mm) of (a) the Simplified Surface Energy Balance Operational (SSEBop) ET; (b) MOD16 ET; (c) TRMM rainfall; and (d) long-term mean annual NDVI (NDVI > 0); 2002–2011.
Remotesensing 06 05885f2
Figure 3. Frequency (%) of 8-day times series of (a) SSEBop (ET > 0); (b) MODIS NDVI (NDVI > 0) and (c) MOD16 (ET > 0) retrievals during 2002–2011.
Remotesensing 06 05885f3
Figure 4. (aj) Nile Basin ET dynamics: annual ET (SSEBop) standardized anomalies, 2002–2011. The standardized annual anomalies were computed by subtracting the long-term mean (2002–2011) of the annual values from the corresponding individual annual values (annual mean) and dividing by the standard deviation.
Remotesensing 06 05885f4
Figure 5. (ak) Areal extent and degree of severity of annual ET anomalies in the Nile Basin during 2002−2011. The bar length represents the proportional area fraction basin-wide (BW) and for each climate zone (1–9, Camberlin [59]). Colors represent the degree of the severity of dryness and wetness of the standardized anomaly (SA): (i) −0.5 < SA ≤ 0.5: normal (in gray); (ii) 0.5 < SA ≤ 2: moderately wet (light green); (iii) SA > 2: severely wet (dark green); (v) −2 < SA ≤ −0.5: moderately dry (orange); (vi) SA ≤ −2: severely dry (red).
Remotesensing 06 05885f5
Figure 6. (ai) Interannual ET and rainfall variabilities per climate zones in the Nile Basin: Time series standardized annual anomalies of SSEBop and MOD16 and TRMM rainfall averaged over climate zones I–IX, 2002–2011. The standardized annual anomalies were computed by subtracting the long-term mean (2002–2011) of the annual values from the corresponding individual annual values (annual mean) and dividing by the standard deviation.
Remotesensing 06 05885f6
Figure 7. Time series of monthly ET derived from the median of 30 × 30 non-zero pixels of SSEBop and MOD16 for selected sites in different land cover types and climate zones across the Nile Basin, 2002–2011. Correlation coefficients (r) between ET and vegetation (*** (p < 0.001), ** (p < 0.01),* (p < 0.05)); and long-term mean annual ET estimates (mm/yr) are presented for (a) irrigated croplands in climate zone I, (b) rainfed croplands in zone VII, (c) wetlands in zone VI and (d) grasslands in zone V.
Remotesensing 06 05885f7
Figure 8. ET and rainfall trends. Linear regression trends for annual (a) SSEBop ET and (b) TRMM rainfall in the Nile Basin during 2002–2011. Colors represent the trend direction and statistical significance: (i) significantly upward, (p < 0.05, dark green); (ii) upward, not significant (p ≥ 0.05, light green); (iii) significantly downward trend (p < 0.05, red); and (v) downward, not significant (p ≥ 0.05, yellow).
Remotesensing 06 05885f8
Table 1. Relationship between zonally-averaged standardized annual anomalies of SSEBop versus TRMM rainfall and MOD16 versus TRMM rainfall for the nine climate zones. Pearson’s correlation coefficient (r) and statistical significance (p) is presented.
Climate ZonesSSEBop vs TRMMMOD16 vs TRMM

r, pr, p
Ir = 0.65, p = 0.04r = 0.43, p = 0.21
IIr = 0.63, p = 0.04r = 0.73, p = 0.01
IIIr = 0.51, p = 0.13r = 0.43, p = 0.21
IVr = 0.61, p = 0.06r = 0.53, p = 0.11
Vr = 0.66, p = 0.04r = 0.19, p = 0.60
Vr = 0.51, p = 0.12r = 0.09, p = 0.80
VIIr = 0.55, p = 0.10r = 0.47, p = 0.16
VIIIr = 0.67, p = 0.03r = −0.01, p = 0.97
IXr = 0.59, p = 0.07r = −0.12, p = 0.74

