L- and X-Band Multi-Temporal InSAR Analysis of Tianjin Subsidence


Abstract
: When synthetic aperture radar interferometry (InSAR) technology is applied in the monitoring of land subsidence, the sensor band plays an important role. An X-band SAR system as TerraSAR-X (TSX) provides high resolution and short revisit time, but it has no capability of global coverage. On the other side, an L-band sensor as Advanced Land Observing Satellite-Phased Array L-band Synthetic Aperture Radar (ALOS-PALSAR) has global coverage and it produces highly coherent interferograms, but it provides much less details in time and space. The characteristics of these two satellites from different bands can be regarded as complementary. In this paper, we firstly present a possible strategy for X-band optimized acquisition planning combining with L-band. More importantly, we also present the multi-temporal InSAR (MT-InSAR) analysis results from 23 ALOS-PALSAR images and 37 TSX data, which show the complementarity of L- and X-band allows measuring deformations both in urban and non-urban areas. Furthermore, the validation between MT-INSAR and leveling/GPS has been carried out. The combination analysis of L- and X-band MT-InSAR results effectively avoids the limitation of X-band, providing a way to define the shape and the borderline of subsiding center and helps us to understand the subsidence mechanism. Finally, the geological interpretation of the detected subsidence center is given.1. Introduction
Ground subsidence has always been one of the most severe and widespread geological hazards in Chinese cities [1]. Compared with the single-point-measurement methods of ground leveling and GPS techniques, an advanced remote sensing technique, referred to as differential synthetic aperture radar interferometry (D-InSAR), was introduced as a feasible way to monitor deformation over wide areas with centimeter-to-millimeter accuracy. Nevertheless, the technique was mainly limited by the spatiotemporal decorrelation and atmospheric disturbance [2,3].
To compensate for these shortages, the permanent scatterers (PS) technique [4,5] was proposed as the most powerful multi-temporal tool for wide area deformation monitoring with millimetric accuracy and high spatial sampling density [6], well addressing the above well-known limitations of conventional D-InSAR by examining point-like radar targets (buildings, structures, etc.). In the following years, different implementations of PS technique have been realized by many research groups [7,8], commonly referred as persistent scatterers interferometry (PSI). In addition, another approach has been proposed to extract information from distributed targets by generating many interferograms formed in the conventional way [9,10], known as “small baseline” approach. These two broad categories of methods are exploiting two different kinds of radar scattering targets within resolution cells. PSI is looking for a point-like scatterer while small baseline methods are looking for a distributed scatterer within resolution cells. More recently, methods have been proposed by exploring both types of scatterer [11–13]. To supplement it, the detection of partially coherent targets has been carried out by Quasi-PS (QPS) technique [14]. These different techniques can be optional methods for multi-temporal InSAR (MT-InSAR) analysis when applied to monitor deformation in diverse applications according to real conditions and restrictions. In recent years, significant attention has been focused on investigating subsidence over urban areas [15–17] with MT-InSAR analysis.
The main drawback of SAR images is the low resolutions. With the launch of new generation high resolution SAR satellites, the level of details visible in SAR images increased dramatically. For example, TerraSAR-X (TSX) can provide high resolution data to the scale of 1 m [18,19]. Moreover, compared with the 35 days of ERS and ENVISAT, the short revisit time of 11 days favors a fast build-up of interferometric data stacks, for which it is possible to develop thermal effects and a multi-scatters dispersion model [20,21]. Due to the incredible spatial density of identified PS points and high temporal coherence, X-band PSI results has been proved to have the potential of monitoring simultaneously of multiple towns with relatively high accuracy, as well as large-scale man-made linear features (LMLFs) such as highways, railways and powerlines [22,23].
TSX has the advantages of high precision and short revisit period. However, almost no information can be detected by applying PS analysis with X-band over extra-urban areas [20]. In the contrast, ALOS-PALSAR satellite can provide SAR data with global coverage [24], which has relatively high temporal and spatial coherence even in vegetated and forested areas [25]. Besides, the coverage of TSX in strip mode is not globally continuous. Then, how to make an optimized acquisition planning becomes a challenging problem for data provider. The characteristics of these two satellites can be regarded as complementary. Combining L- and X-band can enhance the ability of subsidence monitoring and provide more reliable results.
In this paper, we firstly present a strategy for X-band optimized acquisition planning combining with L-band. Moreover, with multi-band InSAR data, we present MT-InSAR analysis results by applying PS/QPS technique for subsidence monitoring, taking Tianjin suburbs as the study area, which is well validated with leveling and GPS data from two continuously operating reference stations (CORS). PS, QPS techniques were applied in our processing with the software SARPROZ, developed by Daniele Perissin. The results comparison show the complementarity of L- and X-band allows measuring deformations both in urban and non-urban areas. The combination analysis of X-band with L-band data offers a chance for us to describe the shape of subsiding centers and to further understand the causes of different subsidence rates. Besides, integration analysis of geological materials facilitates our understanding of subsidence mechanisms in Tianjin suburbs.
This article is organized as follows. The strategy for X-band optimized acquisition planning combining with L-band is described in Section 2. Then, MT-InSAR analysis with L- and X-band are presented using the datasets from TSX and ALOS-PALSAR and the MT-InSAR results are validated with leveling data and GPS data from two CORS in Section 3. Section 4 shows the combination analysis with L- and X-band MT-InSAR analysis and geological interpretation. The last section is the conclusions and perspectives.
2. X-Band Optimized Acquisition Planning Combining with L-Band
The strategy we adopted can be divided into the following steps as illustrated in Figure 1: (1) D-InSAR analysis is applied for processing L-band data over the whole region. In this way we can exploit the high coherence and the wide coverage of L-band to find hot spot areas (HSAs) affected by ground surface subsidence. (2) Once the HSAs are identified, we can focus the attention on smaller areas and collect the corresponding TSX images, acquired with shorter revisit time. We can then carry out MT-InSAR analysis and study the displacement time series.
L-band (23 cm wavelength) data supports the relatively high temporal and spatial coherence data with wide-area coverage. In order to make full use of temporal and spatial coherence, we constructed interferometric pairs among these time series SAR images based on minimum spanning tree (MST) algorithm [26]. It provides a different choice for the selection of interferometric pairs. Then, we can construct several interferometric pairs from available time series SAR images. An external digital elevation model (DEM) was applied to remove topographic phase, and thus the differential interferograms were generated. From the analysis of these differential interferograms, the HSAs were highlighted.
After the HSAs were identified by L-band D-InSAR analysis, we try to apply X-band PS analysis for one of the potential deformation areas. Due to better resolution, X-band is expected to have the potential ability to monitor subsidence of individual infrastructure including high speed railway as well as urban buildings. The applied PS processing steps are as follows: master image selection, SAR data focusing and registration, baseline construction, DEM simulation, differential interferogram generation, persistent scatterers candidate (PSC) selection, multi-image sparse grid phase unwrapping, atmospheric phase screen (APS) estimation and removal, PS point selection, PS point displacement history analysis and average deformation estimation.
3. Multi-Band MT-InSAR Analysis
3.1. MT-InSAR Analysis with L- and X-Band
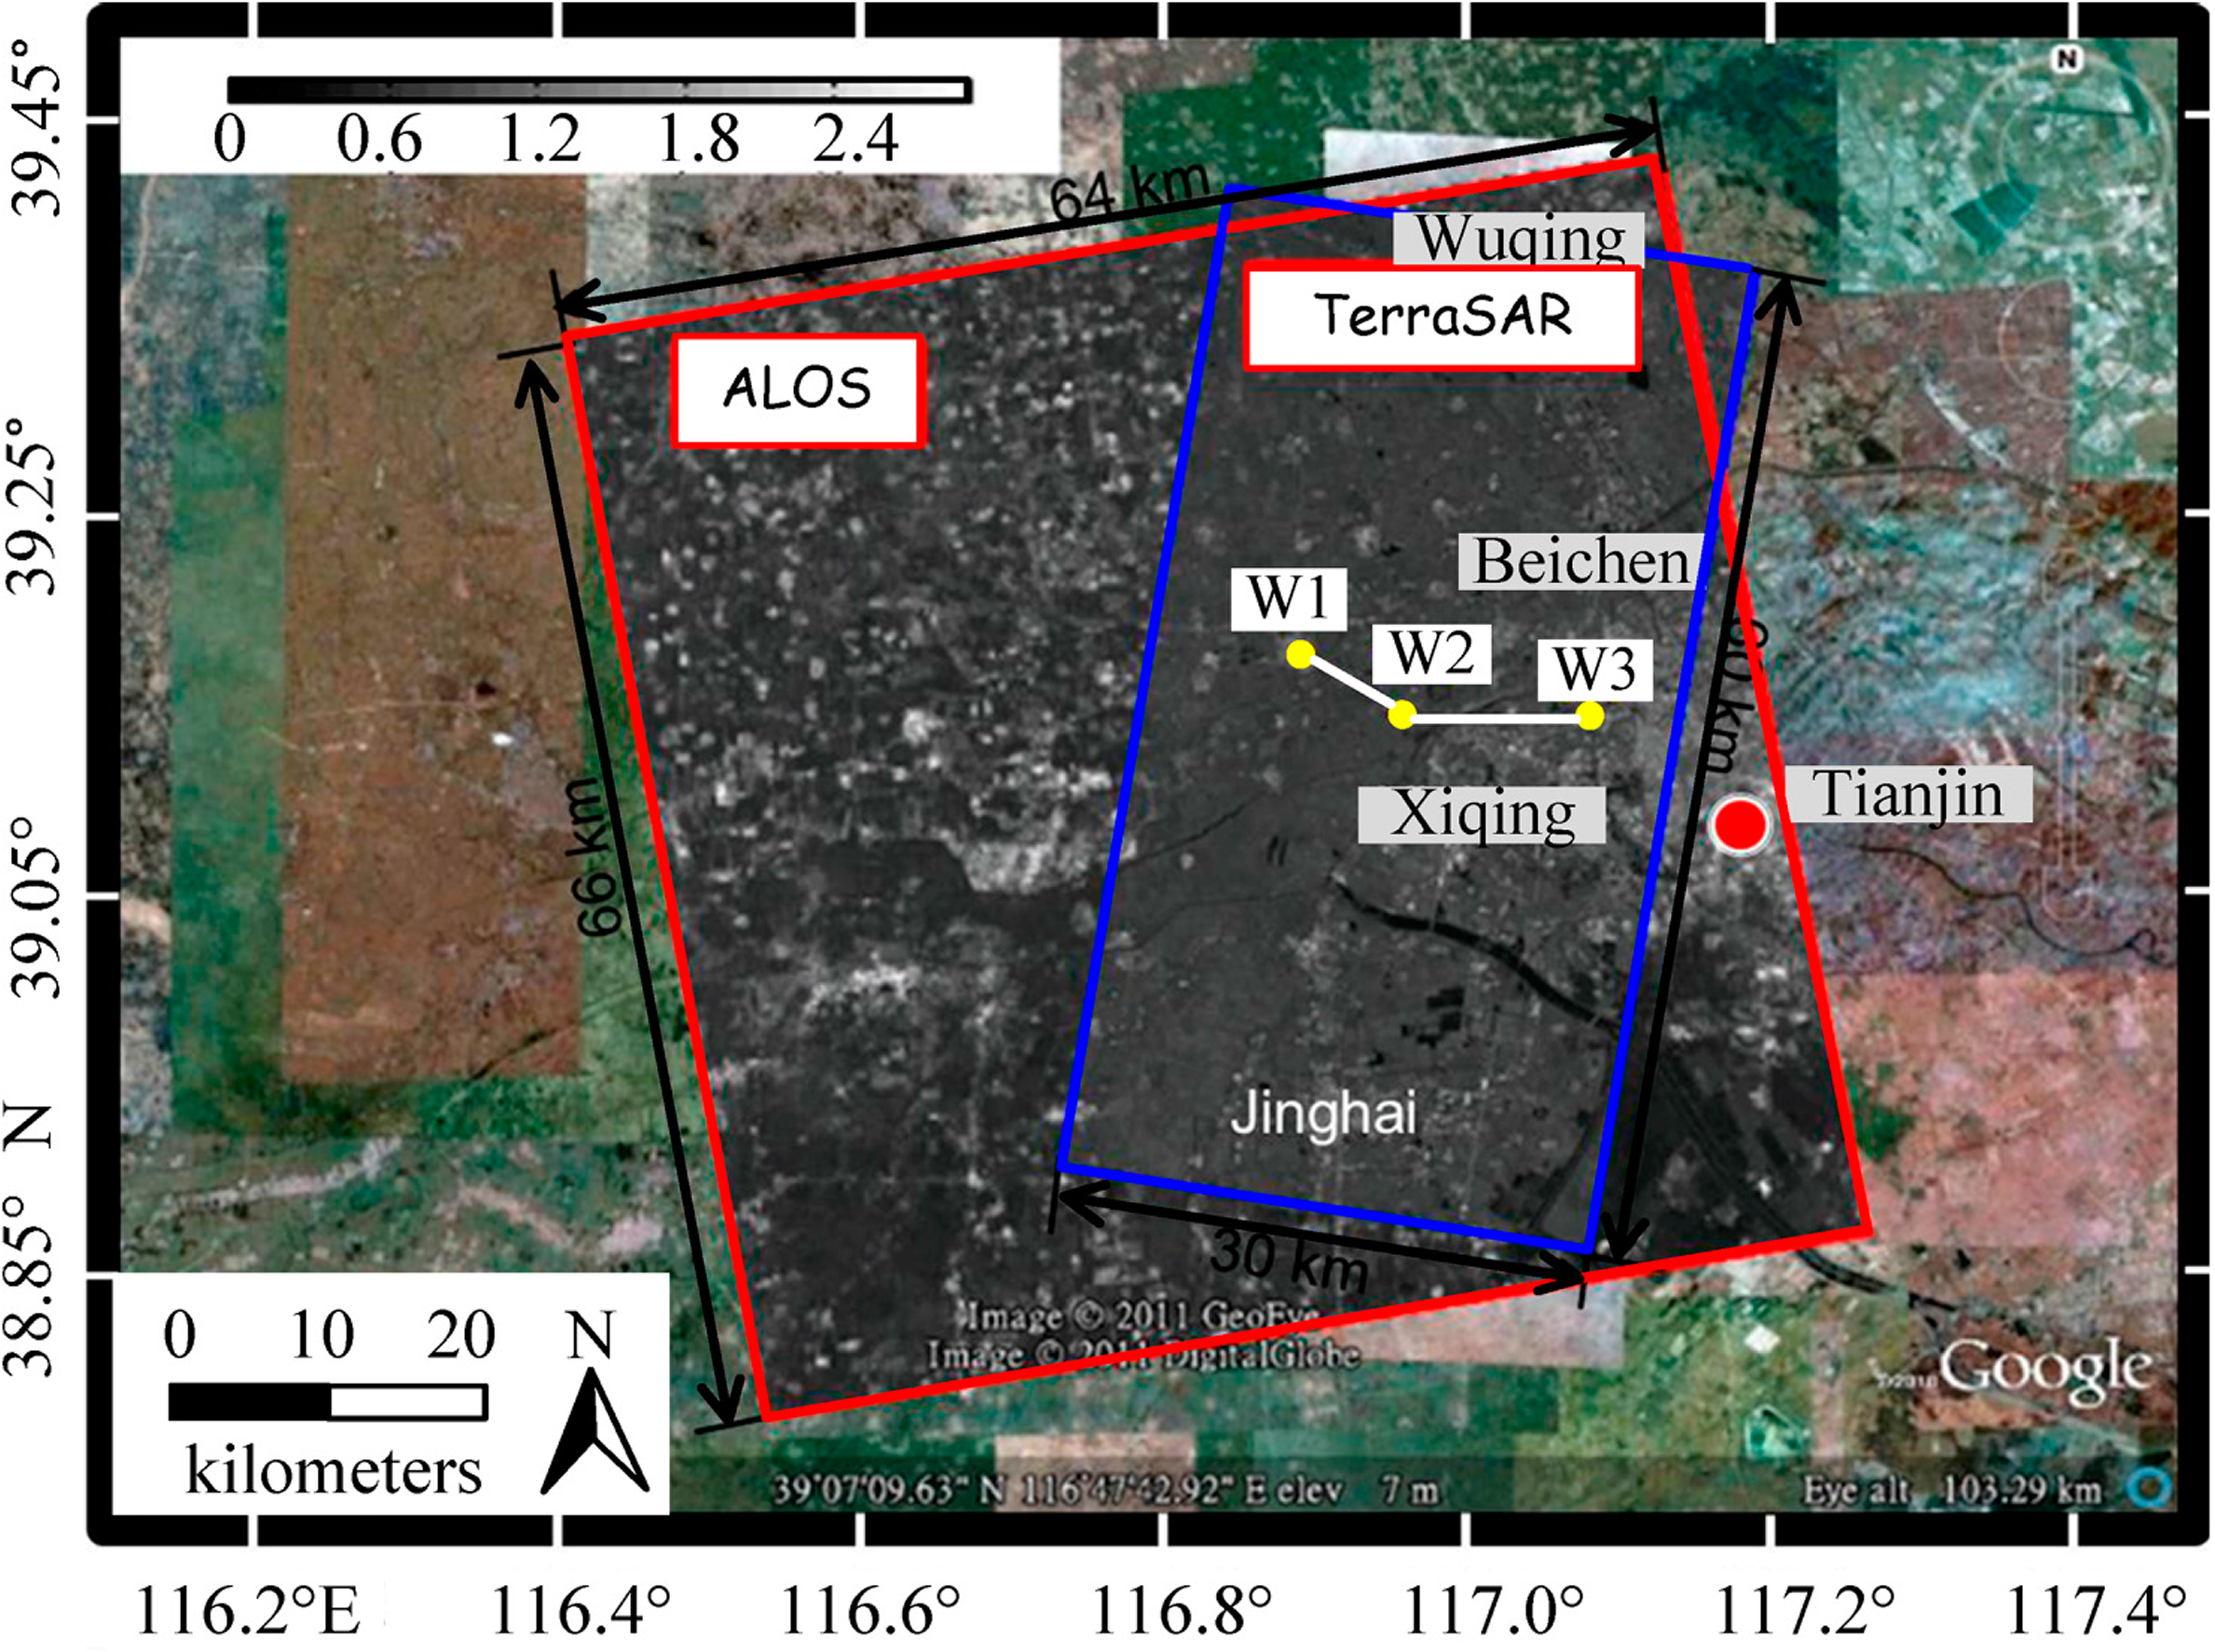
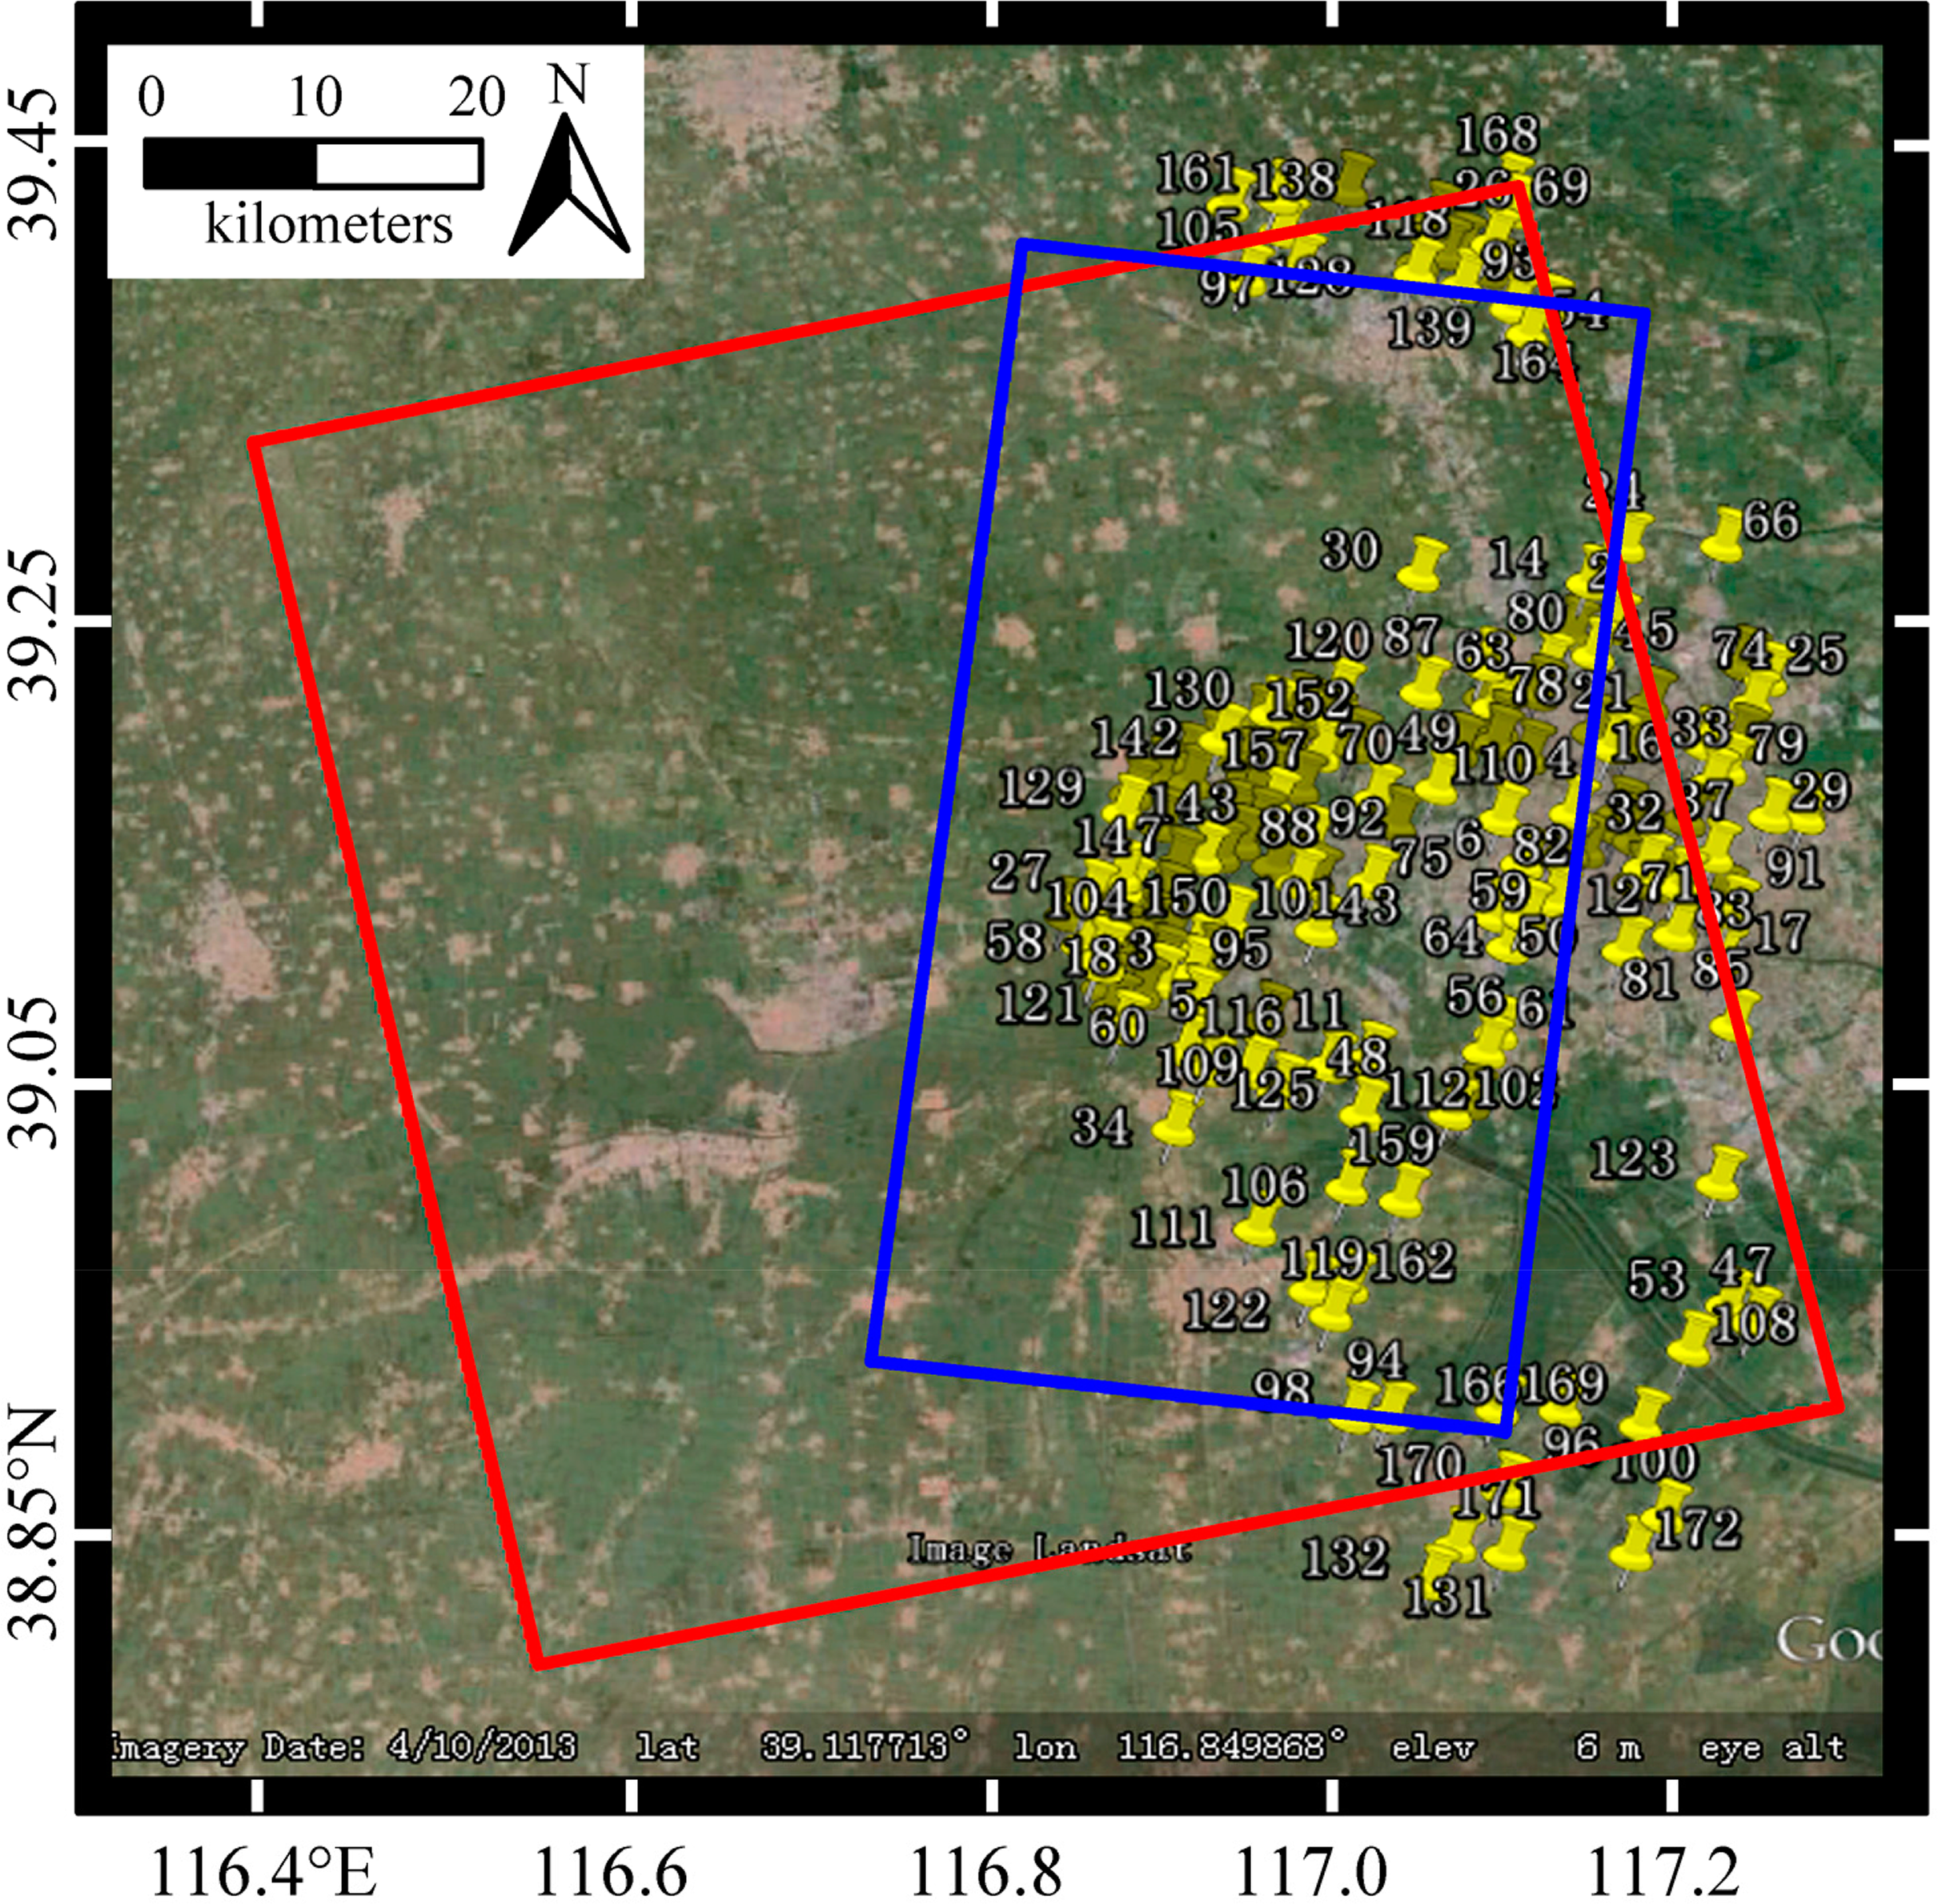
With the rapid development of industry and urbanization, excessive groundwater withdrawal in Tianjin leads itself to one of the most serious ground subsidence regions in China. The study area is located in the west of Tianjin, including Wuqing District, Jinghai County and several other towns. Figure 2 shows the coverage of L-Band (red rectangle) data and X-Band (blue one) data which are superimposed on Google Earth.
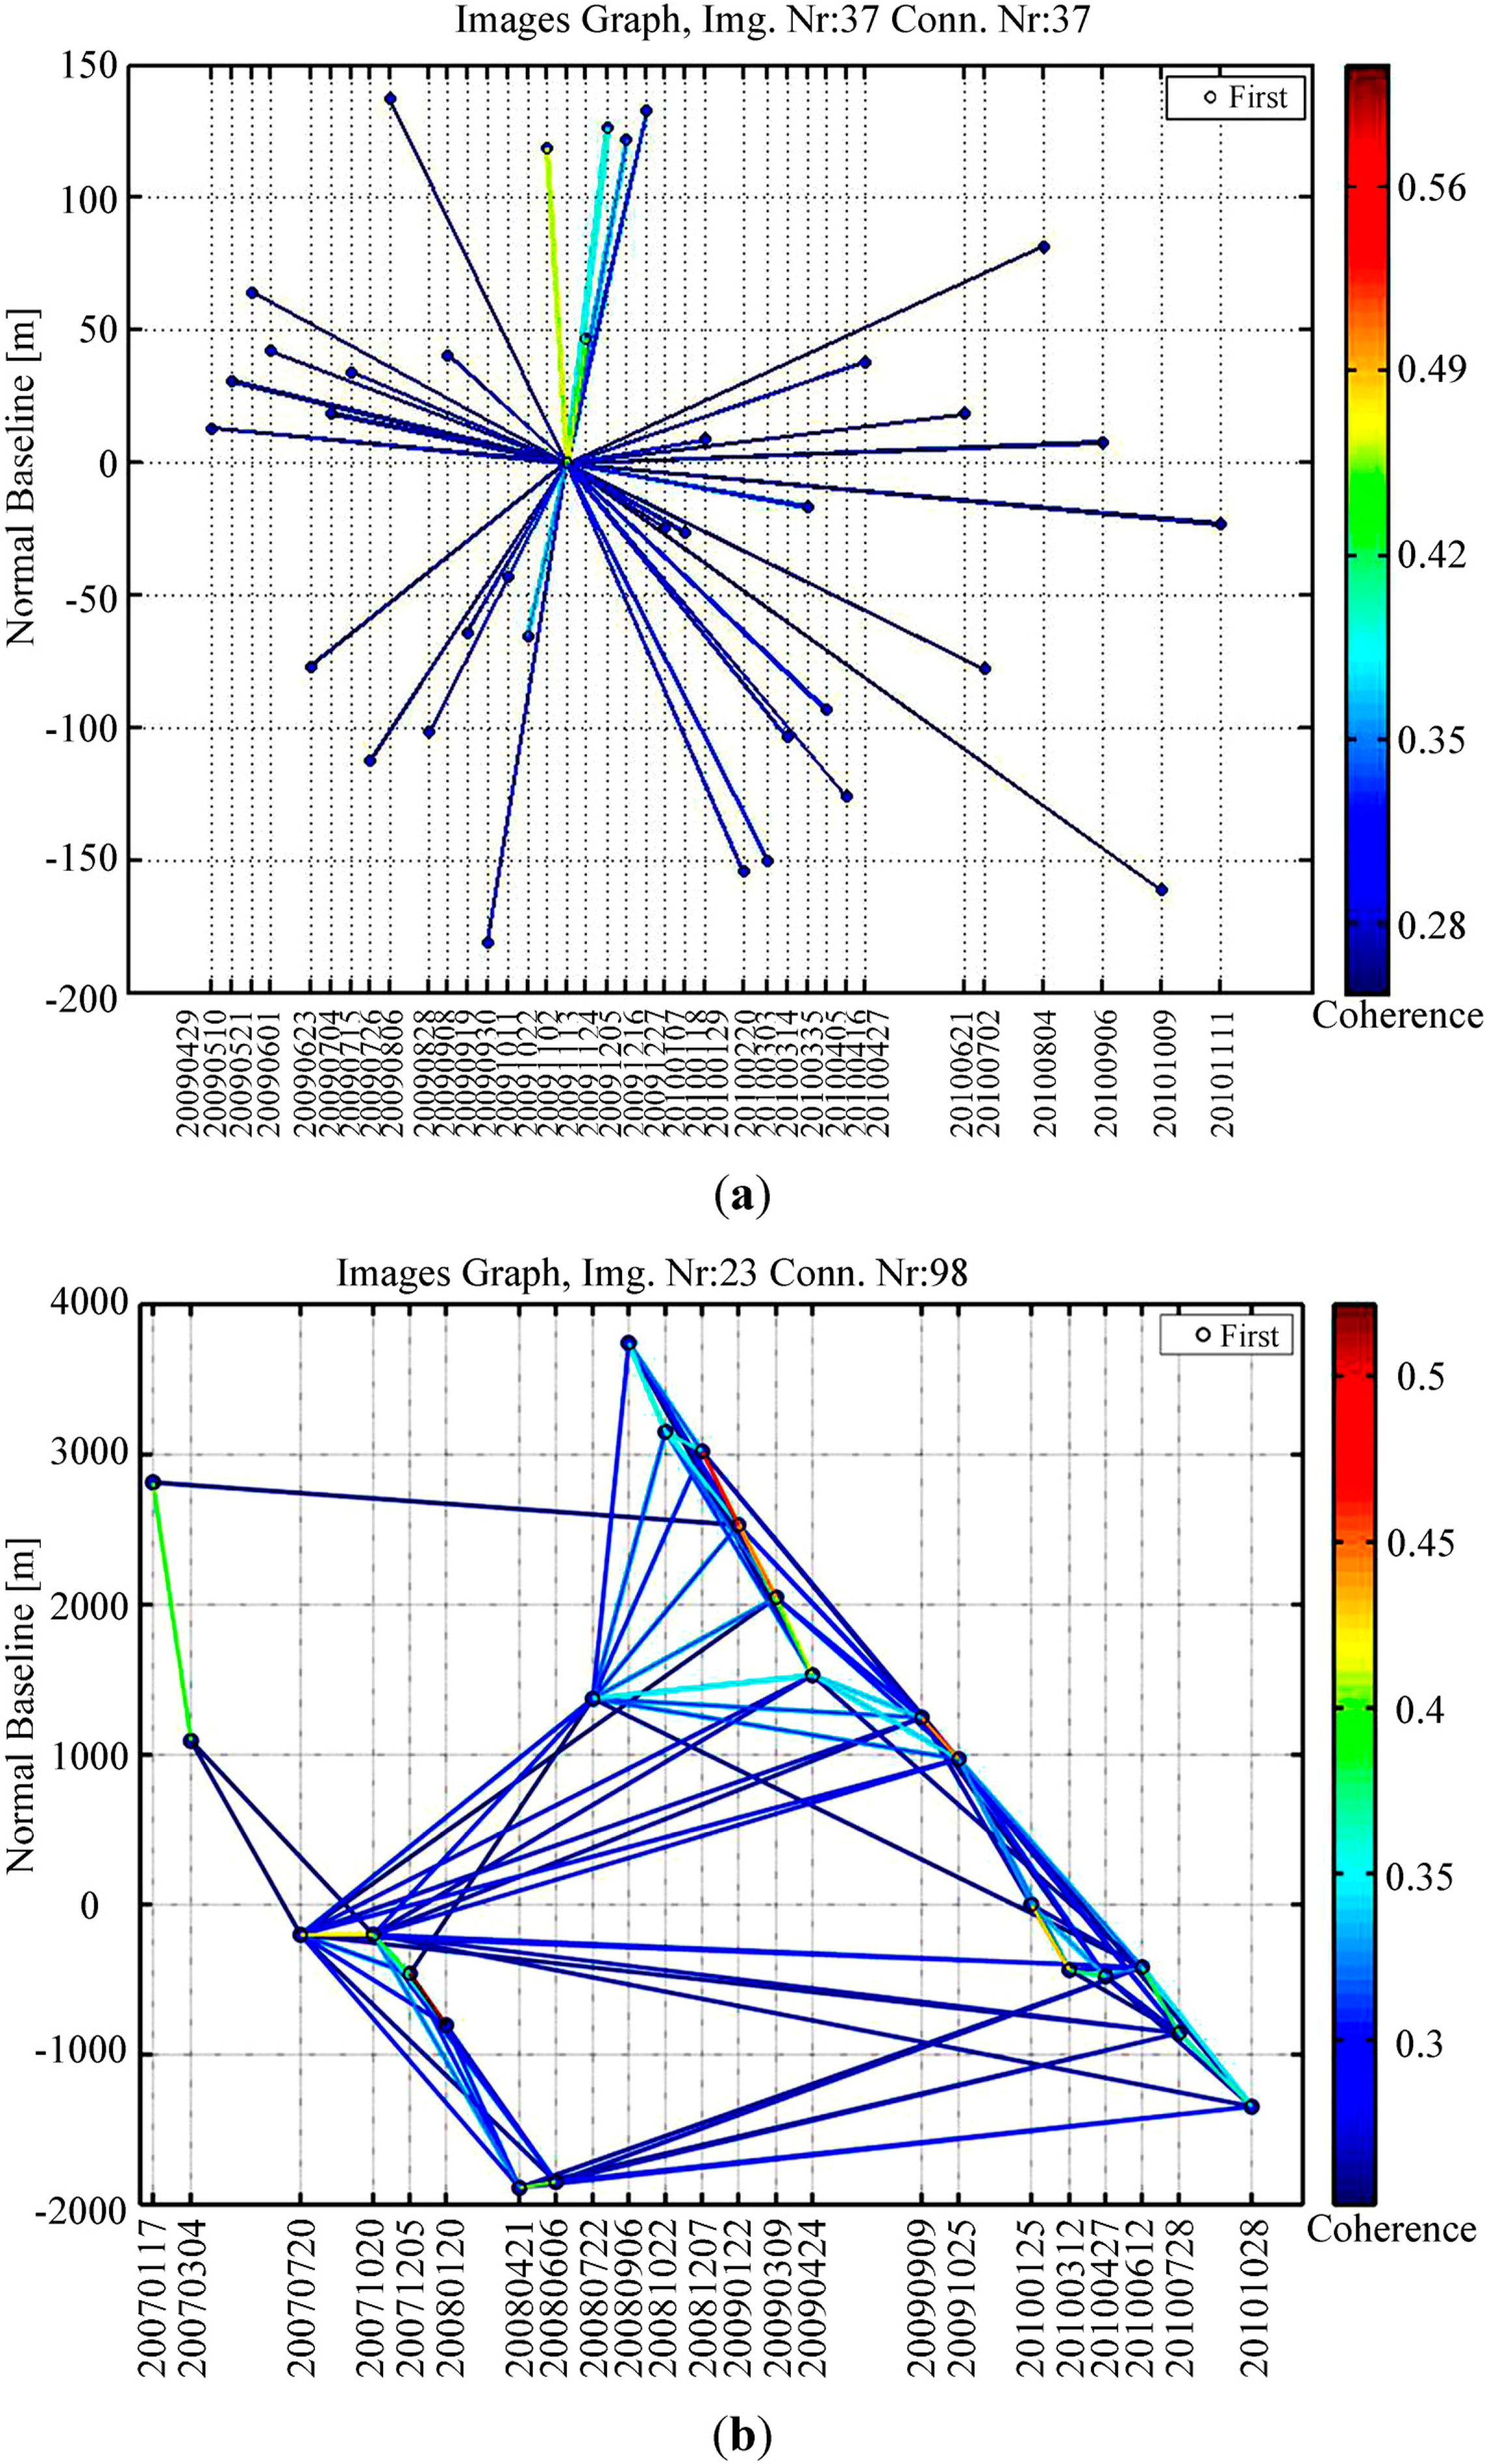
The available SAR datasets are composed of 23 ALOS-PALSAR L-band images acquired from 17 January 2007 to 28 October 2010 and 37 TSX imageries acquired from 29 April 2009 to 11 November 2010. ALOS-PALSAR images are acquired by single polarization model with the spatial resolution of about 7 m on the ground. The incidence angles of TSX and ALOS-PALSAR are 41.08 and 38.70 degrees, respectively. With the aforementioned multi-band InSAR methodology, MTInSAR analysis can be applied to process the available SAR datasets. The basic principles and algorithms of the PS and QPS technique can be referred to [4,5,14]. The PS and QPS analysis are conducted by the processing software SARPROZ [27], which provides data processing, data analysis, data visualization and data exportation in different formats. DEM from shuttle radar topography mission (SRTM) with 90 m resolution was applied for topographic phase removal. There are two major outputs for each PS analysis: average displacement velocity map derived for the whole time period and displacement history [4], displayed exploiting Google Earth imagery.
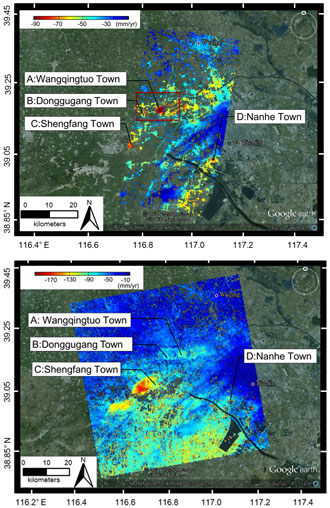
As using the same TSX dataset and PS processing with single master image (Figure 3a), the X-band MT-InSAR results are the same as published in [23], which were rectified with one reference leveling data and displayed as Figure 4a. The results can then be considered as the absolute deformation rates to some extent.
For processing ALOS-PALSAR dataset, multiple reference images were selected and 98 interferograms were generated (Figure 3b). L-band QPS analysis results can be represented as Figure 4b. More than 3,867,649 QPS points (approximately 915 QPS/km2 with the temporal coherence threshold of 0.7) were identified and the subsidence velocity ranges from −190 to −10 mm/year. The results also show that Wangqingtuo, Shengfang and Nanhe Town suffer from the serious subsidence, which matches well with X-band PS results [23].
By comparison, the spatial distribution of the targets detected from X-band PS analysis is non-homogeneous. Most targets are identified as man-made objects and they are aggregated in residential areas, where the density of targets from X-band (1500–2000 PS/km2) is far more than that from L-band (915 QPS/km2). All the advantages of X-band allow its wide applications in monitoring LMLFs and detecting thermal expansion, which requires high precision and detail information capture. However, almost no targets (0–10 PS/km2) can be detected in non-urban area from X-band MT-InSAR analysis. In the contrast, the spatial distribution of the targets identified from L-band MT-InSAR analysis seems more homogeneous (915 QPS/km2) both for the agricultural parcels and residential areas. The reasonable explanation should be the longer wavelength of L-band supports good coherence even over the vegetation areas, where more distributed targets exist instead of point-like targets and they can be detected by QPS technique.
Although there are slight differences in incidence angle and time span between L- and X-band, the accordant subsidence tendency has been detected by both methodologies when applied to different band datasets. To validate L- and X-band MT-InSAR results, further comparison will be carried out in the next section.
3.2. Validation with Leveling and GPS Data
3.2.1. Validation with Leveling
One-hundred seventy two leveling points were provided by Tianjin Institute of Surveying and Mapping with their locations illustrated in Figure 5. The accuracy of height is stated to 2 mm/km.
The possible uncertainties of InSAR results and leveling measurements have been discussed by Luo et al. [23]. The leveling points, which are outside of TSX frame or no corresponding PS point can be detected within a certain radius (200 m in our case) around, are considered as invalid points and thus discarded. Then, only 100 leveling points are left.
The leveling data were acquired only once each October from 2006 to 2011, except for no available data in 2009. Because of the strong linear deformation detected by the leveling data, the data in 2009 were interpolated according to the observations both in 2008 and in 2010. In order to carry out the validation work, the leveling data were assumed as acquired on 15 October of each year. The initial subsidence was assumed to be zero on 15 October 2006 and the accumulated subsidence of each year can be calculated by this assumption.
InSAR is sensitive to the LOS direction while leveling measures along vertical. In order to carry out the validation work, we start with the assumption that there is no horizontal deformation, which was approved by the previous work [28]. Thus, leveling data can be projected from vertical into the LOS direction. There are few chances for leveling data and the corresponding PS point located in the same place. Therefore, the nearest neighbor (NN) and average methods are two available methods to select the corresponding PS points around each leveling point.
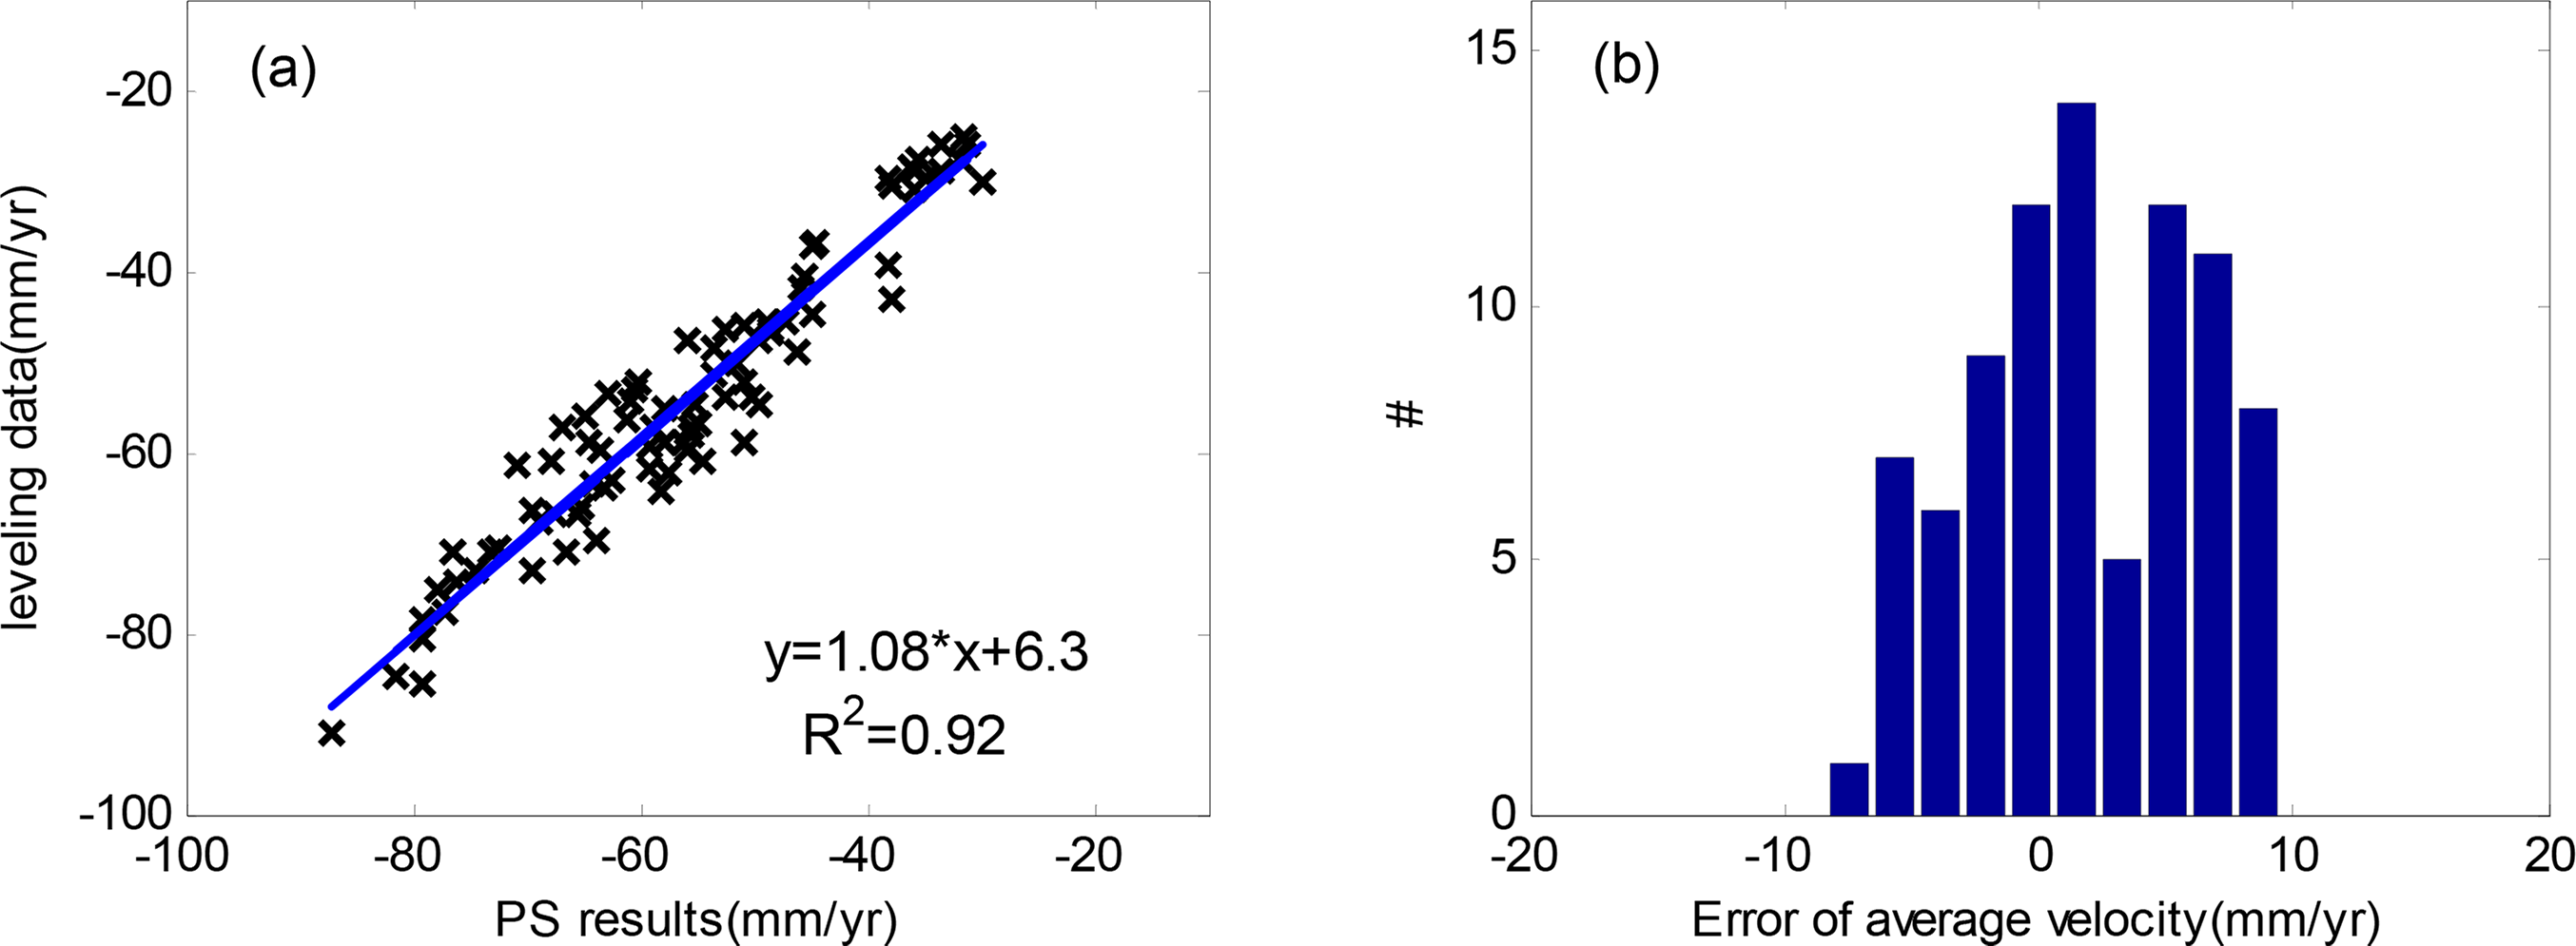
The quantitative comparison of the average subsidence rate between PS and leveling is listed in Table 1. When the average method is applied, the entire root mean square error (RMSE) is 4.84 mm/year, the minimum difference is 0.21 mm/year and maximum is 9.55 mm/year Similarly, the entire RMSE by using NN is 4.63 mm/year, the minimum error is 0.03 mm/year and maximum is 9.13 mm/year. The linear regressions of average subsidence rate are performed between PS results by using average method or NN and the leveling points as illustrated in Figure 6a,c. The correlation coefficient (CC) from average method is 0.92 and that from NN is 0.93, indicating good agreement between these two distinct measurements. The error histograms (Figure 6b,d) by using these two methods are similar, ranging from −9.7 to 9.7 mm/year. It’s worthy to note that the subsidence rate range of this area is large, ranging from −90 to −10 mm/year in LOS direction. The validation results from average and NN show similar accuracy of PS results, indicating high consistency between PS results and leveling measurements in the aspect of average subsidence rate.
Simultaneously, the average subsidence rate of QPS analysis has been validated with the leveling data. The comparison listed in Table 2 presents that the whole RMSE is 10.91 mm/year., the maximum difference is 20.68 mm/year. and the minimum is 0.00 mm/year. Similarly, the linear regression between the QPS points and leveling points has been carried out. The CC of 0.86 suggests the results of QPS analysis is in accordance with leveling measurement. From the comparison, the L-band QPS accuracy is lower than X-band PS. The most possible reason is that L-band (23 cm) owns longer wavelength and is less sensitive to the small deformation than X-band (3 cm). In addition, due to the lower spatial resolution of L-band (7 m), within one pixel, relatively larger phase variation cause larger anomaly. Therefore, an overall correlation of 0.86 and 10 mm/year. dispersion over an area of 64 × 66 km2 is a remarkable figure.
3.2.2. Validation with GPS Data
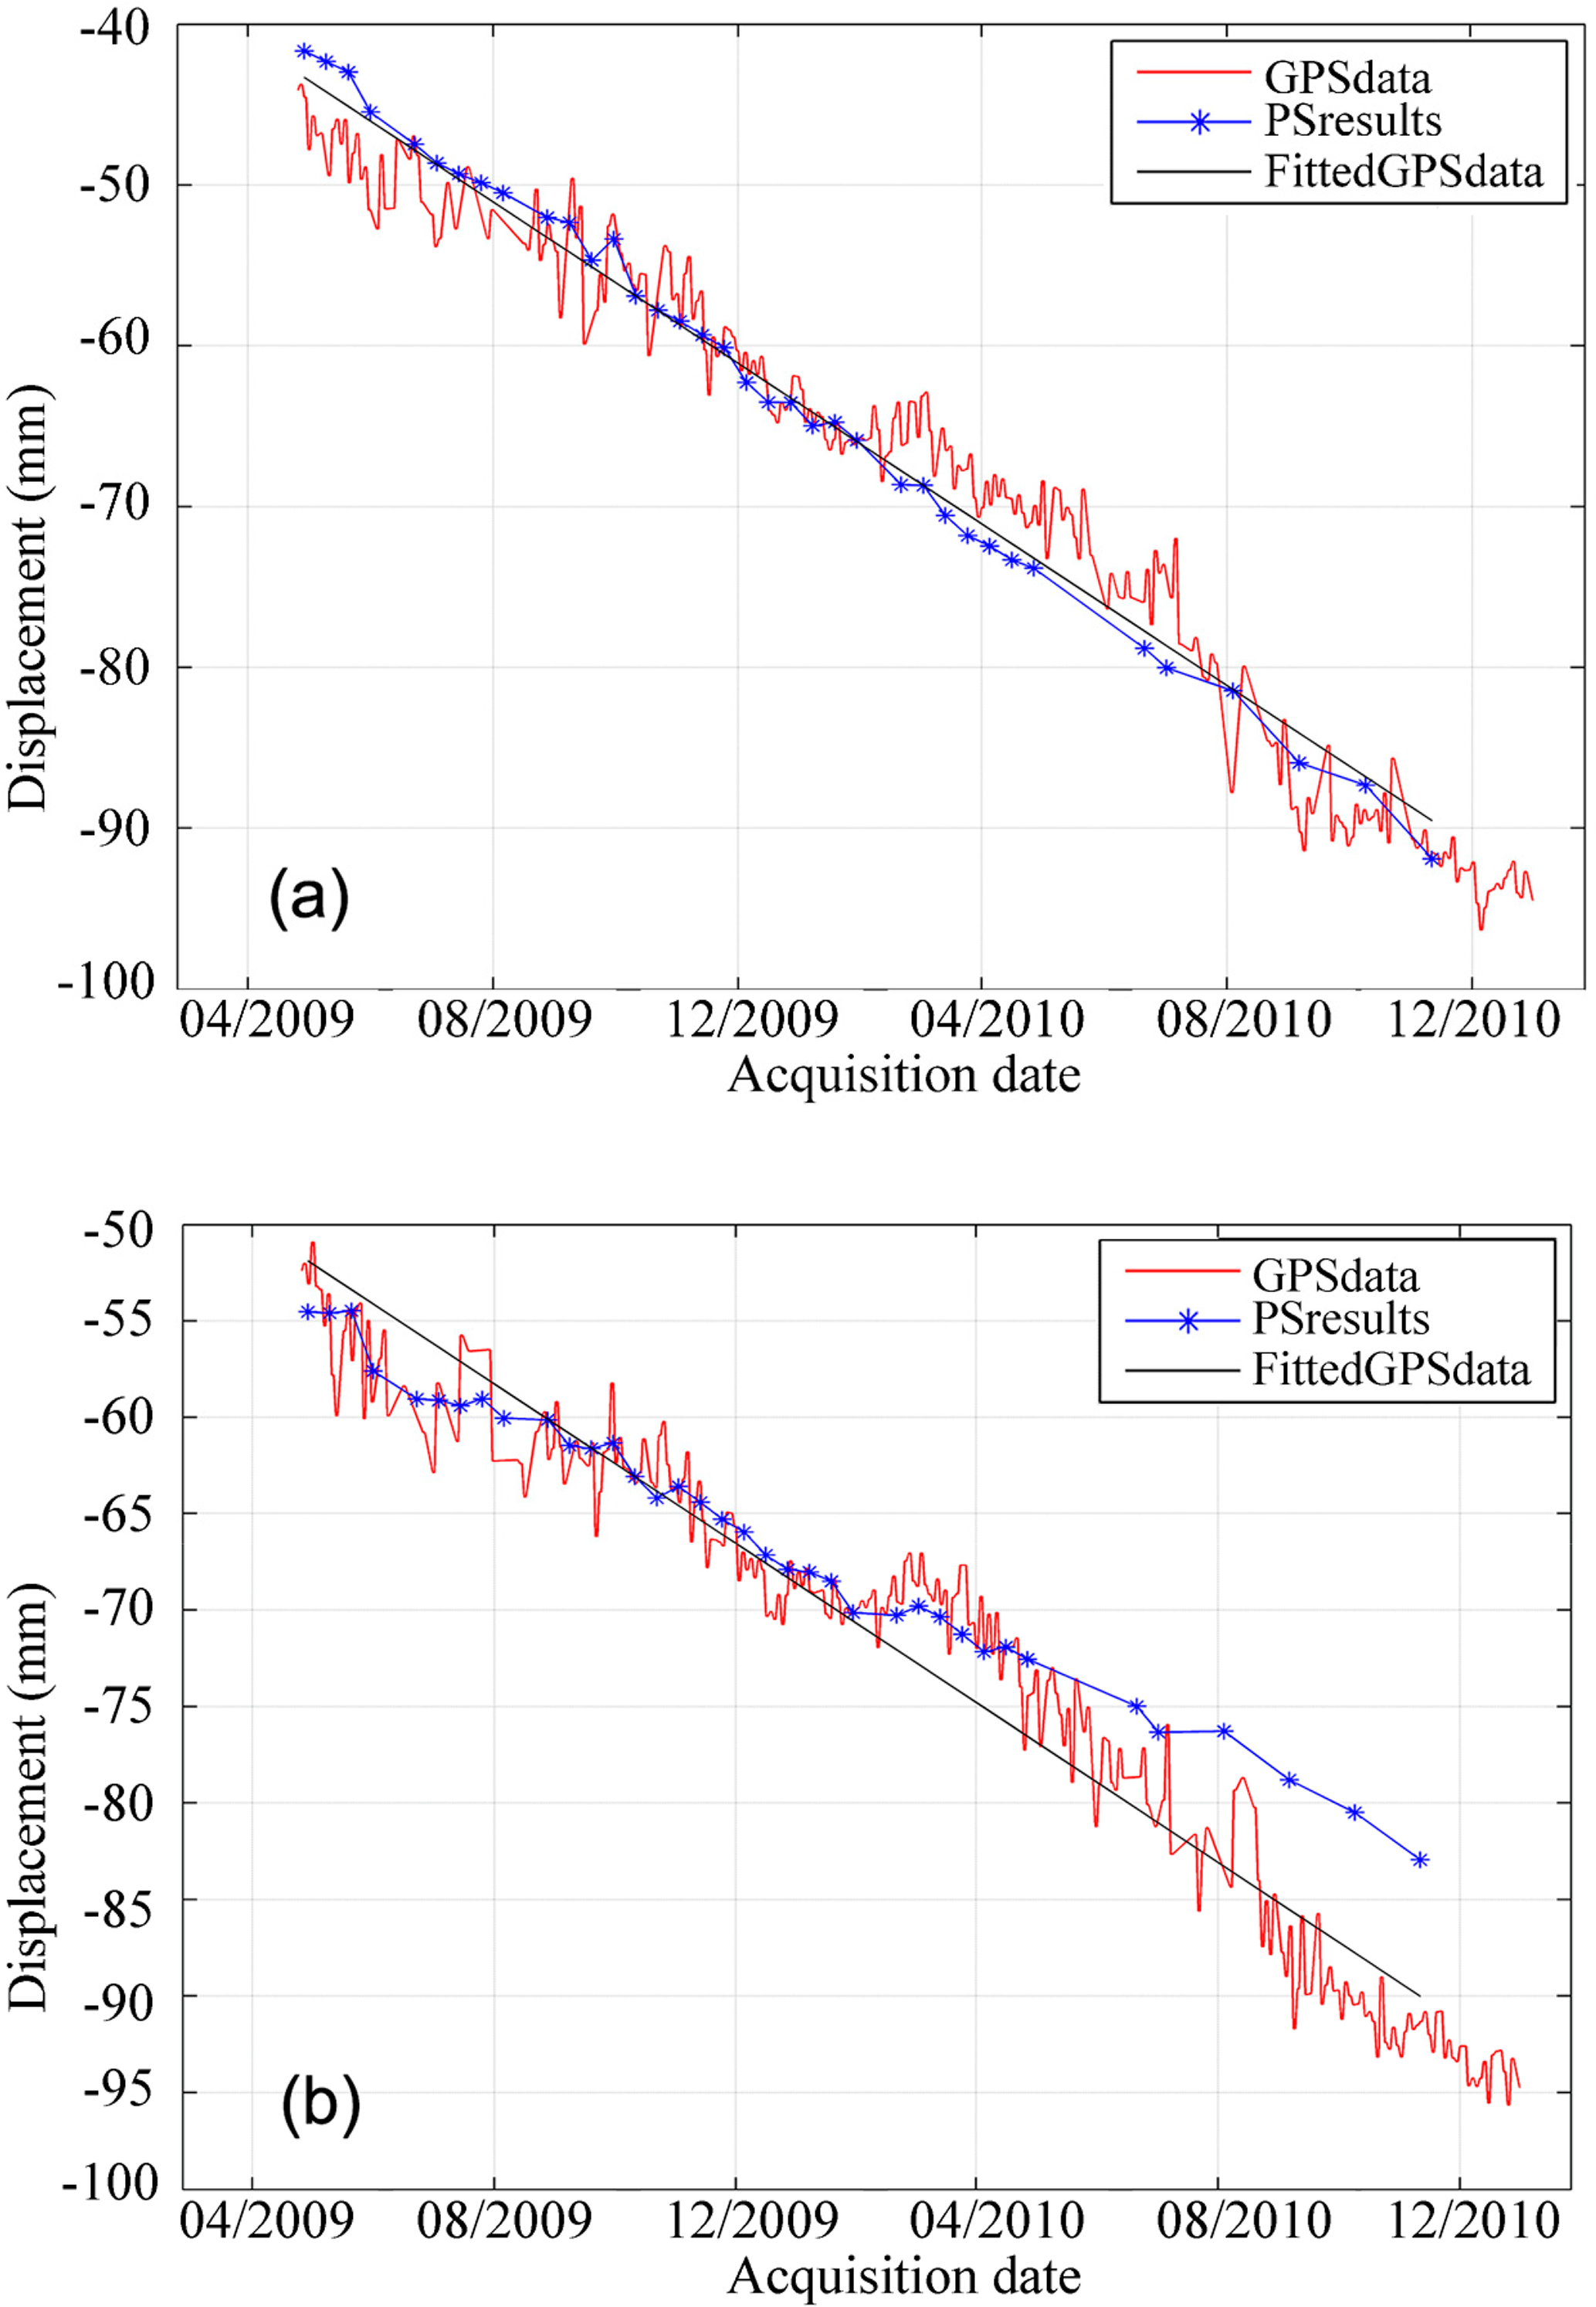
The TSX PS analysis results were also compared against GPS measurements, which were also provided by Tianjin Institute of Surveying and Mapping. The GPS measurements located in the Wuqing and Jinghai CORS were acquired from April 2009 to January 2011. Figure 7 presents the displacement time series along the LOS direction for the PS points located close to Wuqing and Jinhai CORS from 2009 to 2011. Continuous subsidence has been observed at these two PS points. The 3D deformation measured by CORS stations were projected into LOS direction based on satellite heading angle and the incidence angle. The average subsidence velocity of Wuqing Station from PS is 28.90 mm/year while that from GPS is 26.98 mm/year and the difference is 1.92 mm/year. Likewise, on Jinghai Station, the velocity from PS analysis is 15.73 mm/year while that from GPS is a little faster and that is 21.89 mm/year, that is, the difference is 6.16 mm/year. From these two stations comparison, the subsidence rate measured by TSX PS analysis shows good agreement with that measured at both Wuqing and Jinghai CORS stations. There is a discrepancy between MT-InSAR and GPS in the period during April 2010 and December 2010. A possible explanation is that we used a linear model to fit TSX data and the linear model may generate unwrapping errors which cause slight non-linear deviation to match better a wrong linear trend. From December 2009 to April 2010 the GPS data shows an average zero trend while the linear movement InSAR estimated is biased during that period, resulting in a smaller velocity. This is the drawback of adopting a linear model. More advanced techniques could be used to overcome this limitation [29].
4. Multi-Band Combination Analysis and Geological Interpretation
4.1. Multi-Band Combination Analysis
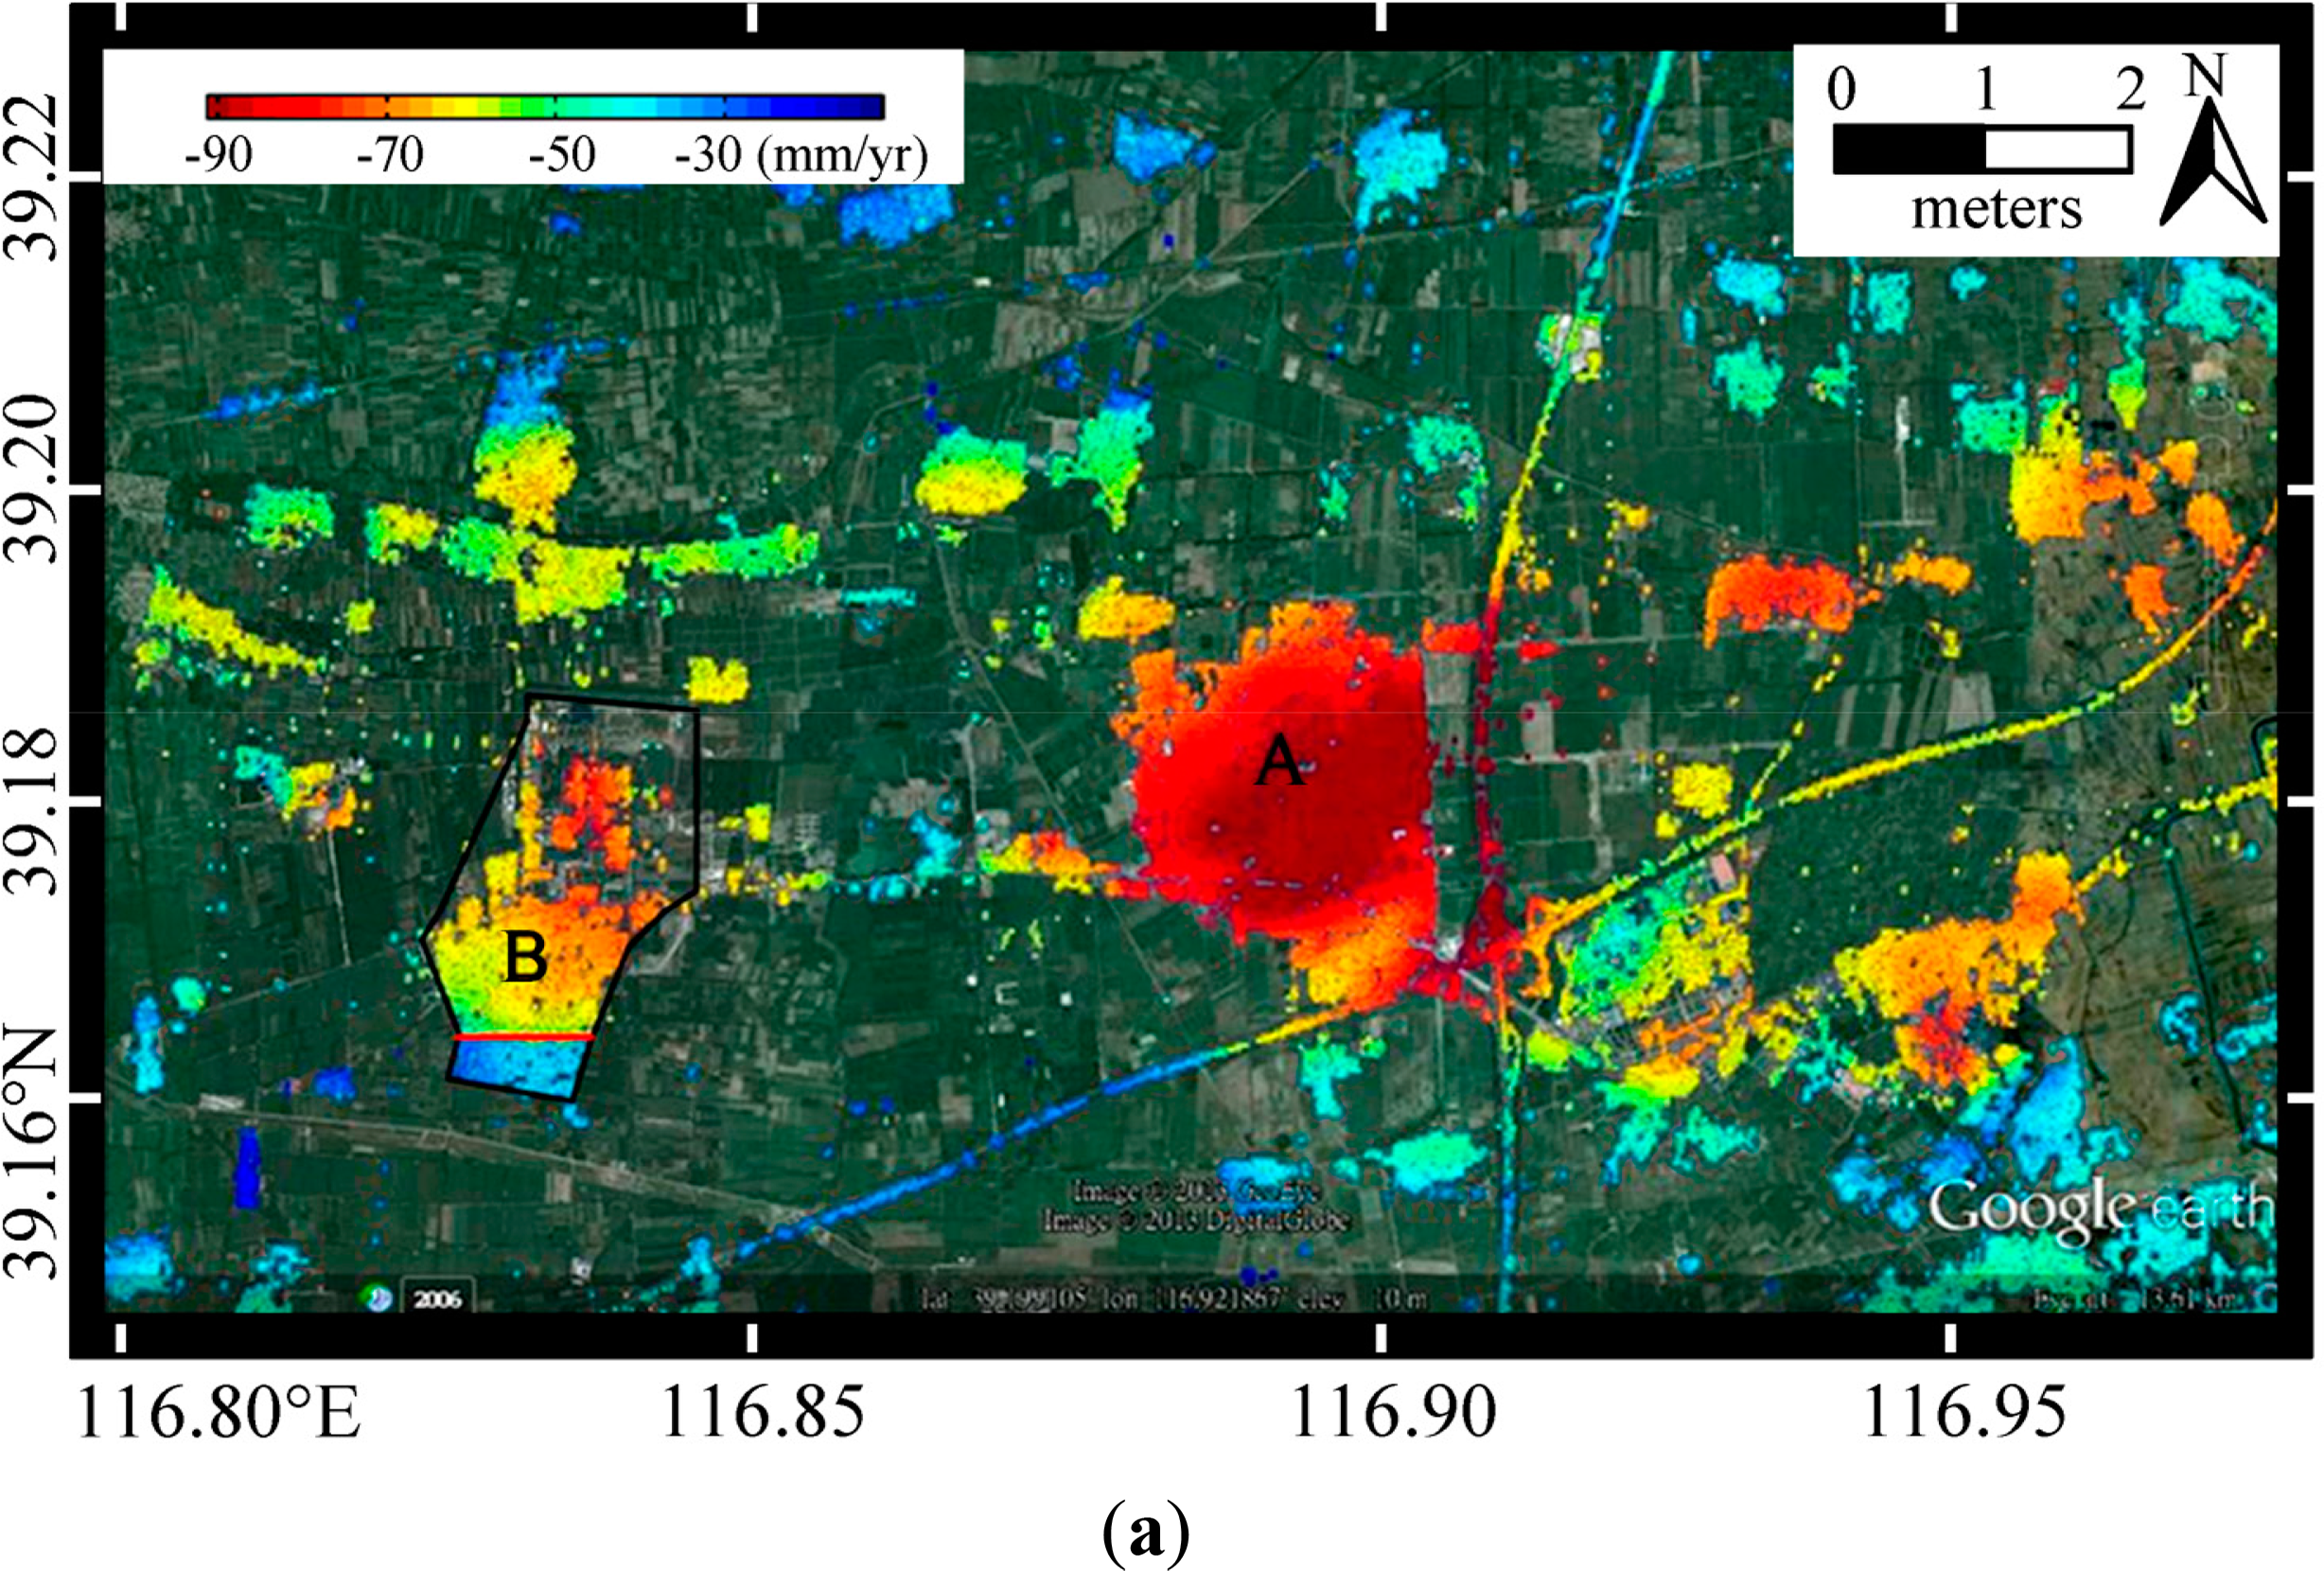
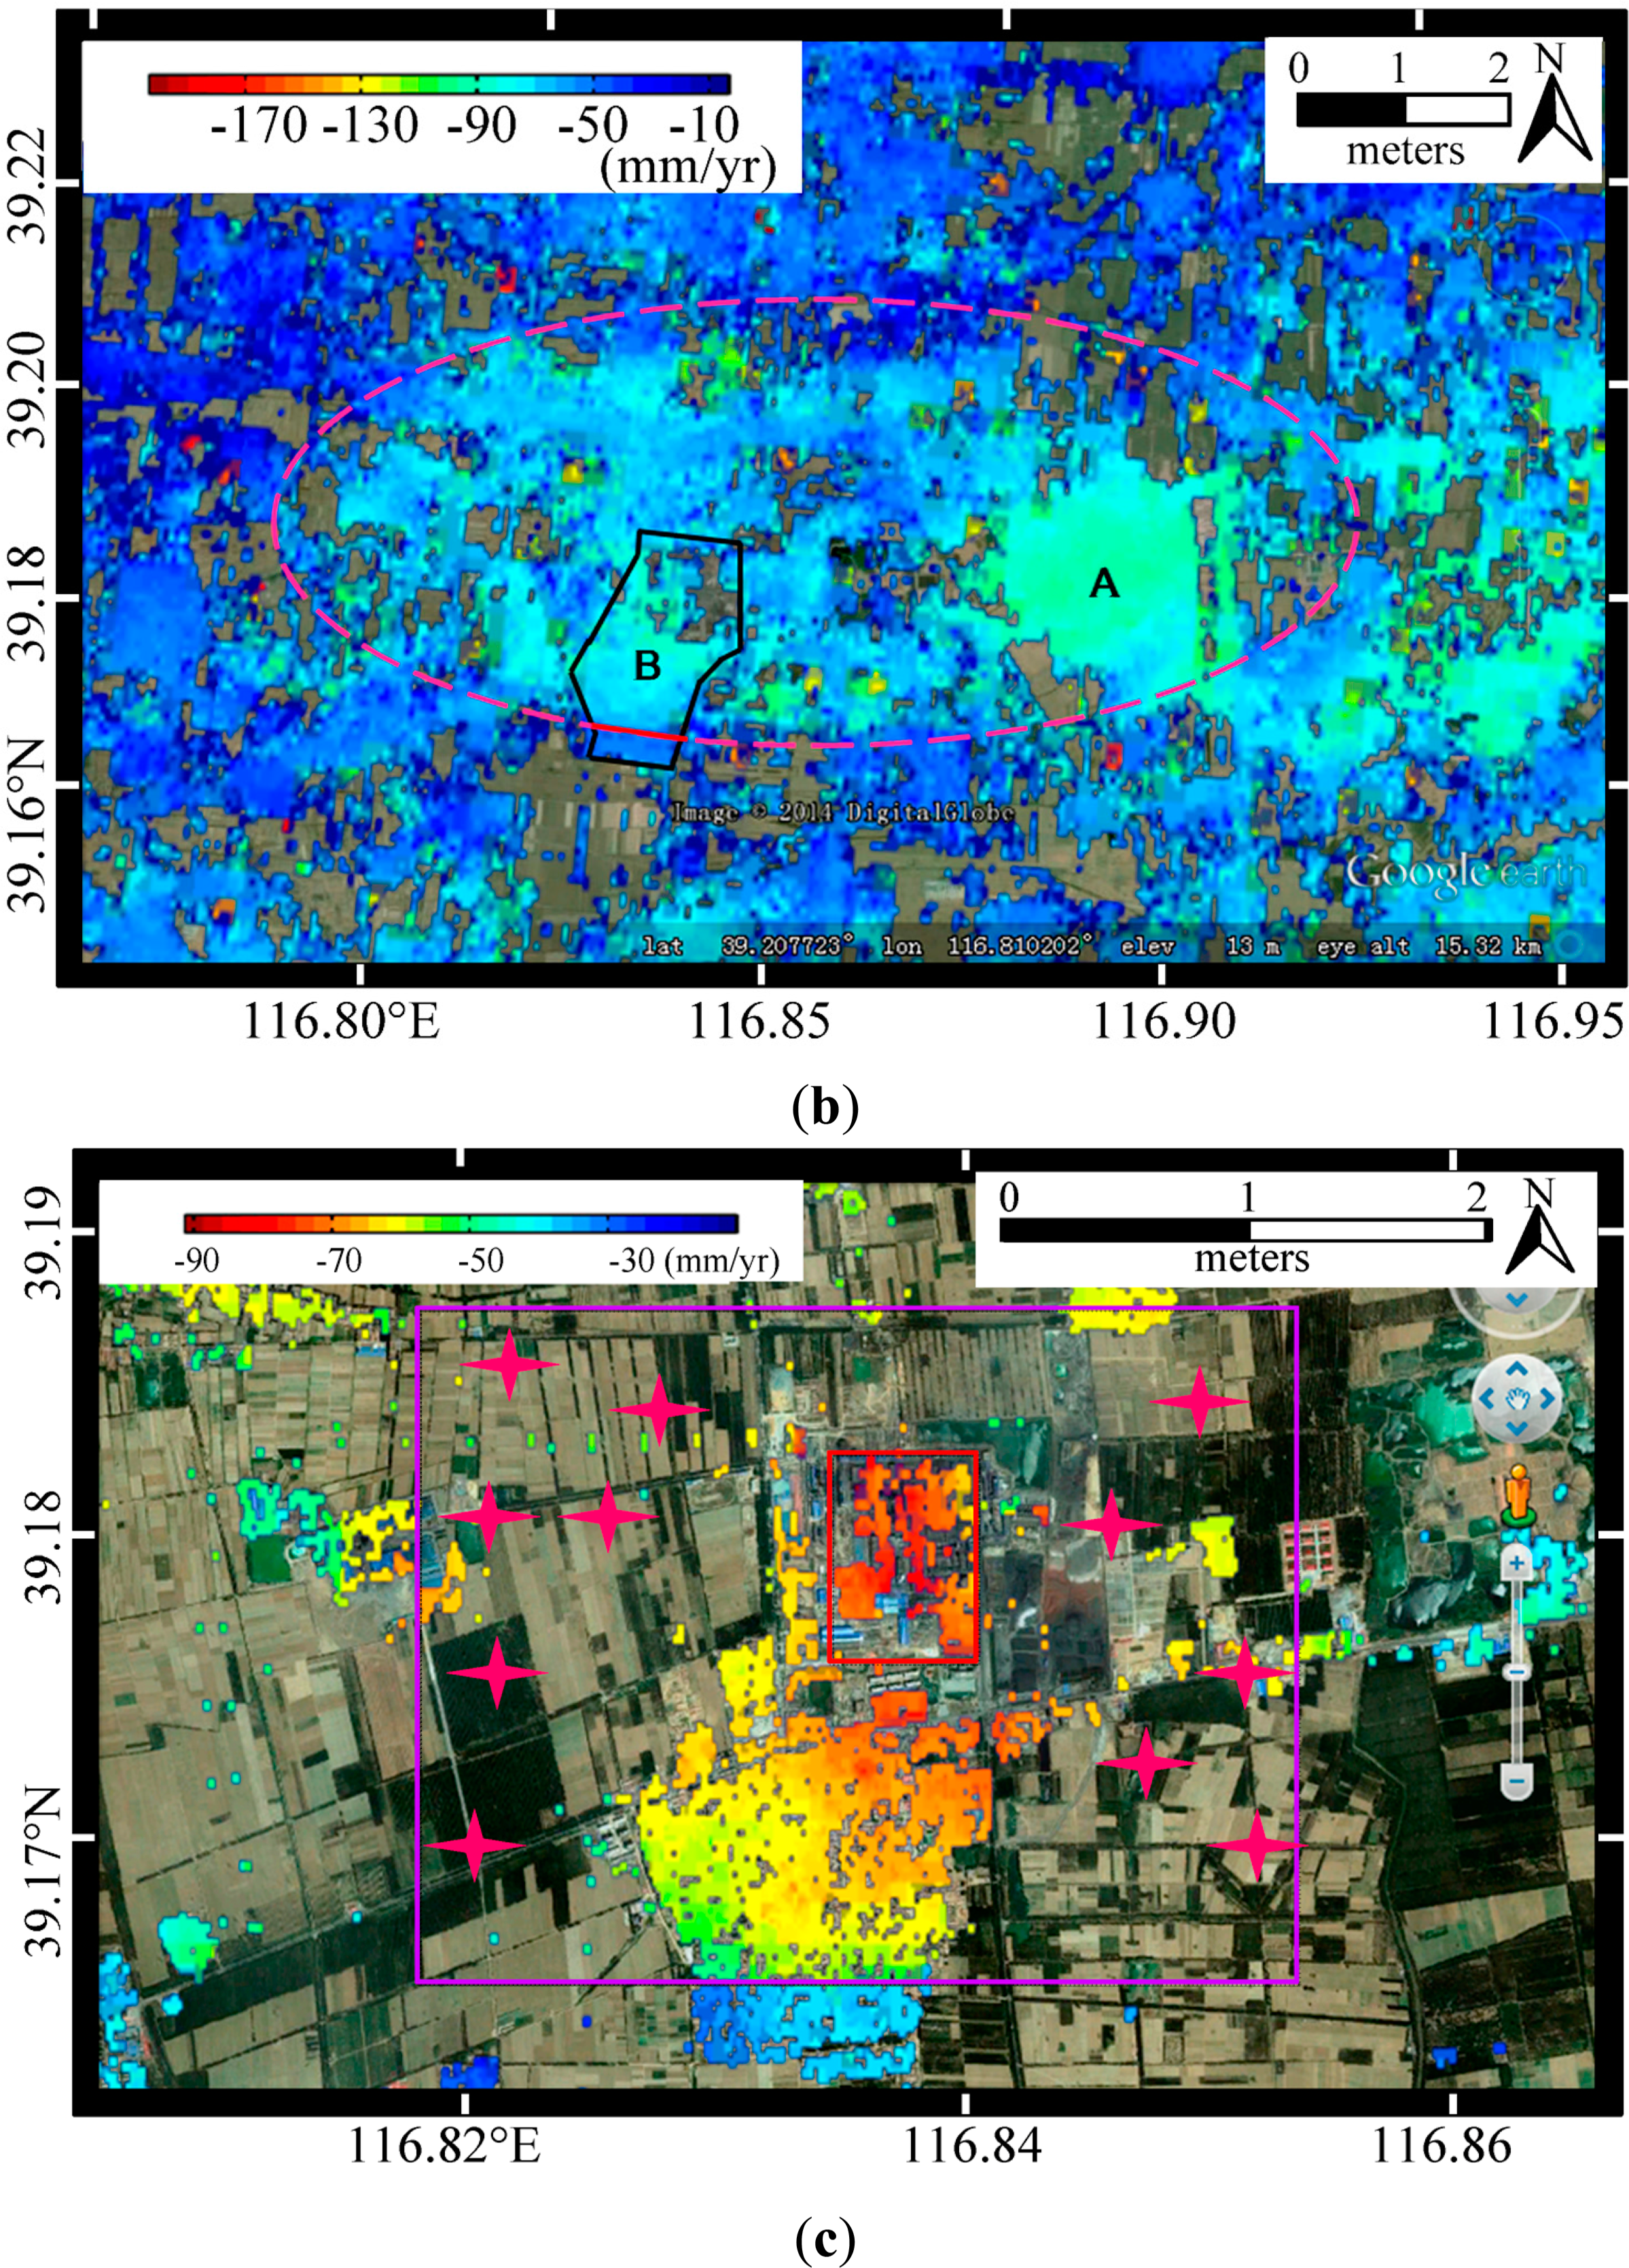
The most serious subsidence area detected in Figure 4a,b is located in Wangqingtuo Town. The enlarged image can be displayed as Figure 8a. Two towns affected by serious subsidence are marked as A: Wangqingtuo Town and B: Donggugang Town. From Section 3, we could clearly know the precision of X-band MT-InSAR results is much better than L-band. However, almost all the subsidence information of non-urban areas is missing and the subsiding center shape cannot be defined with Figure 8a alone. Then, the L-band MT-InSAR analysis results of the corresponding area were extracted from Figure 4b are shown in Figure 8b. With the aid of L-band MT-InSAR results, the comprehensive subsidence information in both vegetated area and constructed area can be extracted and the shape of subsiding center can be defined and highlighted with pink circle. Thus, the combination analysis of multi-band MT-InSAR can not only provide the high precision and detail information, but also allow us to access the comprehensive subsidence information.
In order to figure out the subsidence mechanism, the field trip has been conducted. Wangqingtuo Town is the biggest town for producing bicycles in China. More than 70 factories are producing bicycle accessories. The whole manufacturing progress needs large amount of water, especially for electroplating. Most of the local industrial water comes from underground. The serious subsidence in Wangqingtuo Town draws intense attention and most of electroplating factories have been moved into Hebei province. However, from the detected serious subsidence results, it seems that continuous industrial development and domestic water cannot effectively slow down the subsidence rate.
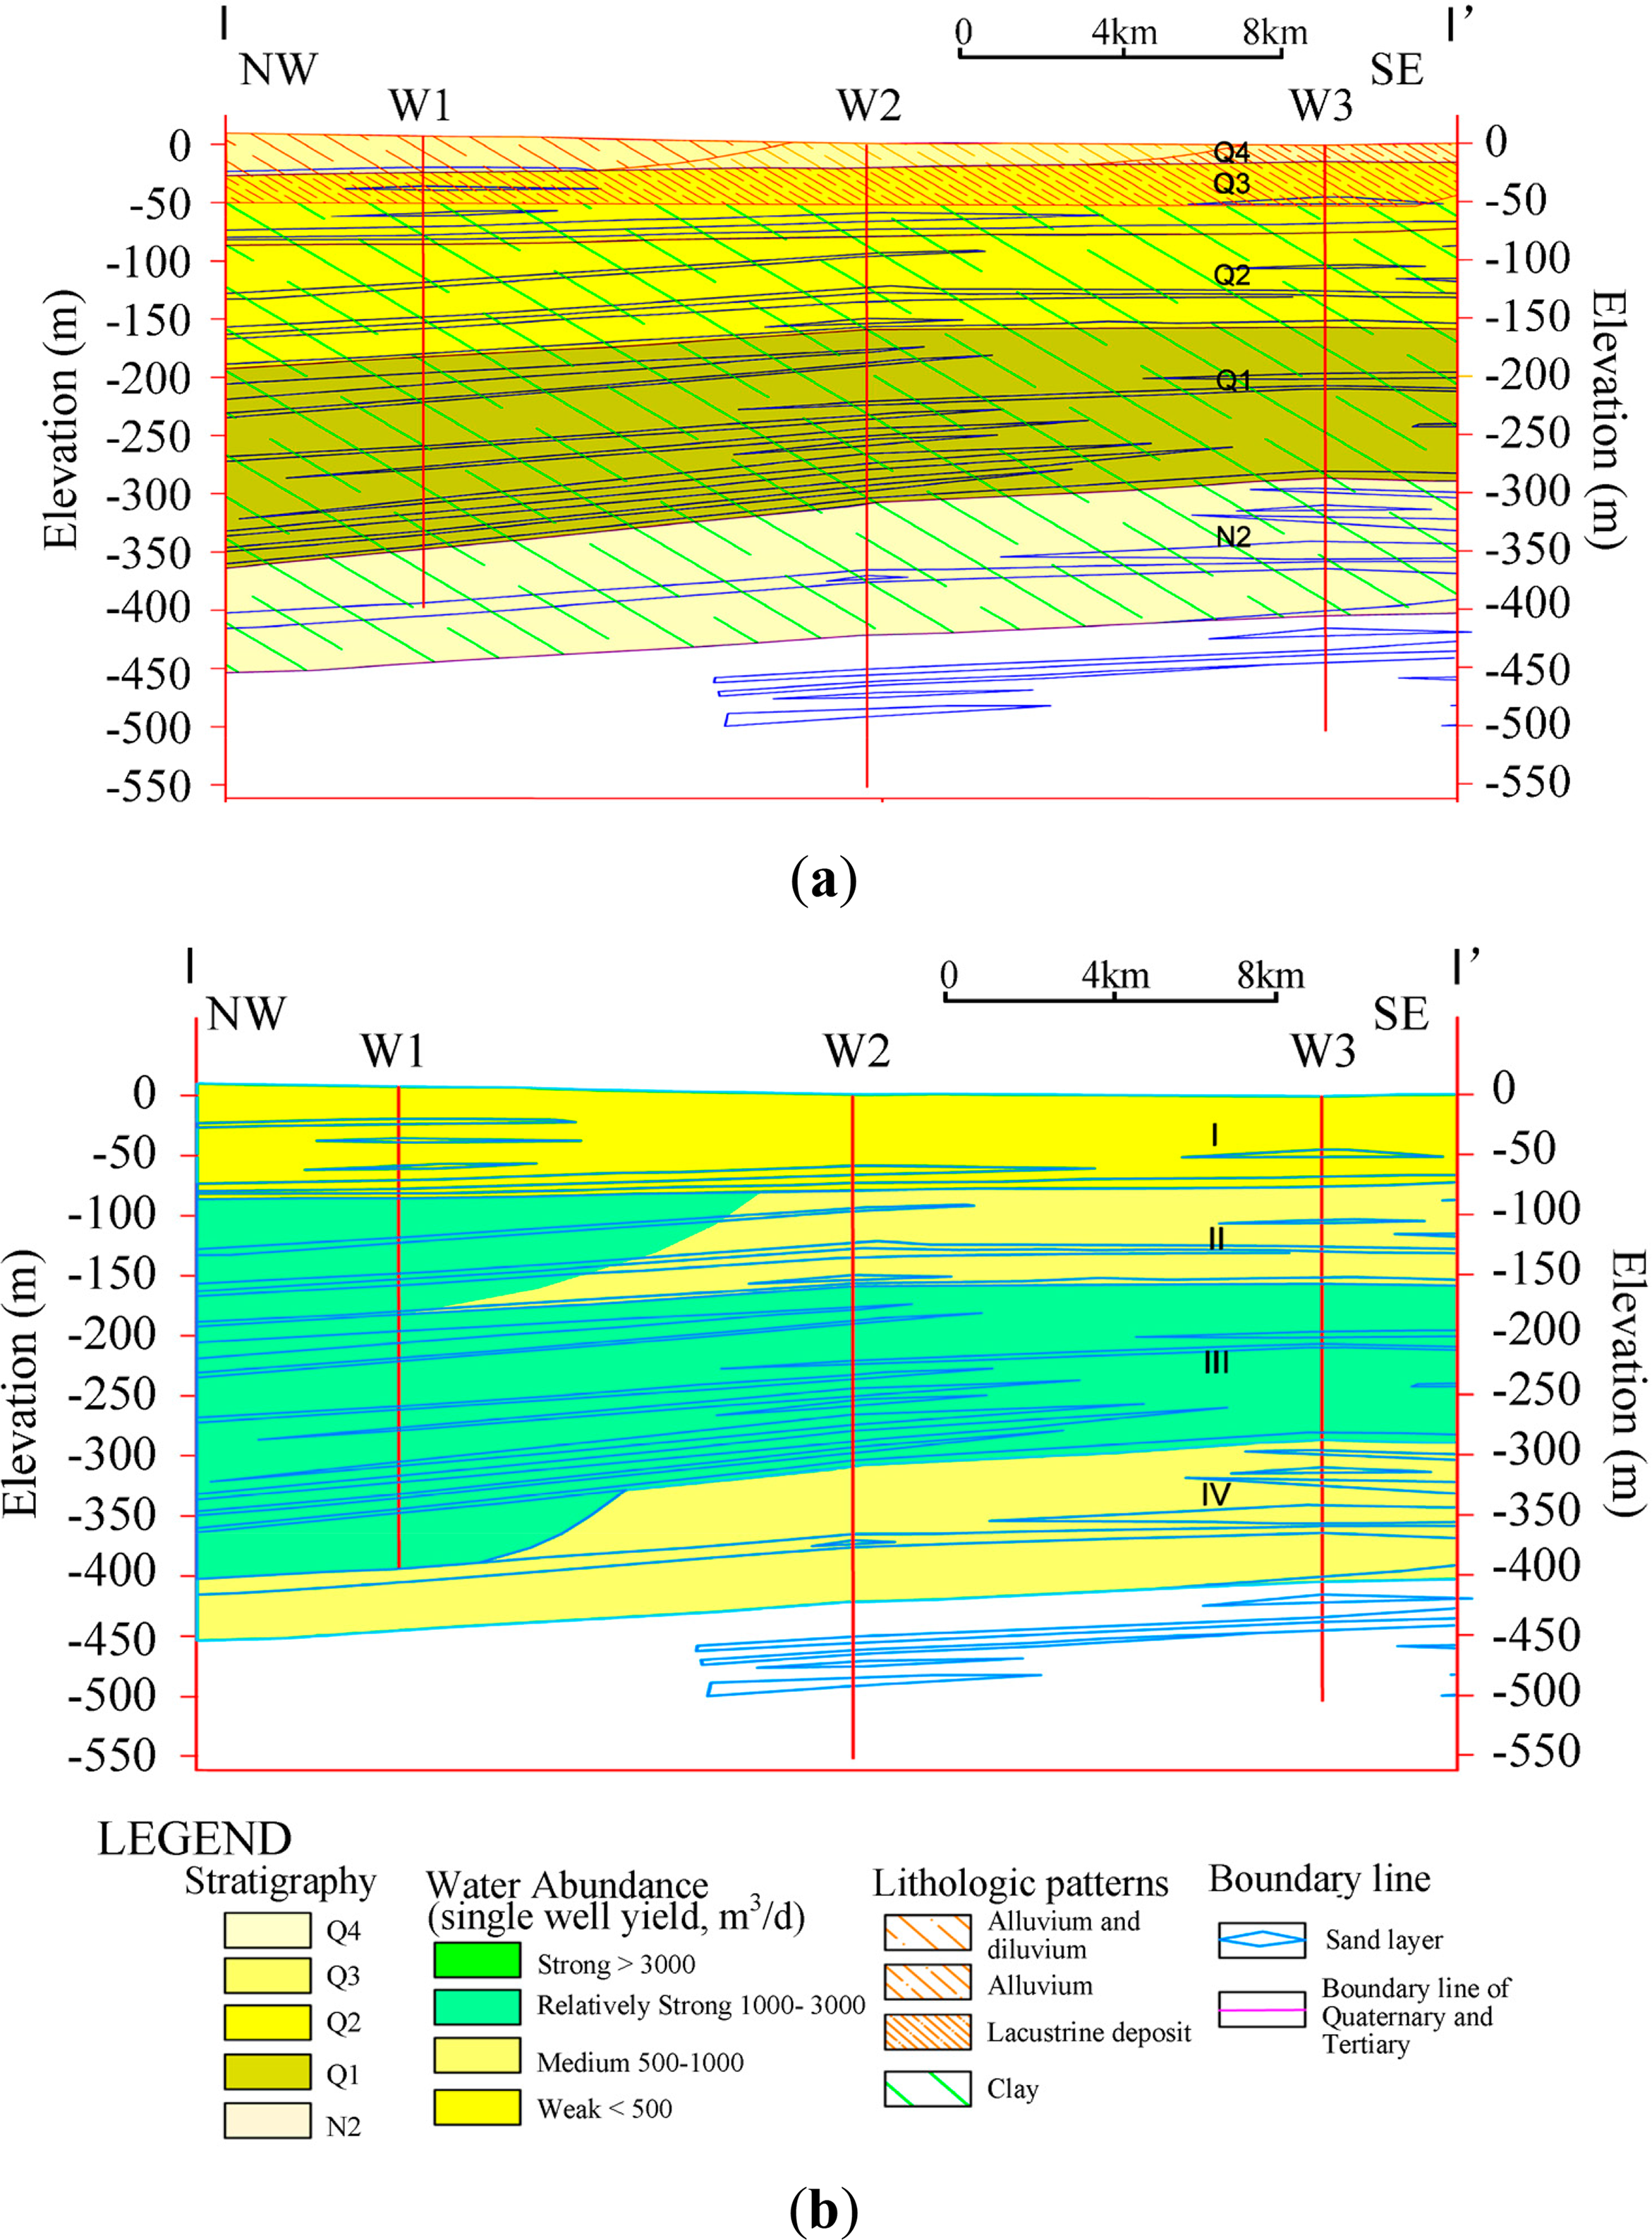
Furthermore, a clear border line (marked with red line in Figure 8a) between blue part and yellow part in Donggugang Town indicates huge differences of subsidence rates within these two parts. With Figure 8b, the red line in Figure 8a can be identified as part of the edge of the subsiding center highlighted by pink circle. B in Figure 8a can be enlarged as Figure 8c. With the aid of field trip, the reason for causing serious subsidence in B (Figure 8c) is also related to industrial underground water withdrawal. Shengbao Steel Pipe is located in the north severe subsidence area (marked with red frame in Figure 8c). In order to meet the demand of industrial production, dozens of water towers (marked with pink stars in Figure 8c) are built for underground water withdrawal ranging from minus 400 m to the ground. They are distributed within the whole town including south residential area (highlighted by purple frame in Figure 8c), working day and night. Thus, the large amount of water demand of Shengbao Steel Pipe is one of the major reasons for causing severer subsidence in Donggugang Town. However, the different subsidence rates on both sides of red line in Figure 8a most possibly result from the different geological conditions. One well was investigated to drill in the blue area represented in Figure 8c. When drilling at −100 m using diamond drilling machine, they found a rock layer. It can be deduced that more than 100 m below is rock, and engineering geology is good. Thus, the border line (see red line in Figure 8a) is most likely to be Contact line and the huge difference of the subsidence rates on two sides along the border line is most likely due to the different geological conditions.
4.2. Geological Interpretation
As stated above, excessive use of underground water resources is the major contribution to subsidence in Tianjin. However, groundwater withdrawal is not the only reason that causes subsiding centers because of the connectivity of water. Natural factors are another primary type of causes for ground subsidence. Natural factors include tectonic subsidence and soft soil consolidation. Previous investigations have shown that the tectonic subsidence rate is 1.3∼2.0 mm/year [30]. The consolidation states of soil can be divided into those areas with under-consolidation, normal-consolidation, and over-consolidation. The soil in most areas in Tianjin is in a state of under-consolidation, which can cause subsidence due to gravity over a long period. Our investigation indicates an existence of Quaternary geology as another prominent factor for causing ground surface subsidence in different degrees.
Most of our study area was covered by Quaternary sediment, ranging from −400 to 0 m underground as illustrated in Figure 9a. Quaternary sediment can be divided into upper Pleistocene, middle Pleistocene, lower Pleistocene and Holocene according to the timeline, named as Q1∼Q4. As illustrated in Figure 9a, alluvium, alluvium and diluvium, and lacustrine deposit are three kinds of involved quaternary sediments. In particular, Q4 is only about 20–30 m at the top layer as the porosity of sediments in the area, which has a great impact on the degree of subsidence when shallow underground water is withdrawn. The surface of Wangqingtuo town (marked with W1 in Figure 9a) is formed by alluvial-diluvial, while the surrounding is alluvium and lacustrine deposit. The gravel diameters of dinas in these three sediments decrease successively. Alluvial-diluvial deposit is composed of fine sand and silty sand resulting in high porosity. However, the main component of the other two deposits (alluvium deposit and lacustrine deposit) is clay, and the associated porosity is low. Thus, subsidence in shallow layer happens more easily in alluvial-diluvial deposit, when the same amount of underground-water is withdrawn. This could be a good explanation to the severe subsidence of Wangqingtuo Town. Therefore, underground water withdrawal plays a dominant role in the subsidence in Tianjin suburbs. However other factors, such as lithological patterns, also have impacts on the degree of subsidence. For deeper understanding, more investigation and geological materials are exhibited as follows.
As illustrated in Figure 9b, the aquifer is divided into four layers with Layer I at depth of 30∼70 m, Layer II at depth of 180∼220 m, Layer III at depth of 280∼320 m, and Layer II at depth of 370∼430 m. The stratigraphic age increases with depth from Q4 to N2. Groundwater flows eastward in the upper two layers and changed to southeastward in the third layer. Layer I belongs to shallow groundwater while the other three groups belong to deep phreatic water. We can take single well yield with same well diameter (Φ203 mm, 8″) and drawdown (S = 15 m) as water abundance assessment. Water yield property can be divided into strong (single well yield >3000 m3/d), relatively strong (1000∼3000 m3/d), medium (500∼1000 m3/d), and weak (<100 m3/d). The water yield property of aquifer group I in Wangqingtuo Town and surroundings is in weak class. Layer II and Layer IV in Wangqingtuo Town is a relatively strong class while surroundings are in medium class. Layer III in Wangqingtuo Town and surroundings are both in relatively strong class. That means the deep phreatic water in Wangqingtuo Town is relatively rich while the shallow groundwater is poor. That is, when the same amount of water is withdrawed, subsidence happens easily in superficial zone. Then, we can draw the conclusion that extraction of shallow groundwater can cause more serious subsidence than extraction of deep phreatic water do in Wangqingtuo Town. In other aspect, it reveals that the different spatial subsidence rate within the same geographic unit of this area may be related to the depth of the well.
5. Conclusions
X-band SAR system provides data with high resolution and short revisit time. However, the coherence is relatively low in vegetated areas. Meanwhile, L-band sensor has global coverage and good coherence while it has long revisit time and low spatial resolution. They can be regarded as complementary. In this paper, we have presented the L-and X-band MT-InSAR analysis for monitoring of subsidence in Tianjin.
- (1)
We proposed a strategy for combination of L- and X-band that can be fruitfully used to draw a global acquisition planning for satellites like TSX, with high potentiality but not global coverage. Areas with evident motion are extracted from L band interferograms. Consequently, PS analyses are carried out on small areas corresponding to the motion observed in L-band. It can also be used to monitor the subsidence over wide area with fast extraction, low cost and high precision.
- (2)
With multi-band InSAR data, MT-InSAR analyses were carried out by applying PS/QPS analysis, taking Tianjin suburbs as the study area. The subsidence patterns derived from L- and X-band MT-InSAR analysis are observed to have a good agreement, although they are acquired in different incidence angles and time periods with different wavelengths. Three areas with obvious motion, including Wangqingtuo, Shengfang and Nanhe Town, are detected from both L- and X-band MT-InSAR analysis.
As for the outcome, there are significant differences in the distribution of PS points between L- and X-band MT-InSAR analysis results. The vast majority of targets concentrated in residential areas (1500–2000 PS/km2) and almost no targets in vegetated areas (0–10 PS/km2) from X-band MT-InSAR analysis, due to the location of man-made objects. Comparatively, the spatial distribution of targets detected from L-band MT-InSAR analysis is more homogeneous (915 QPS/km2), because longer wavelength of L-band allows good coherence even over vegetated areas and QPS technique is capable of detecting distributed targets.
- (3)
The experiment MT-InSAR results has been validated with the leveling and GPS data. The X-band PS quantitative analysis with the leveling data shows 0.93 correlation coefficient (CC) and 5 mm dispersion, indicating very good agreement even under the given ambiguities. Simultaneously, the average velocity validation of L-band QPS results achieves 0.86 correlation and 11 mm/year dispersion, fitting well with leveling data under the condition of wide area fast subsiding. The X-band MT-InSAR results have been validated with GPS data, which demonstrates a good agreement.
- (4)
L-band MT-InSAR analysis makes complementary to X-band MT-InSAR analysis in the vegetable areas, which helps us to identify the shape and the borderline of subsiding centers. Ground survey provides evidences that industrial underground water withdrawal maybe the major reason for causing subsidence in Tianjin suburbs. Moreover, the different subsidence rates are also related to the difference of geological conditions.
- (5)
Geological interpretation gives evidence for supporting underground water withdrawal of industrial areas, which is a major cause of serious subsidence in Tianjin Suburbs. Moreover, the degree of the subsidence also depends on the lithological patterns and the depth of the wells used for water withdrawal.
Acknowledgments
The TSX data were provided by Infoterra Germany and ALOS-PALSAR data were provided by Japanese Earth Remote Sensing Data Analysis Center (ERSDAC). The software of SARPROZ was developed by Daniele Perissin. Thanks for the technical support from Wei Wang, Tianjin Institute of surveying and mapping. This research was partially supported by the Direct Grant (Proj. Ref. No. 2021113), the Research Grants Council (RGC) General Research Fund (GRF) (Proj. Ref. No. 415911) of HKSAR and National Natural Science Foundation of China (grant No. 41101370, 41371388).
Author Contributions
Daniele Perissin contributes most to this manuscript. He offered the SARPROZ software developed by him. He has made the main contribution to the whole idea and data processing and analysis. Yuanzhi Zhang supported the geological interpretation and analysis of the results. Youliang Jia provided significant input to the validation between InSAR results and in situ data. All of the authors contributed to editing and reviewing the manuscript.
Conflicts of Interest
The authors declare no conflict of interest.
References
- Yu, Q.; Wang, W.; Yi, C. Design and application of an automatic system for land-subsidence and water table monitoring in Tianjin City. Ground Water 2007, 29, 101–104. [Google Scholar]
- Zebker, H.A.; Villasenor, J. Decorrelation in interferometric radar echoes. IEEE Trans. Geosci. Remote Sens 1992, 30, 950–959. [Google Scholar]
- Zebker, H.A.; Rosen, P. Atmospheric artifacts in interferometric SAR surface deformation and topographic maps. J. Geophys. Res. Solid Earth 1997, 102, 7547–7563. [Google Scholar]
- Ferretti, A.; Prati, C.; Rocca, F. Permanent scatterers in SAR interferometry. IEEE Trans. Geosci. Remote Sens 2001, 39, 8–20. [Google Scholar]
- Ferretti, A.; Prati, C.; Rocca, F. Nonlinear subsidence rate estimation using permanent scatterers in differential SAR interferometry. IEEE Trans. Geosci. Remote Sens 2000, 38, 2202–2212. [Google Scholar]
- Ferretti, A.; Savio, G.; Barzaghi, R.; Borghi, A.; Musazzi, S.; Novali, F.; Prati, C.; Rocca, F. Submillimeter accuracy of InSAR time series: Experimental validation. IEEE Trans. Geosci. Remote Sens 2007, 45, 1142–1153. [Google Scholar]
- Hooper, A.; Zebker, H.; Segall, P.; Kampes, B. A new method for measuring deformation on volcanoes and other natural terrains using InSAR persistent scatterers. Geophys. Res. Lett 2004, 31. [Google Scholar] [CrossRef]
- Mora, O.; Mallorqui, J.J.; Broquetas, A. Linear and nonlinear terrain deformation maps from a reduced set of interferometric SAR images. IEEE Trans. Geosci. Remote Sens 2003, 41, 2243–2253. [Google Scholar]
- Lanari, R.; Mora, O.; Manunta, M.; Mallorquí, J.J.; Berardino, P.; Sansosti, E. A small-baseline approach for investigating deformations on full-resolution differential SAR interferograms. IEEE Trans. Geosci. Remote Sens 2004, 42, 1377–1386. [Google Scholar]
- Berardino, P.; Fornaro, G.; Lanari, R.; Sansosti, E. A new algorithm for surface deformation monitoring based on small baseline differential SAR interferograms. IEEE Trans. Geosci. Remote Sens 2002, 40, 2375–2383. [Google Scholar]
- Ferretti, A.; Fumagalli, A.; Novali, F.; Prati, C.; Rocca, F.; Rucci, A. A new algorithm for processing interferometric data-stacks: SqueeSAR. IEEE Trans. Geosci. Remote Sens 2011. [Google Scholar] [CrossRef]
- Hooper, A. A multi-temporal InSAR method incorporating both persistent scatterer and small baseline approaches. Geophys. Res. Lett 2008, 35. [Google Scholar] [CrossRef]
- Li, T.; Liu, G.; Lin, H.; Jia, H.; Zhang, R.; Yu, B.; Luo, Q. A hierarchical multi-temporal InSAR method for increasing the spatial density of deformation measurements. Remote Sens 2014, 6, 3349–3368. [Google Scholar]
- Perissin, D.; Teng, W. Repeat-pass SAR interferometry with partially coherent targets. IEEE Trans. Geosci. Remote Sens 2012, 50, 271–280. [Google Scholar]
- Perissin, D.; Wang, T. Time-series InSAR applications over urban areas in China. IEEE J. Sel. Top. Appl. Earth Obs. Remote Sens 2011, 4, 92–100. [Google Scholar]
- Frattini, P.; Crosta, G.B.; Allievi, J. Damage to buildings in large slope rock instabilities monitored with the PSInSAR™ technique. Remote Sens 2013, 5, 4753–4773. [Google Scholar]
- Lubitz, C.; Motagh, M.; Wetzel, H.-U.; Kaufmann, H. Remarkable urban uplift in Staufen im Breisgau, Germany: Observations from TerraSAR-X InSAR and leveling from 2008 to 2011. Remote Sens 2013, 5, 3082–3100. [Google Scholar]
- Pitz, W.; Miller, D. The TerraSAR-X satellite. IEEE Trans. Geosci. Remote Sens 2013, 48, 615–622. [Google Scholar]
- Zhang, G.; Li, Z.; Zhu, X.; Fei, W. Geometric model for high-resolution SAR-GEC images. Int. J. Image Data Fusion 2013, 4, 159–170. [Google Scholar]
- Crosetto, M.; Monserrat, O.; Iglesias, R.; Crippa, B. Persistent scatterer interferometry: Potential, limits and initial C-and X-band comparison. Photogramm. Eng. Remote Sens 2010, 76, 1061–1069. [Google Scholar]
- Fornaro, G.; Reale, D.; Serafino, F. Four-dimensional SAR imaging for height estimation and monitoring of single and double scatterers. IEEE Trans. Geosci. Remote Sens 2009, 47, 224–237. [Google Scholar]
- Liu, G.X.; Jia, H.G.; Zhang, R.; Zhang, H.X.; Jia, H.L.; Yu, B.; Sang, M.Z. Exploration of subsidence estimation by persistent scatterer InSAR on time series of high resolution TerraSAR-X images. IEEE J. Sel. Top. Appl. Earth Obs. Remote Sens 2011, 4, 159–170. [Google Scholar]
- Luo, Q.; Perissin, D.; Hui, L.; Wang, W. Subsidence monitoring of Tianjin suburbs by persistent scatterers interferometry with high resolution TerraSAR-X. IEEE J. Sel. Top. Appl. Earth Obs. Remote Sens 2013. [Google Scholar] [CrossRef]
- Schneider, M.; Suri, S.; Lehner, M.; Reinartz, P. Matching of high-resolution optical data to a shaded DEM. Int. J. Image Data Fusion 2012, 3, 111–127. [Google Scholar]
- Raucoules, D.; Colesanti, C.; Carnec, C. Use of SAR interferometry for detecting and assessing ground subsidence. Comptes Rendus Geosci 2007, 339, 289–302. [Google Scholar]
- Perissin, D.; Piantanida, R.; Piccagli, D.; Rocca, F. Landslide in Dossena (BG): Comparison between interferometric techniques. BIOGEOSAR 2007, 9, 1–7. [Google Scholar]
- SARPROZ Software Manual. Available online: https://engineering.purdue.edu/∼perissin/manual/main_master.html (accessed on 18 August 2014).
- Tianjin Institute of Surverying and Mapping. In Introduction to Promote the Use of CGCS2000 Coordinate System in Tianjin; Tianjin Institute of Surverying and Mapping: Tianjin, China, 2011. (In Chinese)
- Bozzano, F.; Esposito, C.; Franchi, S.; Mazzanti, P.; Perissin, D.; Rocca, A.; Romano, E. Analysis of a subsidence process by integrating geological and hydrogeological modeling with satellite InSAR data. In Proceedings of European Space Agency Living Planet Symposium 2013, Edinburgh, UK, 9–13 September 2013; pp. 1–8.
- Guo, L.; Buo, W.; Chen, Y.; Yao, L.; Ta, L.; Zhou, H.; Guo, H. Vertical deformation and tectonic activity in Tianjin area. J. Geod. Geodyn 2009, 29, 1–5. [Google Scholar]


| Method | RMSE (mm/year) | MAX (mm/year) | MIN (mm/year) | CC |
|---|---|---|---|---|
| Average | 4.84 | 9.55 | 0.21 | 0.92 |
| NN | 4.63 | 9.13 | 0.03 | 0.93 |
| Method | RMSE (mm/year) | MAX (mm/year) | MIN (mm/year) | CC |
|---|---|---|---|---|
| Average | 10.91 | 20.68 | 0.00 | 0.86 |
| NN | 13.14 | 25.78 | 0.13 | 0.78 |
© 2014 by the authors; licensee MDPI, Basel, Switzerland This article is an open access article distributed under the terms and conditions of the Creative Commons Attribution license (http://creativecommons.org/licenses/by/3.0/).
Share and Cite
Luo, Q.; Perissin, D.; Zhang, Y.; Jia, Y. L- and X-Band Multi-Temporal InSAR Analysis of Tianjin Subsidence. Remote Sens. 2014, 6, 7933-7951. https://doi.org/10.3390/rs6097933
Luo Q, Perissin D, Zhang Y, Jia Y. L- and X-Band Multi-Temporal InSAR Analysis of Tianjin Subsidence. Remote Sensing. 2014; 6(9):7933-7951. https://doi.org/10.3390/rs6097933
Chicago/Turabian StyleLuo, Qingli, Daniele Perissin, Yuanzhi Zhang, and Youliang Jia. 2014. "L- and X-Band Multi-Temporal InSAR Analysis of Tianjin Subsidence" Remote Sensing 6, no. 9: 7933-7951. https://doi.org/10.3390/rs6097933