Article

Evaluation of Polarized Remote Sensing of Aerosol Optical Thickness Retrieval over China

State Key Laboratory of Remote Sensing Science, Institute of Remote Sensing and Digital Earth, Chinese Academy of Sciences, Beijing, 100101 China
*
Author to whom correspondence should be addressed.
Remote Sens. 2015, 7(10), 13711-13728; https://doi.org/10.3390/rs71013711
Submission received: 11 July 2015 / Revised: 13 September 2015 / Accepted: 12 October 2015 / Published: 20 October 2015

Abstract

:
The monitoring capability of a polarized instrument (POLDER) under high aerosol loading conditions over China is investigated. The aerosol optical thickness (AOT), which infers the aerosol burden, is used to measure the satellite monitoring capabilities. AOT products retrieved from POLDER on low aerosol loading days, and products from a radiometric instrument (MODIS) on high and low aerosol loading days, are presented for comparison. Our study reveals that for high aerosol days, the monitoring capability of the polarized instrument is lower than that of the traditional instrument. The accuracy of matched POLDER fine-AOTs is lower than that of MODIS-matched AOTs. On low aerosol loading days, the performance of the polarized instrument is good when monitoring the aerosol optical thickness. Further analysis reveals that for the high aerosol loading days, the mean relative errors of matched POLDER fine AOTs and MODIS AOTs with respect to AERONET measurements are 44% and 16%, respectively. For the low aerosol loading days, the mean relative errors of POLDER and MODIS measurements with respect to AERONET measurements are 41% and 40%, respectively. During high aerosol days, POLDER-retrieved fine-AOTs reveal a poor accuracy with only 14% of matches falling within the error range, which is nearly one fourth of the MODIS regression results (51.59%). For the low aerosol loading days, the POLDER regression results are good. Approximately 62% of the POLDER measurements fall within the expected error range ±(0.05 + 15%) compared with the AERONET observed values.

Graphical Abstract

1. Introduction

Atmospheric aerosols are composed of solid and liquid particles suspended in air, and they play a significant role in climate change [1,2]. Various satellite remote sensing instruments have been extensively used to study aerosol properties in global or regional coverage (POLDER, MODIS, PARASOL, and others). Compared with traditional instrumentation (e.g., radiometers), the space-borne multi-angular spectropolarimeters can provide a large amount of raw data, reaching 100 to 400 measurements (components of the Stokes vector for several observation directions and wavelengths) for a given satellite pixel. This abundance of data should increase the accuracy for the retrieval of aerosol properties. In addition, the polarized measurements exhibit a higher sensitivity to aerosol properties than to land surface [3,4], indicating that multi-angular spectropolarimeters can take advantage of the different angular and polarized reflectance signatures of the contributions from the surface and the aerosols for the retrieval of aerosol properties [5].
Exploiting these features of polarization, various polarimetric remote sensing instruments that have been designed and will be designed to fly on satellites to monitor atmospheric aerosol properties. For example, the polarization and directionality of the earth reflectance (POLDER) instrument was designed to collect accurate observations of solar radiation reflected by the Earth-atmosphere system using sequential measurements with polarizers in different orientations [6,7]. The second generation global imager (S-GLI), which has a unique tilting data to realize the directional polarized observation with red and near infrared wavelengths, will be included in the Japanese global change observation mission satellite (GCOM-C) payloads [8]. In China, the directional polarimetric camera (DPC) is designed to be fitted on aircraft to measure the polarization and directionality of the solar radiation in the visible and near infrared spectrum with a wide field of view and high spatial resolution (4 m at 4000 m a.g.l.) to [5]. It has been developed to monitor aerosol pollution over cities [9,10] .
China has experienced unprecedented economic growth over the past two decades. As a result, it has become one of the world’s most dense aerosol regions [11,12]. In China, the physical and optical properties of aerosol particles vary greatly under different aerosol loading conditions. Days with severe aerosol pollution conditions may be related to enhanced anthropogenic emissions, intense dust outflows, and longer aerosol lifetime [13]. Aerosols on these days can be emitted (primary) or formed through the gas-to-particle conversion process (secondary) in the atmosphere [14]. The sources, emission rates, mix state, transport, chemical reactions and removal mechanisms of aerosols are also complex. The unclarified aerosol properties on high pollution days in China lead to relatively unclear performances of satellite retrieval algorithms. To reduce the uncertainties of aerosol radiative effects and to improve the air quality in China, it is important to improve the ability of the satellite to monitor aerosol characteristics. Among the various polarized instruments, POLDER has provided a long-term and unique set of aerosol observations over China; however, the performance of POLDER on high aerosol loading days in China is unknown .
In this study, the monitoring capability of a polarized instrument (for example, the POLDER instrument) under high aerosol loadings over China is investigated. The aerosol optical thickness (AOT), which infers the aerosol burden on different aerosol pollution days, is used as a standard product of satellite retrievals. In this study, we use the MODIS measurements as a representative, which have been widely used by a large team of scientists and engineers in aerosol-related studies. The aerosol optical thickness retrieved products from POLDER under low aerosol loading days and from a traditional instrument (MODIS) under high/low aerosol loading days are presented for comparison. The POLDER/MODIS products are obtained from the Multi-sensor Aerosol Product Sampling System (MAPSS) website [15], which is used for multi-sensor aerosol validation, intercomparison, and joint analysis. Satellite-retrieved AOTs were validated independently and were compared with the relevant ground-based AERONET measurements. In the next section, the data and matchup method used for validation are introduced. The results and conclusions are presented in Section 3 and Section 4.

2. Data and Methodology

2.1. Satellite Data

The POLDER instrument measures the linear polarization of light reflected by the Earth using sequential measurements with polarizers in different orientations. It has flown on ADEOS-1, ADEOS-2 and, most recently, on PARASOL (POLDER-3). POLDER-3 was launched in December 2004 and provided more than seven years of aerosol products from space. The design of the POLDER imager allows the collection of a comprehensive characterization of the angular distribution of the total and polarized components of solar radiation reflected into space. Observations collected by POLDER include measurements of nine spectral channels (from 443 to 910 nm), and three of the channels are polarization measurements: 443, 670, and 865 nm. The number of viewing angles varies from 14 to 16, depending on the observed geographical location. The multi-angle polarized measurements provide an alternative and robust approach for the study of aerosols over land [16]. The utilization of only polarized observations allows the derivation of aerosol properties and avoids the challenging issue of separating surface and aerosol contributions into the total reflectance [17].
Compared with POLDER, MODIS observes spectral radiance in 36 wavelength bands ranging from 0.412 to 41.2 µm and provides abundant information on atmospheric, terrestrial, and oceanic environments. The most difficult task in MODIS aerosol retrieval algorithms is to distinguish aerosol and surface contributions in the upwelling total radiance. The uncertainties of MODIS aerosol retrievals include the uncertainties in the assumed aerosol optical properties, the assumed land surface optical properties, the radiative transfer through the atmosphere, cloud masking, accuracy of instrument calibration. MODIS retrieval algorithms have been updated to use improved cloud-masking processes, aerosol models, and the surface reflectance database [18,19]. [20] provided a global validation of the Collection 005 (C005) dark target aerosol product over land and reported that >66% of the MODIS-retrieved aerosol optical thickness (AOT) values are comparable to AERONET observed values, within an expected error (EE) range of ±(0.05 + 15%) .
In this study, the POLDER Level-2 polarized aerosol products and the Aqua MODIS Level-2 aerosol products (collection 006) with the best quality assurance flag value (QA = 3) are used. These products can be obtained from the MAPSS website. The satellite products are averaged from pixels that fall within an approximate radius of 27.5 km from the chosen AERONET locations in MAPSS. This spatial threshold is most suitable for matching satellite and AERONET measurements [21].

2.2. AERONET Data and Sites Description

The Aerosol Robotic Network (AERONET) [22,23] is a well-established network of over 800 stations and provides standardized high quality aerosol measurements widely used for various aerosol-related studies, including satellite retrieval validation. AERONET uses CIMEL sun/sky radiometers that obtain measurements of the direct sun and diffuse sky radiances within the 340–1020 nm and 440–1020 nm spectral ranges, respectively [22]. AOT measurements are recorded every 15 min from direct solar radiation, with an accuracy of 0.01–0.02 .
AERONET data are provided in three categories: Level 1.0 (unscreened), Level 1.5 (cloud screened; [24]), and Level 2.0 (cloud screened and quality assured; [22]). The data can be downloaded from the AERONET website. To obtain the largest amount of available ground-based data collocated by satellite retrievals, the “Level 1.5 AOT and Inversion All Points” data (cloud-screened) are used in this study.
The AOT values at 550 nm are not directly provided by AERONET. Therefore, to compare with MODIS data, AOT values at 550 nm were interpolated from AERONET AOTs at 440 nm and 870 nm using the following Angstrom equation:
A E = ln ( τ λ 1 / τ λ 3 ) ln ( λ 1 / λ 3 )
where τa is the aerosol optical thickness, and λ is the wavelength [25] .
To compare with MODIS-retrieved total AOTs at 550 nm, the POLDER-retrieved Fine AOTs at 869 nm were extrapolated to the 550 nm wavelength using the fine mode Angstrom exponent, which is calculated from AERONET-retrieved fine mode AOTs at 440 nm and 869 nm.
To compare with satellite data, ground-based measurements are obtained within 30 min of the MODIS/POLDER satellite overpass over this location. In addition, the following processes are performed on AERONET level 1.5 data to rule out those with less stable atmospheric conditions:
(1)
AERONET measurements with a sky error larger than 5% were not used .
(2)
Data with the real part of the refractive index reaching the unrealistic value of 1.6 were removed.
(3)
The ratio of the standard deviation σ to the average AOT over the one hour of the satellite pass was computed. Ratios larger than 0.20 were not considered .
To distinguish high and low aerosol loading days, all of the AERONET AOTs at five sites were averaged from January 2001 to June 2015. The values of mean AOT550nm of 0.53 and fine-AOT550nm of 0.35 were obtained. Thus, the high aerosol pollution days are defined as days with a daily mean AOT550nm larger than 0.53 or with a daily fine-AOT550nm larger than 0.35. Correspondingly, low aerosol loading days are days with a mean AOT675nm lower than 0.53 or with a daily fine-AOT550nm lower than 0.35.
Table 1 represents the location of the five AERONET sites. These sites were selected for their provision of well-populated data records from 2002 to 2014. The former four sites are located in different regions of China. They are located dispersedly from north to south over three distinct types of land surface, including urban, rural and semi-arid areas .
Beijing is the capital of China, and the aerosols in this city are very complex. Severe pollution episodes, such as dust storms and haze, are frequently observed in Beijing. Xianghe is a rural site near Beijing and is surrounded by cropland, densely occupied residences and light industry. The air pollution in Xianghe is influenced by the pollution from Beijing. Taihu is located in the Yangtze River delta and is surrounded by farmland and cottages. SACOL is located to the southeast of Lanzhou City. It is frequently affected by dust storms in spring and has a relatively high surface reflectance .
Table 1. The location of the five AERONET sites over China.
Site NameLon/LatObservation PeriodSite Description
Beijing116.381/39.9772001.3–2015.4Urban city;
Chinese capital
Hong_Kong_PolyU114.180/22.3032005.11–2015.5Urban city
SACOL104.137/35.9462006.7–2013.5Rural; Semi-arid
Taihu120.215/31.4212005.9–2015.4Rural, vegetation,
Xianghe116.962/39.7542001.3–2015.5Rural region next to Beijing

2.3. Methodology for Comparisons between Satellite-Based and Ground-Based AODs

Comparisons between satellite-retrieved AOTs and ground-based AOTs are crucial for improving satellite retrieval algorithms, reducing the uncertainties in radiative forcing assessments and assimilating multi-source satellite data. In this study, linear regression analysis was performed for MODIS and POLDER AOTs with respect to AERONET AOTs, according to the following equation:
AOT satellite =m × AOT AERONET +c
where m is the slope, c is the intercept, AOTAERONET represents AERONET AOT, and AOTsatellite represents AOT from the MODIS and POLDER satellites. The coefficient of determination (R2) indicates the correlation between MODIS and AERONET AODs [26]. These quantities (m, c, and R2) are useful indicators of satellite-retrieved aerosol AOTs at a particular location and time [27]. Non-zero “c” may be associated with errors in surface reflectance or calibration [28,29]. An “m” value other than unity may be associated with irregularities between the optical properties and the aerosol microphysical properties used in the retrieval algorithm [30].
In addition to the linear regression analysis, the following three indicators are used to compare AOT data from the MODIS and POLDER satellite sensors with AERONET:
Relative error (RE),
Bias,
RMS deviation (or RMSE), and
Good Fraction (Gfraction)
The relative error is a relative criterion and is defined as follows:
R E = x s a t e l l i t e x A E R O N E T x A E R O N E T
Where xsatellite represents the satellite observations, and xAERONET represents the ground-based observations .
The “bias” is a difference of the mean value of the satellite and ground-based measurements and is defined as follows:
bias = x ¯ satellite - x ¯ AERONET
The root mean square error (or root mean square deviation) is an absolute criterion and is defined as follows:
R M S E = i = 1 n ( x s a t e l l i t e x A E R O N E T ) 2 n
A “good fraction” is defined by the MODIS team, which define a retrieval as “good” when the difference from the sunphotometer data is less than the following range:
Δ τ = ± 0.05 ± 0.15 τ A E R O N E T
where τAERONET is the optical thickness measured by the AERONET. A good fraction is the percentage of the data that satisfy the MODIS confidence ranges. It applies a combination of absolute and relative criteria and weights all of the events equally [31]. This is important when using a single metric to evaluate agreement over the full range of AOT values. A small fraction of outliers does not exert a large influence on the comparison statistics .

3. Results

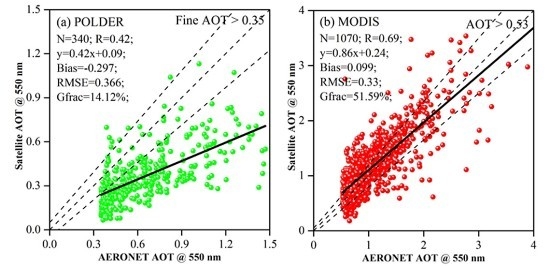
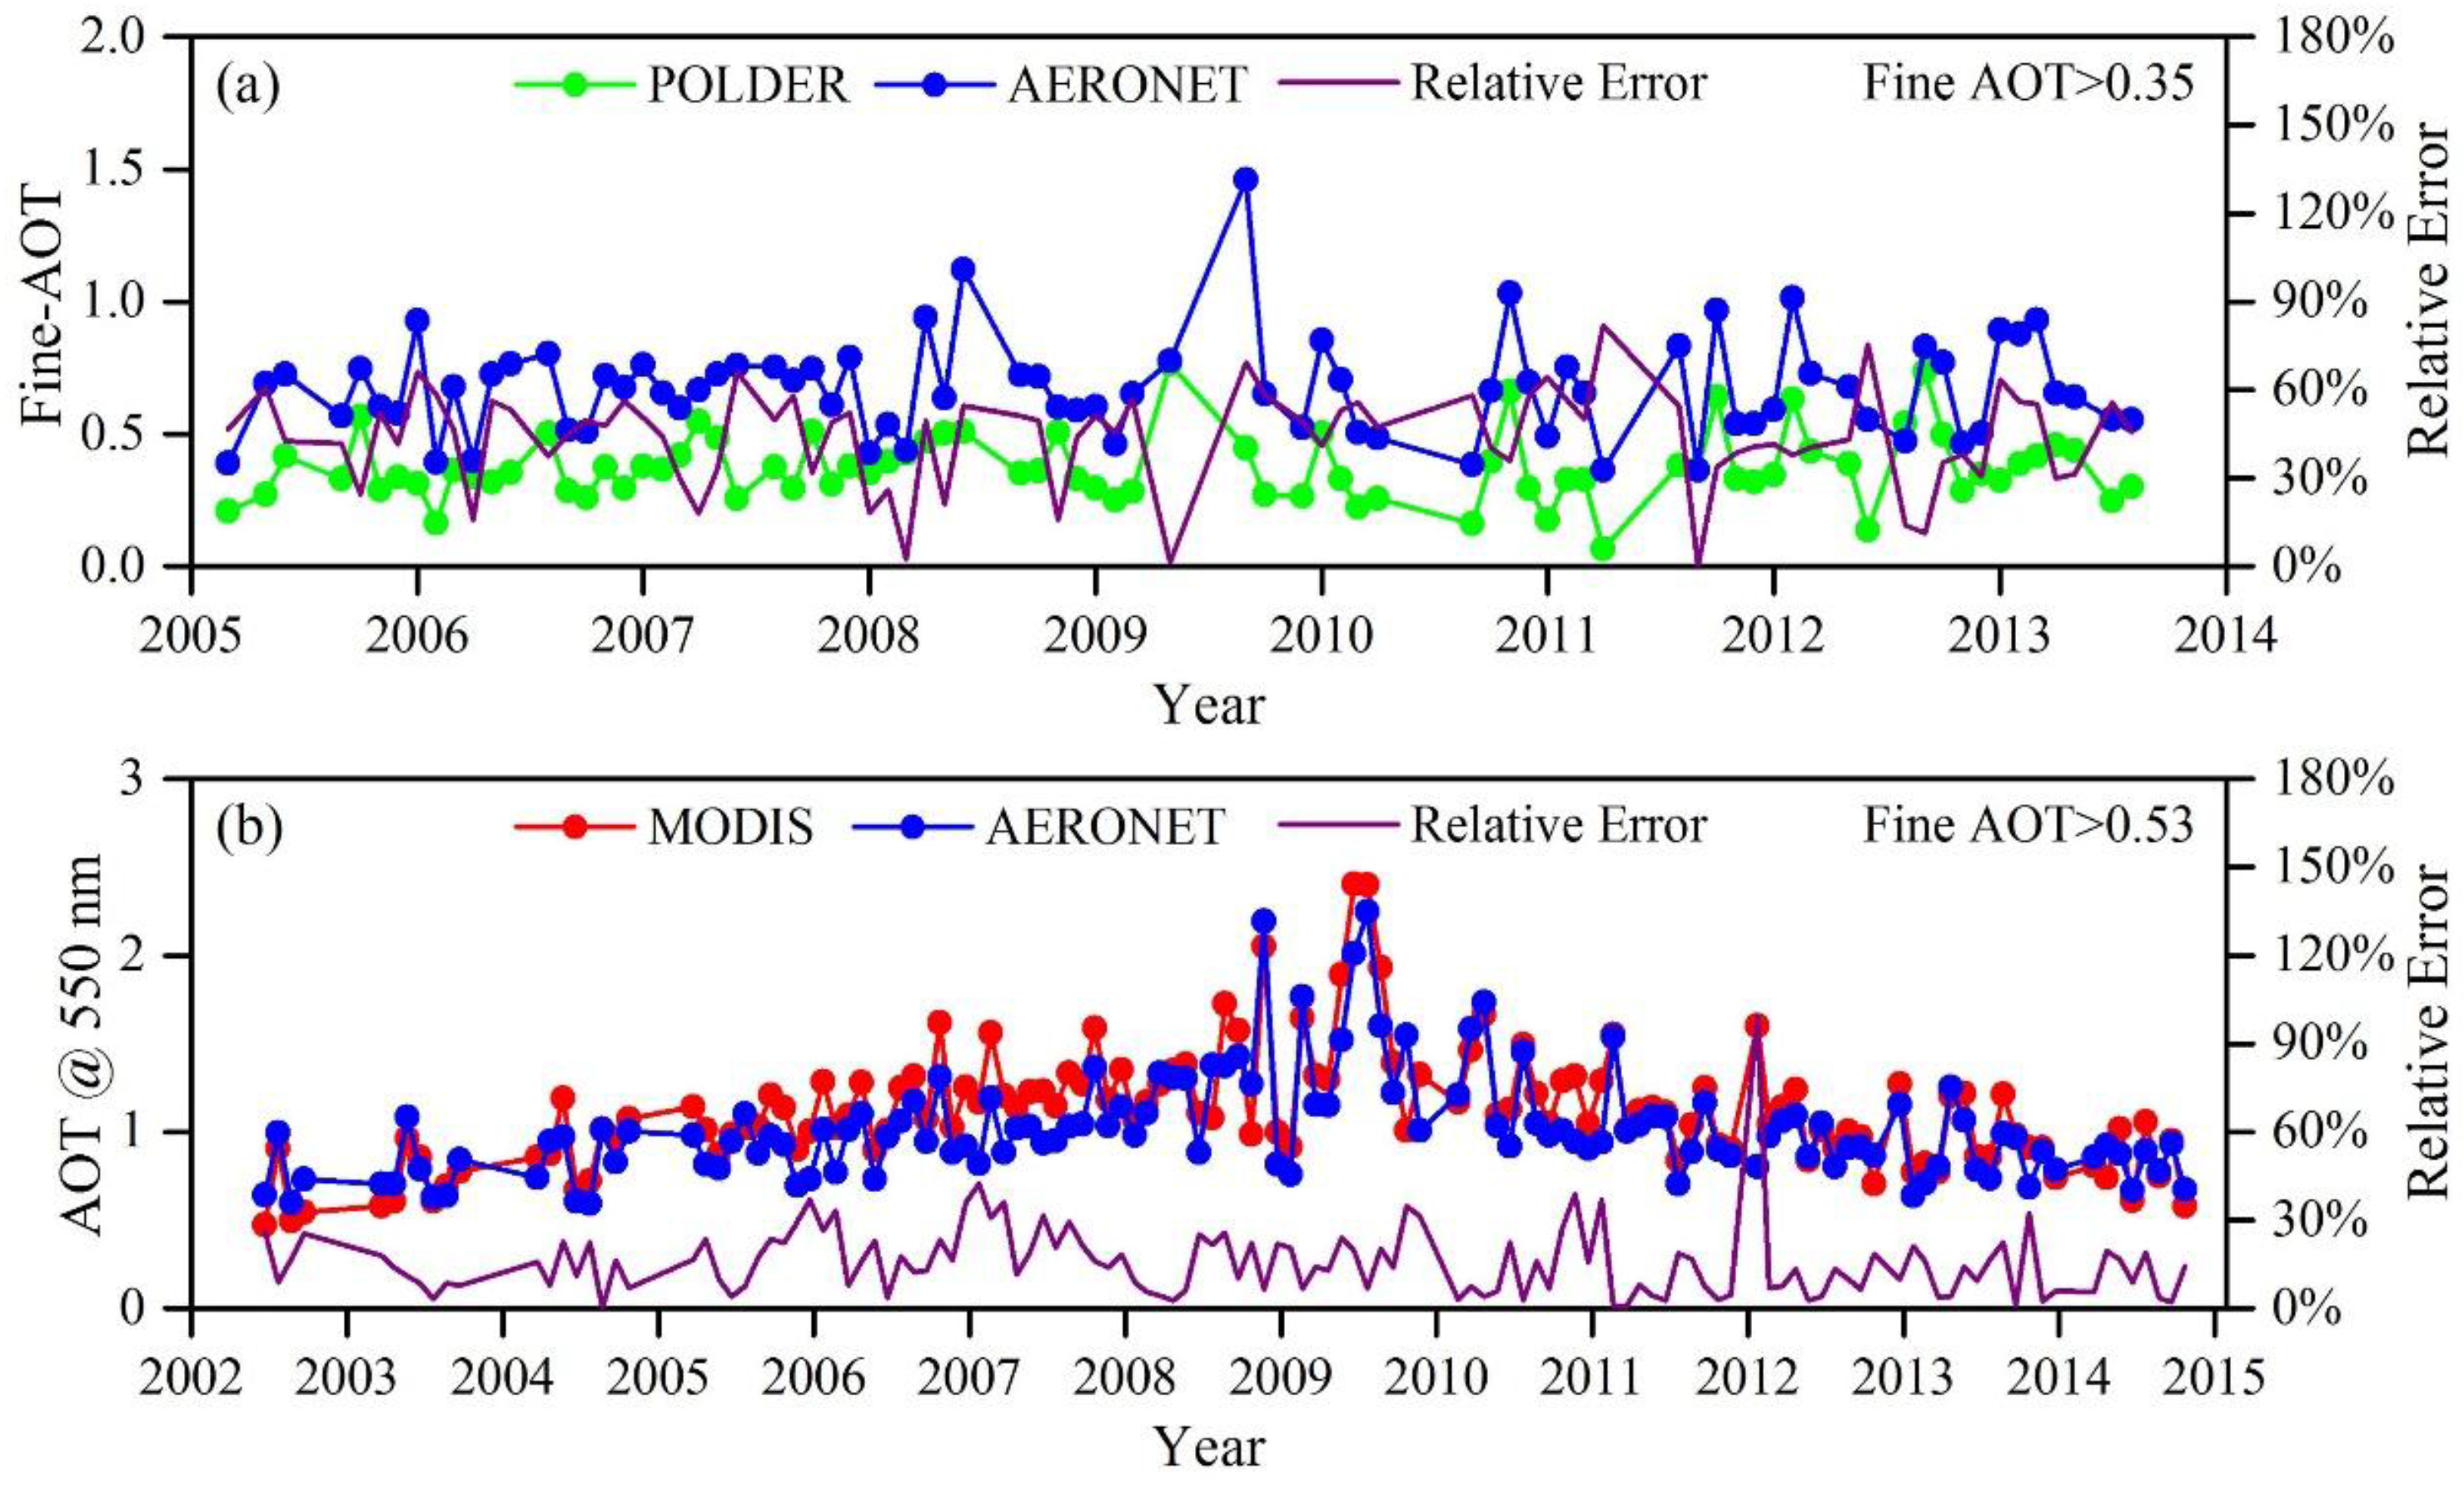
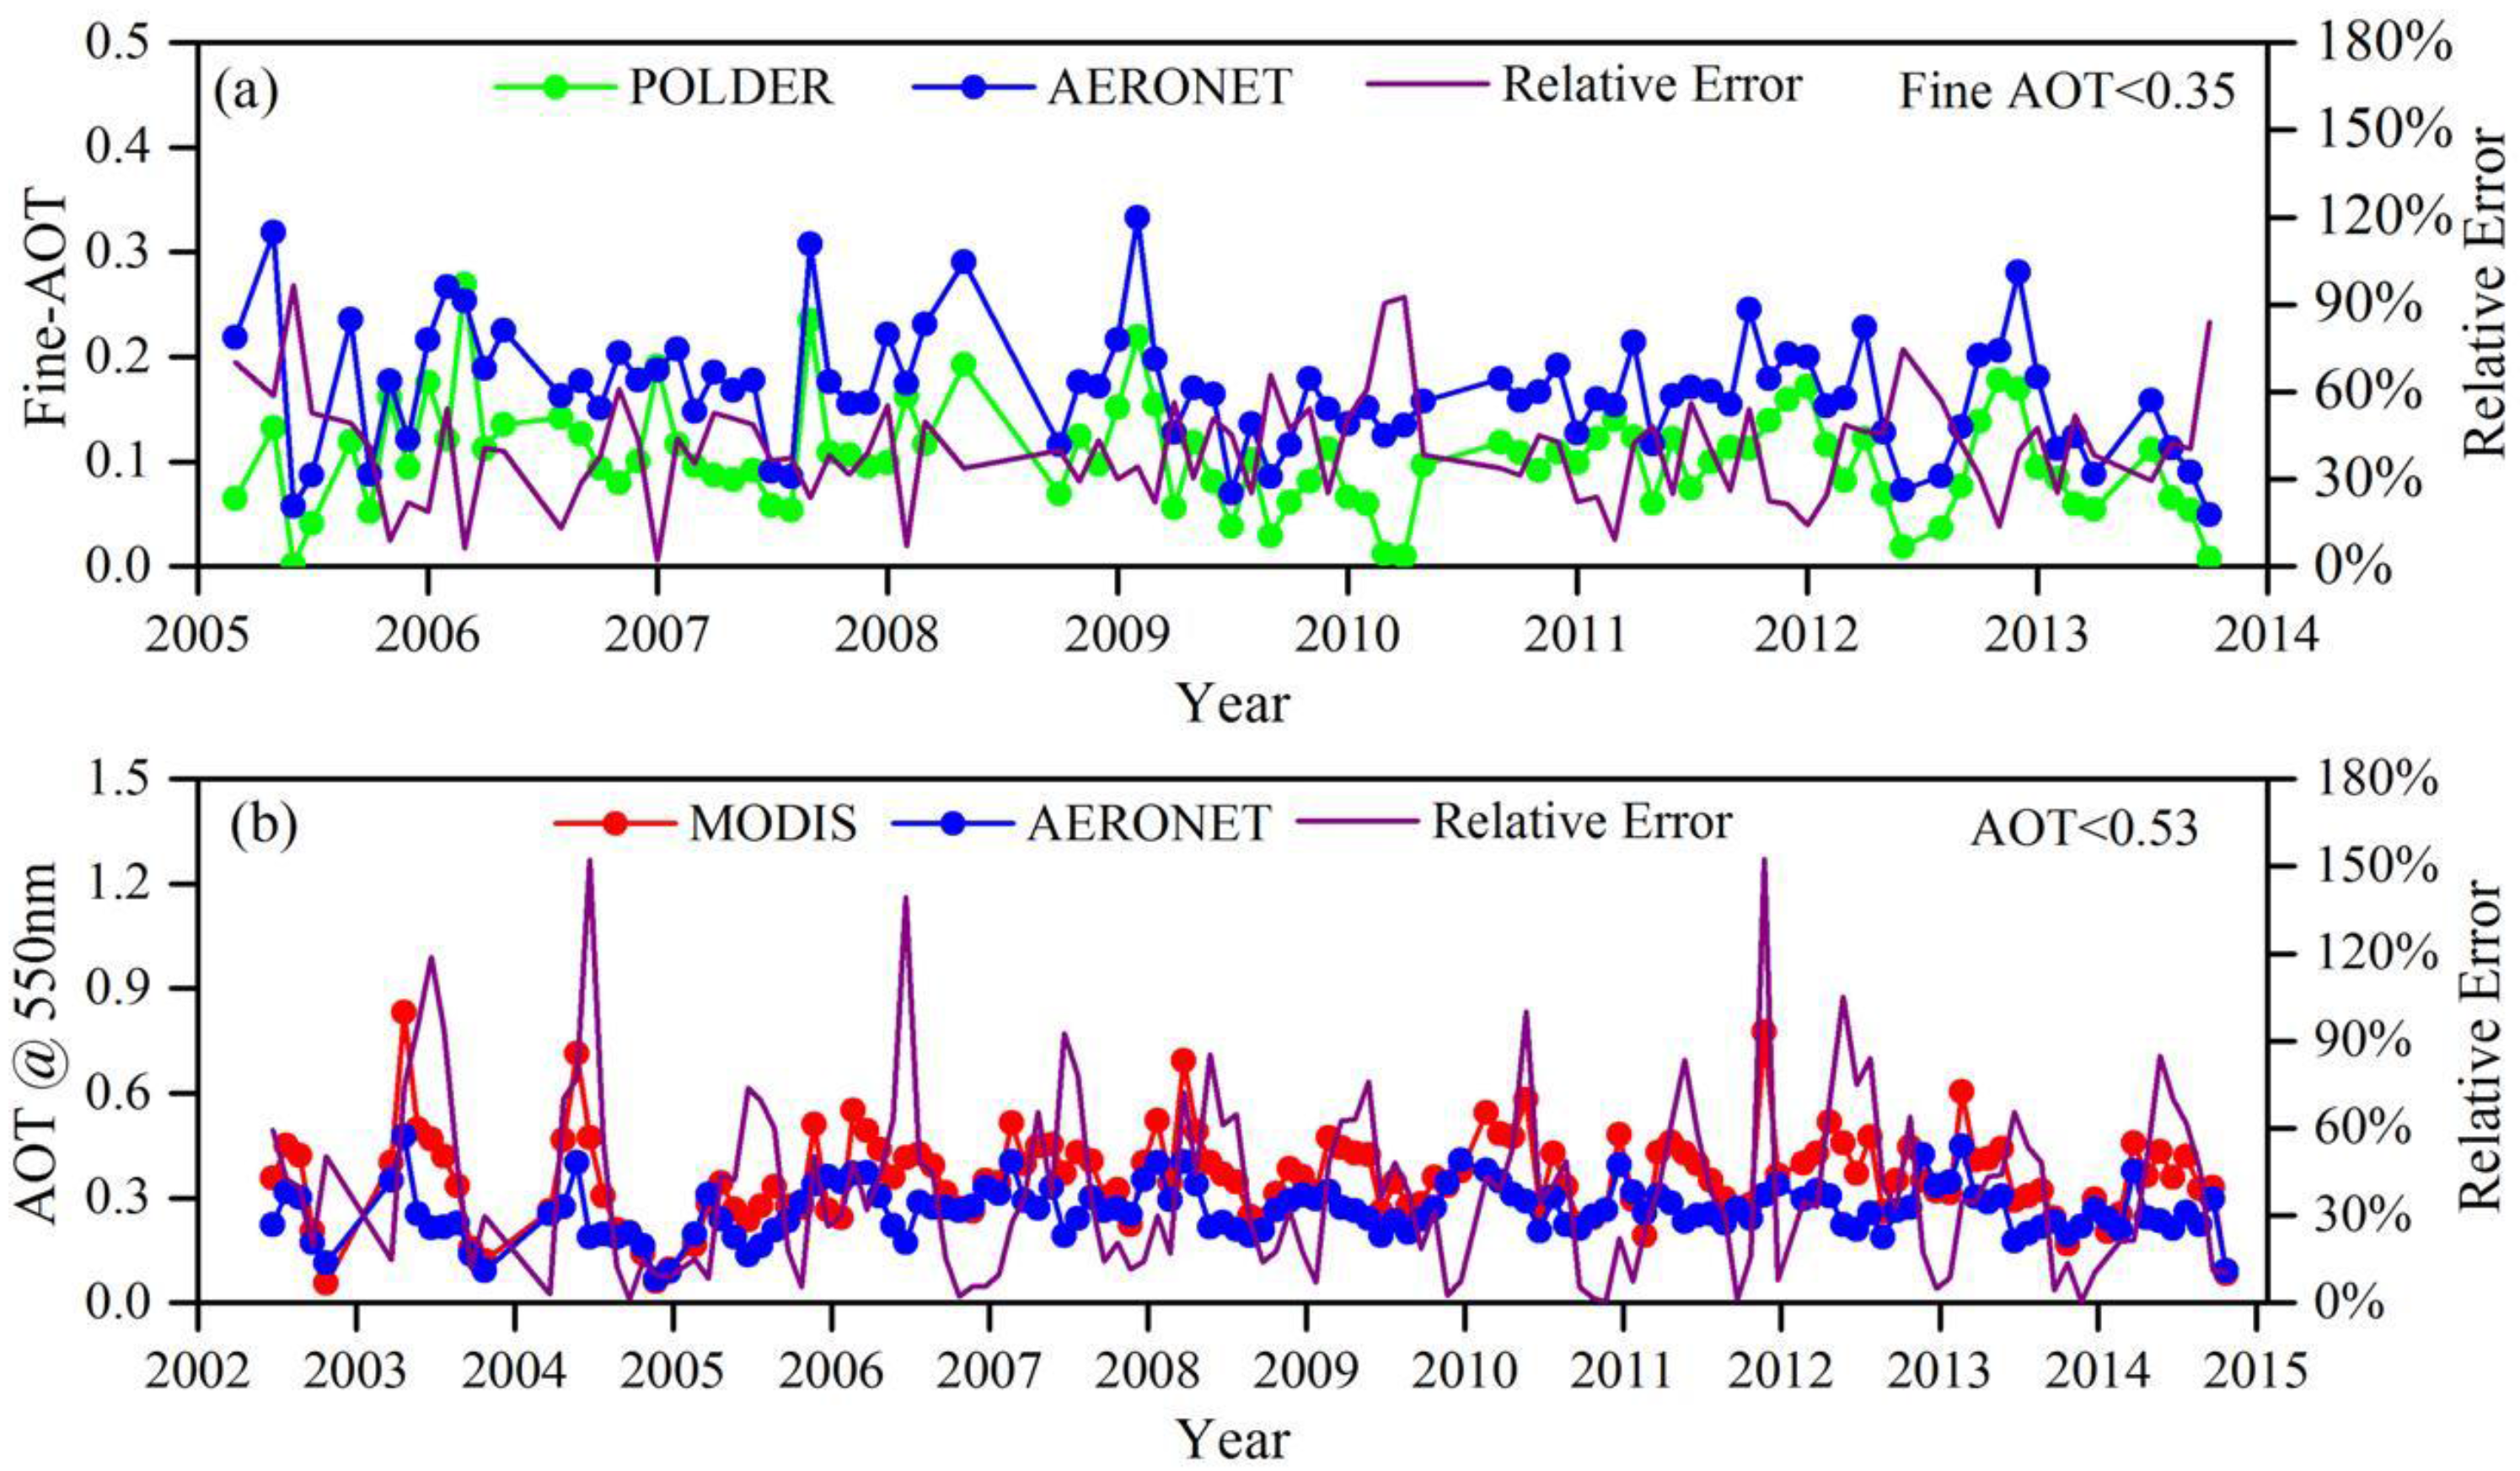
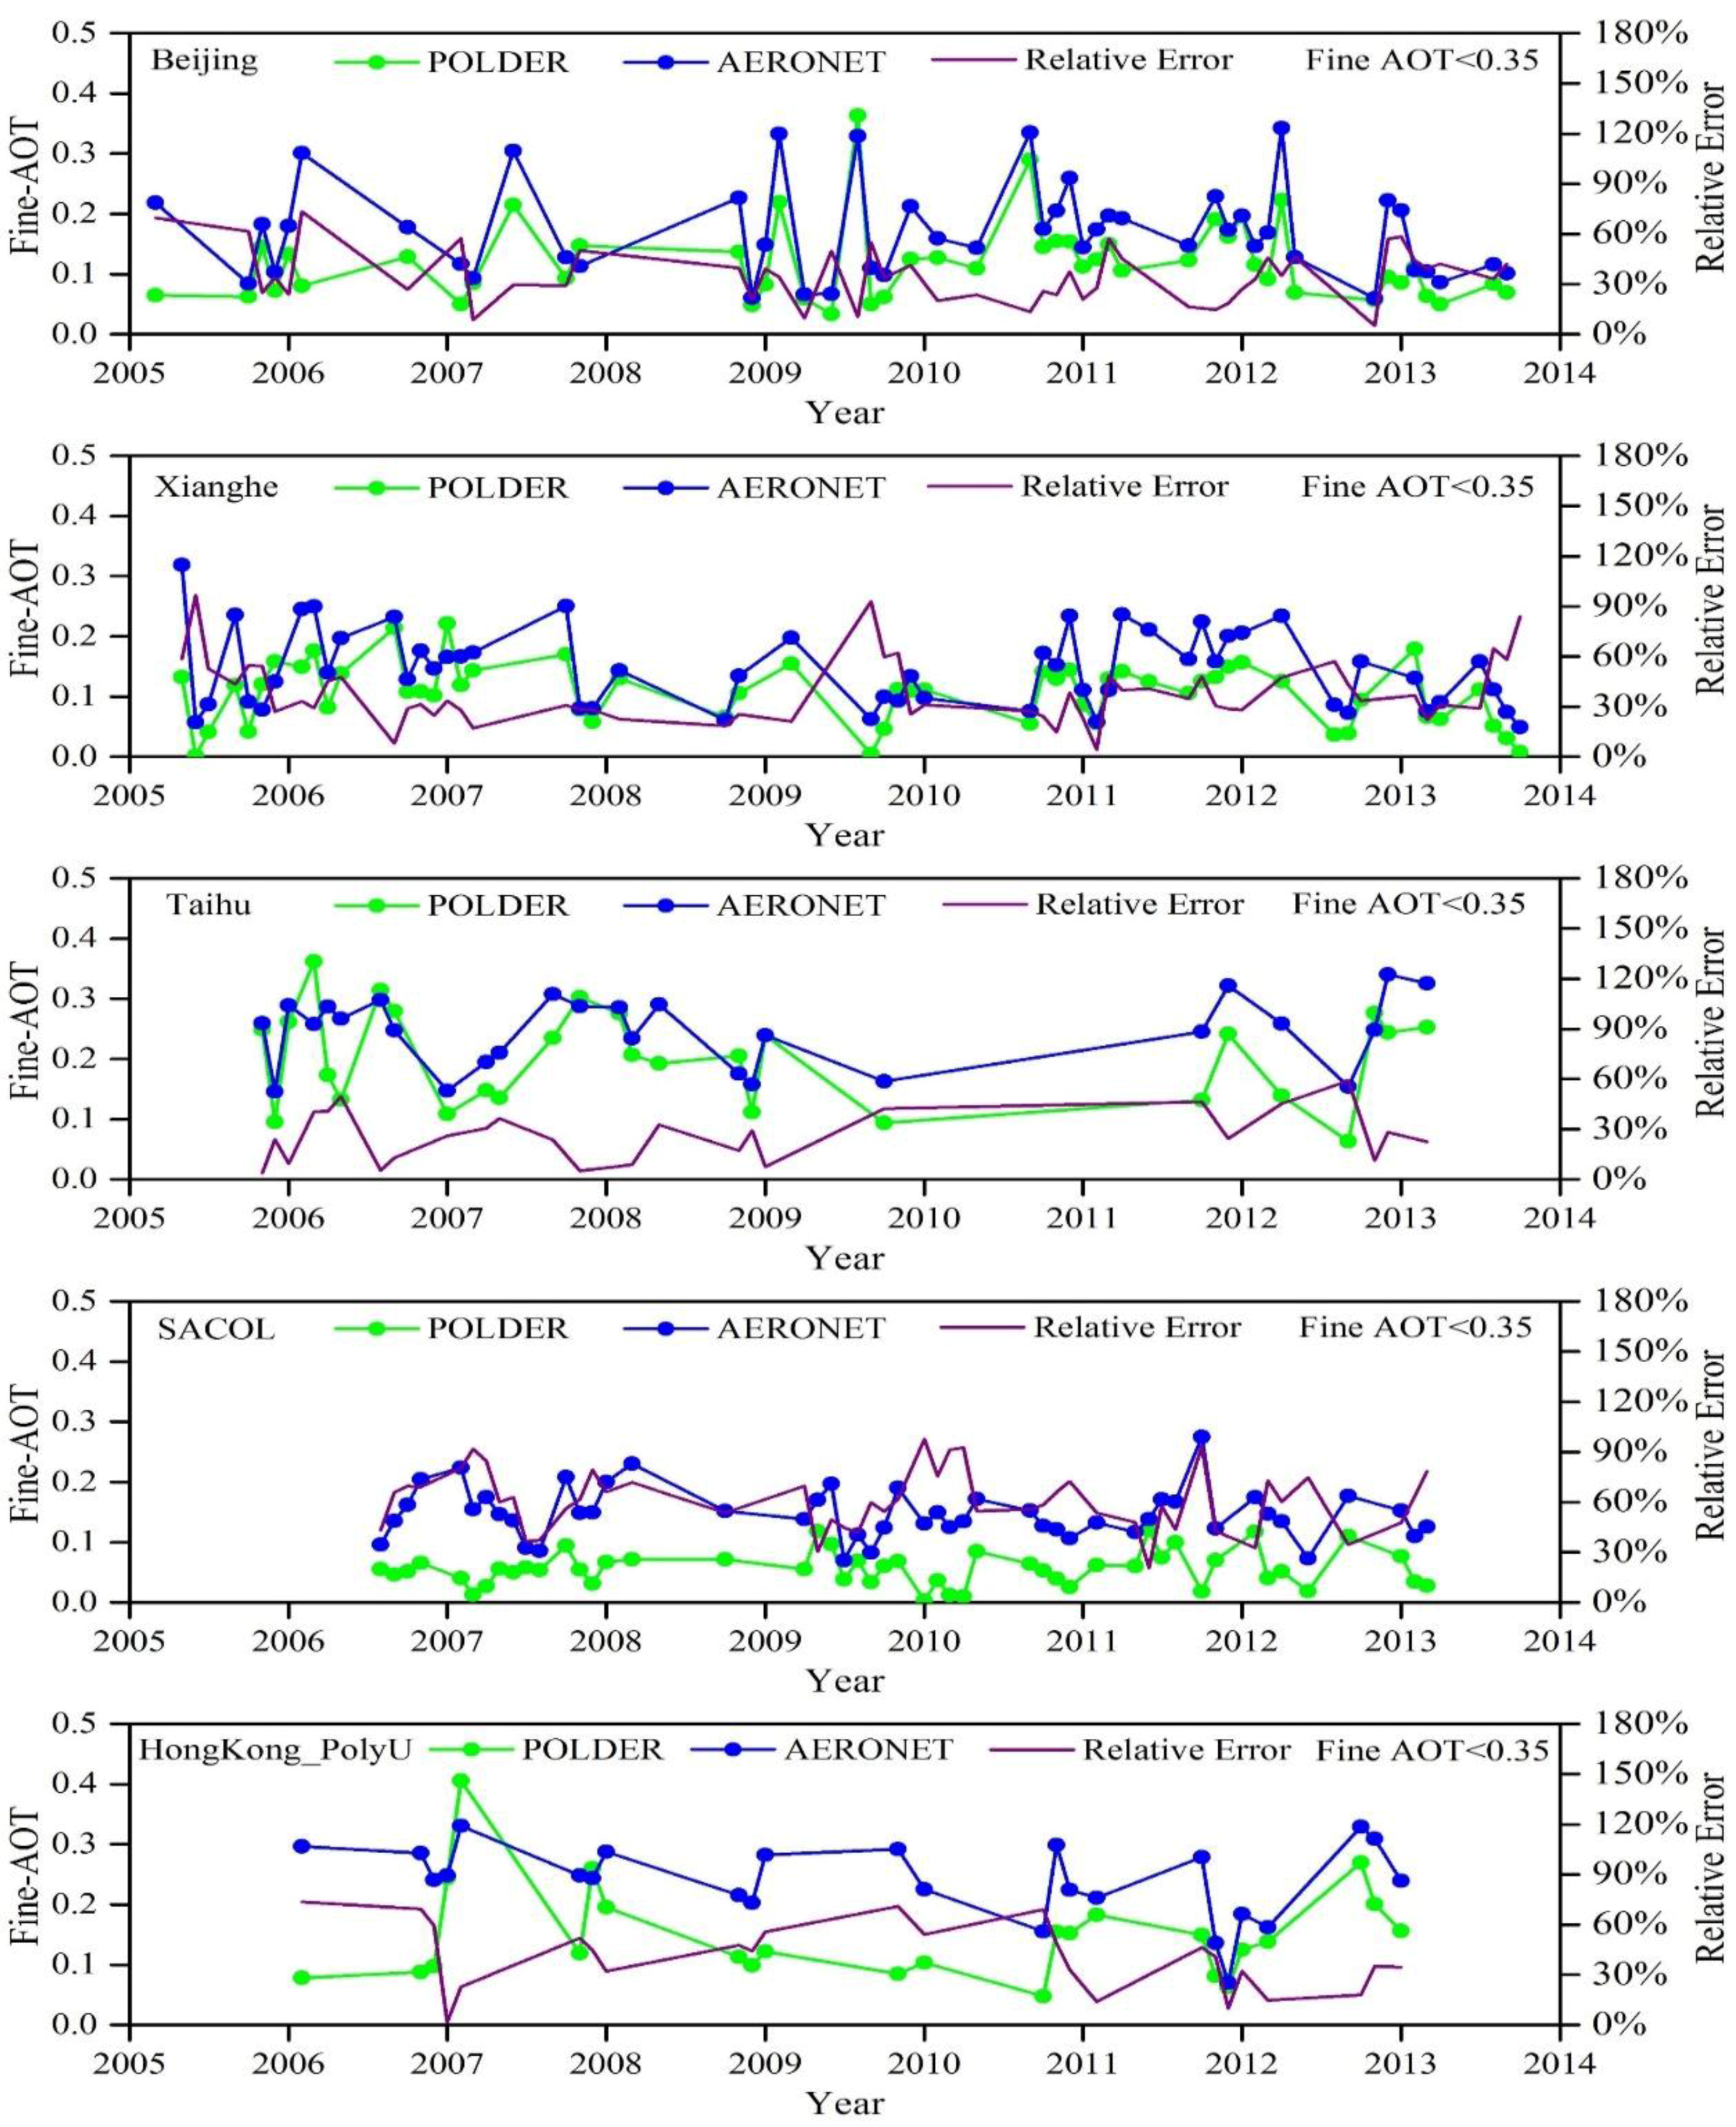
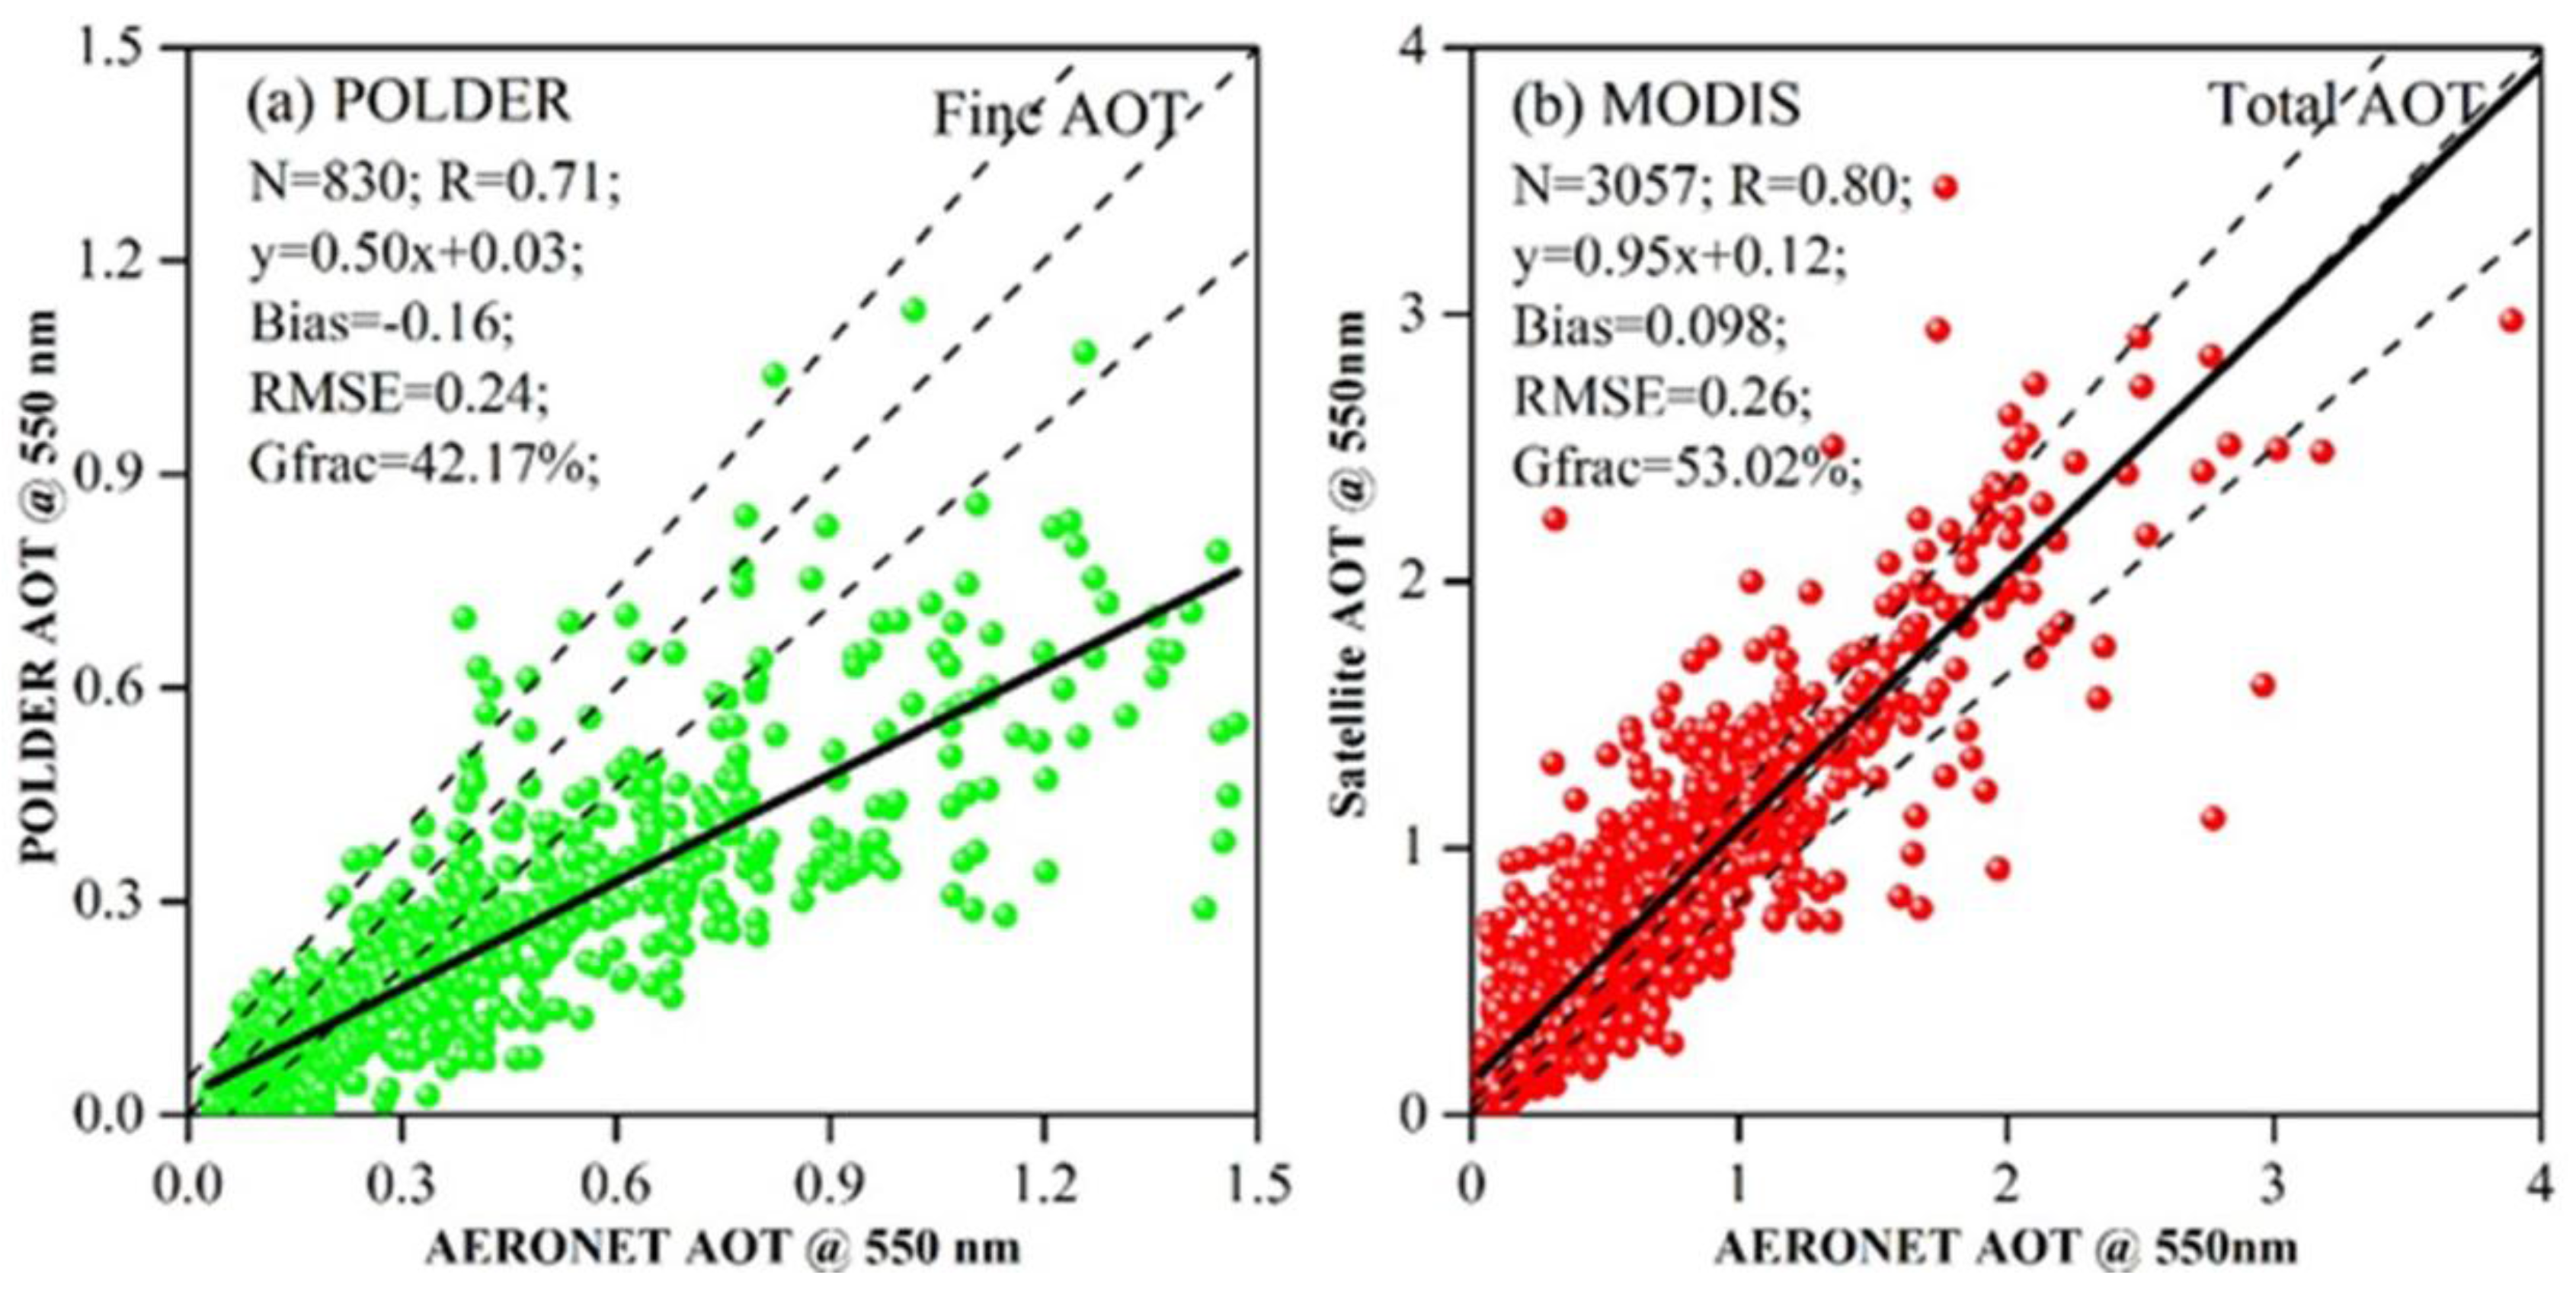
3.1. Relative Errors of POLDER-AERONET and MODIS-AERONET AOT Data in the Long-Term Trend

Figure 1 and Figure 2 illustrate the monthly variation and relative errors of matched AOTs/fine-AOTs under the high and low aerosol loadings over China in the long-term trend 2002–2014. Data are collected from 5 AERONET sites (Beijing, Xianghe, SACOL, Taihu and HongKong_PolyU). .POLDER-retrieved fine-AOTs are generally lower than those of AERONET-retrieved AOTs during the high aerosol loadings (Figure 1a) .
The mean relative error of matched POLDER with respect to AERONET fine-AOT is 44% for the long-term trend from 2005 to 2013. Compared with the POLDER-retrieved AOTs, MODIS-retrieved AOTs are very close to the matched AERONET AOT data for the high aerosol loading conditions (Figure 1b). The relative errors between matched MODIS and AERONET AOTs are substantially lower than 30%, with a mean value of 16% in the long-term trend. They also reveal significant seasonal variation with large values that typically occur in winter.
Figure 1. (a) Monthly averages of POLDER and AERONET fine aerosol optical thicknesses (AOTs) at 550 nm and their relative errors for daily mean fine AOTs larger than 0.35 from 2005 to 2013; (b) Monthly averages of MODIS and AERONET AOTs at 550 nm and their relative errors for daily mean AOTs larger than 0.53 from 2002 to 2014.
Remotesensing 07 13711 g001
For the low aerosol loading conditions, POLDER-retrieved fine AOTs are lower than that from AERONET. The mean relative error is 41%, which is nearly the same as that for the high aerosol loading days (44%). The monthly mean AOTs derived from MODIS are close to but slightly larger than that from AERONET measurements (Figure 2). In the long-term period, the relative errors of matched MODIS AOTs fluctuate dramatically, with a maximum value 150%, and a minimum value 1%. The mean relative error is 40% from 2002 to 2014, which is 2 times larger than that for the high aerosol loading days (16%). Compared with MODIS, POLDER represents a lesser fluctuation of relative errors in the long-term trend from 2005 to 2013. The maximum value is 100%, and the minimum value is 0%.
Figure 2. Identical to Figure 1 but for daily mean fine AOTs lower than 0.35 and for daily mean AOTs lower than 0.53.
Remotesensing 07 13711 g002
Because the relative error is a relative criterion, it tends to overestimate errors on small AOTs. To overcome this disadvantage, it is necessary to introduce relative and absolute criteria to compare satellite-retrieved AOTs under different aerosol loading conditions.
Figure 3 and Figure 4 represent the monthly variation and relative errors of matched fine-AOTs at the five AERONET sites for the high and low aerosol loadings respectively. They are used to investigate how useful is polder for monitoring air quality in different regions of China.
Figure 3. Monthly averages of POLDER and AERONET fine AOTs at 550 nm and their relative errors at five AERONET sites for daily mean fine AOTs larger than 0.35 from 2005 to 2013.
Remotesensing 07 13711 g003
Figure 4. Identical to Figure 3 but for daily mean fine AOTs lower than 0.35.
Remotesensing 07 13711 g004
For the high aerosol loadings days, the AERONET retrieved mean fine-AOTs are 0.71, 0.74, 0.43, 0.65 and 0.56, respectively, for Beijing, Xianghe, SACOL, Taihu and HongKong_PolyU sites during 2005–2013. The POLDER retrieved mean fine-AOTs are generally 0.2–0.3 lower than those of AERONET-retrieved AOTs (Figure 3). The mean relative error of matched POLDER with respect to AERONET fine-AOT are 46%, 45%, 58%, 38% and 52% respectively for the five AERONET. POLDER’s outperformance at Taihu site reveal its advantage in characterization the surface using polarization measurements. Conversely, the poor performance of POLDER retrieved fine-AOTs at SACOL site (mean relative error of 58%) could be caused by the frequently observed dust events in this site. The polarization of the dust particles is lower than that of the fine particles and the size distribution did not consider the relationship between the large, non-polarizing and small, polarizing particles [32]. This leads to the underestimation of fine AOTs in the dust events.
For the low aerosol loading days, the AERONET retrieved mean fine-AOTs are 0.16, 0.13, 0.15, 0.24 and 0.24, respectively, for Beijing, Xianghe, SACOL, Taihu and HongKong_PolyU sites. The POLDER retrieved mean fine-AOTs are 0.12, 0.09, 0.06, 0.19 and 0.15 respectively for the five sites (Figure 4). The mean relative error of matched POLDER with respect to AERONET fine-AOT are 35%, 38%, 61%, 26% and 41%, respectively. Like in the high pollution days, POLDER reveal a good performance at Taihu site (mean relative error of 26%) and poor performance at SACOL site (mean relative error of 61%).

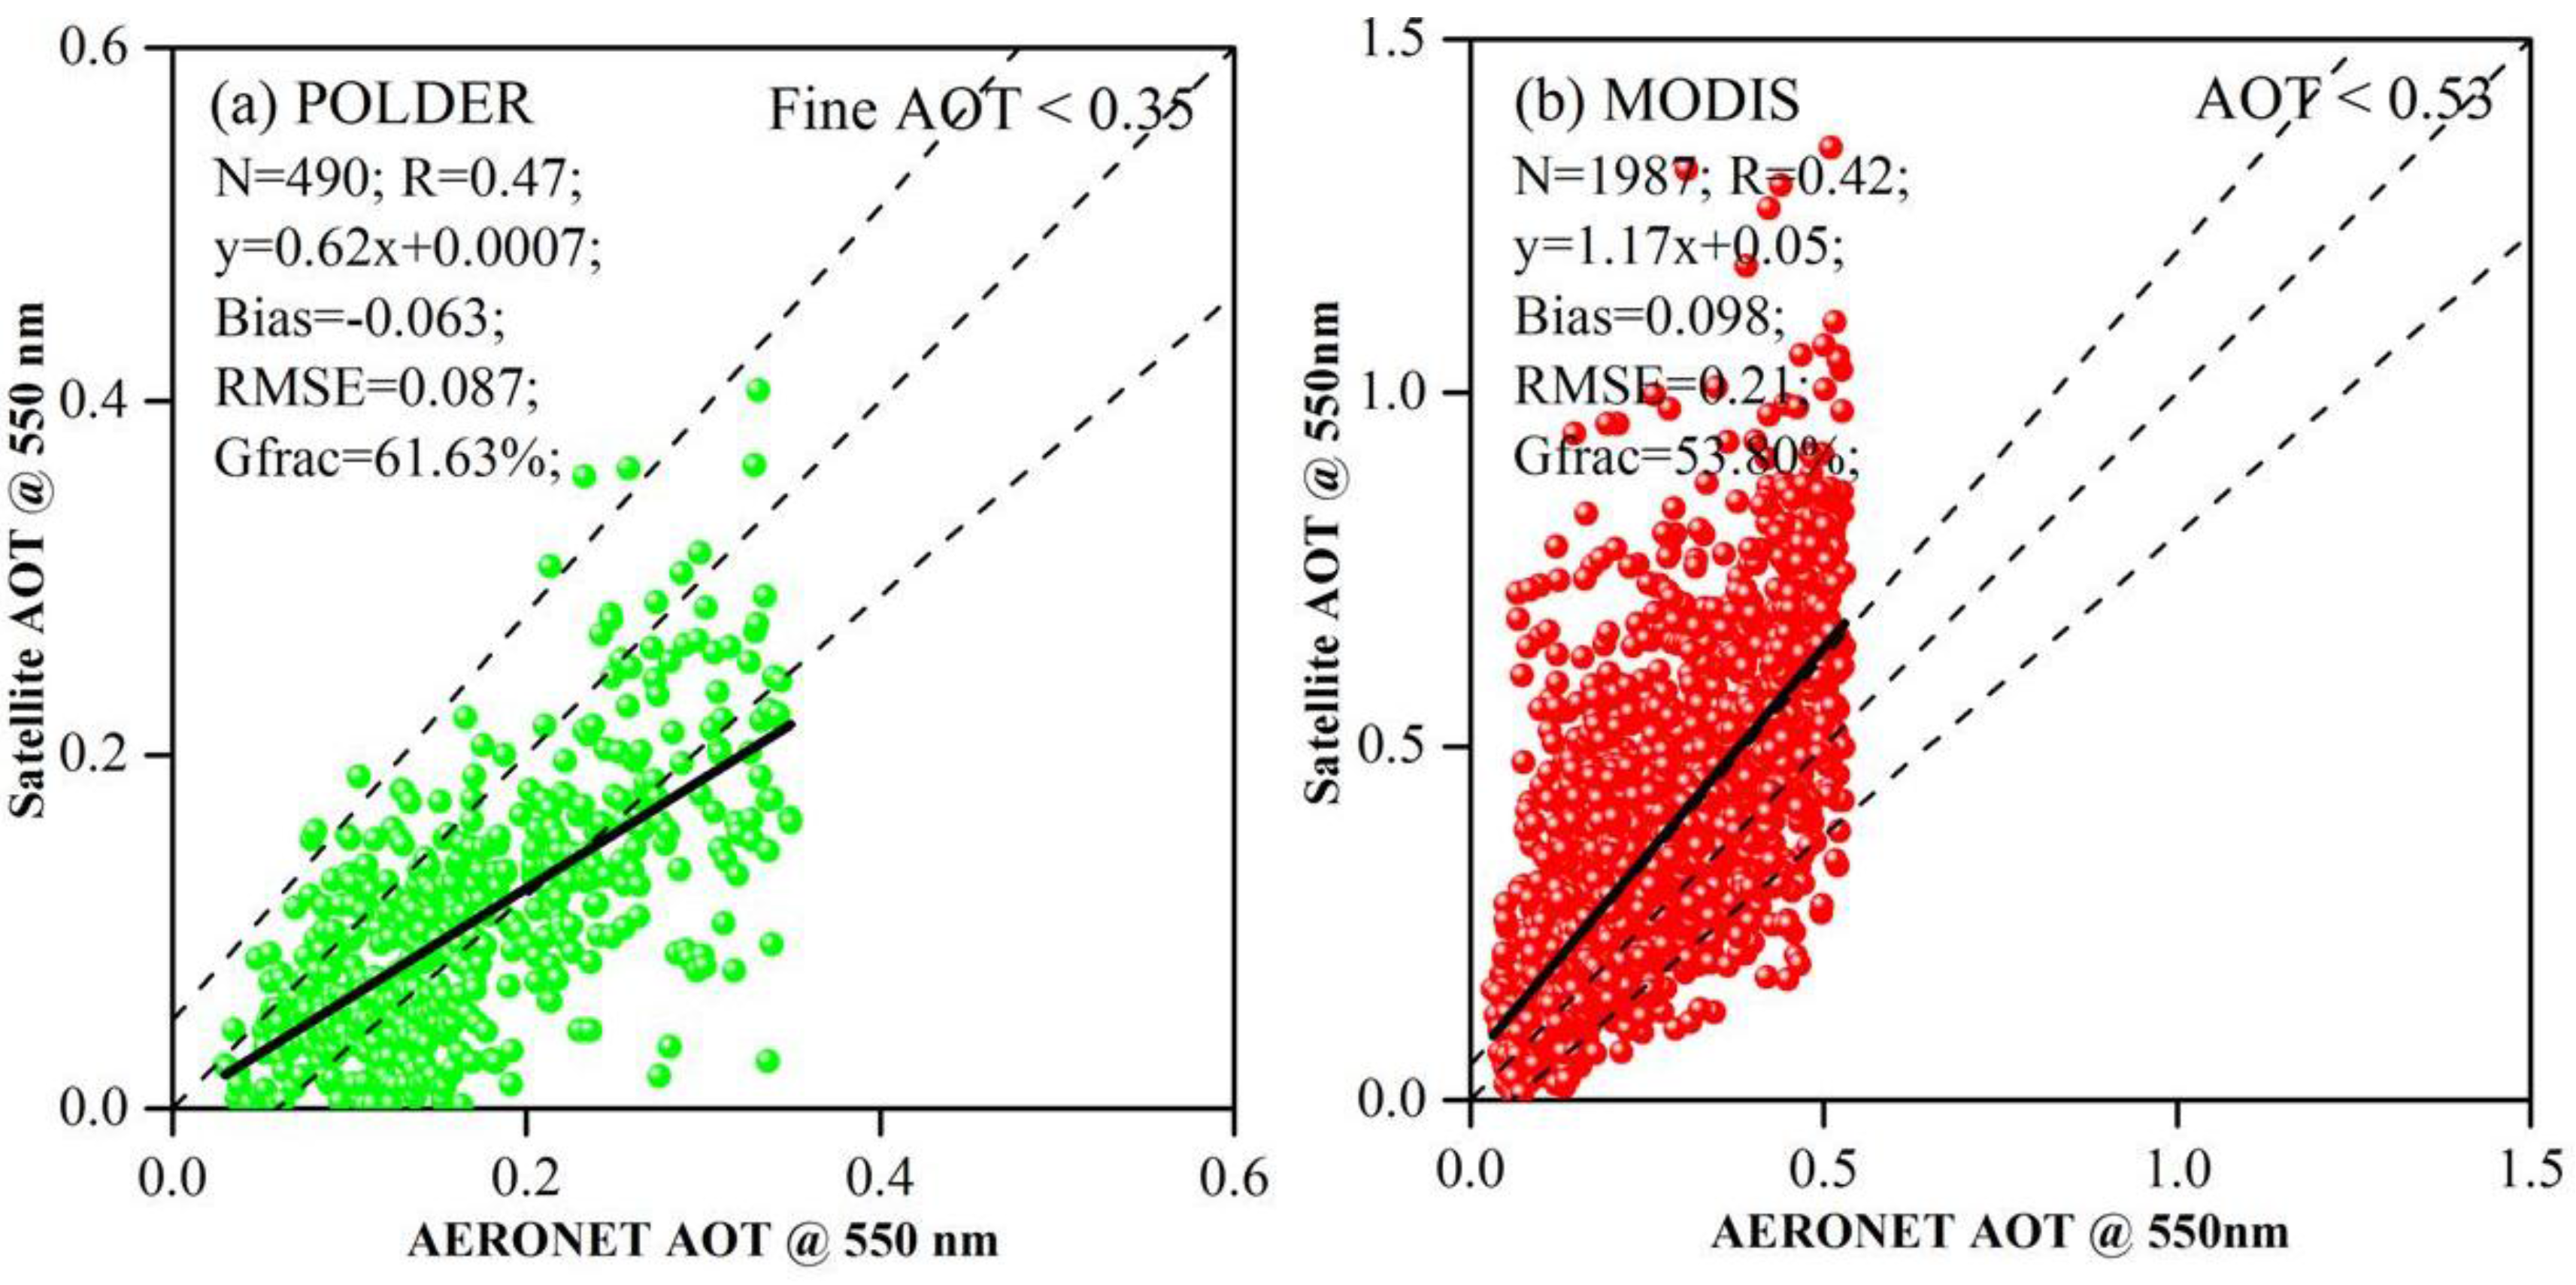
3.2. Comparisons between POLDER, MODIS and AERONET AOT Data under High and Low Aerosol Loading Days

Figure 5 illustrates the scatter plots of matched POLDER fine-AOTs and MODIS total AOTs for all of the aerosol conditions over five sites in China. The match-ups of POLDER-retrieved fine-AOTs are less than one third of MODIS due to its low revisit frequency. POLDER and MODIS reveal a high correlation with sunphotometer AOTs (0.71 and 0.80, respectively). The POLDER regression results are inferior to those of MODIS, which is shown as a larger bias (−0.16 and 0.098 for PODLER and MODIS, respectively), a lower slope of fitting line (0.5 and 0.95, respectively) and a smaller “Gfraction” (42.17% and 53.02%, respectively). Further research shows that a high bias in POLDER retrievals is apparent for the “dirty” atmosphere (right corner of the left plot in Figure 3). Correspondingly, MODIS statistics are degraded for the “clean” cases. Because POLDER and MODIS reveal significant differences in the aerosol monitoring capability under high and low aerosol loadings days, it is necessary to verify their accuracies in these two cases .
Figure 5. Scatter plots for the POLDER-retrieved fine-AOTs (a) and MODIS-retrieved AOTs (b) against AERONET measurements. One diagonal dotted line is the 1:1 line. The other two lines represent y = 0.05 + 1.15x and y = −0.05 + 0.85x.
Remotesensing 07 13711 g005
Figure 6 illustrates the scatter plots of matched POLDER fine-AOTs and MODIS AOTs under the high aerosol loadings. According to Figure 4, POLDER has a poor agreement with AERONET fine-AOTs under high aerosol loading days. The coefficient of determination (0.42) and slope of fitting line (0.42) are low, and the bias (−0.297) and RMSE (0.366) are relatively high. Only 14.12% of POLDER-retrieved fine-AOT values fall within ±(0.15τ + 0.05) of the paired validation data from AERONET. Compared with POLDER, the MODIS regression results are better with a high coefficient of determination (0.69) and a low bias (0.099). The slope of the MODIS fitting line is 0.86, which is close to 1.0. Approximately 51.59% of matching AOTs fall within the expected error range. POLDER’s underestimation of the higher AOTs could be caused by the inappropriate aerosol models in the retrieval algorithm, the influence of cloud screening or the high spatial variation caused by the local aerosol emission. POLDER’s operational retrieval algorithm over land only considered aerosols within the accumulation mode (fine mode), and the contribution of the coarse mode is neglected. Aerosols in China are complex mixtures of fine and coarse mode particles, primarily arising from anthropogenic and dust sources, respectively [33,34]. These complex mixtures of fine and coarse mode particles on severe aerosol loading days in China complicate the development of type-specific aerosol models, resulting in low accuracies of the satellite retrieval algorithm. Second, the POLDER instrument does not have a longer IR channel, causing difficulty in differentiating between aerosol and partially clouded scenes [35]. Third, aerosols are dominated by fine-mode particles from local emissions; thus, the spatial deviation is large on heavy pollution days. According to Fan et al. [36], large errors of POLDER-retrieved AOTs on hazy and cloudy days are found over northeast Asia.
Figure 6. Scatter plot of POLDER-retrieved fine AOTs (a) and MODIS-retrieved AOTs (b) for the high aerosol loading days.
Remotesensing 07 13711 g006
Good agreement was found between POLDER and AERONET measured fine-AOTs (Figure 7), with approximately 61.63% of matching fine-AOTs falling within the expected error range, which is slightly higher than the fraction of MODIS matched AOTs. In addition, POLDER shows a low bias (−0.063) and low RMSE (0.087) with respect to AERONET measurements. POLDER and MODIS reveal low coefficients with the AERONET measurement (0.47 for POLDER and 0.42 for MODIS) for the low aerosol loading days. The matched MODIS and AERONET AOTs show a similar performance for the regression results under low aerosol loading days to the results under high aerosol loading days. The “Gfraction”, bias and RMSE values are 53.8%, 0.098 and 0.21, respectively. This “Gfraction” value is very close to the results under high aerosol loading days. Both of the values are lower than the global averaged level (>66%) reported by [20]. The retrieval of small aerosol concentrations from MODIS has always been challenging. The relatively strong surface information under low aerosol loading conditions makes it difficult to distinguish the relative contribution between aerosol and surface spectral signatures in the retrieval algorithms. POLDER’s superior performance can be attributed to its unique design, which uses only polarized measurements of reflected light over land [15]. According to the results of [37,38], the polarized reflectance is sensitive to aerosol models used in the retrieval algorithm. When the aerosol concentration is small, the aerosol contribution to the total spectral signal is relatively small, and polarized measurements reveal their advantage for characterizing the surface contribution.
Figure 7. Scatter plots for the MODIS AOTs (a) and POLDER fine-AOTs (b) under the low aerosol loading days.
Remotesensing 07 13711 g007

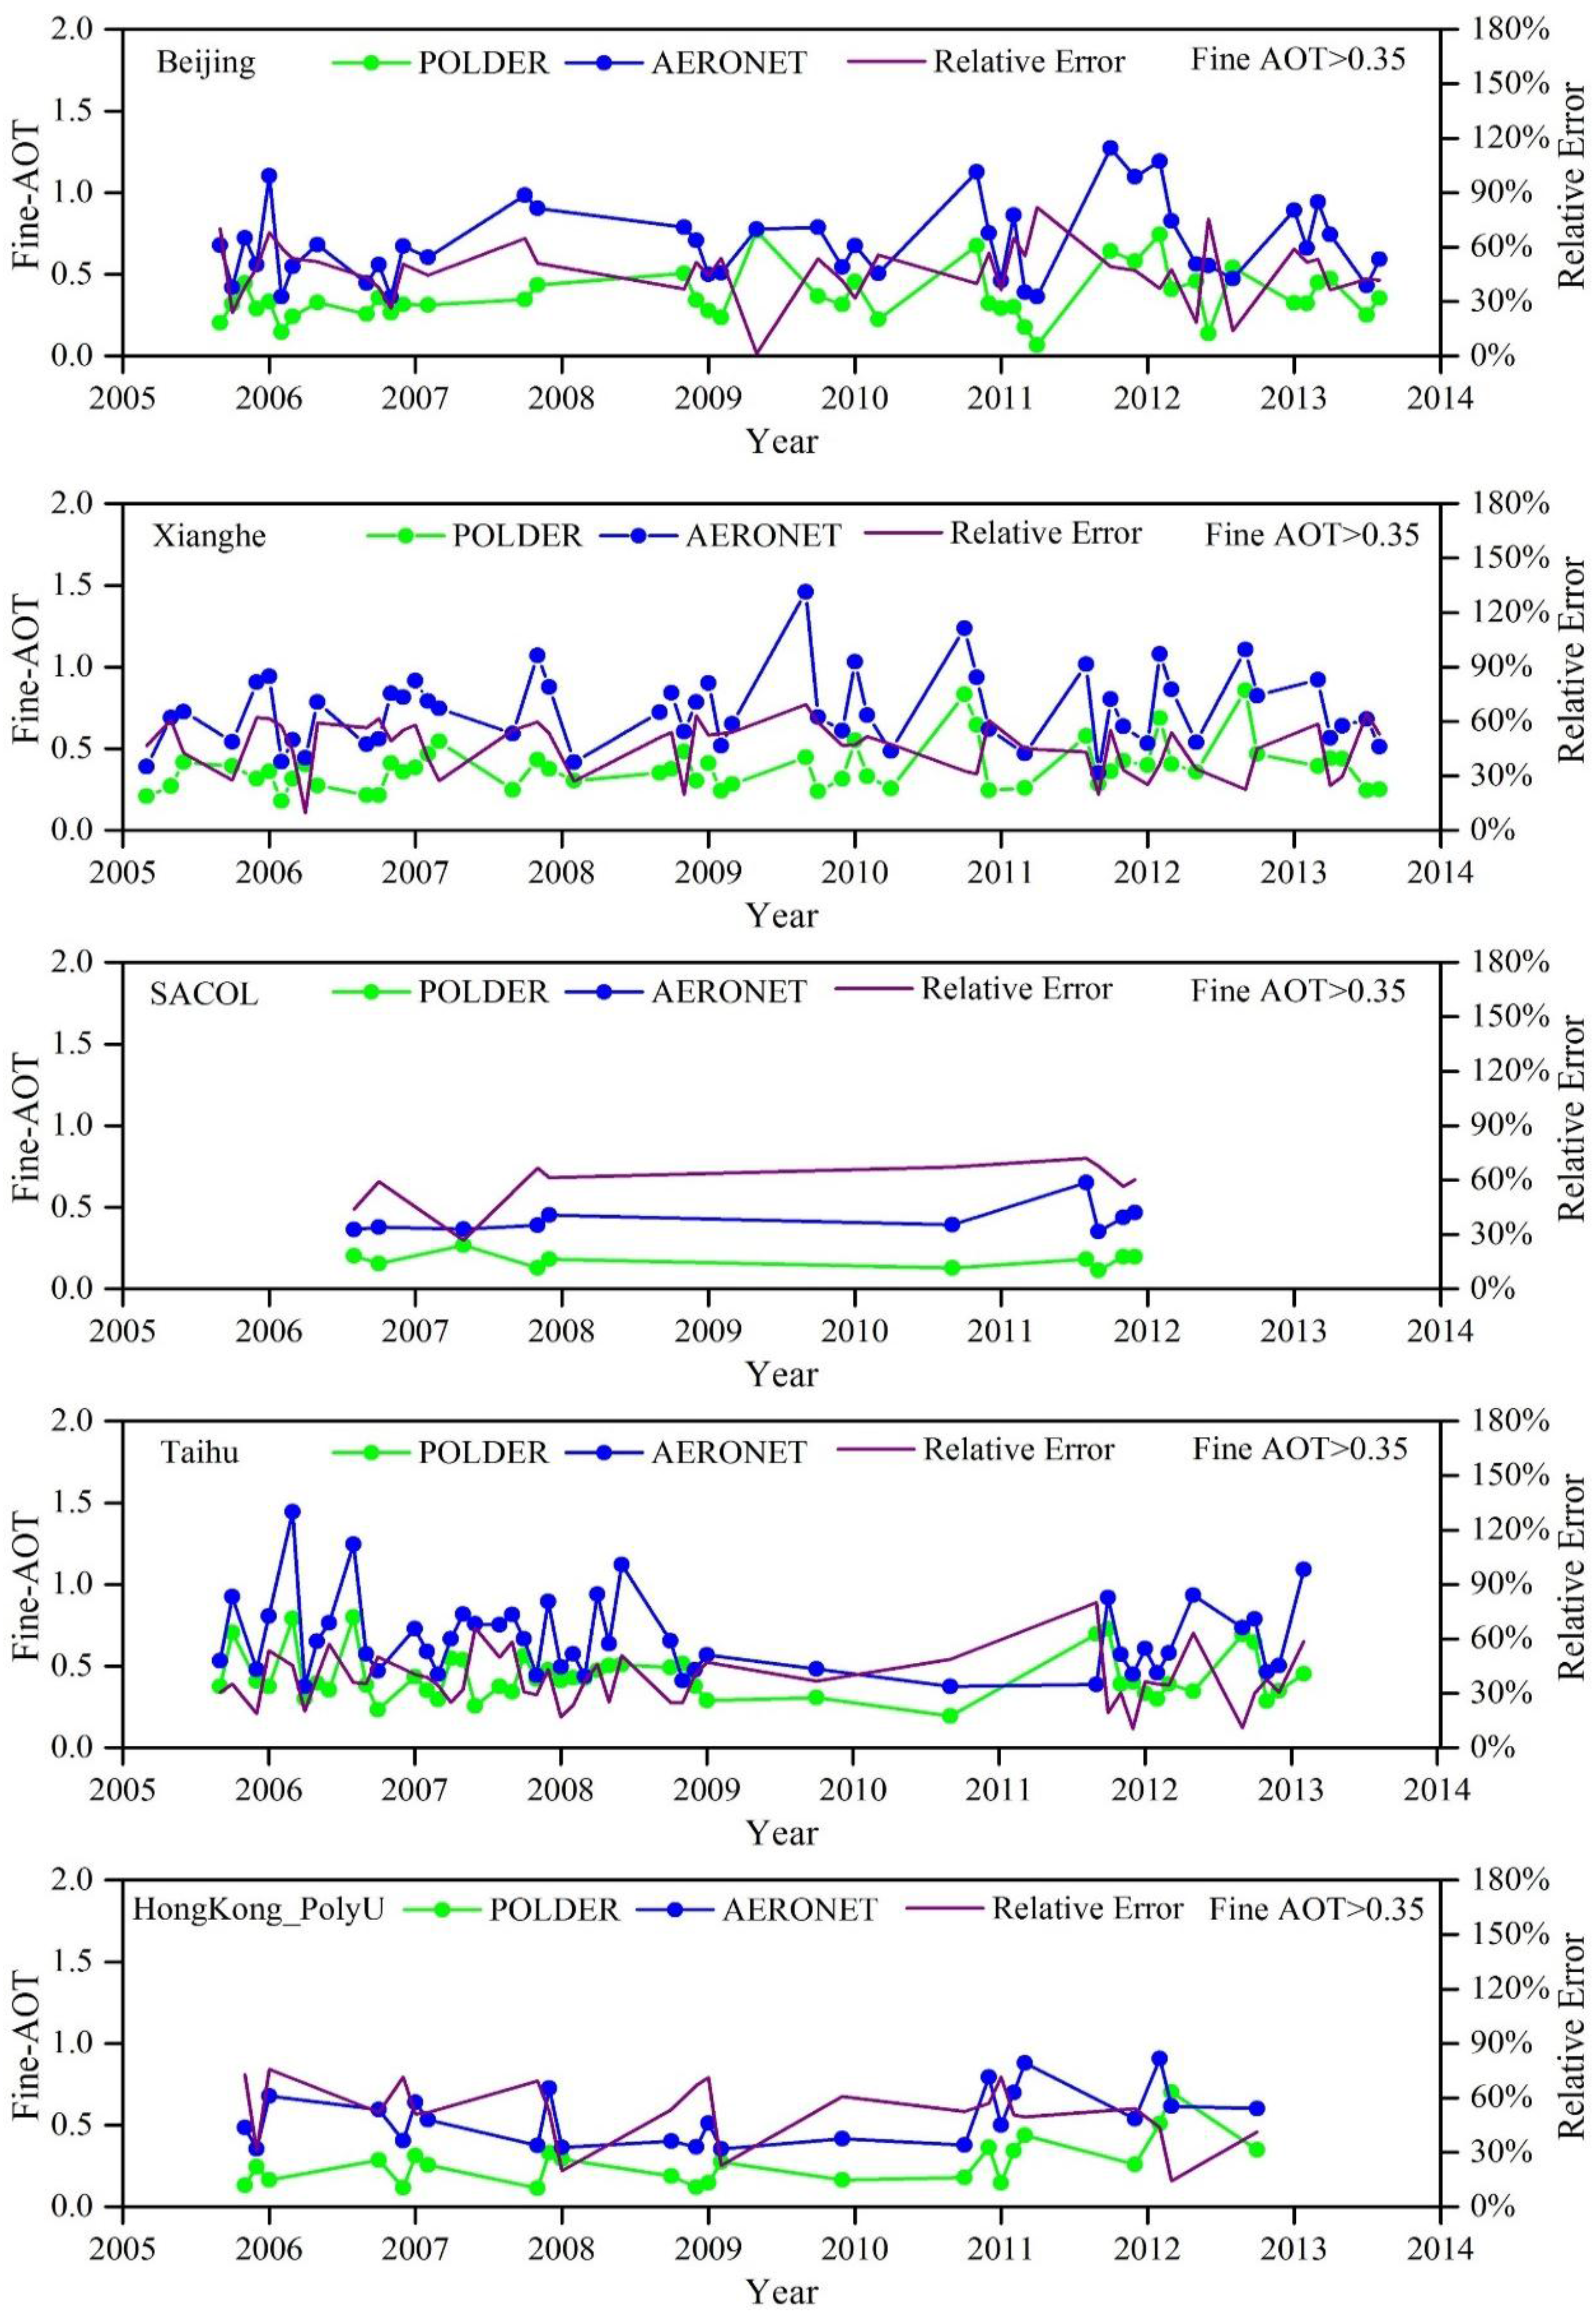
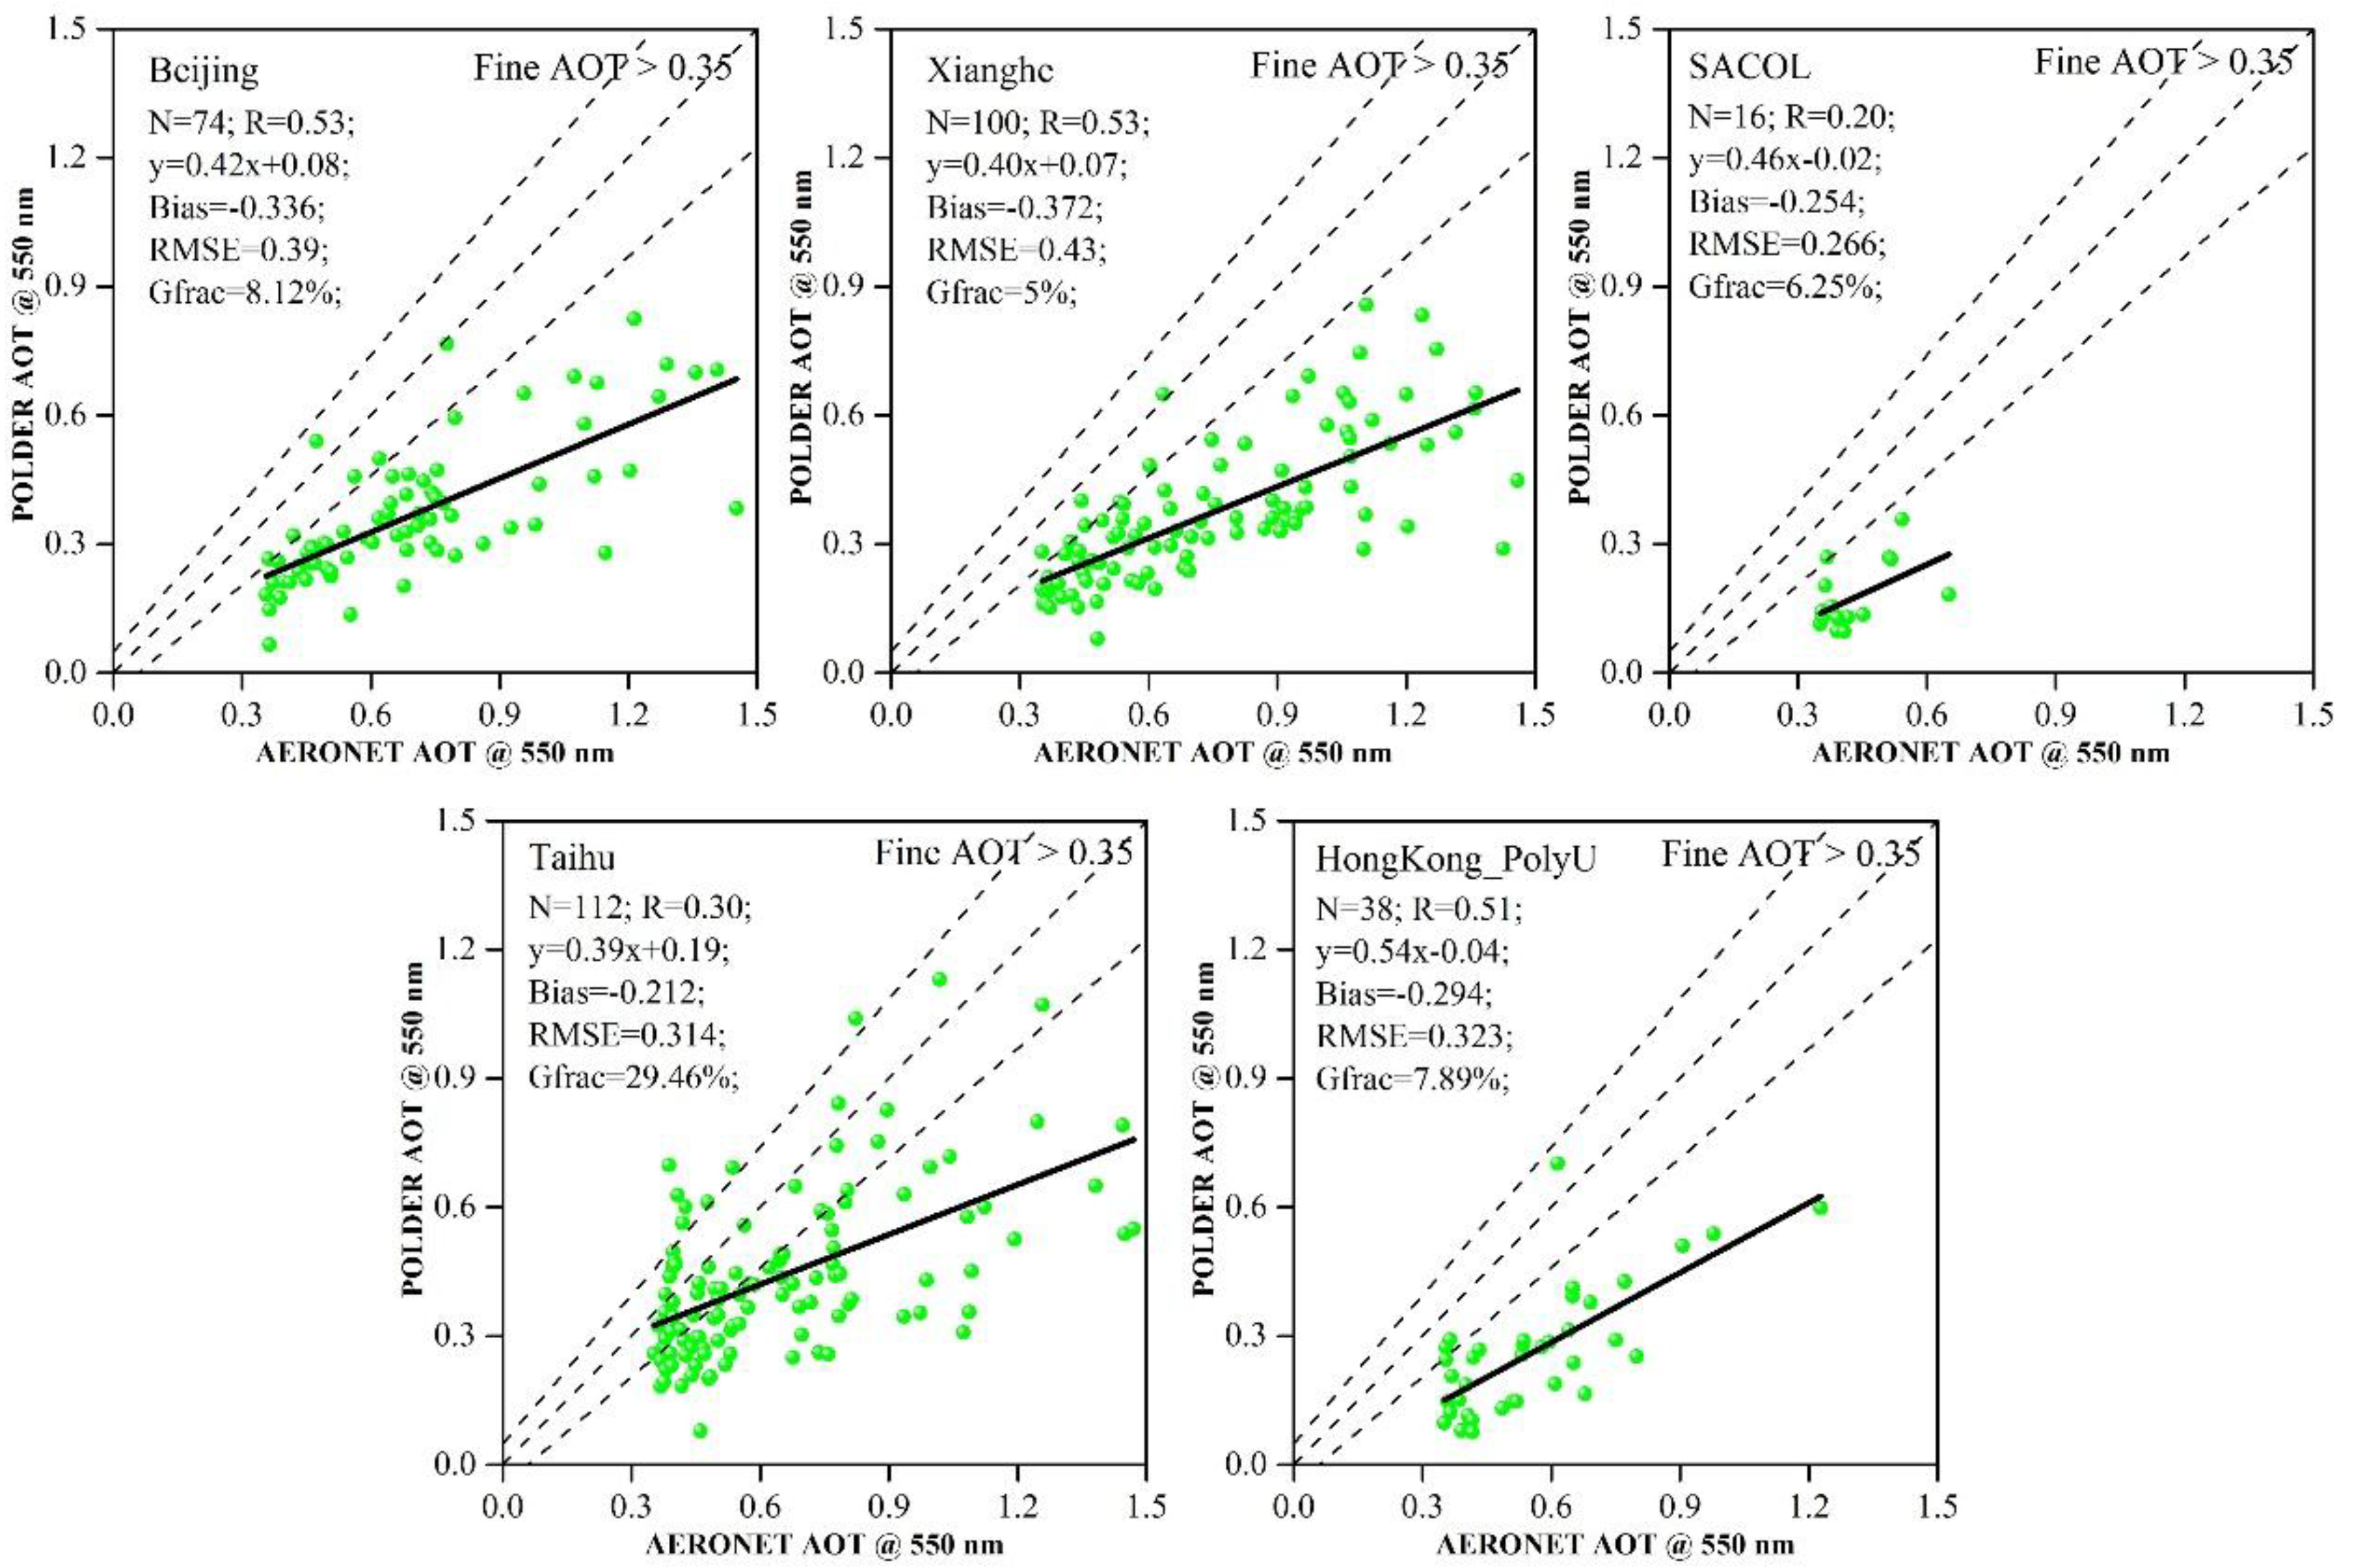
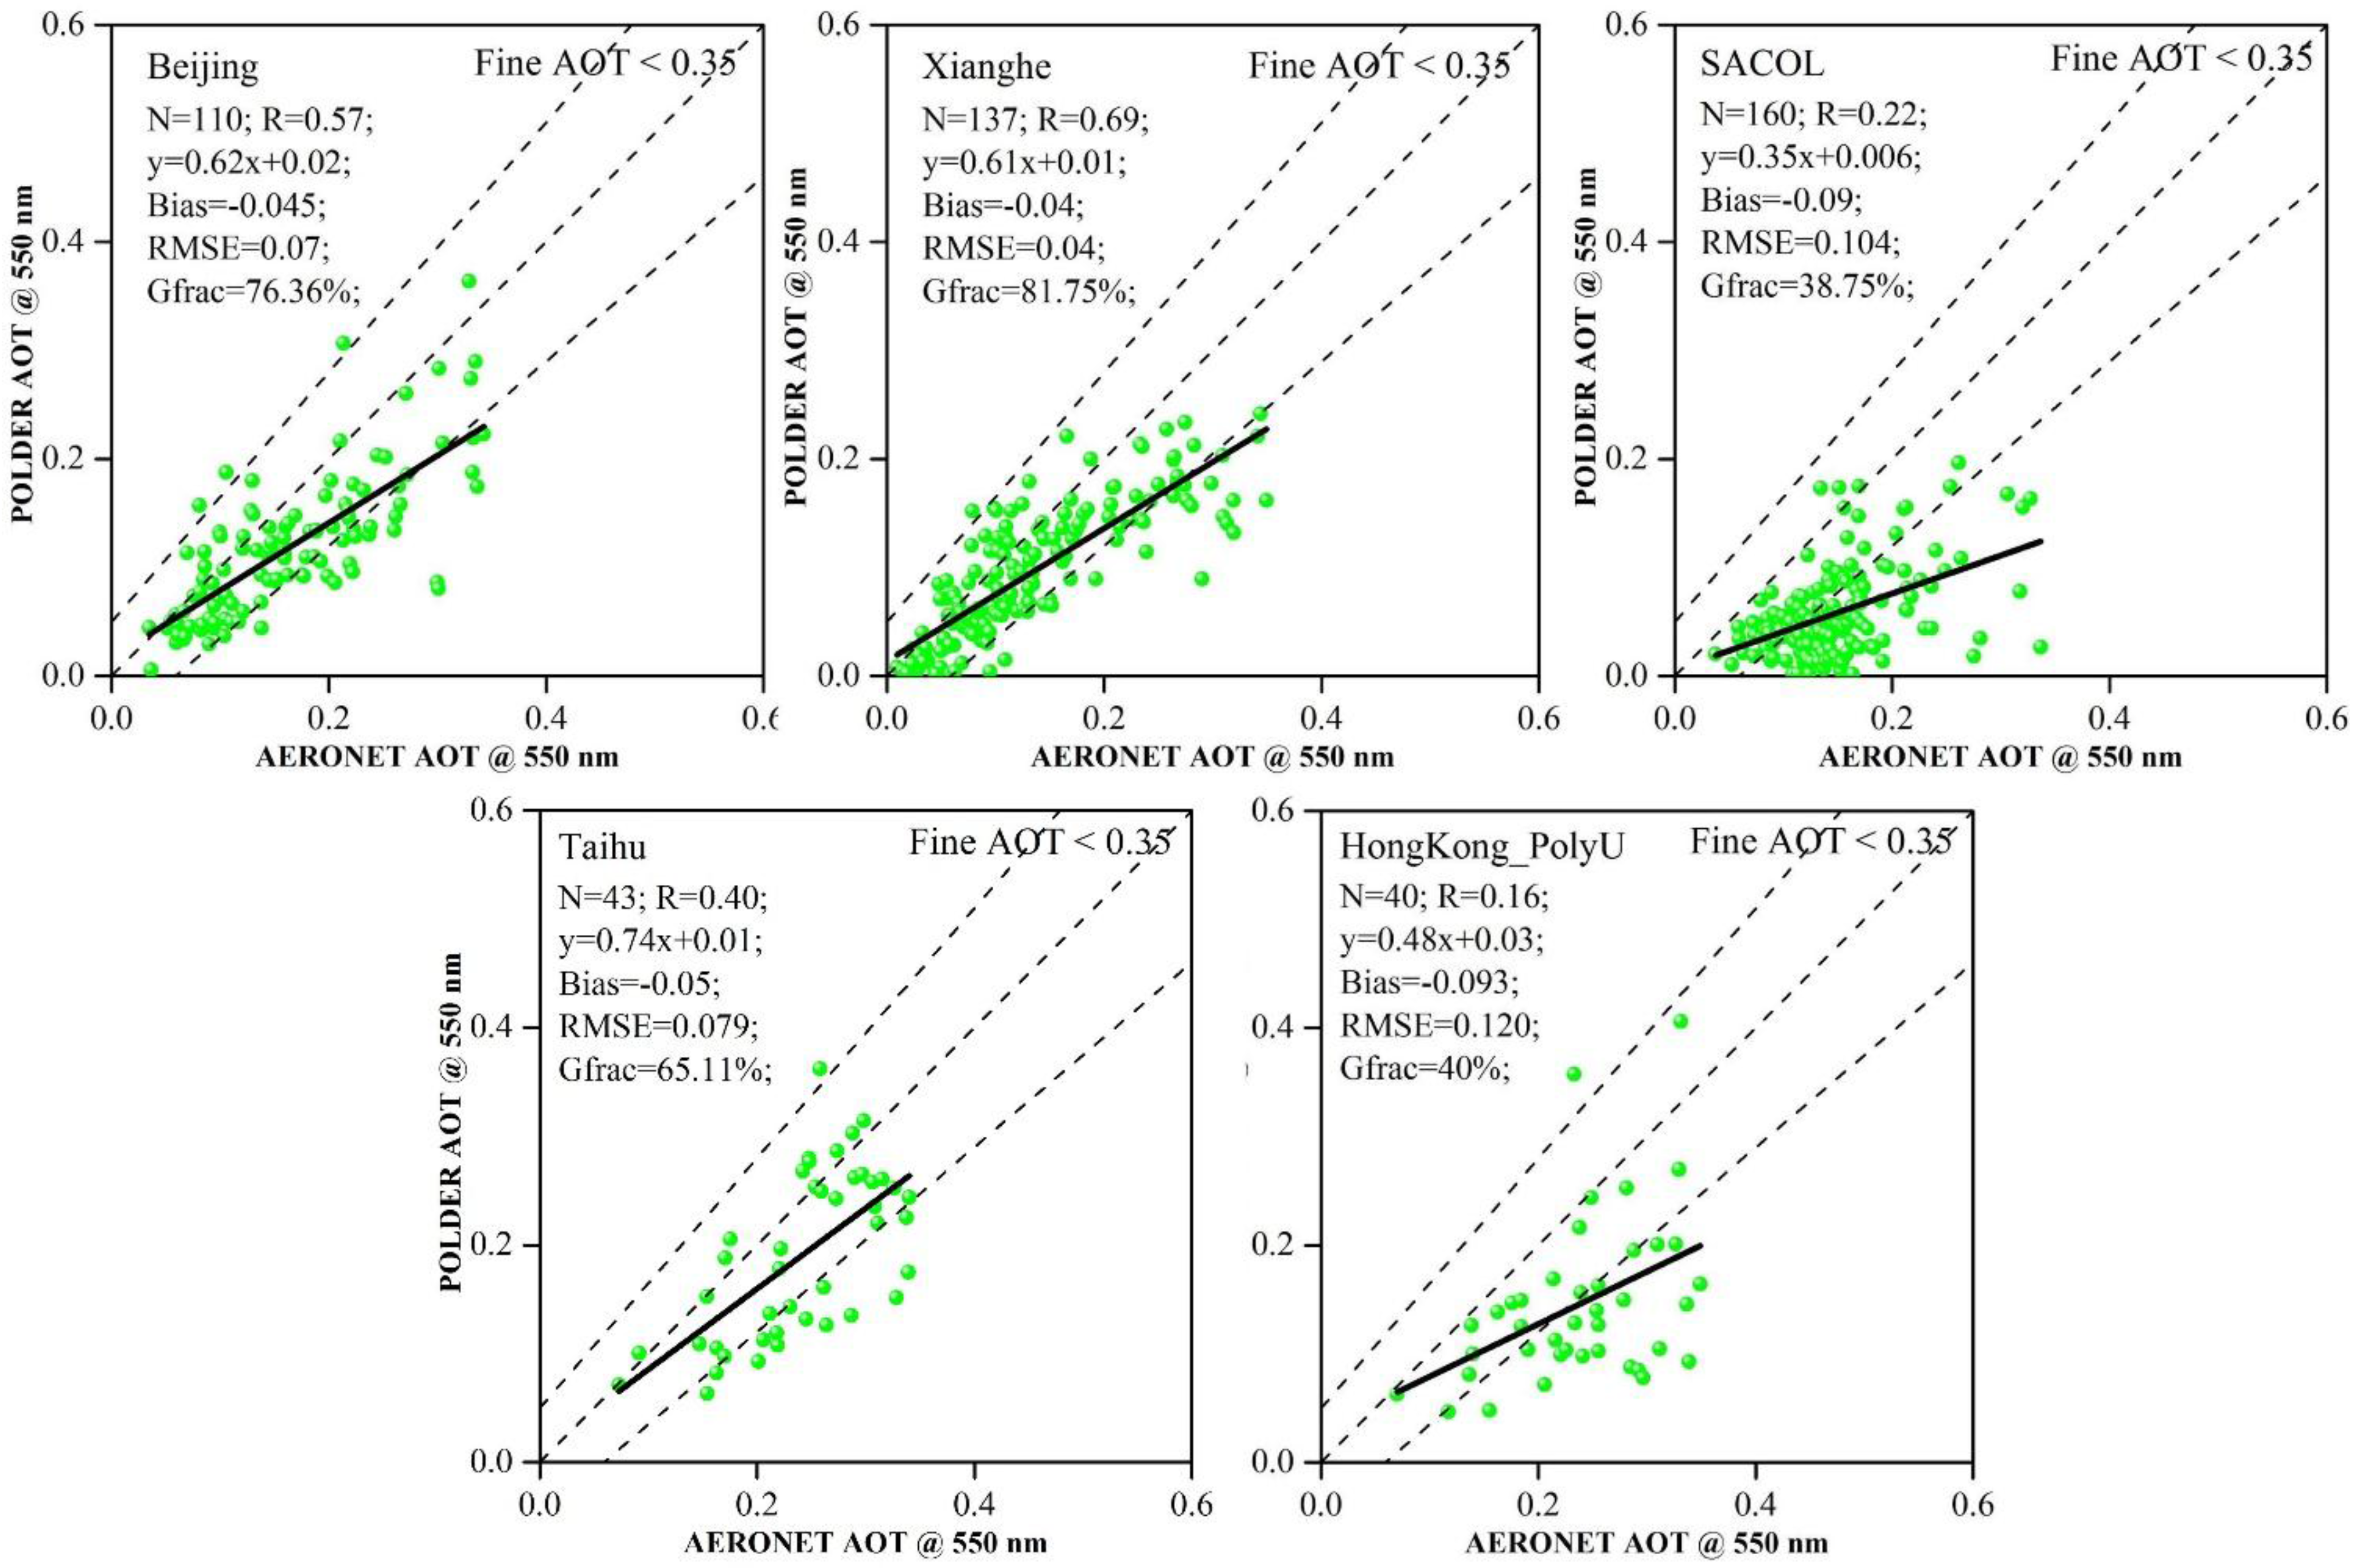
3.3. Comparisons of POLDER-Retrieved AOT Data under Different AERONET Sites of China

The performance of the satellite retrieval of fine AOTs/AOTs tends to be regionally specific because it depends on the aerosol type and the underlying surface type. In this section, the performance of POLDER retrievals over five sites of China are compared (Figure 8 and Figure 9). Beijing is an urban site and has a complicated landscape and local aerosol types, while Xianghe is a rural site that is approximately 70 km southeast of Beijing. Aerosol optical thickness and other properties at Xianghe are nearly the same as over Beijing [34,38]. SACOL is a typical dust activity center and has a relatively high surface reflectance. Taihu site is located in the suburb of Wuxi City, surrounded with farmland and cottages. HongKong_PolyU is an urban site located at southern China an urban site and suffers from a high concentration of anthropogenic aerosols.
During high aerosol loading days, POLDER reveal poor performance with AERONET fine AOTs at Beijing, Xianghe, SACOL, Taihu and HongKong_PolyU, with only 8%, 5%, 6%, 29% and 8% of matches falling within the error range (Figure 8). Besides, the Bias and RMSE values at these five sites are relatively high and coefficients of determination are low. This further illustrates that POLDER’s satellite retrieval algorithms are not suited to China’s high concentration and complex aerosol conditions. Among these five sites, the best retrieval of POLDER is at Taihu site with N = 112, R = 0.3, RMSE = 0.3 and Gfraction = 29%. As we mentioned, POLDER’s outperformance at Taihu can be attribute to its advantage in characterization the surface using polarization measurements.
Figure 8. Scatter plots for POLDER fine-AOTs for high aerosol loading days at the five AERONER sites of China.
Remotesensing 07 13711 g008
When the aerosol loading is low, POLDER has a good performance with respect to AERONET measurements for Beijing, Xianghe and Taihu sites. The “Gfraction” are 76%, 82% and 65%, respectively (Figure 9). For the SACOL and HongKong_PolyU site, the “Gfraction” are relatively small with values 39% and 40%, respectively. As aerosols at Beijing and Xianghe sites are similar and the surface types are different, POLDER retrievals between these two sites are compared. POLDER’s fine-AOT retrieval accuracies at the Xianghe and Beijing sites during high and low aerosol loading days are similar. An excellent performance has been found during low aerosol loading days, with the “good” fractions are about 82%, while on the high aerosol loading days, these fractions are only 5%–8%. From the comparison between POLDER’s performance at the Beijing and Xianghe sites, we concluded that the agreement between POLDER and AERONET measurements reveals no obvious change as the surface type changes. For the SACOL and HongKong_PolyU sites, POLDER’s poor performance are mostly attributed to the inaccurate definition of aerosol properties in the retrieval algorithm or the few matched points during the study period (only 40 matched points during 2005–2013 at HongKong_PolyU).
Figure 9. Scatter plots for POLDER fine-AOTs under low aerosol loading days over the five AERONET sites of China.
Remotesensing 07 13711 g009

4. Conclusions

In this study, the monitoring capability of a polarized instrument (for example, POLDER) under high aerosol loadings over China is investigated. The corresponding aerosol optical thickness values retrieved from POLDER on low aerosol loading days and from a traditional instrument (i.e., MODIS) on high/low aerosol loading days are presented for comparison.
From 2005 to 2013, POLDER-retrieved fine-AOTs are lower than the AERONET values. The mean relative errors of matched POLDER and AERONET fine-AOTs are 44% and 41% for high and low aerosol loading days, respectively. During the long-term trend (2002–2014), MODIS revealed low relative errors with the matched AERONET AOTs for the high aerosol loading days, with a mean relative error of 16%. For the low aerosol loading days, the relative errors of the matched MODIS AOTs fluctuated dramatically, with a maximum value 150% and a minimum value 1%. The mean relative error is 40%, which is two times higher than that under high aerosol loading days (16%).
Scatter plots reveal that POLDER is in good agreement with AERONET fine-AOTs under low aerosol loading days, while it is in poor agreement for high aerosol loading days. The “good” fraction for the former is approximately 62% and is only 14% for the latter. The deteriorating agreement between POLDER and AERONET measurements as the fine-AOTs increased could be caused by the inappropriate aerosol models used in the retrieval algorithm, the influence of cloud screening or the high spatial variation caused by the local aerosol emission. The matched MODIS and AERONET AOTs have similar regression results under low and high aerosol loading days. For low and high aerosol loading days, MODIS showed similar retrieval accuracies, with approximately 50% of matched AOTs falling within ±(0.15τ + 0.05) of the paired validation data .
The performance of PODLER retrieved fine-AOTs over five AEROET sites is further compared. The aerosol optical and physical properties at Beijing and Xianghe are nearly the same, while the surface types are significantly different. According to our results, POLDER’s retrieval accuracies at the Xianghe site on high and low aerosol loading days are similar to those at the Beijing site, and no obvious change was found as the surface type changes. POLDER’s outperformance at Taihu can be attribute to its advantage in characterization the surface using polarization measurements. Its poor performance at SACOL and HongKong_PolyU are mostly attributed to the inaccurate definition of aerosol properties in the retrieval algorithm.

Acknowledgments

This research was supported by the National Basic Research Program of China (No: 2010CB950800) and the Natural Science Foundation of China (No: 41371015, 41001207). We are grateful to the Multi-sensor Aerosol Product Sampling System (MAPSS) teams at NASA for providing the satellite data. We thank the principle investigators (PIs) (Hong-Bin_Chen, Philippe_Goloub, Pucai_Wang, Xiangao_Xia, Janet_Elizabeth_Nichol, Jianping_Huang, Wu_Zhang, Ma_Ronghua) and their staff for establishing and maintaining the Beijing, Xianghe, Hongkong, SACOL and Taihu AERONET sites used in this study.

Author Contributions

Hao Chen, Tianhai Cheng, Xingfa Gu, Zhengqiang Li and Yu Wu conceived and designed the study; Hao Chen and Tianhai Cheng were responsible for the validation of the satellite products and authored the main paper; Xingfa Gu and Zhengqiang Li downloaded the satellite and ground-based data; Yu Wu prepared the figures.

Conflicts of Interest

The authors declare no conflict of interest.

References

  1. Ramanathan, V.C.P.J.; Crutzen, P.J.; Kiehl, J.T.; Rosenfeld, D. Aerosols, climate, and the hydrological cycle. Science 2001, 294, 2119–2124. [Google Scholar] [CrossRef] [PubMed]
  2. Seinfeld, J.H.; Pandis, S.N. Atmospheric Chemistry and Physics: from Air Pollution to Climate Change; John Wiley & Sons: New Jersey, NJ, United States, 2012. [Google Scholar]
  3. Mishchenko, M.I.; Travis, L.D. Satellite retrieval of aerosol properties over the ocean using polarization as well as intensity of reflected sunlight. J. Geophys. Res. 1997, 102, 16989–17013. [Google Scholar] [CrossRef]
  4. Chowdhary, J.; Cairns, B.; Mishchenko, M.I.; Hobbs, P.V.; Cota, G.F.; Redemann, J.; Rutledge, K.; Holben, B.N.; Russell, E. Retrieval of aerosol scattering and absorption properties from photopolarimetric observations over the ocean during the CLAMS experiment. J. Atmos. Sci. 2005, 62, 1093–1117. [Google Scholar] [CrossRef]
  5. Cheng, T.H.; Gu, X.F.; Xie, D.H.; Li, Z.Q.; Yu, T.; Chen, X.F. Simultaneous retrieval of aerosol optical properties over the Pearl River Delta, China using multi-angular, multi-spectral, and polarized measurements. Remote Sens. Environ. 2011, 115, 1643–1652. [Google Scholar] [CrossRef]
  6. Kacenelenbogen, M.; Léon, J.F.; Chiapello, I.; Tanré, D. Characterization of aerosol pollution events in France using ground-based and POLDER-2 satellite data. Atmos. Chem. Phys. 2006, 6, 4843–4849. [Google Scholar]
  7. Kokhanovsky, A.A.; Davis, A.B.; Cairns, B.; Dubovik, O.; Hasekamp, O.P.; Sano, I.; Mukai, S.; Rozanov, V.V.; Litvinov, P.; Lapyonok, T.; et al. Space-based remote sensing of atmospheric aerosols: The multi-angle spectro-polarimetric frontier. Earth-Sci. Rev. 2015, 145, 85–116. [Google Scholar]
  8. Imaoka, K.; Kachi, M.; Fujii, H.; Murakami, H.; Hori, M.; Ono, A.; Igarashi, T.; Nakagawa, K.; Oki, T.; Honda, Y.; Shimoda, H. Global Change Observation Mission (GCOM) for monitoring carbon, water cycles, and climate change. Proc. IEEE. 2010, 98, 717–734. [Google Scholar] [CrossRef]
  9. Gu, X.; Cheng, T.; Xie, D.; Li, Z.; Yu, T.; Chen, H. Analysis of surface and aerosol polarized reflectance for aerosol retrievals from polarized remote sensing in PRD urban region. Atmos. Environ. 2011, 45, 6607–6612. [Google Scholar] [CrossRef]
  10. Xie, D.; Cheng, T.; Zhang, W.; Yu, J.; Li, X.; Gong, H. Aerosol type over east Asian retrieval using total and polarized remote sensing. J. Quant. Spectrosc. Radiat. Transf. 2013, 129, 15–30. [Google Scholar] [CrossRef]
  11. Duncan, B.N.; Martin, R.V.; Staudt, A.C.; Yevich, R.; Logan, J.A. Interannual and seasonal variability of biomass burning emissions constrained by satellite observations. J. Geophys. Res. 2003, 108, ACH 1-1–ACH 1-22. [Google Scholar] [CrossRef]
  12. Li, C.; Marufu, L.T.; Dickerson, R.R.; Li, Z.; Wen, T.; Wang, Y.; Wang, P.; Chen, H.; Stehr, J.W. In situ measurements of trace gases and aerosol optical properties at a rural site in northern China during East Asian Study of Tropospheric Aerosols: An International Regional Experiment 2005. J. Geophys. Res. 2007, 112, D22–S04. [Google Scholar]
  13. Kaskaoutis, D.G.; Sinha, P.R.; Vinoj, V.; Kosmopoulos, P.G.; Tripathi, S.N.; Misra, A.; Sharma, M.; Singh, R.P. Aerosol properties and radiative forcing over Kanpur during severe aerosol loading conditions. Atmos. Environ. 2013, 79, 7–19. [Google Scholar] [CrossRef]
  14. Zhang, R.; Khalizov, A.; Wang, L.; Hu, M.; Xu, W. Nucleation and growth of nanoparticles in the atmosphere. Chem. Rev. 2011, 112, 1957–2011. [Google Scholar] [CrossRef] [PubMed]
  15. MAPSS. Available online: http://giovanni.gsfc.nasa.gov/mapss.html (accessed on 5 June 2015).
  16. Waquet, F.; Cairns, B.; Knobelspiesse, K.; Chowdhary, J.; Travis, L.D.; Schmid, B.; Mishchenko, M.I. Polarimetric remote sensing of aerosols over land. J. Geophys. Res. 2009, 114. [Google Scholar] [CrossRef]
  17. Deuzé, J.L.; Bréon, F.M.; Devaux, C.; Goloub, P.; Herman, M.; Lafrance, B.; Maignan, F.; Marchand, A.; Perry, G.; Tanré, D. Remote sensing of aerosols over land surfaces from POLDER-ADEOS–1 polarized measurements. J. Geophys. Res. 2001, 106, 4913–4926. [Google Scholar] [CrossRef]
  18. Remer, L.A.; Kaufman, Y.J.; Tanré, D.; Mattoo, S.; Chu, D.A.; Martins, J.V.; Li, R.R.; Ichoku, C.; Levy, R.C.; Kleidman, R.G.; et al. The MODIS aerosol algorithm, products, and validation. J. Atmos. Sci. 2005, 62, 947–973. [Google Scholar] [CrossRef]
  19. Levy, R.C.; Remer, L.A.; Mattoo, S.; Vermote, E.F.; Kaufman, Y.J. Second-generation operational algorithm: Retrieval of aerosol properties over land from inversion of Moderate Resolution Imaging Spectroradiometer spectral reflectance. J. Geophys. Res. 2007, 112. [Google Scholar] [CrossRef]
  20. Levy, R.; Remer, L.; Kleidman, R.; Mattoo, S.; Ichoku, C.; Kahn, R.; Eck, T.F. Global evaluation of the Collection 5 MODIS dark-target aerosol products over land. Atmos. Chem. Phys. 2010, 10, 10399–10420. [Google Scholar] [CrossRef] [Green Version]
  21. Bréon, F.M.; Colzy, S. Cloud detection from the spaceborne POLDER instrument and validation against surface synoptic observations. J. Appl. Meteorol. 1999, 38, 777–785. [Google Scholar] [CrossRef]
  22. Holben, B.N.; Eck, T.F.; Slutsker, I.; Tanre, D.; Buis, J.P.; Setzer, A.; Vermote, E.; Reagan, J.A.; Kaufman, Y.J.; Nakajima, T.; Lavenu, F.; Jankowiak, I.; Smirnov, A. AERONET—A federated instrument network and data archive for aerosol characterization. Remote Sens. Environ. 1998, 66, 1–16. [Google Scholar] [CrossRef]
  23. Holben, B.N.; Smirnov, A.; Eck, T.F.; Slutsker, I.; Abuhassan, N.; Newcomb, W.W.; Schafer, J.S.; Chatenet, B.; Lavenu, F.; Kaufman, Y.J.; et al. An emerging ground-based aerosol climatology- Aerosol optical depth from AERONET. J. Geophys. Res. 2001, 106, 12067–12097. [Google Scholar] [CrossRef]
  24. Smirnov, A.; Holben, B.; Eck, T.; Dubovik, O.; Slutsker, I. Cloud-screening and quality control algorithms for the AERONET database. Remote Sens. Environ. 2000, 73, 337–349. [Google Scholar] [CrossRef]
  25. Angstrom, A. On the atmospheric transmission of sun radiation and on dust in the air. Geogr. Ann. 1929, 11, 156–166. [Google Scholar]
  26. Hyer, E.J.; Reid, J.S.; Zhang, J. An over-land aerosol optical depth data set for data assimilation by filtering, correction, and aggregation of MODIS Collection 5 optical depth retrievals. Atmos. Meas. Tech. 2011, 4, 379–408. [Google Scholar] [CrossRef]
  27. Ichoku, C.; Chu, D.A.; Mattoo, S.; Kaufman, Y.J.; Remer, L.A.; Tanré, D.; Slusker, I.; Holben, B.N. A spatio-temporal approach for global validation and analysis of MODIS aerosol products. Geophys. Res. Lett. 2002, 29, MOD1-1. [Google Scholar] [CrossRef]
  28. Chu, D.A.; Kaufman, Y.J.; Ichoku, C.; Remer, L.A.; Tanré, D.; Holben, B.N. Validation of MODIS aerosol optical depth retrieval over land. Geophys. Res. Lett. 2002, 29, MOD2-1. [Google Scholar] [CrossRef]
  29. Tripathi, S.N.; Dey, S.; Chandel, A.; Srivastava, S.; Singh, R.P.; Holben, B.N. Comparison of MODIS and AERONET derived aerosol optical depth over the Ganga Basin, India. Ann. Geophy. 2005, 23, 1093–1101. [Google Scholar] [CrossRef]
  30. Zhao, T.P.; Stowe, L.L.; Smirnov, A.; Crosby, D.; Sapper, J.; McClain, C.R. Development of a global validation package for satellite oceanic aerosol optical thickness retrieval based on AERONET observations and its application to NOAA/NESDIS operational aerosol retrievals. J. Atmos. Sci. 2002, 59, 294–312. [Google Scholar] [CrossRef]
  31. Kahn, R.A.; Garay, M.J.; Nelson, D.L.; Levy, R.C.; Bull, M.A.; Diner, D.J.; Martonchik, J.V.; Hansen, E.G.; Remer, L.A.; Tanré, D. Response to “Toward unified satellite climatology of aerosol properties. 3. MODIS versus MISR versus AERONET”. J. Quant. Spectrosc. Radiat. Transf. 2011, 112, 901–909. [Google Scholar] [CrossRef]
  32. Deuzé, J.L.; Bréon, F.M.; Devaux, C.; Goloub, P.; Herman, M.; Lafrance, B.; Maignan, F.; Marchand, A.; Nadal, F.; Perry, G.; Tanré, D. Remote sensing of aerosols over land surfaces from POLDER-ADEOS-1 polarized measurements. J. Geophy. Res. 2001, 106, D5. [Google Scholar]
  33. Kim, D.H.; Sohn, B.J.; Nakajima, T.; Takamura, T.; Takemura, T.; Choi, B.C.; Yoon, S.C. Aerosol optical properties over East Asia determined from ground‑based sky radiation measurements. J. Geophys. Res. 2004, 109, D2. [Google Scholar] [CrossRef]
  34. Eck, T.F.; Holben, B.N.; Dubovik, O.; Smirnov, A.; Goloub, P.; Chen, H.B.; Chatenet, B.; Gomes, L.; Zhang, X.Y.; Tsay, S.C.; Ji, Q.; Giles, D.; Slusker, I. Columnar aerosol optical properties at AERONET sites in central eastern Asia and aerosol transport to the tropical mid-Pacific. J. Geophys. Res. 2005, 110, D06202. [Google Scholar] [CrossRef]
  35. Bréon, F.M.; Vermeulen, A.; Descloitres, J. An evaluation of satellite aerosol products against sunphotometer measurements. Remote Sens Environ. 2011, 115, 3102–3111. [Google Scholar] [CrossRef]
  36. Fan, X.; Goloub, P.; Deuzé, J.L.; Chen, H.; Zhang, W.; Tanré, D.; Li, Z. Evaluation of PARASOL aerosol retrieval over North East Asia. Remote Sens. Environ. 2007, 112, 697–707. [Google Scholar] [CrossRef]
  37. Cheng, T.; Gu, X.; Xie, D.; Li, Z.; Yu, T.; Chen, H. Aerosol optical depth and fine-mode fraction retrieval over East Asia using multi-angular total and polarized remote sensing. Atmos. Meas. Tech. 2012, 5, 501–516. [Google Scholar] [CrossRef]
  38. Chen, H.; Cheng, T.; Gu, X.; Wu, Y. Impact of particle nonsphericity on the development and properties of aerosol models for East Asia. Atmos. Environ. 2015, 101, 246–256. [Google Scholar] [CrossRef]
  39. Xia, X.A.; Chen, H.B.; Wang, P.C.; Zhang, W.X.; Goloub, P.; Chatenet, B.; Eck, T.F.; Holben, B.N. Variation of column-integrated aerosol properties in a Chinese urban region. J. Geophys. Res. 2006, 111. [Google Scholar] [CrossRef]

