Article

CMSAF Radiation Data: New Possibilities for Climatological Applications in the Czech Republic

1
Department of Atmospheric Physics, Faculty of Mathematics and Physics, Charles University, V Holešovičkách 2, 1800 00 Praha 8, Czech Republic
2
Czech Hydrometeorological Institute, Na Sabatce 17, 143 06 Praha 4, Czech Republic
*
Author to whom correspondence should be addressed.
Remote Sens. 2015, 7(11), 14445-14457; https://doi.org/10.3390/rs71114445
Submission received: 6 August 2015 / Revised: 21 October 2015 / Accepted: 22 October 2015 / Published: 30 October 2015
(This article belongs to the Special Issue Remote Sensing of Solar Surface Radiation)

Abstract

:
Satellite Application Facility on Climate Monitoring (CMSAF) data have been studied in the Czech Republic for approximately 10 years. Initially, validation studies were conducted, particularly regarding the incoming solar radiation product and cloudiness data. The main focus of these studies was the surface incoming shortwave (SIS) radiation data. This paper first briefly describes the validation of CMSAF SIS data for the period of 1989–2009. The main focus is on the use and possible applications of CMSAF data. It is shown that maps of SIS radiation in combination with surface data may be useful for solar power plant operators as well as for assessing the climate variability in the Czech Republic during different years and seasons. This demonstrates that the CMSAF data can improve our understanding of local climate, especially in regions lacking traditional surface observations and/or in border regions with a scarcity of stations in the neighboring countryside. Furthermore, data from the recently released SARAH (Surface Solar Radiation Data Set-Heliosat) dataset (1983–2013) are also briefly described and their use for trend computing is demonstrated. Finally, an outlook is given in terms of further possibilities for using CMSAF data in the Czech Republic.

Graphical Abstract

1. Introduction

Traditional observations of meteorological elements provide high-quality data but fairly low spatial representativeness, especially for high variability variables. Although the density of the measuring grid could be increased, the cost would exceed the means of the national meteorological services. For some elements, it is possible to replace or complement them with data measured by meteorological satellites. Currently, there is a multitude of products available originating from these measurements, and sometimes it is difficult to determine the parameter best suited to user needs. One option for the European region is provided by METEOSAT through its Satellite Application Facilities [1], which include the Satellite Application Facility on Climate Monitoring (CMSAF), focusing on climate data [2]. CMSAF provides both operational products and long-term datasets.
The operational products have documented non-relevant limitations, which largely satisfy the applicable requirements and/or are deemed sufficiently mature by the relevant Steering Group to be distributed to users [3]. With near real-time availability, they are distributed in a timely manner (within eight weeks) to support operational climate-monitoring applications (e.g., national meteorological and hydrological services). Due to the inhomogeneity caused by the timeliness requirement, these products may not be suitable for monitoring the inter-annual variability and trends with a high confidence. Bias errors due to the shift of equator overpass times, orbit height decay, and instrument errors can cause inter-satellite biases to remain uncorrected for the operational monitoring product. However, the characterization of significant anomalies on the monthly scale is possible.
The datasets, similarly to the operational products, largely satisfy the applicable requirements with documented characteristics, validations, results, and limitations, and they are also deemed sufficiently mature for target applications by the relevant Steering Group. They are retroactively produced and based on carefully inter-sensor calibrated radiances. Their aim is the provision of homogenous sets of high-quality data for the investigation of climate variability and long-term changes of the mean climate state (by minimizing the errors of operational products).
One group of products addresses solar radiation. The solar surface radiation represents one of the basic climate elements. It plays an important role in the global energy cycle, is crucial for many human activities, such as agriculture and solar energy, and, of course, is a factor in many climate processes. The accurate measurement of solar radiation is critical in many fields of (and not limited to) applied climatology, from climate monitoring to solar energy and land surface studies. In the territory of the Czech Republic, the surface incoming shortwave radiation is measured by the Czech Hydrometeorological Institute (CHMI) radiation network. This network was established in 1984, providing 30 years of continuous measurement. The network is composed of just 11 stations (although eight new stations have been added since 2002). Although these traditional man-operated observations usually provide high-quality data, the density of the radiation stations is not high enough to thoroughly cover the area of the Czech Republic (Figure 1). Solar radiation products from CMSAF provide a more complex view of the solar parameter fields, and they are definitively less expensive, with comparable quality to the surface instrumental measurements. This is why products and datasets from CMSAF started to be used in the CHMI. The main focus has been on the surface incoming shortwave radiation, the SIS product (also known as the global irradiance). This climatological element is crucial for various fields of applied climatology that CHMI addresses.
Figure 1. CHMI radiation network stations within the Czech Republic (as of October 2013) (source: http://portal.chmi.cz).
Remotesensing 07 14445 g001
Validation studies of the satellite-generated data were conducted. Naturally, there were prior validation studies conducted directly by the CMSAF staff [4,5,6,7,8,9]. However, to ensure a convincing confirmation of the quality of the CMSAF data, a comparison was needed with the solar radiation data measured directly in the Czech Republic.
In the beginning of 2015, a new set of long-term data records of surface incoming shortwave radiation, SARAH (Surface Solar Radiation Data Set-Heliosat), was released [10]. This set provides data for the period of 1983 to 2013, including the monthly, daily, and even hourly averages in a regular longitude/latitude grid at a resolution of 0.05° × 0.05°. The accuracy of these data relative to surface measurements is 5.5 m for the monthly SIS averages [11]. It should be noted that SARAH includes not only SIS but also the direct normal radiation and effective cloud albedo.
In the following sections, several applications of CMSAF solar radiation and its usage are described. Because of a partial interconnection between the solar radiation and cloudiness data, we have also focused on selected cloudiness products provided by CMSAF. Sometimes it is more convenient and even precise to work with the sunshine duration to establish the average cloudiness during the day than directly using the cloudiness measurement. The reason for this is the large subjectivity regarding the cloud cover (and its types) in the human observation-based measurement at weather stations. For this reason, we have also paid special attention to cloudiness products of the cloud fractional cover (CFC) and cloud type (CTY) [12].

2. Use and Application of CMSAF Solar Data

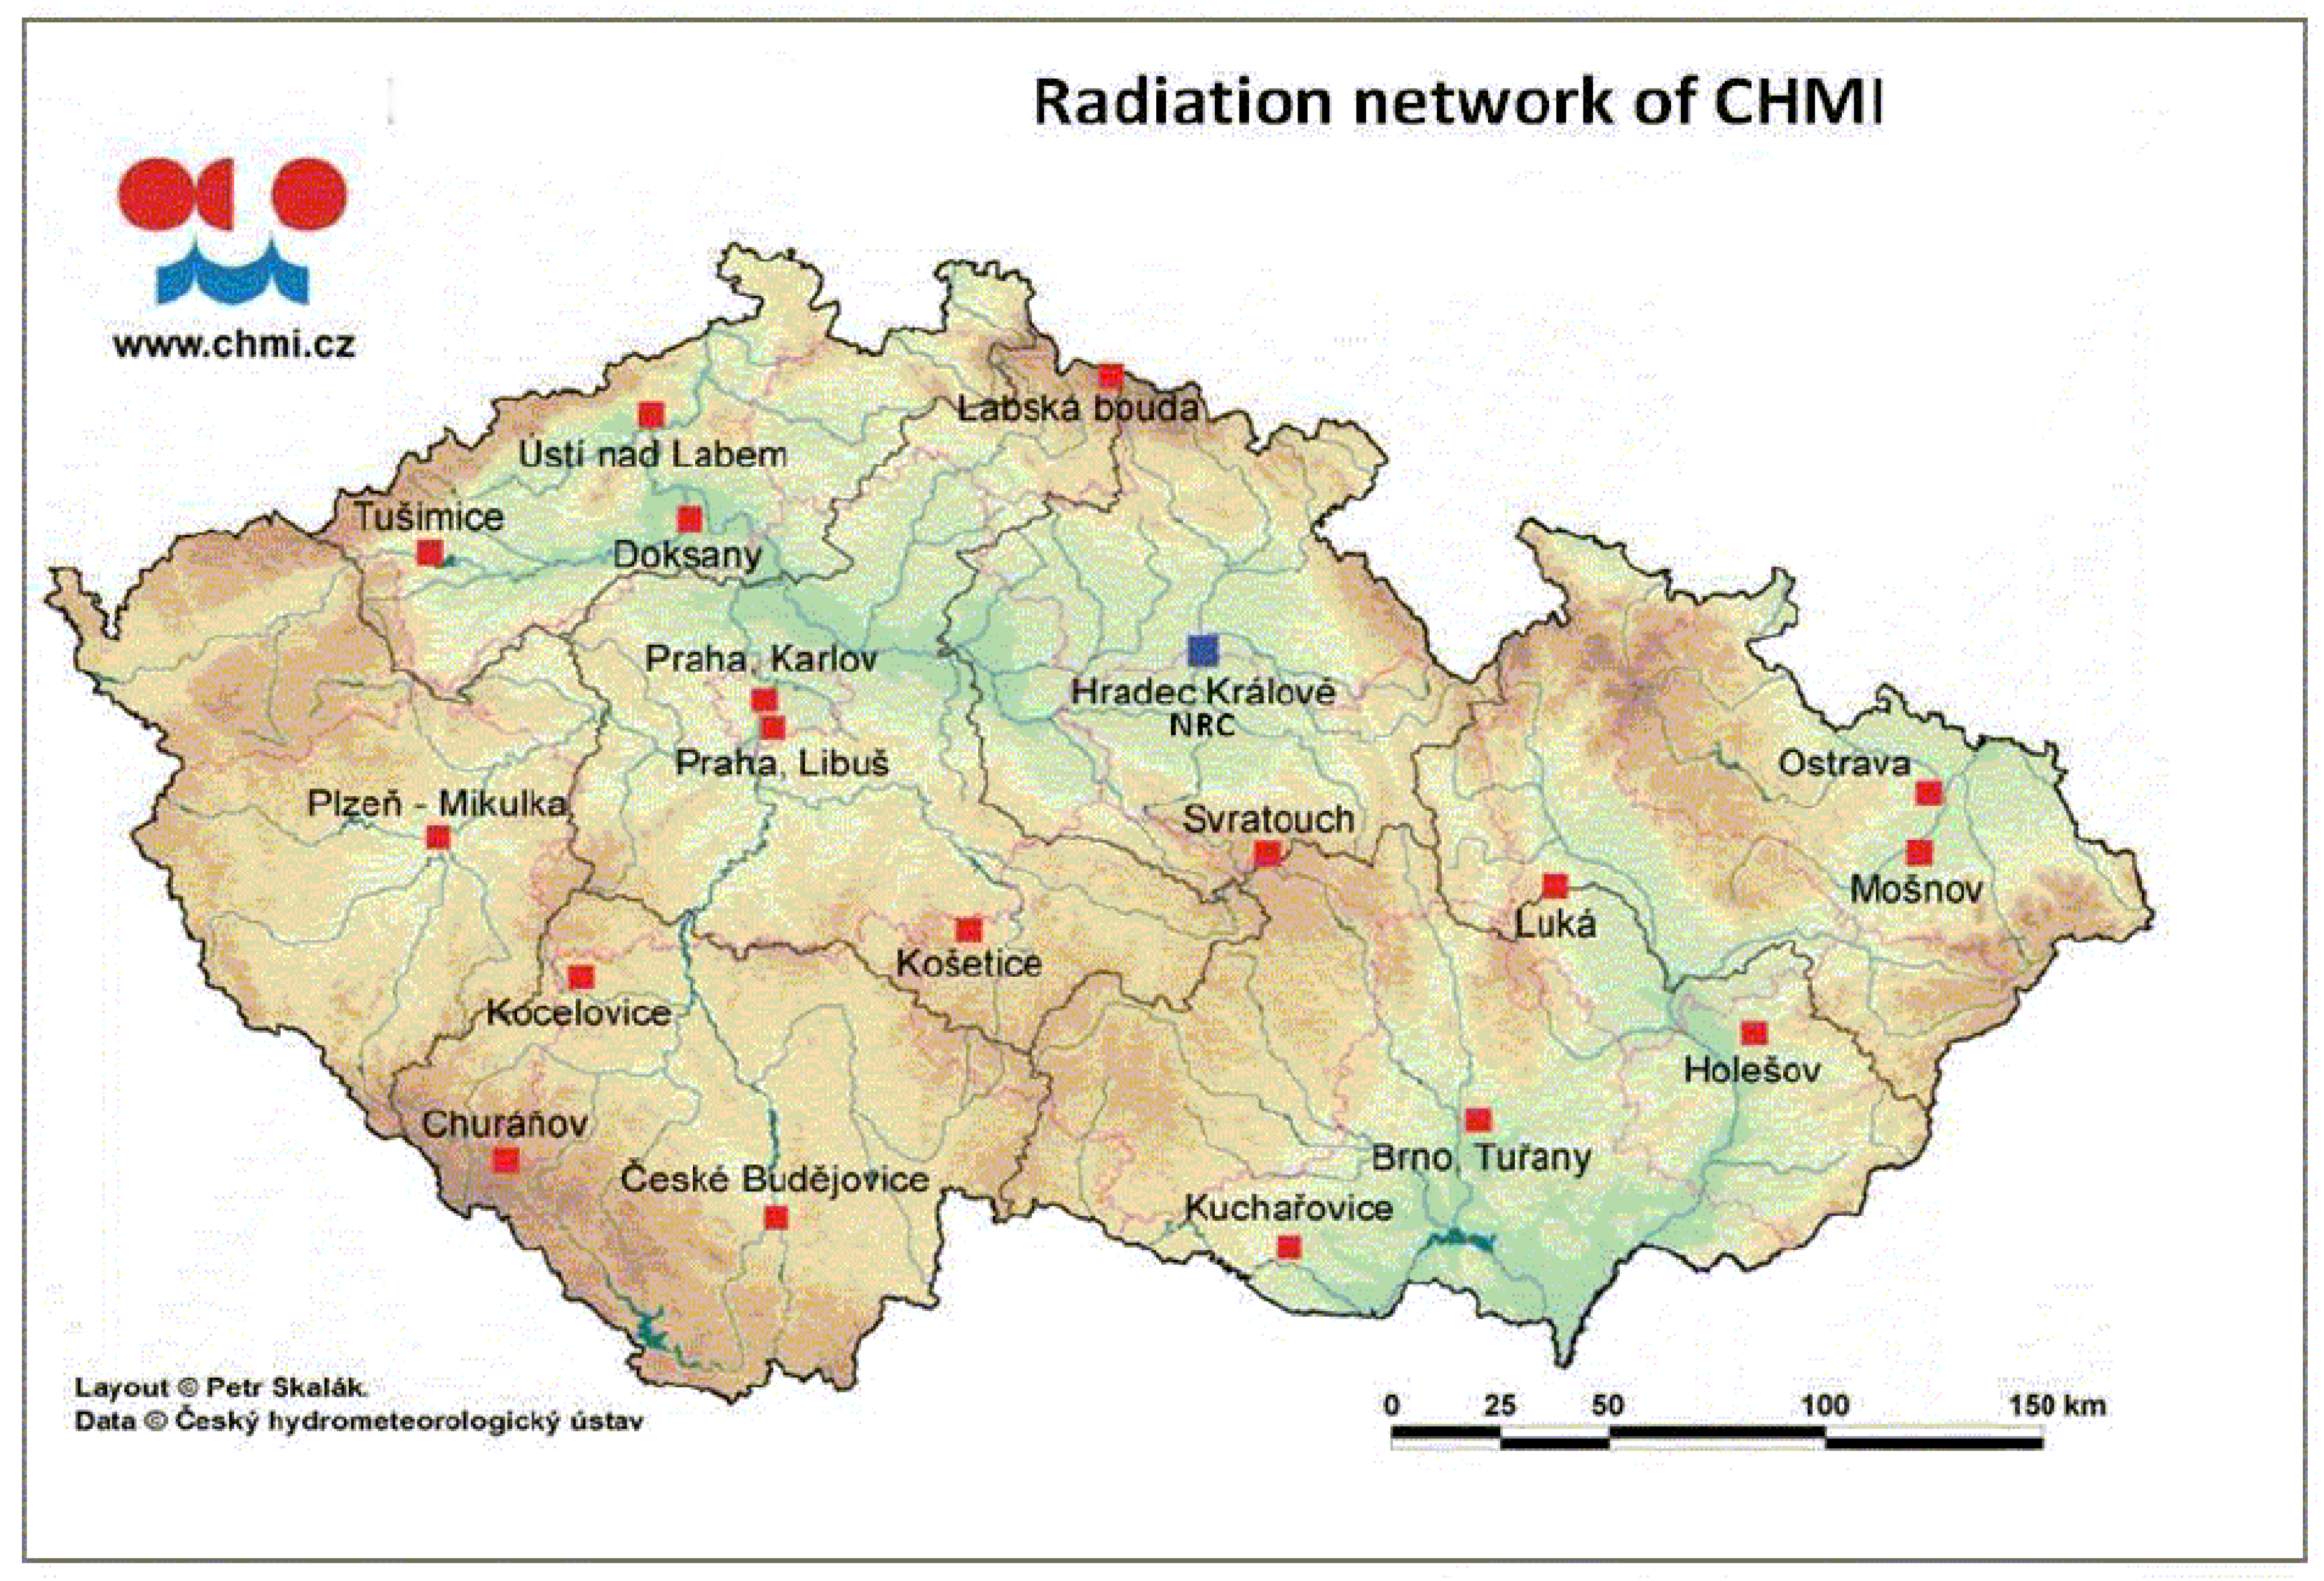
2.1. Verification of SIS in the CHMI

As mentioned above, the validation of SIS data was conducted by CMSAF climatologists as well as by other authors. However, before the use of the data for climatological applications, we had to check the data to obtain convincing proof of their reliability, both for us and other potential users. Because the highest demand from users was for monthly data, the comparison was made for this time scale only. The verification was performed similarly to the Validation Report of CMSAF [13]. For 10 stations measuring SIS since 1984, SIS data from the CMSAF dataset from the period of 1989–2009 (based on AVHRR (Advanced Very High Resolution Radiometer) Global Area Coverage data) was extracted for points closest to the stations. Basic statistical parameters (bias, standard deviation, and the number of months with a difference between surface and satellite data over 15 W/m2) were computed. The results can be seen in Table 1. The values of the bias are approximately 4–5 W/m2. Although there is generally no substantial difference between various locations, the stations located in the northwestern part of Bohemia (with a stronger aerosol pollution) have slightly higher values. This is consistent with other studies focusing on Central Europe [4] that found a bias of 5.3 W/m2 for the Hradec Králové station for the period of 1983–2005. This suggests a slight radiation overestimation in CMSAF data compared to the surface measurements. The portion of months with differences exceeding 15 W/m2 is approximately 11%. The highest bias was found at the Churanov station, located in the mountains in the southwestern Czech Republic; this can be related to the complex terrain in the region, with fog and stratus clouds often forming in the valleys (see [14]). The annual course of SIS radiation sums is similar for both types of data (Figure 2). Generally, it may be concluded that the SIS data from CMSAF are very similar to those measured at the surface, with only slight overestimations compared to surface stations (with the largest bias in April); thus, it is acceptable to use them for various climatological applications.
Table 1. Basic statistics of comparison between SIS (surface incoming shortwave) data from CMSAF (Satellite Application Facility on Climate Monitoring) (SIS product) and the surface station observations at a monthly time scale.
Station (and Type)Altitude (m a.s.l.)Bias (W/m2)Ratio of Months with Difference over 15 W/m2 Standard Deviation (W/m2)Number of Cases
Hradec Králové (lowland)2854.110%8.1252
Churáňov (mountainous)11224.714%8.8252
Kocelovice (hilly, countryside)5194.68%8.8252
Košetice (hilly, countryside)4704.49%8.3252
Kuchařovice (lowland, countryside)3344.510%8.5252
Luká (hilly, countryside)5104.59%8.4252
Mošnov (lowland, countryside)2424.29%8.3252
Praha-Karlov (city, centre)2544.311%8.2252
Svratouch (hilly, countryside)7374.210%8.1252
Tušimice (industrial region)3224.513%8.6252
Ústí nad Labem (industrial region)3754.612%9.2252
Figure 2. Average annual course (1989–2009) of average monthly sums of SIS radiation (MJ = mega-joules, m = metre) for Prague both for the surface station-and satellite-derived data (SIS product of CMSAF); the bias is also shown.
Remotesensing 07 14445 g002

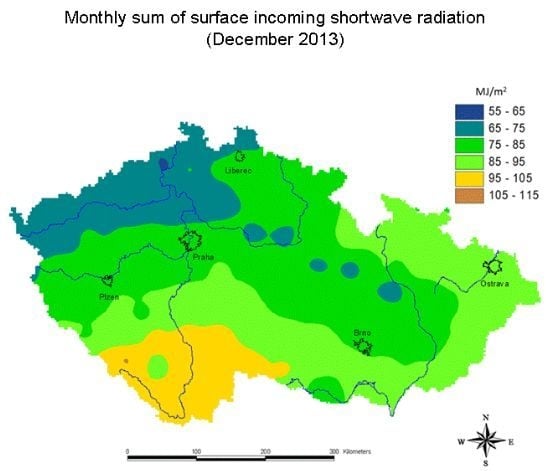
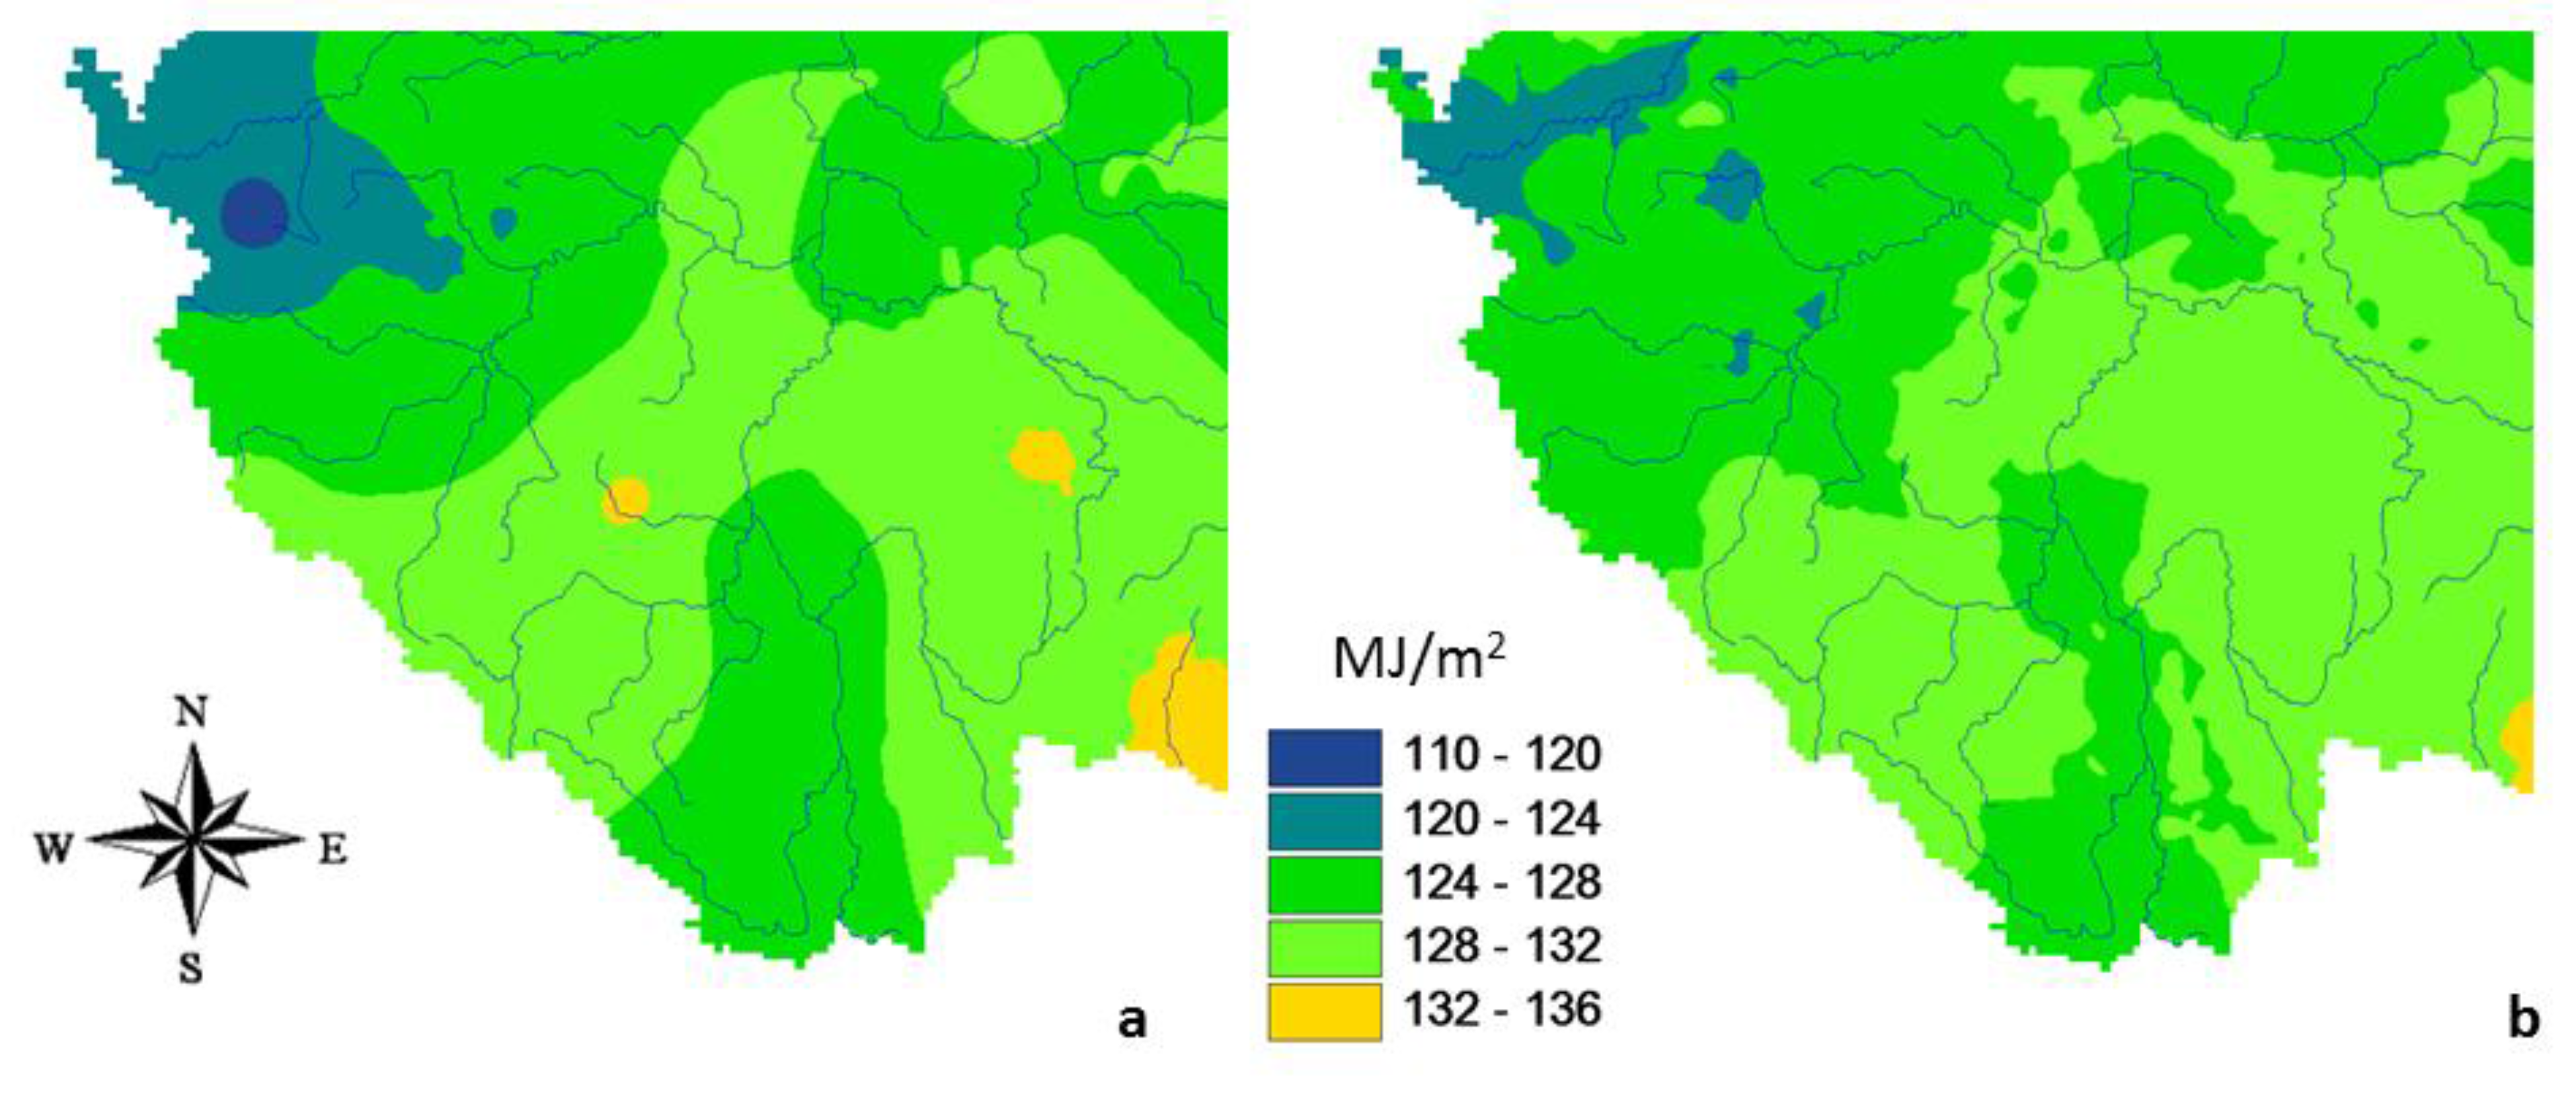
2.2. Solar Radiation Maps and Graphs—on Monthly and Long Term Bases

The surface incoming shortwave radiation is of great interest to solar power plant operators [5]. However, the information on solar radiation is often also required by banks (providing credit to the operators) and state bodies, such as the Energy Regulatory Office of the Czech Republic. They either require the measured data (which is, however, limited due to the small number of stations observing the global radiation) or sometimes maps. To process maps of SIS, it is necessary to interpolate the observations, but when only measured values are used, the resulting map has limited values due to errors originating from the interpolation. A possible method of improving these maps is the use of a special regression model with the relative sunshine duration values measured at meteorological stations because this parameter is observed more often. Another way is combining both the measured values of SIS from the surface measurements and the SIS data of CMSAF (operational data, see [15] for details). This was conducted by extracting satellite data into a regular grid at a resolution of 15 × 15 km over the Czech Republic area. The extracted values are placed in the centers of the satellite pixels. Further measured values are added where available (in their real positions) and then the values are interpolated with the help of the inverse distance weighting (IDW) method spatial interpolation. The IDW method was selected because the field of solar radiation over the Czech Republic is quite homogeneous, and the input data are fairly equally distributed; otherwise, the kriging method would probably be preferable. Additionally, grids outside the Czech Republic can also be used in constraining the values for the border regions to more realistic estimates. These maps are available with a few weeks’ delay compared to the surface data, but their complexity offsets this negative aspect. An example of such a map prepared from an operational product can be seen in Figure 3 (with the indication of utilized locations). It should be noted that due to the customer requests, the values are calculated and presented not in the intensity values but in the amount values (mega-joules per square meter).
Figure 3. Monthly sum of SIS in December 2013. Example of a product combining the surface measured data and CMSAF data.
Remotesensing 07 14445 g003
From the times series data, long-term averages were also constructed. The resulting maps can facilitate assessment of the solar radiation availability for solar panels in the given region. An example for the whole yearly sum (1989–2009) is shown in Figure 4.
Figure 4. Long-term average of the annual sum of SIS constructed by the combination of measured and CMSAF data (1989–2009).
Remotesensing 07 14445 g004

2.3. Long-Term Changes of Surface Solar Radiation in the Czech Republic

There are various reasons why the long-term changes of SIS are also of some interest. In addition to the aforementioned solar power plant development possibilities, they may be useful, for example, in agriculture or the tourism industry. In the preceding part of this paper, the SIS CMSAF dataset covering the 20-year period of 1989–2009 was used (the seven years from 1982–1988 might possibly be used as well as auxiliary data), but in climatology, longer periods are better. Usually a period lasting at least 30 years is required for further analyses. Nevertheless, all of this changed in the beginning of 2015 when the SARAH dataset was released. It contains a 31-year period from 1983–2013, which perfectly suits the climatological requirements. Due to the limited time since the data were released, only few analyses could be conducted, the first of which was to capture the trend, if any, of SIS in the Czech Republic. A map was constructed for this period based solely on SIS CMSAF data (Figure 5). It can be seen that while almost no trend is observed in the southern and northeastern parts of the Czech Republic, clear positive trends occur in the northern and northwestern parts of Bohemia. There might be two explanations for this occurrence: (1) The northwestern part of Bohemia was particularly heavily industrialized and substantially polluted in the 1980s (with many brown coal power plants lacking desulphurization). During the 1990s, desulphurization was carried out, and economic changes led to a reduction of the chemical industry and a decrease in aerosol pollution; this had a reducing effect on fog and low-level cloud occurrence [14]. (2) Naturally, climate change might have had an impact, e.g., the lower frequency of Atlantic cyclones (less cloudiness), thus allowing a higher amount of solar radiation to reach the surface [16]. In general, point (1) has had a greater impact. When comparing trends measured at surface stations with those derived from CMSAF, very similar values can be seen (Table 2), and this is in line with previous studies [11].
Figure 5. Map of the decadal trend of SIS in the Czech Republic from the SARAH dataset (1983–2013).
Remotesensing 07 14445 g005
Table 2. Decadal trends of SIS for selected stations in the 1983–2013 period. Values for surface stations and for the closest points were derived from SARAH data.
Station (and Type)Altitude (m a.s.l.)Trend of Surfaced Data (W/m2)Trend of Satellite Data (W/m2)
Hradec Králové (lowland)2851.61.7
Churáňov (mountainous)11221.10.8
Ústí nad Labem (industrial region)3754.84.0
Ostrava (lowland, city)2421.20.9
Kocelovice (hilly, countryside)5190.60.4
Košetice (hilly, countryside)4701.21.2
Kuchařovice (lowland, countryside)3341.31.1
Luká (hilly, countryside)5101.61.7
Praha-Karlov (city, centre)2541.51.9
Svratouch (hilly, countryside)7371.61.8
Tušimice (industrial region)3223.32.8

2.4. Weather Test Reference Year

Weather Test Reference Year (TRY) represents a typical course of meteorological elements during the year and has been constructed and used in many countries [17]. However, in the Czech Republic, it was first constructed approximately six years ago [18] using the data from 1990–2005, so it is perfectly covered by the SIS dataset. Since its preparation, it has been used in many application fields, especially in civil engineering. It contains 10 meteorological elements, including temperature, precipitation, humidity, wind, and SIS. Due to limited SIS measurements, it was computed based on the relative sunshine duration. However, the data are not available everywhere, as there are parts of the Czech Republic with a limited number of stations measuring the sunshine duration. This is why a correction of TRY was tested. For these regions, ‘fictitious’ points were created in selected locations, which differ in climate from the surrounding regions (and have no surface solar radiation observation). These additional points create a denser network of input data. An interpolation based on this network was conducted. We present the results for the southwestern part of Bohemia because this is a region with a complex orography and with different climate features in the immediate neighboring regions. The average May values are given in Figure 6 (a comparison between the original values and the state after adding SIS data from CMSAF). The resultant field of SIS reflects the climate features in the studied area better than the previous approximation.
Figure 6. Example of SIS map used for TRY computation (southwestern part of Bohemia) for May ((a) based on station data only, (b) combination of both station and CMSAF data).
Remotesensing 07 14445 g006

2.5. Solar Radiation and Cloudiness Data

As previously mentioned in the introduction, we focused on selected cloudiness products provided by CMSAF, especially the Cloud Fractional Cover (CFC). CLAAS (CM SAF CLoud property dAtAset) data have been used for this purpose [19]. The average cloudiness is one of the main climatological parameters describing cloudiness, but sometimes it is more convenient and even more accurate to work with the sunshine duration to compute the average cloudiness during the day than using the cloudiness measurement directly. The cloudiness is computed according to the relative sunshine duration for the given day. This is also a common practice in the Czech Republic [14]. Using daily data from seven years, maps of average monthly cloudiness were constructed based on the surface sunshine duration data and CFC data. The method of map construction is as follows: A regular grid of average monthly cloudiness was prepared from CFC data (monthly data from CMSAF). For surface stations measuring sunshine duration, the cloudiness was computed according to the relative sunshine duration. In this network of higher density data (more grids with cloudiness), a spatial interpolation was conducted. An example can be seen in Figure 7.
Figure 7. Average monthly cloudiness for November 2012: (a) Only station data based on the sunshine duration; (b) combination of station and CMSAF data.
Remotesensing 07 14445 g007

2.6. Outlook

Since SARAH data were released, more climatological applications and studies have become possible because we now have a homogenized time series of radiation with a span of 31 years. Because radiation is one of the main climate features, it can be used for various applications in agriculture as well as in many climate classifications. Another potential lies in the tourism industry, e.g., the most and least sunny period for a given place can be obtained; the first results for Prague and the mountain area of Jeseníky in the northeastern part of the Czech Republic are given in Figure 8. A sunny day is defined as a day with 80% or more of available clear-sky surface solar radiation for the given day. Of course, the possibilities of model data validation seem to be promising because these data have very high time and spatial resolution and homogeneity and are freely available, which could be of great importance in the Czech Republic where only a part of the meteorological data is free of charge.
Figure 8. Probability of sunny day occurrence for a given decade for the regions of Prague and the Jeseníky mountains (from SARAH products).
Remotesensing 07 14445 g008

3. Uncertainties, Errors, and Accuracies

As shown in Section 2, the SIS data from the CMSAF are very close to the values observed at the surface climatological stations, which is also the case for the region of the Czech Republic. The differences between these two data sources usually do not exceed 5 W/m2 for monthly values (in terms of the average intensity of the SIS), with CMSAF data slightly overestimating the ground observations. Also, the number of months with higher differences (in excess of 15 W/m2) seems to be reasonably small. Validation should also be performed for daily or even hourly values, particularly for the SARAH dataset, but as shown in [10], the monthly and daily mean from CMSAF SARAH have higher quality than the previous CMSAF surface radiation dataset. This is also the case for the direct surface radiation, which was additionally evaluated for the SARAH dataset to allow a comparison with the previous version of the CMSAF surface radiation dataset. Higher uncertainties of SIS are expected for regions with a long-lasting snow cover and desert regions with brighter surfaces, but this is not the case for the territory of the Czech Republic. Furthermore, based on the CMSAF team findings [10], there is no obvious inhomogeneity apparent in the SIS time series, so these time series are fit to be applied in long-term change studies. However, what still needs to be taken into account is the question of possible inhomogeneity caused by the significant decrease in aerosol load after 1989.

4. Discussion

Satellite data provide a great source of climate information and can be used in various applications within climatology, meteorology, or beyond. However, generally this also represents a source of potential problems: When we want to use satellite data instead of (or combined with) surface observations, there is an issue of locality matching (usually the satellite grid point slightly deviates from the surface station location). In the case of solar radiation data, SIS in particular, the situation is generally good. This parameter is instrumentally measured at the surface, so there is no subjective element to be considered when comparing the data with the satellite counterparts (namely CMSAF in this case). For this reason, the use of SIS provided by CMSAF seems to be very promising and helpful in climatology. Another point that has to be mentioned here, especially regarding the Czech Republic, is the existence of a good network of SIS surface observations (taking into account its spatial variability) and a fairly large number of stations measuring the sunshine duration, a parameter that can be used for the computation of SIS as an alternative. Simultaneously, the recently released SARAH dataset also makes the direct normal radiation available to us, a parameter that is only partly measured, and therefore this element can now be extracted from this dataset for the entire Czech Republic. Another issue is cloudiness. Generally, the observer cannot see all the clouds above him/her if they are located in multiple layers overlapping each other. For example, when observing 8/8 of sky covered by stratus clouds, the observer is not able to spot any higher clouds. The satellite, in contrast, is able to capture cirrus or altostratus clouds above the stratus level. Furthermore, in summer the observers tend to report more distant clouds (in case there is no cloudiness in the station surroundings), especially if they are of convective origin such as cumulonimbus clouds, the anvil of which can be observed from 50 to 100 km or even farther. However, from the satellite’s point of view, there are no clouds immediately above the observer. This means the man-performed observation from surface stations can lead to a mismatch when making comparisons with the satellite data, but this is only due to the different viewing technologies and not due to a physical inconsistency. Generally, the specifics of satellite-based observations need to be remembered when comparing them with the surface (“conventional way of”) observation. The high quality of measurements from surface stations might also be one of the reasons why climatologists in the Czech Republic do not feel an urgent need to use and work with satellite data (which is not limited to CMSAF data in this respect). Finally, there is also an economic argument for using the satellite data; due to budgetary cuts, the number of stations has decreased in the Czech Republic over the last decade, making the satellite data more useful than ever.

5. Conclusions

The solar radiation data obtained from the CMSAF satellite measurements have proved to be a useful complement to conventional surface observations. They can help to create more realistic maps of the surface incoming shortwave radiation when combining CMSAF SIS data with the surface radiation network observations. These maps can then find various practical applications, for instance, in solar power plants. When the long-term version of the data is utilized, useful information about the local solar climate variability can also be obtained. This is especially the case when using the SARAH dataset data covering the 31-year period of 1983–2013. Such a period is sufficiently long to be used in climatology for various applications. For example, trends can be detected. As has been shown in the Czech Republic, these are mostly slightly positive, with the highest values in the northwestern parts of Bohemia (approximately 4 W/m2 per 10 years). It is possible to determine the sunniest periods during the year and also during the whole period. For example, in Prague, the sunniest period during the year is the second half of April, whereas the sunniest month since 1983 was July 1994 (which was also one of the warmest months). Many more applications based on this long-term data may yet be found, especially in agriculture, but also in the construction industry. The usefulness of CMSAF solar radiation data has already been shown in the model validation [20,21,22], with the largest benefit lying in the data homogeneity and resolution, both spatial and temporal.

Acknowledgements

This study was supported by the Czech Science Foundation (GA ČR) through grant P209/11/0956.

Author Contributions

Michal Zak wrote the first draft. All authors planned the manuscript and provided input at all stages of writing.

Conflicts of Interest

The authors declare no conflict of interest.

References

  1. EUMETSAT. Available online: http://www.eumetsat.int/website/home/Satellites/GroundSegment/Safs/index.html (accessed on 30 July 2015).
  2. Schulz, J.; Albert, P.; Behr, H.-D.; Dewitte, S.; Dürr, B.; Gratzki, A.; Hollmann, R.; Karlsson, K.-G.; Manninen, T.; Müller, R.; et al. Operational climate monitoring from space: The EUMETSAT Satellite Application Facility on Climate Monitoring (CMSAF). Atmos. Chem. Phys. 2009, 9, 1687–1709. [Google Scholar] [CrossRef]
  3. CMSAF. http://www.cmsaf.eu (accessed on 30 July 2015).
  4. Sanchez-Lorenzo, A.; Wild, M.; Trentmann, J. Validation and stability assessment of the monthly mean CMSAF surface solar radiation dataset over Europe against a homogenized surface dataset (1983–2005). Remote Sens. Environ. 2013, 134, 355–366. [Google Scholar] [CrossRef]
  5. Posselt, R.; Mueller, R.W.; Stöckli, R.; Trentmann, J. Remote sensing of solar surface radiation for climate monitoring—The CMSAF retrieval in international comparison. Remote Sens. Environ. 2012, 118, 186–198. [Google Scholar] [CrossRef]
  6. Antonanzas-Torres, F.; Cañizares, F.; Perpiñán, O. Comparative assessment of global irradiation from a satellite estimate model (CMSAF) and on-ground measurements (SIAR): A Spanish case study. Renew. Sustain. Energy Rev. 2013, 21, 248–261. [Google Scholar] [CrossRef] [Green Version]
  7. Sancho, J.M.; de Sanchez Cos, M.C.; Jiménez, C. Comparison of global irradiance measurements of the official Spanish radiometric network for 2006 with satellite estimated data. Tethys 2011, 8, 43–52. [Google Scholar] [CrossRef]
  8. Journée, M.; Bertrand, C. Improving the spatio-temporal distribution of surface solar radiation data by merging ground and satellite measurements. Remote Sens. Environ. 2010, 114, 2692–2704. [Google Scholar] [CrossRef]
  9. Bojanowski, J.S.; Skidmore, A.K.; Vrieling, A. A comparison of data sources for creating a long-term time series of daily gridded solar radiation for Europe. Sol. Energy 2014, 99, 152–171. [Google Scholar] [CrossRef]
  10. Müller, R.; Pfeifroth, U.; Träger-Chatterjee, C.; Trentmann, J.; Cremer, R. Digging the Meteosat Treasuer—3 decades of solar surface radiation. Remote Sens. 2015, 7, 8067–8101. [Google Scholar] [CrossRef]
  11. Müller, R.; Pfeifroth, U.; Träger-Chatterjee, C.; Cremer, R.; Trentmann, J.; Hollmann, R. Surface Solar Radiation Data Set-Heliosat (SARAH)-Edition 1; EUMETSAT Satellite Application Facility on Climate Monitoring: Offenbach, Germany, 2015. [Google Scholar]
  12. Zak, M.; Sacha, P.; Pisoft, P. On the use of the CMSAF cloud-data in the Czech Republic. In Proceedings of First International Conference on Remote Sensing, Paphos, Cyprus, 8–10 April 2013.
  13. Karlsson, K.-G.; Riihelä, A.; Müller, R.; Meirink, J.F.; Sedlar, J.; Stengel, M.; Lockhoff, M.; Trentmann, J.; Kaspar, F.; Hollmann, R.; Wolters, E. CLARA-A1: A cloud, albedo, and radiation dataset from 28 year of global AVHRR data. Atmos. Chem. Phys. 2013, 13, 5351–5367. [Google Scholar] [CrossRef]
  14. Tolasz, R.; Květoň, V.; Vaníček, K.; Richterová, D.; Němec, L.; Metelka, L.; Valeriánová, A.; Hostýnek, J.; Štěpánek, P.; Žák, M.; et al. Climate Atlas of Czechia; Czech Hydrometeorological Institute and University of Palacky: Olomouc, Czech Republic, 2007; p. 256. [Google Scholar]
  15. Müller, R.W.; Matsoukas, C.; Gratzki, A.; Behr, H.D.; Hollmann, R. The CMSAF operational scheme for the satellite based retrieval of solar surface irradiance—A LUT based eigenvector hybrid approach. Remote Sens. Environ. 2009, 113, 1012–1024. [Google Scholar] [CrossRef]
  16. Climate Change in the Bohemia-Silesia Border Region. Available online: https://publikationen.sachsen.de/bdb/artikel/23661/documents/32551 (accessed on 30 August 2015).
  17. Bilbao, J.; Miguel, A.; Franco, J.A.; Ayuso, A. Test Reference Year Generation and evaluation methods in the continental Mediterranean area. J. Appl. Meteorol. 2004, 43, 390–400. [Google Scholar] [CrossRef]
  18. Květoň, V.; Valeriánová, A.; Žák, M. Weather test reference years in the Czech Republic. Meteorol. Z. 2009, 62, 65–72. [Google Scholar]
  19. Stengel, M.; Kniffka, A.; Meirink, J.F.; Riihelä, A.; Trentmann, J.; Müller, R.; Lockhoff, M.; Hollmann, R. Claas: CMSAF cloud property dataset using SEVIRI-edition 1-hourly/daily means, pentad means, monthly means/monthly mean diurnal cycle/monthly histograms. Satell. Appl. Facil. Clim. Monit. 2013, 1. [Google Scholar] [CrossRef]
  20. Alexandri, G.; Georgoulias, A.K.; Zanis, P.; Katragkou, E.; Tsikerdekis, A.; Kourtidis, K.; Meleti, C. On the ability of RegCM4 regional climate model to simulate surface solar radiation patterns over Europe: An assessment using satellite-based observations. Atmos. Chem. Phys. 2015, 15, 18487–18535. [Google Scholar] [CrossRef]
  21. Hagemann, S.; Loew, A.; Andersson, A. Combined evaluation of MPI-ESM land surface water and energy fluxes. J. Adv. Model. Earth Sys. 2013, 5, 259–286. [Google Scholar] [CrossRef]
  22. Haiden, T.; Trentmann, J. Verification of cloudiness and radiation forecasts in the greater Alpine region. Meteorol. Z. 2015, 13. [Google Scholar] [CrossRef]

